Article

Prediction of In-Flight Particle Properties and Mechanical Performances of HVOF-Sprayed NiCr–Cr3C2 Coatings Based on a Hierarchical Neural Network

1
School of Mechanical and Electrical Engineering, Soochow University, Suzhou 215137, China
2
Institute for Manufacturing Technologies of Ceramic Components and Composites (IMTCCC), University of Stuttgart, Allmandring 7b, 70569 Stuttgart, Germany
3
School of Automobile and Transportation Engineering, Guangdong Polytechnic Normal University, Guangzhou 510665, China
4
National Engineering Laboratory for Modern Materials Surface Engineering Technology, Institute of New Materials, Guangdong Academy of Science, Guangzhou 510650, China
5
School of Mechanical Engineering, Suzhou University of Science and Technology, Suzhou 215009, China
6
CNRS, INRAE, Centrale Lille, UMR 8207—UMET—Unité Matériaux et Transformations, Université de Lille, 59000 Lille, France
*
Authors to whom correspondence should be addressed.
Materials 2023, 16(18), 6279; https://doi.org/10.3390/ma16186279
Submission received: 28 August 2023 / Revised: 14 September 2023 / Accepted: 14 September 2023 / Published: 19 September 2023
(This article belongs to the Special Issue Manufacturing and Mechanics of Materials, Volume II)

Abstract

:
High-velocity oxygen fuel (HVOF) spraying is a promising technique for depositing protective coatings. The performances of HVOF-sprayed coatings are affected by in-flight particle properties, such as temperature and velocity, that are controlled by the spraying parameters. However, obtaining the desired coatings through experimental methods alone is challenging, owing to the complex physical and chemical processes involved in the HVOF approach. Compared with traditional experimental methods, a novel method for optimizing and predicting coating performance is presented herein; this method involves combining machine learning techniques with thermal spray technology. Herein, we firstly introduce physics-informed neural networks (PINNs) and convolutional neural networks (CNNs) to address the overfitting problem in small-sample algorithms and then apply the algorithms to HVOF processes and HVOF-sprayed coatings. We proposed the PINN and CNN hierarchical neural network to establish prediction models for the in-flight particle properties and performances of NiCr–Cr3C2 coatings (e.g., porosity, microhardness, and wear rate). Additionally, a random forest model is used to evaluate the relative importance of the effect of the spraying parameters on the properties of in-flight particles and coating performance. We find that the particle temperature and velocity as well as the coating performances (porosity, wear resistance, and microhardness) can be predicted with up to 99% accuracy and that the spraying distance and velocity of in-flight particles exert the most substantial effects on the in-flight particle properties and coating performance, respectively. This study can serve as a theoretical reference for the development of intelligent HVOF systems in the future.

1. Introduction

High-velocity oxygen fuel (HVOF) spraying is a high-energy thermal spraying process for depositing protective coatings with anticorrosion, anti-erosion, and anti-wear properties [1,2,3]. In the HVOF technique, a mixture of fluid/gaseous fuel and oxygen is ejected through a Laval nozzle at supersonic speeds into a combustion chamber [4]. At extremely high temperatures and pressures, the resultant gas heats and accelerates the feeding powder to form the final coating on the substrate [5]. The in-flight particle properties (temperature and velocity) critically affect the performances of HVOF-sprayed coatings [6,7] and depend on the parameters of the HVOF process, including the standoff distance, oxygen flow, and fuel flow [8]. However, owing to the complex physical and chemical phenomena involved in the HVOF technique, designing spraying parameters that optimize the coating performances is challenging. HVOF-sprayed coatings have been predicted and optimized through various approaches, such as experimental design, numerical simulation, and machine learning (ML) [9,10,11,12,13].
Recently, statistical optimization methods, including the Taguchi method and numerical simulations, have been widely employed to establish polynomial regression equations and clarify the influence of the process parameters on the coating properties. For example, Nguyen et al. [14] used the Taguchi method to investigate the optimal process parameters of HVOF-sprayed WC-16Co coatings. However, as the performance of coatings is affected by multiple sets of HVOF process parameters, these methods do not make accurate predictions of the coating performance based on experimental designs, thereby substantially limiting their applicability. Nevertheless, the entire HVOF process, including the variation patterns of flame pressure, temperature, velocity, Mach number, combustion composition, temperature, velocity, and motion trajectory of WC-12Co particles, has been analyzed using numerical models [15]. However, it should be mentioned that in metal–ceramic composites, as one of the most studied HVOF-sprayed coatings, such as NiCr–Cr3C2 and WC-Co, carbide (WC and Cr3C2) powders are susceptible to different degrees of decomposition reaction under various HVOF spraying parameters [16]. There is no doubt that the change in composition of in-flight particles will significantly affect the deposition behavior of each particles, influencing the temperature and velocity of in-flight particles. As such, the complex evolution procedures (e.g., phase transformation, dissolution, and evaporation of some elements or compositions) make it very difficult to model the real behaviors of the particles via numerical simulations. Consequently, neither the Taguchi method nor the numerical simulation-based modeling technique can accurately predict the spraying parameters and coating performance.
Machine learning (ML) techniques can overcome the abovementioned technical difficulties of the Taguchi and numerical modeling methods [17]. Artificial neural networks (ANNs) with flexible structures and powerful learning ability are most commonly proposed for the prediction and optimization of thermal spraying processes. In 2004, ANN implementation in the thermal spray process was pioneered by the LERMPS laboratory [18]. They modeled the plasma spraying technique using an ANN and then analyzed and predicted the coating characteristics, including the percentage of unmelted particles, porosity, and phase composition [18,19,20,21]. Choudhury also trained an ANN model for predicting the in-flight particle characteristics of an atmospheric plasma spraying process [22]. Moreover, he investigated the relation between these characteristics and the properties of plasma-sprayed 8YSZ electrolyte coatings [23]. Recently, researchers have explored ML algorithms and neural networks that predict the performance of TiO2 coatings deposited using a novel plasma spraying technique called suspension plasma spraying [24]. However, research on neural network-based predictions of the HVOF spraying process and HVOF-sprayed coatings is limited compared to that on neural network-based predictions of plasma spraying [13,25].
As mentioned earlier, researchers have predicted the particle or coating properties in case of the plasma spraying process, but studies on the relationships among the HVOF process parameters, intermediate variables (i.e., temperature and velocity of the in-flight particles), and coating properties are limited. Moreover, most prediction models for both HVOF and plasma spraying in-flight particle characteristics are based on ANNs [13,18,19,20,21], which tend to be overfitted when the input data are limited.
Convolutional neural networks (CNNs) can automatically mine the potential pattern features, which is potentially less time consuming than accumulating experience and professional knowledge [17]. Unlike ANNs, CNNs employ a weight-sharing feature that reduces the number of trainable network parameters, enhancing the generalization of the model and avoiding or weakening overfitting [26]. Moreover, a CNN model is a powerful tool for pattern recognition in various computational materials problems characterized by local interactions [27]. Using a CNN-based approach, Zhang et al. [28] attempted to improve predictions of the material removal rate in chemical mechanical polishing. Lu et al. [29] developed a CNN model that rapidly and accurately predicts the amorphous formation ability of various amorphous alloys; they reported a prediction accuracy of 0.71693, more than 19% higher than those of 13 standards. CNN-based studies are currently few and limited to air-plasma spraying and air plasma-sprayed coatings. The relation between in-flight particles and the spraying parameters has been implicitly established and analyzed in a previous study [17]. Thus, developing CNN models of the HVOF process and HVOF-sprayed coatings is desired and should be attempted.
However, the ANN and CNN models are based on blackbox algorithms which obscure their interpretability [30], i.e., ANNs and CNNs generate their prediction and relation results without considering the basic physical models of the HVOF process. The physics-informed neural network (PINN) is a hybrid physical–statistical ML method that embeds automatic differentiation and partial differential equations into the loss function of neural networks [31]. Moreover, the PINN combines physical models with neural network regression to compensate for the poor transferability of traditional ML techniques, such as ANN and CNN, to unknown structures. In thermal fluid studies, the PINN has been used to solve momentum and energy transport governing equations [32] and to accurately predict the velocity and temperature of particles [33,34]. In addition to thermal fluid problems, PINNs have been applied to various material applications. Zhang [35] found that among various deep neural networks and traditional ML models, the PINN most accurately predicts the creep–fatigue life of 316L stainless steel. To the best of our knowledge, a PINN model has never been applied to thermal spraying, which is characterized by complex flow fields and thermal fields during deposition.
This study attempts to optimize HVOF-sprayed NiCr–Cr3C2 coatings and predict their in-flight particle properties based on the HVOF process parameters and the properties of the NiCr–Cr3C2 coatings. The HVOF process and HVOF-sprayed coatings are analyzed using a PINN–CNN hierarchical neural network that synergistically combines the advantages of the PINN and CNN. The primary objective is to propose a layered learning model that utilizes the PINN to construct the first layer for predicting the HVOF in-flight particle properties, which is followed by that of a second layer using a CNN for prediction of coating properties. The framework is illustrated in Figure 1. The relative importance of the spraying parameters with respect to the properties of in-flight particles and coating performance are then evaluated using a random forest (RF) model. Results indicated that spraying distance and in-flight particle velocity most considerably affect the in-flight particle properties and coating performance, respectively. Furthermore, compared with experimental data, the temperature and velocity of in-flight particles as well as the coating properties (cross-sectional porosity, wear resistance, and microhardness) are predicted with up to 99% accuracy.

2. Experimental Procedures

2.1. HVOF Spray Process Parameters

The raw material used herein is a commercially available NiCr–Cr3C2 powder (METCO 81 VF-NS: Oerlikon Metco AG, Wohlen, Switzerland) with particle size ranging from 5 μm to 45 μm. HVOF spraying experiments were conducted using an in-house fabricated Diamond Jet spraying system. The gun was guided by a six-axis industrial robot (IRB2600-20: ABB, VÄSTERÅS, Sweden); a sandblasted 316L stainless steel plate (Ø 25 mm × 10 mm) was used as the substrate. During the experiments, three process parameters, namely the oxygen flow rate (Q(O2)), fuel flow rate (Q(CH4)), and standoff distance (SOD), were varied. In addition, in-flight particles were characterized during HVOF spraying using a commercial diagnostic system, AccuraSpray G3 (Tecnar, St-Bruno, PQ, Canada). The specific spraying process parameters are listed in Table 1.

2.2. Coating Microstructure Characterization

The porosity of the coating was determined through analyzing its cross-sectional microstructure via optical microscope (Nikon, Japan). Over 10 consecutive images were captured, and the average value was calculated using ImageJ imaging software (version: 1.8.0_112). The microhardness of the coatings was evaluated using a Vickers microhardness tester (Leiz—Wetzlar, Germany) with a load of 300 gf and a dwell time of 25 s on a cross-section of the coating. Twenty random indentations were made, and an average microhardness value was obtained for each coating. Wear rates were determined through performing dry sliding wear tests using a CSEM tribometer (Neuchatel, Switzerland) at an atmospheric temperature of 15–20 °C and a humidity of 40–50%. The paired material used comprised Al2O3 balls (diameter = 6 mm) with a load of 5 N, a rotation radius of 7 mm, a linear rotation speed of 10 mm/s, and a sliding distance of 500 m. The cross-sectional profile of the wear track was measured using a profilometer (Altisurf 500, Thonon-les-Bains, France), and 10 contour measurements were performed to obtain the average wear rate. The wear rate is denoted by K as expressed in Equation (1).
K = Δ V S F N
Here, Δ V denotes the volume loss of the material, S denotes the sliding distance, and F N denotes the applied normal load.
For the above characterization and performance tests, all specimens were prepared via grinding using P220 SiC paper (Struers, Champigny-sur-Marne, France) and MD-Largo disks (Struers, Champigny-sur-Marne, France), followed by polishing with a 3-μm diamond suspension and a 0.04-μm nondrying colloidal silica suspension.

3. Hierarchical PINN-CNN Models and Their Implementations

3.1. Feature Selection Based on the Random Forest (RF) Model

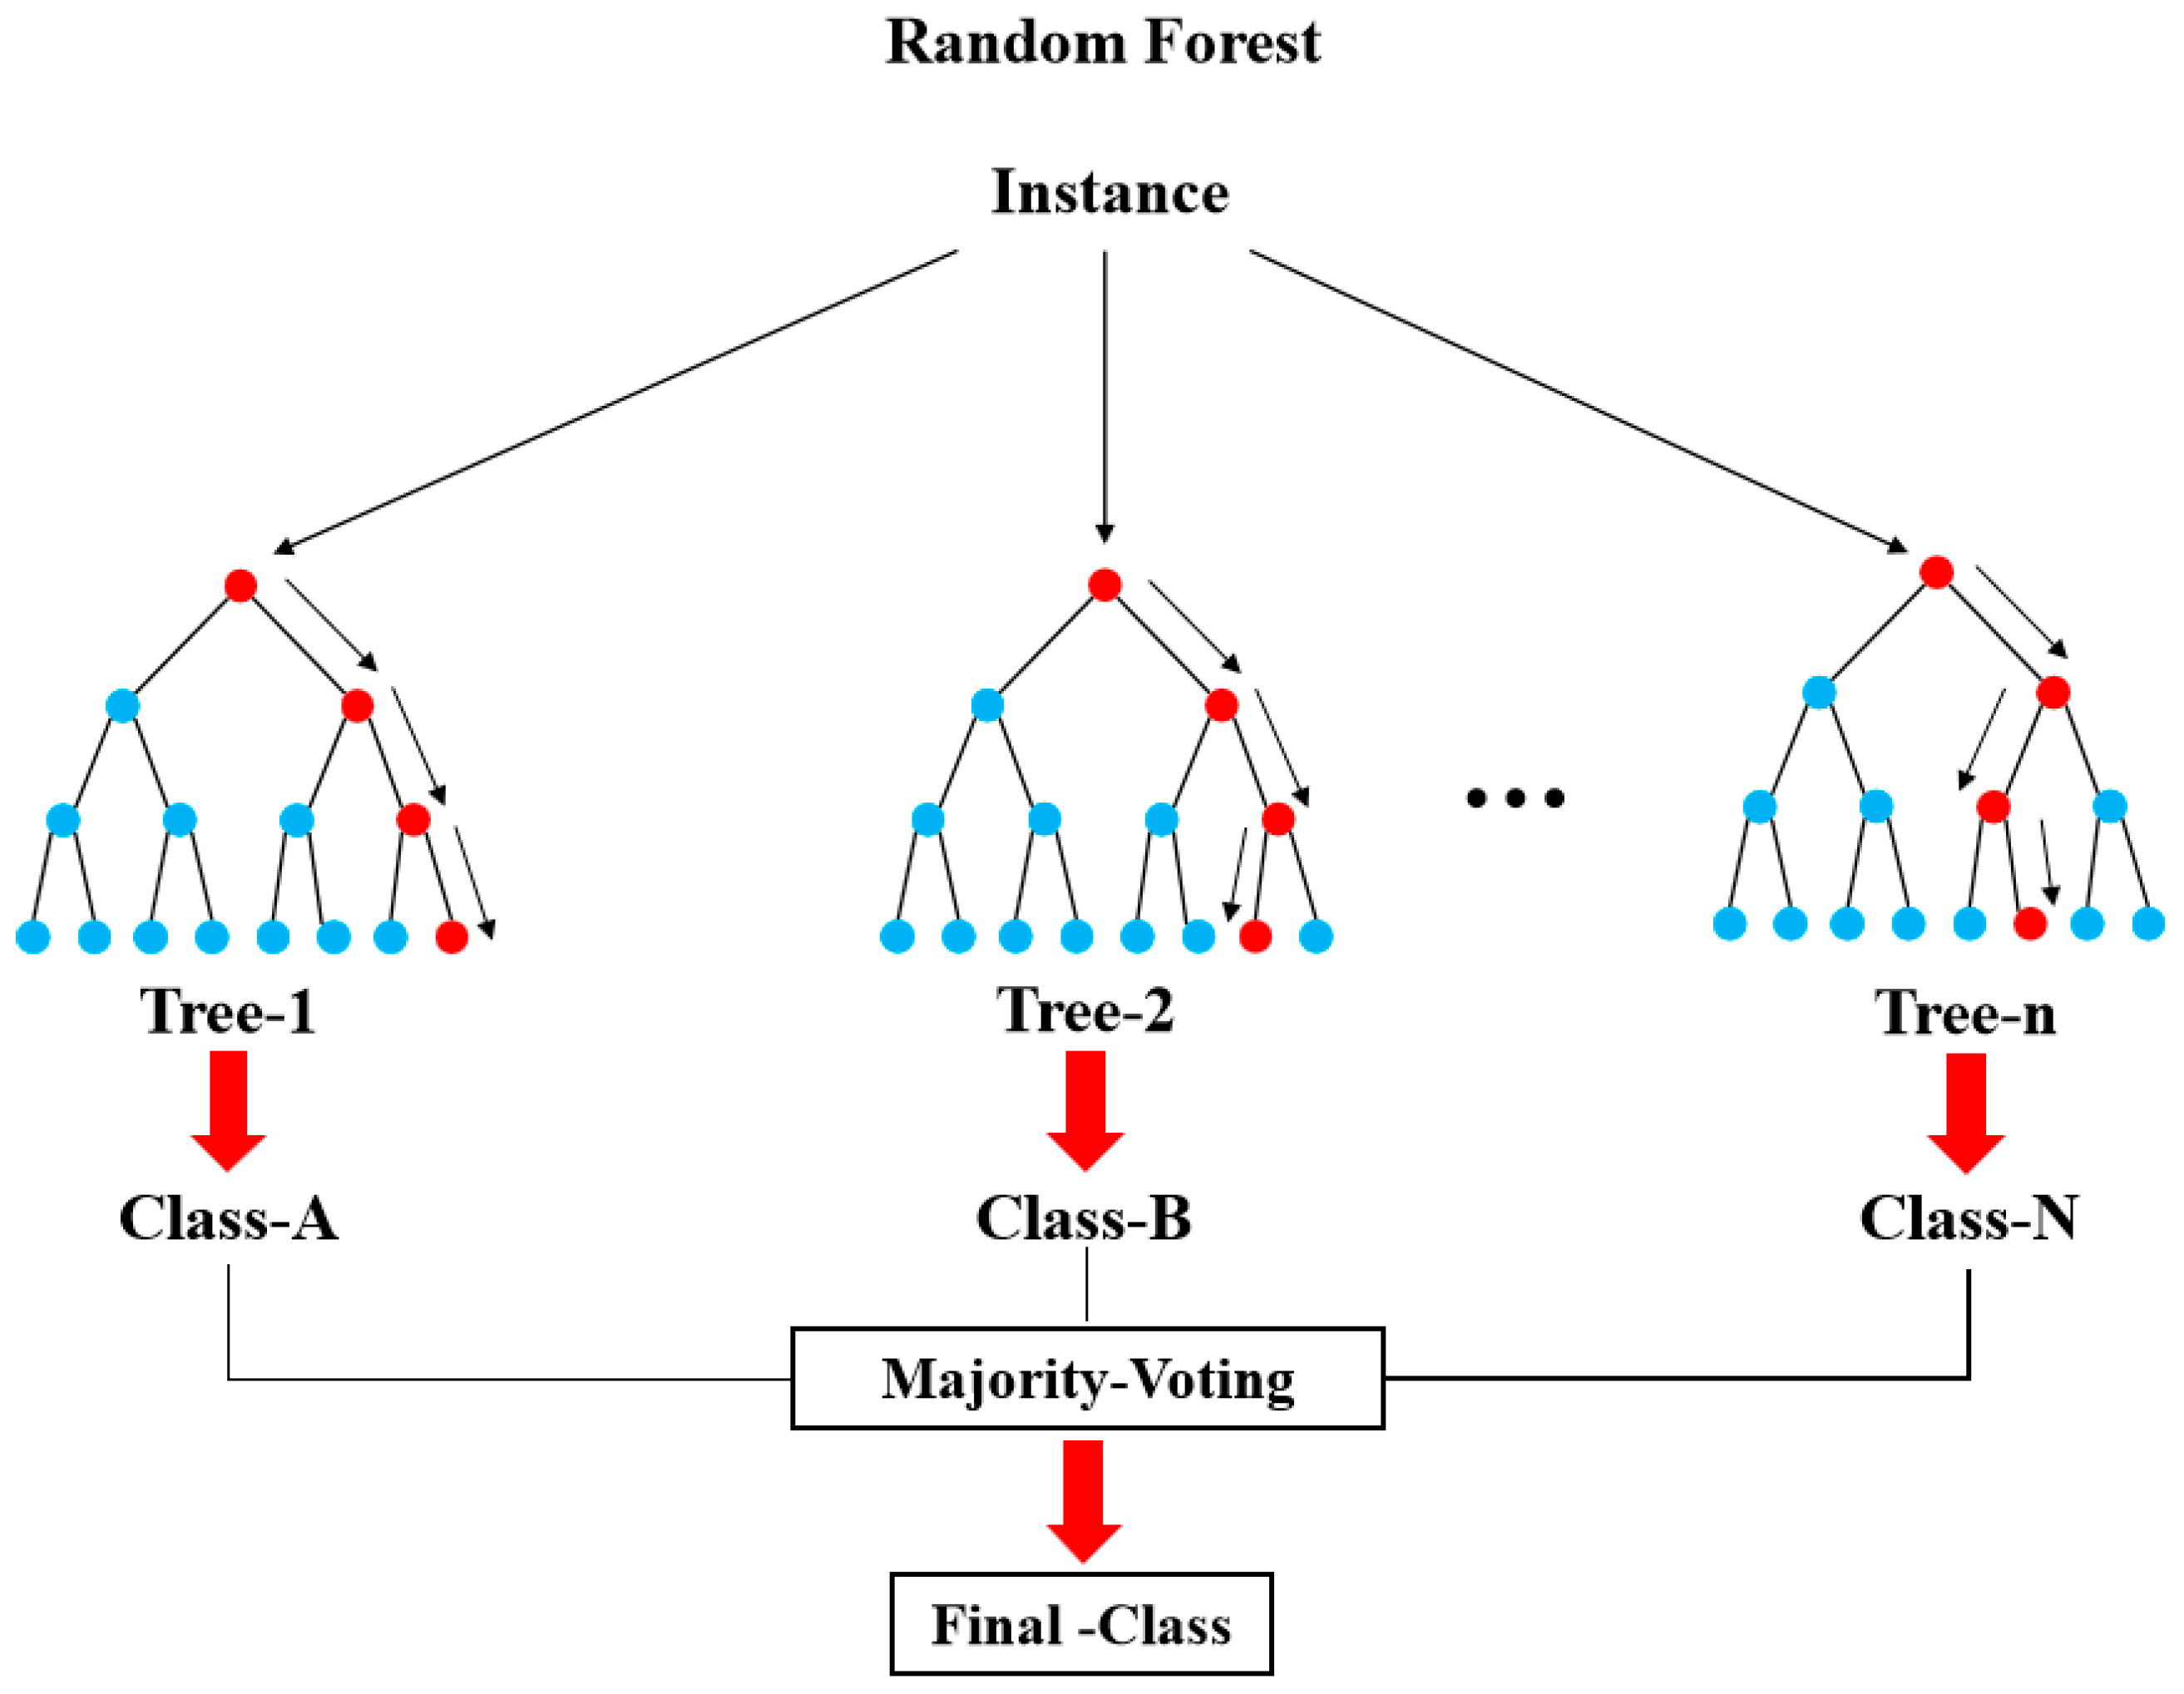
The HVOF spraying process involves numerous feature variables. To avoid compromising prediction accuracy, we applied the RF feature selection algorithm to identify essential features for prediction. The final classification outcome was determined through a voting process among the base classifiers. Integrating multiple decision trees in the RF model renders it more stable than a standalone decision tree model, particularly in classifying complex feature variables and unbalanced categories. This property results in more accurate predictions and reduces the likelihood of overfitting (Figure 2).
In the RF model, noisy but important features can substantially affect classification accuracy. Therefore, we used feature importance as a criterion for selecting the features of the RF algorithm. The feature importance metric D j ¯ for feature X j is given by Equation (2):
D j ¯ = 1 B t = 1 B ( R b o o b R b j o o b )
where B denotes the number of training samples, R b o o b denotes the number of correct classifications counted by the decision tree for the out-of-bag data, and R b j o o b denotes the number of correct classifications counted when the decision tree classifies the out-of-bag data after perturbation.

3.2. Data Collection and Preprocessing

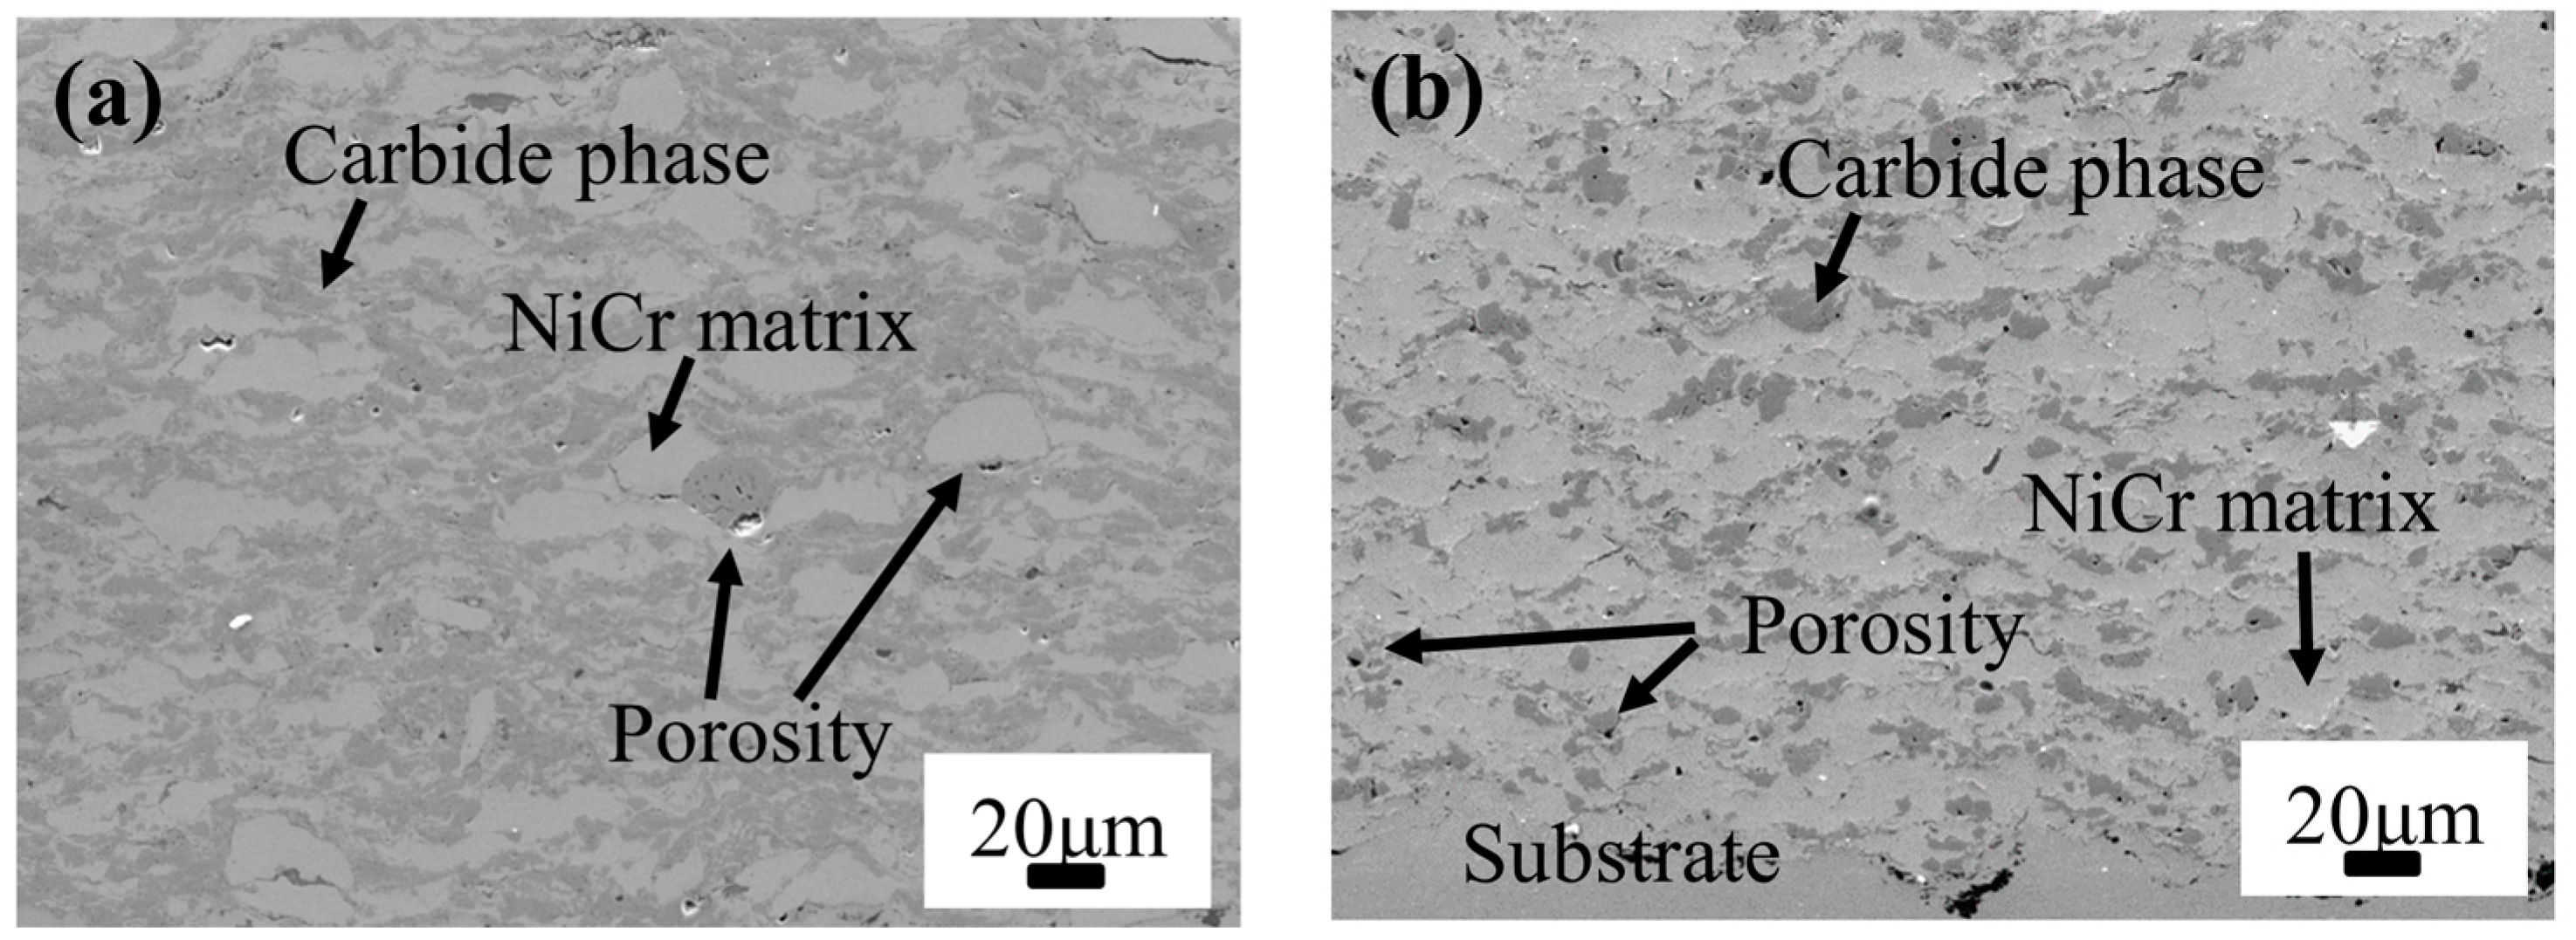
The dataset utilized in the experiments comprise 320 data points from 40 sets of spraying experiments and corresponding characterizations and performance tests on HVOF-sprayed NiCr–Cr3C2 coatings. The experiments include monitoring in-flight particles (temperature and velocity) and coating characterization tests (e.g., porosity, wear resistance, and microhardness). The spraying parameters, characteristics of the in-flight particles, and coating performances are summarized in Table 2. Additionally, all these HVOF-sprayed NiCr–Cr3C2 coatings exhibited typical lamellar structure. Taking the No. 5 and No. 35 samples as examples, different NiCr/Cr3C2 ratio and lamellar structures with porosity were observed in Figure 3, where the NiCr matrix is light gray and Cr3C2 is in dark gray. The PINN considers the standoff distance (SOD), oxygen flow rate (Q(O2)), and fuel flow rate (Q(CH4)) as inputs and particle in-flight velocity and temperature as outputs. The PINN outperforms current ML approaches used in thermal spraying through incorporating physical information regarding the system. In addition, it reduces the dataset required to uncover complex prediction–response relations, shortens training time, and rationalizes the mechanism of the spraying process. Therefore, we used the PINN as the first layer of the layered neural network model to predict particle in-flight velocity and temperature through inputting standoff distance (SOD), oxygen flow rate (Q(O2)), and fuel flow rate (Q(CH4)).
In the second layer of the neural network model, we used a CNN with in-flight particle velocity (V) and temperature (T) as inputs and microhardness, porosity, and wear rate of coatings as final outputs. Before training the model, we normalized it according to Equation (3) through setting the variable input range between one and two to prevent computational errors resulting from different parameter magnitudes. To prevent overfitting, we randomly divided the data into the training and validation sets, with proportions of 80% and 20%, respectively.
X N O R M = X X M I N X M A X X M I N
Here, X N O R M denotes the normalized value, X denotes the experimental value, X M A X denotes the maximum experimental value, and X M I N denotes the minimum experimental value. Specific representation of the data in the model is shown in Figure 4.

3.3. PINN Model: First-Layer Building, Training, and Validation

The layered machine model was implemented in PyTorch, a deep learning framework based on Torch, and developed using Python. The first layer of the model employs a PINN with transfer functions, including functions from the input layer to the first hidden layer, between hidden layers, and from the second hidden layer to the output layer set to tansig, logsig, and purelin, respectively. In addition, proportional conjugate gradient backpropagation (trainscg) was selected as the training function.
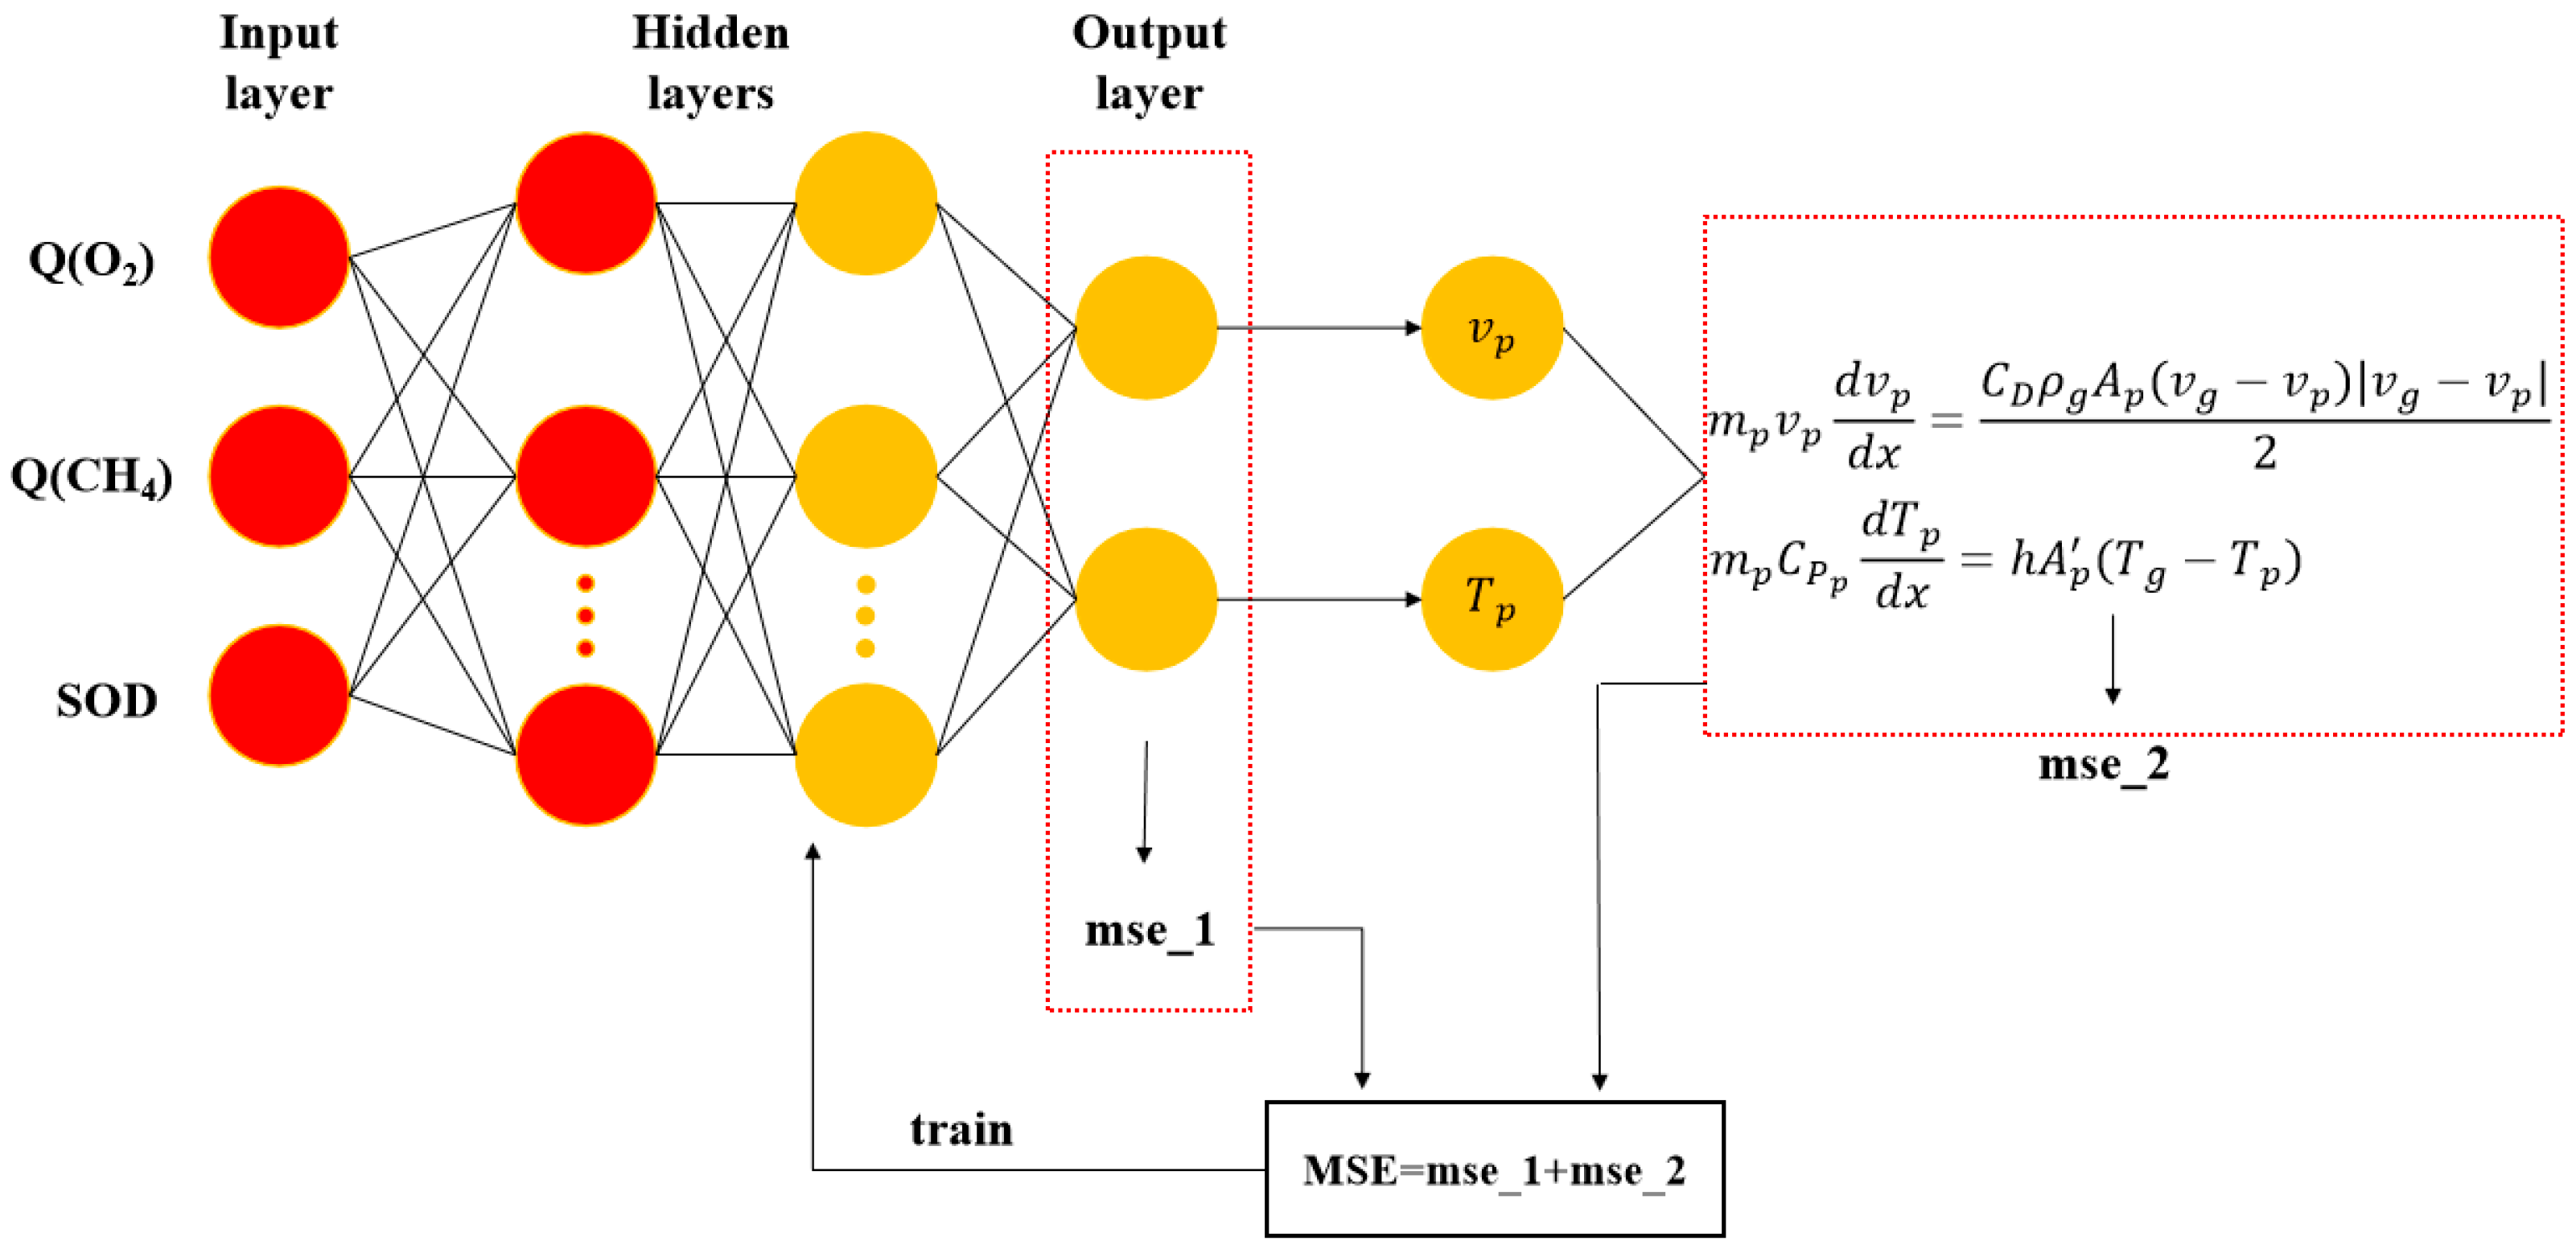
As there were three input variables and two target variables in the dataset, the number of neurons in the input layer was set to three and the number of neurons in the output layer was set to two. However, no general rule exists for determining the exact number of neurons in the hidden layer. Typically, the fewer the hidden layers and number of neurons in the hidden layers, the more lightweight the model. Therefore, in this study, a neural network model with two hidden layers was selected and the number of neurons in each hidden layer was set to 10 after simulation and comparison based on the prediction results. Figure 5 depicts the PINN model architecture diagram.
Herein, the neural network model is trained using the backpropagation method, a commonly used algorithm for learning multilayer networks. The training is supervised, and the inputs are forwarded through a transfer function to calculate the error between the model output and actual experimental data. This error, denoted as mse_1, is optimized during training to improve network performance. Additionally, physical formulas are embedded, such as those for particle velocity and temperature, using Lagrangian methods. The loss functions for v p and T p in Equations (4) and (5) are associated with an error of mse_2. To minimize the errors, mse_1 and mse_2 are backpropagated to adjust the network weights and bias values. Two metrics were used to evaluate the CNN results in this study: the mean absolute error (MAE) of Equation (6) and the decidability factor ( R 2 ) of Equation (7). Smaller MAE values and a larger R 2 indicate a better model fit and higher prediction accuracy, respectively.
m p v p d v p d x = C D ρ g A p v g v p v g v p 2
m p C P p d T p d t = h A p T g T p
In Equation (4), v p denotes the velocity of the particle flight, m p denotes the mass of the particle, v g denotes the gas velocity, C D denotes the drag coefficient, A p denotes the particle cross-sectional area, ρ g denotes the gas density, and x denotes the axial position. In Equation (5), T p denotes the particle temperature, A p denotes the particle surface area, C P p denotes the particle heat capacity, T g denotes the gas temperature, and h denotes the heat transfer coefficient.
M A E = 1 n i = 1 n y i y i ^ y i
Here, y i denotes the true value, y i ^ denotes the predicted value (i = 1, 2, …, n), and n denotes the number of samples.
R 2 = 1 i = 1 N t i a i 2 i = 1 N t i t = i 2
Here, t i denotes the experimental results, a i denotes the predicted result, t = i denotes the mean of the experimental results, and N denotes the number of datasets.

3.4. CNN Model: Building, Training, and Validation of the Second Layer

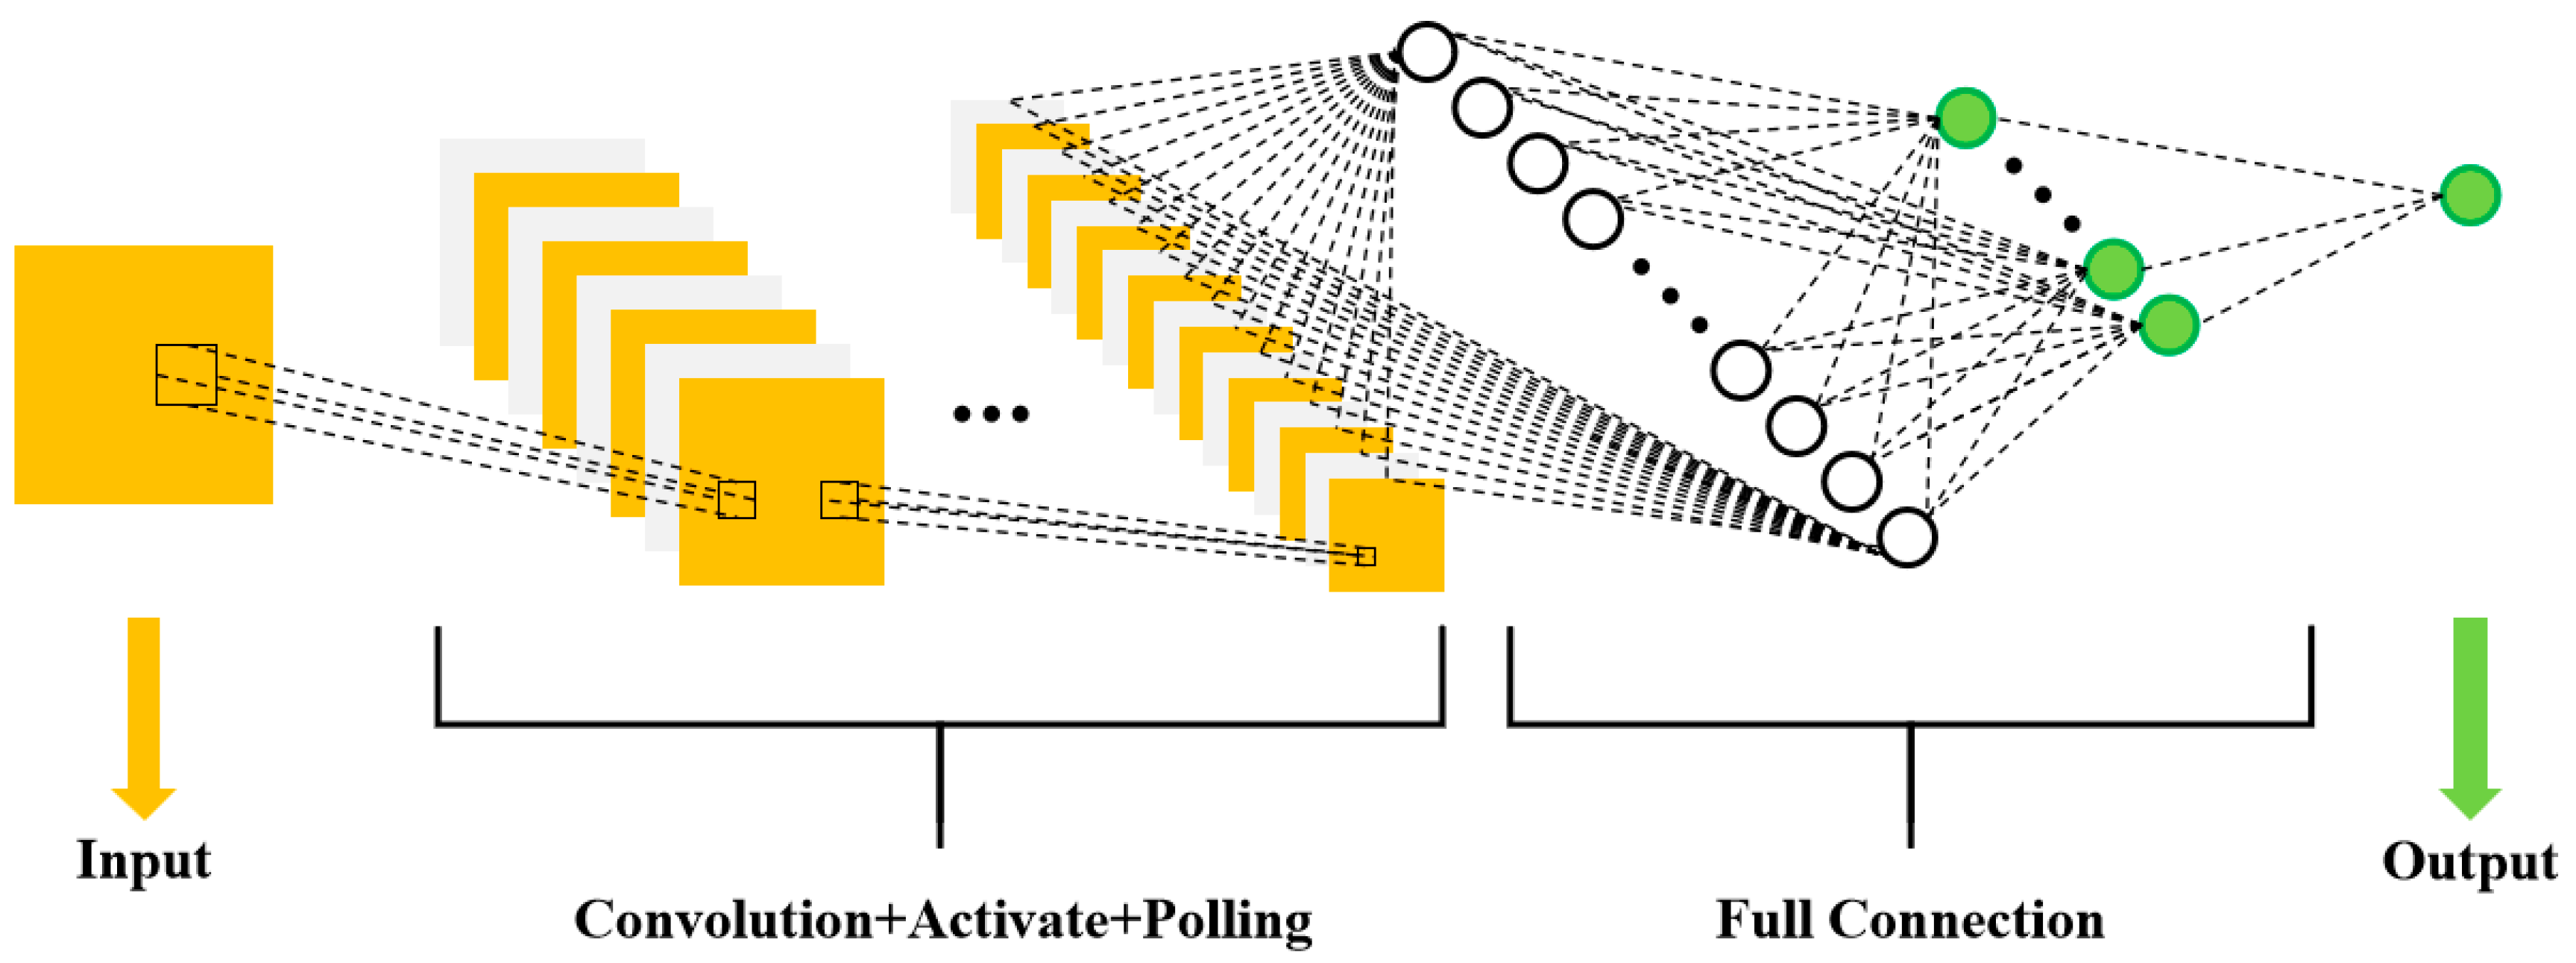
In this work, we use a CNN to construct the second layer of our model. We evaluate and compare the predictive performance of the CNN model using the same evaluation metrics as the PINN. The CNN mainly comprises a convolutional layer, pooling layer, and fully connected layer (Figure 6).
Herein, we propose a novel architecture wherein the input layer is the predicted particle flight speed and temperature obtained from the PINN model. The convolutional layer performs layer-by-layer feature extraction of the input signal, and the obtained features are then mapped to the output layer using the fully connected layer. The output layer predicts the microhardness, porosity, and wear rate of the coating. The convolutional layer is the central component of the CNN and calculates feature values from the input data. The specific calculation is expressed in Equation (8).
c t = f ω = p = 1 f p × ω p q , 0 m < M , 0 n < N
Here, f denotes the input signal guide, ω denotes the convolution kernel, n denotes the total number of signals, and q denotes the size of the convolution kernel.
The primary function of the pooling layer is to decrease the dimensionality of the data, reduce computation, and prevent overfitting while enhancing the robustness of the system. Because the dataset is small, the network comprises only two convolutional layers and lacks a pooling layer.
The fully connected layer is a shallow perceptron that establishes complete connections between the output layer and the data acquired after multiple convolution and pooling operations. Finally, the Softmax activation function classifies the results obtained in the output layer, computed as shown in Equation (9):
f x i | θ = p y i = 1 | x i , θ p y i = k | x i , θ = 1 j = 1 k e θ j T x i e θ 1 T x i e θ k T x i
where k denotes a particular classification, θ 1 T x i denotes the value of that classification, p y i = k | x i , θ denotes the probability of the k th category, and θ denotes the weight.
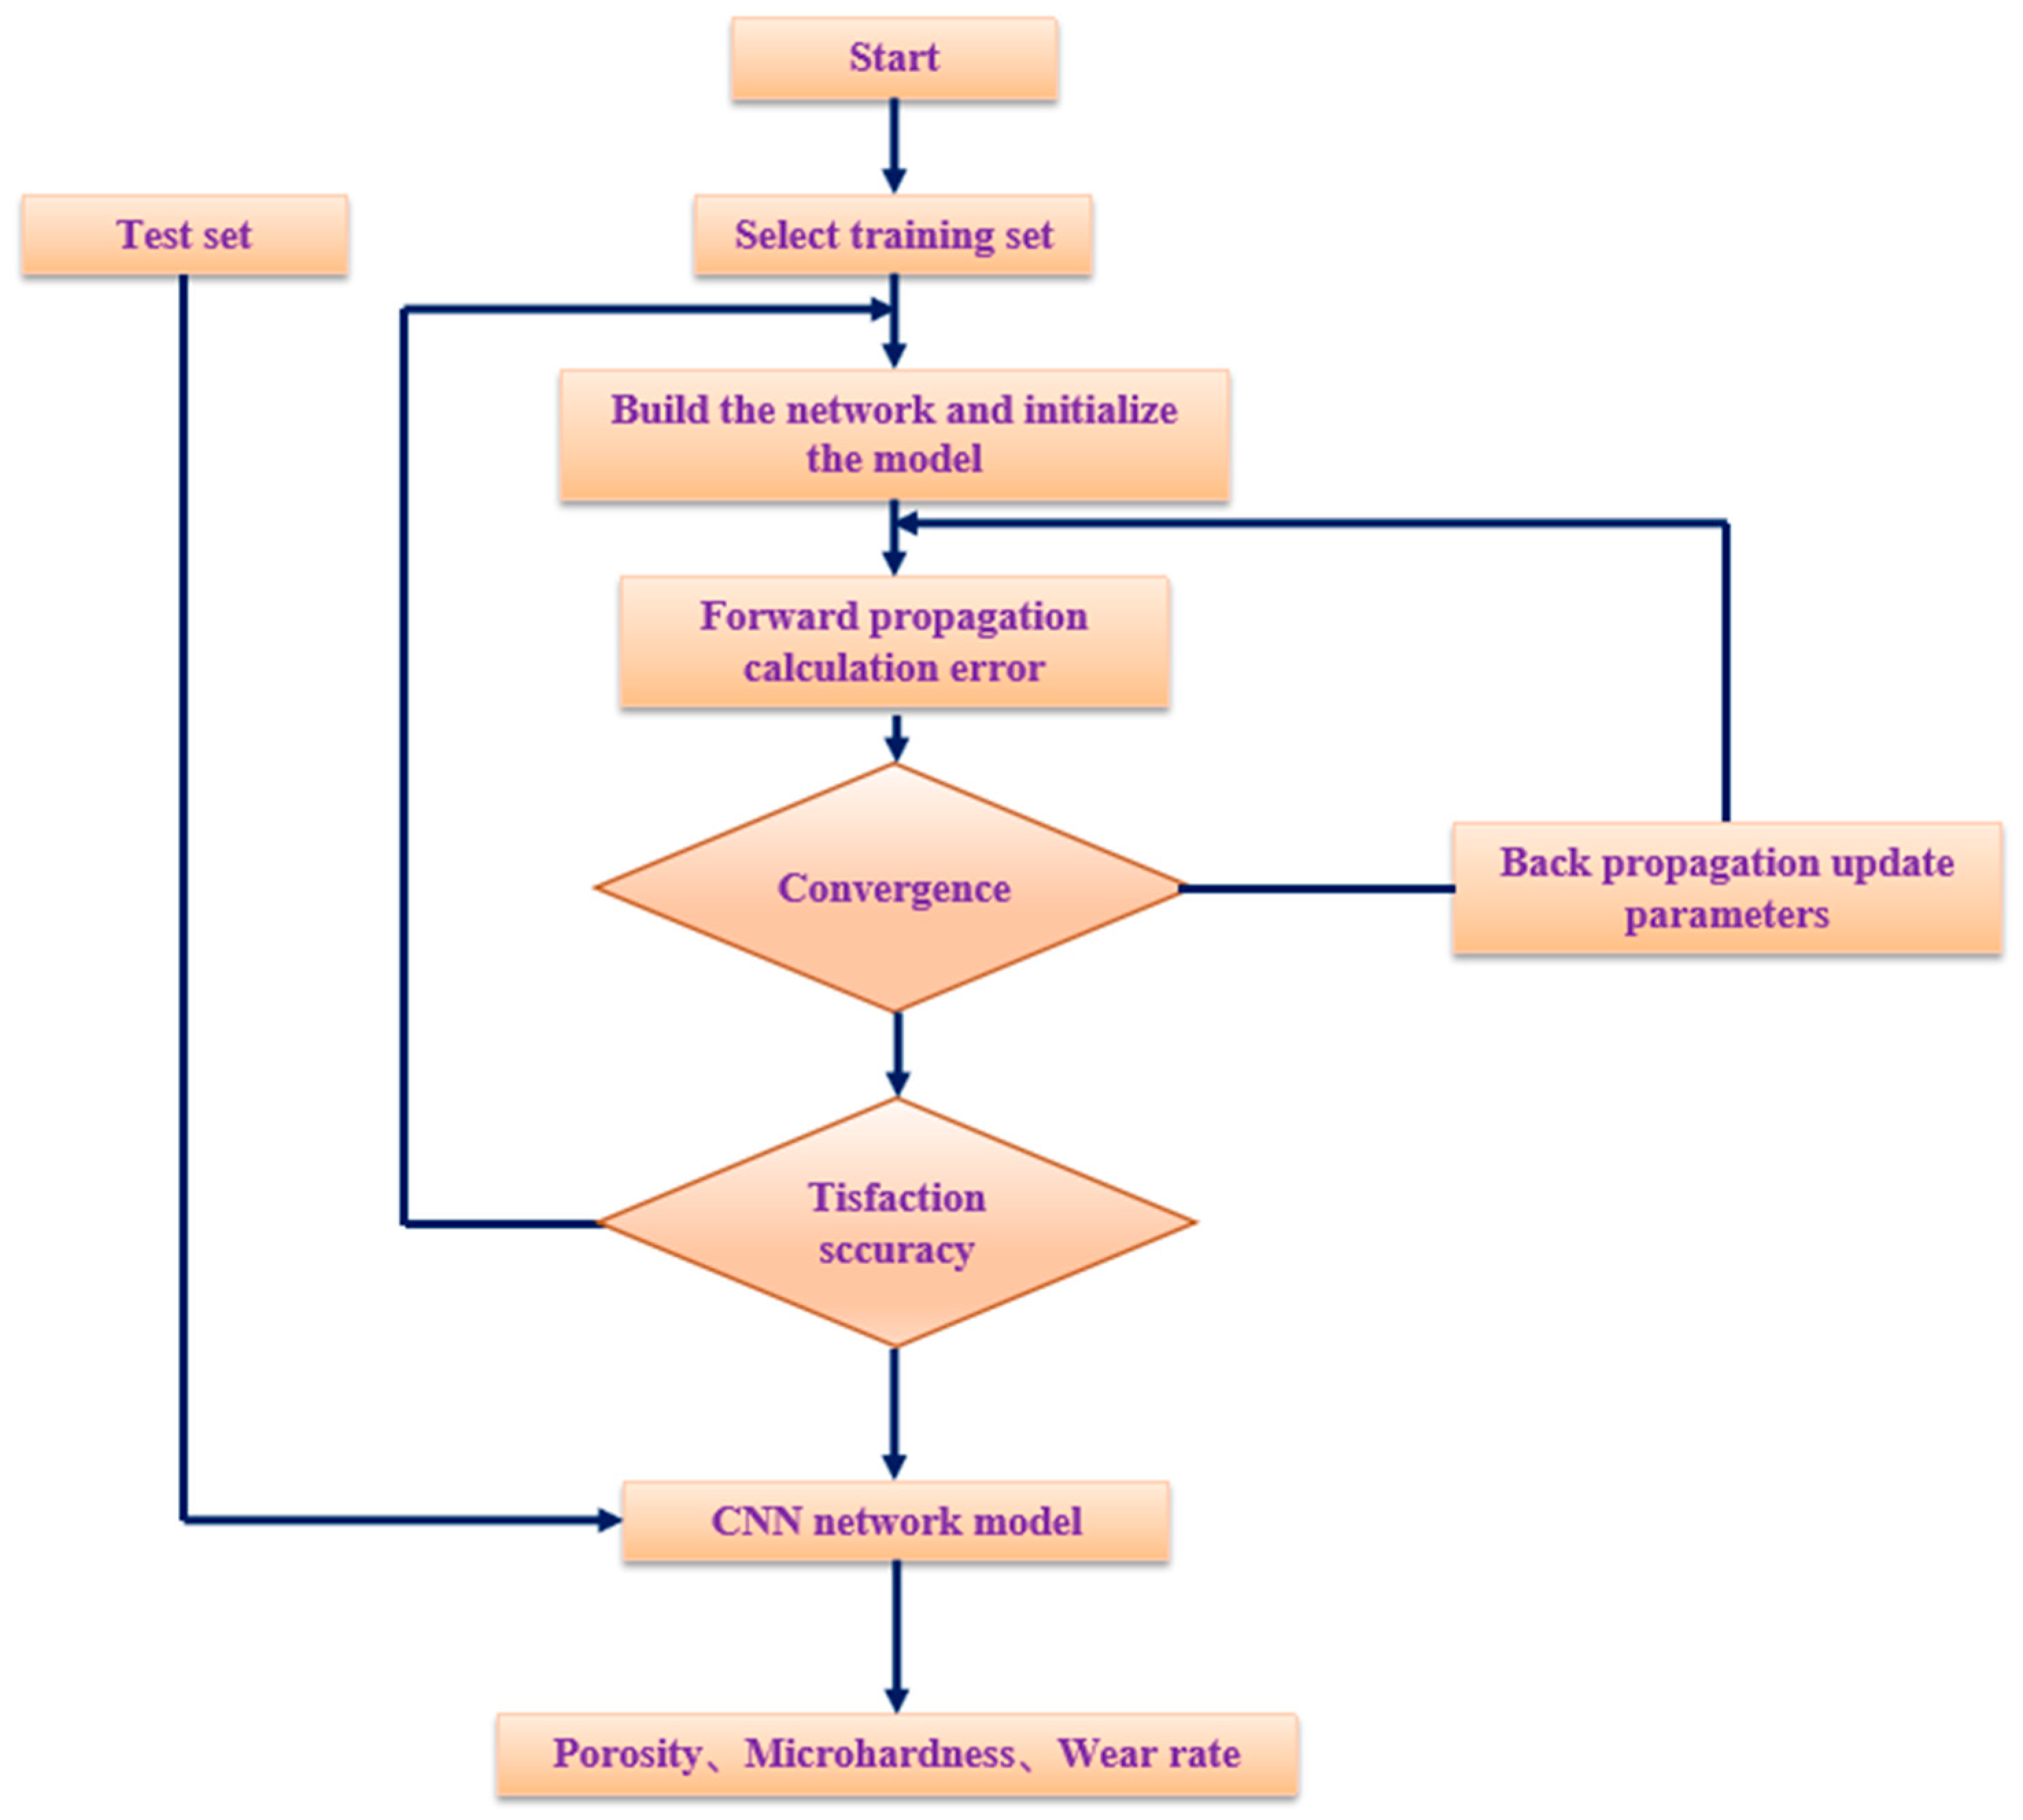
The CNN model is optimized using Adam’s optimizer, with a learning rate set at 0.00001. The ReLU function is selected as the activation function for both convolutional layers, while the categorical cross-entropy function is selected as the loss function. The training process for the CNN is illustrated in Figure 7. To meet the accuracy requirements, the training process is divided into two parts: forward and backward propagation. During forward propagation, the network is constructed and the weights and errors are initialized. Subsequently, the input data are convolved into the fully connected layer and classified. The gradient descent method is applied in backward propagation, and the error is fed back to the convolutional layer based on the loss function through adjusting the network parameters and repeating the aforementioned steps.

4. Results and Discussion

4.1. Analysis of RF Feature Selection Results

To select key features for accurate prediction results in further steps, we constructed an RF model herein. This model was used to compute the percentages of feature importance for velocity and temperature in the PINN model and for porosity, microhardness, and wear rate in the CNN model. The RF evaluation determined the contribution of each input variable to each output variable of the PINN and CNN models in further steps. As shown in Figure 8, the feature names were displayed on the horizontal axis, while their corresponding importance was marked on the vertical axis.
Figure 8a illustrates the RF analysis of the PINN model layer, revealing that SOD, Q(O2), and Q(CH4) are important features affecting the velocity of in-flight particles, while SOD, Q(CH4), and Q(O2) are features that affect the temperature of these particles. The results demonstrate that SOD exerts the greatest effect on the characteristics of in-flight particles, making 95% and 87% contribution to the velocity and temperature, respectively. However, the effects of Q(O2) and Q(CH4) on temperature and velocity are limited, which is consistent with the Irregular trend of velocity variation with CH4 flow. Figure 8b displays the results of the RF evaluation of the CNN model, indicating that the velocity of in-flight particles exerts a greater effect on the microhardness and wear rate of the coating, making 72% and 69% contributions to these parameters, respectively; the velocity is more important than the temperature characteristics. However, with regard to the coating porosity, the temperature of in-flight particles (55%) is more important than their velocity (45%). It indicated that the porosity of HVOF-sprayed coatings is relatively more sensitive to the melting degree of in-flight particles. Additionally, as shown in Figure 8a, since both the velocity and temperature of in-flight particles are obviously determined by spraying distances, the optimization of spraying distance is an efficient way for controlling the porosities of coatings. Therefore, based on the RF model calculation results, adjusting the velocity range is an effective measure for adjusting the microhardness and wear rate of HVOF-sprayed NiCr–Cr3C2 coatings. Furthermore, tuning the temperature of impinging particles is more useful to control the porosity of the NiCr–Cr3C2 coatings.

4.2. Analysis of the PINN Training Results

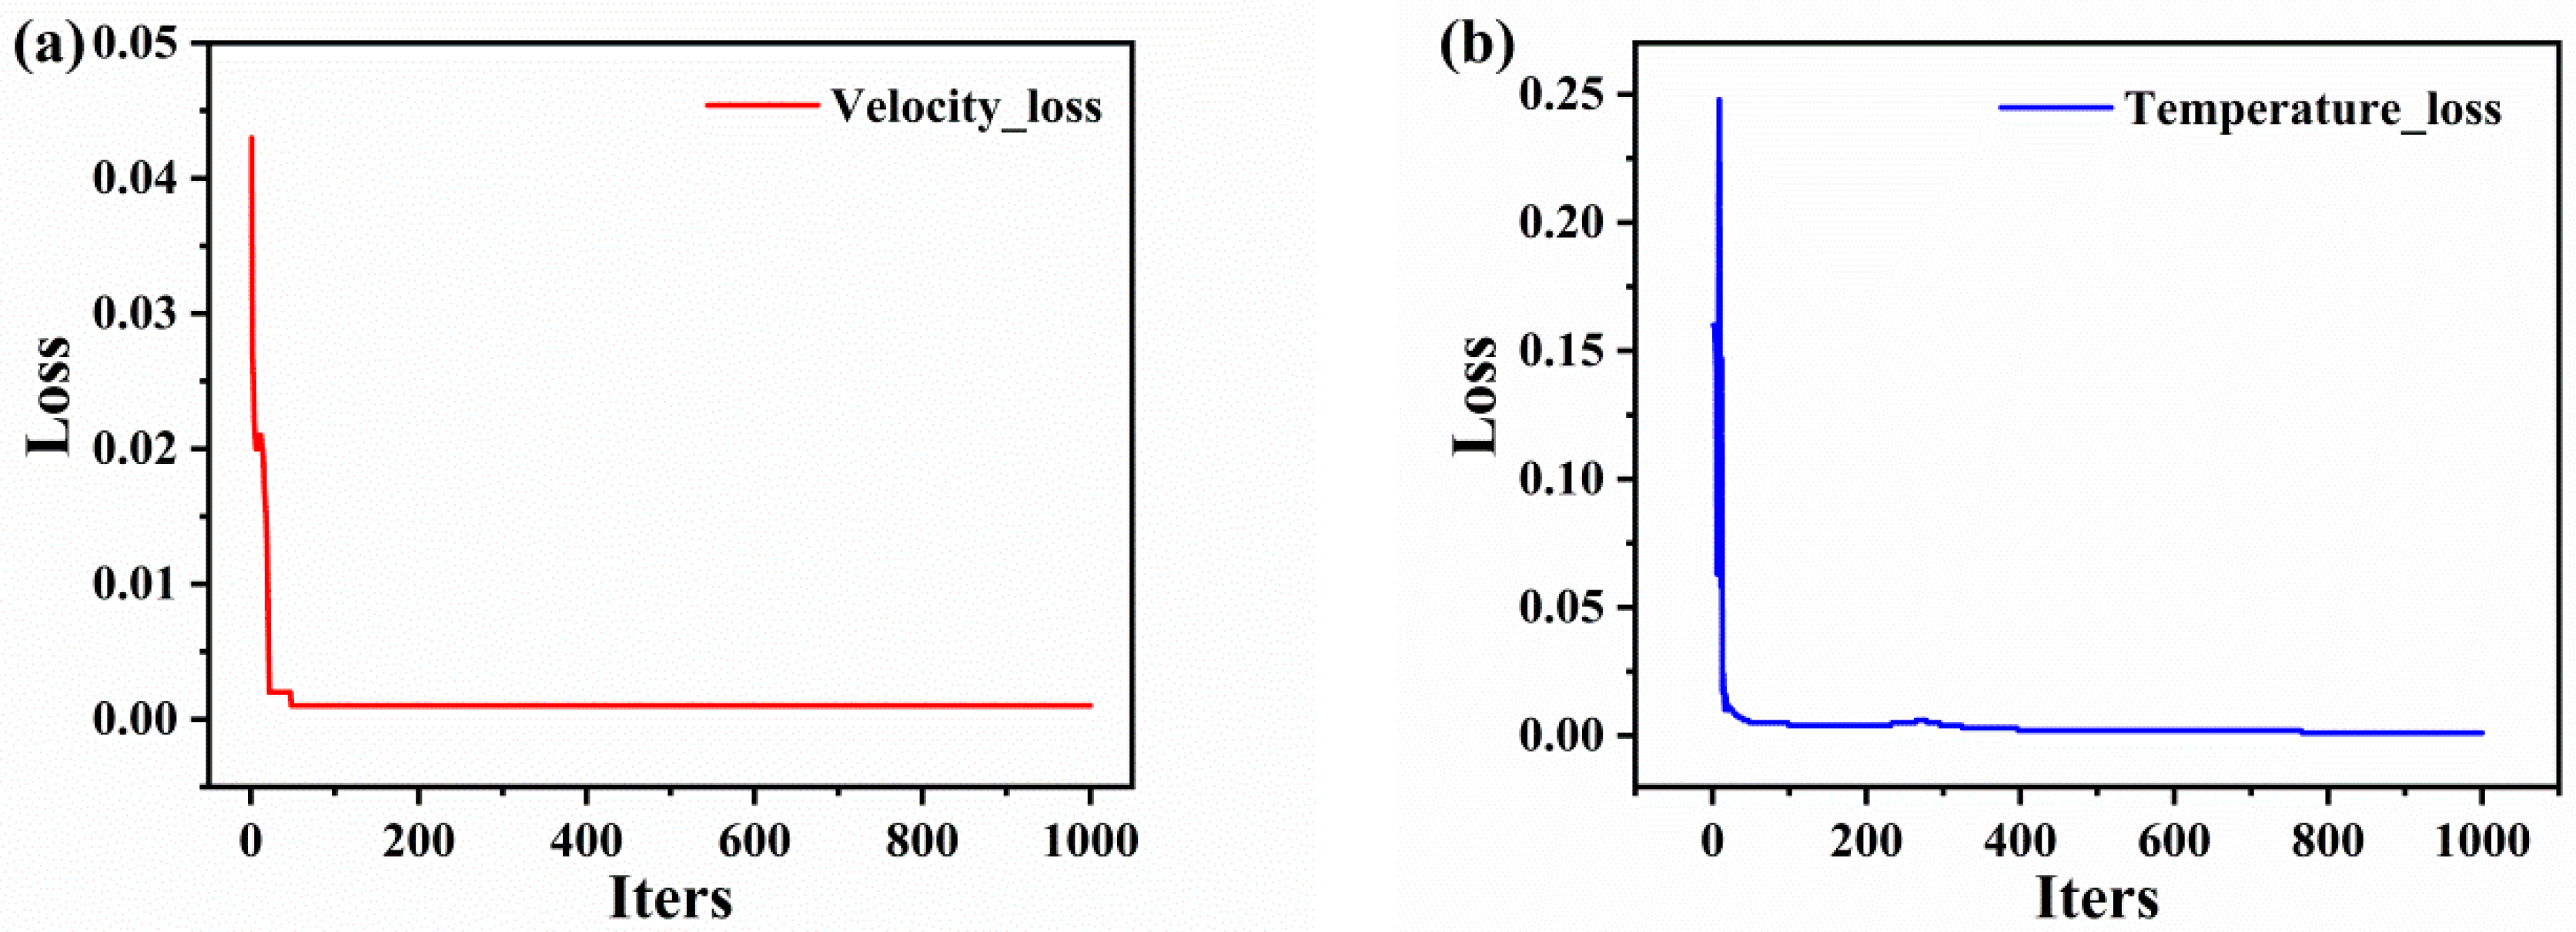
After training the PINN model, we plotted loss function values for the training set as a function of the epochs (Figure 9). After several rounds of trial and error and parameter adjustments, the training loss values of the PINN network model remained consistently at <0.01 and attained a steady state. Figure 10 displays the fit of the PINN model. Horizontal coordinates, vertical coordinates, and the solid line represent the experimental values, predicted values, and ideal fit results, respectively. The closer the dispersion points are to the solid line, the more accurate is the prediction. As shown in Figure 10a,b, the predicted values of the PINN model training for the temperature and velocity of the in-flight particles are highly similar to the actual values, and the R2 values of the model reach 0.99473 and 0.96888, respectively. These results indicate that the PINN model satisfies the training requirements and can be used to predict the velocity and temperature of the in-flight particles.
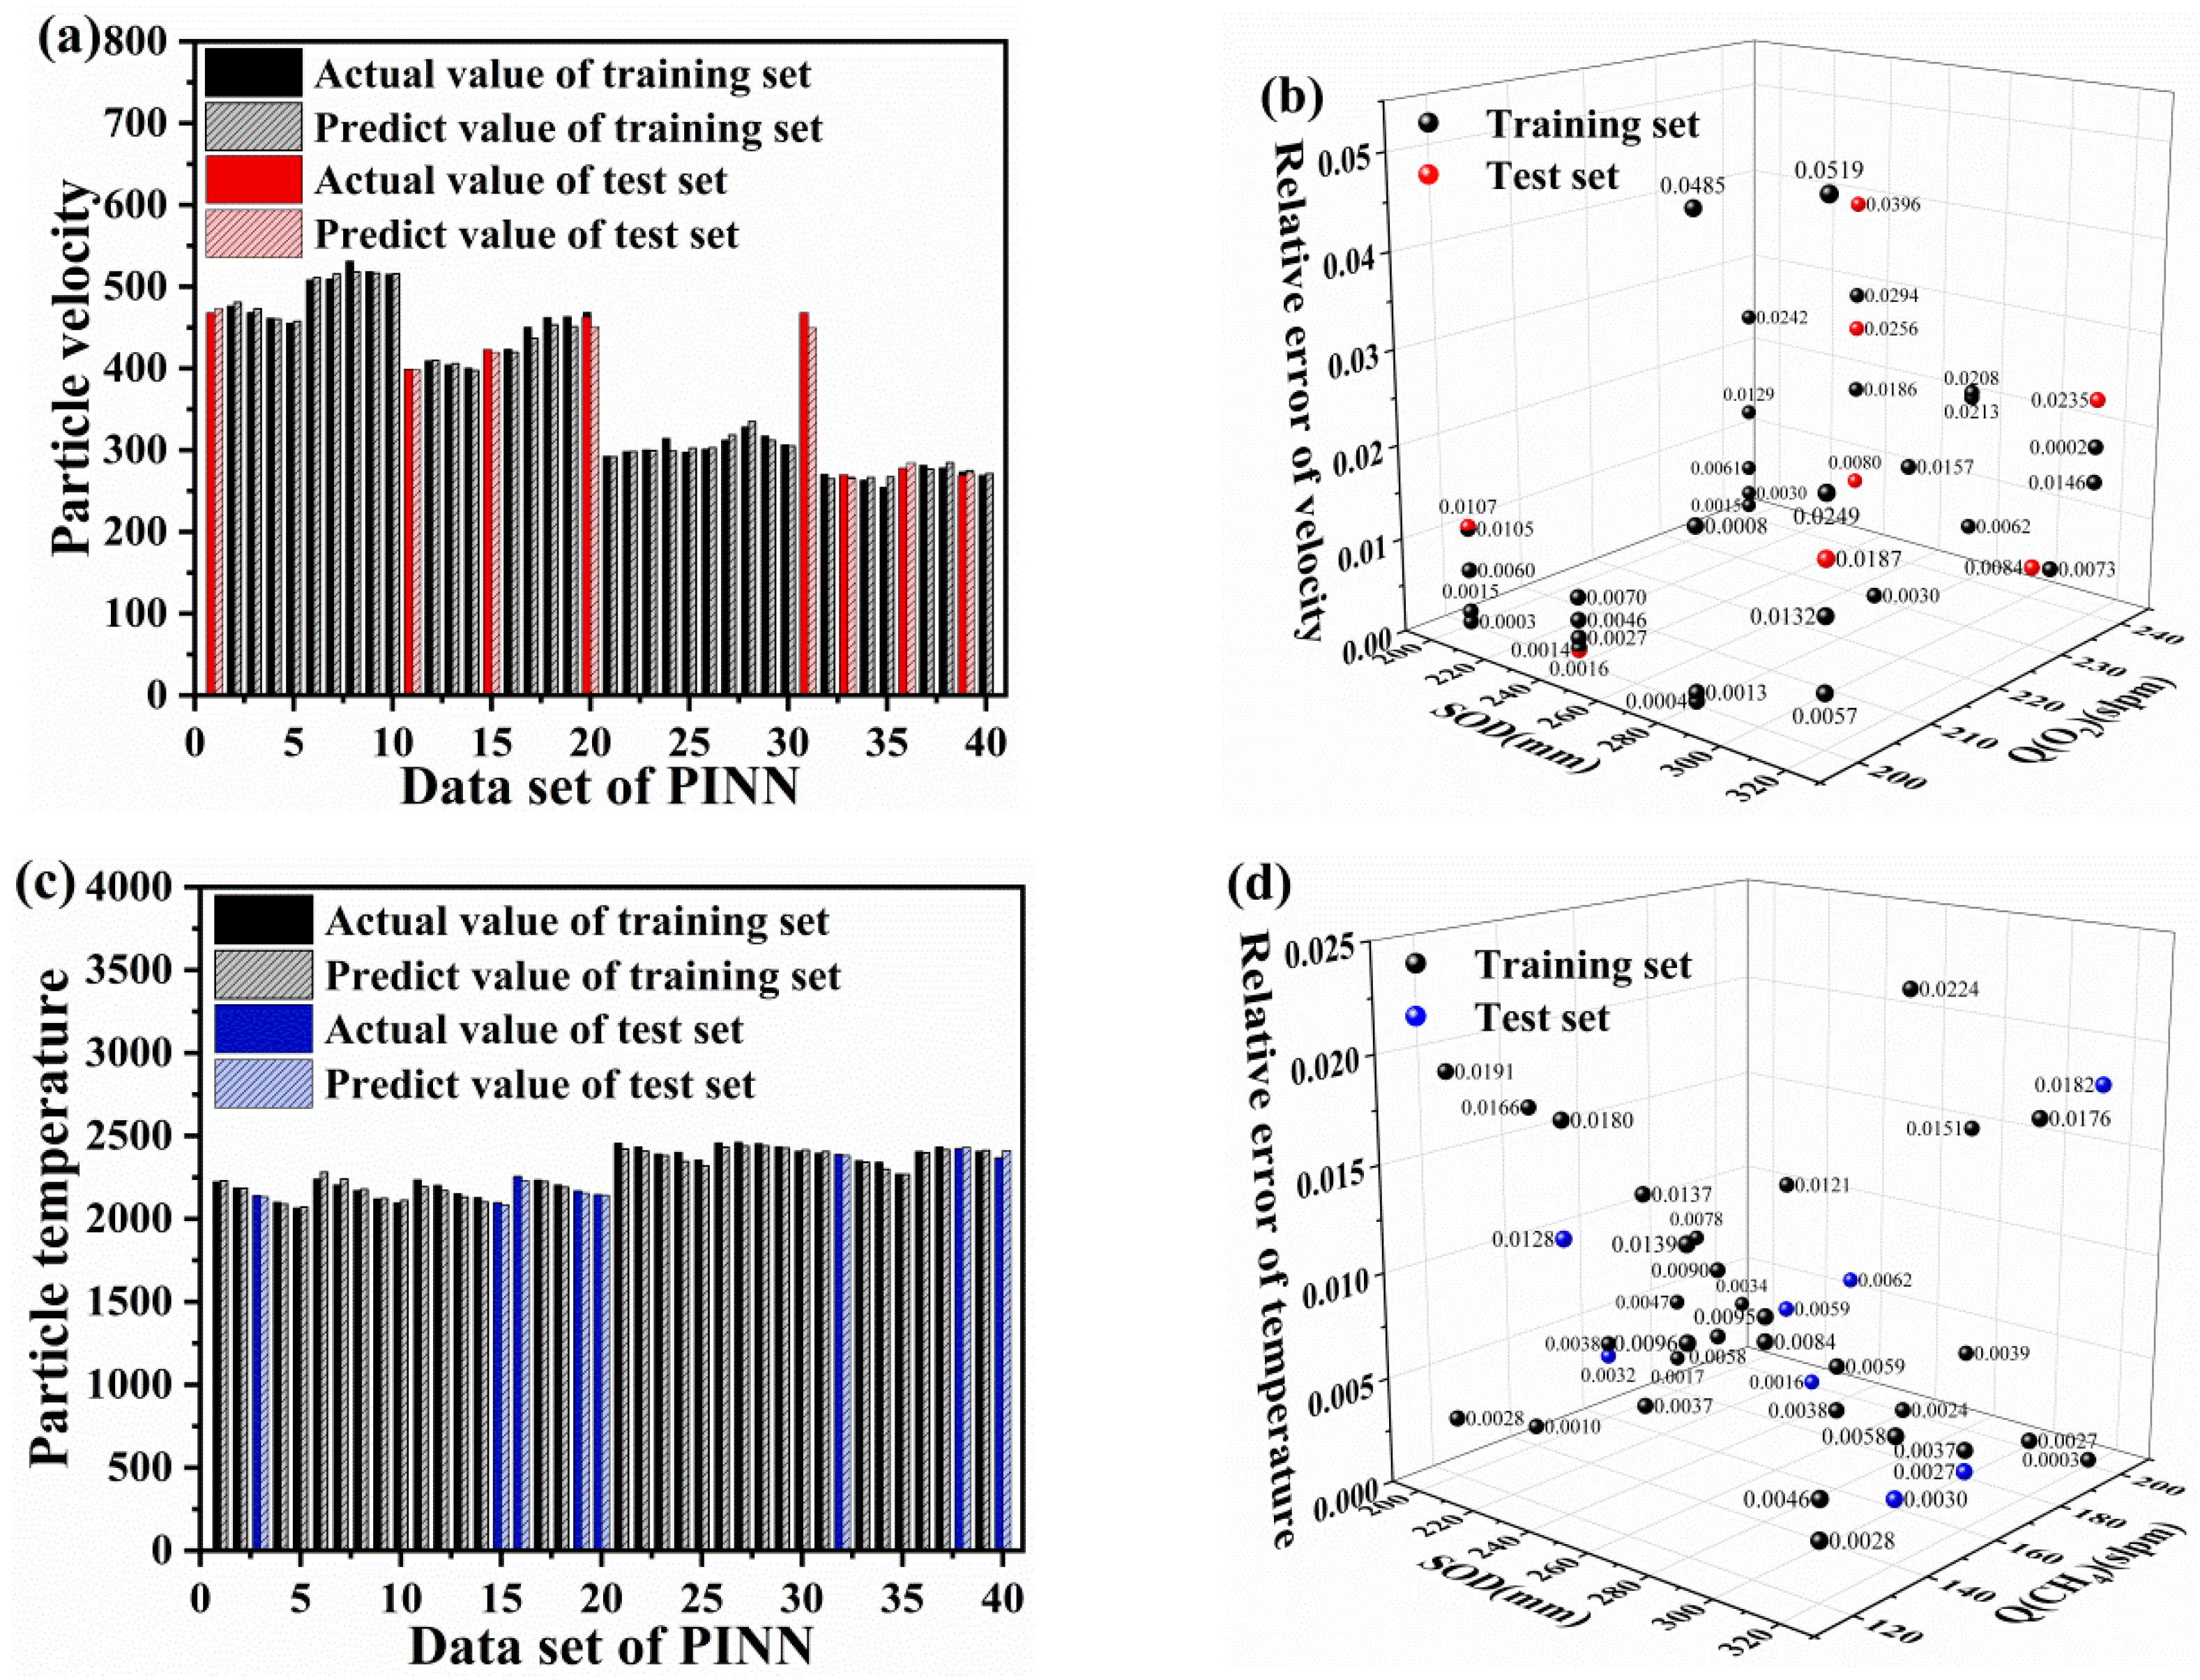
The mean absolute error (MAE) distribution between the experimental values and the predicted values of the PINN model is shown in Figure 11. It was calculated using Equation (6). Figure 11a,b display the MAE distribution of in-flight particle velocity for the training and validation sets, which were distributed from 0.00033 to 0.05190 with an MAE of 0.01346. Figure 11c,d show the MAE distribution of the in-flight particle temperature, which ranged from 0.00026 to 0.02241 with an MAE of 0.00966. The velocity distribution of in-flight particles was larger and more dispersed than the temperature distribution, indicating that the PINN model was more accurate in predicting temperature owing to the uniform preheating of in-flight particles during the testing process, which led to a more accurate temperature estimation. For in-flight particle velocity values, the model predicted instantaneous velocity during a short period before the in-flight and the MAE was normal (i.e., within the range of acceptability).
To verify the reliability of the PINN model, a randomly selected test set, unrelated to the training and optimization of the PINN model, was used to validate the predicted velocity and temperature performance. Figure 11 shows that the maximum MAEs of the velocity and temperature of in-flight particles in the test set were 0.03962 and 0.01824, respectively, while the minimum MAEs of the velocity and temperature of in-flight particles in the test set were 0.00142 and 0.00026, respectively. In other words, it reveals that the prediction accuracy of temperature and velocity of in-flight particles are 96.89% and 99.47%, respectively. Comparing with in-flight particle predictions based on traditional machine learning models from different thermal spraying routes, including plasma spraying (with 82% and 97% prediction accuracies for mean particle temperature and velocity) [36], cold spraying (with 96.45% predication accuracy for particle velocity) [37], and HVOF (with 99.24% and 99.57% prediction accuracies for mean particle temperature and velocity) [13], the novel hybrid PINN-CNN model exhibited generally more accurate predictions. In addition, results indicated that the predicted and actual values of the model were consistent, which demonstrates that the PINN model was trained and met the prediction requirements for the temperature and velocity of in-flight particles in the HVOF spray process. The model establishes a physical relation to describe the association between HVOF spray process parameters and particle flight characteristics.

4.3. Analysis of the CNN Training Results

After training the CNN network (Figure 12a–c), we plotted the loss function values of the training set for each training cycle. The results indicated a gradual decrease in the training error with increasing training times; the average training error stabilized at approximately 0.05 after 20,000 training cycles.
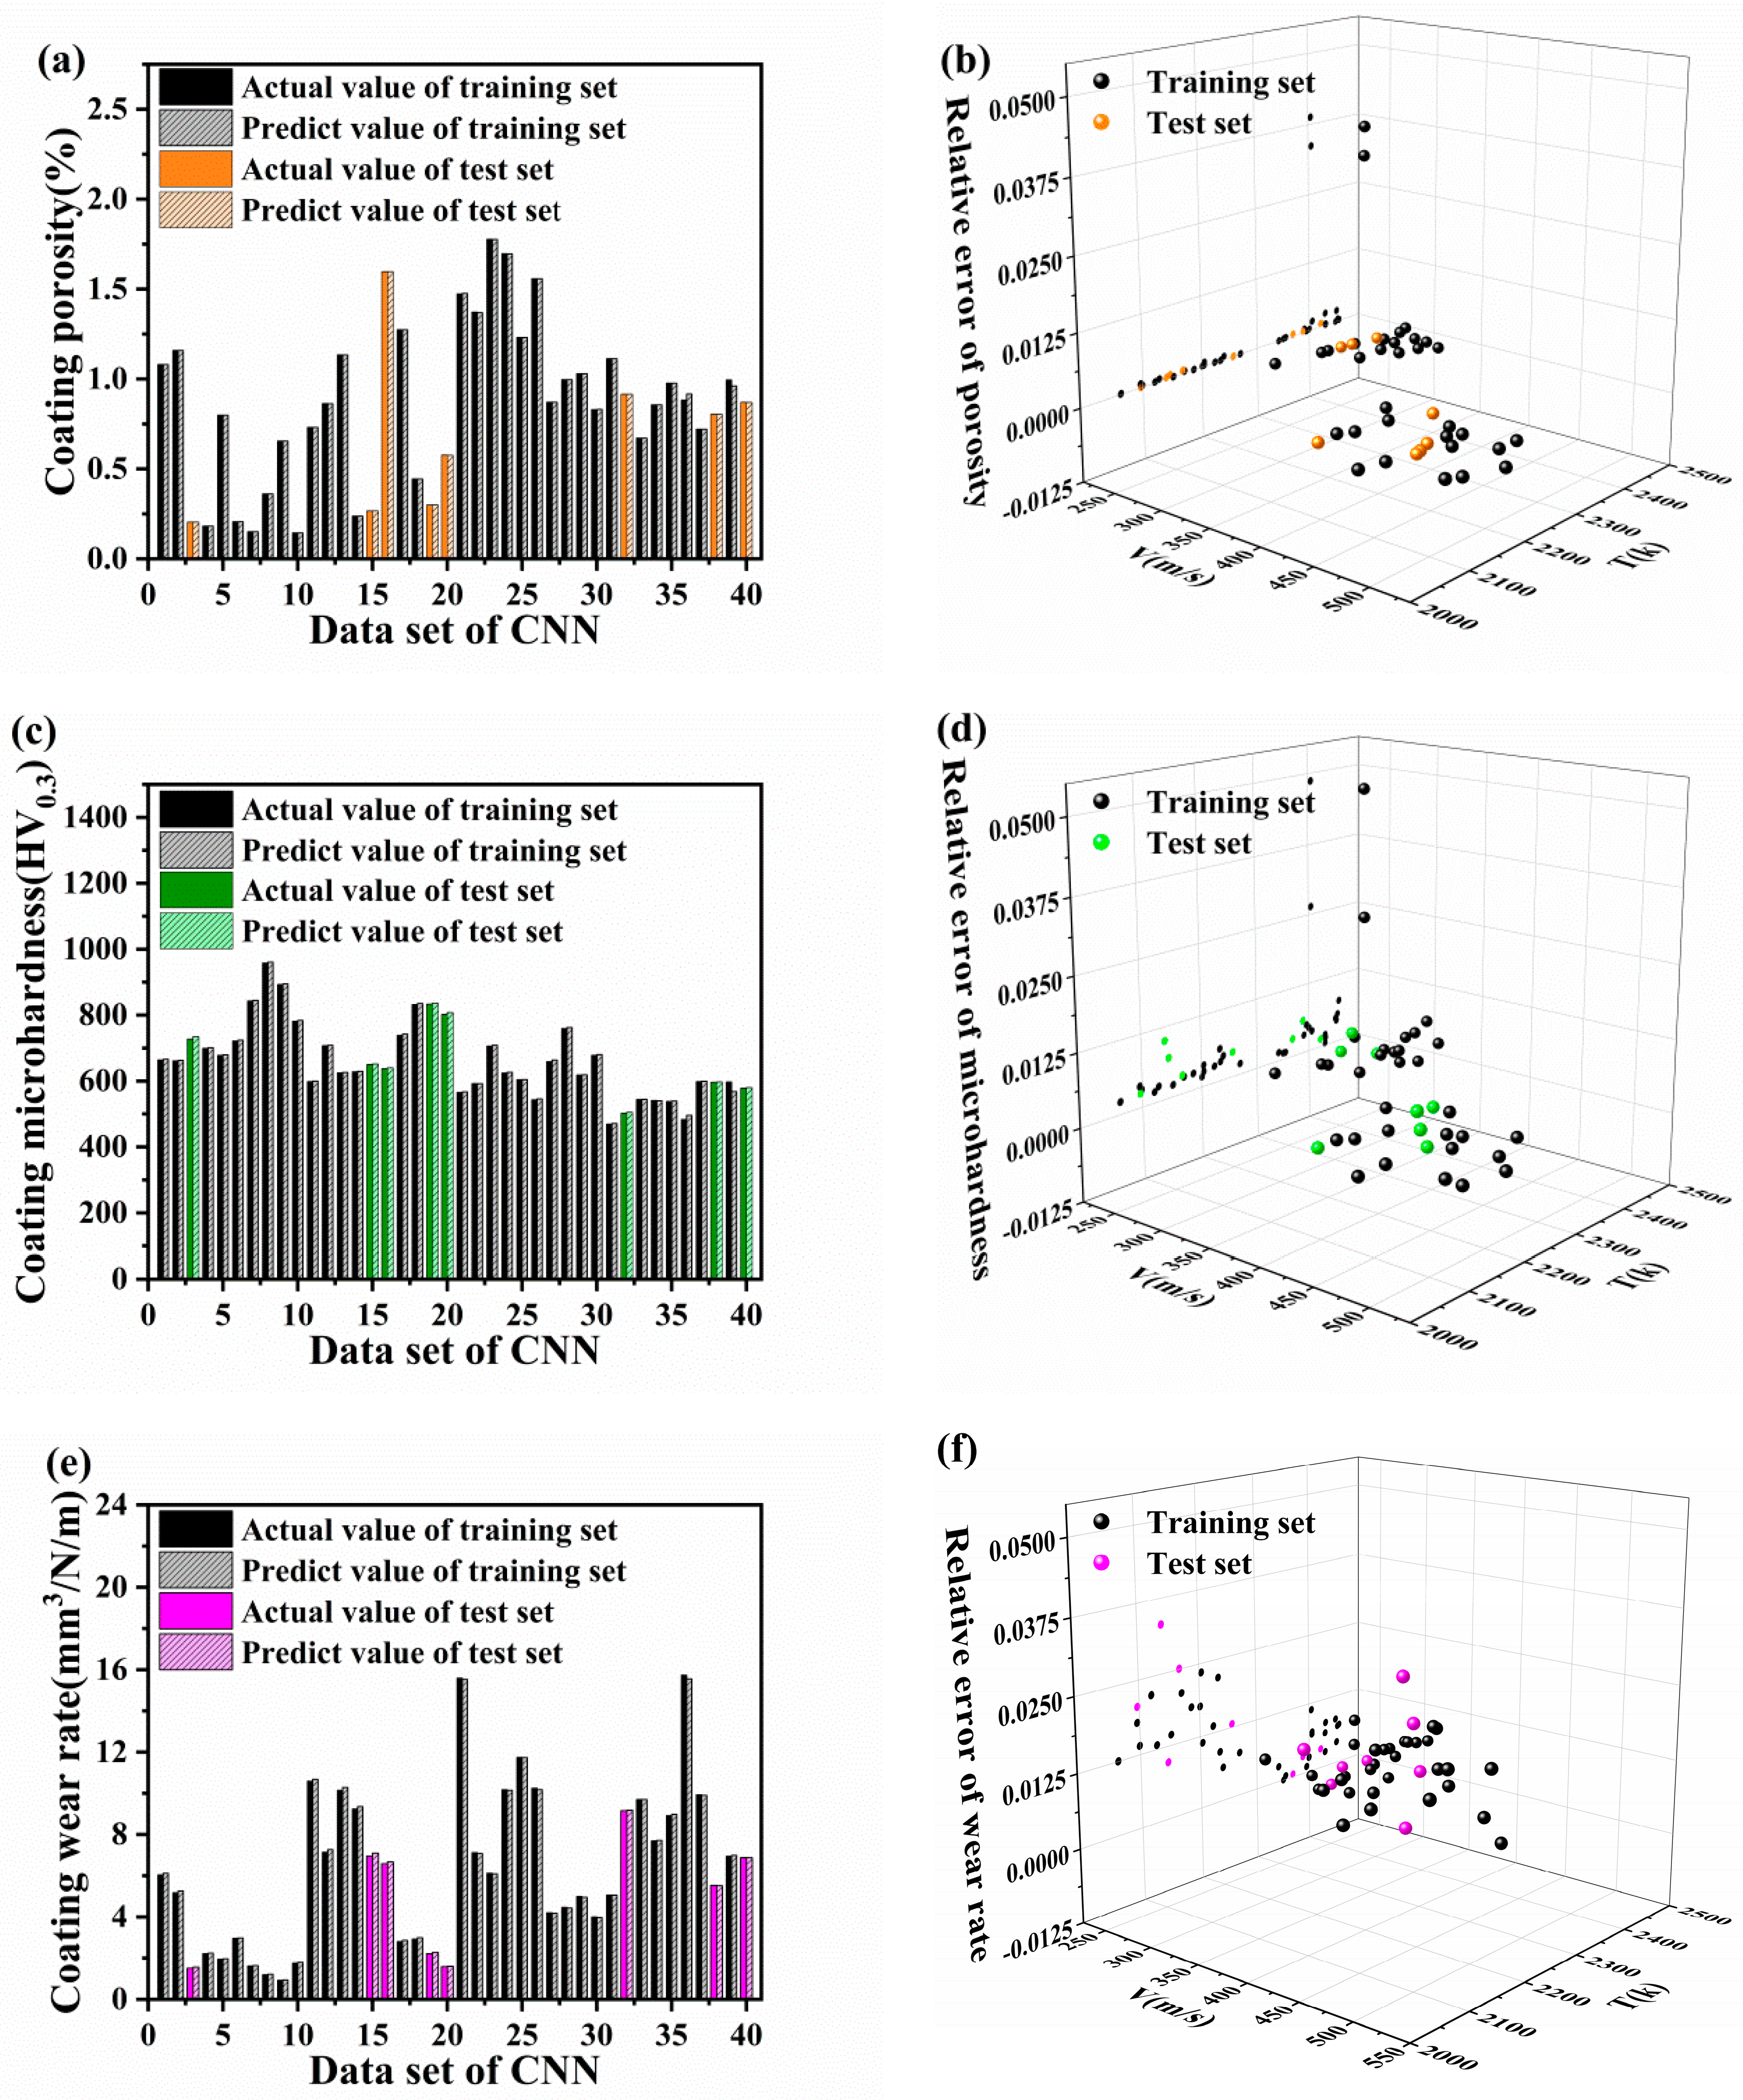
To evaluate the effectiveness of the CNN model, we randomly split the dataset into training and validation sets. The experimental results show that the R2 values of the model reached 0.99971, 0.99741, and 0.99968 for the porosity, microhardness, and wear rate, respectively (as shown in Figure 13a–c). These results confirm that the fitting of the model is good. However, the R2 values of the CNN model were smaller than those of the PINN model. This difference can be attributed to the ability of the PINN to embed the physical relation equation, which enhances the prediction accuracy and fit of the model. The accuracy of the CNN model was evaluated using MAE (Figure 14a–f). After model training, we reversely normalized the true and predicted values in the training and validation sets. Figure 14 compares the MAEs between experimental values and the predicted values of the CNN model. As shown in Figure 14a,b, the MAEs for the porosity of the coating in the training and validation sets ranged from 0.000002 to 0.03877, with an average of 0.00218. The coating microhardness exhibited maximum and minimum MAEs of 0.04864 and 0.00043, respectively, between true and predicted values, with an average of 0.00513 (Figure 14c,d). Furthermore, the MAEs of the coating wear rate were mostly distributed between 0.000004 and 0.03318, with an average of 0.01078 (Figure 14e,f). The MAE results indicate that the error distribution of the coating wear rate is wider and more dispersed than the distribution of coating microhardness or porosity. This implies that the CNN model accurately predicts the porosity and microhardness of the coating. This is because porosity is a parameter directly obtained after spraying and less influenced by other parameters. Therefore, direct prediction based on particle velocity and temperature provides high accuracy of up to 99%. Furthermore, in case of coating microhardness, the error bars are larger, the CNN data exhibit fluctuations, and the test data are affected by specimen size, the degree of particle flattening, and residual stress. The accuracy of data predicted directly on the basis of particle velocity and temperature is lower than that predicted on the basis of porosity. The coating wear rate is influenced by the porosity, microhardness, and roughness of the sample and exhibits a substantial relation with the surface condition of the specimen post treatment. Therefore, it is understandably influenced by the crossover of parameters, and the prediction accuracy of the model is low.
Figure 14 demonstrates the reliability of the CNN model through evaluating its prediction performance on the test set. The porosity, microhardness, and wear rate have maximum MAEs of 0.00063, 0.01009, and 0.03318, respectively. The minimum MAEs for porosity, microhardness, and wear rate are 0.00029, 0.00146, and 0.00052, respectively. These results indicated that the predication accuracy for coatings’ porosity, microhardness and wear rate are 99.97%, 99.74%, and 99.97%, respectively. As a comparison, based on the Generative Adversarial Network (GAN) model, the prediction accuracy for coating characteristics via suspension plasma spraying is only 80% [24]. Consequently, the hybrid PINN-CNN model also possess advantages with excellent prediction accuracy for coating performances.

5. Conclusions

Herein, a new hierarchical neural network model based on the PINN and CNN has been proposed to simulate the relation between HVOF spray process parameters, in-flight particle characteristics, and NiCr–Cr3C2 coating properties. It should be mentioned that the development of the novel hybrid PINN-CNN model could be beneficial for reducing the overfitting problem from the conventional ANN model, as well as compensating for the poor transferability of traditional machine learning techniques due to the usage of PINN model. The main contributions of the proposed approach can be summarized as follows: First, an RF model was developed for feature selection to assess the importance of each feature. Results demonstrate that SOD exerts the greatest effect on the velocity and temperature of in-flight particles and that the velocity of in-flight particles affects the microhardness and wear rate of the coating; the temperature of in-flight particles is more important for the porosity of the coating than their velocity. Second, this study proposes a novel approach: the prediction of HVOF-sprayed coatings based on the hybrid PINN-CNN model. The PINN model can predict the velocity and temperature of in-flight particles via training and optimization, with MAEs of 0.01346 and 0.00966, respectively. Third, the CNN model considers the velocity and temperature of in-flight particles predicted by the PINN as the input and predicts the porosity, microhardness, and wear rate. The MAEs of the CNN model are 0.00218, 0.00513, and 0.01078 for the porosity, microhardness, and wear rate, respectively, which achieve good prediction accuracy and less overfitting. The hybrid PINN-CINN model prediction errors are 1% overall, and the R2 is >96%, which possessed comparable or even better prediction accuracies for both in-flight particle characteristics and coating performances compared to traditional ML models. Moreover, the development of the novel hybrid PINN-CNN model is beneficial for reducing the overfitting problem from the conventional ANN model, as well as compensating for the poor transferability of traditional machine learning techniques due to the usage of the PINN model. All in all, the hierarchical neural network model is not only capable of effectively realizing the prediction of in-flight particle behavior and coating performances as well as its influencing factors, but also providing a theoretical basis for preparing and optimizing high-performance HVOF-sprayed coatings.

Author Contributions

Conceptualization, M.L.; methodology, R.C. and S.L.; software, B.W. and R.C.; funding acquisition, Q.Z.; investigation, Q.Z. and Y.X.; project administration, Y.X.; data curation, L.G.; resources, S.L.; validation, A.K.; visualization, A.K.; writing—original draft, L.G. and B.W.; writing—review and editing, Z.Y.; supervision, Z.Y. and M.L. All authors have read and agreed to the published version of the manuscript.

Funding

This work was supported by the Natural Science Foundation of Jiangsu Higher Education Institution of China (Grant No. 20KJB430003) and the open project of Key Laboratory of Green Fabrication and Surface Technology of Advanced Metal Materials (Grant NO. GFST2021KF01). Zexin Yu also thanks for the support from the Humboldt Fellowship.

Institutional Review Board Statement

Not applicable.

Informed Consent Statement

Not applicable.

Data Availability Statement

Not applicable.

Conflicts of Interest

The authors declare that they have no known competing financial interests or personal relationships that could have appeared to influence the work reported in this paper.

References

  1. Raza, A.; Ahmad, F.; Badri, T.M.; Raza, M.; Malik, K. An influence of oxygen flow rate and spray distance on the porosity of HVOF coating and its effects on corrosion—A review. Materials 2022, 15, 6329. [Google Scholar] [CrossRef] [PubMed]
  2. Straffelini, G.; Federici, M. HVOF cermet coatings to improve sliding wear resistance in engineering systems. Coatings 2020, 10, 886. [Google Scholar] [CrossRef]
  3. Pradeep, D.; Venkatesh, C.; Nithin, H. Review on tribological and mechanical behavior in HVOF thermal-sprayed composite coatings. J. Bio-Tribo-Corros. 2022, 8, 30. [Google Scholar] [CrossRef]
  4. Silvello, A.; Cavaliere, P.; Yin, S.; Lupoi, R.; Garcia Cano, I.; Dosta, S. Microstructural, mechanical and wear behavior of HVOF and cold-sprayed high-entropy alloys (HEAs) coatings. J. Therm. Spray Technol. 2022, 31, 1184–1206. [Google Scholar] [CrossRef]
  5. Mittal, G.; Paul, S. Suspension and Solution Precursor Plasma and HVOF Spray: A Review. J. Therm. Spray Technol. 2022, 31, 1443–1475. [Google Scholar] [CrossRef]
  6. Kumar, R.; Kamaraj, M.; Seetharamu, S.; Pramod, T.; Sampathkumaran, P. Effect of spray particle velocity on cavitation erosion resistance characteristics of HVOF and HVAF processed 86WC-10Co4Cr hydro turbine coatings. J. Therm. Spray Technol. 2016, 25, 1217–1230. [Google Scholar] [CrossRef]
  7. Guo, X.; Planche, M.-P.; Chen, J.; Liao, H. Relationships between in-flight particle characteristics and properties of HVOF sprayed WC-CoCr coatings. J. Mater. Process. Technol. 2014, 214, 456–461. [Google Scholar] [CrossRef]
  8. Zhao, L.; Maurer, M.; Fischer, F.; Dicks, R.; Lugscheider, E. Influence of spray parameters on the particle in-flight properties and the properties of HVOF coating of WC-CoCr. Wear 2004, 257, 41–46. [Google Scholar] [CrossRef]
  9. Praveen, A.S.; Sarangan, J.; Suresh, S.; Channabasappa, B. Optimization and erosion wear response of NiCrSiB/WC–Co HVOF coating using Taguchi method. Ceram. Int. 2016, 42, 1094–1104. [Google Scholar] [CrossRef]
  10. Qiao, L.; Wu, Y.; Hong, S.; Zhang, J.; Shi, W.; Zheng, Y. Relationships between spray parameters, microstructures and ultrasonic cavitation erosion behavior of HVOF sprayed Fe-based amorphous/nanocrystalline coatings. Ultrason. Sonochem. 2017, 39, 39–46. [Google Scholar] [CrossRef] [PubMed]
  11. Dongmo, E.; Wenzelburger, M.; Gadow, R. Analysis and optimization of the HVOF process by combined experimental and numerical approaches. Surf. Coat. Technol. 2008, 202, 4470–4478. [Google Scholar] [CrossRef]
  12. Pan, J.; Hu, S.; Yang, L.; Ding, K.; Ma, B. Numerical analysis of flame and particle behavior in an HVOF thermal spray process. Mater. Des. 2016, 96, 370–376. [Google Scholar] [CrossRef]
  13. Liu, M.; Yu, Z.; Wu, H.; Liao, H.; Zhu, Q.; Deng, S. Implementation of artificial neural networks for forecasting the HVOF spray process and HVOF sprayed coatings. J. Therm. Spray Technol. 2021, 30, 1329–1343. [Google Scholar] [CrossRef]
  14. Nguyen, T.P.; Doan, T.H.; Tong, V.C. Multi-objective optimization of WC-12Co coating by high-velocity oxygen fuel spray using multiple regression-based weighted signal-to-noise ratio. Proc. Inst. Mech. Eng. Part B—J. Eng. Manuf. 2021, 235, 1168–1178. [Google Scholar] [CrossRef]
  15. Li, C.; Gao, X.; Zhang, D.; Gao, H.; Han, X.; Zhang, B. Numerical Investigation on the Flame Characteristics and Particle Behaviors in a HVOF Spray Process Using Kerosene as Fuel. J. Therm. Spray Technol. 2021, 30, 725–738. [Google Scholar] [CrossRef]
  16. Oksa, M.; Turunen, E.; Suhonen, T.; Varis, T.; Hannula, S.P. Optimization and Characterization of High Velocity Oxy-fuel Sprayed Coatings: Techniques, Materials, and Applications. Coatings 2011, 1, 17–52. [Google Scholar] [CrossRef]
  17. Zhu, J.; Wang, X.; Kou, L.; Zheng, L.; Zhang, H. Prediction of control parameters corresponding to in-flight particles in atmospheric plasma spray employing convolutional neural networks. Surf. Coat. Technol. 2020, 394, 125862. [Google Scholar] [CrossRef]
  18. Guessasma, S.; Montavon, G.; Coddet, C. Modeling of the APS plasma spray process using artificial neural networks: Basis, requirements and an example. Comput. Mater. Sci. 2004, 29, 315–333. [Google Scholar] [CrossRef]
  19. Sahraoui, T.; Guessasma, S.; Fenineche, N.; Montavon, G.; Coddet, C. Friction and wear behaviour prediction of HVOF coatings and electroplated hard chromium using neural computation. Mater. Lett. 2004, 58, 654–660. [Google Scholar] [CrossRef]
  20. Guessasma, S.; Montavon, G.; Coddet, C. Neural computation to predict in-flight particle characteristic dependences from processing parameters in the APS process. J. Therm. Spray Technol. 2004, 13, 570–585. [Google Scholar] [CrossRef]
  21. Guessasma, S.; Salhi, Z.; Montavon, G.; Gougeon, P.; Coddet, C. Artificial intelligence implementation in the APS process diagnostic. Mater. Sci. Eng. B 2004, 110, 285–295. [Google Scholar] [CrossRef]
  22. Choudhury, T.; Hosseinzadeh, N.; Berndt, C. Artificial Neural Network application for predicting in-flight particle characteristics of an atmospheric plasma spray process. Surf. Coat. Technol. 2011, 205, 4886–4895. [Google Scholar] [CrossRef]
  23. Zhang, C.; Kanta, A.F.; Li, C.X.; Li, C.J.; Planche, M.P.; Liao, H.L.; Coddet, C. Effect of in-flight particle characteristics on the coating properties of atmospheric plasma-sprayed 8 mol% Y2O3-ZrO2 electrolyte coating studying by artificial neural networks. Surf. Coat. Technol. 2009, 204, 463–469. [Google Scholar] [CrossRef]
  24. Mahendru, P.; Tembely, M.; Dolatabadi, A. Artificial Intelligence Models for Analyzing Thermally Sprayed Functional Coatings. J. Therm. Spray Technol. 2023, 32, 388–400. [Google Scholar] [CrossRef]
  25. Mojena, M.A.R.; Roca, A.S.; Zamora, R.S.; Orozco, M.S.; Fals, H.C.; Lima, C.R.C. Neural network analysis for erosive wear of hard coatings deposited by thermal spray: Influence of microstructure and mechanical properties. Wear 2017, 376, 557–565. [Google Scholar] [CrossRef]
  26. Alzubaidi, L.; Zhang, J.; Humaidi, A.J.; Al-Dujaili, A.; Duan, Y.; Al-Shamma, O.; Santamaría, J.; Fadhel, M.A.; Al-Amidie, M.; Farhan, L. Review of deep learning: Concepts, CNN architectures, challenges, applications, future directions. J. Big Data 2021, 8, 1–74. [Google Scholar] [CrossRef] [PubMed]
  27. Finol, D.; Lu, Y.; Mahadevan, V.; Srivastava, A. Deep convolutional neural networks for eigenvalue problems in mechanics. Int. J. Numer. Methods Eng. 2019, 118, 258–275. [Google Scholar] [CrossRef]
  28. Zhang, J.S.; Jiang, Y.C.; Luo, H.; Yin, S. Prediction of material removal rate in chemical mechanical polishing via residual convolutional neural network. Control Eng. Pract. 2021, 107, 104673. [Google Scholar] [CrossRef]
  29. Lu, F.; Liang, Y.C.; Wang, X.Y.; Gao, T.H.; Chen, Q.; Liu, Y.C.; Zhou, Y.; Yuan, Y.K.; Liu, Y.T. Prediction of amorphous forming ability based on artificial neural network and convolutional neural network. Comput. Mater. Sci. 2022, 210, 111464. [Google Scholar] [CrossRef]
  30. Rudin, C. Stop explaining black box machine learning models for high stakes decisions and use interpretable models instead. Nat. Mach. Intell. 2019, 1, 206–215. [Google Scholar] [CrossRef]
  31. Raissi, M.; Yazdani, A.; Karniadakis, G.E. Hidden fluid mechanics: Learning velocity and pressure fields from flow visualizations. Science 2020, 367, 1026–1030. [Google Scholar] [CrossRef]
  32. Cai, S.; Wang, Z.; Wang, S.; Perdikaris, P.; Karniadakis, G.E. Physics-informed neural networks for heat transfer problems. J. Heat Transf. 2021, 143, 060801. [Google Scholar] [CrossRef]
  33. Rao, C.; Sun, H.; Liu, Y. Physics-informed deep learning for incompressible laminar flows. Theor. Appl. Mech. Lett. 2020, 10, 207–212. [Google Scholar] [CrossRef]
  34. Zhu, Q.; Liu, Z.; Yan, J. Machine learning for metal additive manufacturing: Predicting temperature and melt pool fluid dynamics using physics-informed neural networks. Comput. Mech. 2021, 67, 619–635. [Google Scholar] [CrossRef]
  35. Zhang, X.C.; Gong, J.G.; Xuan, F.Z. A physics-informed neural network for creep-fatigue life prediction of components at elevated temperatures. Eng. Fract. Mech. 2021, 258, 108130. [Google Scholar] [CrossRef]
  36. Bobzin, K.; Wietheger, W.; Heinemann, H.; Dokhanchi, S.R.; Rom, M.; Visconti, G. Prediction of Particle Properties in Plasma Spraying Based on Machine Learning. J. Therm. Spray Technol. 2021, 30, 1751–1764. [Google Scholar] [CrossRef]
  37. Wang, Z.Y.; Cai, S.; Chen, W.L.; Abd Ali, R.; Jin, K. Analysis of Critical Velocity of Cold Spray Based on Machine Learning Method with Feature Selection. J. Therm. Spray Technol. 2021, 30, 1213–1225. [Google Scholar] [CrossRef]
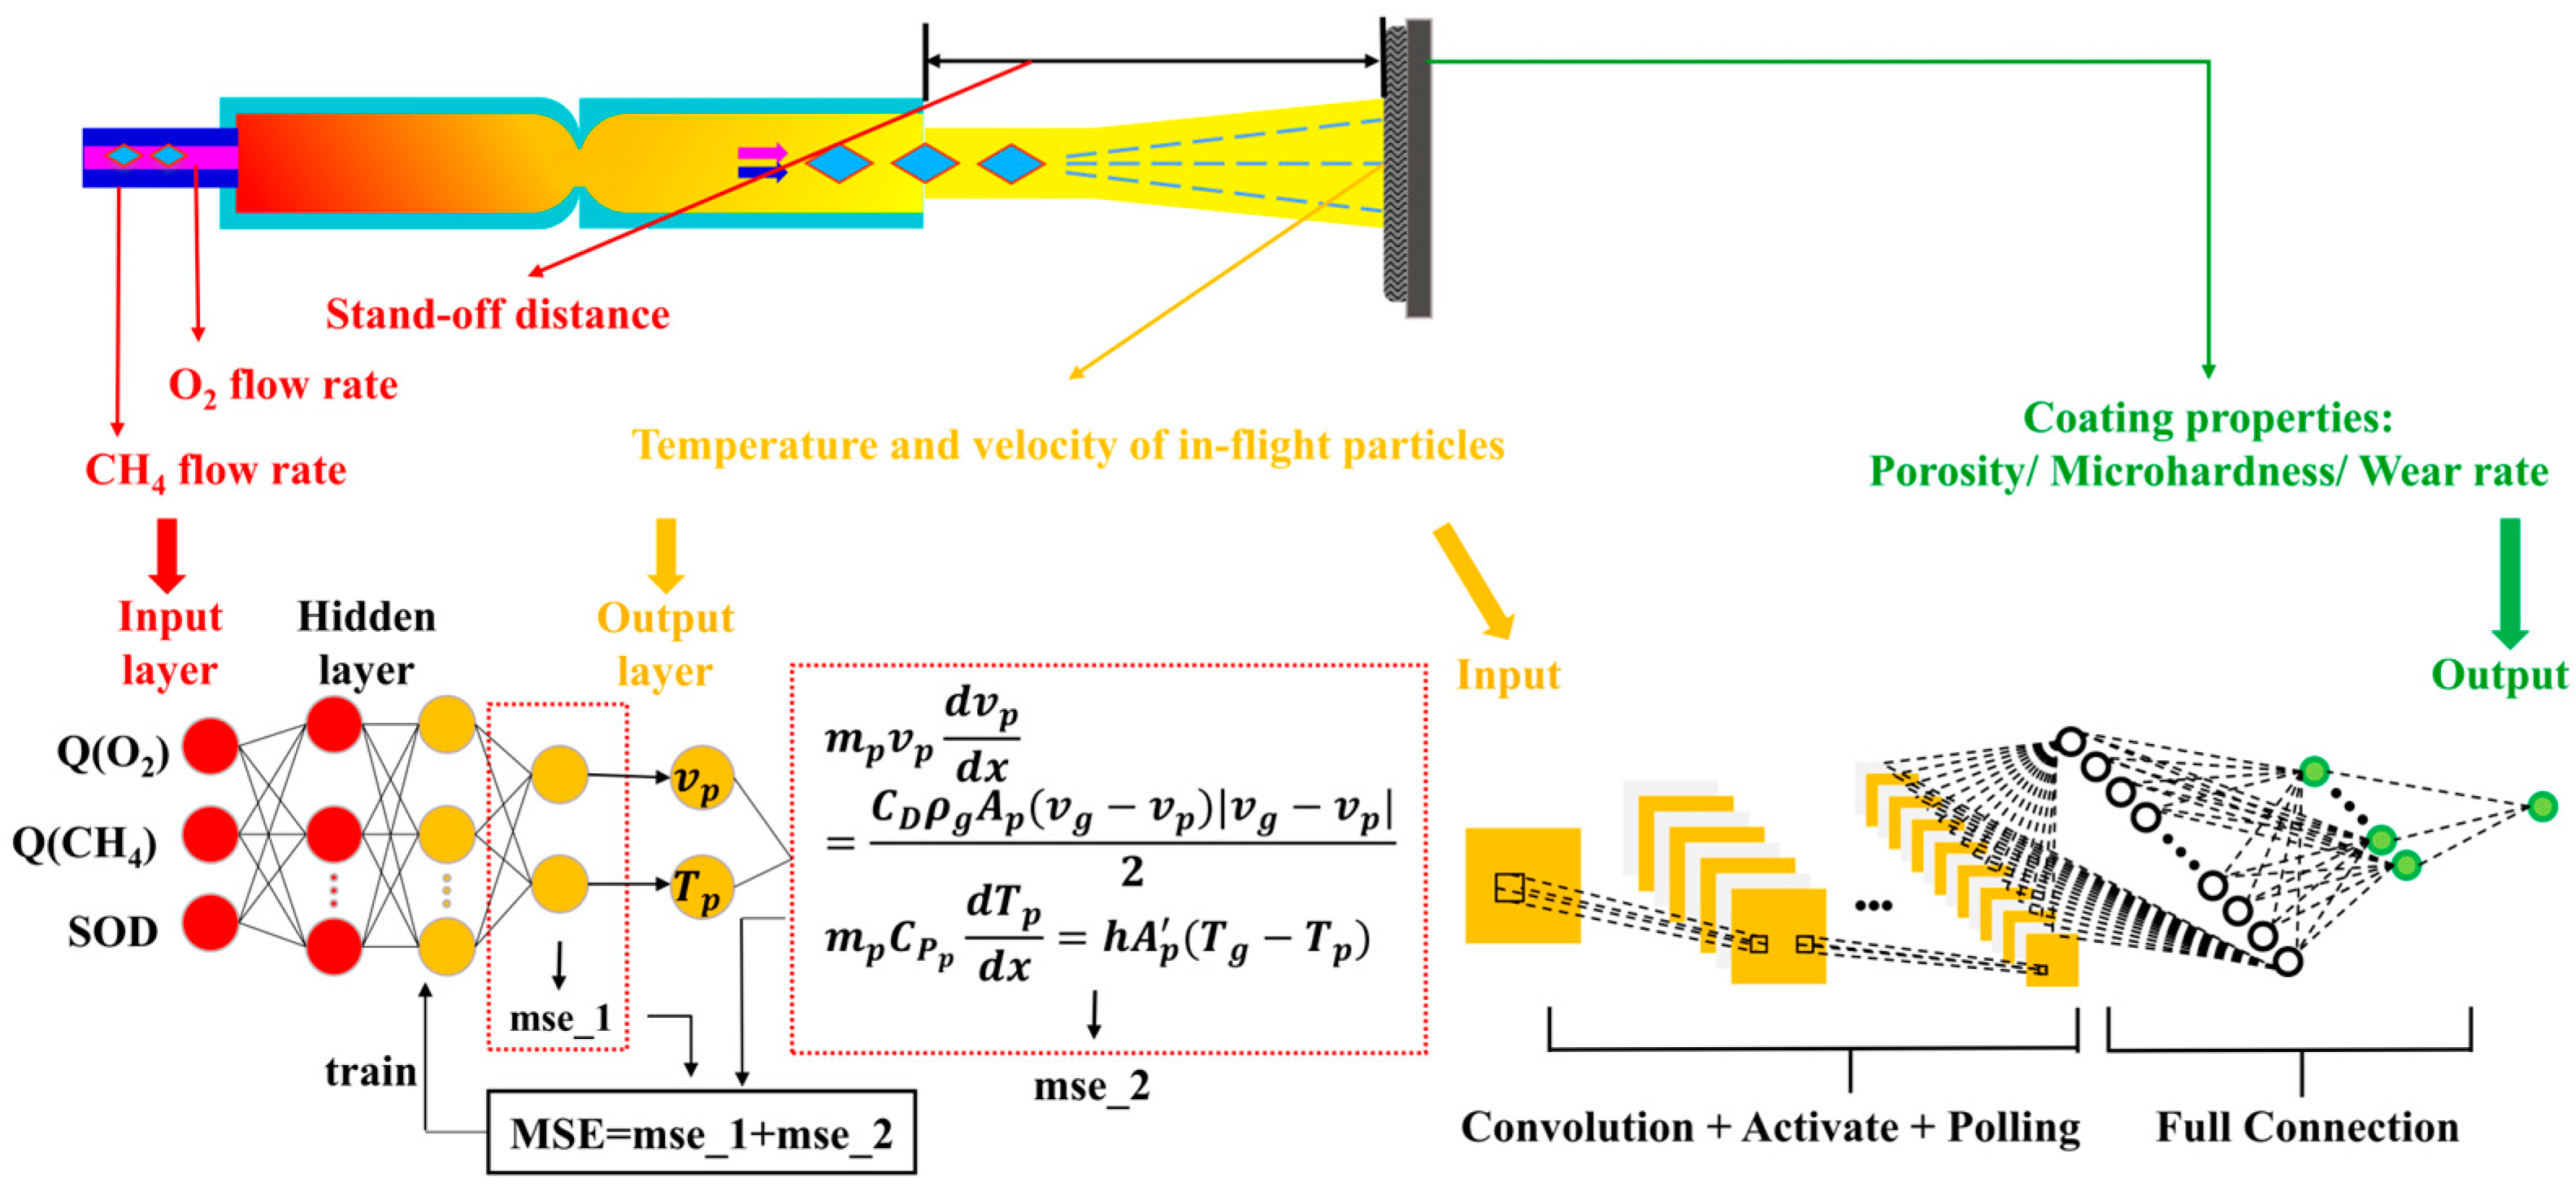
Figure 1. The framework of this work.
Materials 16 06279 g001
Figure 2. The random forest model structure.
Materials 16 06279 g002
Figure 3. Typical lamellar cross-section microstructures of sample (a) No. 5 and (b) No. 35.
Materials 16 06279 g003
Figure 4. Specific representation of data in the model.
Materials 16 06279 g004
Figure 5. PINN model architecture diagram.
Materials 16 06279 g005
Figure 6. The basic architecture of a CNN.
Materials 16 06279 g006
Figure 7. The progress of CNN training.
Materials 16 06279 g007
Figure 8. (a) The contribution rate of input variables on the velocity and temperature of in-flight particles. (b) The contribution rate of input variables on the coating porosity, microhardness, and wear rate.
Materials 16 06279 g008
Figure 9. The loss values of PINN training process for predicting velocity (a) and temperature (b).
Materials 16 06279 g009
Figure 10. Predicted R2 values for velocity (a) and temperature (b) models.
Materials 16 06279 g010
Figure 11. Mean absolute error distribution of the velocity (a,b) and temperature (c,d) experimental values and the predicted values from the PINN model.
Materials 16 06279 g011
Figure 12. The loss values of CNN training process for predicting porosity (a), microhardness (b), and wear rate (c).
Materials 16 06279 g012
Figure 13. Predicted R2 values for predicting porosity (a), microhardness (b), and wear rate (c) models.
Materials 16 06279 g013
Figure 14. Mean absolute error distribution of the porosity (a,b), microhardness (c,d), and wear rate (e,f) experimental values and the predicted values from the CNN model.
Materials 16 06279 g014
Table 1. Spraying parameters for NiCr-Cr3C2 coatings in the HVOF process.
ParametersScope
O2 flow (slpm)200–240
CH4 flow (slpm)120–200
Air flow (slpm)300
Carrier gas flow (slpm)40
stand-off distance (mm)200–320
Spray gun speed (mm/s)400
Powder feeding speed (g/min)30
Table 2. Spraying parameters, characteristics of in-flight particles, and coating performances.
No.Q(CH4)
(slpm)
SOD (mm) Q(O2)
(slpm)
V
(m/s)
T
(K)
MH
(HV0.3)
WR × 10−5
(mm3/N/m)
PO
(% Area)
112020020046722236646.0391.08
212020024050822397212.9620.206
3120240200389223459810.5870.731
412024024042322566376.5851.597
5120280200292245556515.5891.473
6120280240301245754310.2491.558
712032020026923954695.0611.113
8120320240274240548315.7320.883
914020020047621866615.1751.159
1014020024050922048431.6240.151
1114024020040922017077.1420.863
1214024024045022337382.8021.274
1314028020029824325927.1221.372
1414028024031224606594.2030.871
1514032020027023885029.1540.915
1614032024028124325989.9270.721
1716020020046821397271.5160.204
1816020024053121709581.1970.361
19160240200404215162510.1441.134
2016024024046222048322.9260.444
2116028020030023907066.1221.777
2216028024032824537594.4670.996
2316032020026523505449.6980.671
2416032024027824235965.540.803
2518020020046120996992.2170.182
2618020024051821208930.9260.655
2718024020040021276289.2350.237
2818024024046321678332.2210.299
29180280200314240062410.1721.697
3018028023031724336184.9971.03
3118032020026323415417.6930.856
3218032023327324065976.9410.995
3318620024051520967811.7640.144
3418824024046821458021.590.576
3520020020045520646781.9440.799
3620024020039920976506.9550.266
37200280200297235460411.7411.231
3820028022530624066784.0010.83
3920032020025422695388.920.977
4020032023026923685786.8810.87
Disclaimer/Publisher’s Note: The statements, opinions and data contained in all publications are solely those of the individual author(s) and contributor(s) and not of MDPI and/or the editor(s). MDPI and/or the editor(s) disclaim responsibility for any injury to people or property resulting from any ideas, methods, instructions or products referred to in the content.