


Effect of Pretreatment on the Nitrogen Doped Activated Carbon Materials Activity towards Oxygen Reduction Reaction

 , ,
, , 
 ,
,  ,
,  ,
,  , ,
, , 
Abstract
:1. Introduction
2. Materials and Methods
2.1. Nitrogen Doping
2.2. Characterization of N-Doped Carbon Materials
2.3. Electrochemical Measurements of the N-Doped Carbon Materials
3. Results and Discussion
3.1. Characterisation of N-Doped Carbon Materials
3.2. Electrochemical Tests
4. Conclusions
Supplementary Materials
Author Contributions
Funding
Institutional Review Board Statement
Informed Consent Statement
Data Availability Statement
Acknowledgments
Conflicts of Interest
References
- Park, S.; Kim, J.; Kwon, K. A review on biomass-derived N-doped carbons as electrocatalysts in electrochemical energy applications. Chem. Eng. J. 2022, 446, 137116. [Google Scholar] [CrossRef]
- Zaman, S.; Wang, M.; Liu, H.; Sun, F.; Yu, Y.; Shui, J.; Chen, M.; Wang, H. Carbon-based catalyst supports for oxygen reduction in proton-exchange membrane fuel cells. Trends Chem. 2022, 4, 886–906. [Google Scholar] [CrossRef]
- Plavniece, A.; Volperts, A.; Dobele, G.; Zhurinsh, A.; Kaare, K.; Kruusenberg, I.; Kaprans, K.; Knoks, A.; Kleperis, J. Wood and Black Liquor-Based N-Doped Activated Carbon for Energy Application. Sustainability 2021, 13, 9237. [Google Scholar] [CrossRef]
- Rabinovich, M.L.; Fedoryak, O.; Dobele, G.; Andersone, A.; Gawdzik, B.; Lindström, M.E.; Sevastyanova, O. Carbon adsorbents from industrial hydrolysis lignin: The USSR/Eastern European experience and its importance for modern biorefineries. Renew. Sustain. Energy Rev. 2016, 57, 1008–1024. [Google Scholar] [CrossRef]
- Plavniece, A.; Dobele, G.; Volperts, A.; Zhurinsh, A. Hydrothermal Carbonization vs. Pyrolysis: Effect on the Porosity of the Activated Carbon Materials. Sustainability 2022, 14, 15982. [Google Scholar] [CrossRef]
- Sanchez-Sanchez, A.; Braghiroli, F.; Izquierdo, M.; Parmentier, J.; Celzard, A.; Fierro, V. Synthesis and properties of carbon microspheres based on tannin–sucrose mixtures treated in hydrothermal conditions. Ind. Crop. Prod. 2020, 154, 112564. [Google Scholar] [CrossRef]
- Sevilla, M.; Maciá-Agulló, J.A.; Fuertes, A.B. Hydrothermal carbonization of biomass as a route for the sequestration of CO2: Chemical and structural properties of the carbonized products. Biomass-Bioenergy 2011, 35, 3152–3159. [Google Scholar] [CrossRef]
- Kambo, H.S.; Dutta, A. A comparative review of biochar and hydrochar in terms of production, physico-chemical properties and applications. Renew. Sustain. Energy Rev. 2015, 45, 359–378. [Google Scholar] [CrossRef]
- Li, R.; Zhou, Y.; Li, W.; Zhu, J.; Huang, W. Structure Engineering in Biomass-Derived Carbon Materials for Electrochemical Energy Storage. Research 2020, 2020, 8685436. [Google Scholar] [CrossRef]
- Pandolfo, A.; Hollenkamp, A.F. Carbon properties and their role in supercapacitors. J. Power Sources 2006, 157, 11–27. [Google Scholar] [CrossRef]
- Shi, H. Activated carbons and double layer capacitance. Electrochim. Acta 1996, 41, 1633–1639. [Google Scholar] [CrossRef]
- Yang, K.-L.; Ying, T.-Y.; Yiacoumi, S.; Tsouris, C.; Vittoratos, E.S. Electrosorption of Ions from Aqueous Solutions by Carbon Aerogel: An Electrical Double-Layer Model. Langmuir 2001, 17, 1961–1969. [Google Scholar] [CrossRef]
- Rufford, T.E.; Hulicova-Jurcakova, D.; Zhu, Z.; Lu, G.Q. Empirical analysis of the contributions of mesopores and micropores to the double-layer capacitance of carbons. J. Phys. Chem. C 2009, 113, 19335–19343. [Google Scholar] [CrossRef]
- Dai, L.; Xue, Y.; Qu, L.; Choi, H.-J.; Baek, J.-B. Metal-Free Catalysts for Oxygen Reduction Reaction. Chem. Rev. 2015, 115, 4823–4892. [Google Scholar] [CrossRef]
- Trogadas, P.; Fuller, T.F.; Strasser, P. Carbon as catalyst and support for electrochemical energy conversion. Carbon 2014, 75, 5–42. [Google Scholar] [CrossRef]
- Daems, N.; Sheng, X.; Vankelecom, I.F.J.; Pescarmona, P.P. Metal-free doped carbon materials as electrocatalysts for the oxygen reduction reaction. J. Mater. Chem. A 2014, 2, 4085–4110. [Google Scholar] [CrossRef]
- Dessalle, A.; Quílez-Bermejo, J.; Fierro, V.; Xu, F.; Celzard, A. Recent progress in the development of efficient biomass-based ORR electrocatalysts. Carbon 2023, 203, 237–260. [Google Scholar] [CrossRef]
- Wang, D.-W.; Su, D. Heterogeneous nanocarbon materials for oxygen reduction reaction. Energy Environ. Sci. 2014, 7, 576–591. [Google Scholar] [CrossRef]
- Wang, M.; Ma, J.; Yang, H.; Lu, G.; Yang, S.; Chang, Z. Nitrogen and Cobalt Co-Coped Carbon Materials Derived from Biomass Chitin as High-Performance Electrocatalyst for Aluminum-Air Batteries. Catalysts 2019, 9, 954. [Google Scholar] [CrossRef]
- Yang, H.; Li, Z.; Kou, S.; Lu, G.; Liu, Z. A complex-sequestered strategy to fabricate Fe single-atom catalyst for efficient oxygen reduction in a broad pH-range. Appl. Catal. B Environ. 2020, 278, 119270. [Google Scholar] [CrossRef]
- Borghei, M.; Lehtonen, J.; Liu, L.; Rojas, O.J. Advanced Biomass-Derived Electrocatalysts for the Oxygen Reduction Reaction. Adv. Mater. 2018, 30, e1703691. [Google Scholar] [CrossRef]
- Kaur, P.; Verma, G.; Sekhon, S. Biomass derived hierarchical porous carbon materials as oxygen reduction reaction electrocatalysts in fuel cells. Prog. Mater. Sci. 2018, 102, 1–71. [Google Scholar] [CrossRef]
- Du, L.; Zhang, G.; Liu, X.; Hassanpour, A.; Dubois, M.; Tavares, A.C.; Sun, S. Biomass-derived nonprecious metal catalysts for oxygen reduction reaction: The demand-oriented engineering of active sites and structures. Carbon Energy 2020, 2, 561–581. [Google Scholar] [CrossRef]
- Wang, M.; Wang, S.; Yang, H.; Ku, W.; Yang, S.; Liu, Z.; Lu, G. Carbon-Based Electrocatalysts Derived from Biomass for Oxygen Reduction Reaction: A Minireview. Front. Chem. 2020, 8, 116. [Google Scholar] [CrossRef] [PubMed]
- Volperts, A.; Plavniece, A.; Dobele, G.; Zhurinsh, A.; Kruusenberg, I.; Kaare, K.; Locs, J.; Tamasauskaite-Tamasiunaite, L.; Norkus, E. Biomass based activated carbons for fuel cells. Renew. Energy 2019, 141, 40–45. [Google Scholar] [CrossRef]
- Jiang, M.; Yu, X.; Yang, H.; Chen, S. Optimization Strategies of Preparation of Biomass-Derived Carbon Electrocatalyst for Boosting Oxygen Reduction Reaction: A Minireview. Catalysts 2020, 10, 1472. [Google Scholar] [CrossRef]
- Zhang, J.; He, J.; Zheng, H.; Li, R.; Gou, X. N,S dual-doped carbon nanosheet networks with hierarchical porosity derived from biomass of Allium cepa as efficient catalysts for oxygen reduction and Zn–air batteries. J. Mater. Sci. 2020, 55, 7464–7476. [Google Scholar] [CrossRef]
- Guo, D.; Shibuya, R.; Akiba, C.; Saji, S.; Kondo, T.; Nakamura, J. Active sites of nitrogen-doped carbon materials for oxygen reduction reaction clarified using model catalysts. Science 2016, 351, 361–365. [Google Scholar] [CrossRef]
- Lv, Q.; Si, W.; He, J.; Sun, L.; Zhang, C.; Wang, N.; Yang, Z.; Li, X.; Wang, X.; Deng, W.; et al. Selectively nitrogen-doped carbon materials as superior metal-free catalysts for oxygen reduction. Nat. Commun. 2018, 9, 3376. [Google Scholar] [CrossRef]
- Lai, L.; Potts, J.R.; Zhan, D.; Wang, L.; Poh, C.K.; Tang, C.; Gong, H.; Shen, Z.; Lin, J.; Ruoff, R.S. Exploration of the active center structure of nitrogen-doped graphene-based catalysts for oxygen reduction reaction. Energy Environ. Sci. 2012, 5, 7936–7942. [Google Scholar] [CrossRef]
- Lakhi, K.S.; Park, D.; Joseph, S.; Talapaneni, S.N.; Ravon, U.; Al-Bahily, K.; Vinu, A. Effect of heat treatment on the nitrogen content and its role on the carbon dioxide adsorption capacity of highly ordered mesoporous carbon nitride. Chem.-Asian J. 2017, 12, 595–604. [Google Scholar] [CrossRef]
- Mostazo-López, M.J.; Salinas-Torres, D.; Ruiz-Rosas, R.; Morallón, E.; Cazorla-Amorós, D. Nitrogen-doped superporous activated carbons as electrocatalysts for the oxygen reduction reaction. Materials 2019, 12, 1346. [Google Scholar] [CrossRef] [PubMed]
- Wu, X.; Tian, Z.; Hu, L.; Huang, S.; Cai, J. Macroalgae-derived nitrogen-doped hierarchical porous carbons with high performance for H2 storage and supercapacitors. RSC Adv. 2017, 7, 32795–32805. [Google Scholar] [CrossRef]
- Ferrari, A.C.; Robertson, J. Resonant Raman spectroscopy of disordered, amorphous, and diamondlike carbon. Phys. Rev. B 2001, 64, 075414. [Google Scholar] [CrossRef]
- Trusovas, R.; Račiukaitis, G.; Niaura, G.; Barkauskas, J.; Valušis, G.; Pauliukaite, R. Recent Advances in Laser Utilization in the Chemical Modification of Graphene Oxide and Its Applications. Adv. Opt. Mater. 2016, 4, 37–65. [Google Scholar] [CrossRef]
- Cançado, L.G.; Jorio, A.; Ferreira, E.H.M.; Stavale, F.; Achete, C.A.; Capaz, R.B.; Moutinho, M.V.d.O.; Lombardo, A.; Kulmala, T.S.; Ferrari, A.C. Quantifying Defects in Graphene via Raman Spectroscopy at Different Excitation Energies. Nano Lett. 2011, 11, 3190–3196. [Google Scholar] [CrossRef] [PubMed]
- O’neill, A.; Khan, U.; Nirmalraj, P.N.; Boland, J.; Coleman, J.N. Graphene dispersion and exfoliation in low boiling point solvents. J. Phys. Chem. C 2011, 115, 5422–5428. [Google Scholar] [CrossRef]
- Yoshida, A.; Kaburagi, Y.; Hishiyama, Y. Full width at half maximum intensity of the G band in the first order Raman spectrum of carbon material as a parameter for graphitization. Carbon 2006, 44, 2333–2335. [Google Scholar] [CrossRef]
- Ribeiro-Soares, J.; Oliveros, M.; Garin, C.; David, M.; Martins, L.; Almeida, C.; Martins-Ferreira, E.; Takai, K.; Enoki, T.; Magalhães-Paniago, R.; et al. Structural analysis of polycrystalline graphene systems by Raman spectroscopy. Carbon 2015, 95, 646–652. [Google Scholar] [CrossRef]
- Ferrari, A.C.; Robertson, J. Interpretation of Raman spectra of disordered and amorphous carbon. Phys. Rev. B 2000, 61, 14095–14107. [Google Scholar] [CrossRef]
- Celiešiūtė, R.; Trusovas, R.; Niaura, G.; Švedas, V.; Račiukaitis, G.; Ruželė, Z.; Pauliukaite, R. Influence of the laser irradiation on the electrochemical and spectroscopic peculiarities of graphene-chitosan composite film. Electrochim. Acta 2014, 132, 265–276. [Google Scholar] [CrossRef]
- Trusovas, R.; Ratautas, K.; Račiukaitis, G.; Niaura, G. Graphene layer formation in pinewood by nanosecond and picosecond laser irradiation. Appl. Surf. Sci. 2019, 471, 154–161. [Google Scholar] [CrossRef]
- Liu, W.-W.; Chai, S.-P.; Mohamed, A.R.; Hashim, U. Synthesis and characterization of graphene and carbon nanotubes: A review on the past and recent developments. J. Ind. Eng. Chem. 2014, 20, 1171–1185. [Google Scholar] [CrossRef]
- Malard, L.M.; Pimenta, M.A.; Dresselhaus, G.; Dresselhaus, M.S. Raman spectroscopy in graphene. Phys. Rep. 2009, 473, 51–87. [Google Scholar] [CrossRef]
- Hao, Y.; Wang, Y.; Wang, L.; Ni, Z.; Wang, Z.; Wang, R.; Koo, C.K.; Shen, Z.; Thong, J.T.L. Probing layer number and stacking order of few-layer graphene by Raman spectroscopy. Small 2010, 6, 195–200. [Google Scholar] [CrossRef] [PubMed]
- Qiu, T.; Yang, J.-G.; Bai, X.-J.; Wang, Y.-L. The preparation of synthetic graphite materials with hierarchical pores from lignite by one-step impregnation and their characterization as dye absorbents. RSC Adv. 2019, 9, 12737–12746. [Google Scholar] [CrossRef] [PubMed]
- Li, W.; Zhu, Y. Structural characteristics of coal vitrinite during pyrolysis. Energy Fuels 2014, 28, 3645–3654. [Google Scholar] [CrossRef]
- Arrebola, J.C.; Caballero, A.; Hernán, L.; Morales, J. Graphitized Carbons of Variable Morphology and Crystallinity: A Comparative Study of Their Performance in Lithium Cells. J. Electrochem. Soc. 2009, 156, A986–A992. [Google Scholar] [CrossRef]
- Yin, P.; Deng, Y.; Zhang, L.; Li, N.; Feng, X.; Wang, J.; Zhang, Y. Facile synthesis and microwave absorption investigation of activated carbon@Fe3O4 composites in the low frequency band. RSC Adv. 2018, 8, 23048–23057. [Google Scholar] [CrossRef]
- Hariani, P.L.; Faizal, M.; Ridwan; Marsi; Setiabudidaya, D. Removal of Procion Red MX-5B from songket’s industrial wastewater in South Sumatra Indonesia using activated carbon-Fe3O4 composite. Sustain. Environ. Res. 2018, 28, 158–164. [Google Scholar] [CrossRef]
- Kiciński, W.; Dyjak, S. Transition metal impurities in carbon-based materials: Pitfalls, artifacts and deleterious effects. Carbon 2020, 168, 748–845. [Google Scholar] [CrossRef]
- Hou, S.; Cai, X.; Wu, H.; Yu, X.; Peng, M.; Yan, K.; Zou, D. Nitrogen-doped graphene for dye-sensitized solar cells and the role of nitrogen states in triiodide reduction. Energy Environ. Sci. 2013, 6, 3356–3362. [Google Scholar] [CrossRef]
- Bard, A.J.; Faulkner, L.R. Electrochemical Methods: Fundamentals and Applications, 2nd ed.; Wiley: Hoboken, NJ, USA, 2000; Available online: https://www.wiley.com/en-us/Electrochemical+Methods%3A+Fundamentals+and+Applications%2C+2nd+Edition-p-9780471043720 (accessed on 27 March 2022).
- Ratso, S.; Kruusenberg, I.; Käärik, M.; Kook, M.; Puust, L.; Saar, R.; Leis, J.; Tammeveski, K. Highly efficient transition metal and nitrogen co-doped carbide-derived carbon electrocatalysts for anion exchange membrane fuel cells. J. Power Sources 2018, 375, 233–243. [Google Scholar] [CrossRef]
- Wang, L.; Sofer, Z.; Pumera, M. Will Any Crap We Put into Graphene Increase Its Electrocatalytic Effect? ACS Nano 2020, 14, 21–25. [Google Scholar] [CrossRef] [PubMed]
- Ismagilov, Z.R.; Shalagina, A.E.; Podyacheva, O.Y.; Ischenko, A.V.; Kibis, L.S.; Boronin, A.I.; Chesalov, Y.A.; Kochubey, D.I.; Romanenko, A.I.; Anikeeva, O.B.; et al. Structure and electrical conductivity of nitrogen-doped carbon nanofibers. Carbon 2009, 47, 1922–1929. [Google Scholar] [CrossRef]


| Sample | Yield, % | SBET, m2 g−1 | Vtotal, cm3 g−1 | Vmeso from Vt, % | N, % | C, % | H, % | O, % |
|---|---|---|---|---|---|---|---|---|
| APYR-W | 10 | 2553 | 1.4 | 41 | 0.9 | 92.0 | 0.6 | 6.4 |
| APYR-H | 14 | 2494 | 1.4 | 44 | 0.7 | 92.5 | 0.7 | 6.1 |
| APYR-T | 14 | 2804 | 1.5 | 40 | 0.8 | 93.0 | 0.7 | 5.5 |
| AHTC-W | 9 | 2629 | 1.9 | 58 | 1.7 | 91.7 | 0.6 | 6.0 |
| AHTC-H | 7 | 2919 | 2.2 | 59 | 1.2 | 92.0 | 0.6 | 6.1 |
| AHTC-T | 7 | 2401 | 1.9 | 58 | 0.6 | 93.4 | 1.3 | 4.5 |
| APYR-W-N | 9 | 2497 | 1.4 | 44 | 3.4 | 91.0 | 2.2 | 3.3 |
| APYR-H-N | 14 | 2306 | 1.4 | 49 | 3.5 | 89.8 | 2.5 | 4.2 |
| APYR-T-N | 14 | 2482 | 1.3 | 42 | 5.0 | 89.6 | 1.8 | 3.6 |
| AHTC-W-N | 8 | 2431 | 1.6 | 57 | 5.1 | 91.8 | 0.9 | 2.3 |
| AHTC-H-N | 7 | 2395 | 1.7 | 55 | 5.3 | 91.3 | 0.6 | 2.7 |
| AHTC-T-N | 7 | 2357 | 1.8 | 59 | 4.0 | 91.4 | 0.4 | 4.2 |
| Sample | I(D)/I(G) | FWHM(G) (cm−1) | A(D″) |
|---|---|---|---|
| APYR-W-N | 0.70 | 39.7 | 132 |
| APYR-H-N | 0.42 | 31.8 | 100 |
| APYR-T-N | 1.00 | 74.6 | 409 |
| AHTC-W-N | 1.05 | 69.7 | 357 |
| AHTC-H-N | 1.04 | 65.6 | 357 |
| AHTC-T-N | 1.02 | 71.3 | 391 |
| At 1600 rpm | At 2200 rpm | |||||||
|---|---|---|---|---|---|---|---|---|
| Sample | Eonset, V | E1/2, V | Tafel Plot, mV dec−1 | jL at 0.25 V | E1/2, V | Tafel Plot, mV dec−1 | jL at 0.25 V | Average n |
| APYR-W-N | 0.91 | 0.84 | −57.30 | −2.32 | 0.84 | −55.00 | −2.70 | 4.0 |
| APYR-H-N | 0.91 | 0.82 | −62.30 | −2.60 | 0.81 | −61.60 | −2.90 | 3.8 |
| APYR-T-N | 0.91 | 0.84 | −56.20 | −2.97 | 0.84 | −52.60 | −3.07 | 4.2 |
| AHTC-W-N | 0.92 | 0.84 | −54.90 | −2.89 | 0.83 | −55.50 | −3.33 | 3.6 |
| AHTC-H-N | 0.90 | 0.82 | −59.50 | −2.58 | 0.82 | −59.20 | −2.94 | 3.1 |
| AHTC-T-N | 0.92 | 0.81 | −50.70 | −3.14 | 0.81 | −49.40 | −3.82 | 3.0 |
| Pt/C | 0.95 | 0.89 | −49.40 | −3.39 | 0.89 | −49.60 | −3.89 | 4.0 |
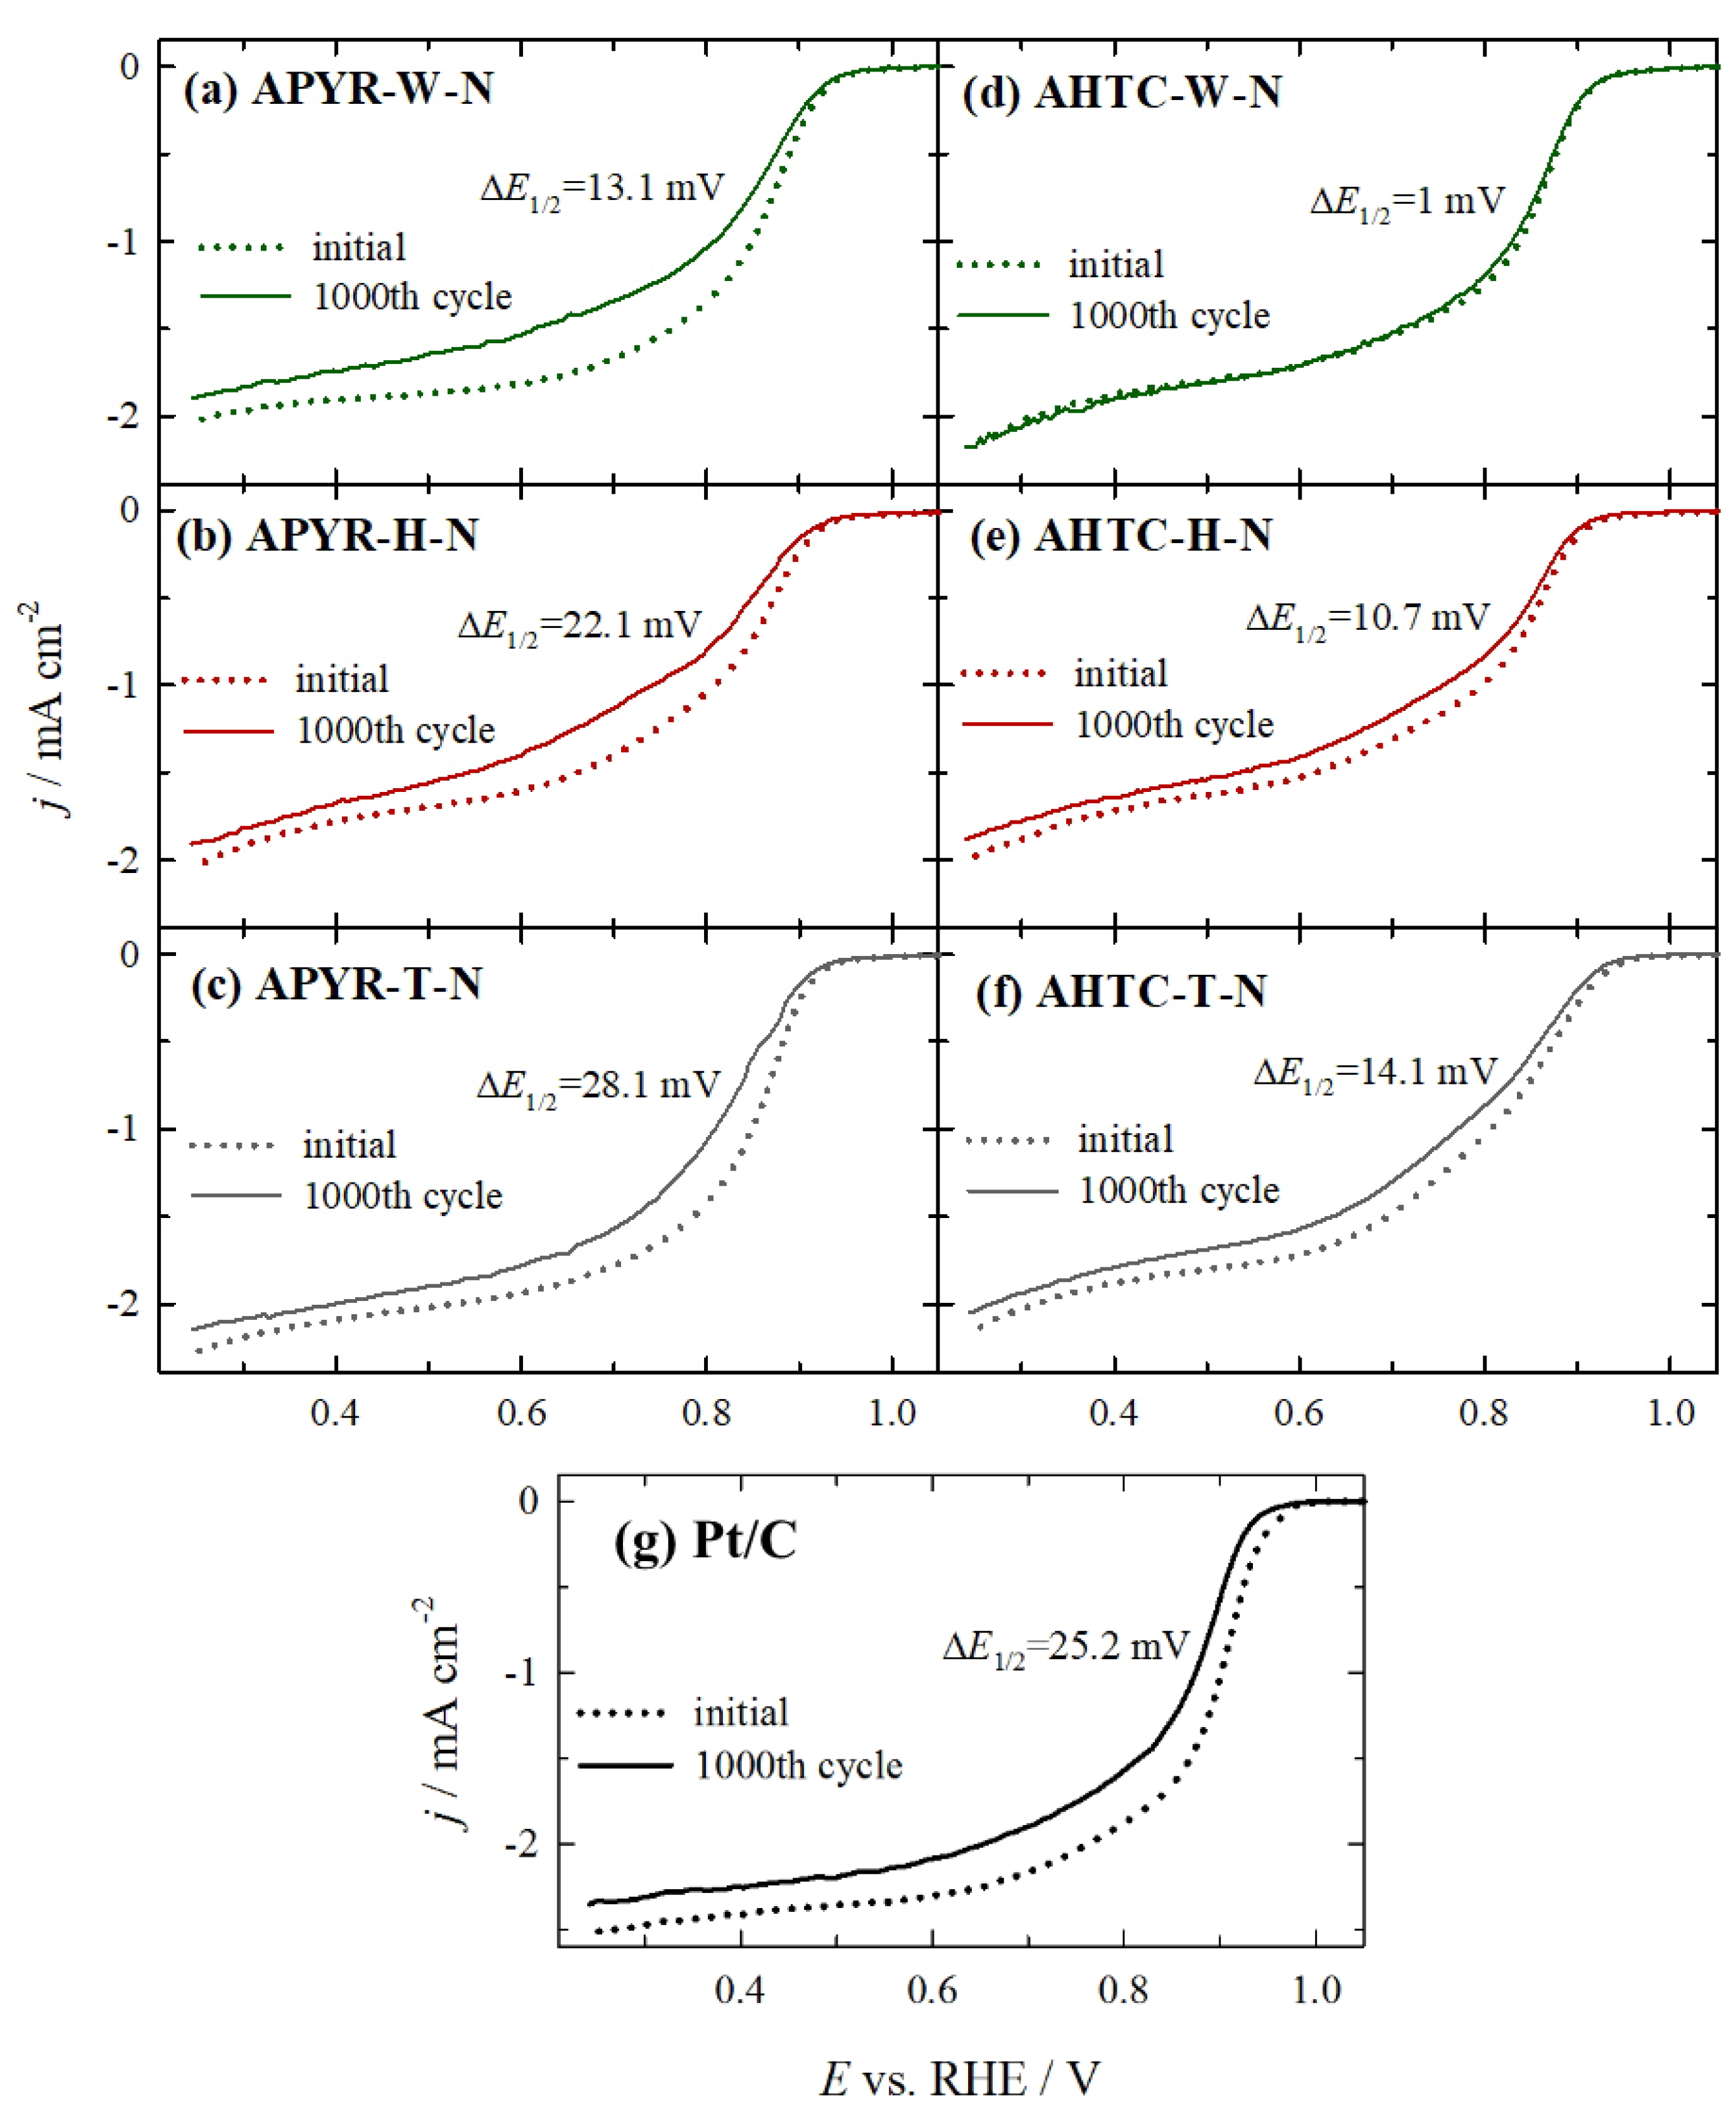
| Sample | E1/2, V, Initial | E1/2, V, after 1000th Cycles | ΔE, mV |
|---|---|---|---|
| APYR-W-N | 0.856 | 0.843 | 13.1 |
| APYR-H-N | 0.843 | 0.821 | 22.1 |
| APYR-T-N | 0.849 | 0.821 | 28.1 |
| AHTC-W-N | 0.851 | 0.850 | 1.0 |
| AHTC-H-N | 0.837 | 0.826 | 10.7 |
| AHTC-T-N | 0.835 | 0.821 | 14.1 |
| Pt/C | 0.897 | 0.872 | 25.2 |
| Sample | Conductivity, × 106 S/cm | Resistivity, × 107 Ohm·cm | N, at.% |
|---|---|---|---|
| APYR-W-N | 3.48 | 2.87 | 2.38 |
| APYR-H-N | 3.85 | 2.60 | 2.16 |
| APYR-T-N | 4.22 | 2.37 | 3.46 |
| AHTC-W-N | 4.18 | 2.39 | 4.60 |
| AHTC-H-N | 3.63 | 2.75 | 5.14 |
| AHTC-T-N | 3.60 | 2.77 | 4.33 |
Disclaimer/Publisher’s Note: The statements, opinions and data contained in all publications are solely those of the individual author(s) and contributor(s) and not of MDPI and/or the editor(s). MDPI and/or the editor(s) disclaim responsibility for any injury to people or property resulting from any ideas, methods, instructions or products referred to in the content. |
© 2023 by the authors. Licensee MDPI, Basel, Switzerland. This article is an open access article distributed under the terms and conditions of the Creative Commons Attribution (CC BY) license (https://creativecommons.org/licenses/by/4.0/).
Share and Cite
Dobele, G.; Plavniece, A.; Volperts, A.; Zhurinsh, A.; Upskuviene, D.; Balciunaite, A.; Jasulaitiene, V.; Niaura, G.; Talaikis, M.; Tamasauskaite-Tamasiunaite, L.; et al. Effect of Pretreatment on the Nitrogen Doped Activated Carbon Materials Activity towards Oxygen Reduction Reaction. Materials 2023, 16, 6005. https://doi.org/10.3390/ma16176005
Dobele G, Plavniece A, Volperts A, Zhurinsh A, Upskuviene D, Balciunaite A, Jasulaitiene V, Niaura G, Talaikis M, Tamasauskaite-Tamasiunaite L, et al. Effect of Pretreatment on the Nitrogen Doped Activated Carbon Materials Activity towards Oxygen Reduction Reaction. Materials. 2023; 16(17):6005. https://doi.org/10.3390/ma16176005
Chicago/Turabian StyleDobele, Galina, Ance Plavniece, Aleksandrs Volperts, Aivars Zhurinsh, Daina Upskuviene, Aldona Balciunaite, Vitalija Jasulaitiene, Gediminas Niaura, Martynas Talaikis, Loreta Tamasauskaite-Tamasiunaite, and et al. 2023. "Effect of Pretreatment on the Nitrogen Doped Activated Carbon Materials Activity towards Oxygen Reduction Reaction" Materials 16, no. 17: 6005. https://doi.org/10.3390/ma16176005
APA StyleDobele, G., Plavniece, A., Volperts, A., Zhurinsh, A., Upskuviene, D., Balciunaite, A., Jasulaitiene, V., Niaura, G., Talaikis, M., Tamasauskaite-Tamasiunaite, L., Norkus, E., Kvello, J., & Colmenares-Rausseo, L. C. (2023). Effect of Pretreatment on the Nitrogen Doped Activated Carbon Materials Activity towards Oxygen Reduction Reaction. Materials, 16(17), 6005. https://doi.org/10.3390/ma16176005