
On the Selectivity of Simultaneous CO2 and N2 Reduction Using TiO2/Carbon Sphere Photocatalysts Prepared by Microwave Treatment and Mounted on Silica Cloth

 ,
,  , , ,
, , ,  ,
,  and
and 
Abstract
:1. Introduction
- A two-electron reaction towards formic acid production, proposed by Wang [3]:
- A four-electron reaction of the formation of formaldehyde:
- Nitrogen reduction, which follows the general reaction below [8]:
2. Materials and Methods
2.1. Materials and Reagents
- Resorcinol, C6H4(OH)2 (Chempur, Piekary Śląskie, Poland);
- 96 wt.% ethyl alcohol, C2H5OH (P.P.H. STANLAB, Lublin, Poland);
- 25 wt.% ammonia water solution, NH4OH (P.P.H. STANLAB, Lublin, Poland);
- 37 wt.% formaldehyde, HCHO (Chempur, Piekary Śląskie, Poland).
2.2. Preparation of Carbon Spheres
2.3. Photocatalyst Bed Preparation
2.4. Photoactivity Measurements
2.5. Gas-Phase Analysis
2.6. Liquid-Phase Analysis
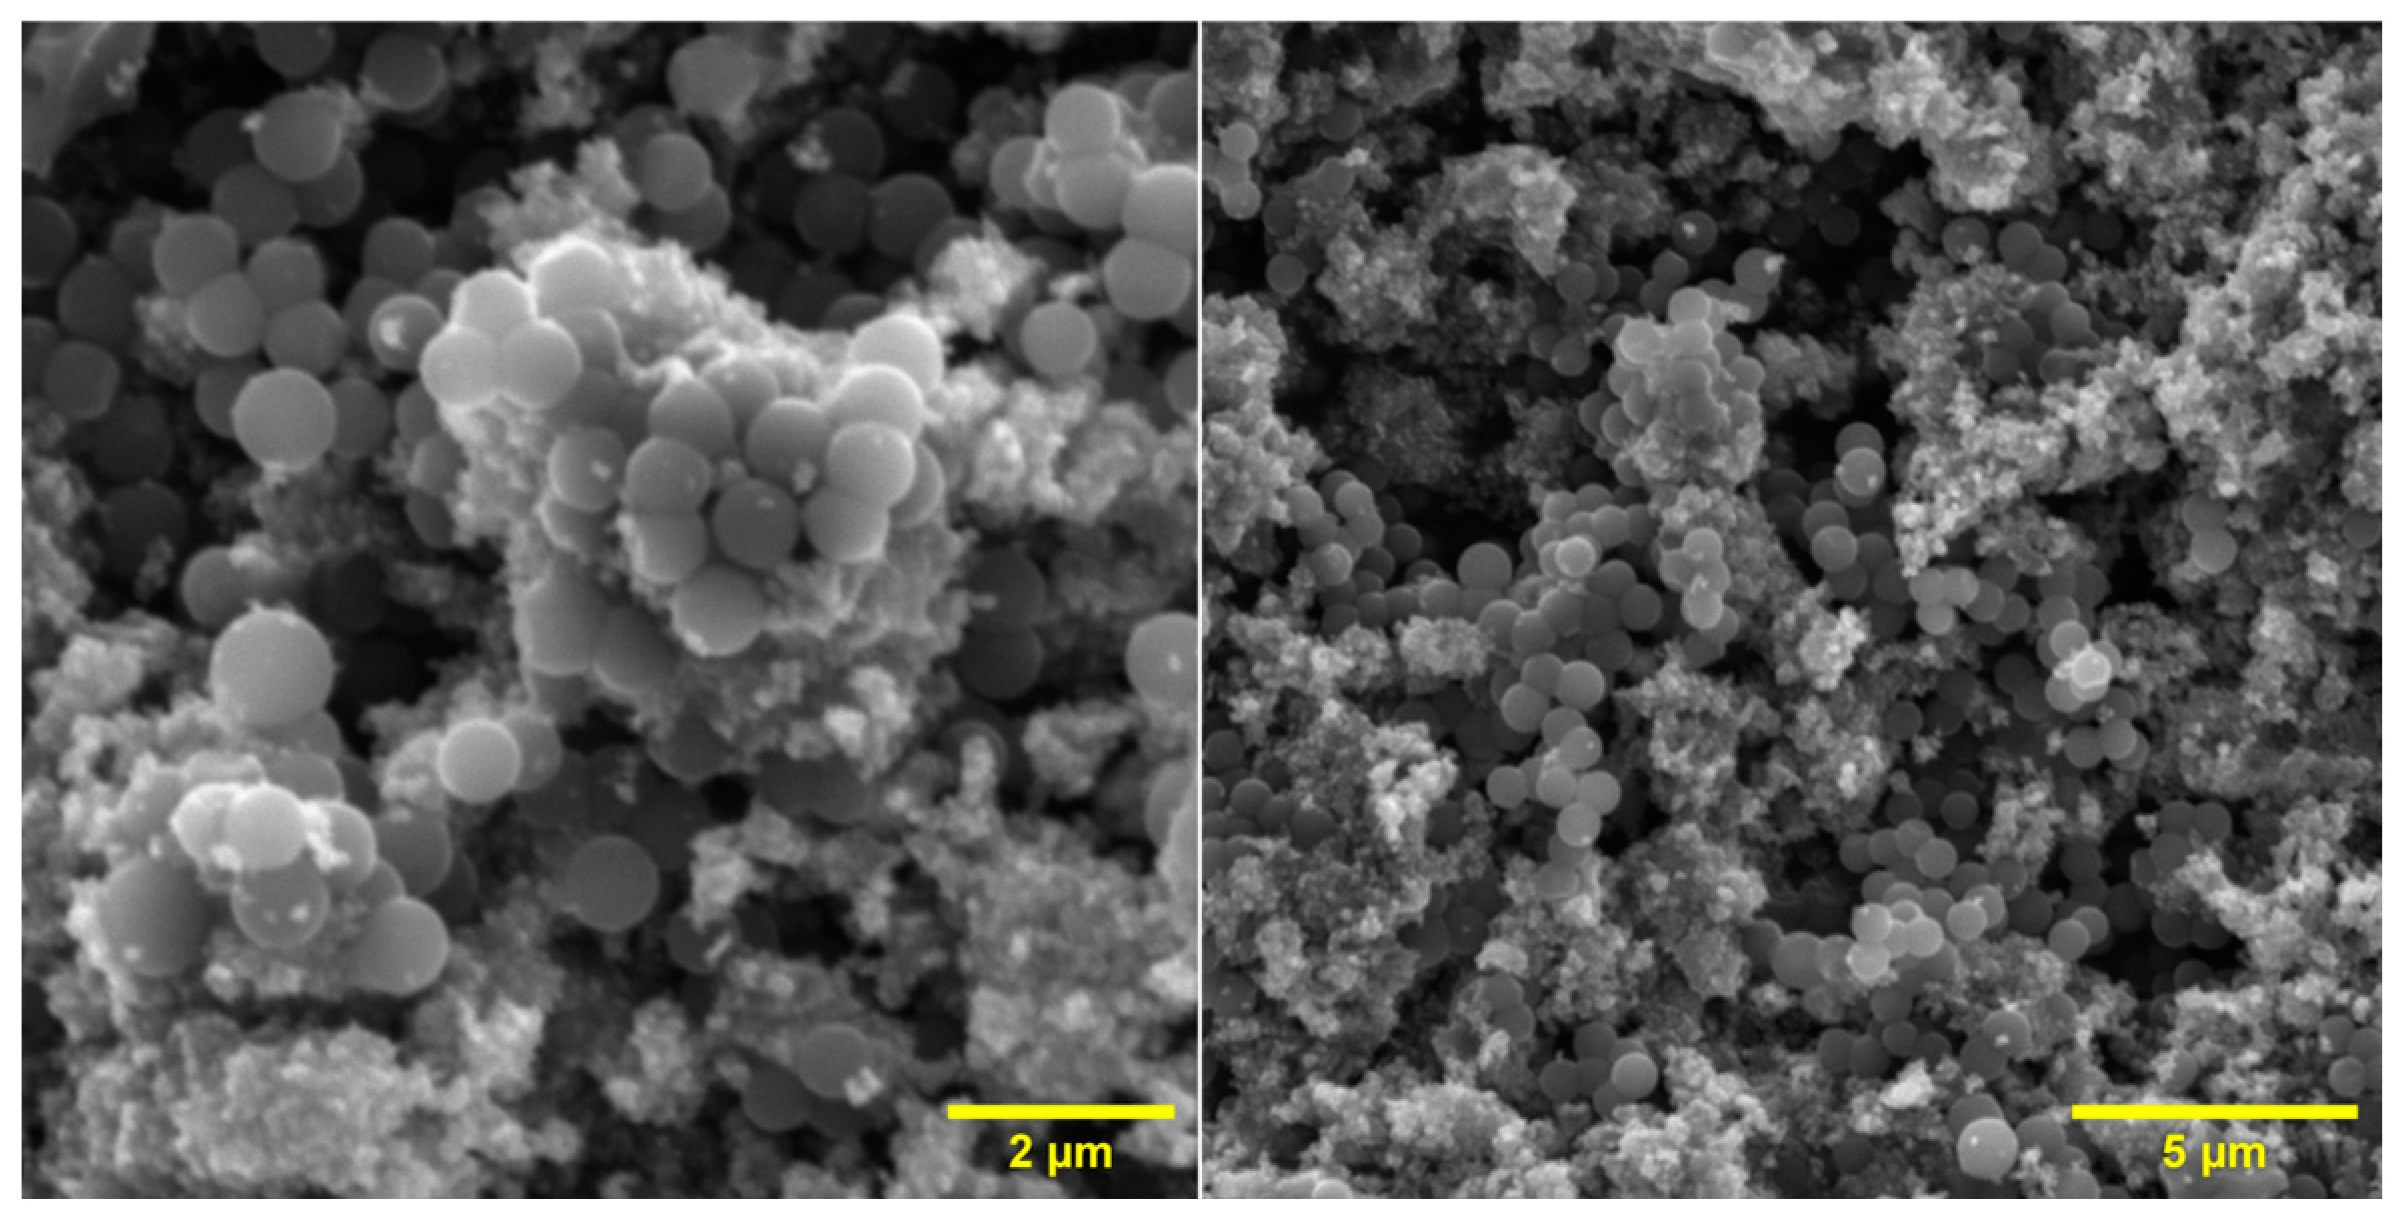
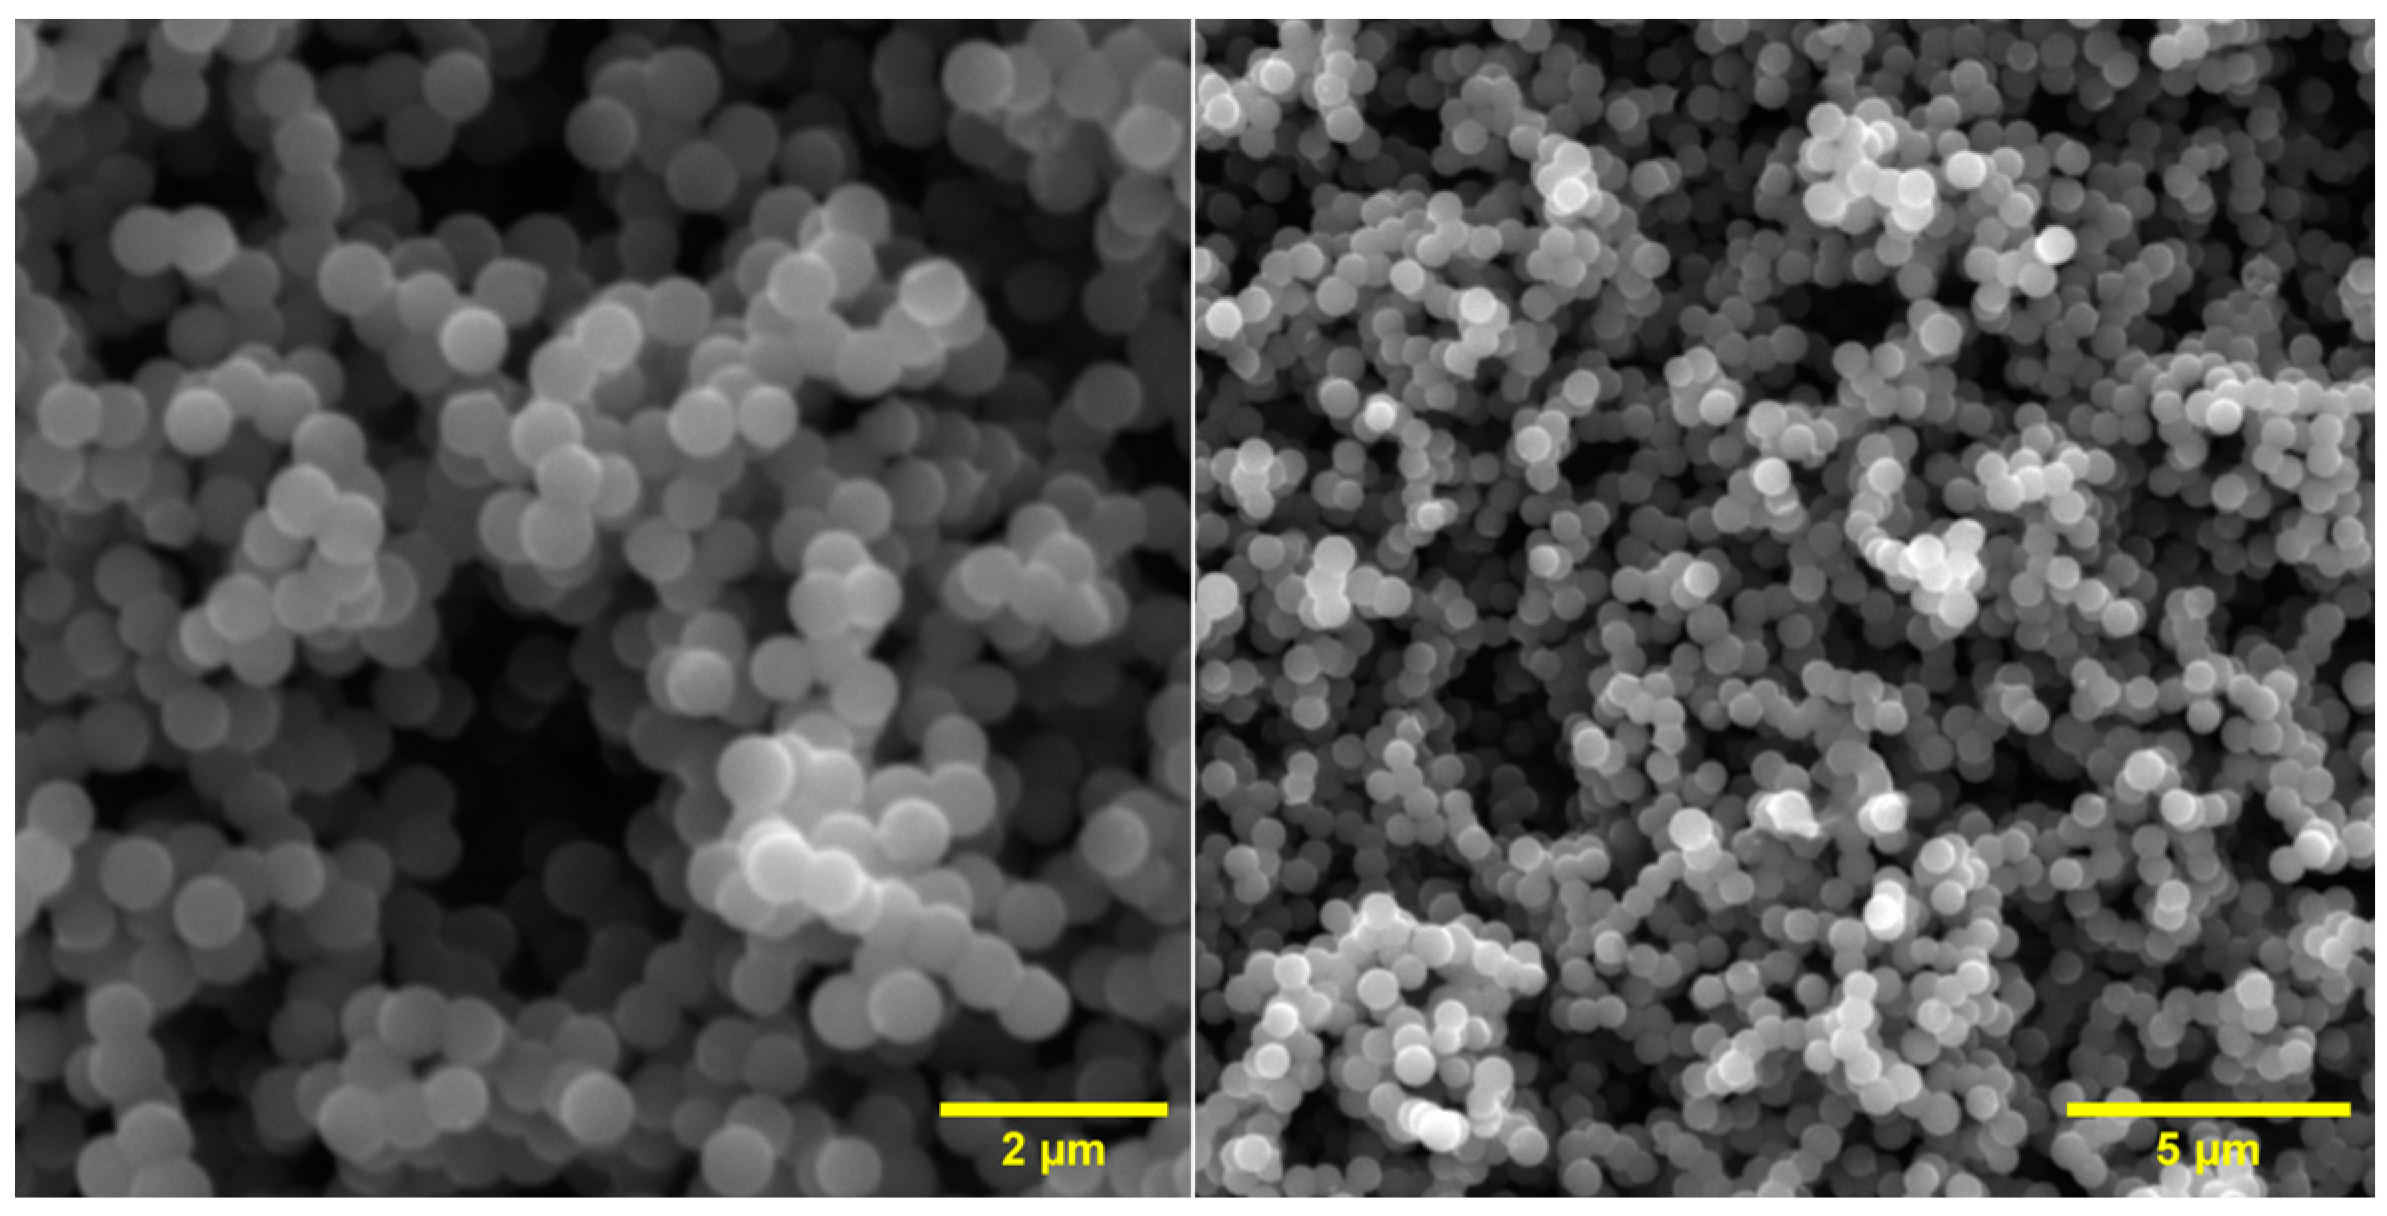
2.7. Investigation of Surface Morphology
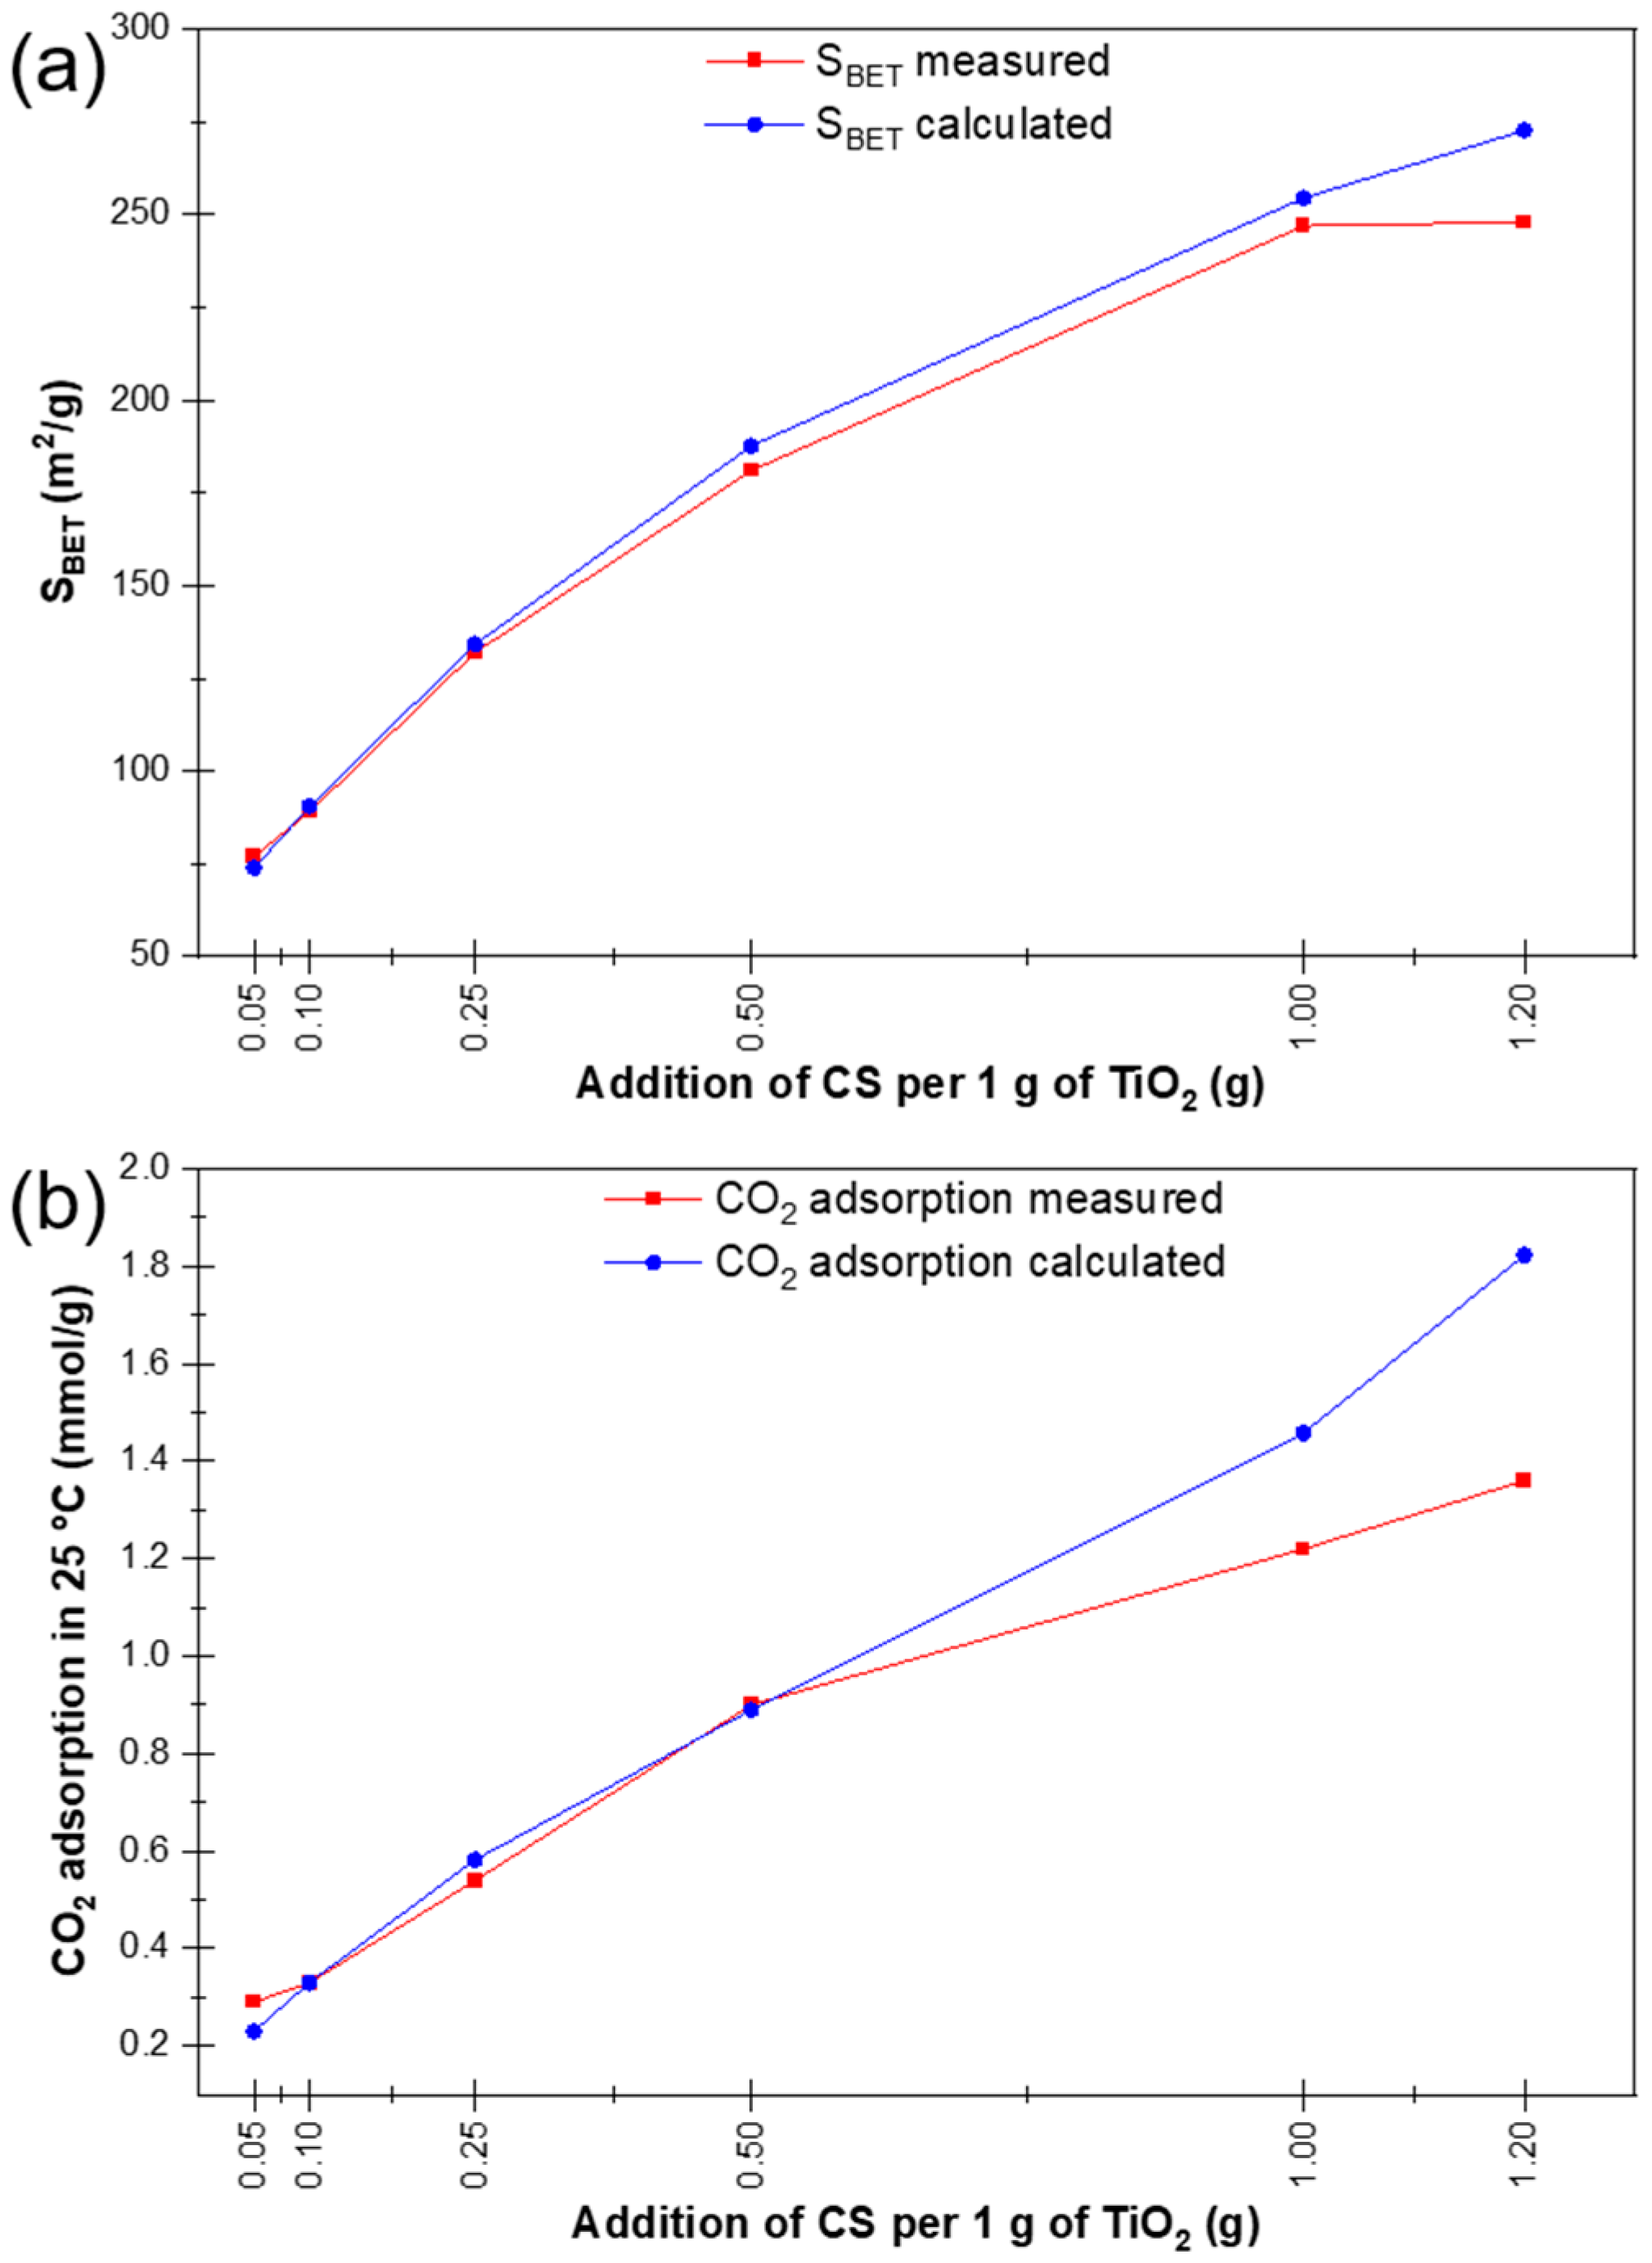
2.8. Textural Parameters and CO2 Adsorption Capacity Analysis
- —theoretical surface area calculated, including measured BET specific surface area (SBET) [m2/g] for TiO2 P25 () and CS RM () and composite components’ mass fractions;
- —the mass fraction of TiO2 P25 photocatalyst in the composite;
- —the mass fraction of CS RM in the composite;
- —the theoretical CO2 sorption capacity calculated on the basis of the measured CO2 sorption capacity [mmol CO2/g] for TiO2 P25 () and CS RM (), and the composite components’ mass fractions.
3. Results
3.1. Characterisation of Materials
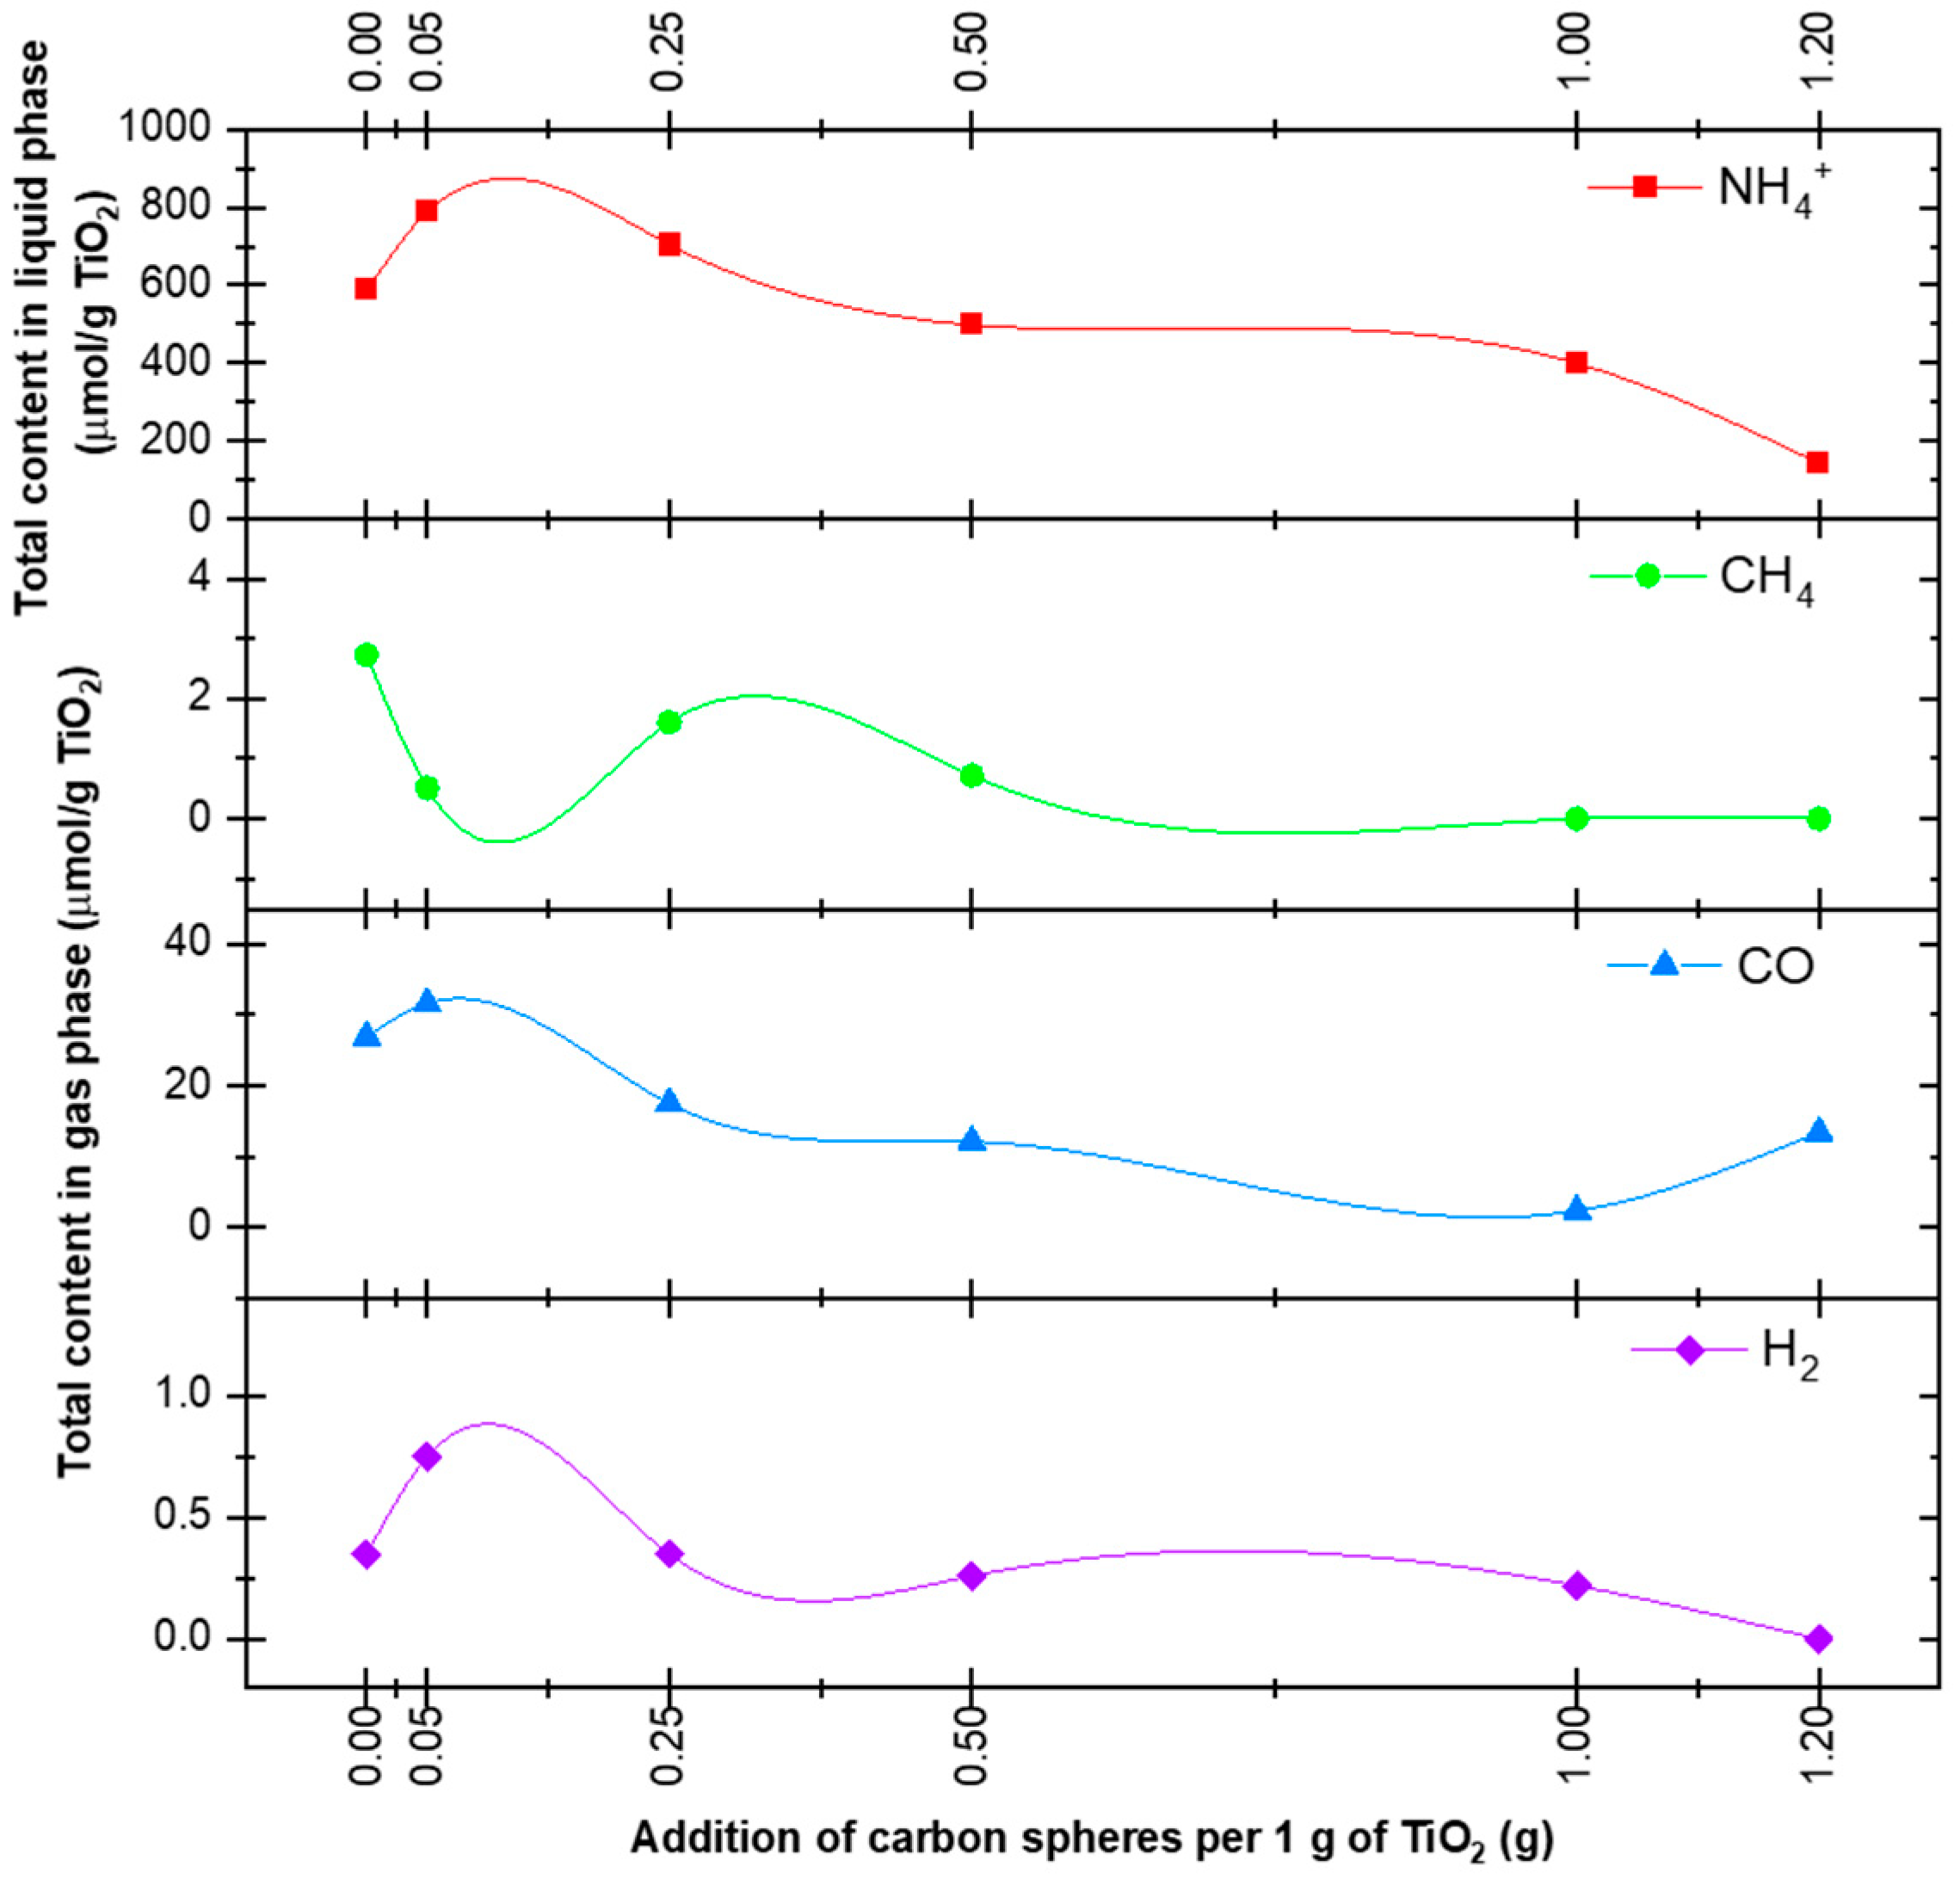
3.2. Photoactivity Measurements
4. Conclusions
Author Contributions
Funding
Institutional Review Board Statement
Informed Consent Statement
Data Availability Statement
Acknowledgments
Conflicts of Interest
References
- Li, R. Photocatalytic nitrogen fixation: An attractive approach for artificial photocatalysis. Chin. J. Catal. 2018, 39, 1180–1188. [Google Scholar] [CrossRef]
- Rodriguez-Gonzalez, V.; Terashima, C.; Fujishima, A. Application of photocatalytic titanium dioxide-based nanomaterials in sustainable agriculture. J. Photochem. Photobiol. C Photochem. Rev. 2019, 40, 49–67. [Google Scholar] [CrossRef]
- Wang, Z.; Hong, J.; Ng, S.-F.; Liu, W.; Huang, J.; Chen, P.; Ong, W.-J. Recent progress of perovskite oxide in emerging photocatalysis landscape: Water splitting, CO2 reduction, and N2 fixation. Acta Phys.-Chim. Sin. 2021, 37, 2011033. [Google Scholar]
- Chang, S.; Xu, X. Au nanocrystals decorated TiO2 nanotubes for photocatalytic nitrogen fixation into ammonia. Inorg. Chem. Front. 2020, 7, 620–624. [Google Scholar] [CrossRef]
- Wang, W.; Ji, Z.; Zhang, D.; Sun, P.; Duan, J. TiO2 doped HKUST-1/CM film in the three-phase photocatalytic ammonia synthesis system. Ceram. Int. 2021, 47, 19180–19190. [Google Scholar] [CrossRef]
- Wang, P.; Yin, G.; Bi, Q.; Huang, X.; Du, X.; Zhao, W.; Huang, F. Efficient photocatalytic reduction of CO2 using carbon-doped amorphous titanium oxide. ChemCatChem 2018, 10, 3854–3861. [Google Scholar] [CrossRef]
- Tasbihi, M.; Kočí, K.; Troppová, I.; Edelmannová, M.; Reli, M.; Čapek, L.; Schomäcker, R. Photocatalytic reduction of carbon dioxide over Cu/TiO2 photocatalysts. Environ. Sci. Poll. Res. 2018, 25, 34903–34911. [Google Scholar] [CrossRef] [PubMed]
- Ren, W.; Mei, Z.; Zheng, S.; Li, S.; Zhu, Y.; Zheng, J.; Lin, Y.; Chen, H.; Gu, M.; Pan, F. Wavelength-dependent solar N2 fixation into ammonia and nitrate in pure water. Research 2020, 2020, 3750314. [Google Scholar] [CrossRef]
- Liu, L.; Zhao, C.; Xu, J.; Li, Y. Integrated CO2 capture and photocatalytic conversion by a hybrid adsorbent/photocatalyst material. Appl. Catal. B Environ. 2015, 179, 489–499. [Google Scholar] [CrossRef]
- Liu, J.; Niu, Y.; He, X.; Qi, J.; Li, X. Photocatalytic reduction of CO2 using TiO2-graphene nanocomposites. J. Nanomater. 2016, 2016, 6012896. [Google Scholar] [CrossRef]
- Kamal, K.M.; Narayan, R.; Chandran, N.; Popović, S.; Nazrulla, M.A.; Kovač, J.; Vrtovec, N.; Bele, M.; Hodnik, N.; Kržmanc, M.M.; et al. Synergistic enhancement of photocatalytic CO2 reduction by plasmonic Au nanoparticles on TiO2 decorated N-graphene heterostructure catalyst for high selectivity methane production. Appl. Catal. B Environ. 2022, 307, 121181. [Google Scholar] [CrossRef]
- Devi, A.D.; Pushpavanam, S.; Singh, N.; Verma, J.; Kaur, M.P.; Roy, S.C. Enhhanced methane yield by photoreduction of CO2 at moderate temperature and pressure using Pt coated, graphene oxide wrapped TiO2 nanotubes. Results Eng. 2022, 14, 100441. [Google Scholar] [CrossRef]
- Do, J.Y.; Kwak, B.S.; Park, S.-M.; Kang, M. Effective carbon dioxide photoreduction over metals (Fe-, Co-, Ni- and Cu-) incorporation TiO2/basalt fiber films. Int. J. Photoenergy 2016, 2016, 5195138. [Google Scholar] [CrossRef]
- Wang, X.; Xuan, X.; Wang, Y.; Li, X.; Huang, H.; Zhang, X.; Du, X. Nano-Au-modified TiO2 grown on dendritic porous silica particles for enhanced CO2 photoreduction. Microporous Mesoporous Mater. 2021, 310, 110635. [Google Scholar] [CrossRef]
- Tasbihi, M.; Fresno, F.; Simon, U.; Villar-García, I.J.; Pérez-Dieste, V.; Escudero, C.; O’shea, V.A.d.l.P. On the selectivity of CO2 photoreduction towards CH4 using Pt/TiO2 catalysts supported on mesoporous silica. Appl. Catal. B Environ. 2018, 239, 68–76. [Google Scholar] [CrossRef]
- Zhang, H.; Lv, X.; Li, Y.; Wang, Y.; Li, J. P25-graphene composite as a high performance photocatalyst. ACS Nano 2010, 4, 380–386. [Google Scholar] [CrossRef] [PubMed]
- Morawski, A.W.; Ćmielewska, K.; Ekiert, E.; Kusiak-Nejman, E.; Pełech, I.P.; Staciwa; Sibera, D.; Wanag, A.; Kapica-Kozar, J.; Gano, M. Effective green ammonia synthesis from gaseous nitrogen and CO2 saturated-water vapor utilising a novel photocatalytic reactor. Chem. Eng. J. 2022, 446, 137030. [Google Scholar] [CrossRef]
- Huang, R.; Li, X.; Gao, W.; Zhang, X.; Liang, S.; Luo, M. Recent advances in photocatalytic nitrogen fixation: From active sites to ammonia quantification methods. RSC Adv. 2021, 11, 14844–14861. [Google Scholar] [CrossRef]
- Pełech, I.; Kusiak-Nejman, E.; Staciwa, P.; Sibera, D.; Kapica-Kozar, J.; Wanag, A.; Latzke, F.; Pawłowska, K.; Michalska, A.; Narkiewicz, U.; et al. CO2 sorbents based on spherical carbon and photoactive metal oxides: Insight into adsorption capacity, selectivity and regenerability. Molecules 2022, 27, 6802. [Google Scholar] [CrossRef]
- Andrade, R.; Rodríguez, V.; Camarillo, R.; Martínez, F.; Jiménez, C.; Rincón, J. Photocatalytic reduction of CO2 with N-doped TiO2-based photocatalysts obtained in one-pot supercritical synthesis. Nanomaterials 2022, 12, 1793. [Google Scholar] [CrossRef]
- Zhai, Q.; Xie, S.; Fan, W.; Zhang, Q.; Wang, Y.; Deng, W.; Wang, Y. Photocatalytic conversion of carbon dioxide with water into mehane: Platinum and copper(I) oxide co-catalysts with a core-shell structure. Angew. Chem. Int. Ed. 2013, 52, 5651–5884. [Google Scholar] [CrossRef]
- Xu, Z.; Cui, Y.; Young, D.J.; Wang, J.; Li, H.-Y.; Bian, G.-Q.; Li, H.-X. Combination of Co2+-immobilized covalent triazine framework and TiO2 by covalent bonds to enhance photoreduction of CO2 to CO with H2O. J. CO2 Util. 2021, 49, 101561. [Google Scholar] [CrossRef]
- Bian, X.; Zhao, Y.; Zhang, S.; Li, D.; Shi, R.; Zhou, C.; Wu, L.-Z.; Zhang, T. Enhancing the supply of activated hydrogen to promote photocatalytic nitrogen fixation. ACS Mater. Lett. 2021, 3, 1521–1527. [Google Scholar] [CrossRef]
- Li, C.; Gu, M.; Gao, M.; Liu, K.; Zhao, X.; Cao, N.; Feng, J.; Ren, Y.; Wei, T.; Zhang, M. N-doping TiO2 hollow microspheres with abundant oxygen vacancies for highly photocatalytic nitrogen fixation. J. Colloid Interface Sci. 2022, 609, 341–352. [Google Scholar] [CrossRef]
- Li, X.; Li, J.; Zhai, H.; Song, M.; Wang, L.; Guan, R.; Zhang, Q.; Zhao, Z. Efficient catalytic fixation nitrogen activity under visible light by molybdenum doped mesoporous TiO2. Catal. Lett. 2022, 152, 116–123. [Google Scholar] [CrossRef]
- Liao, Y.; Lin, J.; Cui, B.; Xie, G.; Hu, S. Well-dispersed ultrasmall ruthenium on TiO2(P25) for effective photocatalytic N2 fixation in ambient condition. J. Photochem. Photobiol. A Chem. 2020, 387, 112100. [Google Scholar] [CrossRef]


| Sample Name | Amount of TiO2 (g) | Amount of Carbon Spheres (g) |
|---|---|---|
| P25 | 1.00 | 0.00 |
| P25 + 0.05 CS RM | 1.00 | 0.05 |
| P25 + 0.1 CS RM | 1.00 | 0.10 |
| P25 + 0.25 CS RM | 1.00 | 0.25 |
| P25 + 0.5 CS RM | 1.00 | 0.50 |
| P25 + 1 CS RM | 1.00 | 1.00 |
| P25 + 1.2 CS RM | 1.00 | 1.20 |
| Sample Name | Specific Surface Area | Calculated Surface Area * | Total Pore Volume | CO2 Sorption Capacity at 25 °C | Calculated CO2 Sorption Capacity at 25 °C * |
|---|---|---|---|---|---|
| (m2/g) | (m2/g) | (cm3/g) | (mmol/g) | (mmol/g) | |
| P25 | 54 | - | 0.40 | 0.12 | - |
| CS | 455 | - | 0.26 | 2.43 | - |
| P25 + 0.05 CS RM | 77 | 73 | 0.33 | 0.29 | 0.23 |
| P25 + 0.1 CS RM | 89 | 91 | 0.34 | 0.33 | 0.33 |
| P25 + 0.25 CS RM | 132 | 134 | 0.43 | 0.54 | 0.58 |
| P25 + 0.5 CS RM | 181 | 188 | 0.37 | 0.90 | 0.89 |
| P25 + 1 CS RM | 247 | 255 | 0.33 | 1.22 | 1.46 |
| P25 + 1.2 CS RM | 248 | 273 | 0.36 | 1.36 | 1.82 |
| Sample Name | Total Content in the Gas Phase after Processing for 6 h (μmol/g TiO2) | Total Content of NH4+ in the Liquid Phase after Processing for 6 h (μmol NH4+/g TiO2) | ||
|---|---|---|---|---|
| H2 | CO | CH4 | ||
| P25 | 0.35 | 26.95 | 2.73 | 586.56 |
| P25 + 0.05 CS RM | 0.75 | 31.64 | 0.51 | 790.17 |
| P25 + 0.25 CS RM | 0.35 | 17.48 | 1.61 | 703.69 |
| P25 + 0.5 CS RM | 0.26 | 12.17 | 0.72 | 498.77 |
| P25 + 1 CS RM | 0.22 | 2.37 | 0.00 | 399.41 |
| P25 + 1.2 CS RM | 0.00 | 13.41 | 0.00 | 143.59 |
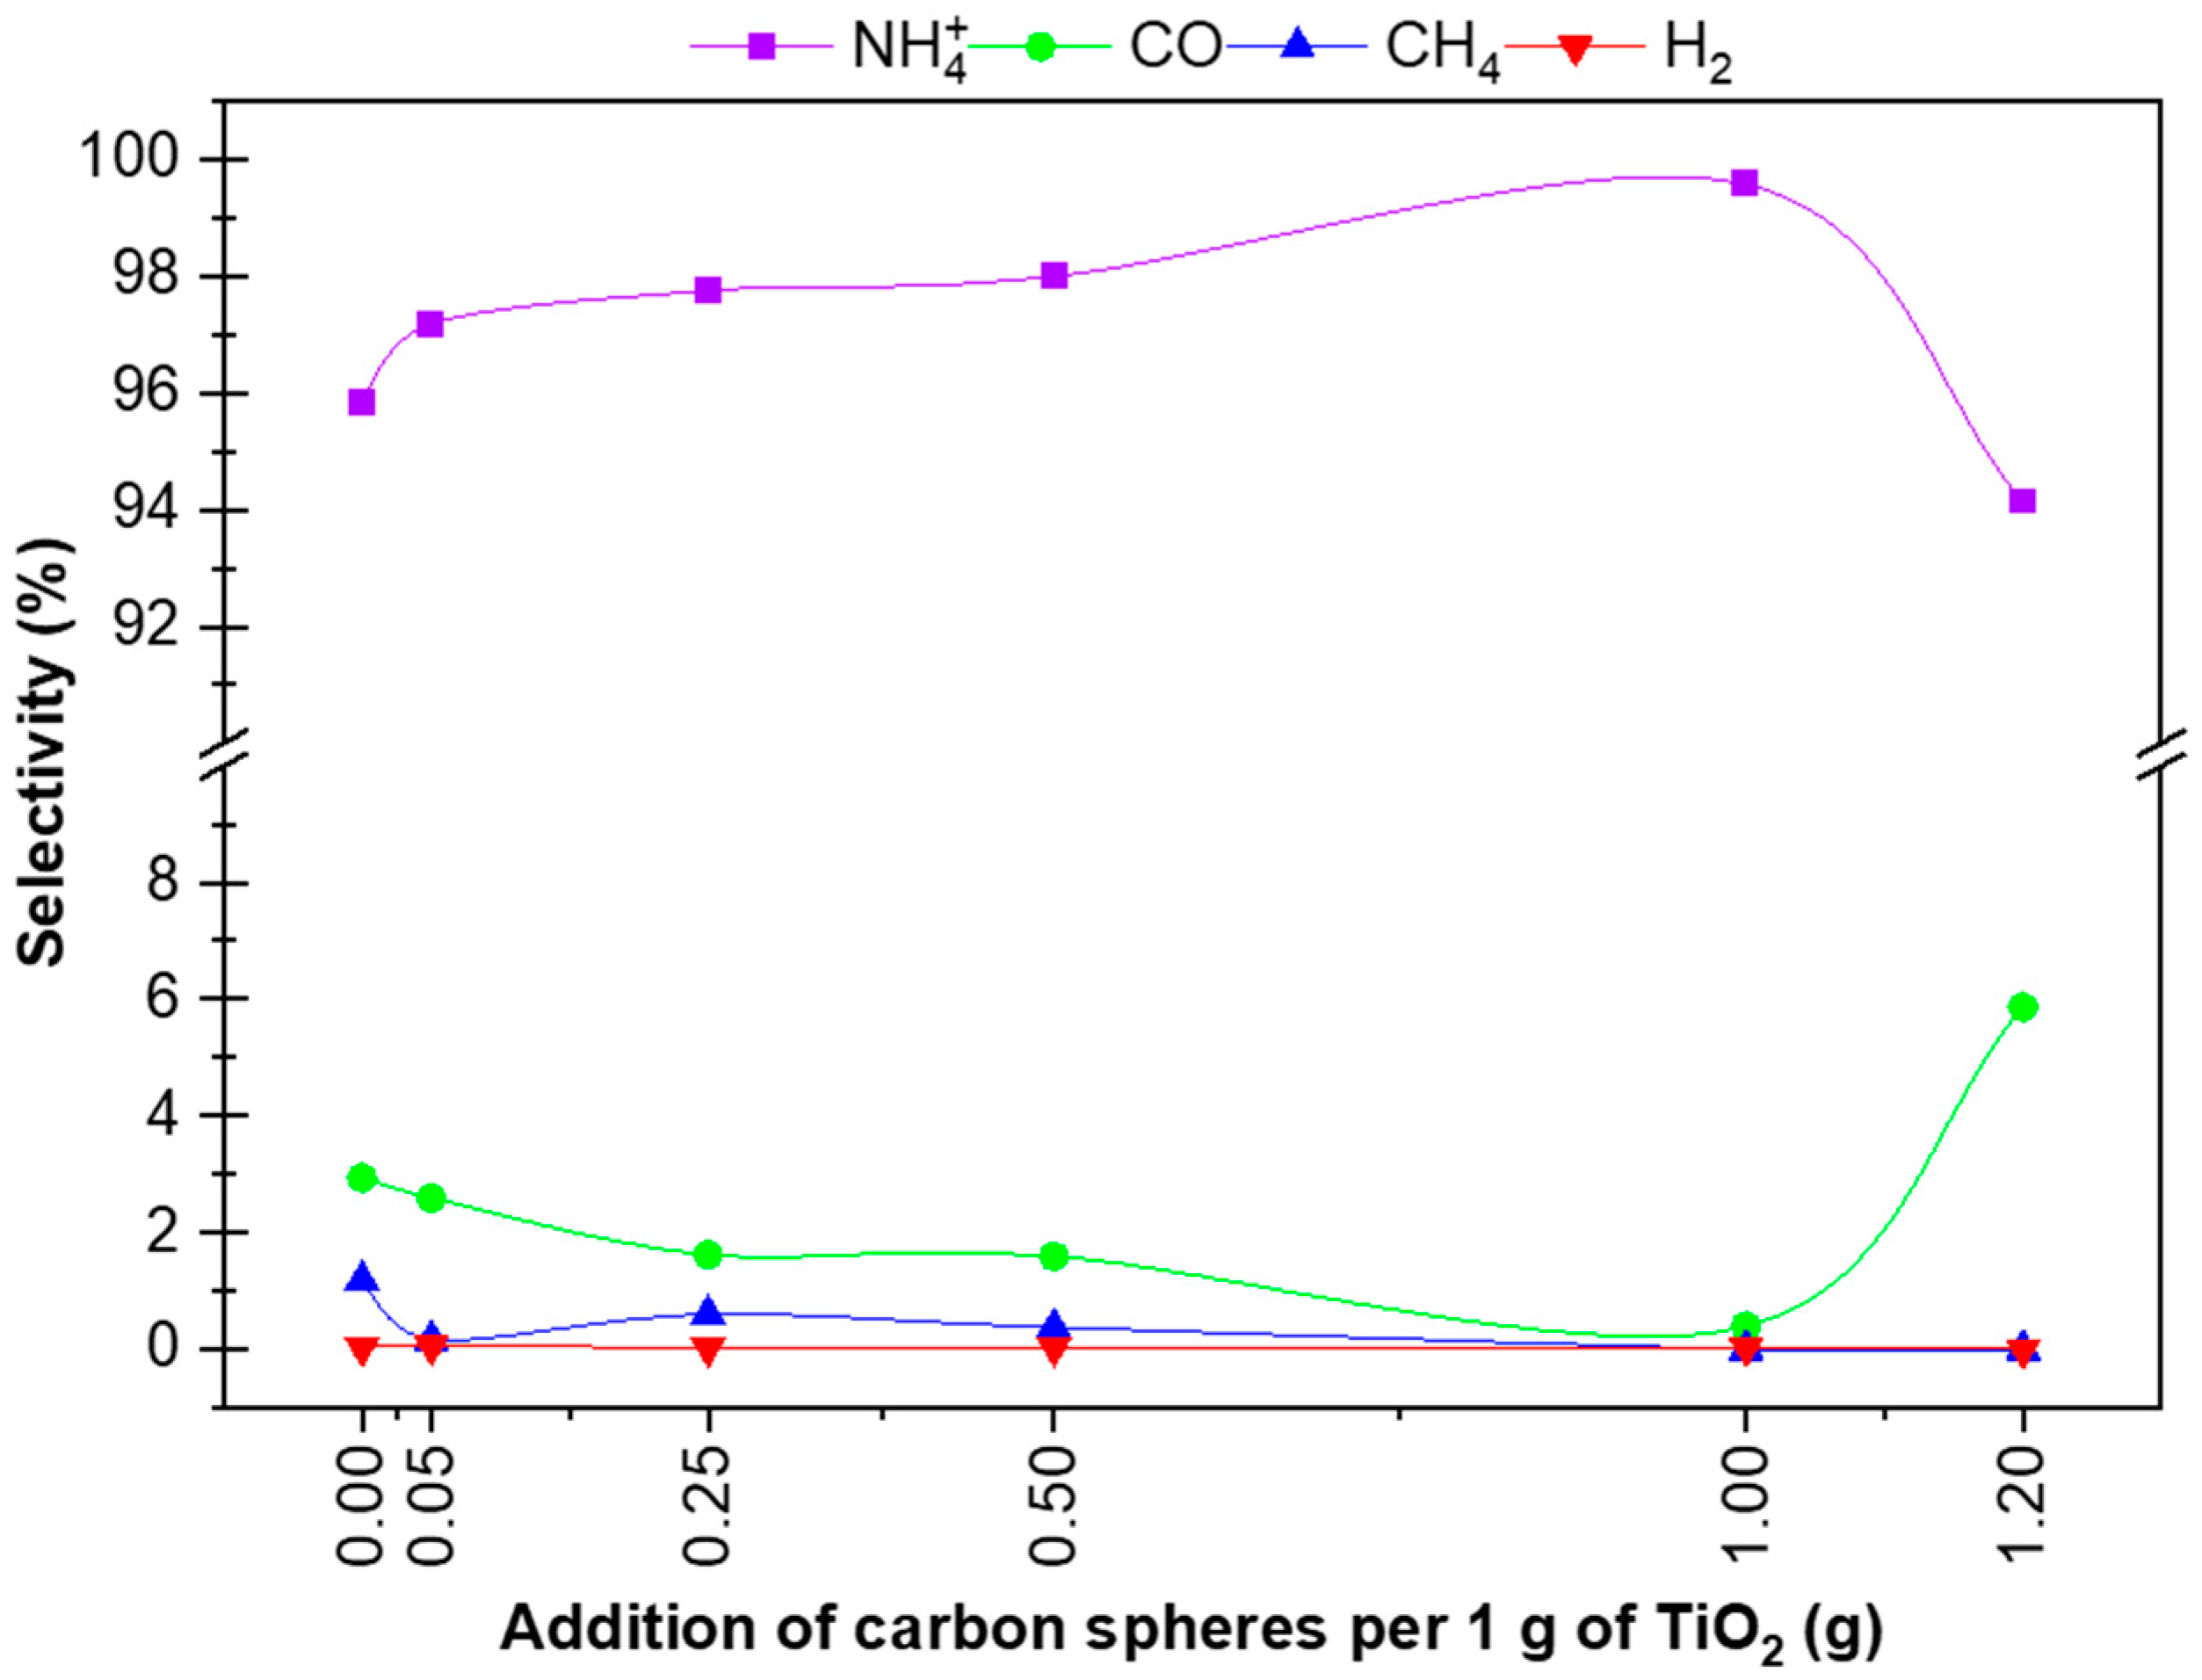
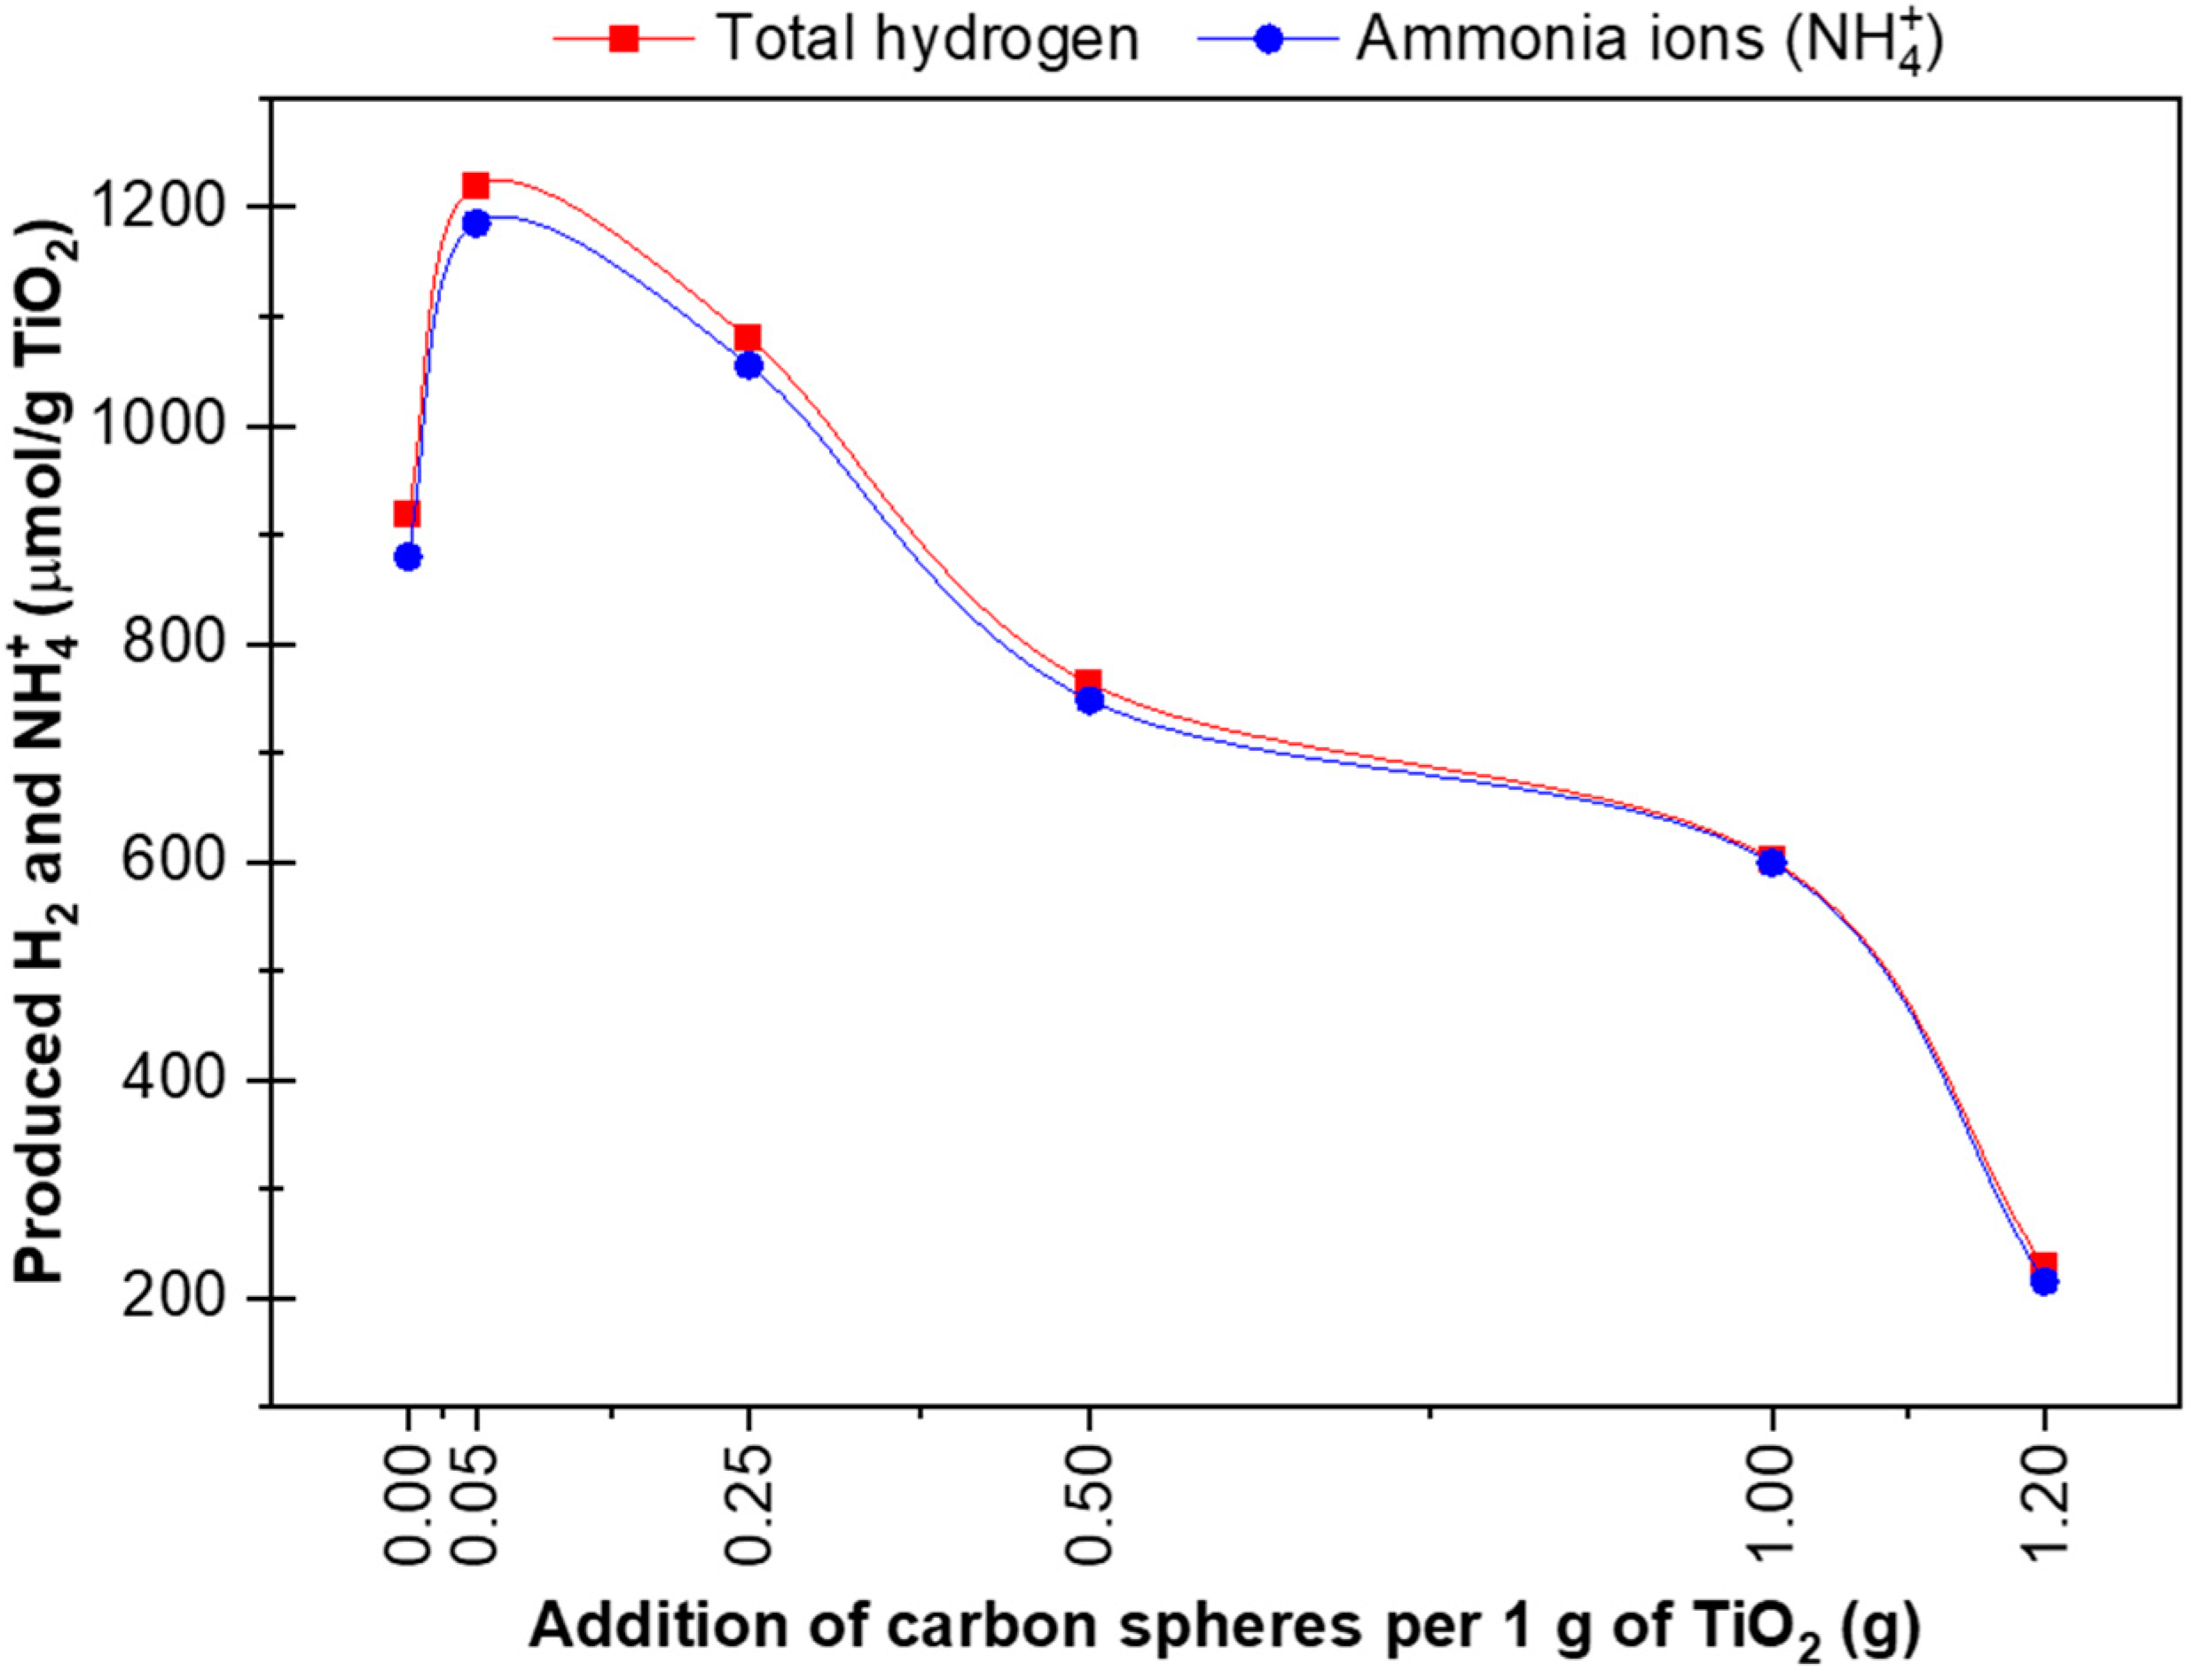
| Sample Name | H2 * | CO ** | CH4 *** | NH4+ **** | ΣH2 (μmol) | ||||
|---|---|---|---|---|---|---|---|---|---|
| Selectivity (%) | Selectivity (%) | Selectivity (%) | Selectivity (%) | ||||||
| (μmol) | (μmol) | (μmol) | (μmol) | ||||||
| P25 | 0.35 | 0.04 | 26.95 | 2.94 | 10.92 | 1.19 | 879.84 | 95.84 | 918.06 |
| P25 + 0.05 CS RM | 0.75 | 0.06 | 31.64 | 2.59 | 2.04 | 0.17 | 1185.26 | 97.18 | 1219.69 |
| P25 + 0.25 CS RM | 0.35 | 0.03 | 17.48 | 1.62 | 6.44 | 0.60 | 1055.54 | 97.75 | 1079.81 |
| P25 + 0.5 CS RM | 0.26 | 0.03 | 12.17 | 1.59 | 2.88 | 0.38 | 748.16 | 97.99 | 763.47 |
| P25 + 1 CS RM | 0.22 | 0.04 | 2.37 | 0.39 | 0.00 | 0.00 | 599.12 | 99.57 | 601.71 |
| P25 + 1.2 CS RM | 0.00 | 0.00 | 13.41 | 5.86 | 0.00 | 0.00 | 215.39 | 94.14 | 228.80 |
Disclaimer/Publisher’s Note: The statements, opinions and data contained in all publications are solely those of the individual author(s) and contributor(s) and not of MDPI and/or the editor(s). MDPI and/or the editor(s) disclaim responsibility for any injury to people or property resulting from any ideas, methods, instructions or products referred to in the content. |
© 2023 by the authors. Licensee MDPI, Basel, Switzerland. This article is an open access article distributed under the terms and conditions of the Creative Commons Attribution (CC BY) license (https://creativecommons.org/licenses/by/4.0/).
Share and Cite
Kusiak-Nejman, E.; Ćmielewska, K.; Pełech, I.; Ekiert, E.; Staciwa, P.; Sibera, D.; Wanag, A.; Kapica-Kozar, J.; Gano, M.; Narkiewicz, U.; et al. On the Selectivity of Simultaneous CO2 and N2 Reduction Using TiO2/Carbon Sphere Photocatalysts Prepared by Microwave Treatment and Mounted on Silica Cloth. Materials 2023, 16, 5810. https://doi.org/10.3390/ma16175810
Kusiak-Nejman E, Ćmielewska K, Pełech I, Ekiert E, Staciwa P, Sibera D, Wanag A, Kapica-Kozar J, Gano M, Narkiewicz U, et al. On the Selectivity of Simultaneous CO2 and N2 Reduction Using TiO2/Carbon Sphere Photocatalysts Prepared by Microwave Treatment and Mounted on Silica Cloth. Materials. 2023; 16(17):5810. https://doi.org/10.3390/ma16175810
Chicago/Turabian StyleKusiak-Nejman, Ewelina, Katarzyna Ćmielewska, Iwona Pełech, Ewa Ekiert, Piotr Staciwa, Daniel Sibera, Agnieszka Wanag, Joanna Kapica-Kozar, Marcin Gano, Urszula Narkiewicz, and et al. 2023. "On the Selectivity of Simultaneous CO2 and N2 Reduction Using TiO2/Carbon Sphere Photocatalysts Prepared by Microwave Treatment and Mounted on Silica Cloth" Materials 16, no. 17: 5810. https://doi.org/10.3390/ma16175810
APA StyleKusiak-Nejman, E., Ćmielewska, K., Pełech, I., Ekiert, E., Staciwa, P., Sibera, D., Wanag, A., Kapica-Kozar, J., Gano, M., Narkiewicz, U., & Morawski, A. W. (2023). On the Selectivity of Simultaneous CO2 and N2 Reduction Using TiO2/Carbon Sphere Photocatalysts Prepared by Microwave Treatment and Mounted on Silica Cloth. Materials, 16(17), 5810. https://doi.org/10.3390/ma16175810