
Influence of the In-Fill Pattern of the 3D Printed Building Wall on Its Thermal Insulation

 , , , and
Abstract
:1. Introduction
2. Materials and Methods
3. Results and Discussion
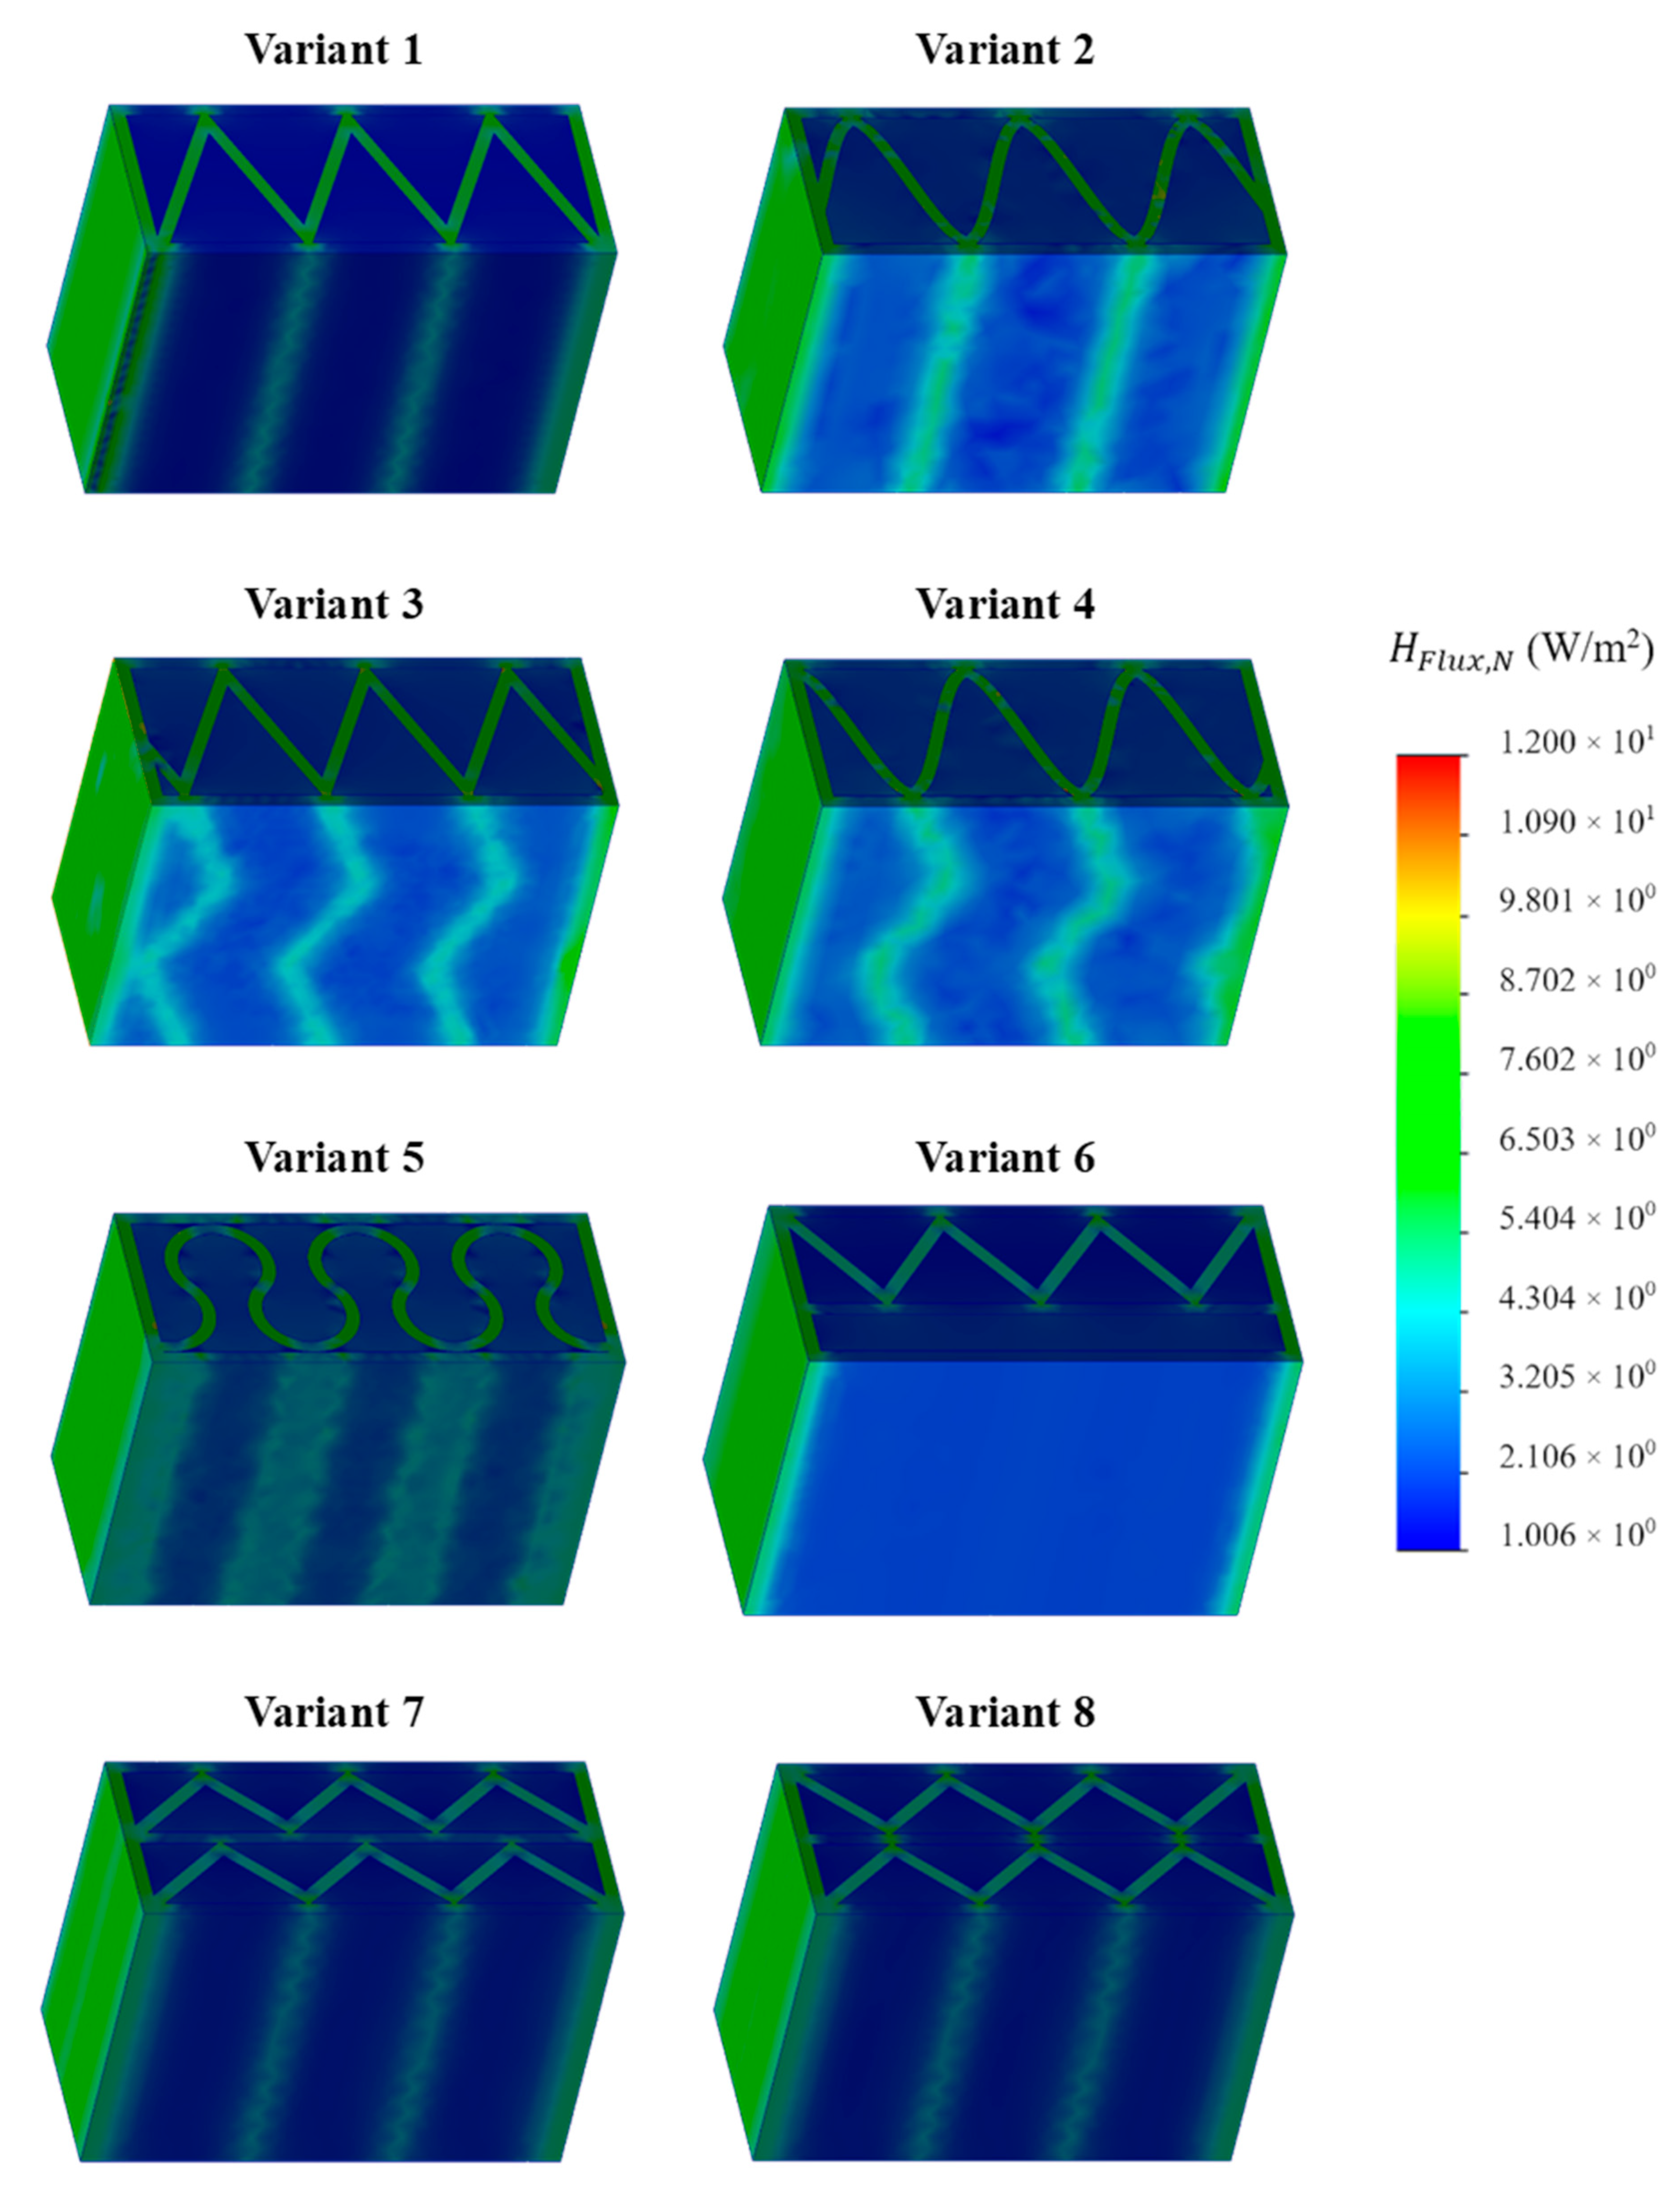
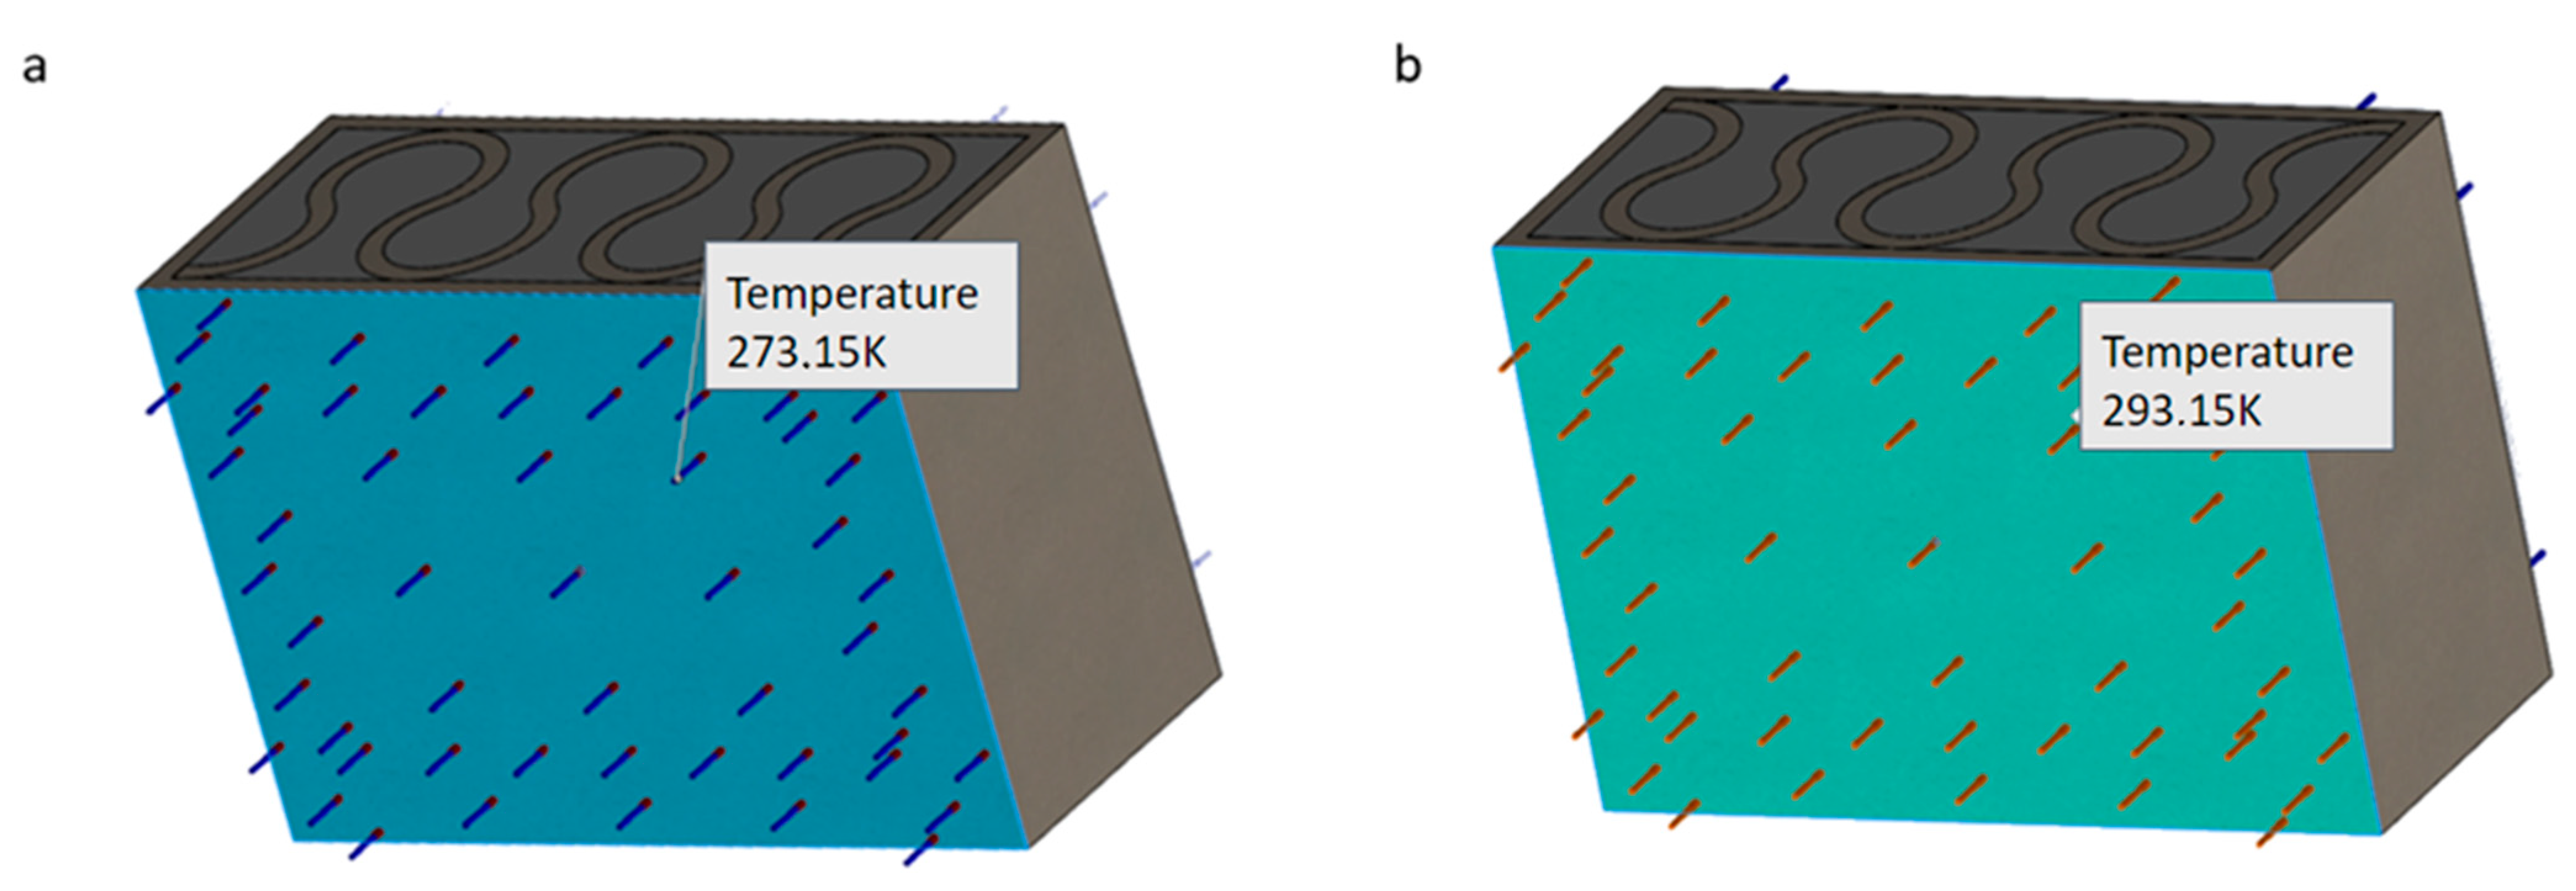
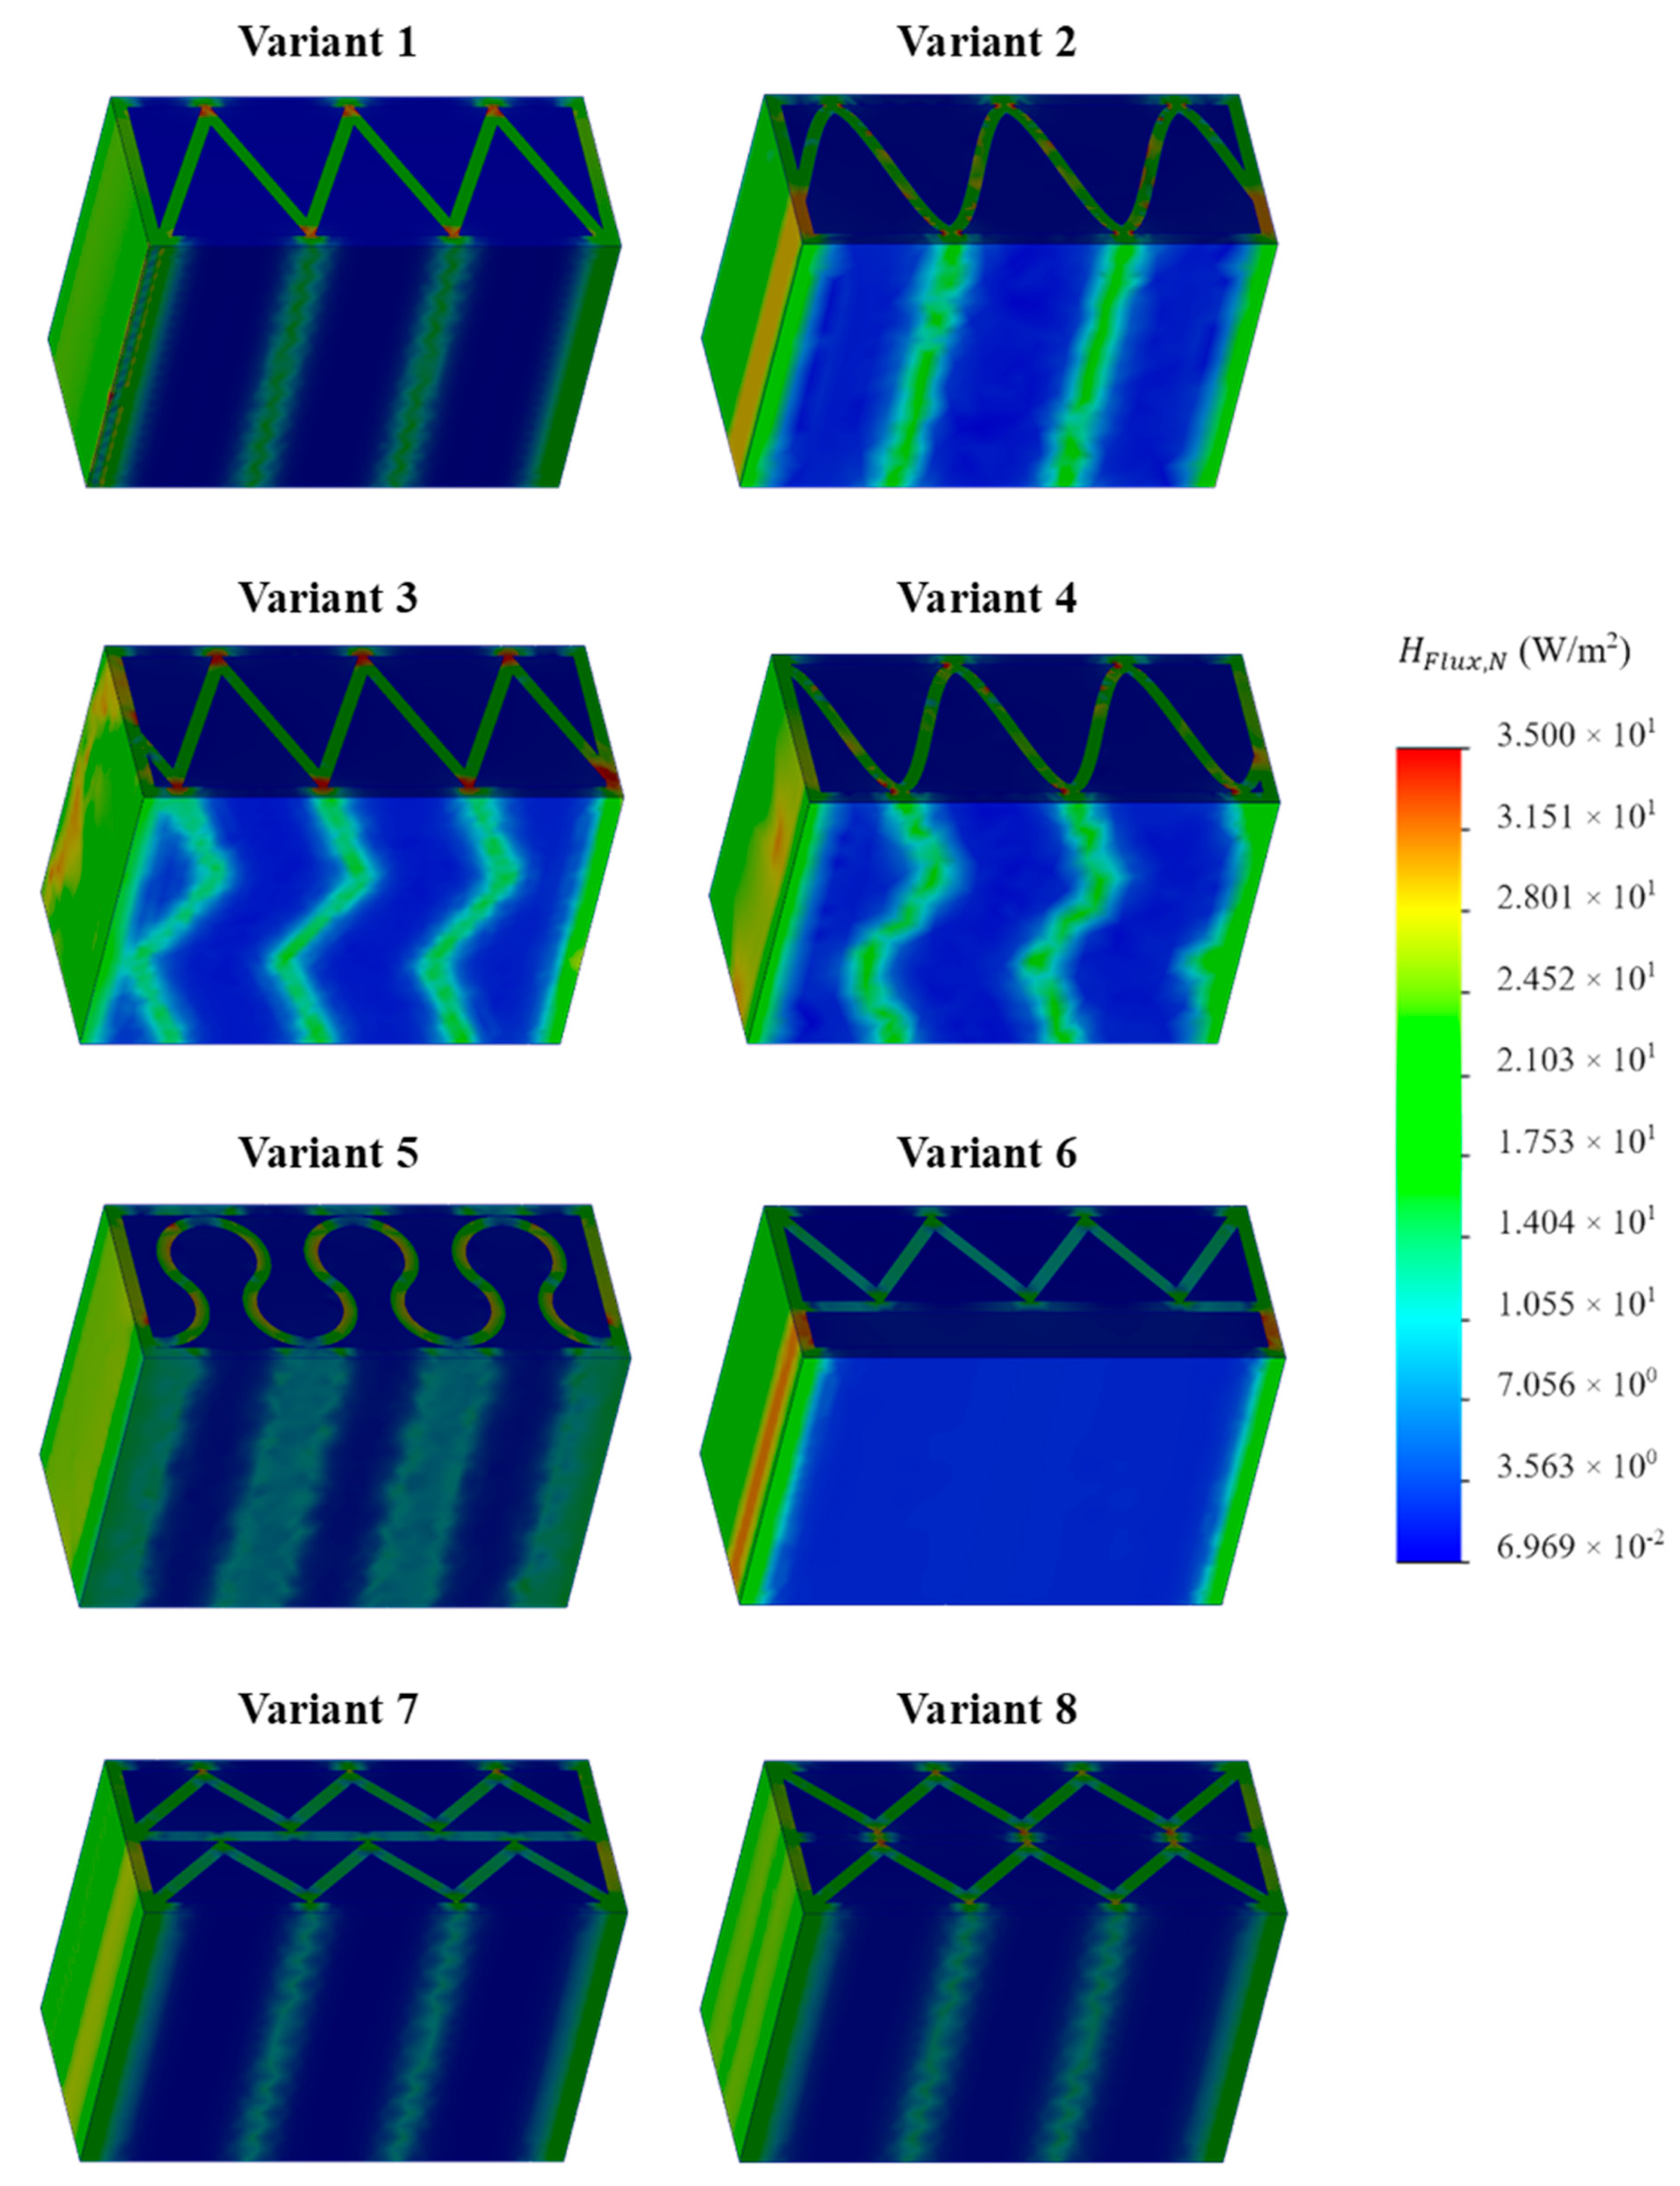
3.1. Thermal Simulation Analysis
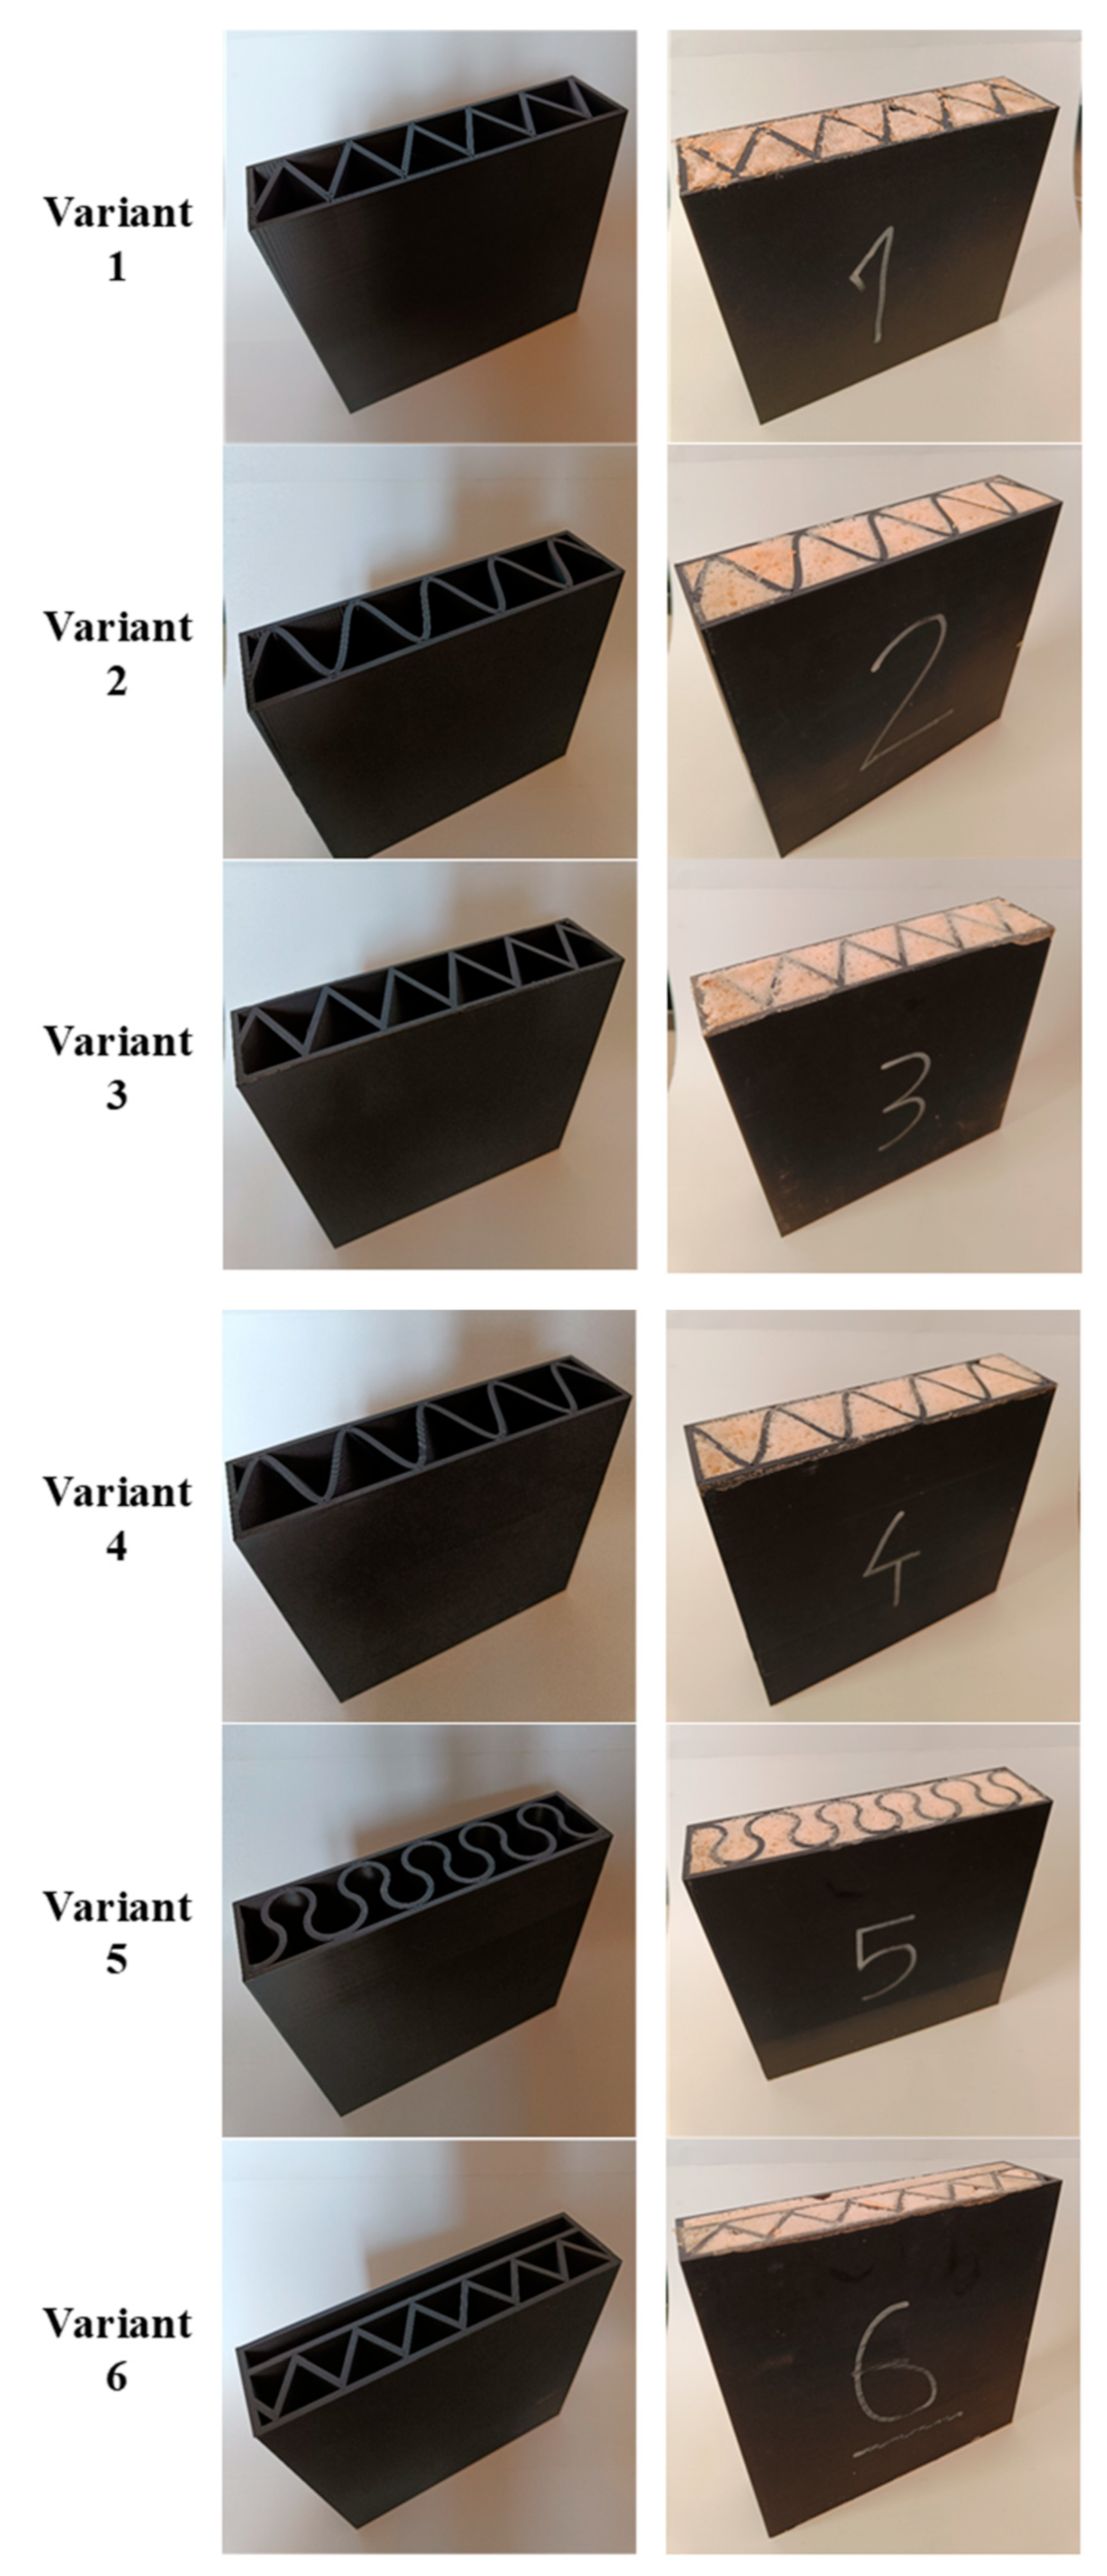
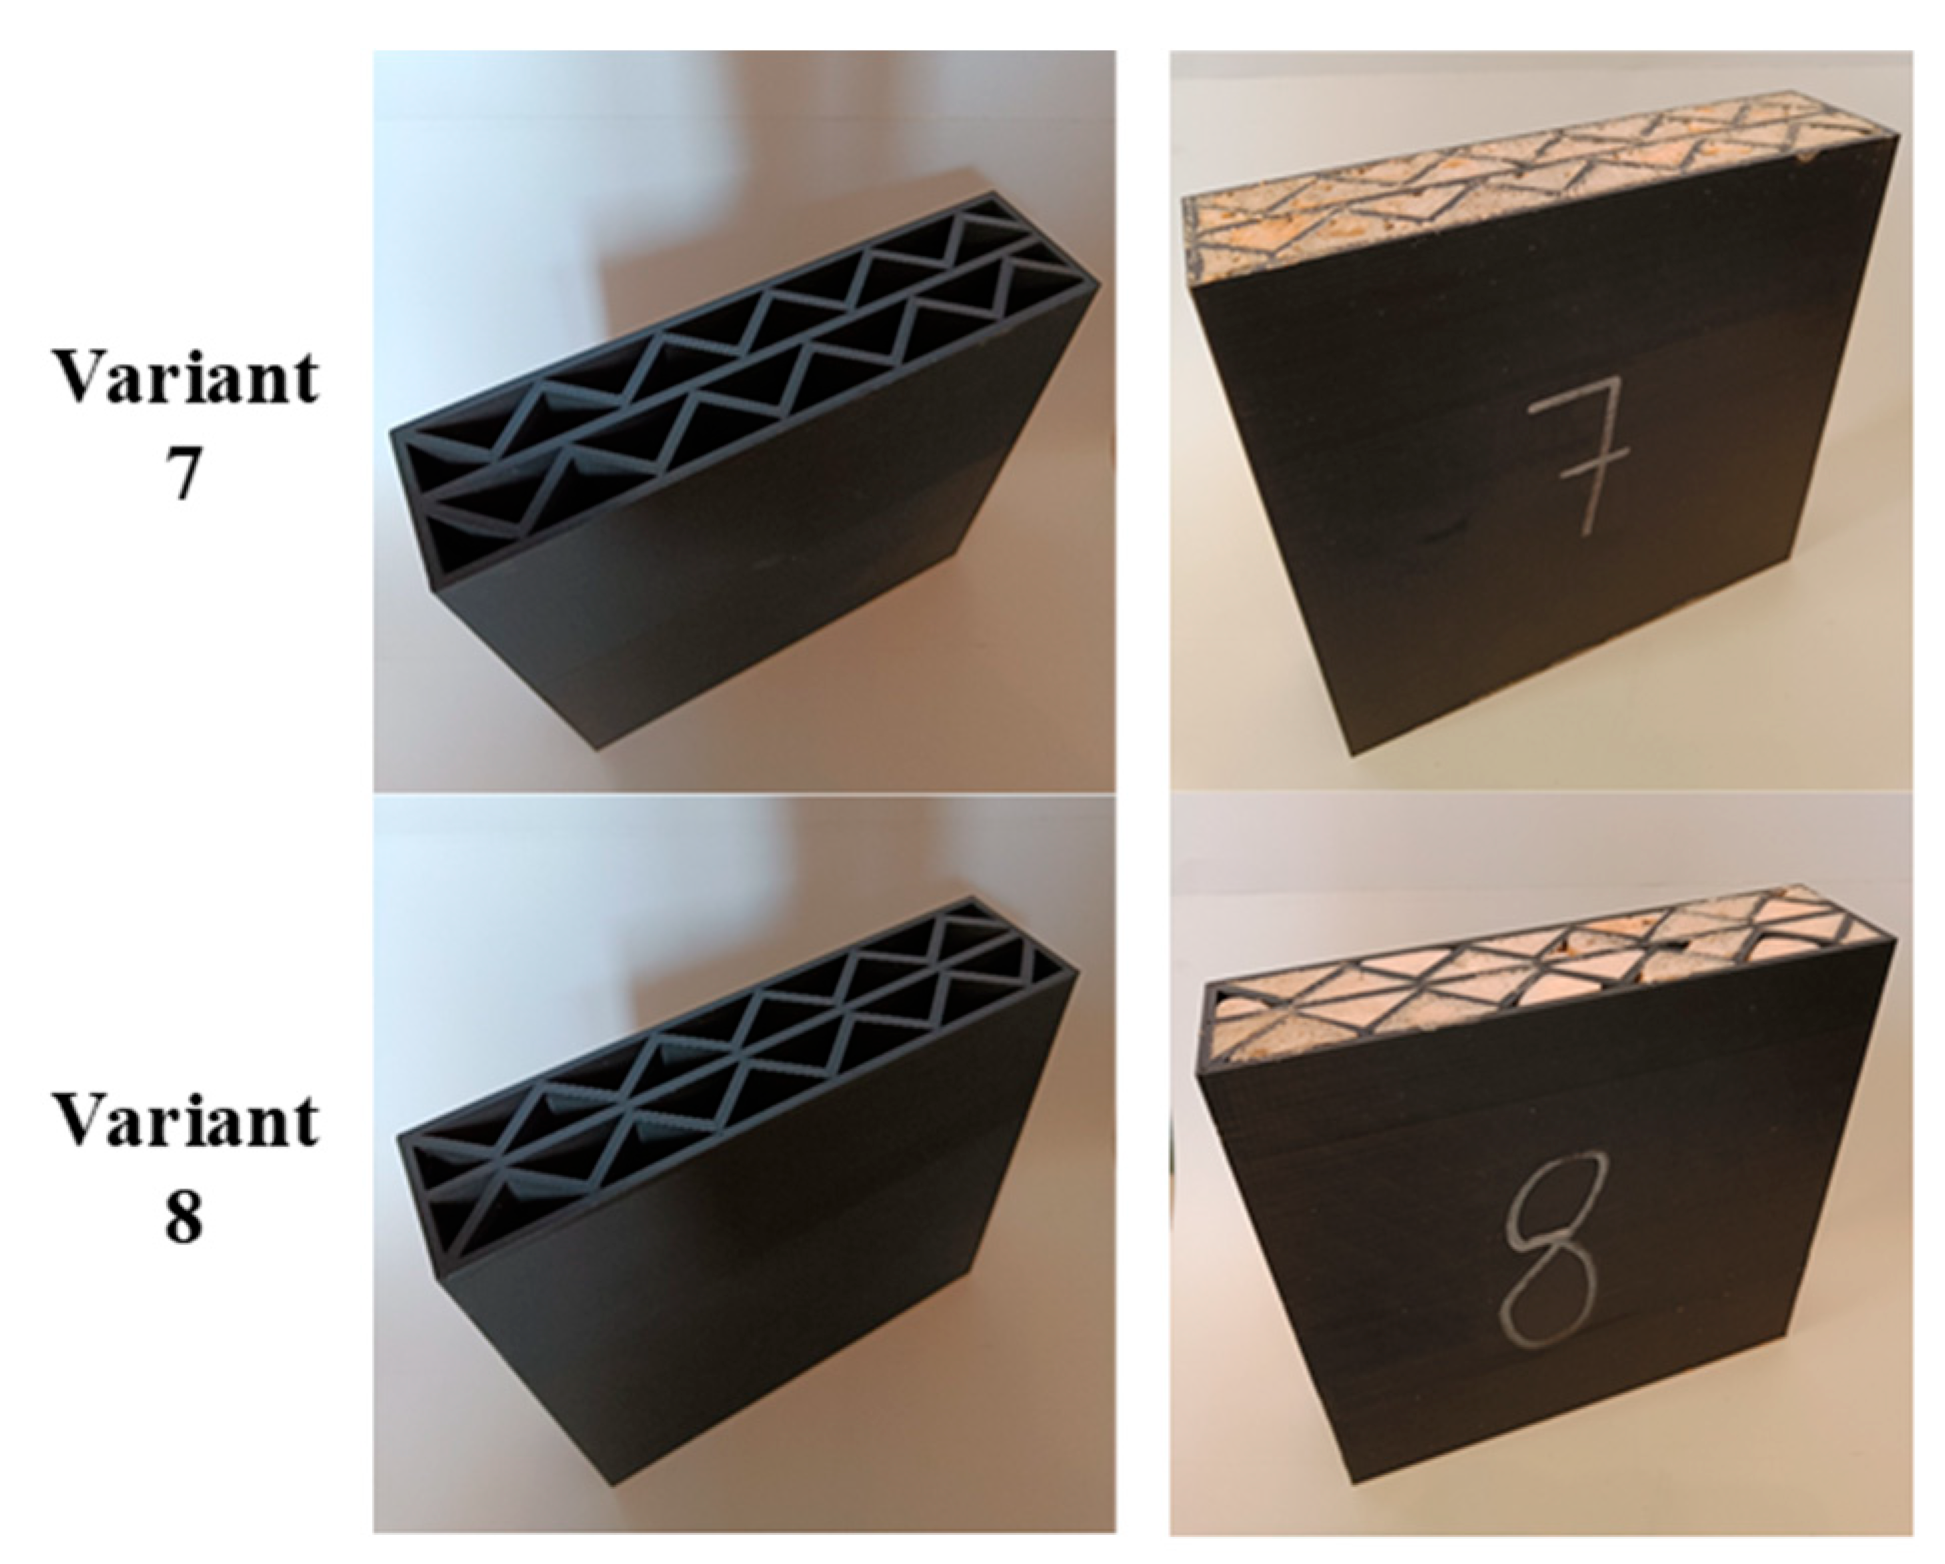
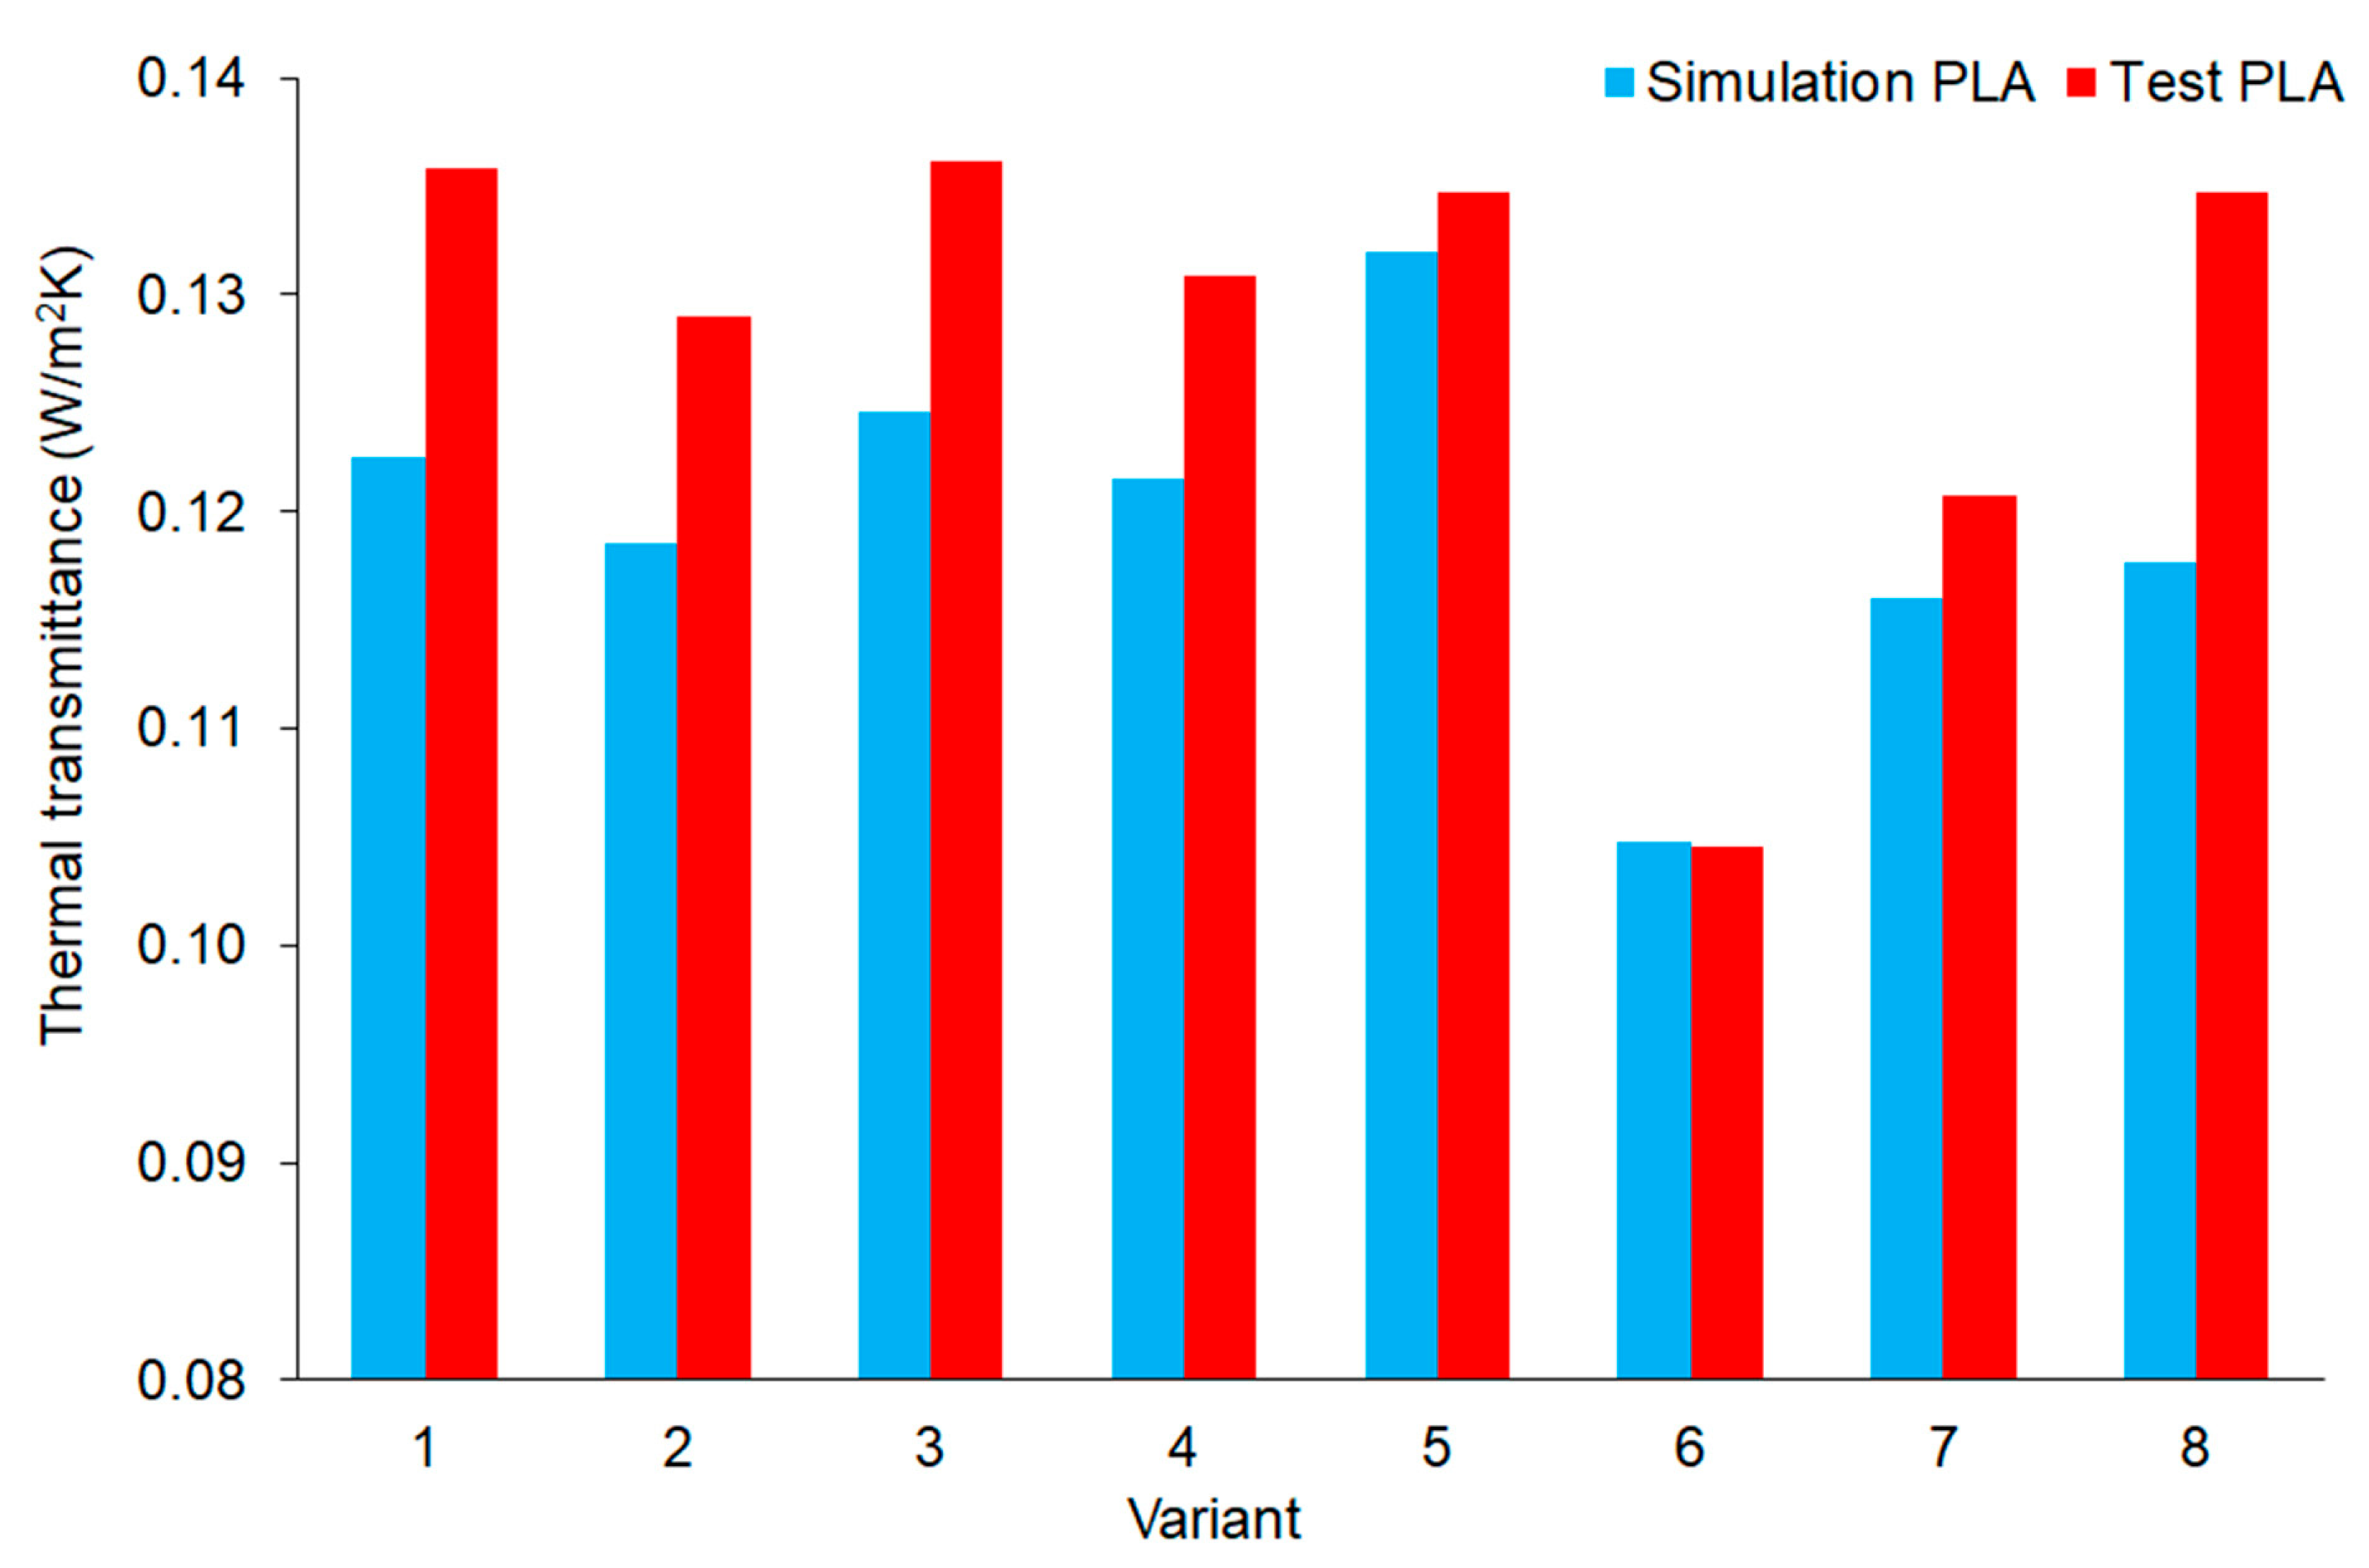
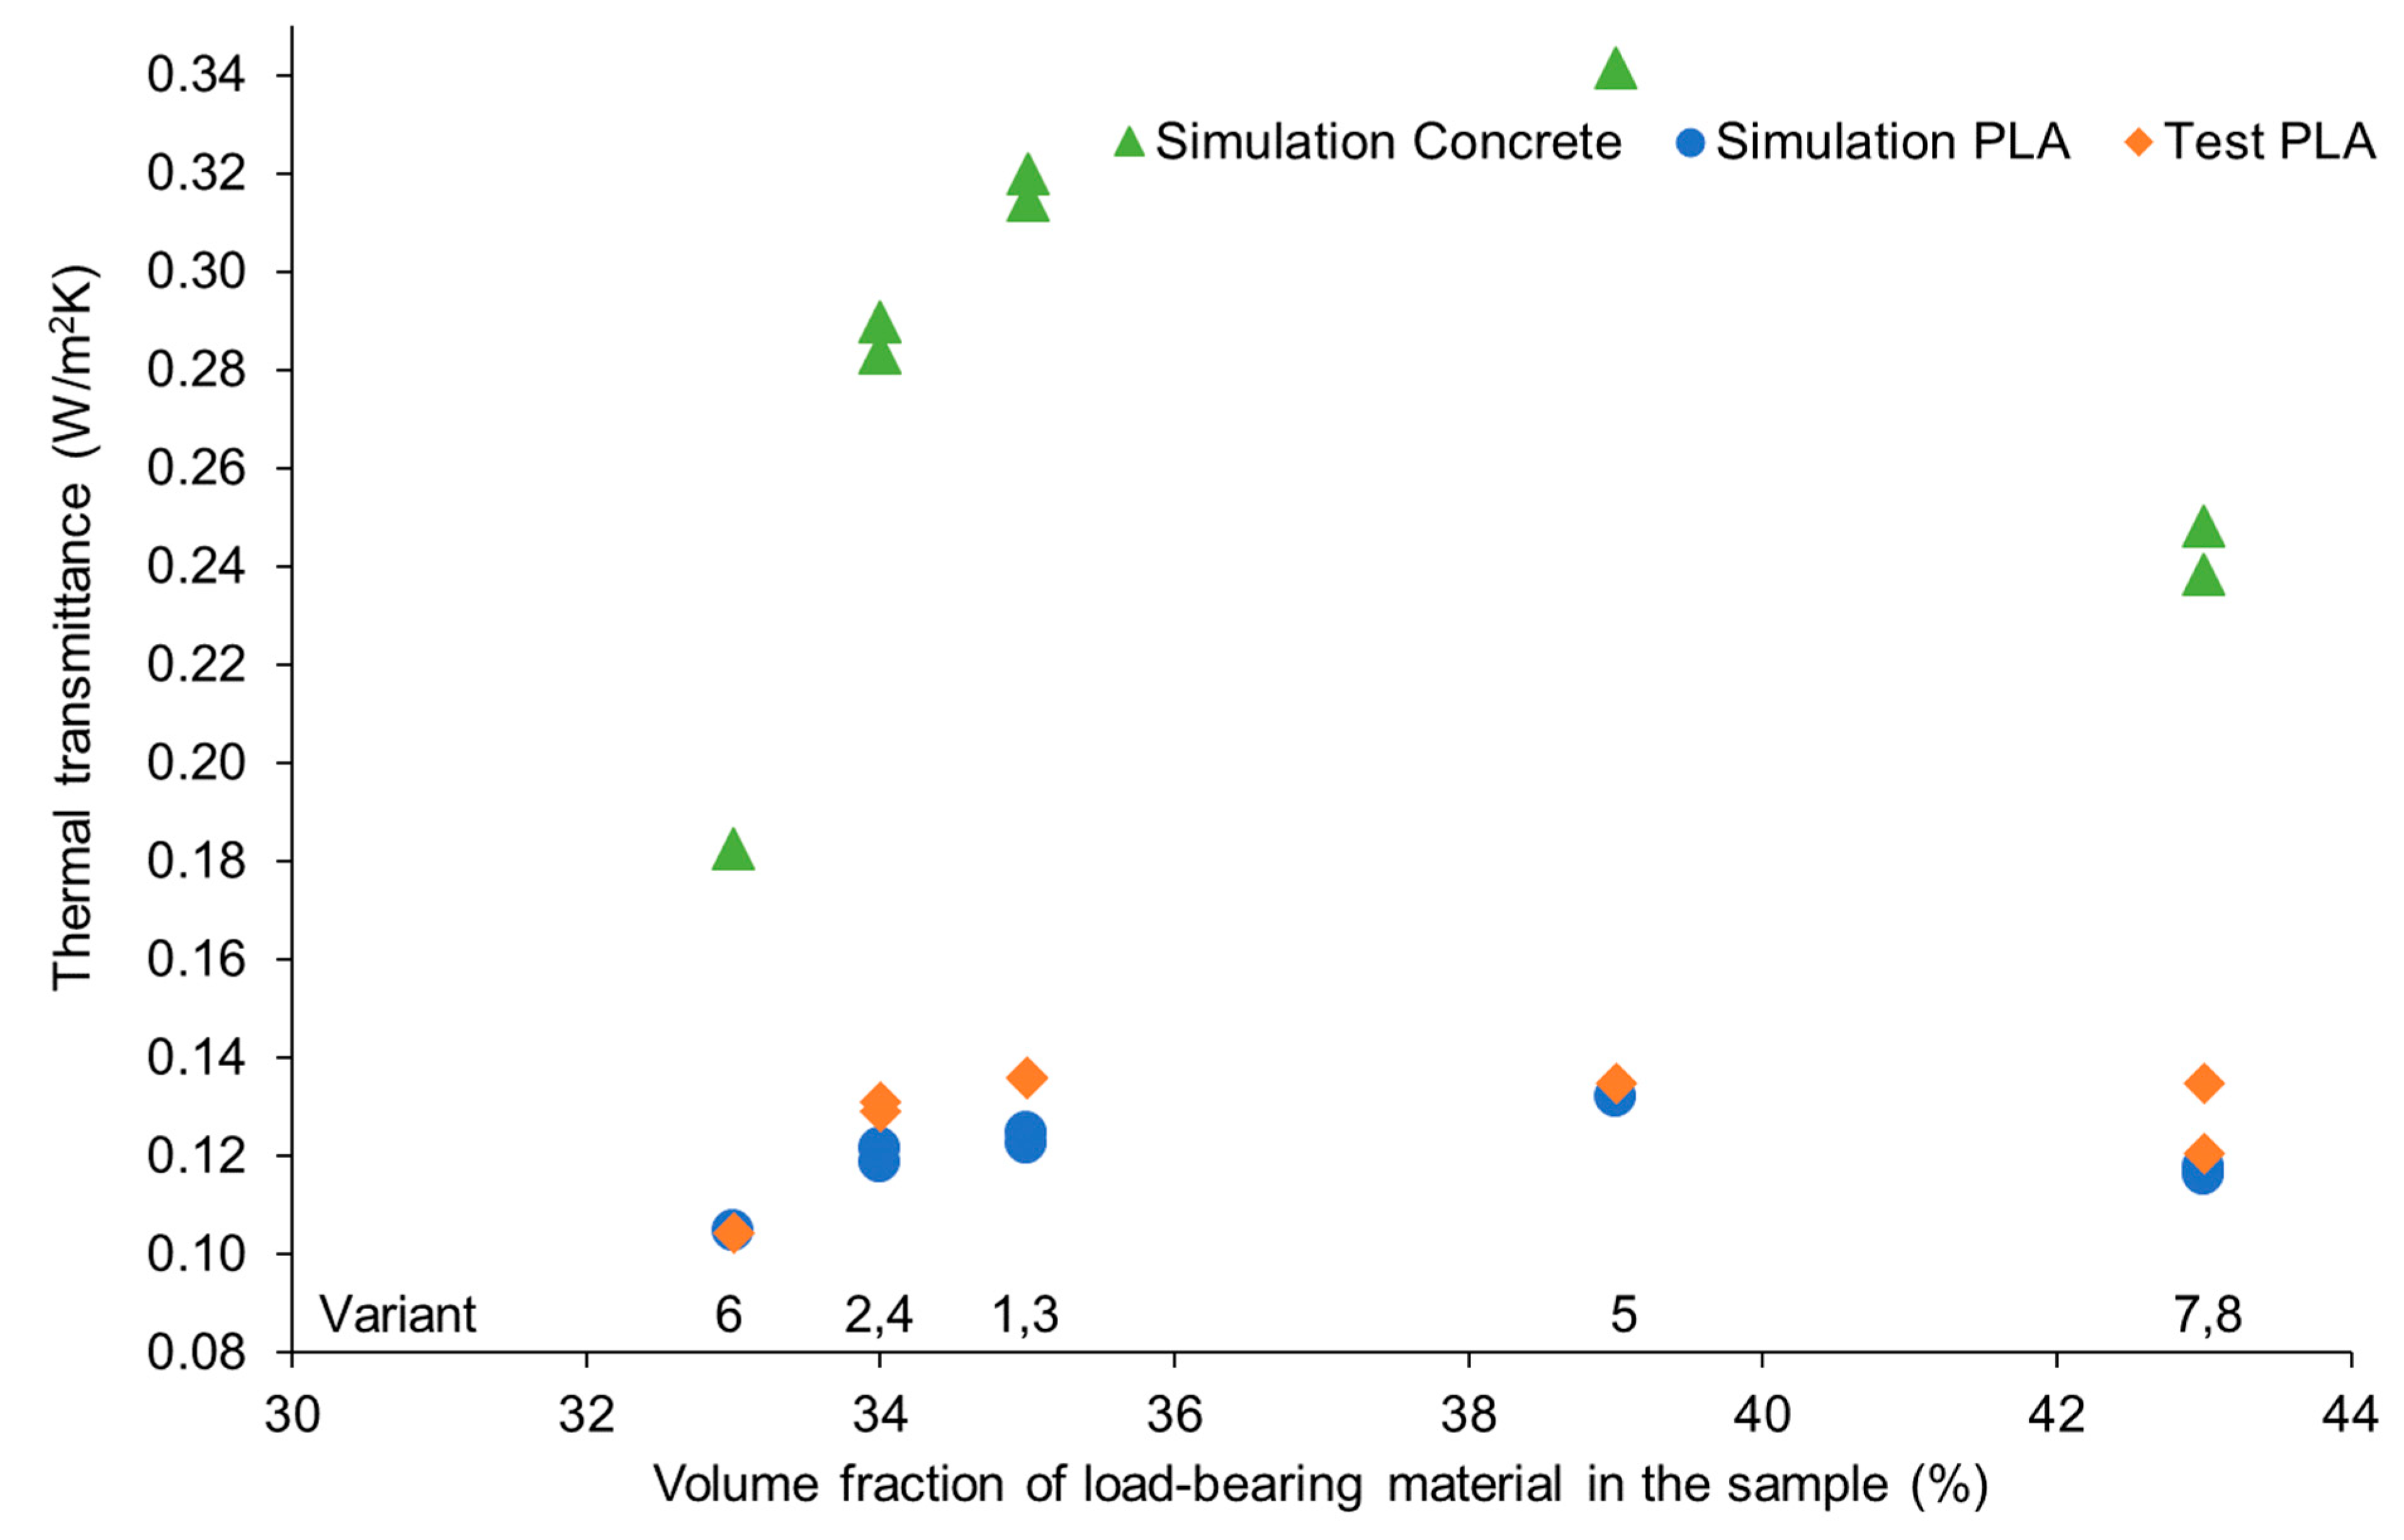
3.2. Micro-Scale Wall Testing

| Version No. | Thermal Resistance R (m2K/W) | Thermal Conductivity λ (W/mK) | Thermal Transmittance of Wall Systems UT (W/m2K) | Thermal Transmittance of Wall Systems UT (Wall Thickness 430 mm) (W/m2K) |
|---|---|---|---|---|
| 1 | 0.8578 | 0.0584 | 1.168 | 0.1358 |
| 2 | 0.9050 | 0.0555 | 1.109 | 0.1290 |
| 3 | 0.8593 | 0.0586 | 1.171 | 0.1362 |
| 4 | 0.8915 | 0.0563 | 1.126 | 0.1309 |
| 5 | 0.8642 | 0.0579 | 1.158 | 0.1347 |
| 6 | 1.1391 | 0.0449 | 0.899 | 0.1045 |
| 7 | 0.9636 | 0.0519 | 1.038 | 0.1207 |
| 8 | 0.8671 | 0.0579 | 1.158 | 0.1347 |
4. Conclusions
Author Contributions
Funding
Institutional Review Board Statement
Informed Consent Statement
Data Availability Statement
Conflicts of Interest
References
- Nie, J.; Xu, X.; Yue, X.; Guo, Q.; Zhou, Y. Less is more: A strategic analysis of 3D printing with limited capacity. Int. J. Prod. Econ. 2023, 258, 108816. [Google Scholar] [CrossRef]
- Freund, C.; Mulabdic, A.; Ruta, M. Is 3D printing a threat to global trade? The trade effects you didn’t hear about. J. Int. Econ. 2022, 138, 103646. [Google Scholar] [CrossRef]
- Chen, Z.; Han, Y.; Cai, P.; Mo, X.; Zhang, Y.; Wu, J.; Sun, B. Application of gel suspension printing system in 3D bio-printing. Mater. Lett. 2023, 341, 134235. [Google Scholar] [CrossRef]
- Ma, G.; Buswell, R.; da Silva, W.R.L.; Wang, L.; Xu, J.; Jones, S.Z. Technology readiness: A global snapshot of 3D concrete printing and the frontiers for development. Cem. Concr. Res. 2022, 156, 106774. [Google Scholar] [CrossRef]
- Sun, J.; Xiao, J.; Li, Z.; Feng, X. Experimental study on the thermal performance of a 3D printed concrete prototype building. Energy Build. 2021, 241, 110965. [Google Scholar] [CrossRef]
- Marczyk, J.; Ziejewska, C.; Gądek, S.; Korniejenko, K.; Łach, M.; Góra, M.; Kurek, I.; Doğan-Sağlamtimur, N.; Hebda, M.; Szechyńska-Hebda, M. Hybrid Materials Based on Fly Ash, Metakaolin, and Cement for 3D Printing. Materials 2021, 14, 6874. [Google Scholar] [CrossRef]
- Hager, I.; Maroszek, M.; Mróz, K.; Kęsek, R.; Hebda, M.; Dvorkin, L.; Marchuk, V. Interlayer Bond Strength Testing in 3D-Printed Mineral Materials for Construction Applications. Materials 2022, 15, 4112. [Google Scholar] [CrossRef]
- Bhattacherjee, S.; Basavaraj, A.S.; Rahul, A.; Santhanam, M.; Gettu, R.; Panda, B.; Schlangen, E.; Chen, Y.; Copuroglu, O.; Ma, G.; et al. Sustainable materials for 3D concrete printing. Cem. Concr. Compos. 2021, 122, 104156. [Google Scholar] [CrossRef]
- Kurek, I.; Florek, E.; Gozdur, W.; Ziejewska, C.; Marczyk, J.; Łach, M.; Korniejenko, K.; Duży, P.; Choińska, M.; Szechyńska-Hebda, M.; et al. Foamed Eco-Geopolymer Modified by Perlite and Cellulose as a Construction Material for Energy-Efficient Buildings. Energies 2022, 15, 4297. [Google Scholar] [CrossRef]
- Perkins, I.; Skitmore, M. Three-dimensional printing in the construction industry: A review. Int. J. Constr. Manag. 2015, 15, 1–9. [Google Scholar] [CrossRef]
- Wu, Y.; Lu, B.; Bai, T.; Wang, H.; Du, F.; Zhang, Y.; Cai, L.; Jiang, C.; Wang, W. Geopolymer, green alkali activated cementitious material: Synthesis, applications and challenges. Constr. Build. Mater. 2019, 224, 930–949. [Google Scholar] [CrossRef]
- Schneider, M.; Romer, M.; Tschudin, M.; Bolio, H. Sustainable cement production—Present and future. Cem. Concr. Res. 2011, 41, 642–650. [Google Scholar] [CrossRef]
- Yan, B.; Duan, P.; Ren, D. Mechanical strength, surface abrasion resistance and microstructure of fly ash-metakaolin-sepiolite geopolymer composites. Ceram. Int. 2017, 43, 1052–1060. [Google Scholar] [CrossRef]
- Ziejewska, C.; Marczyk, J.; Korniejenko, K.; Bednarz, S.; Sroczyk, P.; Łach, M.; Mikuła, J.; Figiela, B.; Szechyńska-Hebda, M.; Hebda, M. 3D Printing of Concrete-Geopolymer Hybrids. Materials 2022, 15, 2819. [Google Scholar] [CrossRef]
- Abrão, P.C.R.; Cardoso, F.A.; John, V.M. Efficiency of Portland-pozzolana cements: Water demand, chemical reactivity and environmental impact. Constr. Build. Mater. 2020, 247, 118546. [Google Scholar] [CrossRef]
- Ferreira, E.G.A.; Yokaichiya, F.; Rodrigues, M.S.; Beraldo, A.L.; Isaac, A.; Kardjilov, N.; Franco, M.K. Assessment of Greener Cement by employing thermally treated sugarcane straw ashes. Constr. Build. Mater. 2017, 141, 343–352. [Google Scholar] [CrossRef]
- Singh, N.; Middendorf, B. Geopolymers as an alternative to Portland cement: An overview. Constr. Build. Mater. 2020, 237, 117455. [Google Scholar] [CrossRef]
- Ngo, T.D.; Kashani, A.; Imbalzano, G.; Nguyen, K.T.Q.; Hui, D. Additive Manufacturing (3D Printing): A Review of Materials, Methods, Applications and Challenges. Compos. Part B Eng. 2018, 143, 172–196. [Google Scholar] [CrossRef]
- Marczyk, J.; Ziejewska, C.; Pławecka, K.; Bąk, A.; Łach, M.; Korniejenko, K.; Hager, I.; Mikuła, J.; Lin, W.-T.; Hebda, M. Optimizing the L/S Ratio in Geopolymers for the Production of Large-Size Elements with 3D Printing Technology. Materials 2022, 15, 3362. [Google Scholar] [CrossRef]
- Cuevas, K.; Strzałkowski, J.; Kim, J.-S.; Ehm, C.; Glotz, T.; Chougan, M.; Ghaffar, S.H.; Stephan, D.; Sikora, P. Towards development of sustainable lightweight 3D printed wall building envelopes—Experimental and numerical studies. Case Stud. Constr. Mater. 2023, 18, e01945. [Google Scholar] [CrossRef]
- Lowke, D.; Dini, E.; Perrot, A.; Weger, D.; Gehlen, C.; Dillenburger, B. Particle-bed 3D printing in concrete construction—Possibilities and challenges. Cem. Concr. Res. 2018, 112, 50–65. [Google Scholar] [CrossRef]
- Berardi, U.; Sprengard, C. An overview of and introduction to current researches on super insulating materials for high-performance buildings. Energy Build. 2020, 214, 109890. [Google Scholar] [CrossRef]
- Regulation of the Minister of Infrastructure and Construction of November 14, 2017 Amending the Regulation on Technical Conditions to Be Met by Buildings and Their Location. Journal of Laws of 2017, Item 2285. Available online: https://isap.sejm.gov.pl/isap.nsf/DocDetails.xsp?id=WDU20170002285 (accessed on 21 August 2023).
- Kaszynka, M.; Olczyk, N.; Techman, M.; Skibicki, S.; Zielinski, A.; Filipowicz, K.; Wroblewski, T.; Hoffmann, M. Thermal-Humidity Parameters of 3D Printed Wall. IOP Conf. Series Mater. Sci. Eng. 2019, 471, 082018. [Google Scholar] [CrossRef]
- Nguyen-Van, V.; Li, S.; Liu, J.; Nguyen, K.; Tran, P. Modelling of 3D concrete printing process: A perspective on material and structural simulations. Addit. Manuf. 2023, 61, 103333. [Google Scholar] [CrossRef]
- Prasittisopin, L.; Pongpaisanseree, K.; Jiramarootapong, P.; Snguanyat, C. Thermal and Sound Insulation of Large-Scale 3D Extrusion Printing Wall Panel. In Proceedings of the Second RILEM International Conference on Concrete and Digital Fabrication, Online, 6–9 July 2020; Bos, F., Lucas, S., Wolfs, R., Salet, T., Eds.; Springer: Cham, Switzerland; Volume 28. RILEM Bookseries. [Google Scholar] [CrossRef]
- Suntharalingam, T.; Upasiri, I.; Nagaratnam, B.; Poologanathan, K.; Gatheeshgar, P.; Tsavdaridis, K.D.; Nuwanthika, D. Finite Element Modelling to Predict the Fire Performance of Bio-Inspired 3D-Printed Concrete Wall Panels Exposed to Realistic Fire. Buildings 2022, 12, 111. [Google Scholar] [CrossRef]
- Prasittisopin, L.; Jiramarootapong, P.; Pongpaisanseree, K.; Snguanyat, C. Lean Manufacturing and Thermal Enhancement of Single-Layered Wall of Additive Manufacturing (AM) Structure. Zkg Int. 2019, 4, 64–74. [Google Scholar]
- Alami, A.H.; Olabi, A.G.; Ayoub, M.; Aljaghoub, H.; Alasad, S.; Abdelkareem, M.A. 3D Concrete Printing: Recent Progress, Applications, Challenges, and Role in Achieving Sustainable Development Goals. Buildings 2023, 13, 924. [Google Scholar] [CrossRef]
- ISO 6946; Building Components and Building Elements—Thermal Resistance and Thermal Transmittance—Calculation Methods. ISO: Geneva, Switzerland, 2017.
- De Rubeis, T.; Evangelisti, L.; Guattari, C.; De Berardinis, P.; Asdrubali, F.; Ambrosini, D. On the influence of environmental boundary conditions on surface thermal resistance of walls: Experimental evaluation through a Guarded Hot Box. Case Stud. Therm. Eng. 2022, 34, 101915. [Google Scholar] [CrossRef]
- Anton, A.; Reiter, L.; Wangler, T.; Frangez, V.; Flatt, R.J.; Dillenburger, B. A 3D concrete printing prefabrication platform for bespoke columns. Autom. Constr. 2021, 122, 103467. [Google Scholar] [CrossRef]
- Tuvayanond, W.; Prasittisopin, L. Design for Manufacture and Assembly of Digital Fabrication and Additive Manufacturing in Construction: A Review. Buildings 2023, 13, 429. [Google Scholar] [CrossRef]
- Lao, W.; Li, M.; Tjahjowidodo, T. Variable-geometry nozzle for surface quality enhancement in 3D concrete printing. Addit. Manuf. 2021, 37, 101638. [Google Scholar] [CrossRef]
- Karcz, J.; Kacperski, Ł. An effect of grid quality on the results of numerical simulations of the fluid flow field in an agitated vessel. In Proceedings of the 14th European Conference on Mixing, Warszawa, Poland, 10–13 September 2012. [Google Scholar]


| Material Property | Normal Strength Concrete | PUR Foam | PLA | Units |
|---|---|---|---|---|
| Elastic Modulus | 32,000 | 2200 | 2950 | N/mm2 |
| Poisson’s Ratio | 0.2 | 0.32 | 0.33 | - |
| Shear Modulus | 13,300 | 830 | 1200 | N/mm2 |
| Density | 2460 | 16.02 | 1250 | kg/m3 |
| Tensile Strength | 3 | 0.79 | 45 | N/mm2 |
| Compressive Strength | 25 | 0.64 | 60 | N/mm2 |
| Yield Strength | - | - | 35 | N/mm2 |
| Thermal Expansion Coefficient | 10−5 | 6.5 × 10⁻⁵ | 7 × 10⁻⁵ | K−1 |
| Thermal Conductivity λ | 0.5 | 0.027 | 0.13 | W/(mK) |
| Specific Heat Capacity | 750 | 1.2 | 1800 | J/(kgK) |
| Parameter | Value | Units |
|---|---|---|
| Nozzle diameter | 0.6 | mm |
| Layer Height | 0.32 | mm |
| Wall line count | 6 | N/A |
| Infill | 100 | % |
| Printing Temperature | 210 | C |
| Bed Temperature | 60 | C |
| Printing Speed | 50 | mm/s |
| Details Mesh Type | Solid Mesh |
|---|---|
| Mesher used | Blended curvature-based mesh |
| Jacobian points for high quality mesh | 16 points |
| Max element size | 38.0215 mm |
| Min element size | 12.6737 mm |
| Mesh quality | High |
| Total nodes | 88,252 |
| Total elements | 48,751 |
| Maximum aspect ratio | 18.272 |
| Percentage of elements with aspect ratio < 3 | 97 |
| Percentage of elements with aspect ratio > 10 | 0.107 |
| Samples Designation | Projection | Cross-Section | Cross-Section, Parallel to Wall Surface | Volume Fraction of Load-Bearing Material in the Sample |
|---|---|---|---|---|
| Variant 1 | 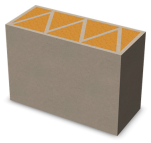 | 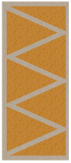 | 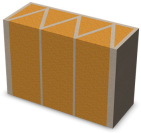 | 35% |
| Variant 2 | 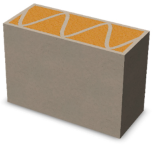 |  | 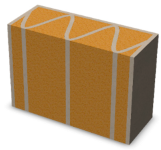 | 34% |
| Variant 3 | 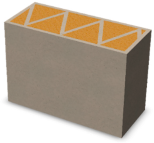 | 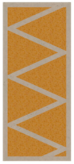 |  | 35% |
| Variant 4 |  | 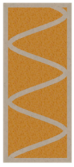 |  | 34% |
| Variant 5 | 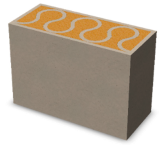 | 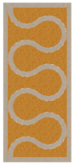 | 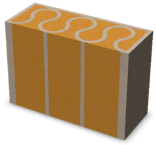 | 39% |
| Variant 6 | 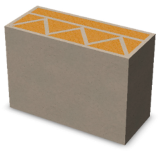 | 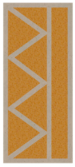 |  | 33% |
| Variant 7 | 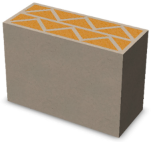 | 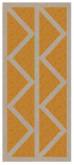 |  | 43% |
| Variant 8 |  | 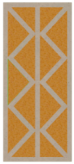 |  | 43% |
| Variant No. | Concrete | PLA | ||
|---|---|---|---|---|
| Avg. Heat Flux (W/m2) | Thermal Transmittance of Wall Systems UC (W/m2K) | Avg. Heat Flux (W/m2) | Thermal Transmittance of Wall Systems UP (W/m2K) | |
| 1 | 6.289 | 0.3145 | 2.451 | 0.1225 |
| 2 | 5.666 | 0.2833 | 2.370 | 0.1185 |
| 3 | 6.398 | 0.3199 | 2.492 | 0.1246 |
| 4 | 5.794 | 0.2897 | 2.431 | 0.1215 |
| 5 | 6.830 | 0.3415 | 2.639 | 0.1320 |
| 6 | 3.654 | 0.1827 | 2.096 | 0.1048 |
| 7 | 4.768 | 0.2384 | 2.321 | 0.1161 |
| 8 | 4.962 | 0.2481 | 2.354 | 0.1177 |
| Variant No. | Simulation Concrete | Simulation PLA | Test PLA |
|---|---|---|---|
| Variant 1 | 6 | 6 | 7 |
| Variant 2 | 4 | 4 | 3 |
| Variant 3 | 7 | 7 | 8 |
| Variant 4 | 5 | 5 | 4 |
| Variant 5 | 8 | 8 | 5 |
| Variant 6 | 1 | 1 | 1 |
| Variant 7 | 2 | 2 | 2 |
| Variant 8 | 3 | 3 | 6 |
Disclaimer/Publisher’s Note: The statements, opinions and data contained in all publications are solely those of the individual author(s) and contributor(s) and not of MDPI and/or the editor(s). MDPI and/or the editor(s) disclaim responsibility for any injury to people or property resulting from any ideas, methods, instructions or products referred to in the content. |
© 2023 by the authors. Licensee MDPI, Basel, Switzerland. This article is an open access article distributed under the terms and conditions of the Creative Commons Attribution (CC BY) license (https://creativecommons.org/licenses/by/4.0/).
Share and Cite
Dziura, P.; Maroszek, M.; Góra, M.; Rudziewicz, M.; Pławecka, K.; Hebda, M. Influence of the In-Fill Pattern of the 3D Printed Building Wall on Its Thermal Insulation. Materials 2023, 16, 5772. https://doi.org/10.3390/ma16175772
Dziura P, Maroszek M, Góra M, Rudziewicz M, Pławecka K, Hebda M. Influence of the In-Fill Pattern of the 3D Printed Building Wall on Its Thermal Insulation. Materials. 2023; 16(17):5772. https://doi.org/10.3390/ma16175772
Chicago/Turabian StyleDziura, Paweł, Marcin Maroszek, Mateusz Góra, Magdalena Rudziewicz, Kinga Pławecka, and Marek Hebda. 2023. "Influence of the In-Fill Pattern of the 3D Printed Building Wall on Its Thermal Insulation" Materials 16, no. 17: 5772. https://doi.org/10.3390/ma16175772
APA StyleDziura, P., Maroszek, M., Góra, M., Rudziewicz, M., Pławecka, K., & Hebda, M. (2023). Influence of the In-Fill Pattern of the 3D Printed Building Wall on Its Thermal Insulation. Materials, 16(17), 5772. https://doi.org/10.3390/ma16175772