Author Contributions
Conceptualization, D.P.G.; Formal analysis, D.P.G., M.B.T., R.P., Y.Z., Y.L. and Y.W.; Investigation, M.B.T., R.P., Y.Z., Y.L. and Y.W.; Resources, D.P.G.; Data curation, D.P.G., M.B.T. and R.P.; Writing—original draft, D.P.G., M.B.T., Y.L. and Y.W.; Writing—review & editing, D.P.G., M.B.T. and R.P. All authors have read and agreed to the published version of the manuscript.
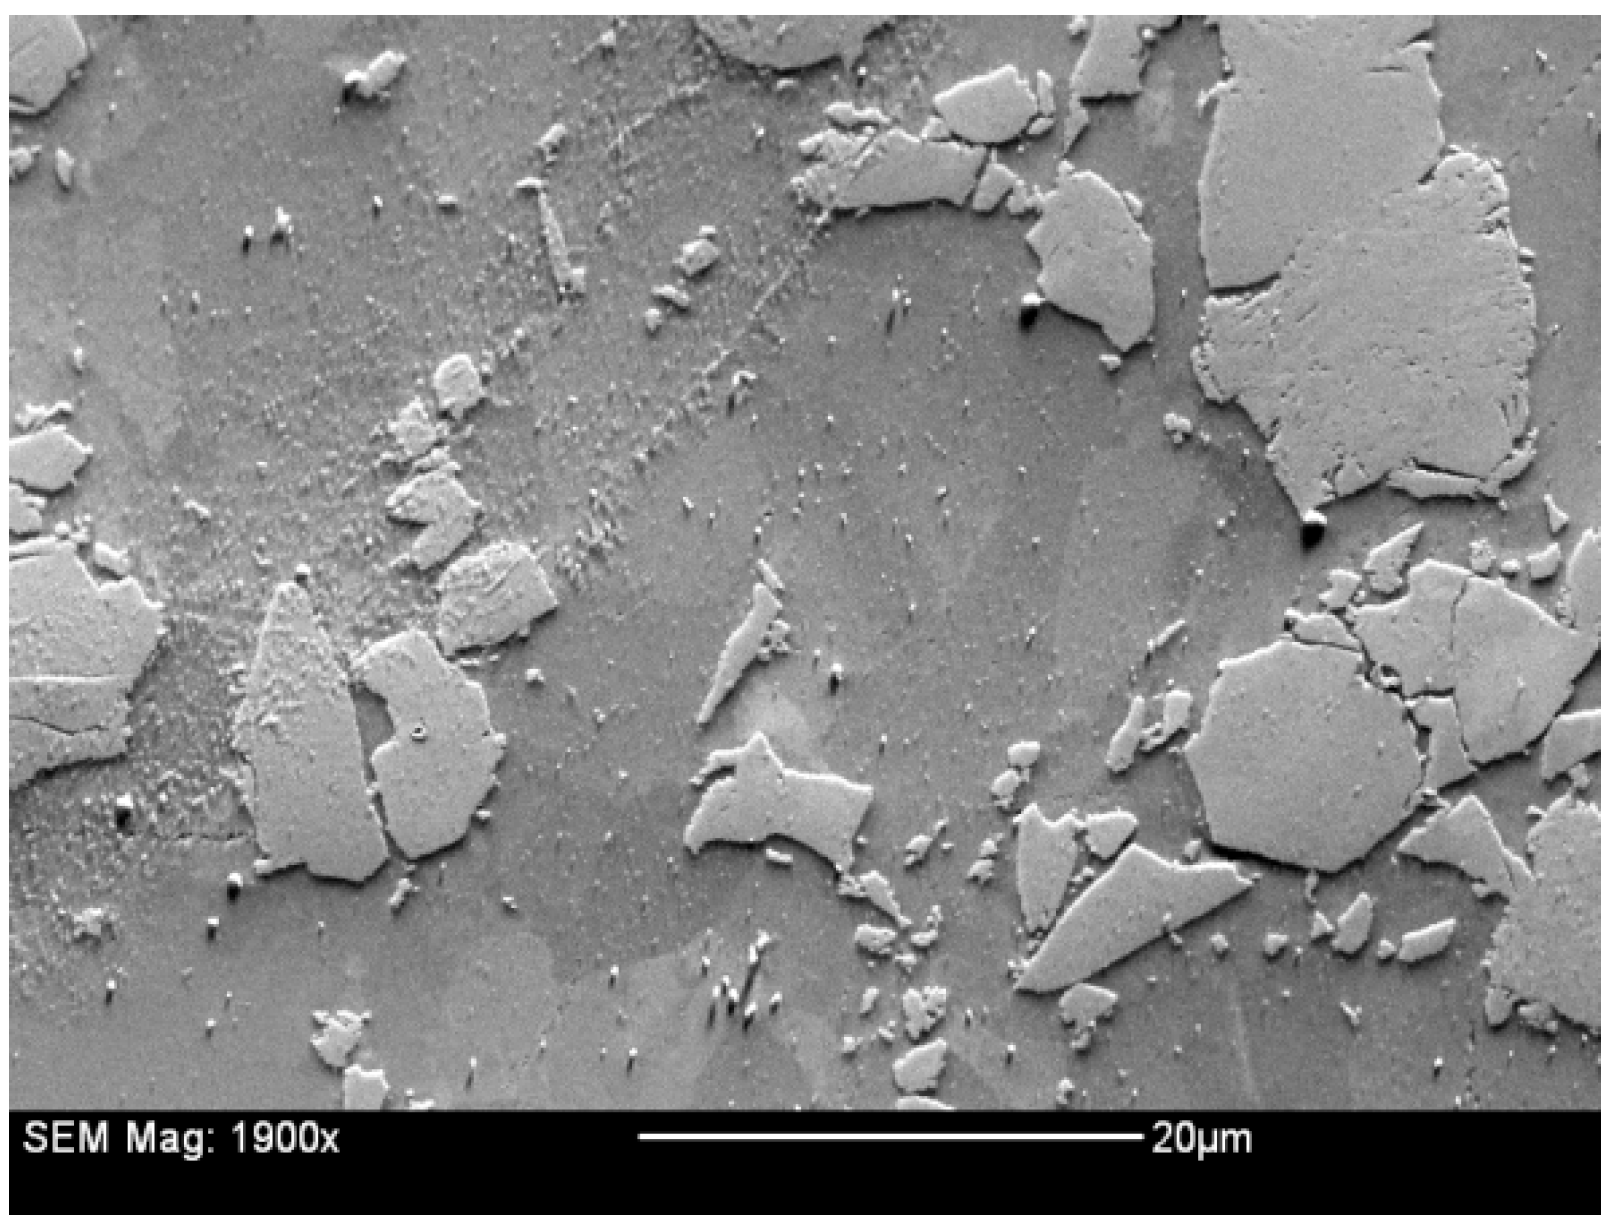
Figure 1.
A SEM secondary electron image of the 28.4 vol% Al3Hf-Al material.
Figure 1.
A SEM secondary electron image of the 28.4 vol% Al3Hf-Al material.
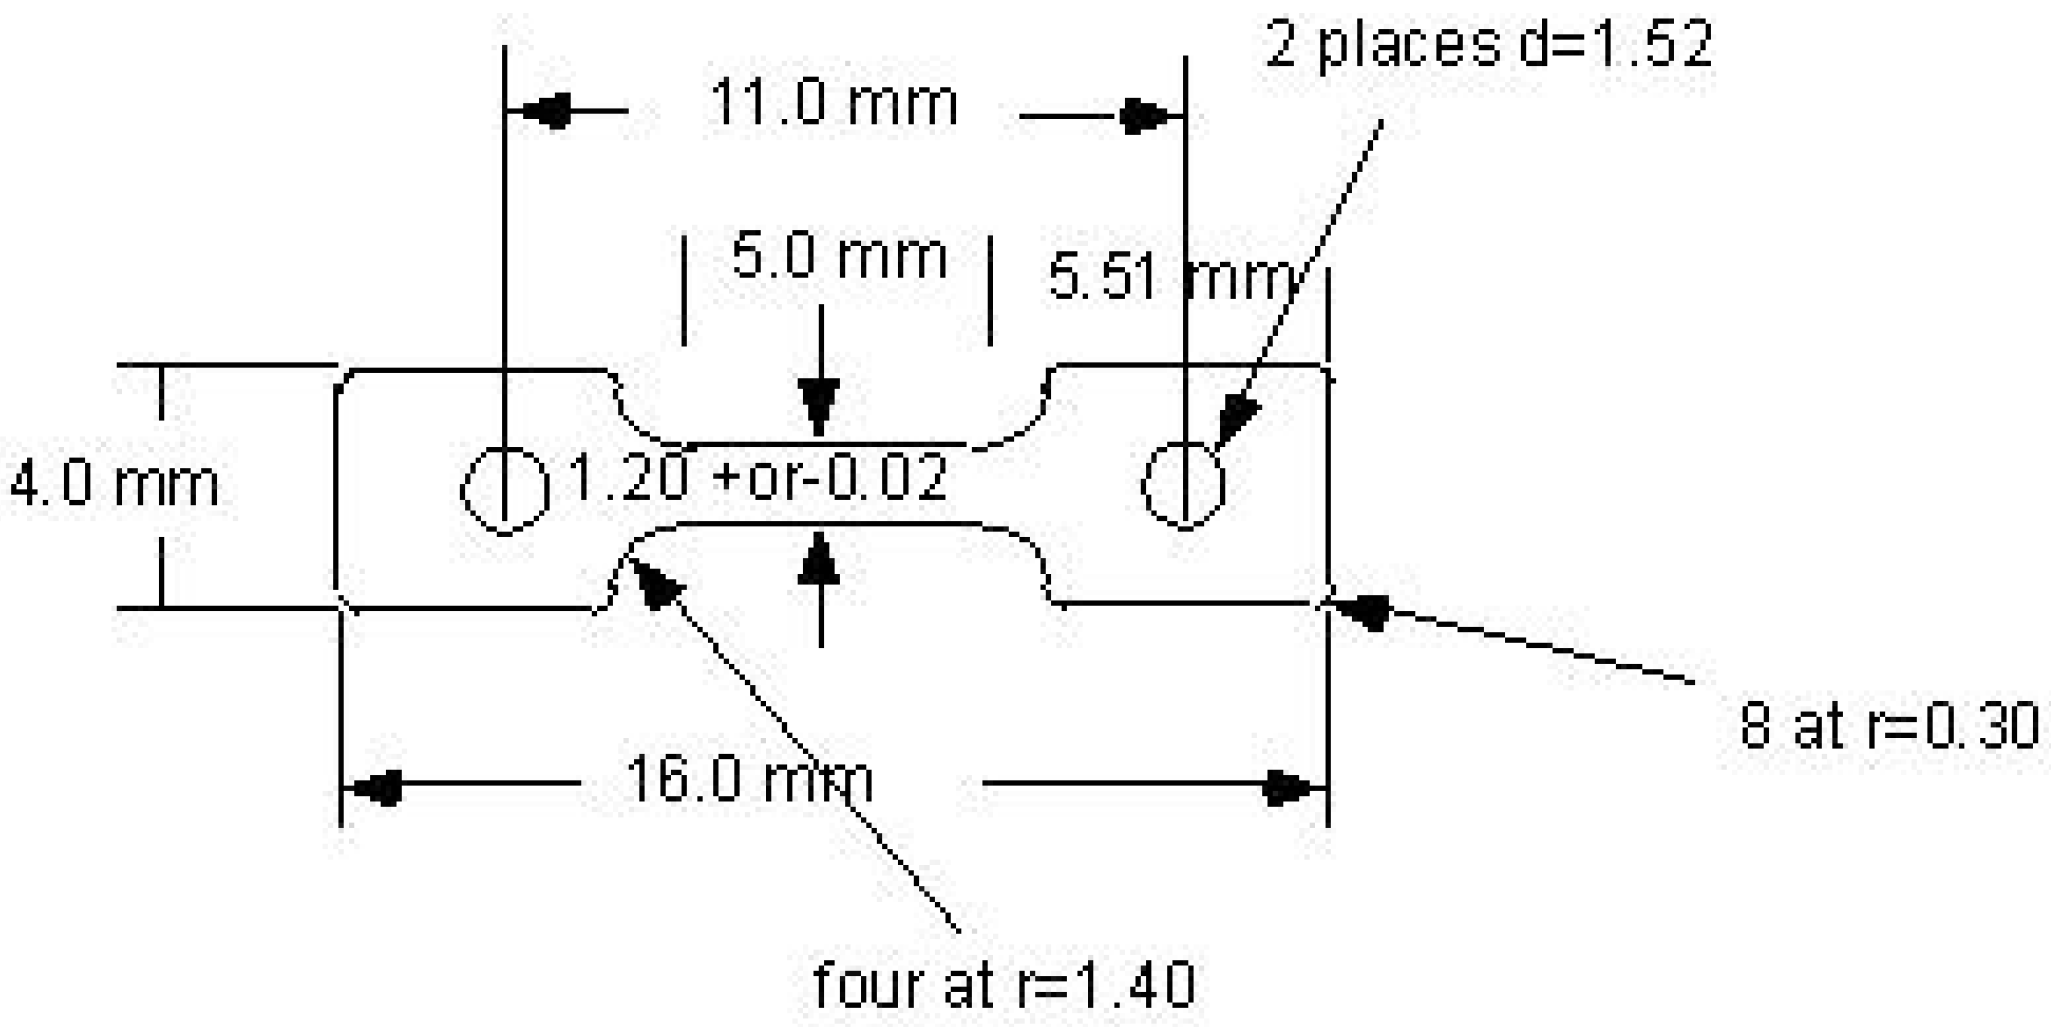
Figure 2.
S1 tensile geometry used for this study. Specimens are 1.0 mm thick.
Figure 2.
S1 tensile geometry used for this study. Specimens are 1.0 mm thick.
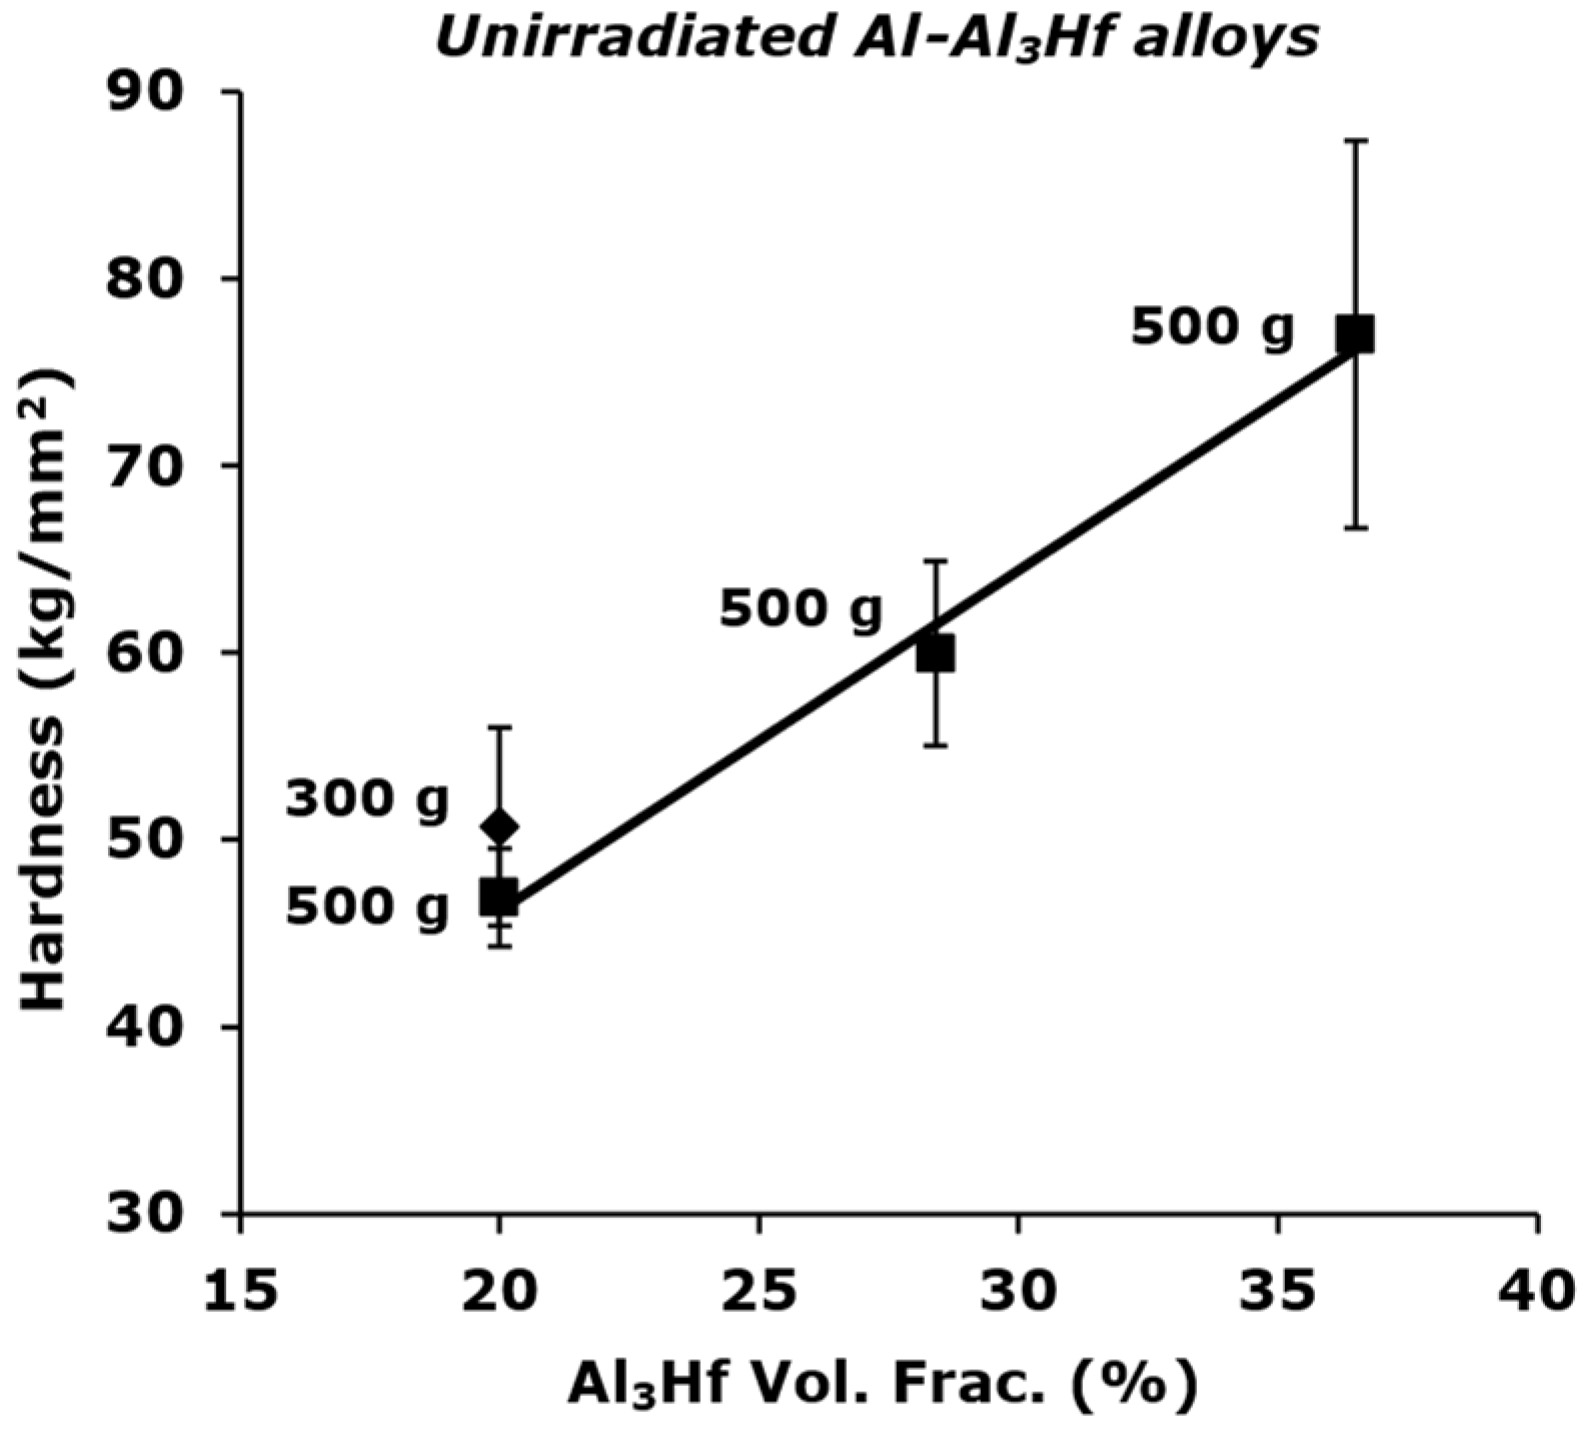
Figure 3.
Vickers microhardness values of unirradiated Al3Hf-Al samples (20 vol% Al3Hf) with a comparison between 300 g and 500 g loads. Error bars are the standard deviation of each measurement set.
Figure 3.
Vickers microhardness values of unirradiated Al3Hf-Al samples (20 vol% Al3Hf) with a comparison between 300 g and 500 g loads. Error bars are the standard deviation of each measurement set.
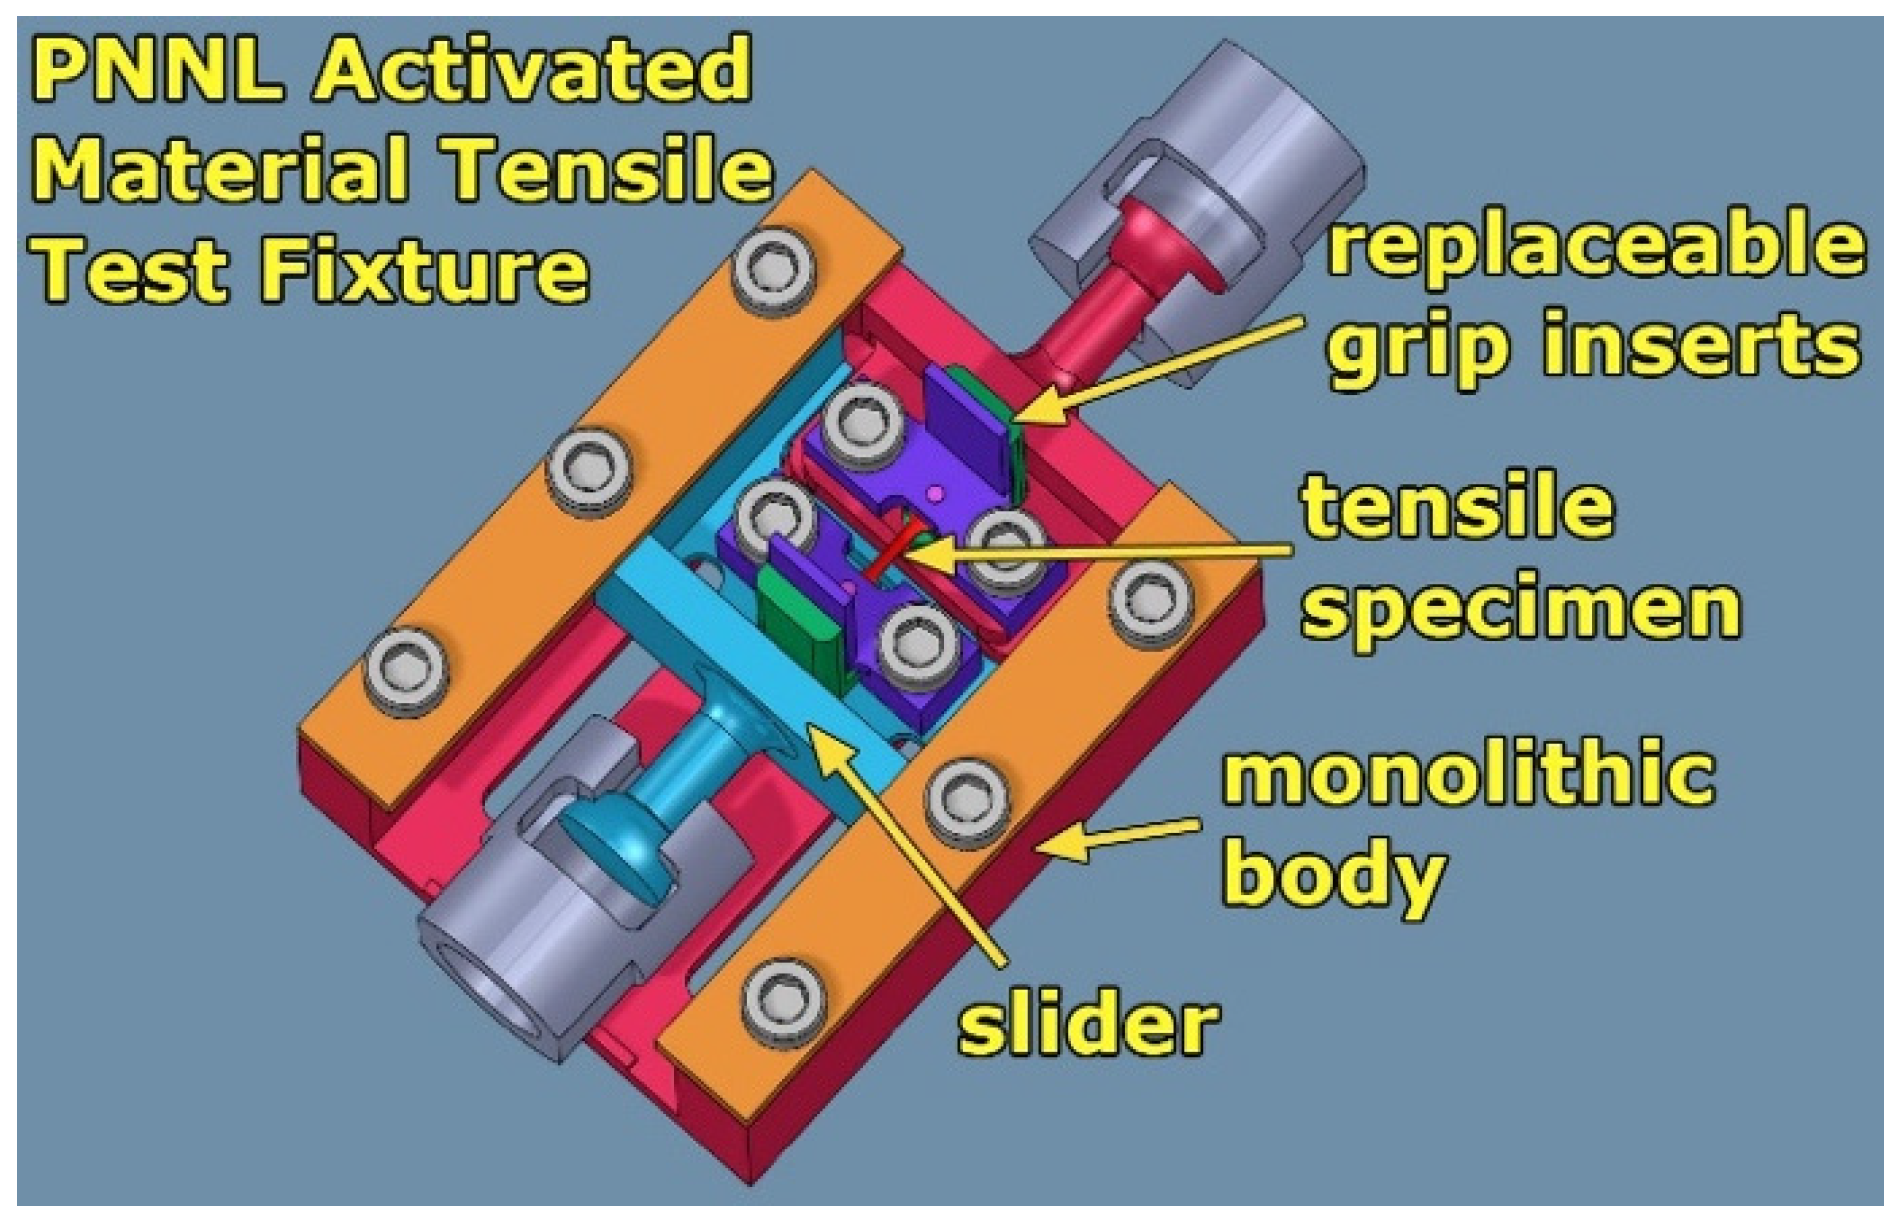
Figure 4.
Activated material tensile test fixture for miniature tensile specimens.
Figure 4.
Activated material tensile test fixture for miniature tensile specimens.
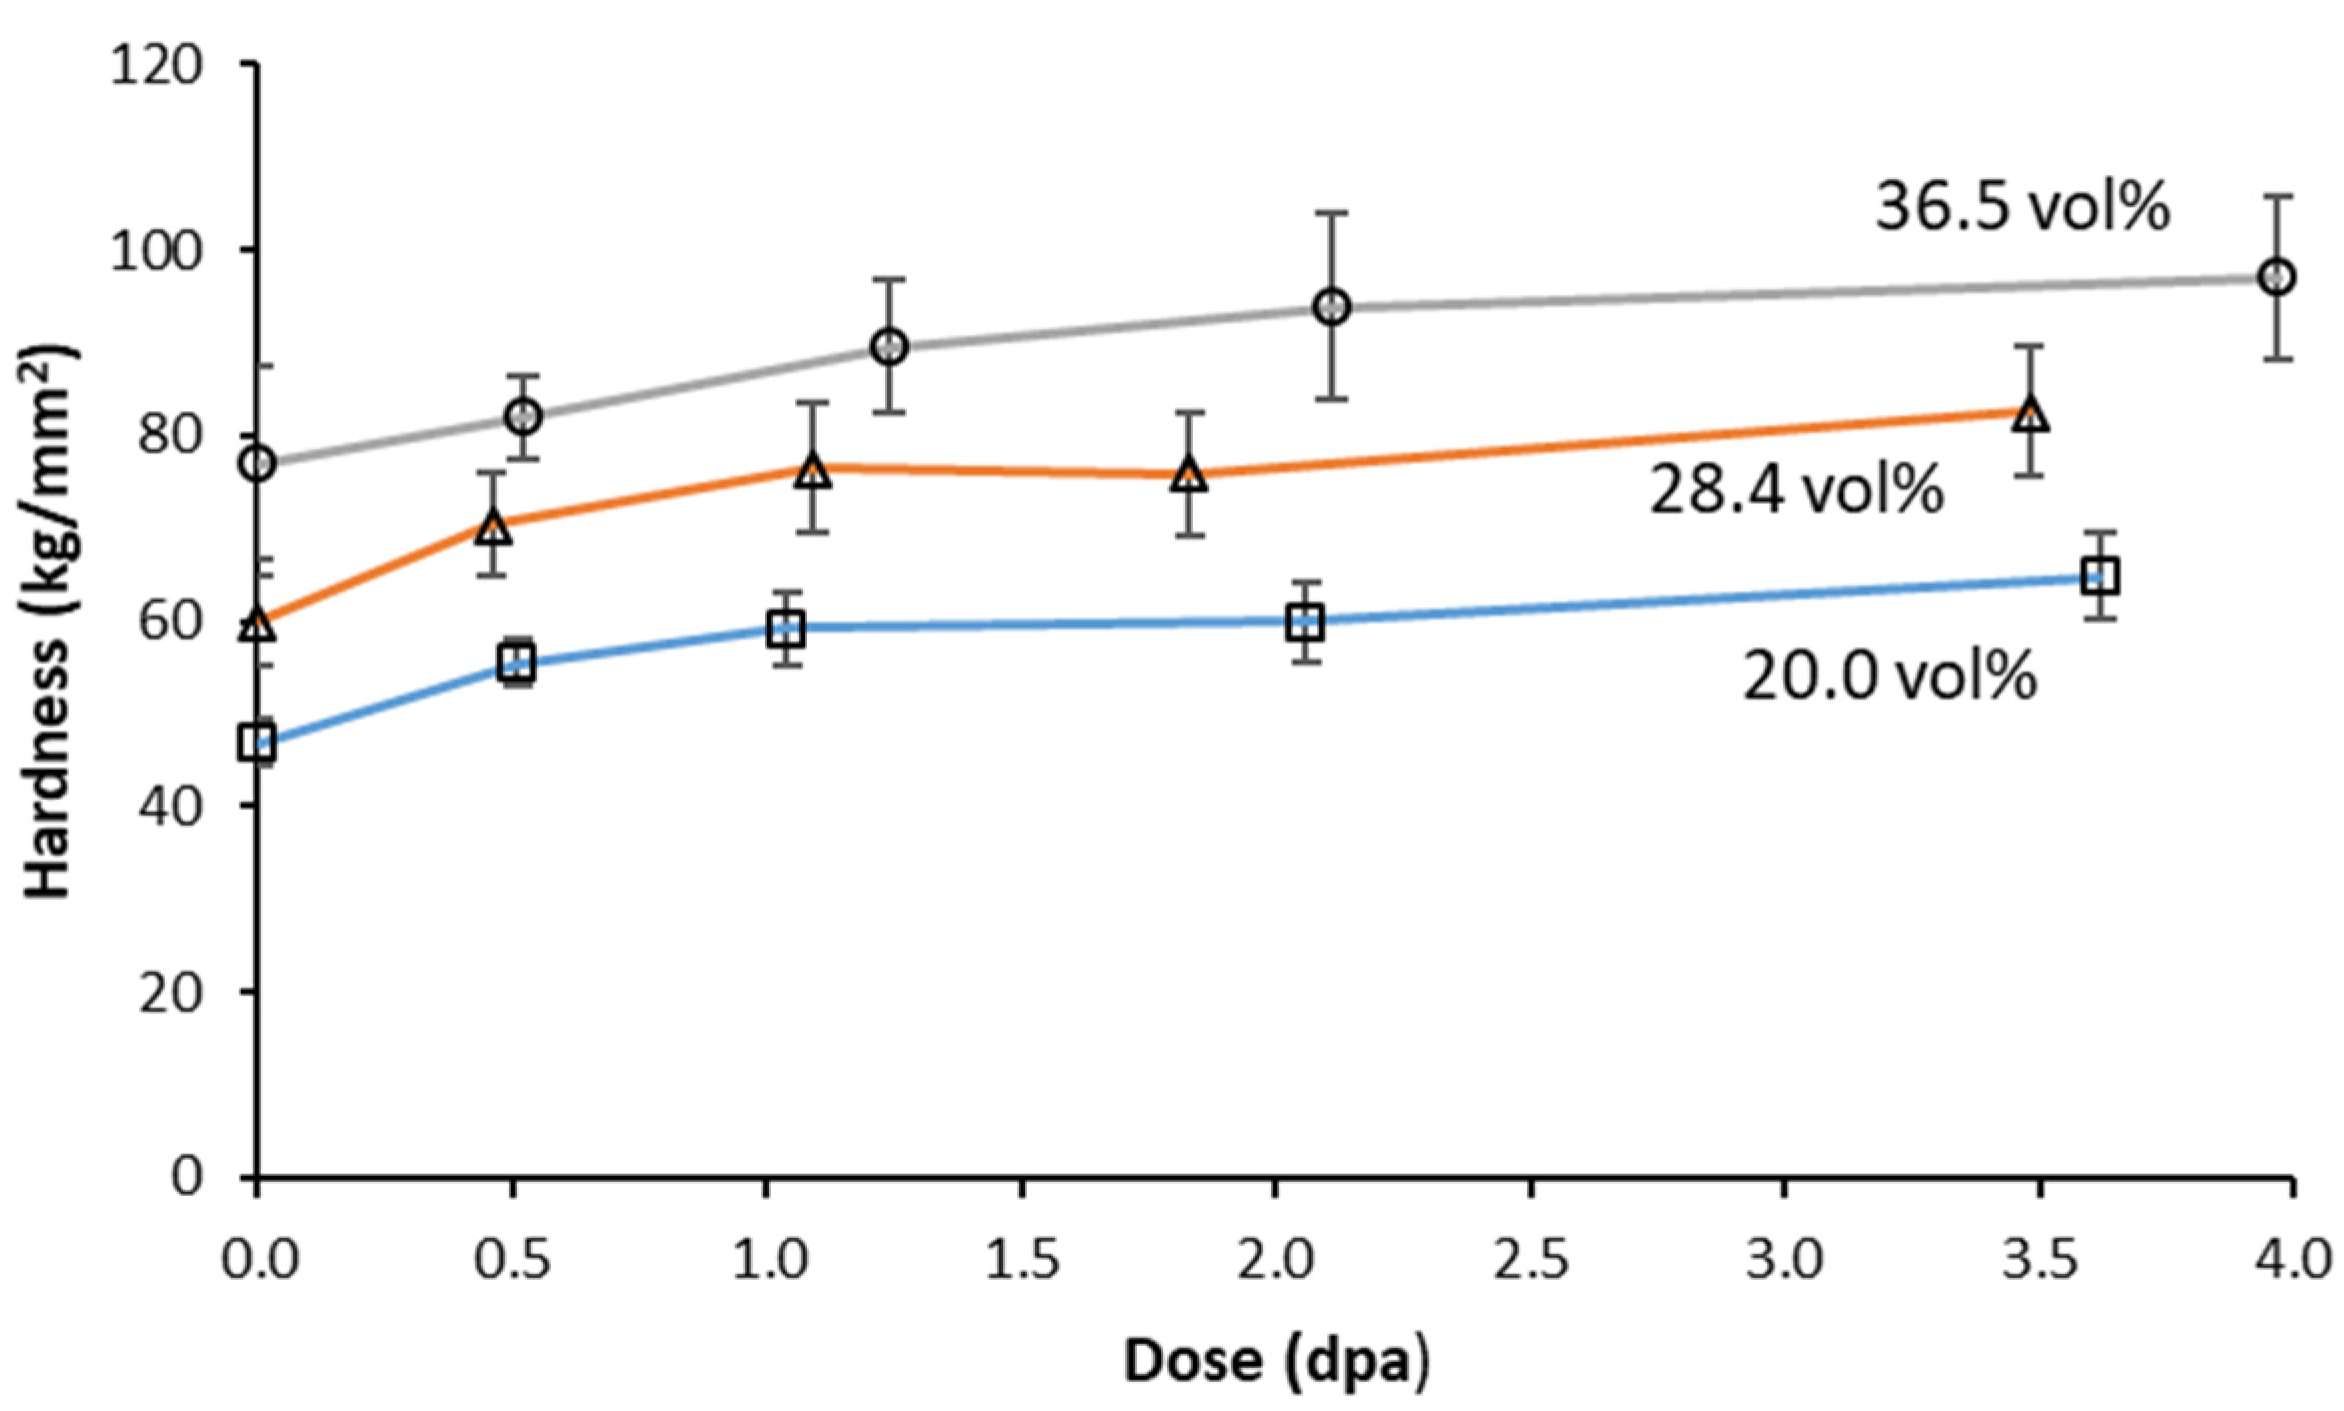
Figure 5.
Microhardness of the three MMCs as a function of dose.
Figure 5.
Microhardness of the three MMCs as a function of dose.
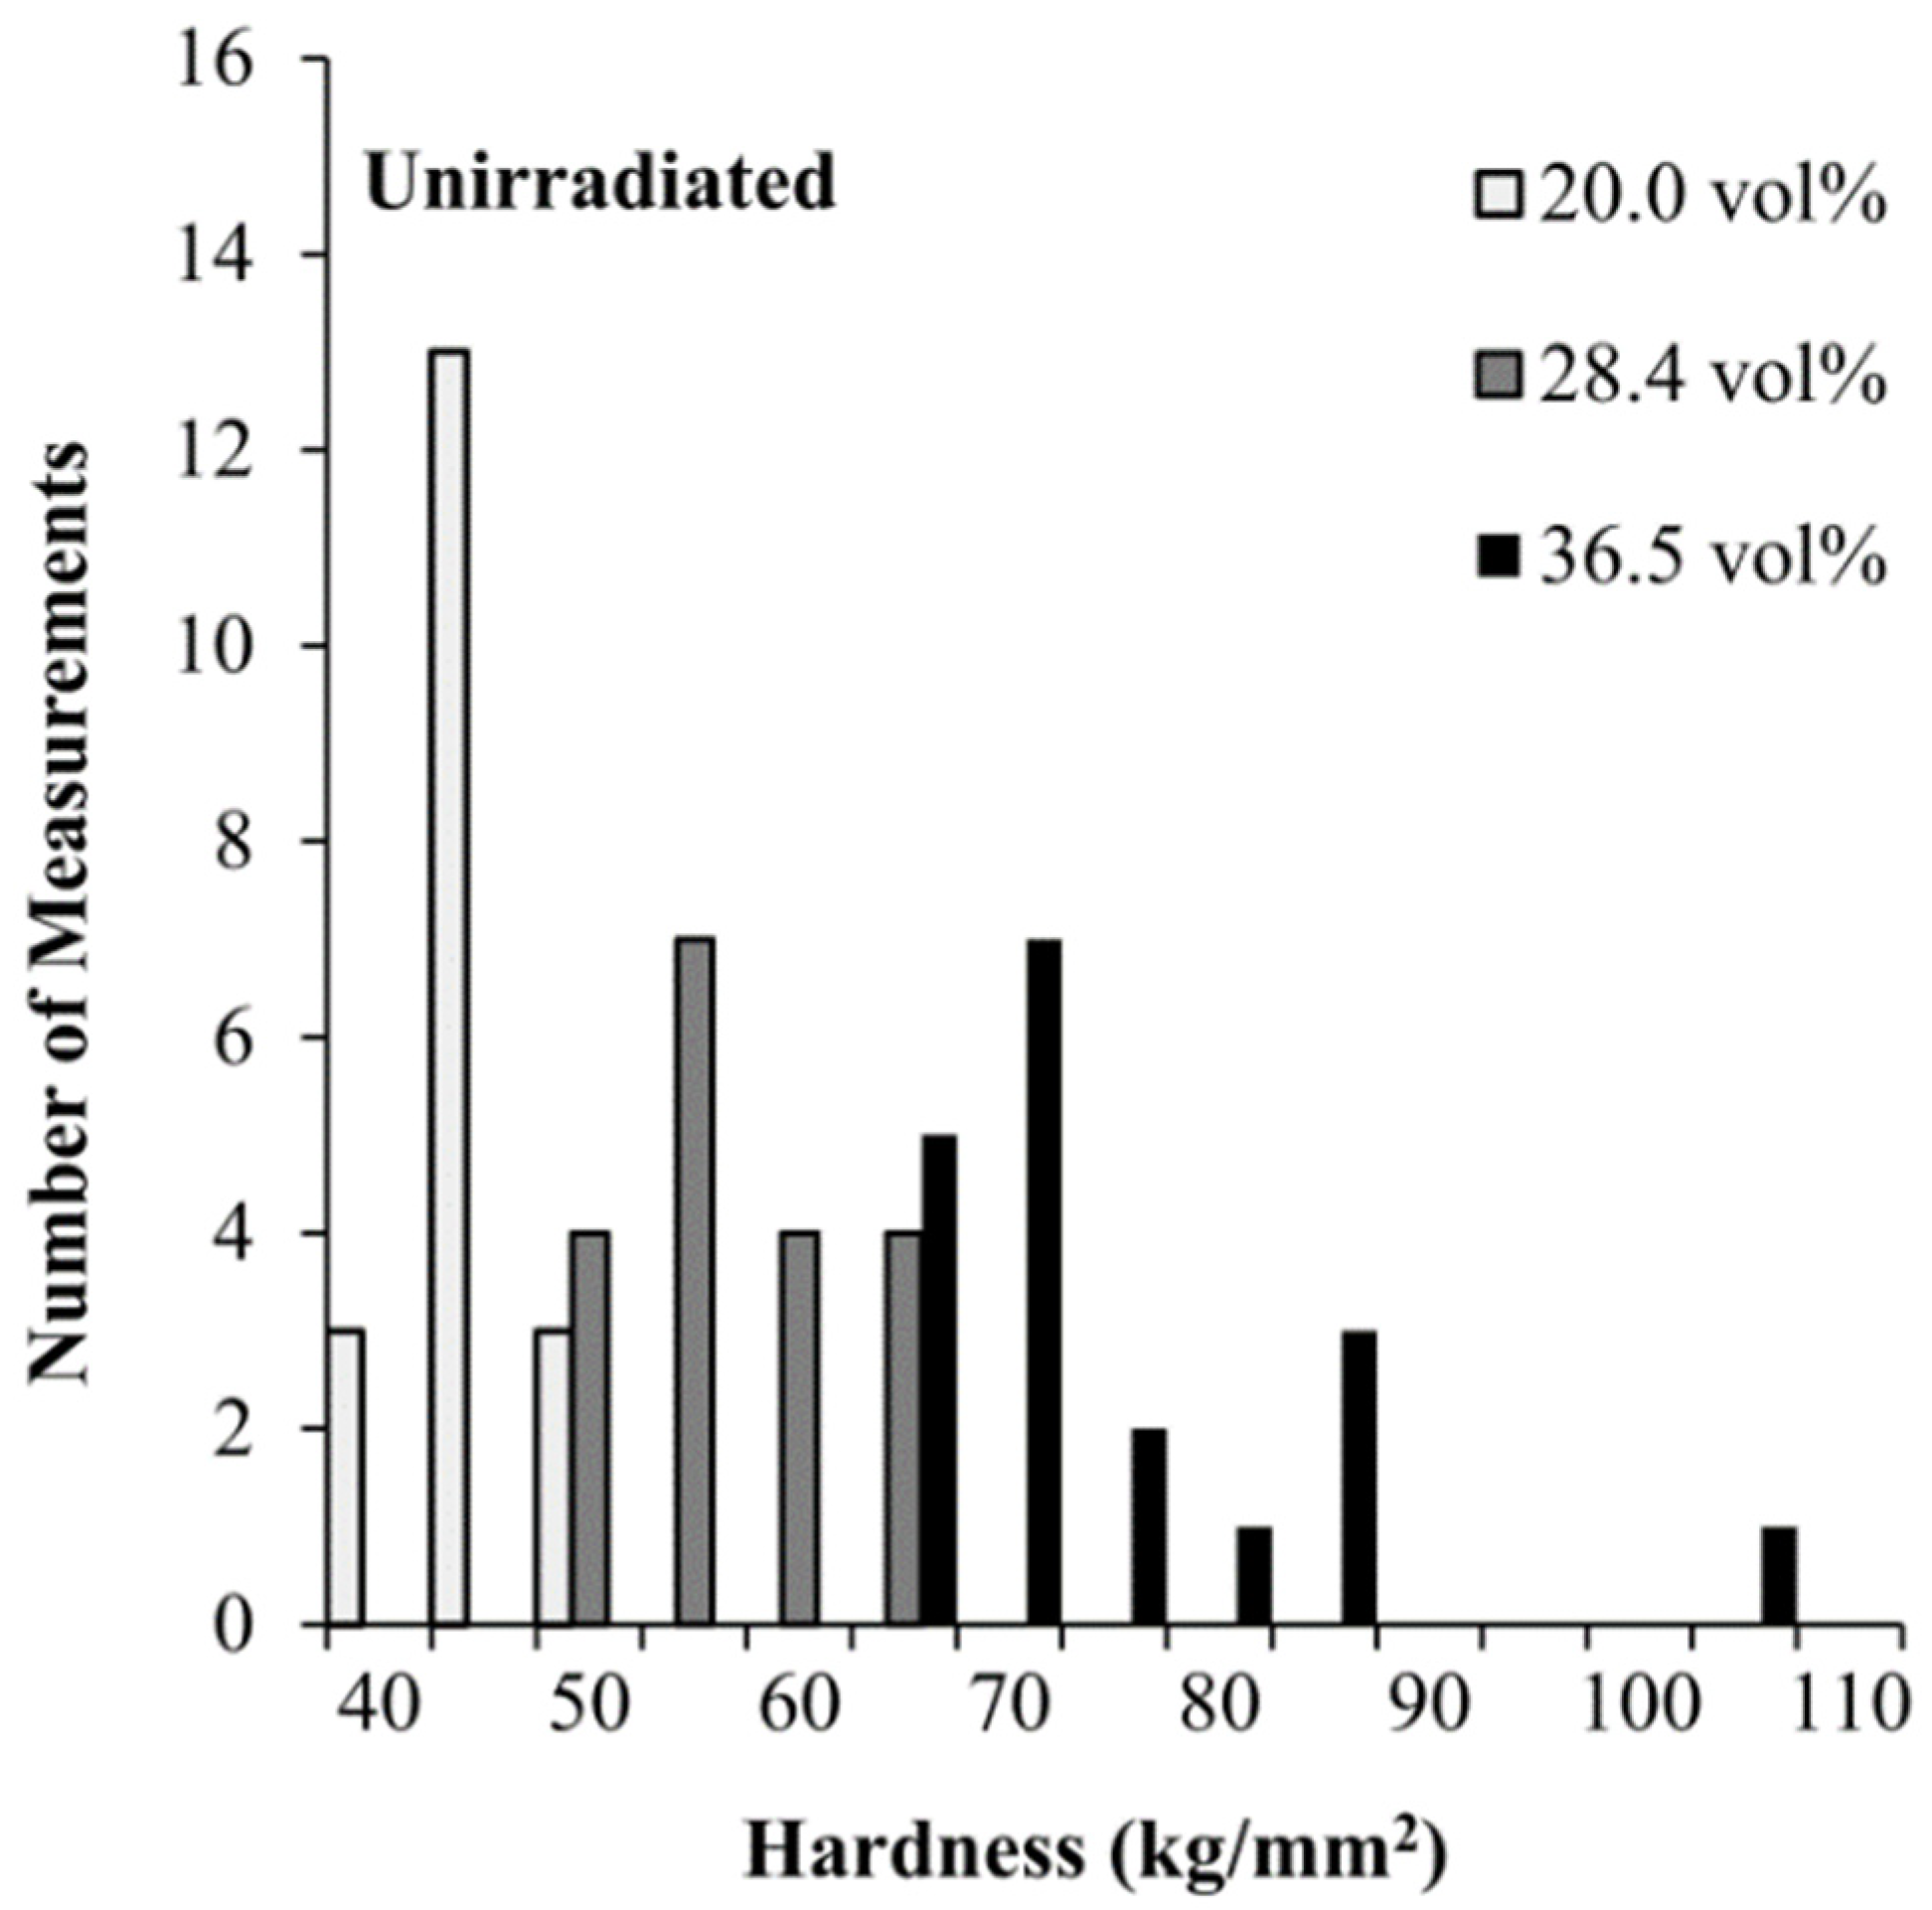
Figure 6.
Microhardness frequency distributions for the three MMC variants.
Figure 6.
Microhardness frequency distributions for the three MMC variants.
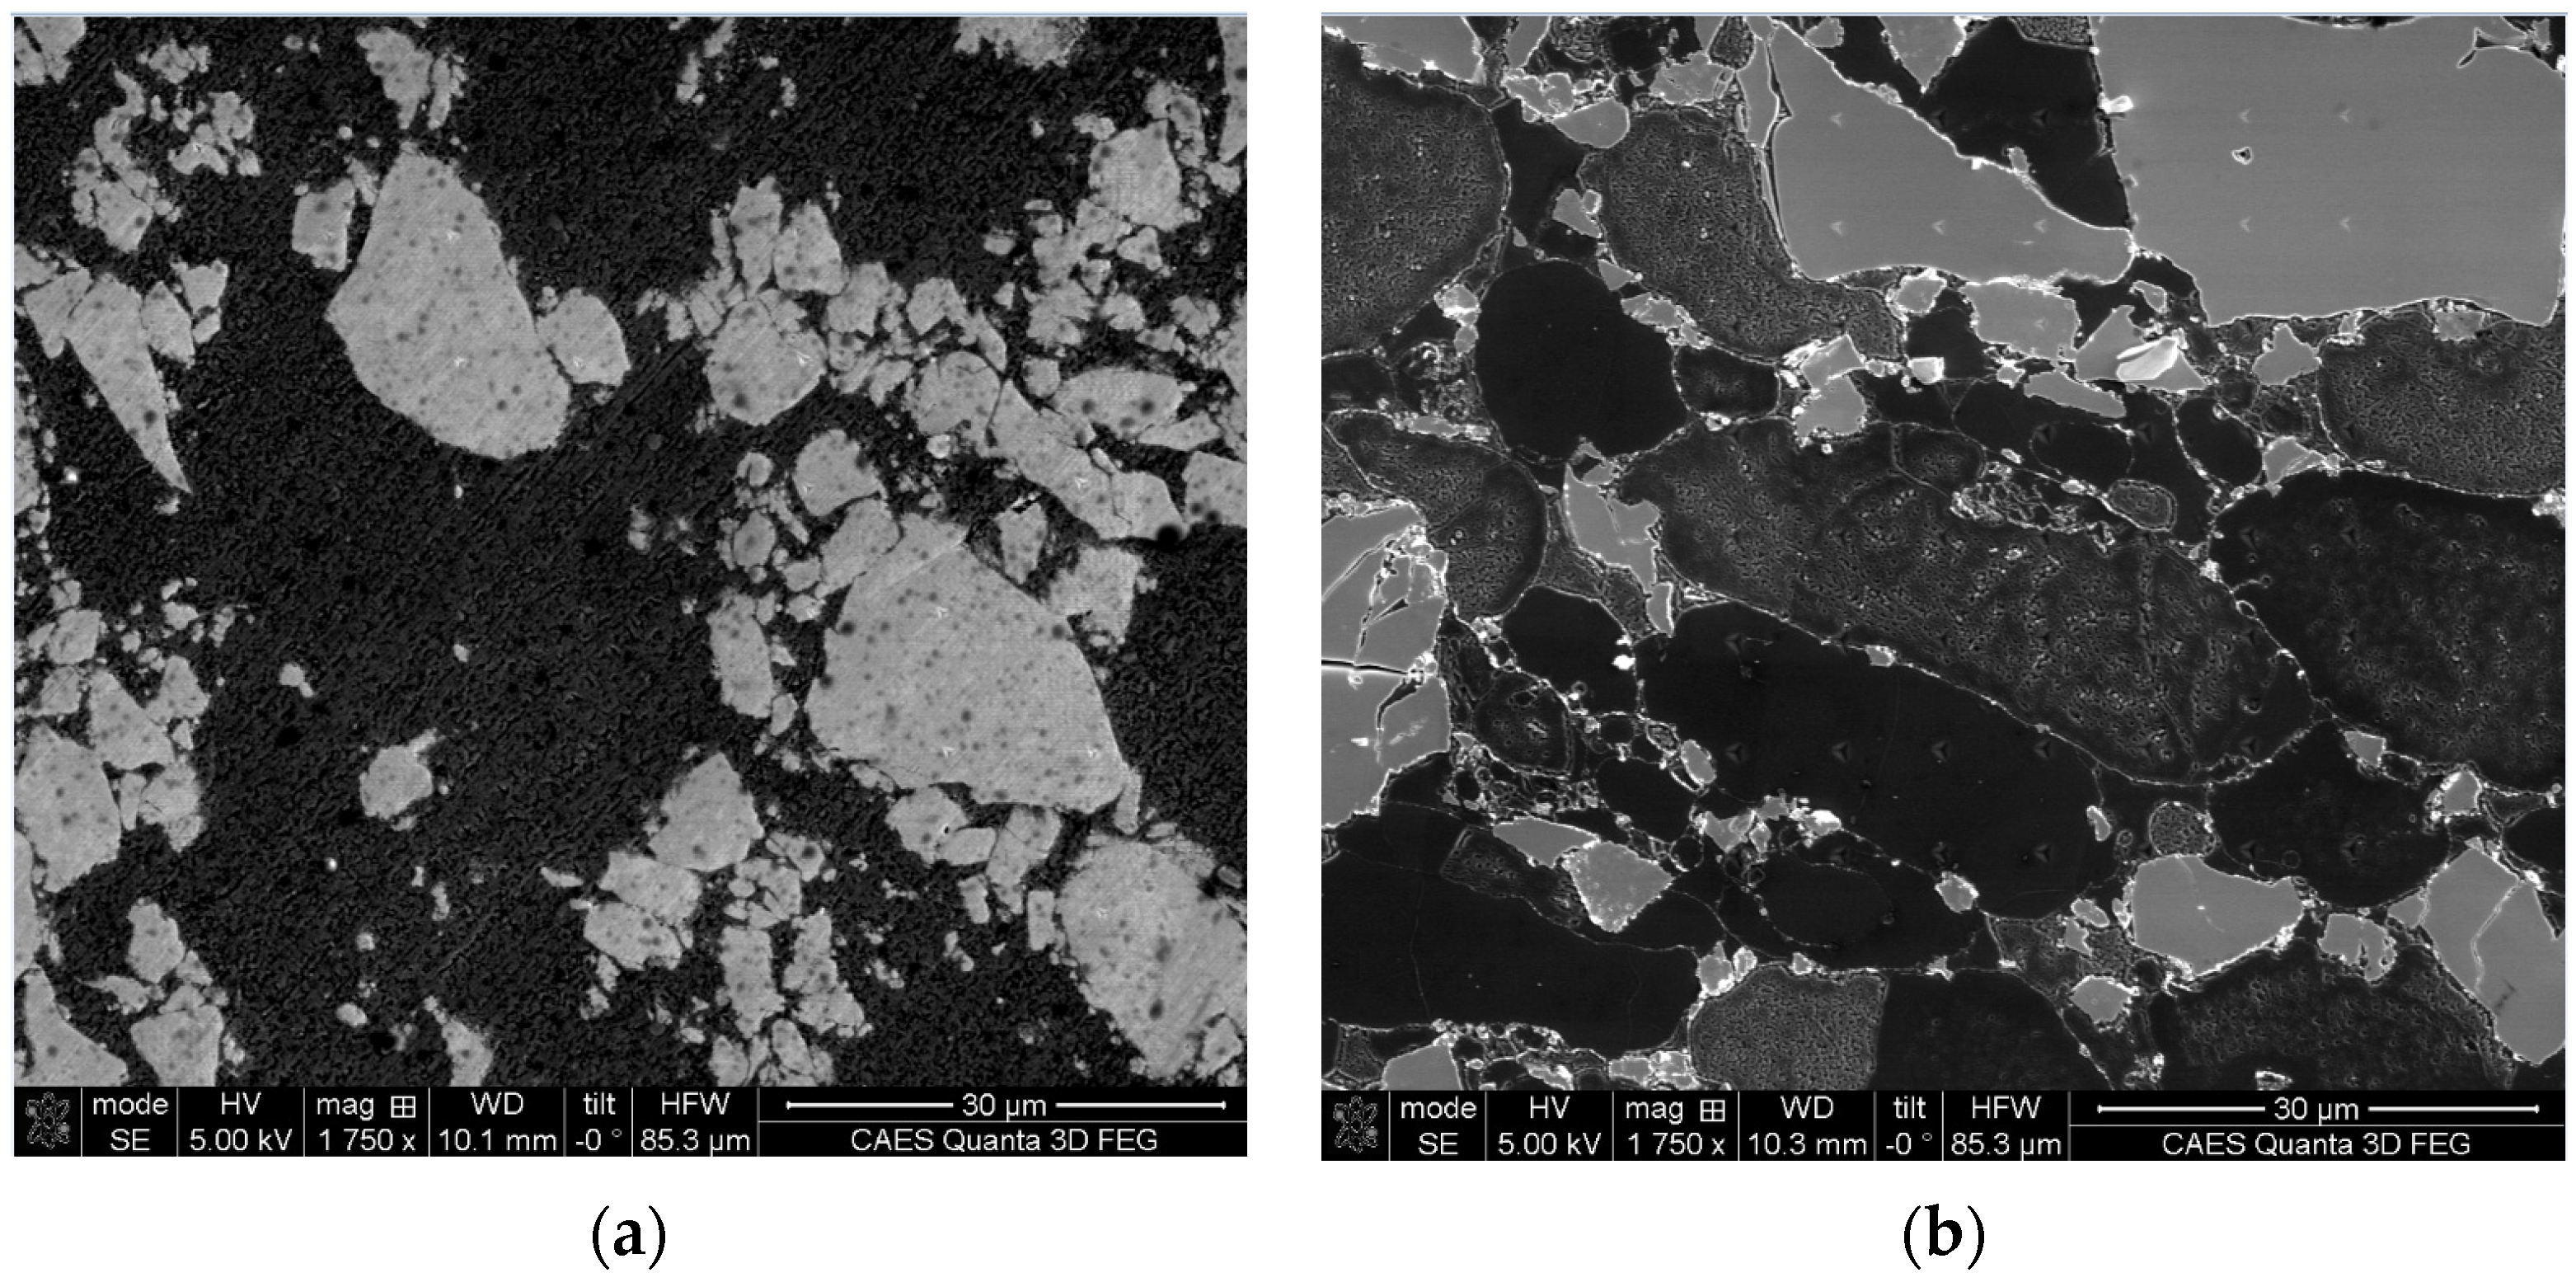
Figure 7.
Microstructure of (a) 36.5 vol% unirradiated, and (b) 28.4 vol% neutron irradiated specimens used for nanoindentation.
Figure 7.
Microstructure of (a) 36.5 vol% unirradiated, and (b) 28.4 vol% neutron irradiated specimens used for nanoindentation.
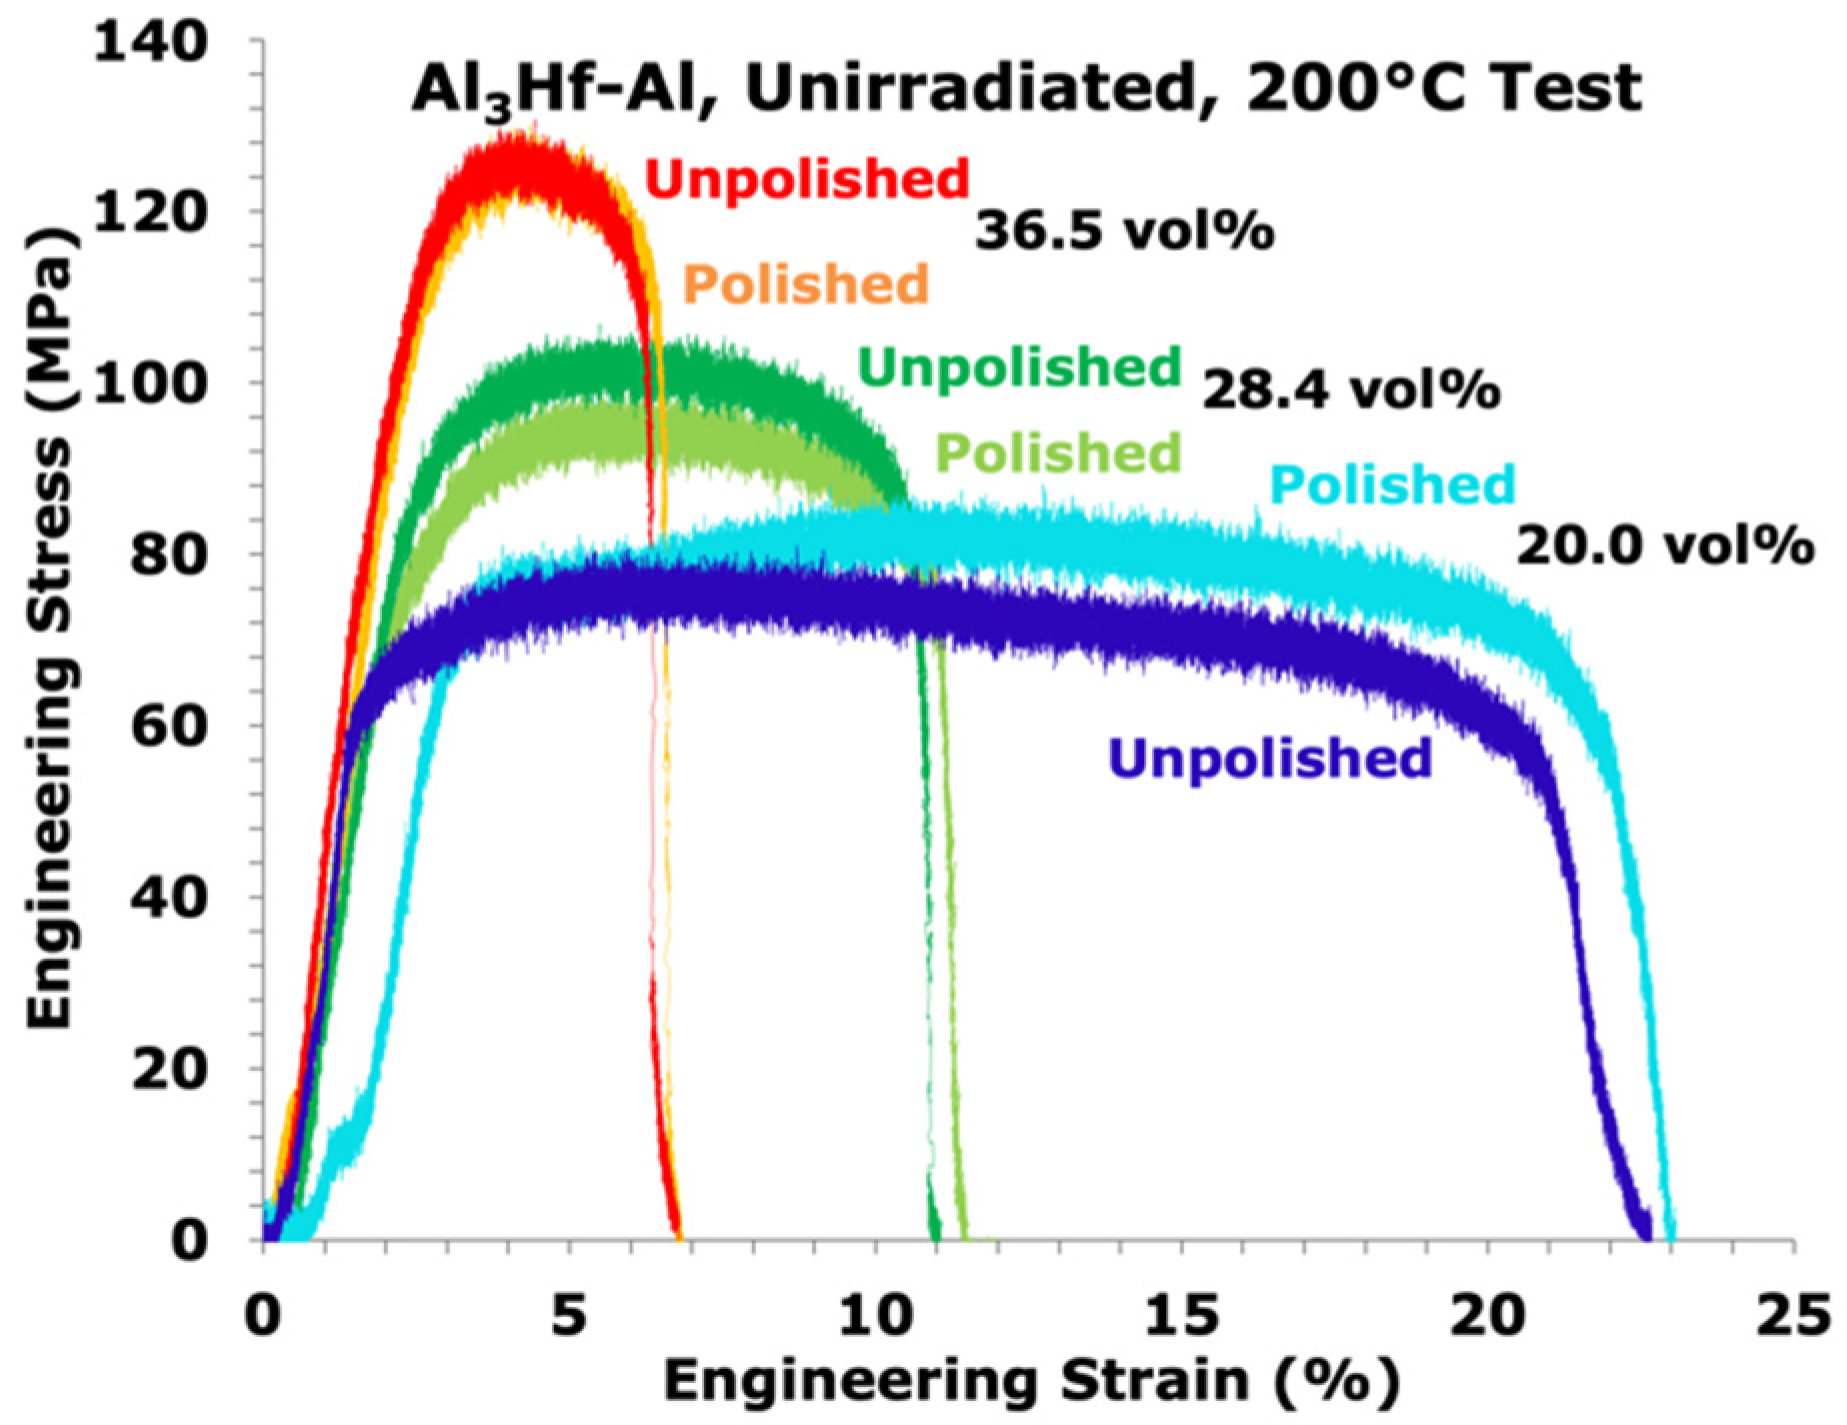
Figure 8.
Engineering stress-strain curves of unpolished and polished unirradiated Al3Hf-Al specimens at 200 °C.
Figure 8.
Engineering stress-strain curves of unpolished and polished unirradiated Al3Hf-Al specimens at 200 °C.
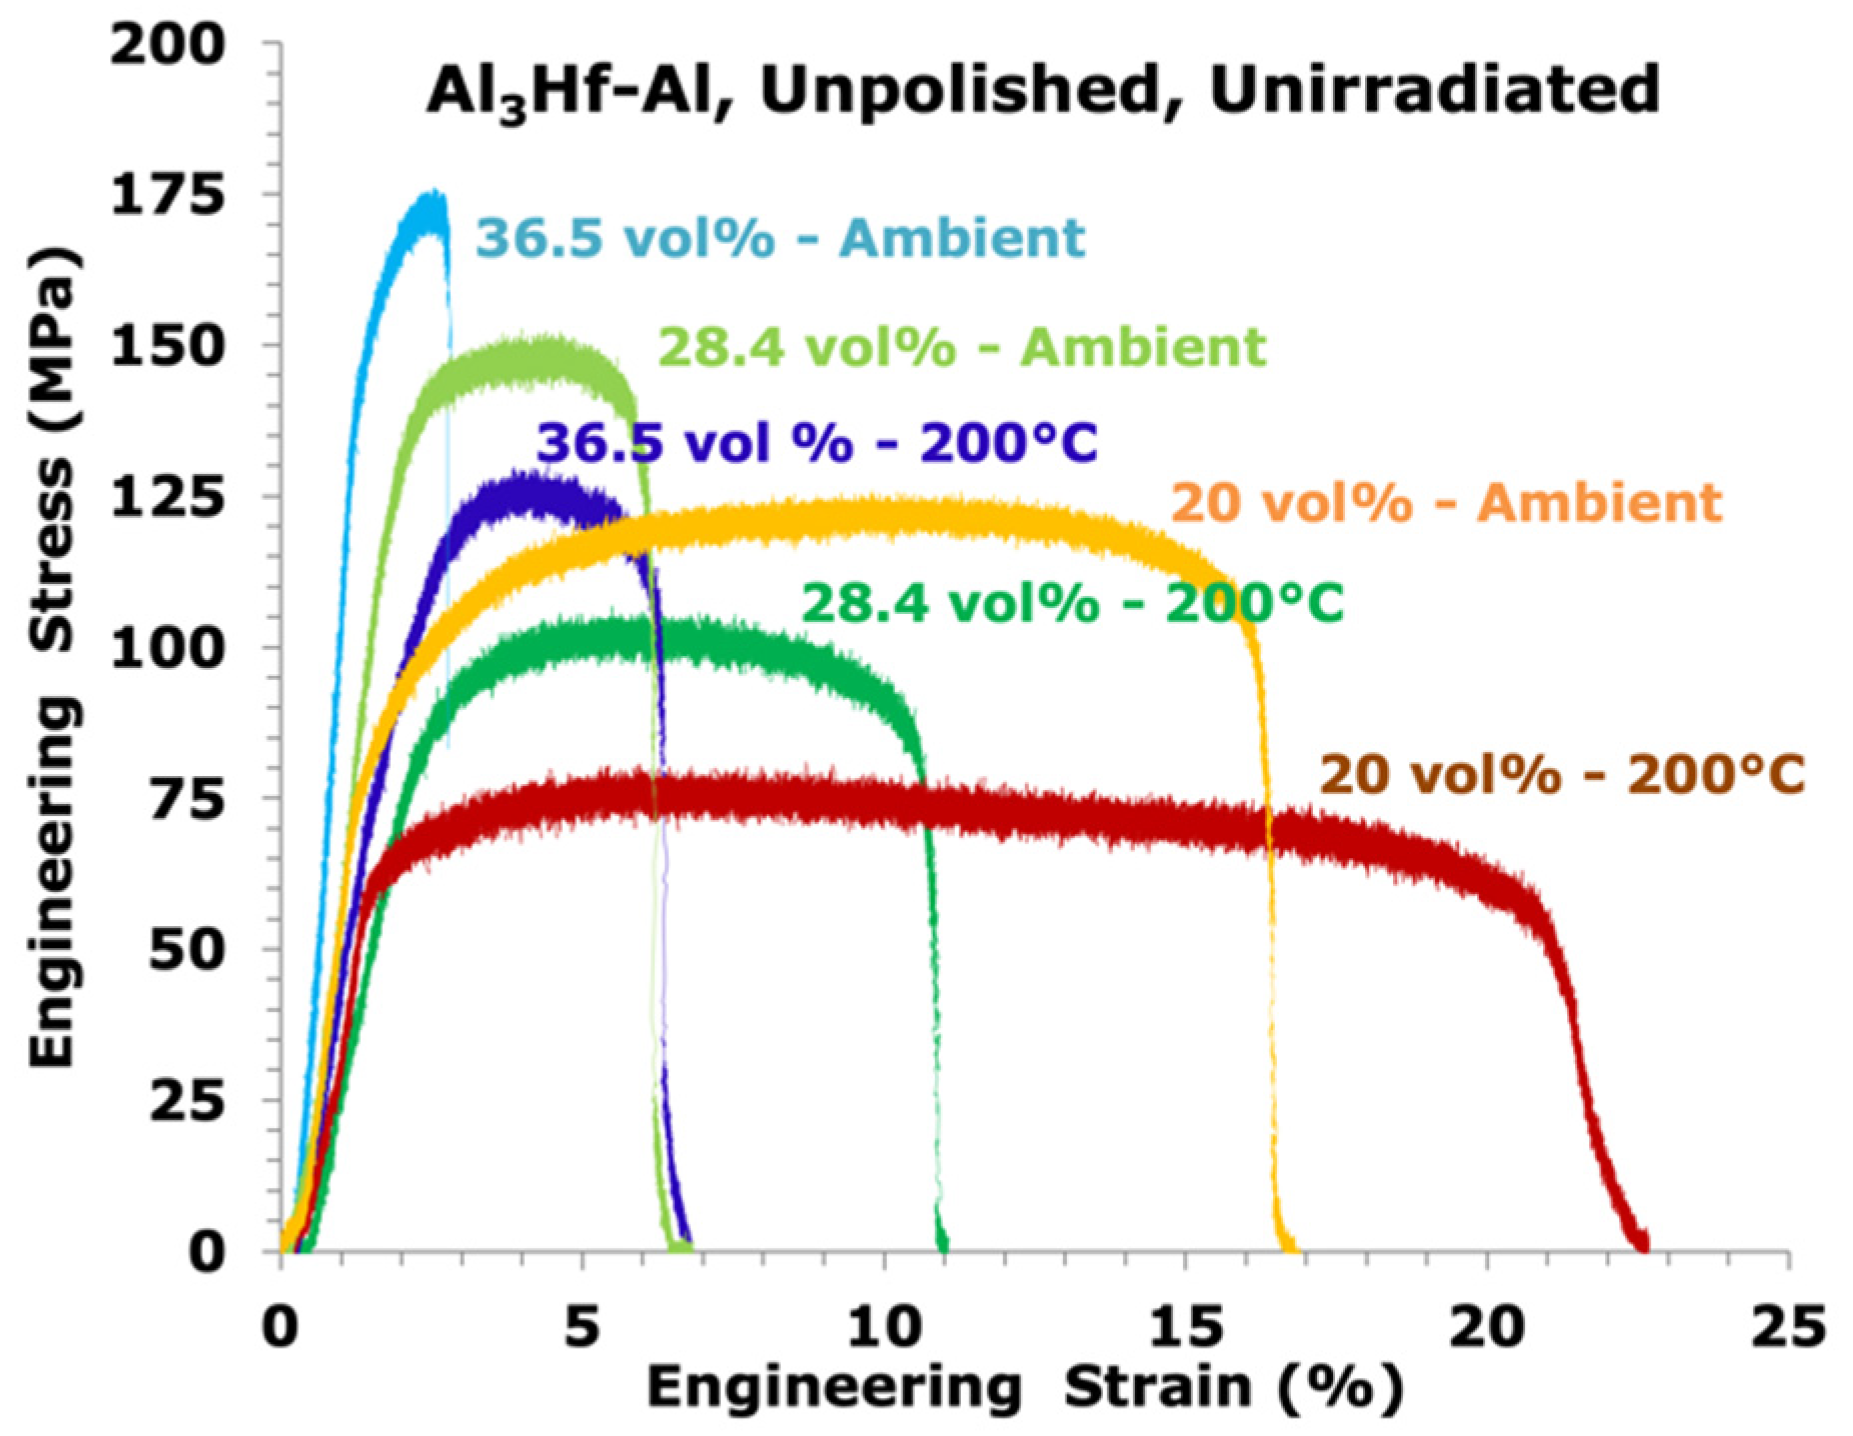
Figure 9.
Engineering stress vs. strain curves of Al3Hf-Al as a function of Al3Hf volume fraction for the unirradiated specimens.
Figure 9.
Engineering stress vs. strain curves of Al3Hf-Al as a function of Al3Hf volume fraction for the unirradiated specimens.
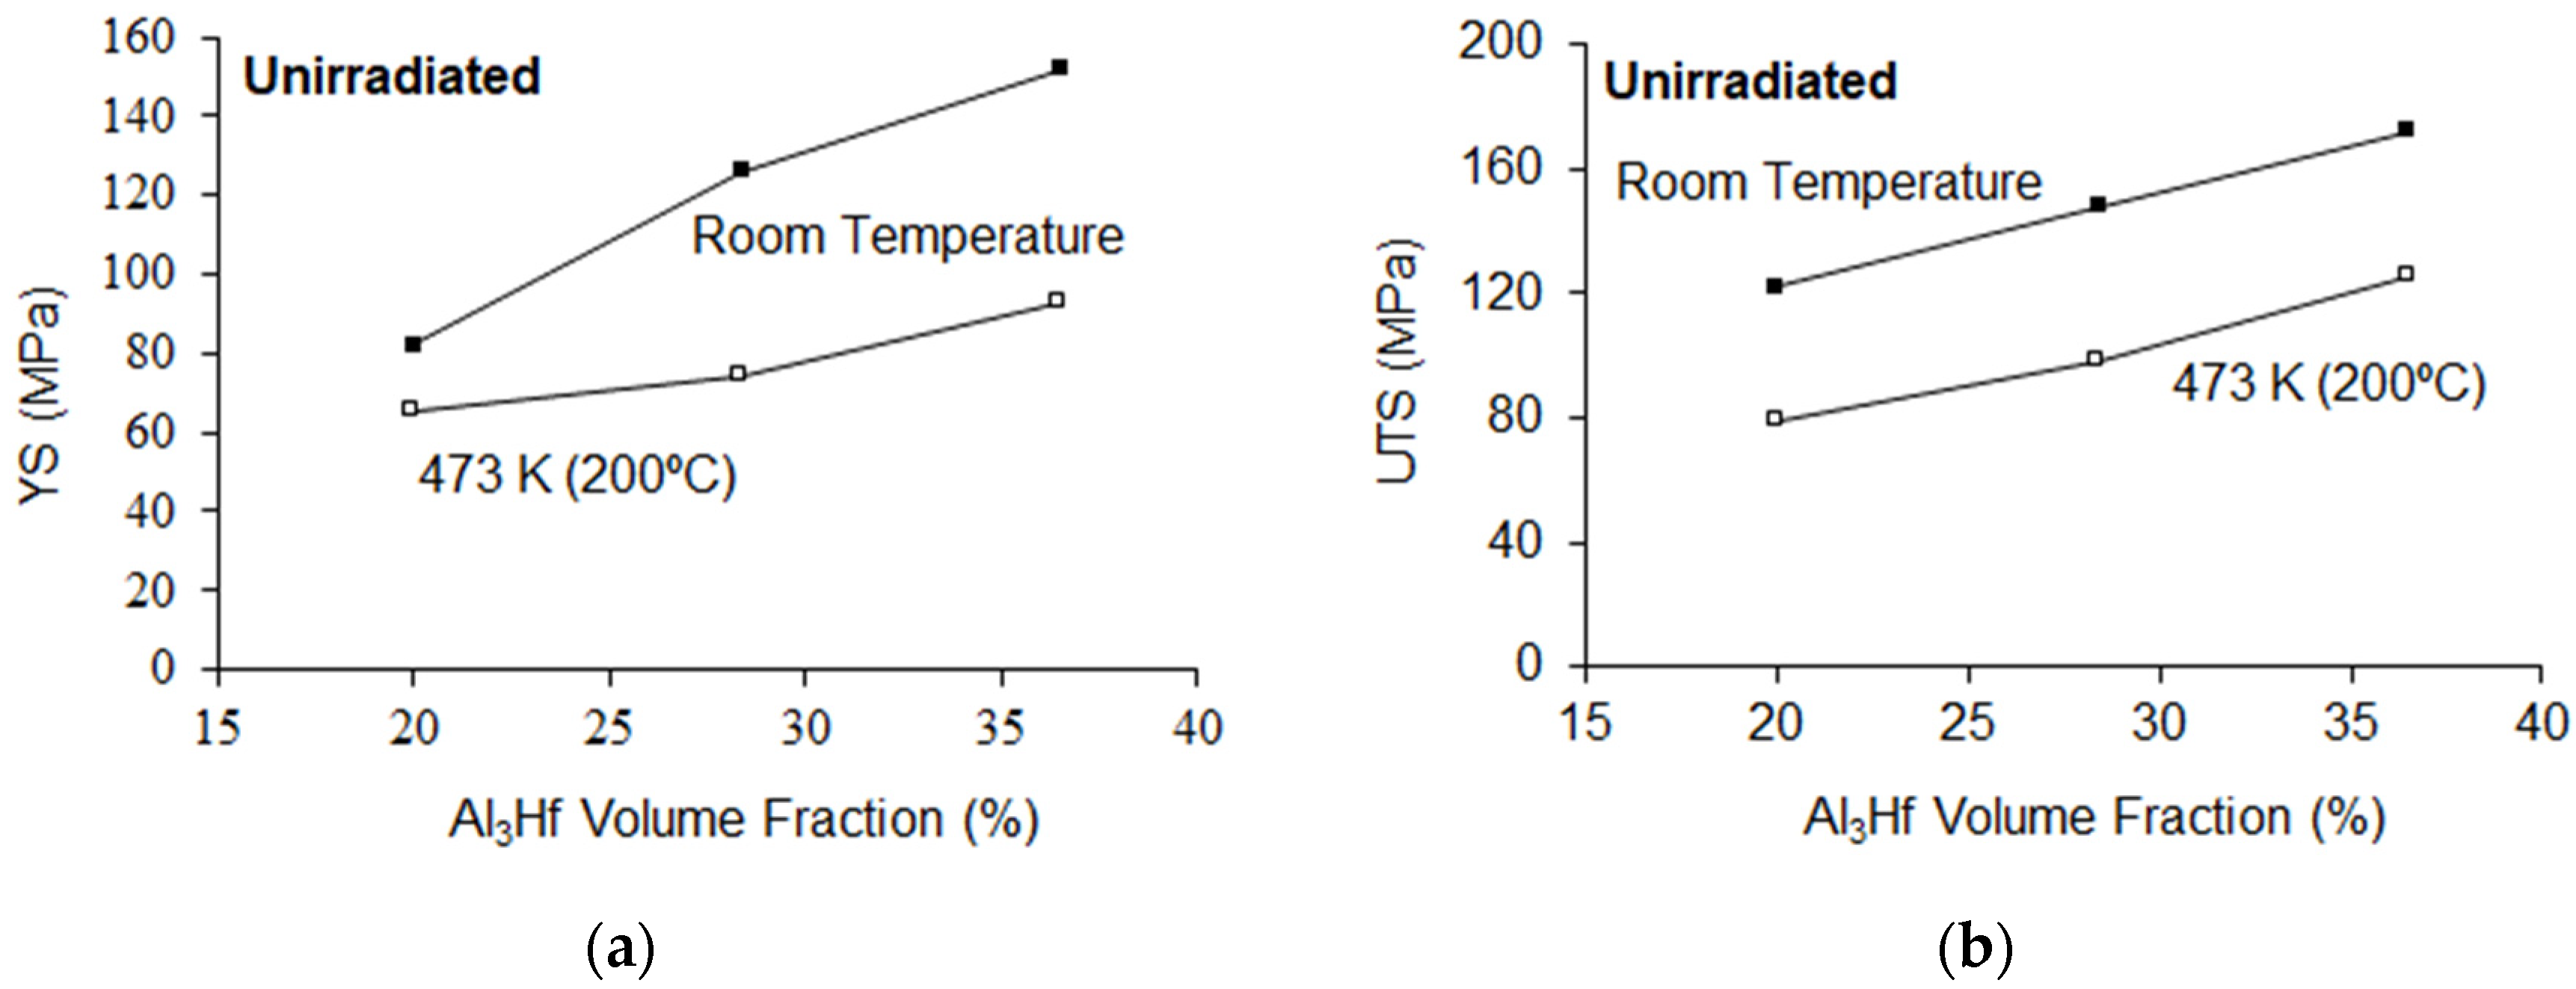
Figure 10.
Al3Hf-Al samples (a) YS and (b) UTS as a function of test temperature for the unirradiated condition.
Figure 10.
Al3Hf-Al samples (a) YS and (b) UTS as a function of test temperature for the unirradiated condition.
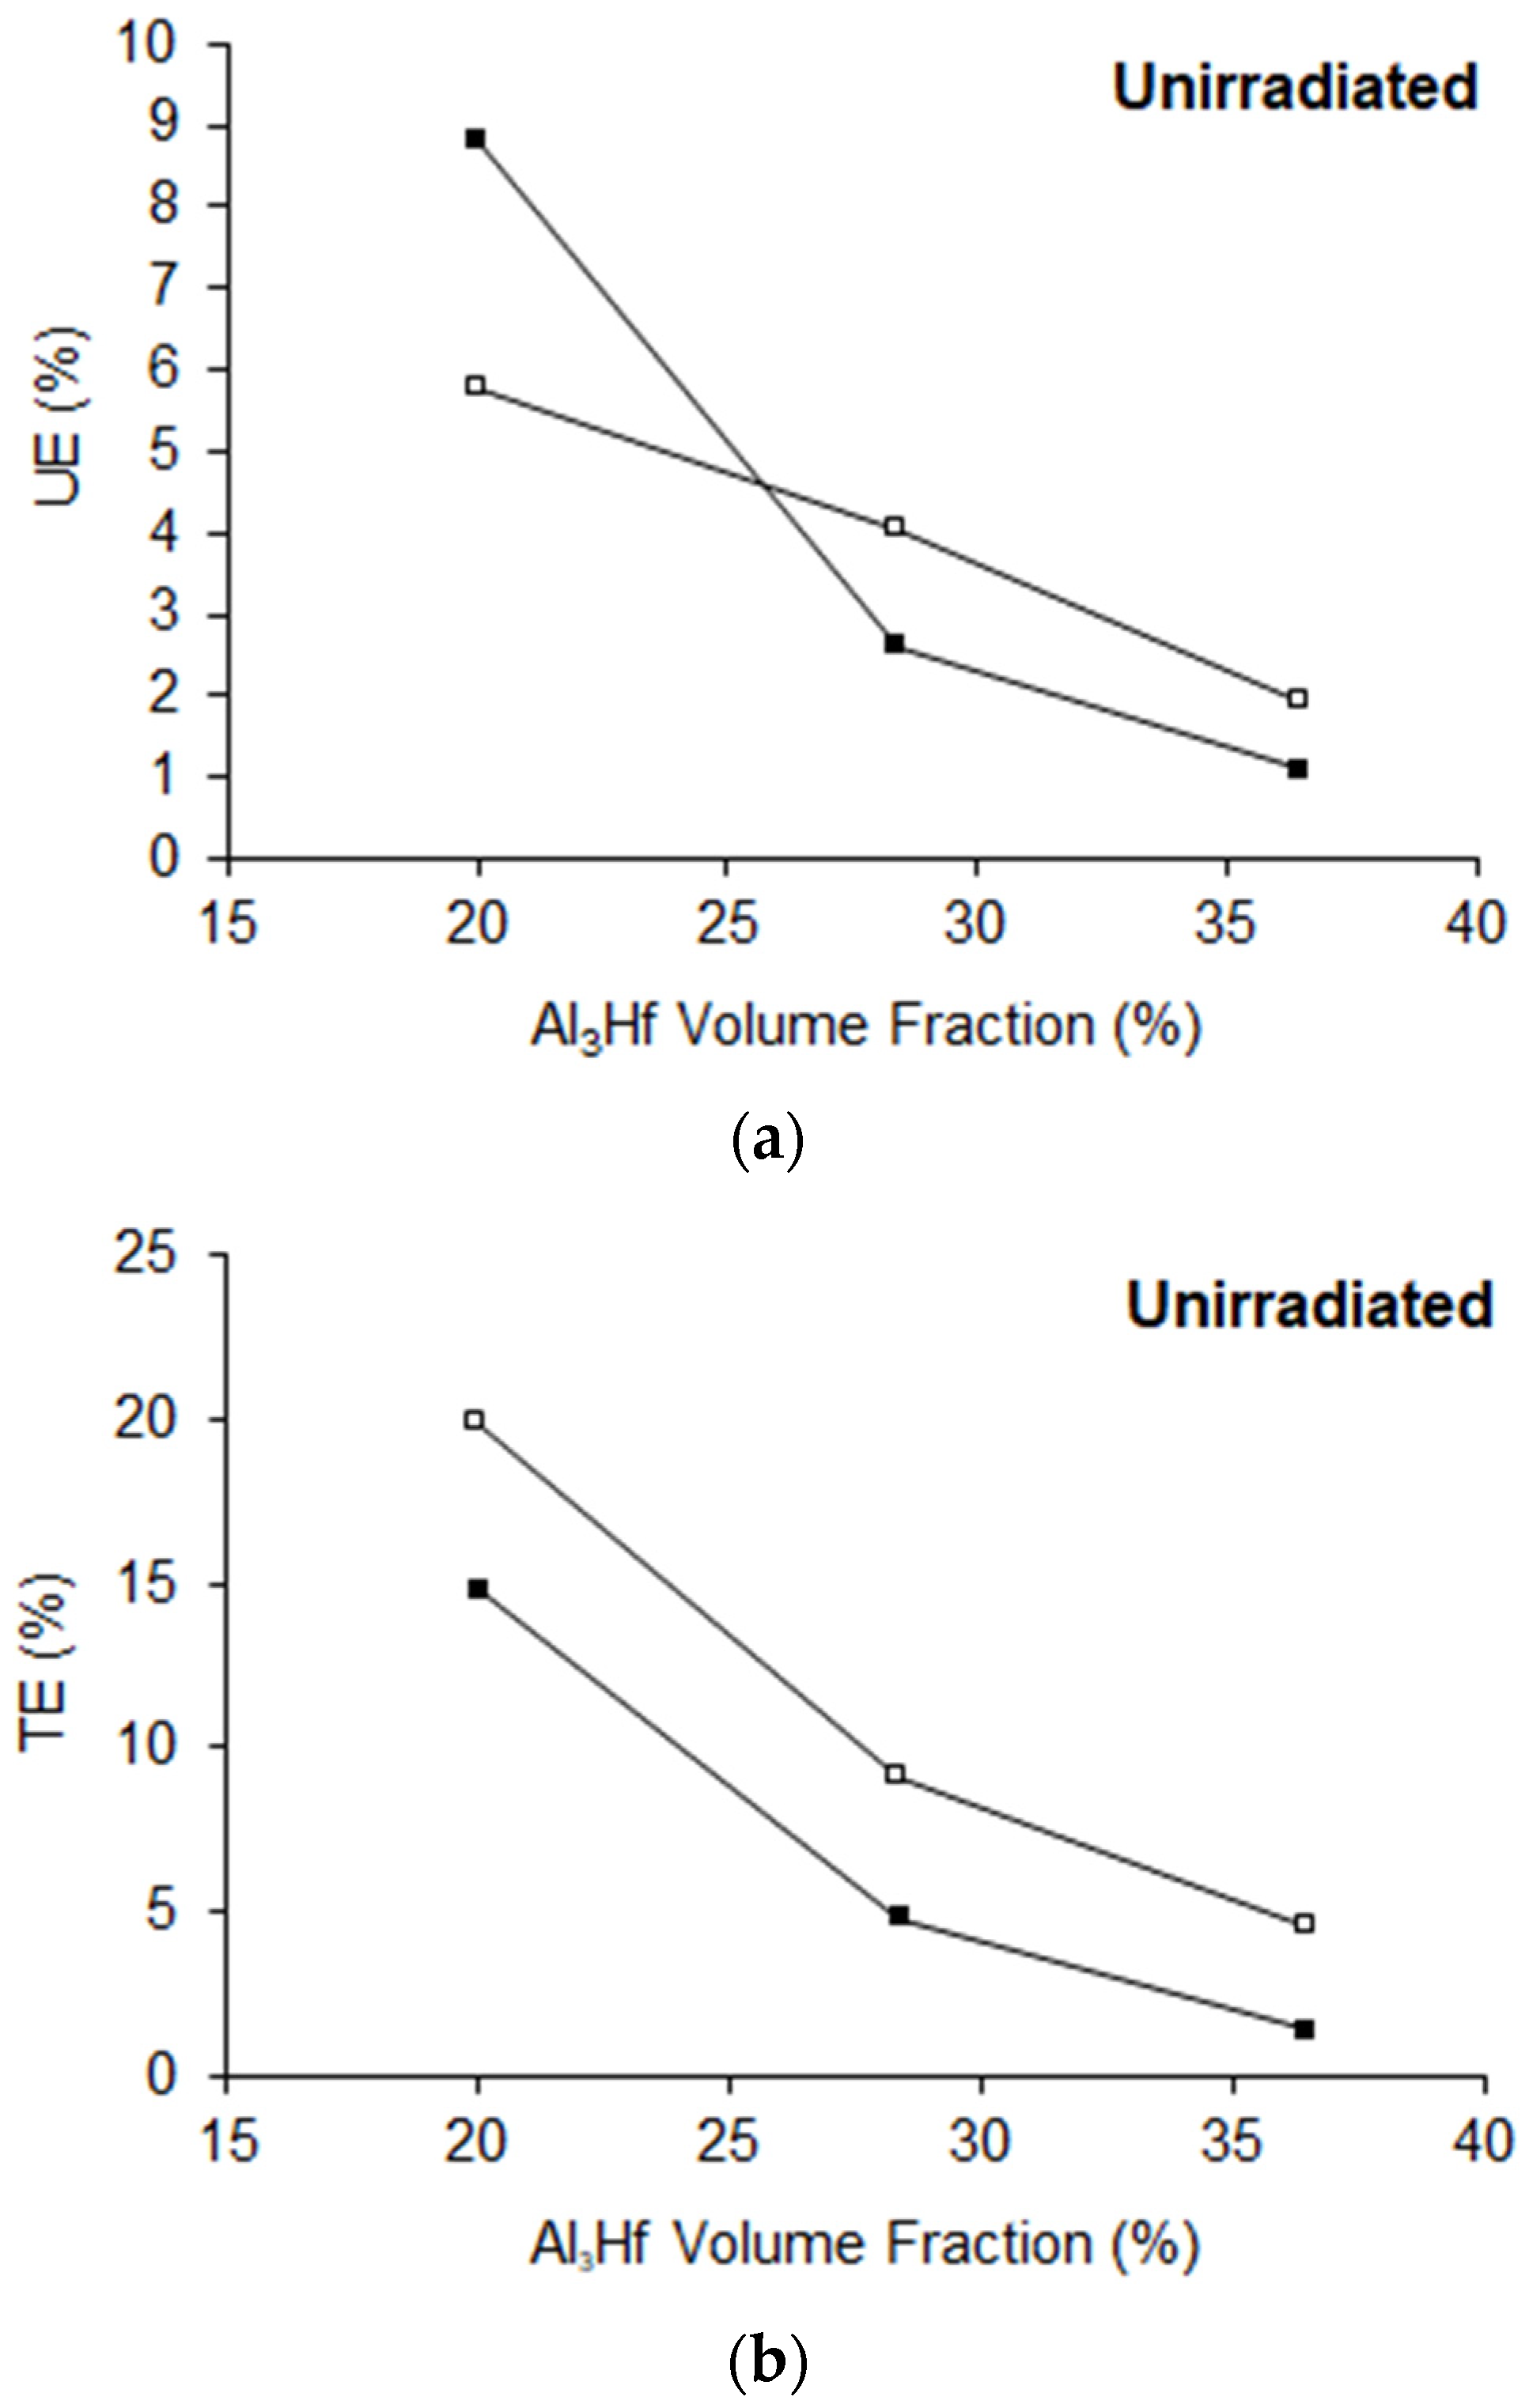
Figure 11.
Al3Hf-Al samples (a) UE and (b) TE as a function of temperature for the unirradiated condition. NOTE: Filled symbol represents RT tests and unfilled symbol represents 200 °C tests.
Figure 11.
Al3Hf-Al samples (a) UE and (b) TE as a function of temperature for the unirradiated condition. NOTE: Filled symbol represents RT tests and unfilled symbol represents 200 °C tests.
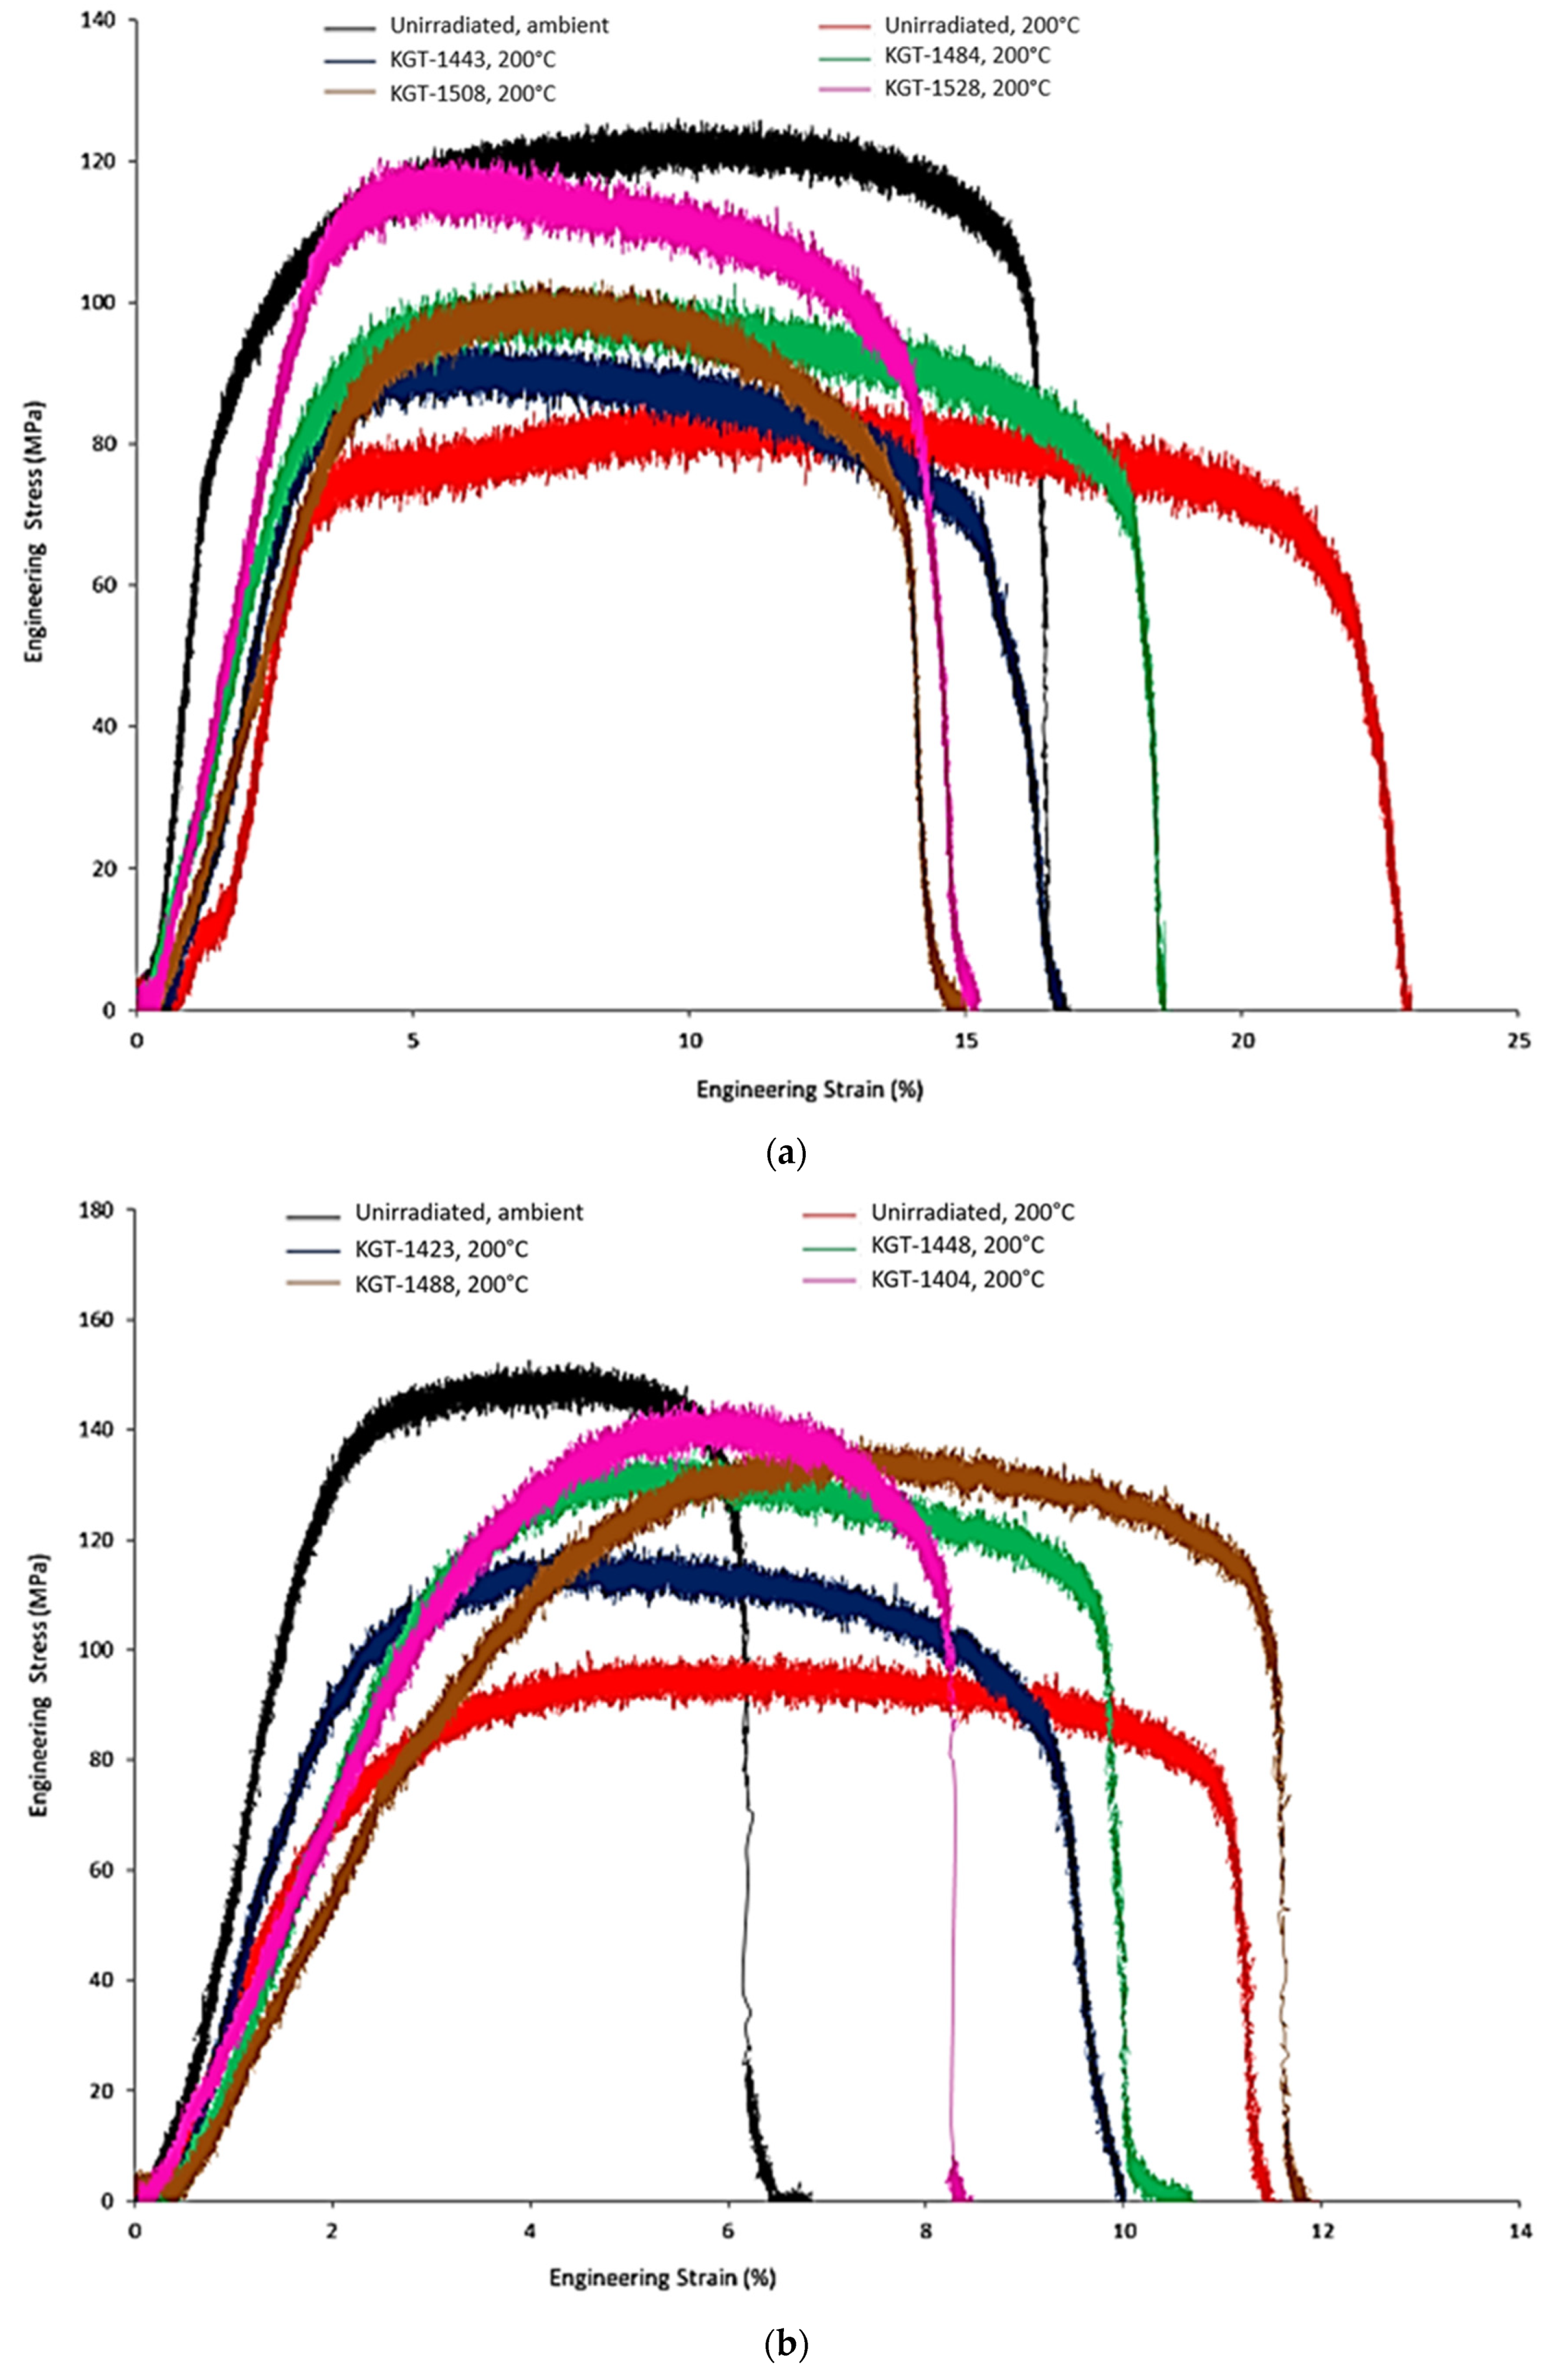
Figure 12.
Engineering stress vs. strain curves of Al3Hf-Al as a function of Al3Hf volume fraction, test temperature and KGT identifier (a) 20.0 vol%, (b) 28.4 vol%, and (c) 36.5 vol%.
Figure 12.
Engineering stress vs. strain curves of Al3Hf-Al as a function of Al3Hf volume fraction, test temperature and KGT identifier (a) 20.0 vol%, (b) 28.4 vol%, and (c) 36.5 vol%.
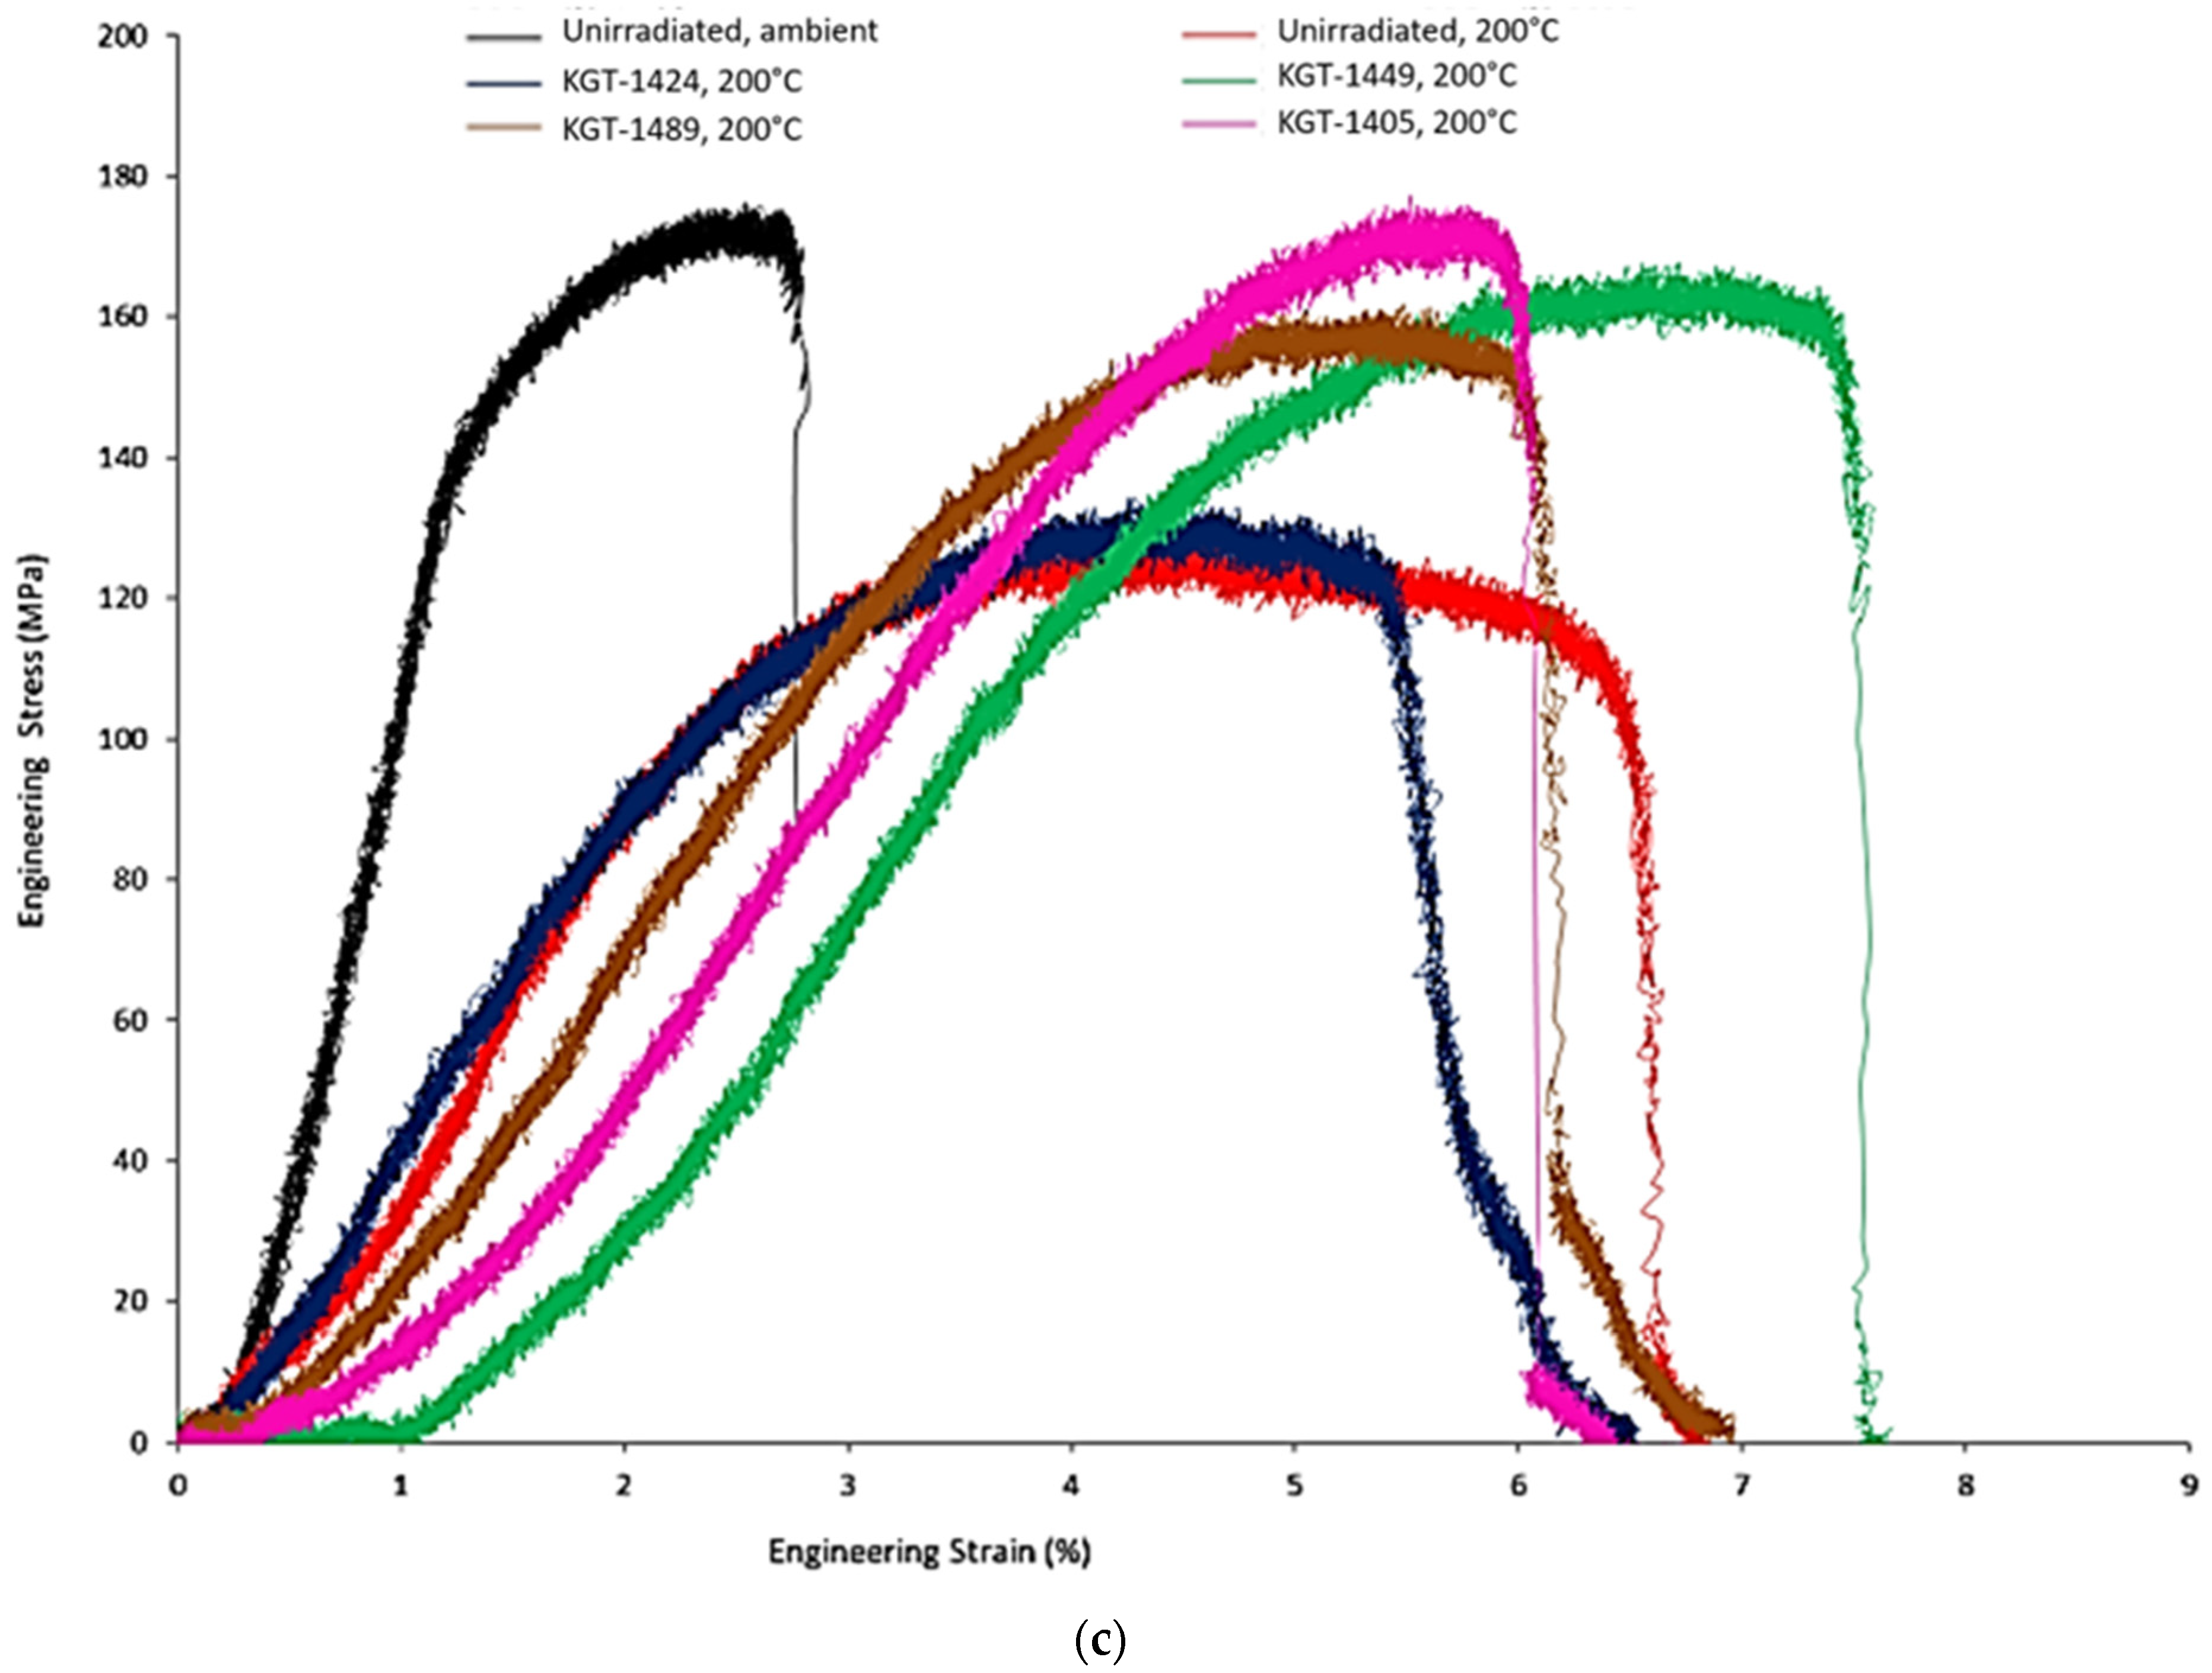
Figure 13.
(a) YS and (b) UTS at 200 °C of the irradiated Al3Hf-Al materials as a function of dose.
Figure 13.
(a) YS and (b) UTS at 200 °C of the irradiated Al3Hf-Al materials as a function of dose.
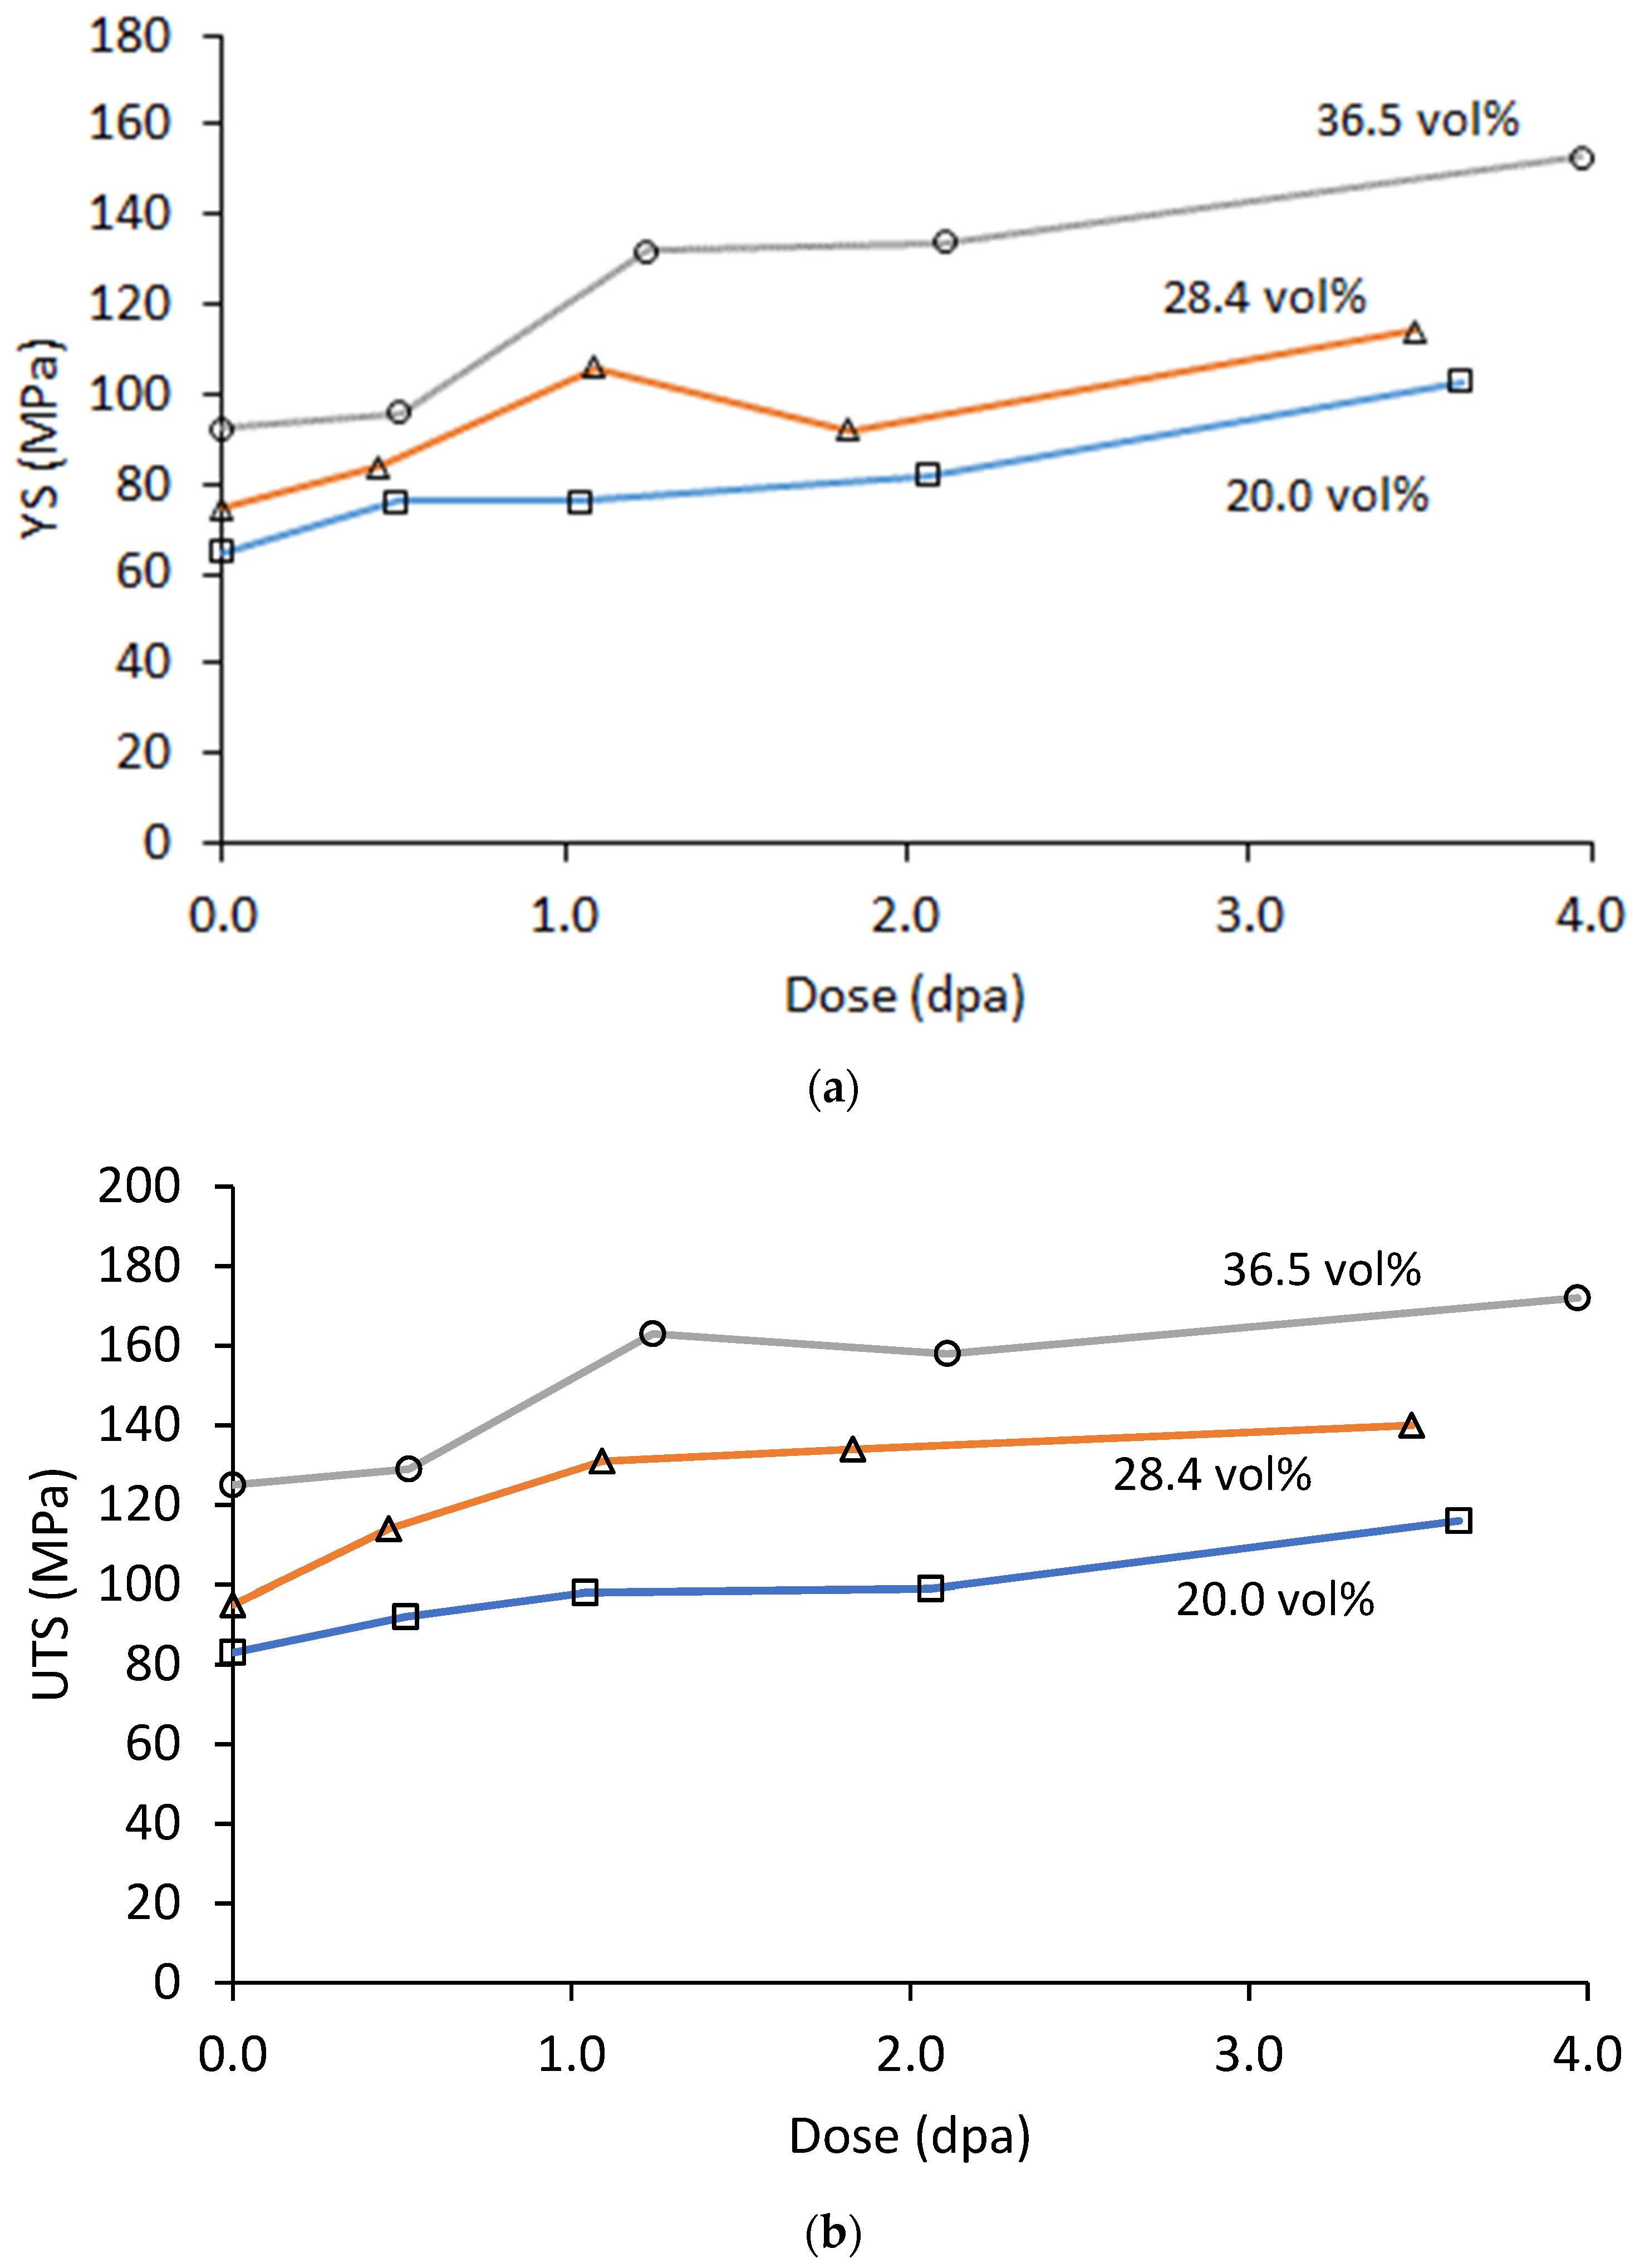
Figure 14.
(a) UE and (b) TE at 200 °C of the irradiated Al3Hf-Al materials as a function of dose.
Figure 14.
(a) UE and (b) TE at 200 °C of the irradiated Al3Hf-Al materials as a function of dose.
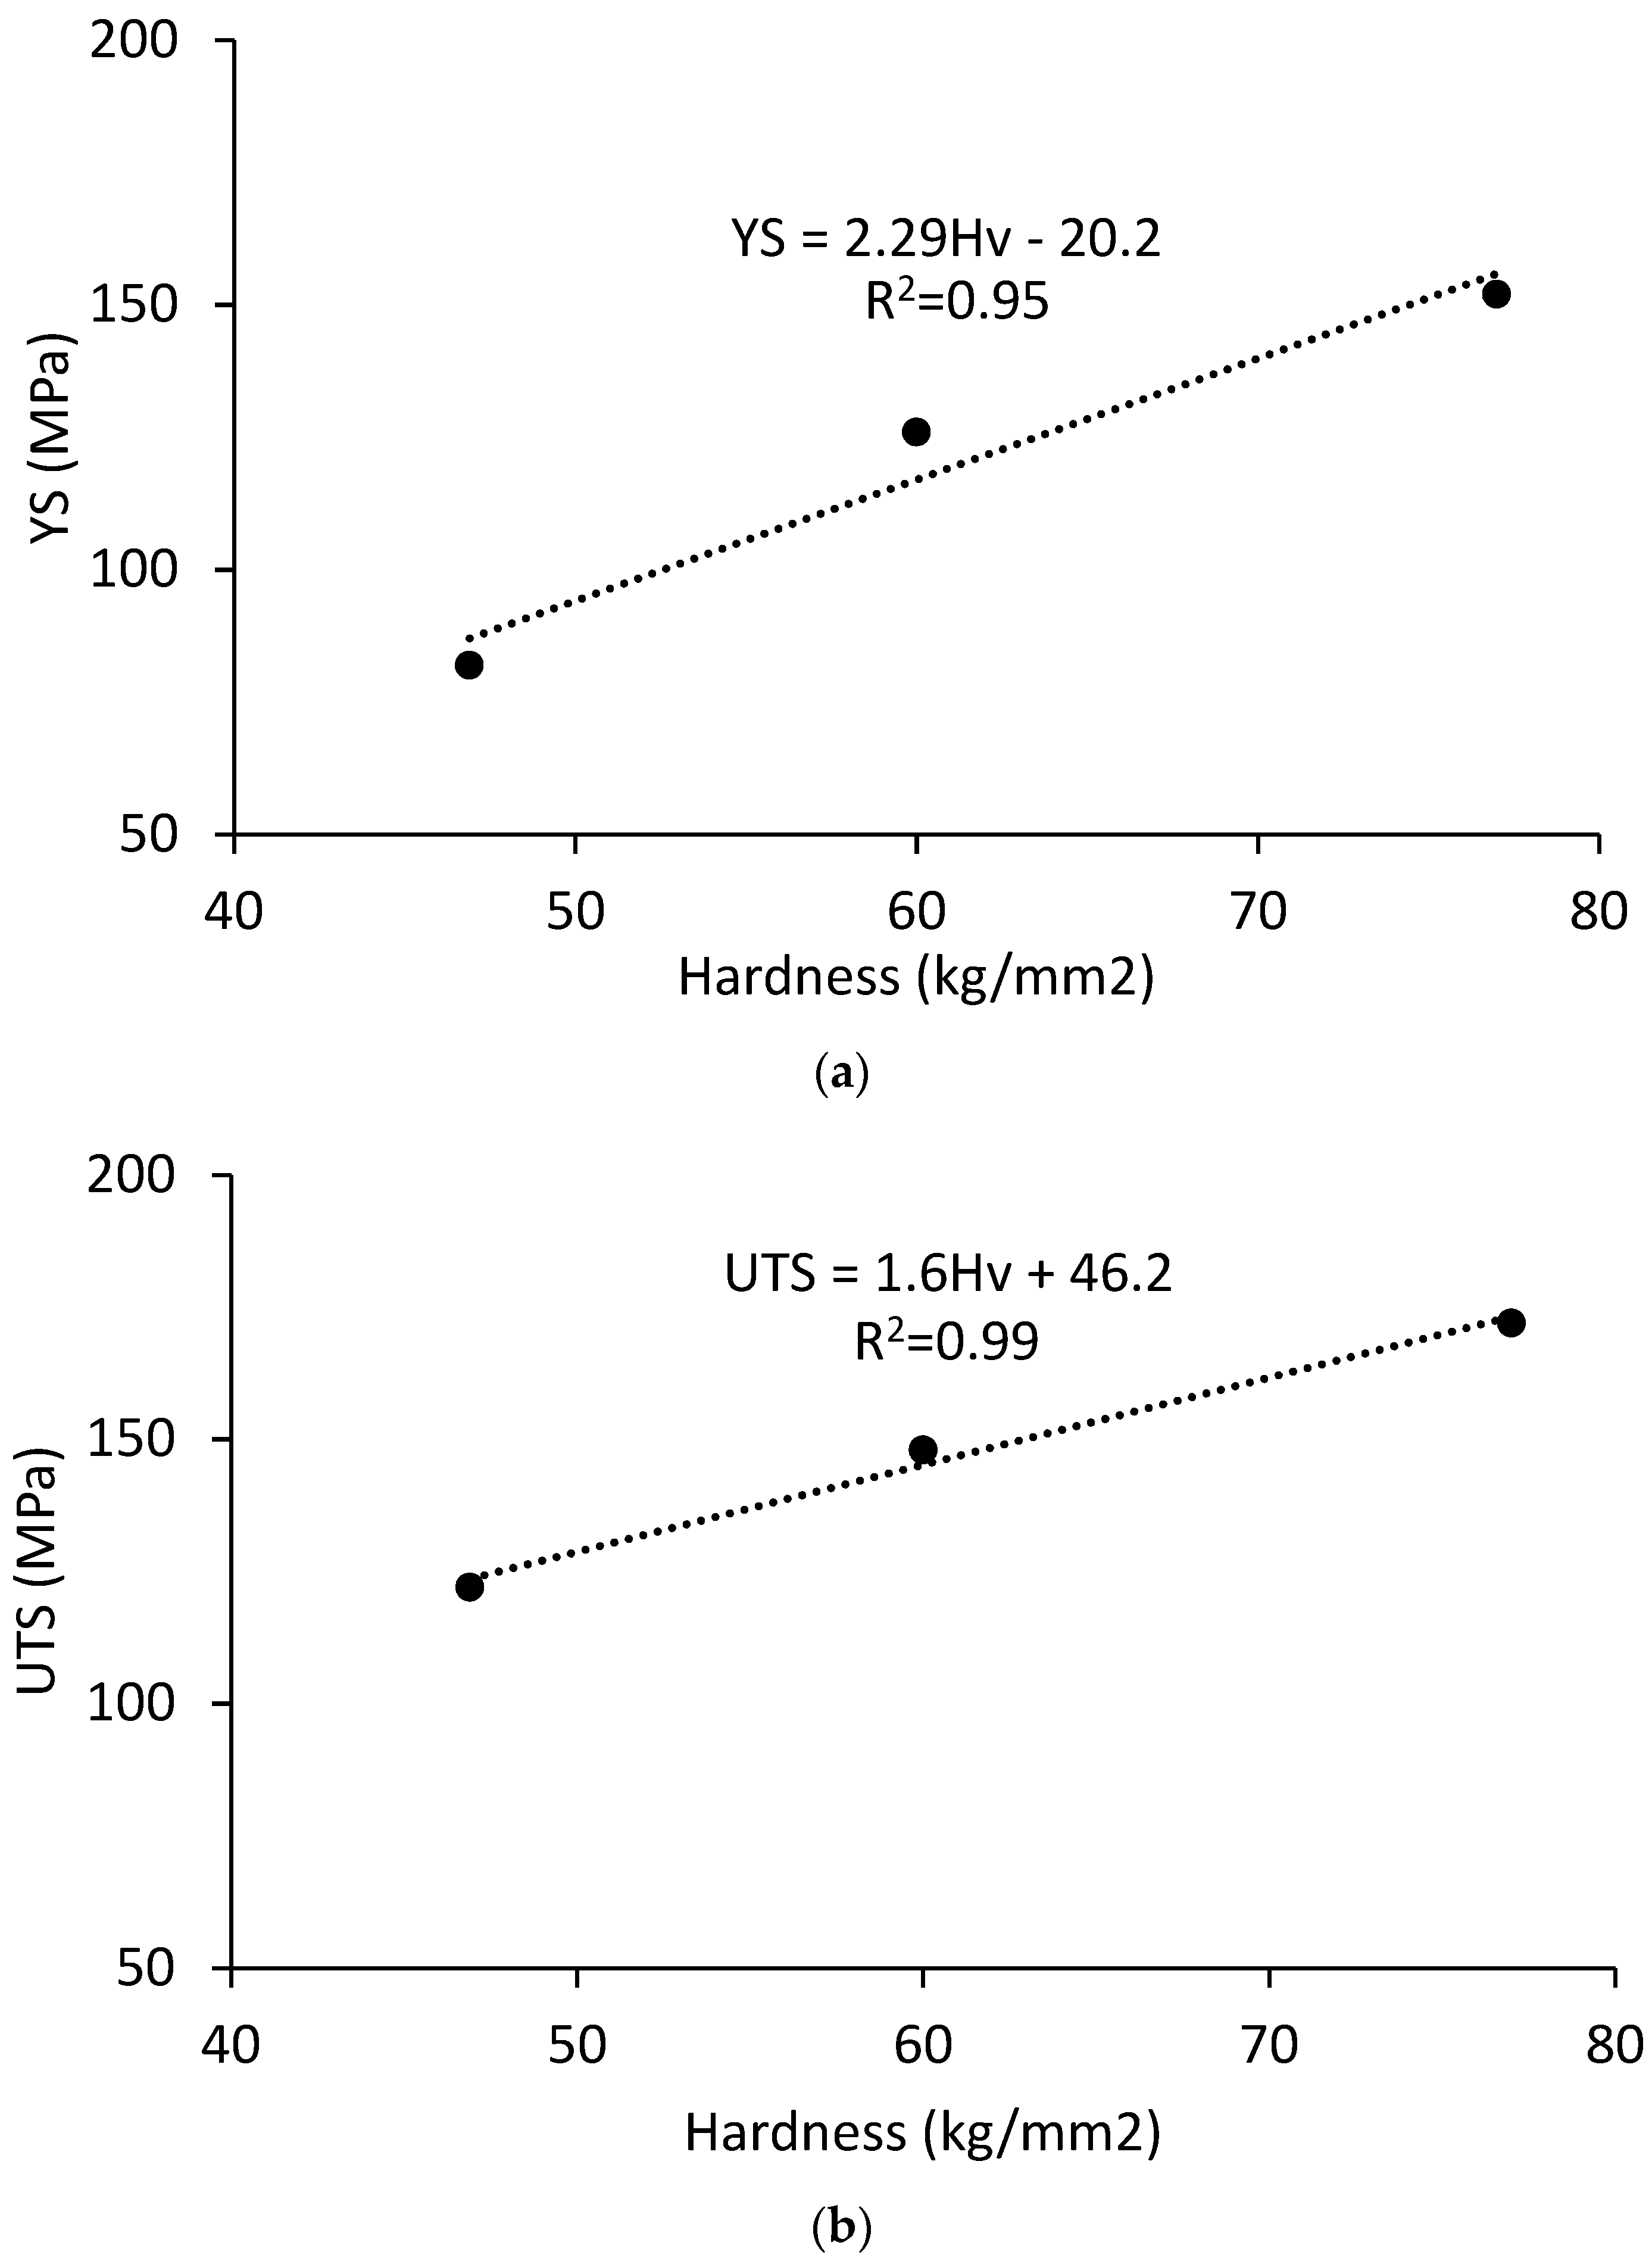
Figure 15.
Correlations between hardness and (a) yield strength and (b) ultimate strength for the Al3Hf-Al MMCs at room temperature in the unirradiated condition.
Figure 15.
Correlations between hardness and (a) yield strength and (b) ultimate strength for the Al3Hf-Al MMCs at room temperature in the unirradiated condition.
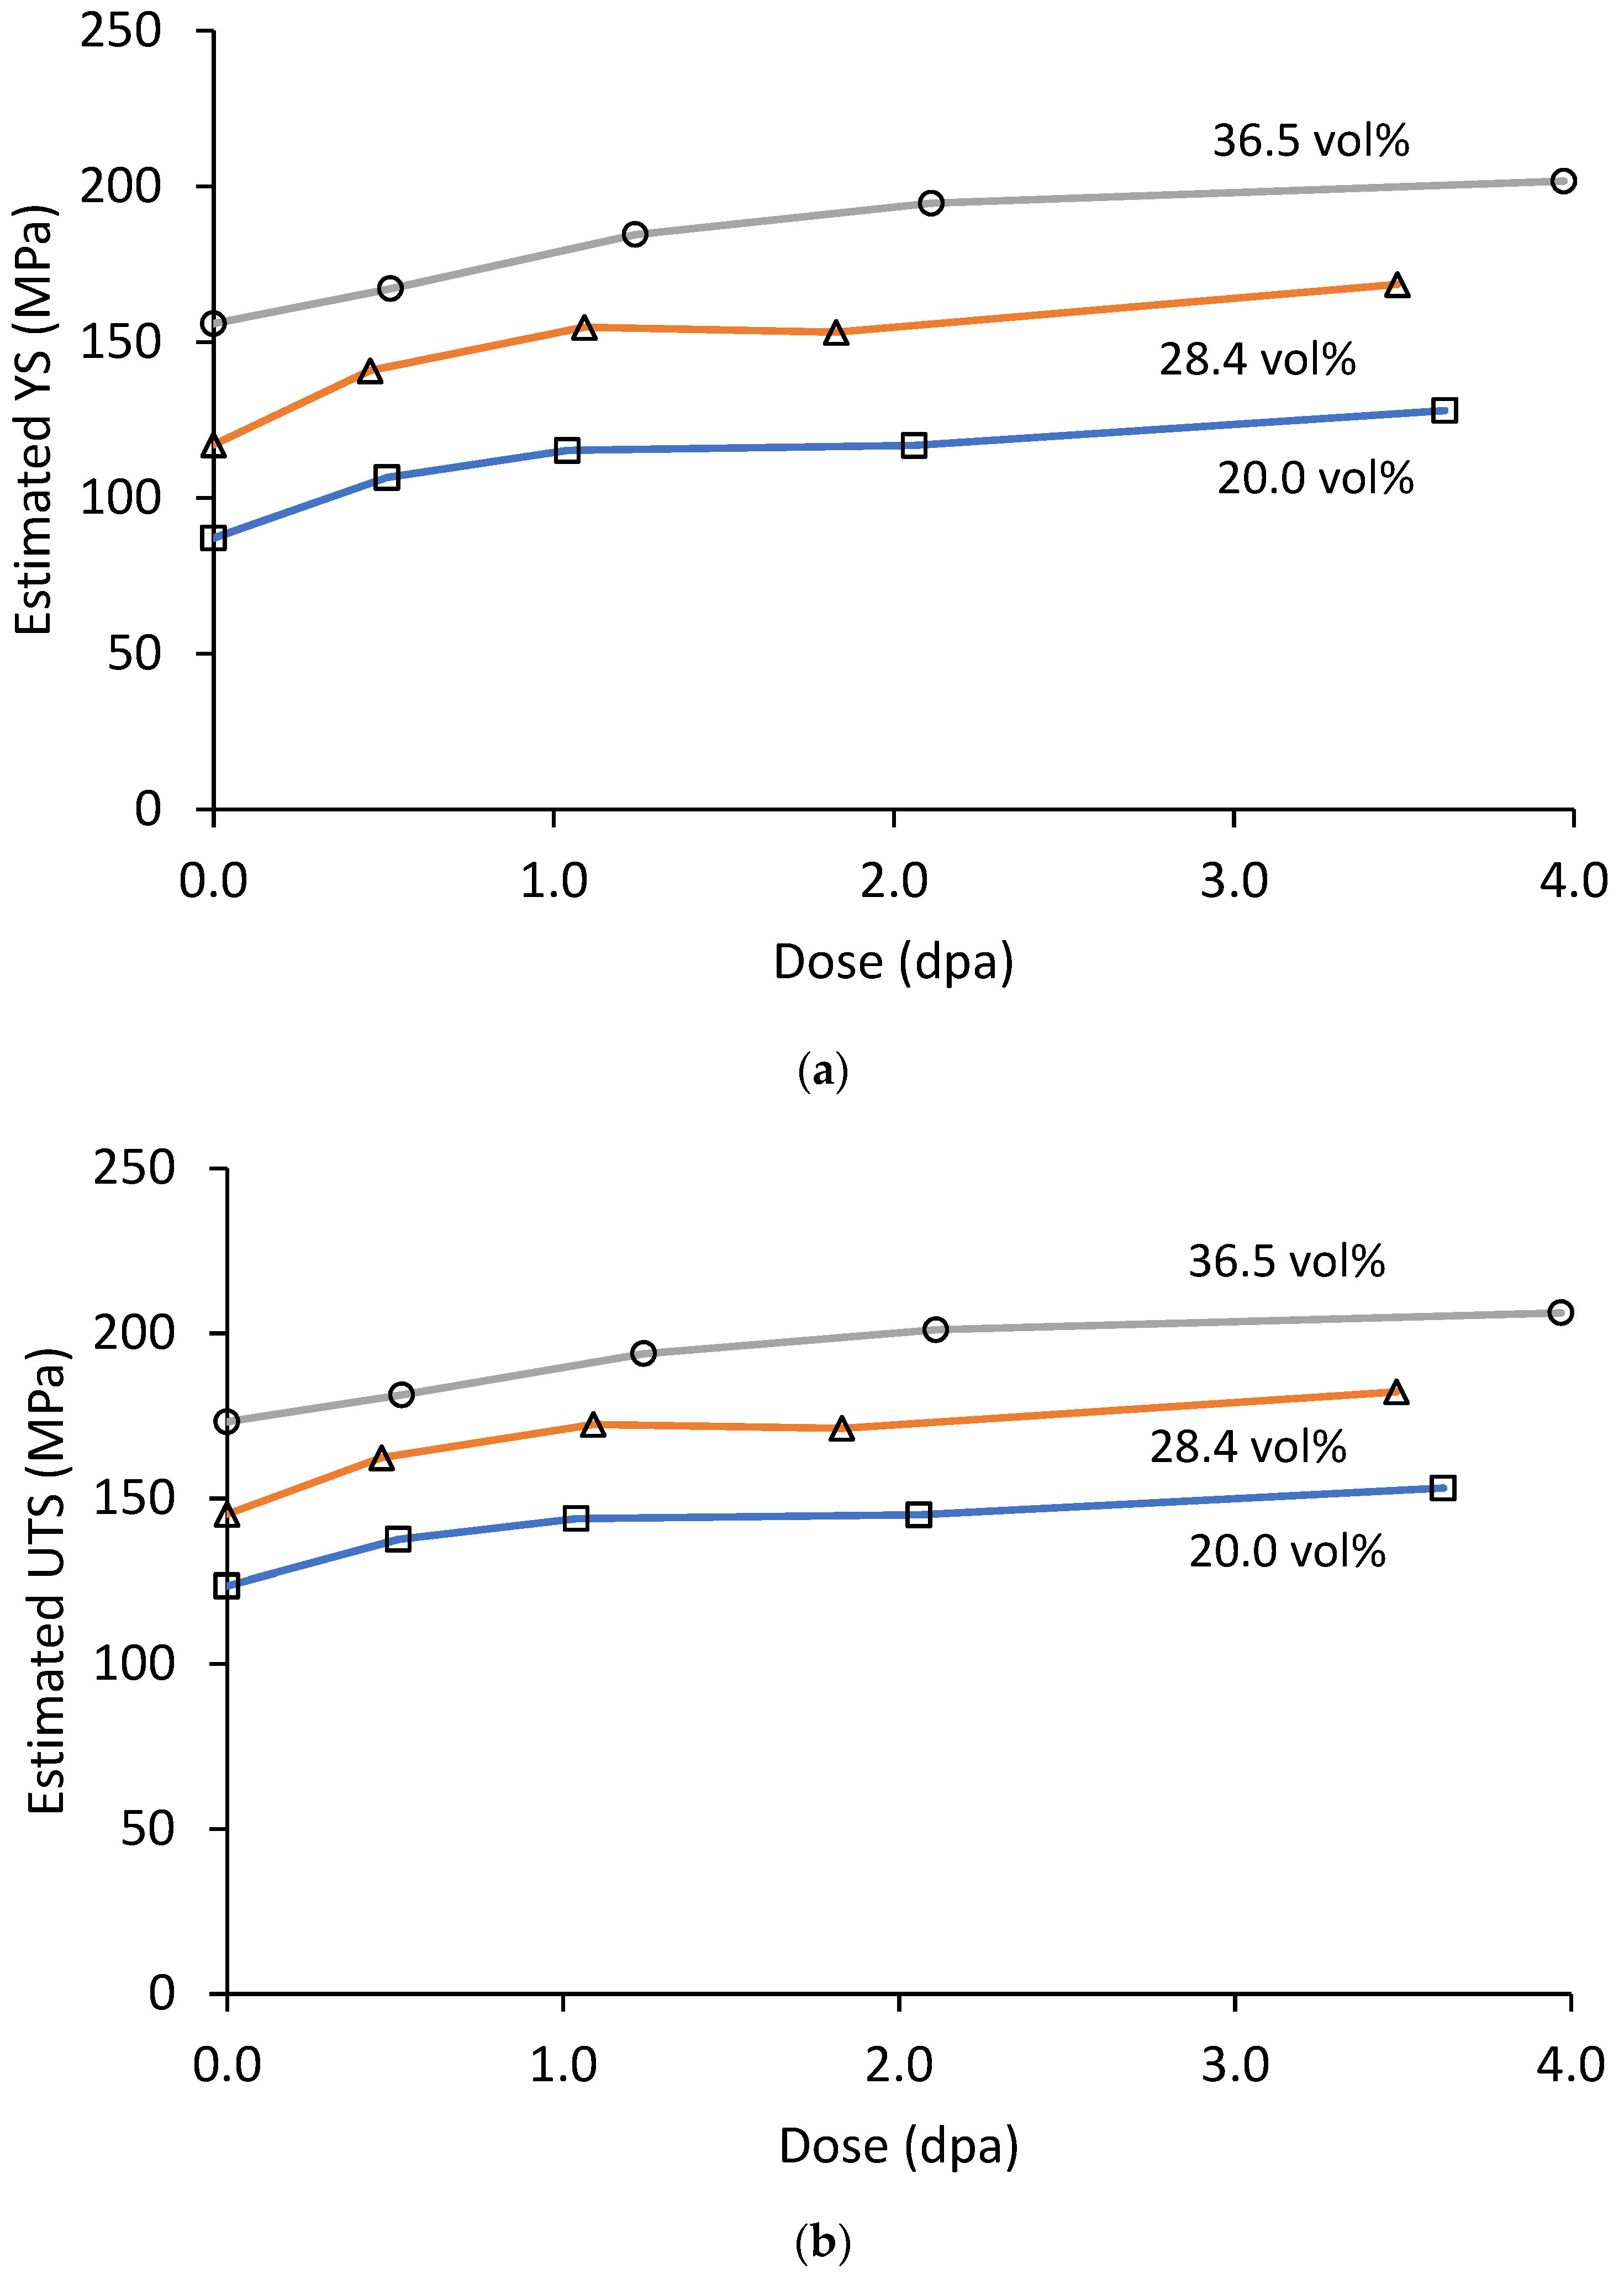
Figure 16.
(a) Estimated yield strength and (b) estimated ultimate strength for the Al3Hf-Al MMCs at room temperature as a function of dose.
Figure 16.
(a) Estimated yield strength and (b) estimated ultimate strength for the Al3Hf-Al MMCs at room temperature as a function of dose.
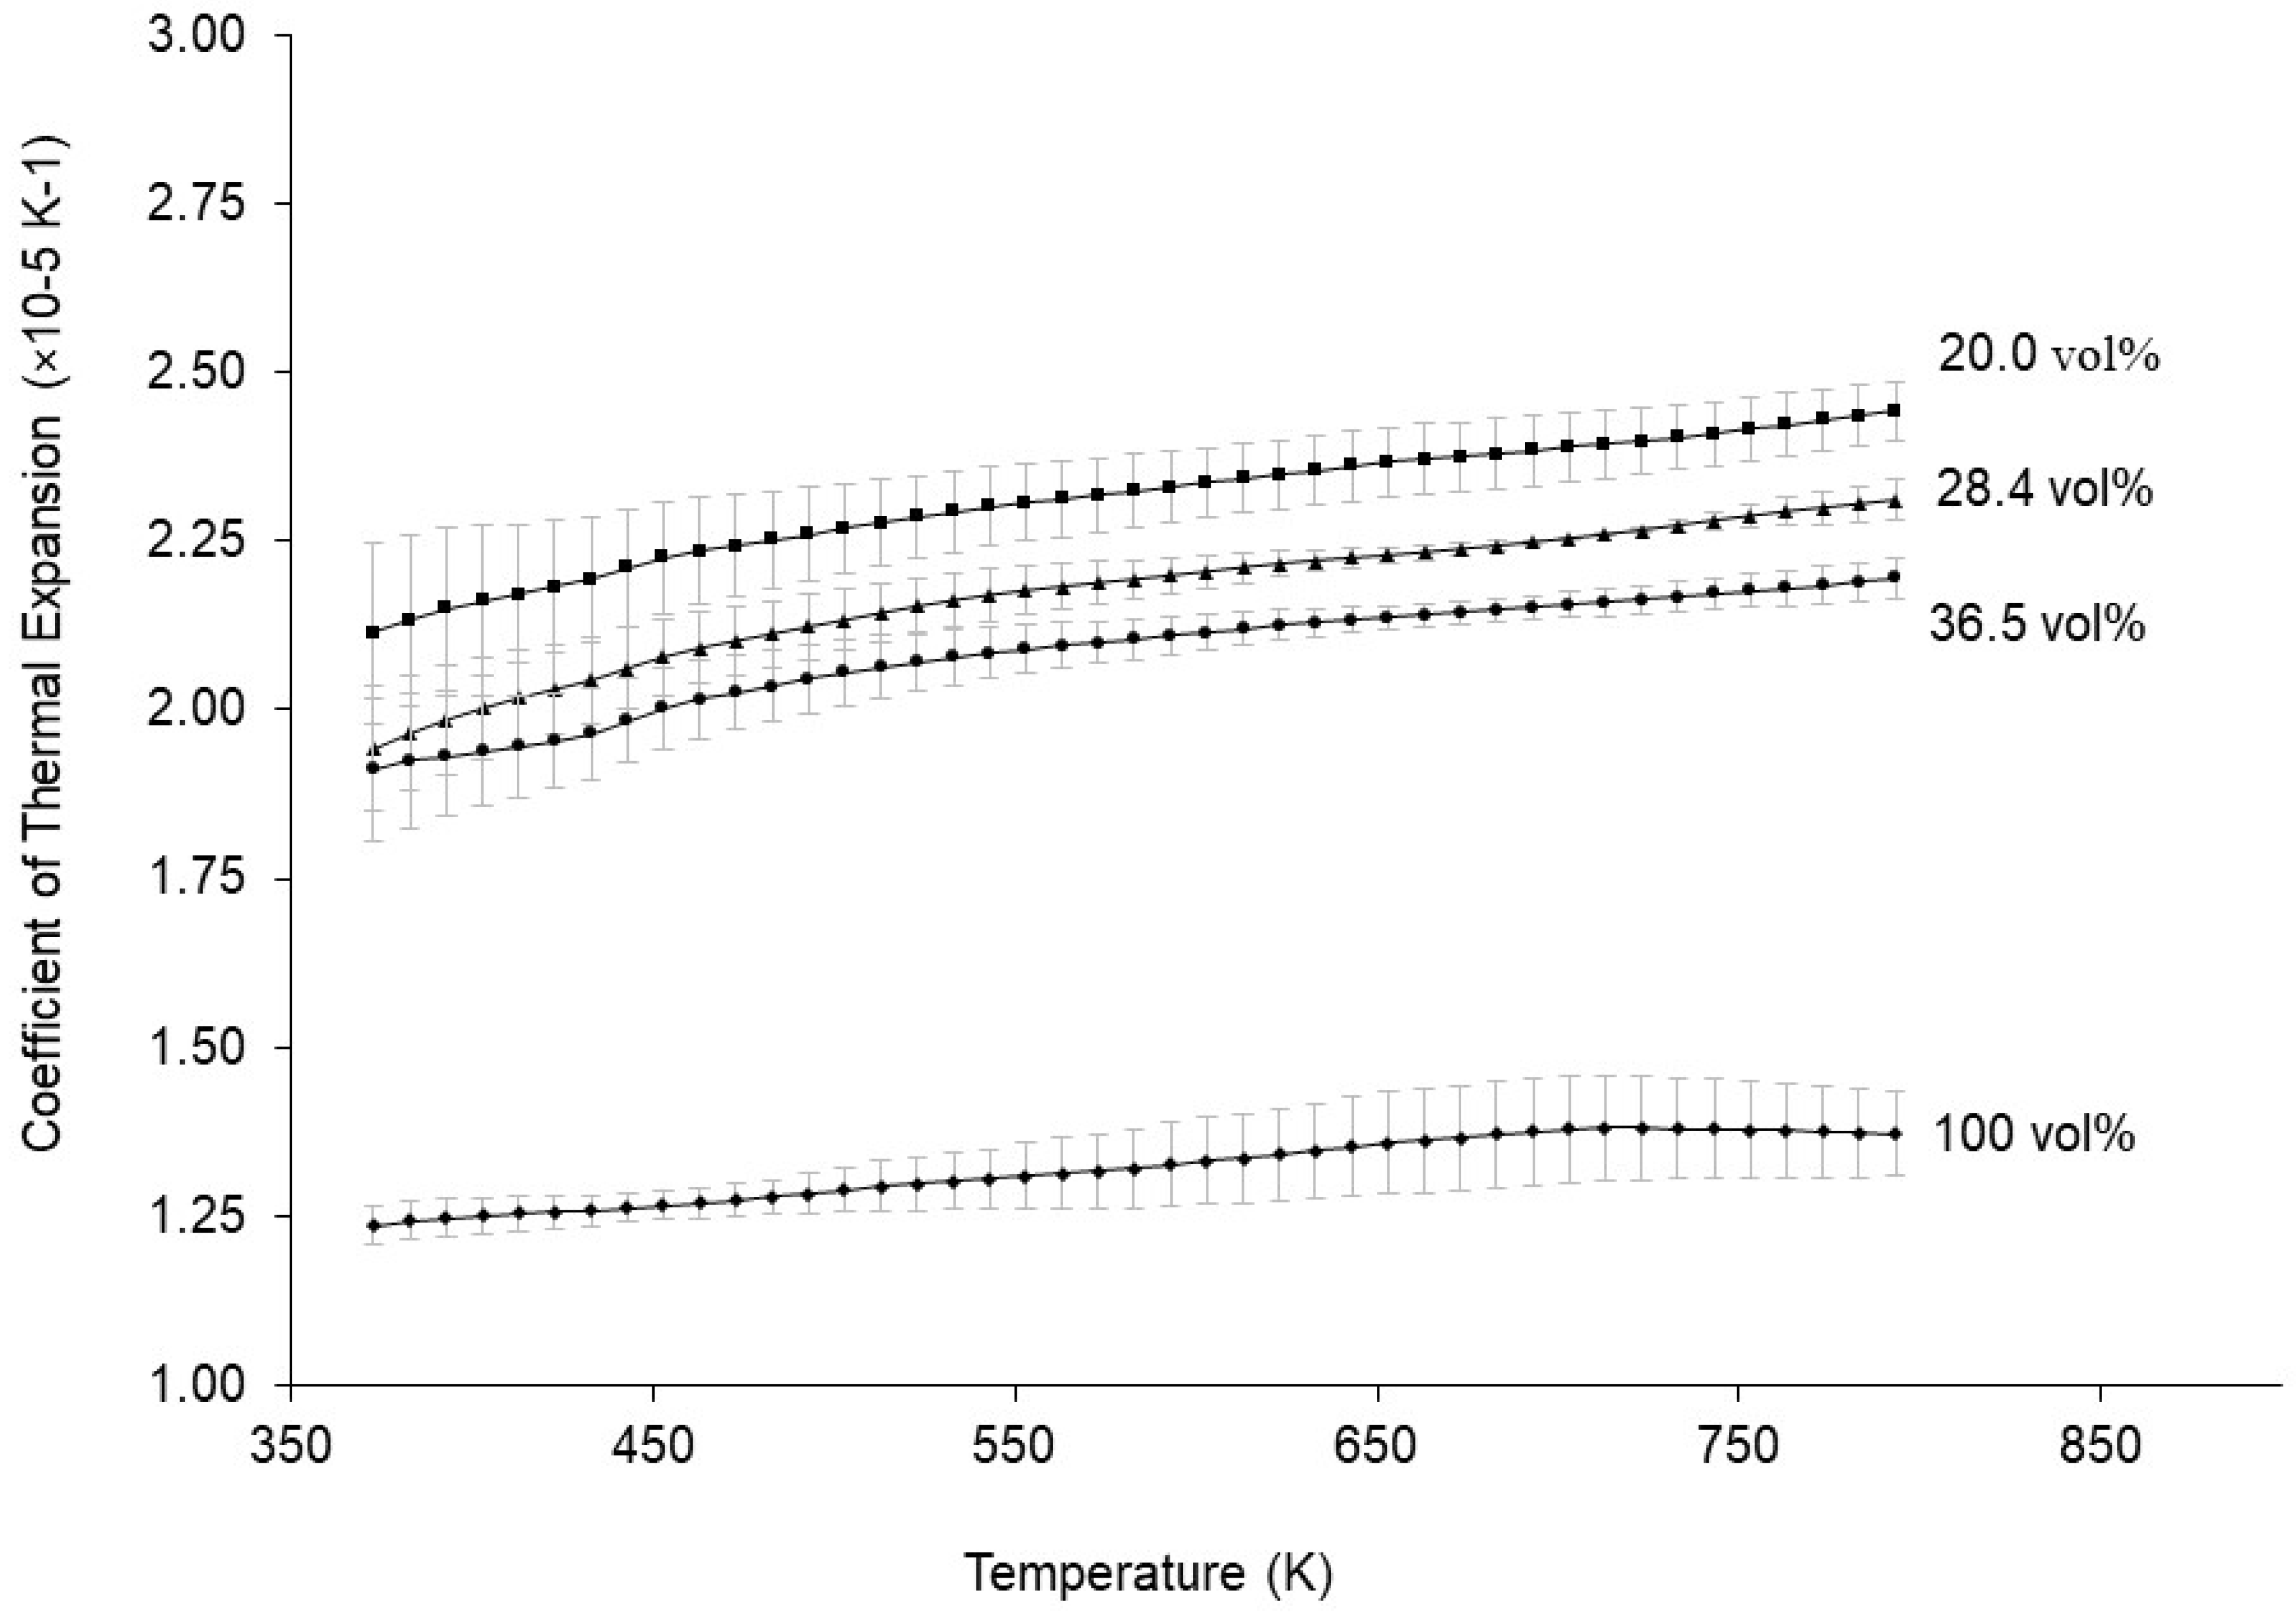
Figure 17.
Coefficient of thermal expansion vs. temperature for the 20.0, 28.4, 36.5, and 100 vol% unirradiated materials.
Figure 17.
Coefficient of thermal expansion vs. temperature for the 20.0, 28.4, 36.5, and 100 vol% unirradiated materials.
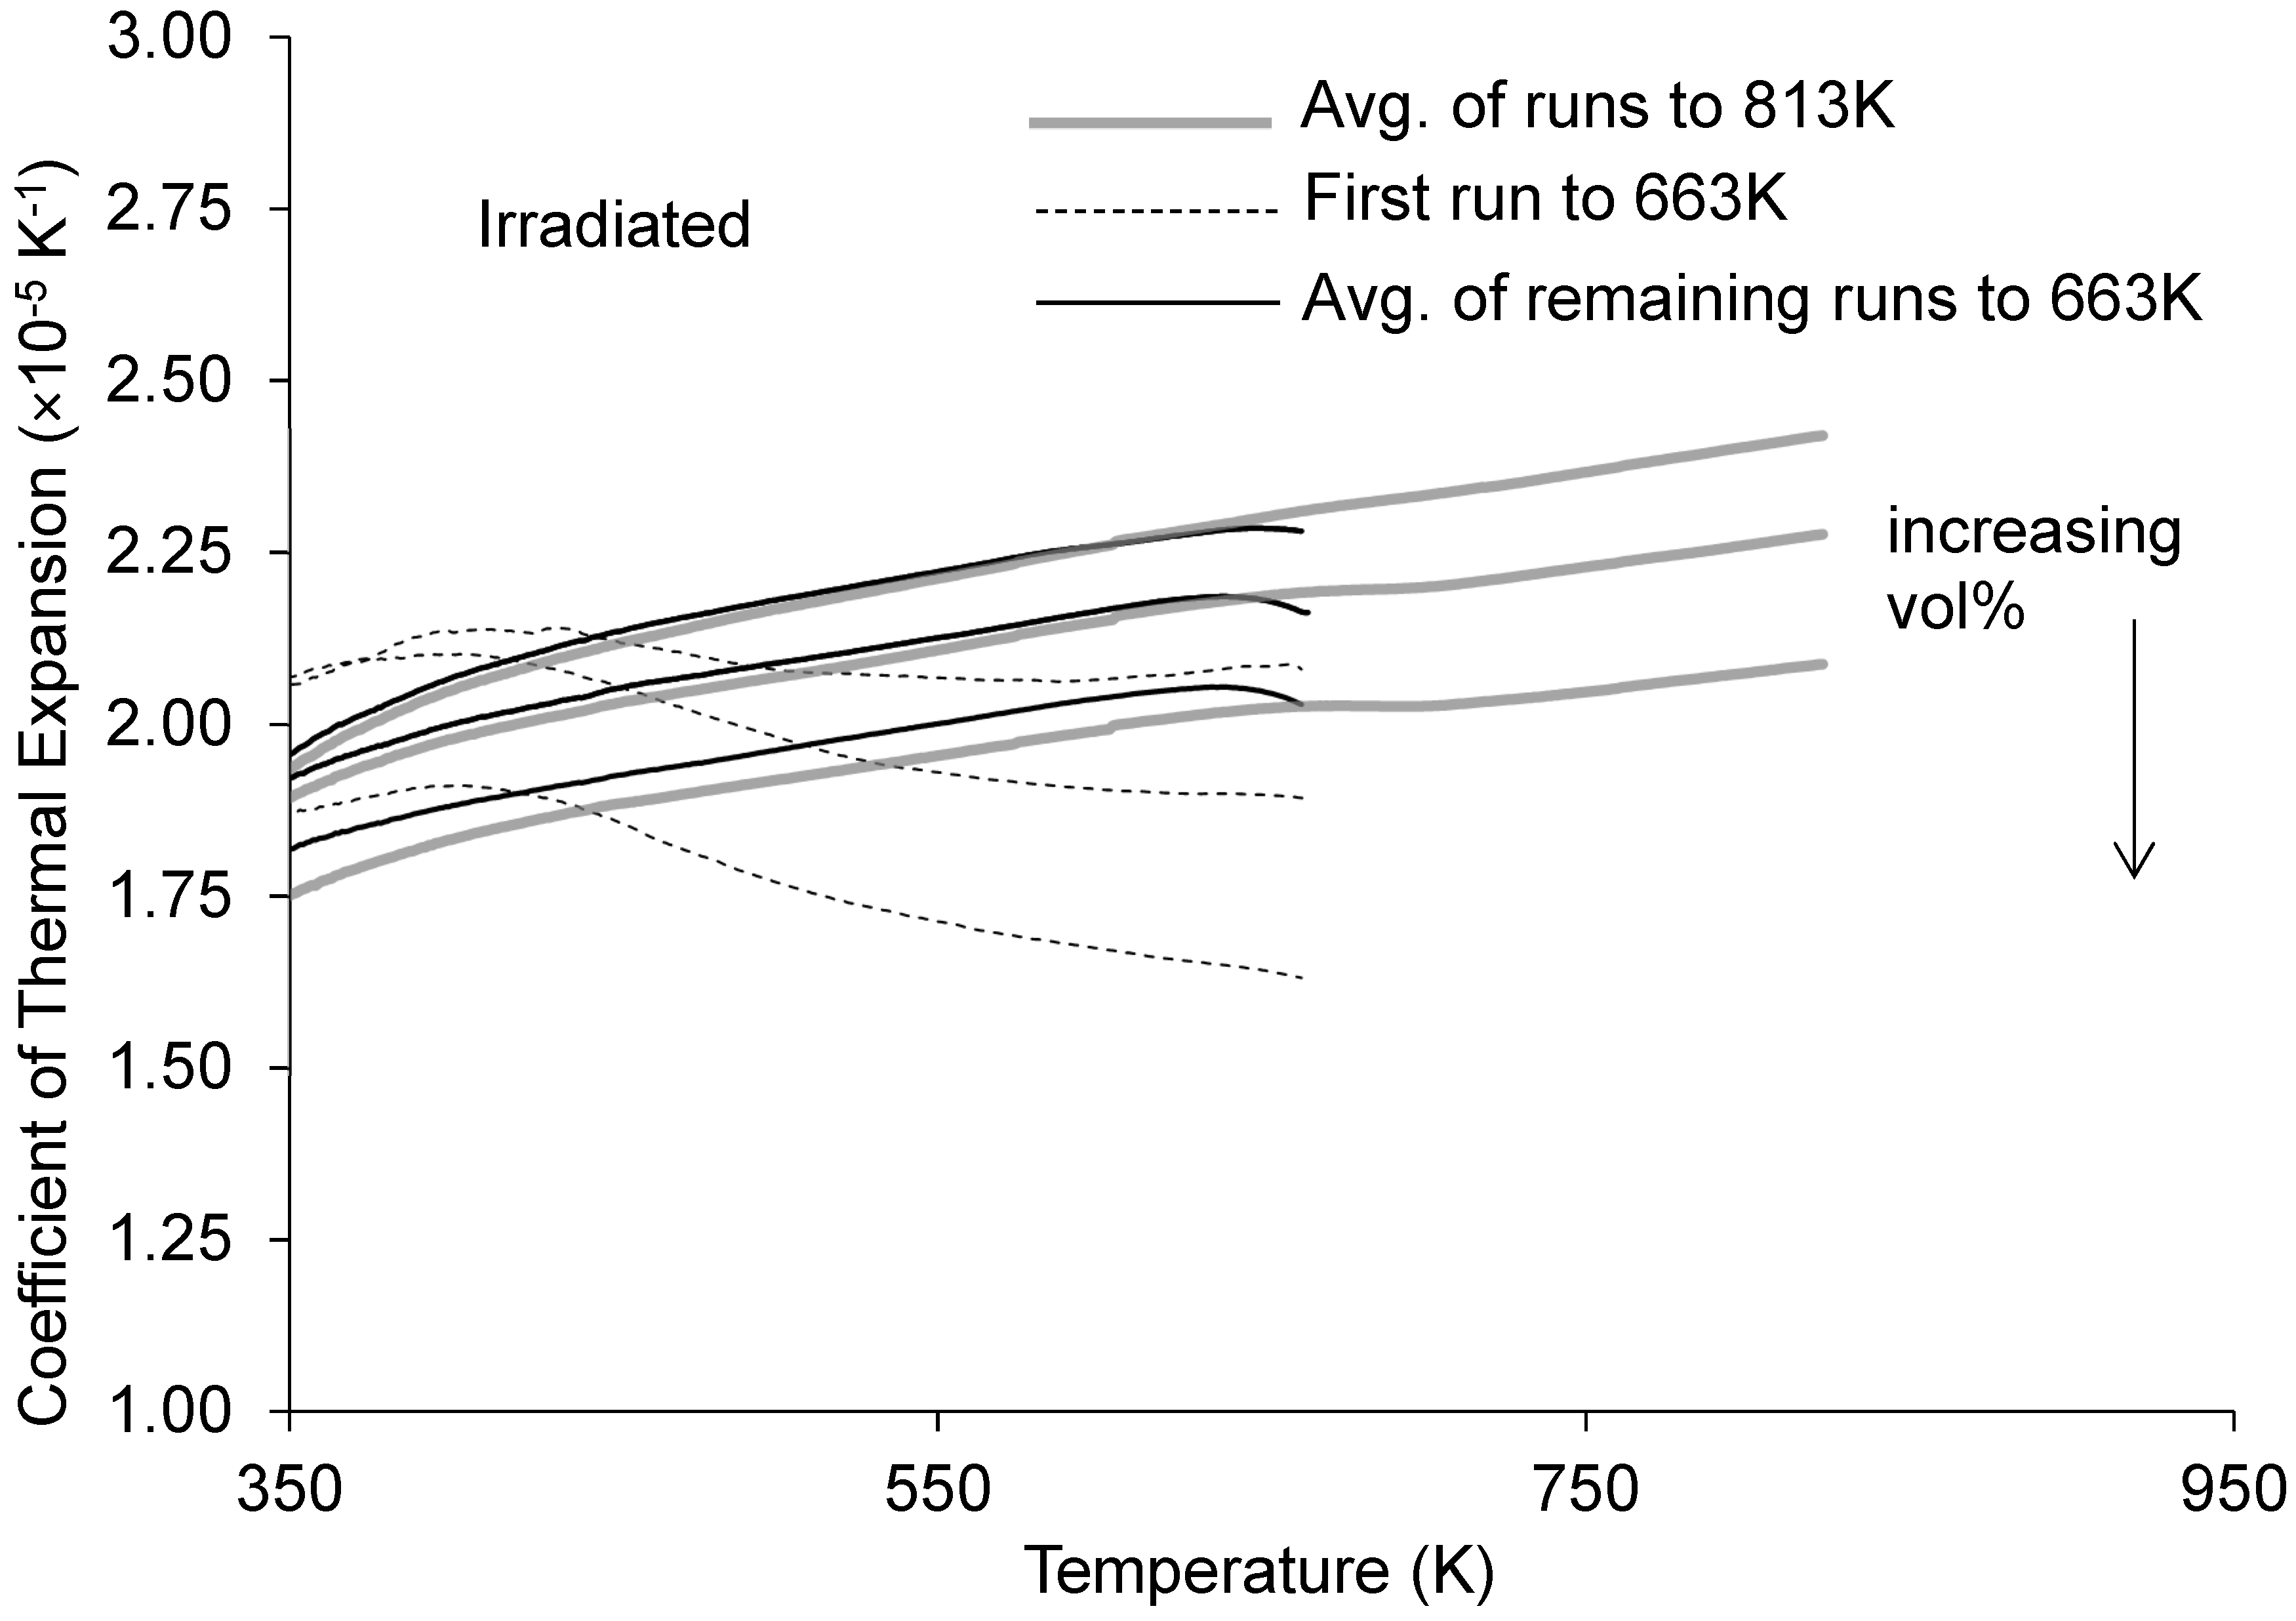
Figure 18.
Coefficient of thermal expansion vs. temperature for the irradiated materials showing effects of annealing. Note that the 100 vol% Al3Hf material was not irradiated so the plot only shows three curves for the materials that were irradiated (i.e., 20, 28.4, and 36.5 vol%).
Figure 18.
Coefficient of thermal expansion vs. temperature for the irradiated materials showing effects of annealing. Note that the 100 vol% Al3Hf material was not irradiated so the plot only shows three curves for the materials that were irradiated (i.e., 20, 28.4, and 36.5 vol%).
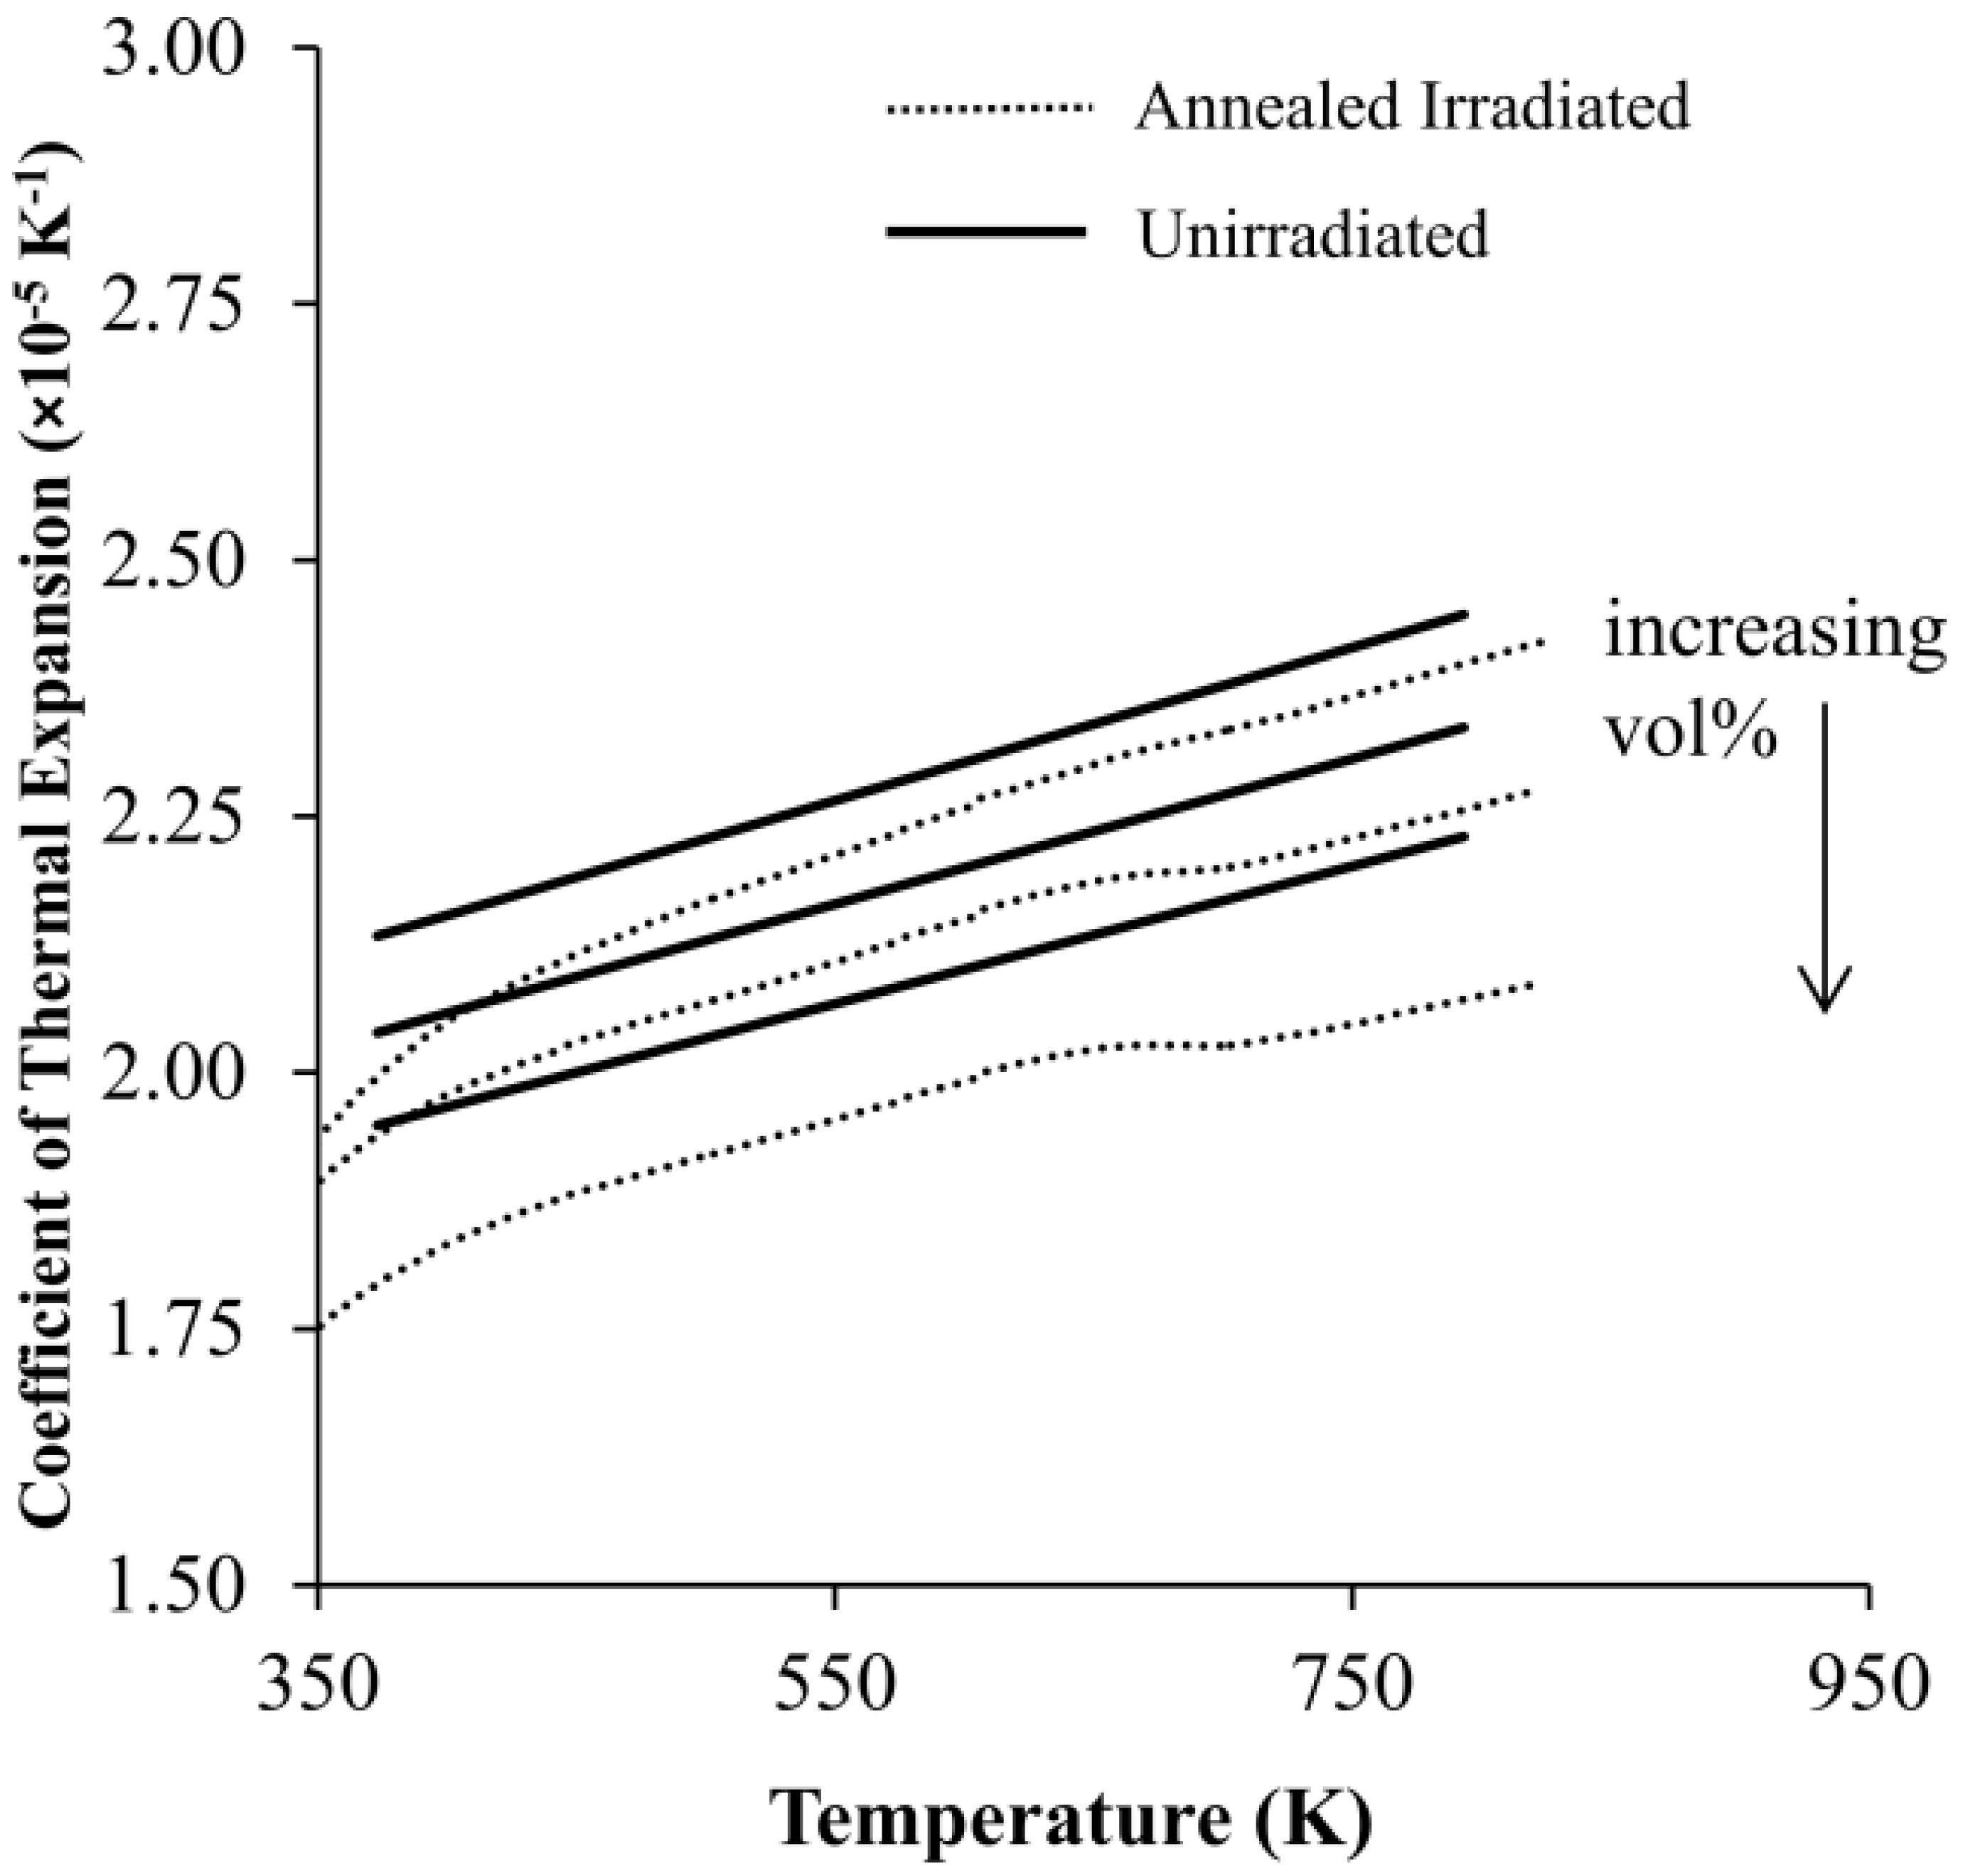
Figure 19.
Comparison of coefficients of thermal expansion for the unirradiated materials and the annealed irradiated materials.
Figure 19.
Comparison of coefficients of thermal expansion for the unirradiated materials and the annealed irradiated materials.
Figure 20.
SEM image of the polished surface of an unirradiated 20 vol% specimen that has been tensile tested.
Figure 20.
SEM image of the polished surface of an unirradiated 20 vol% specimen that has been tensile tested.
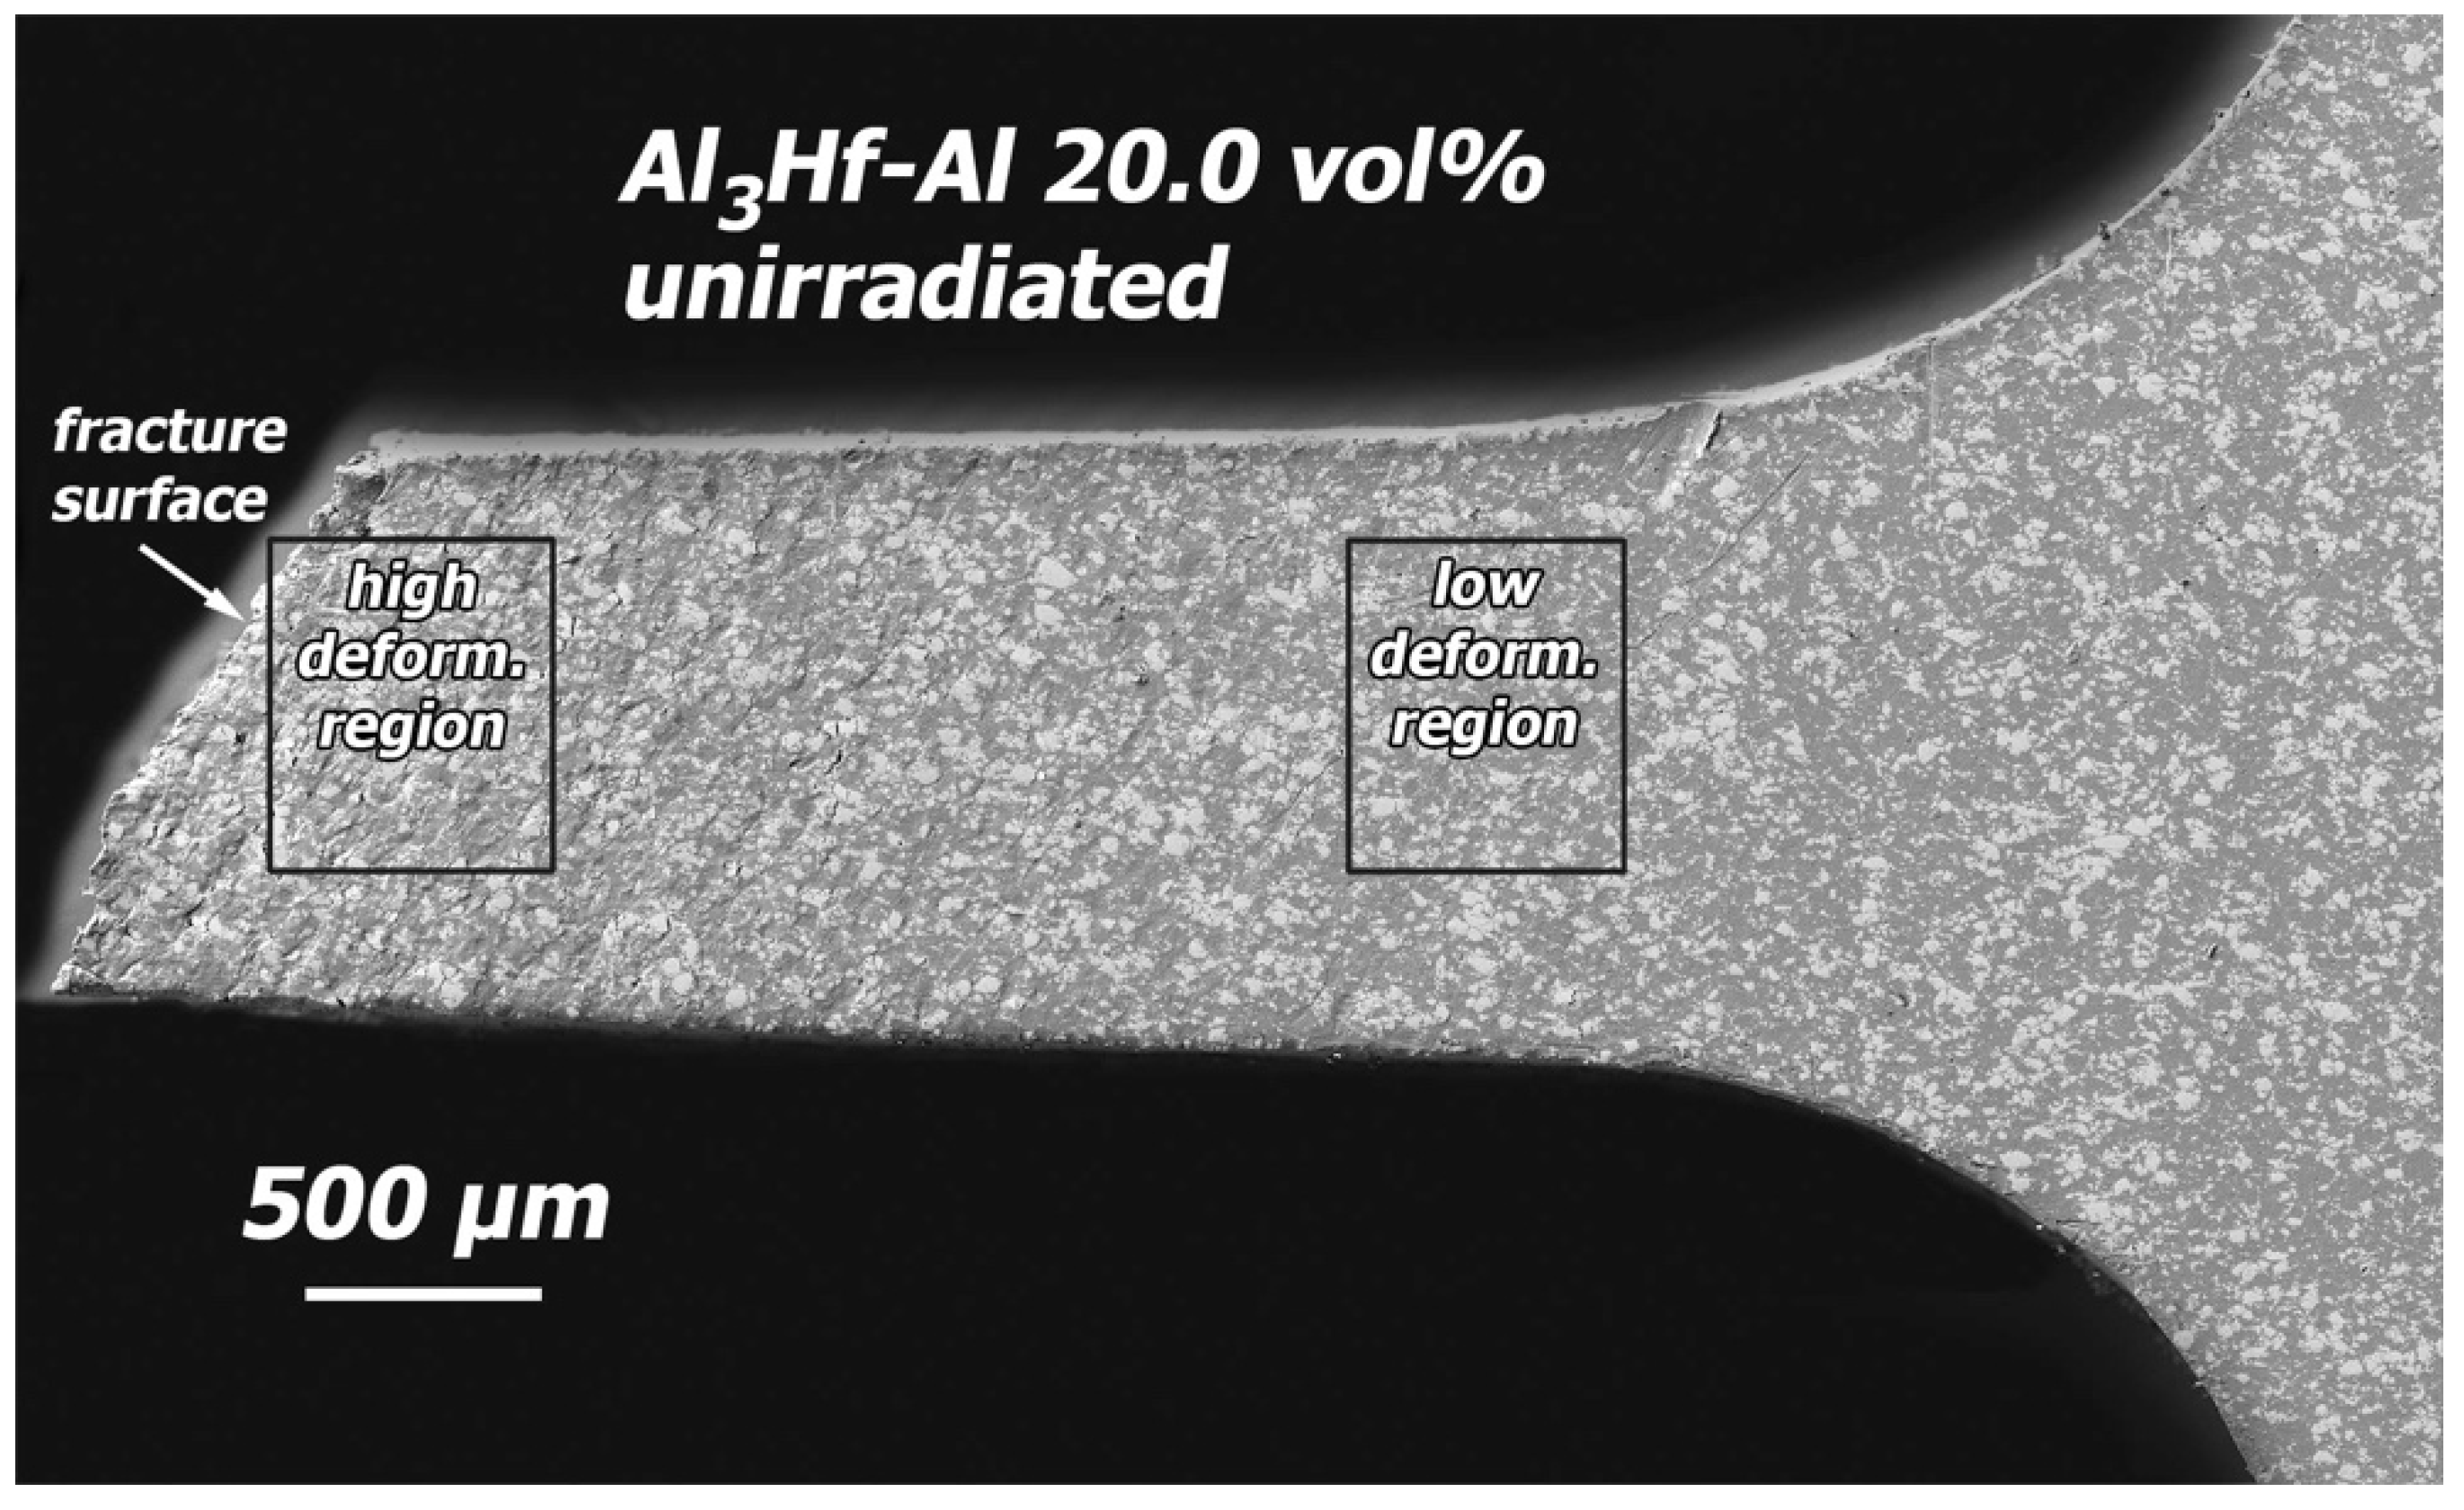
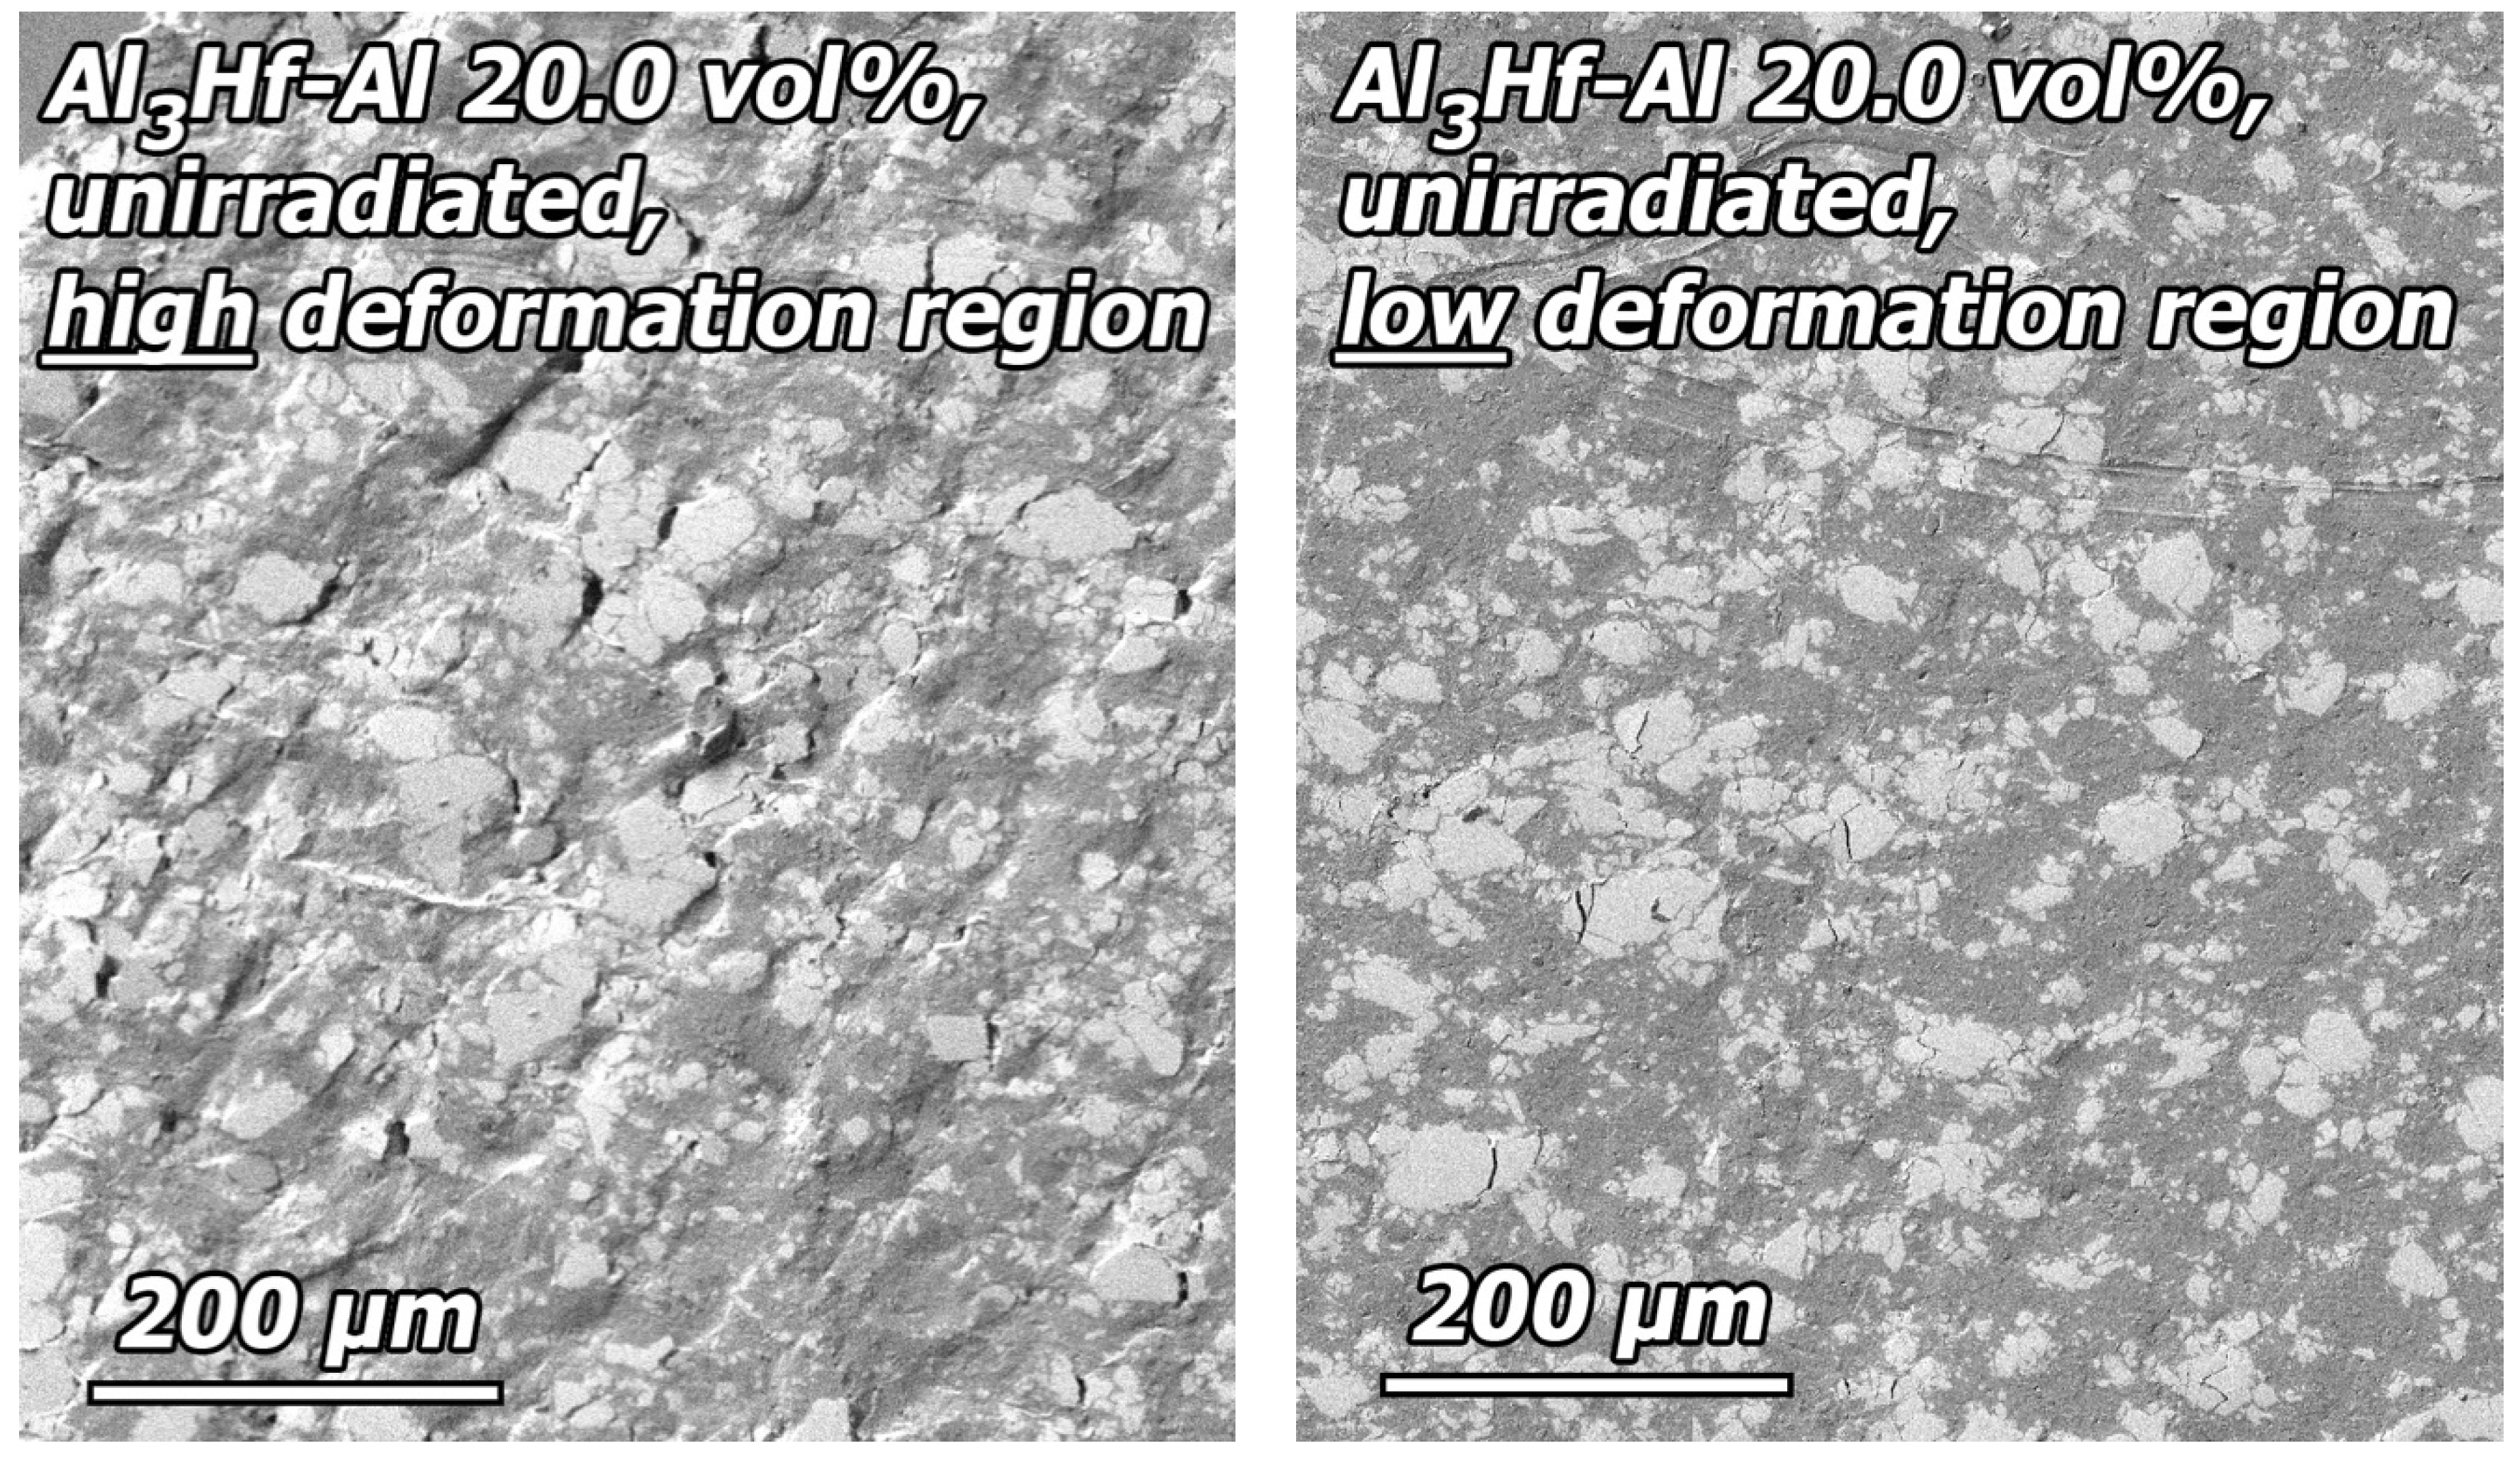
Figure 21.
SEM image of the detail region near the fracture surface an unirradiated 20 vol% specimen that has been tensile tested.
Figure 21.
SEM image of the detail region near the fracture surface an unirradiated 20 vol% specimen that has been tensile tested.
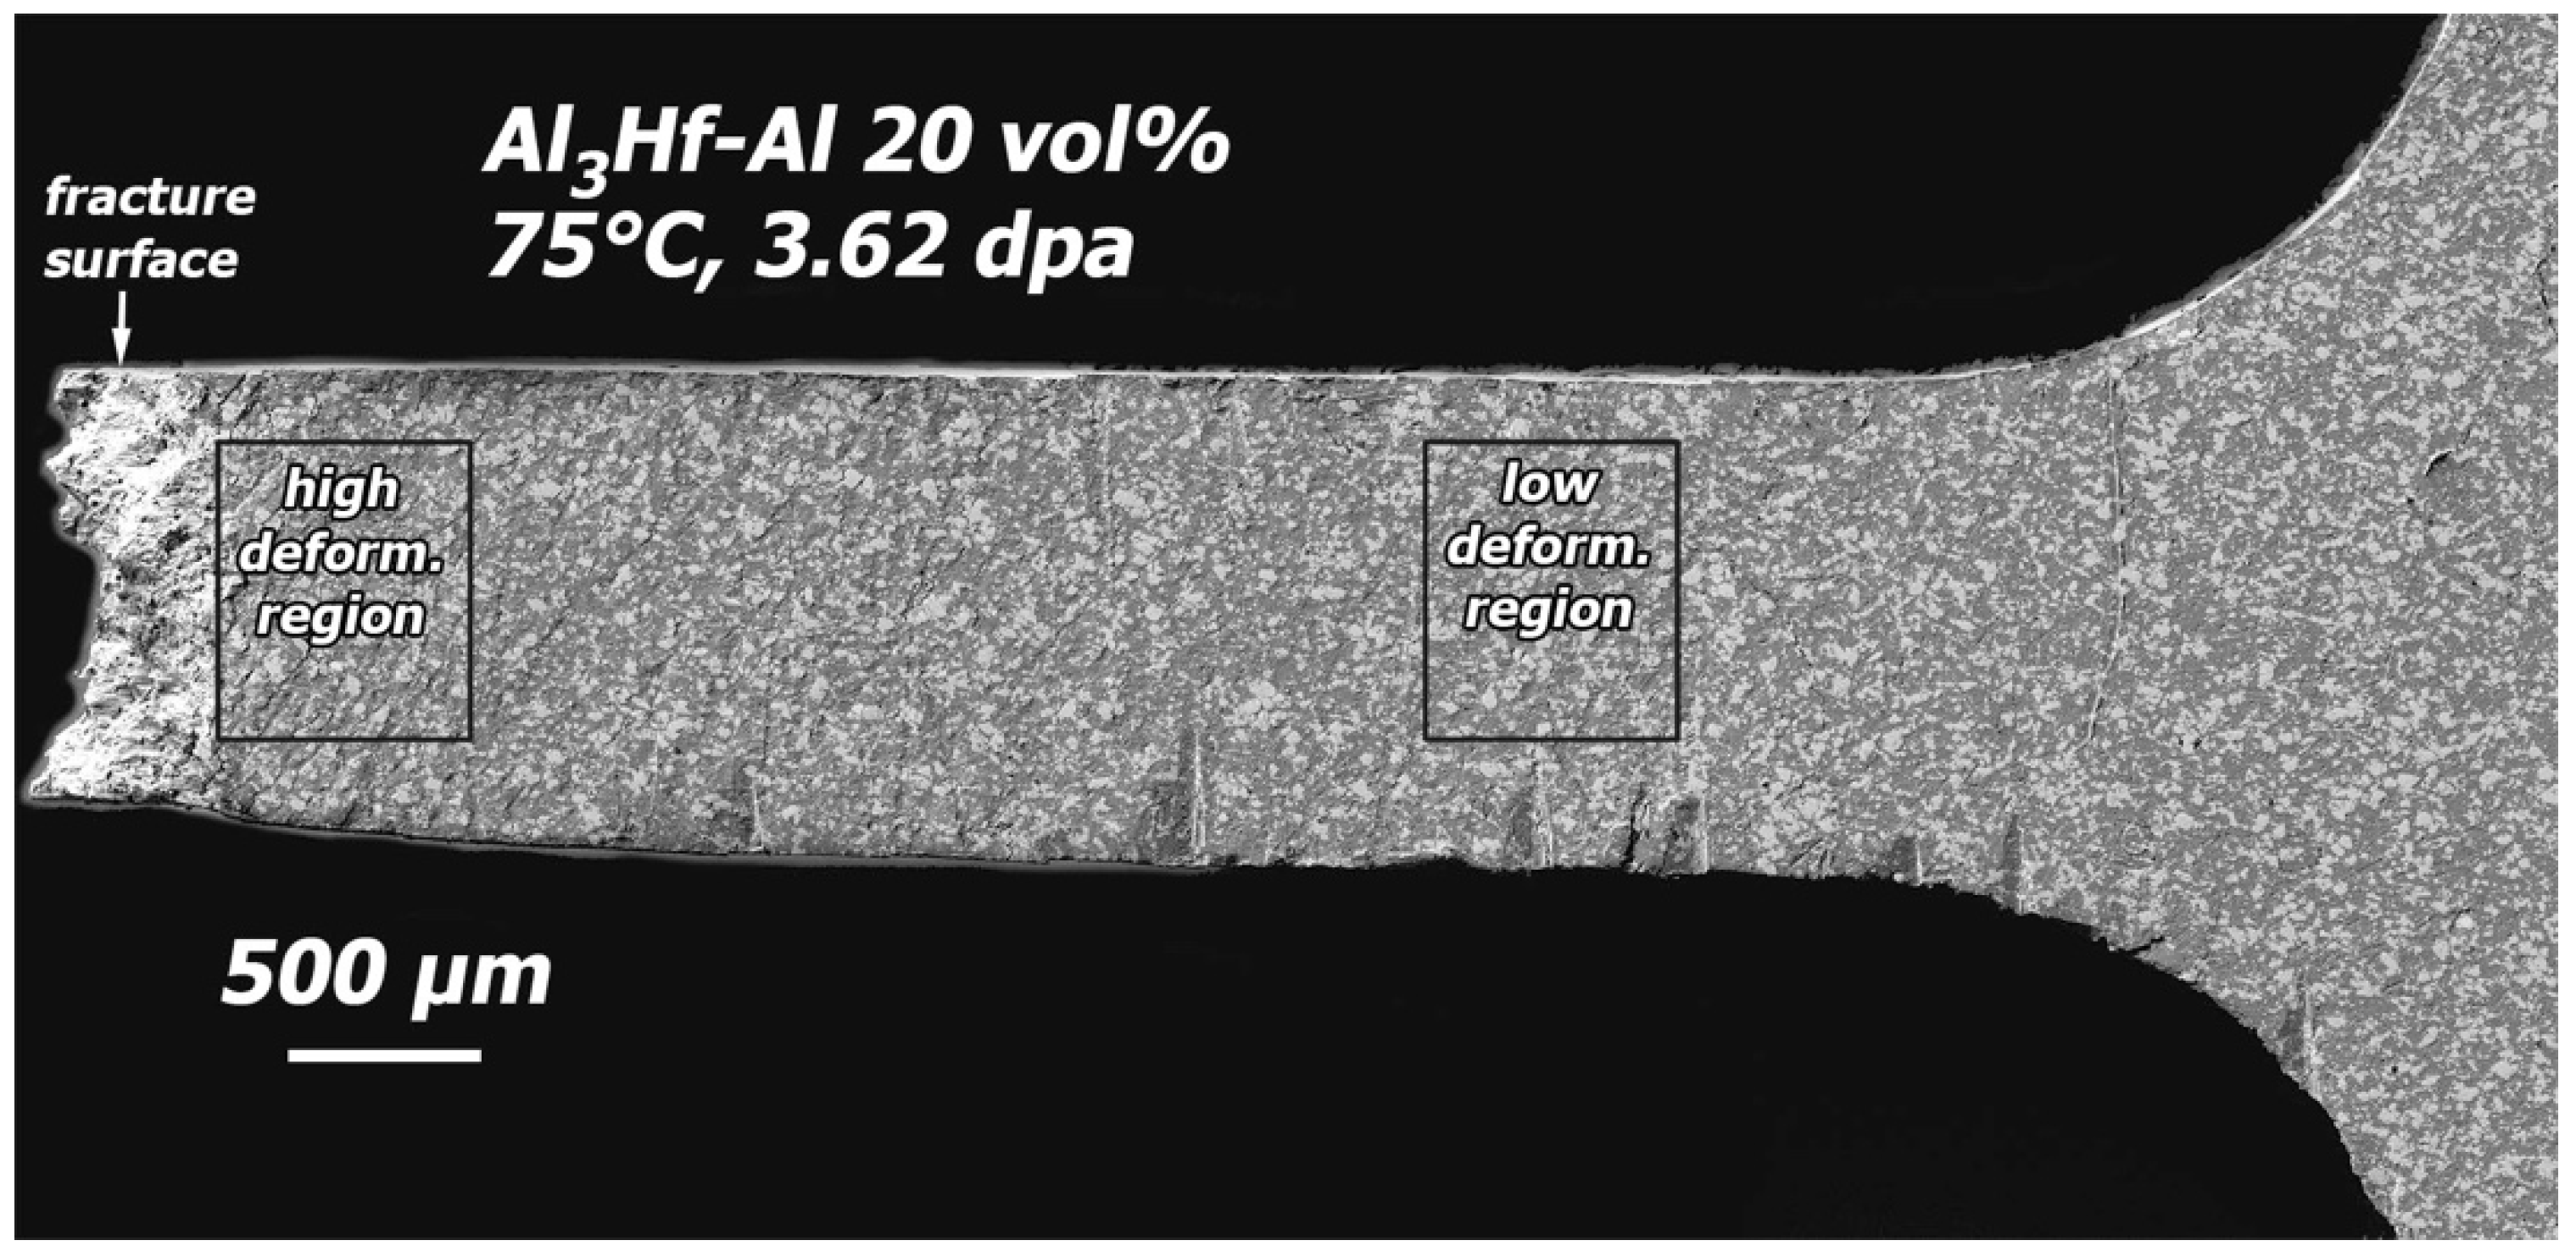
Figure 22.
SEM image of the polished surface of the 20 vol% tensile specimen that was tensile tested after irradiation to 3.62 dpa at 75 °C (KGT-1528).
Figure 22.
SEM image of the polished surface of the 20 vol% tensile specimen that was tensile tested after irradiation to 3.62 dpa at 75 °C (KGT-1528).
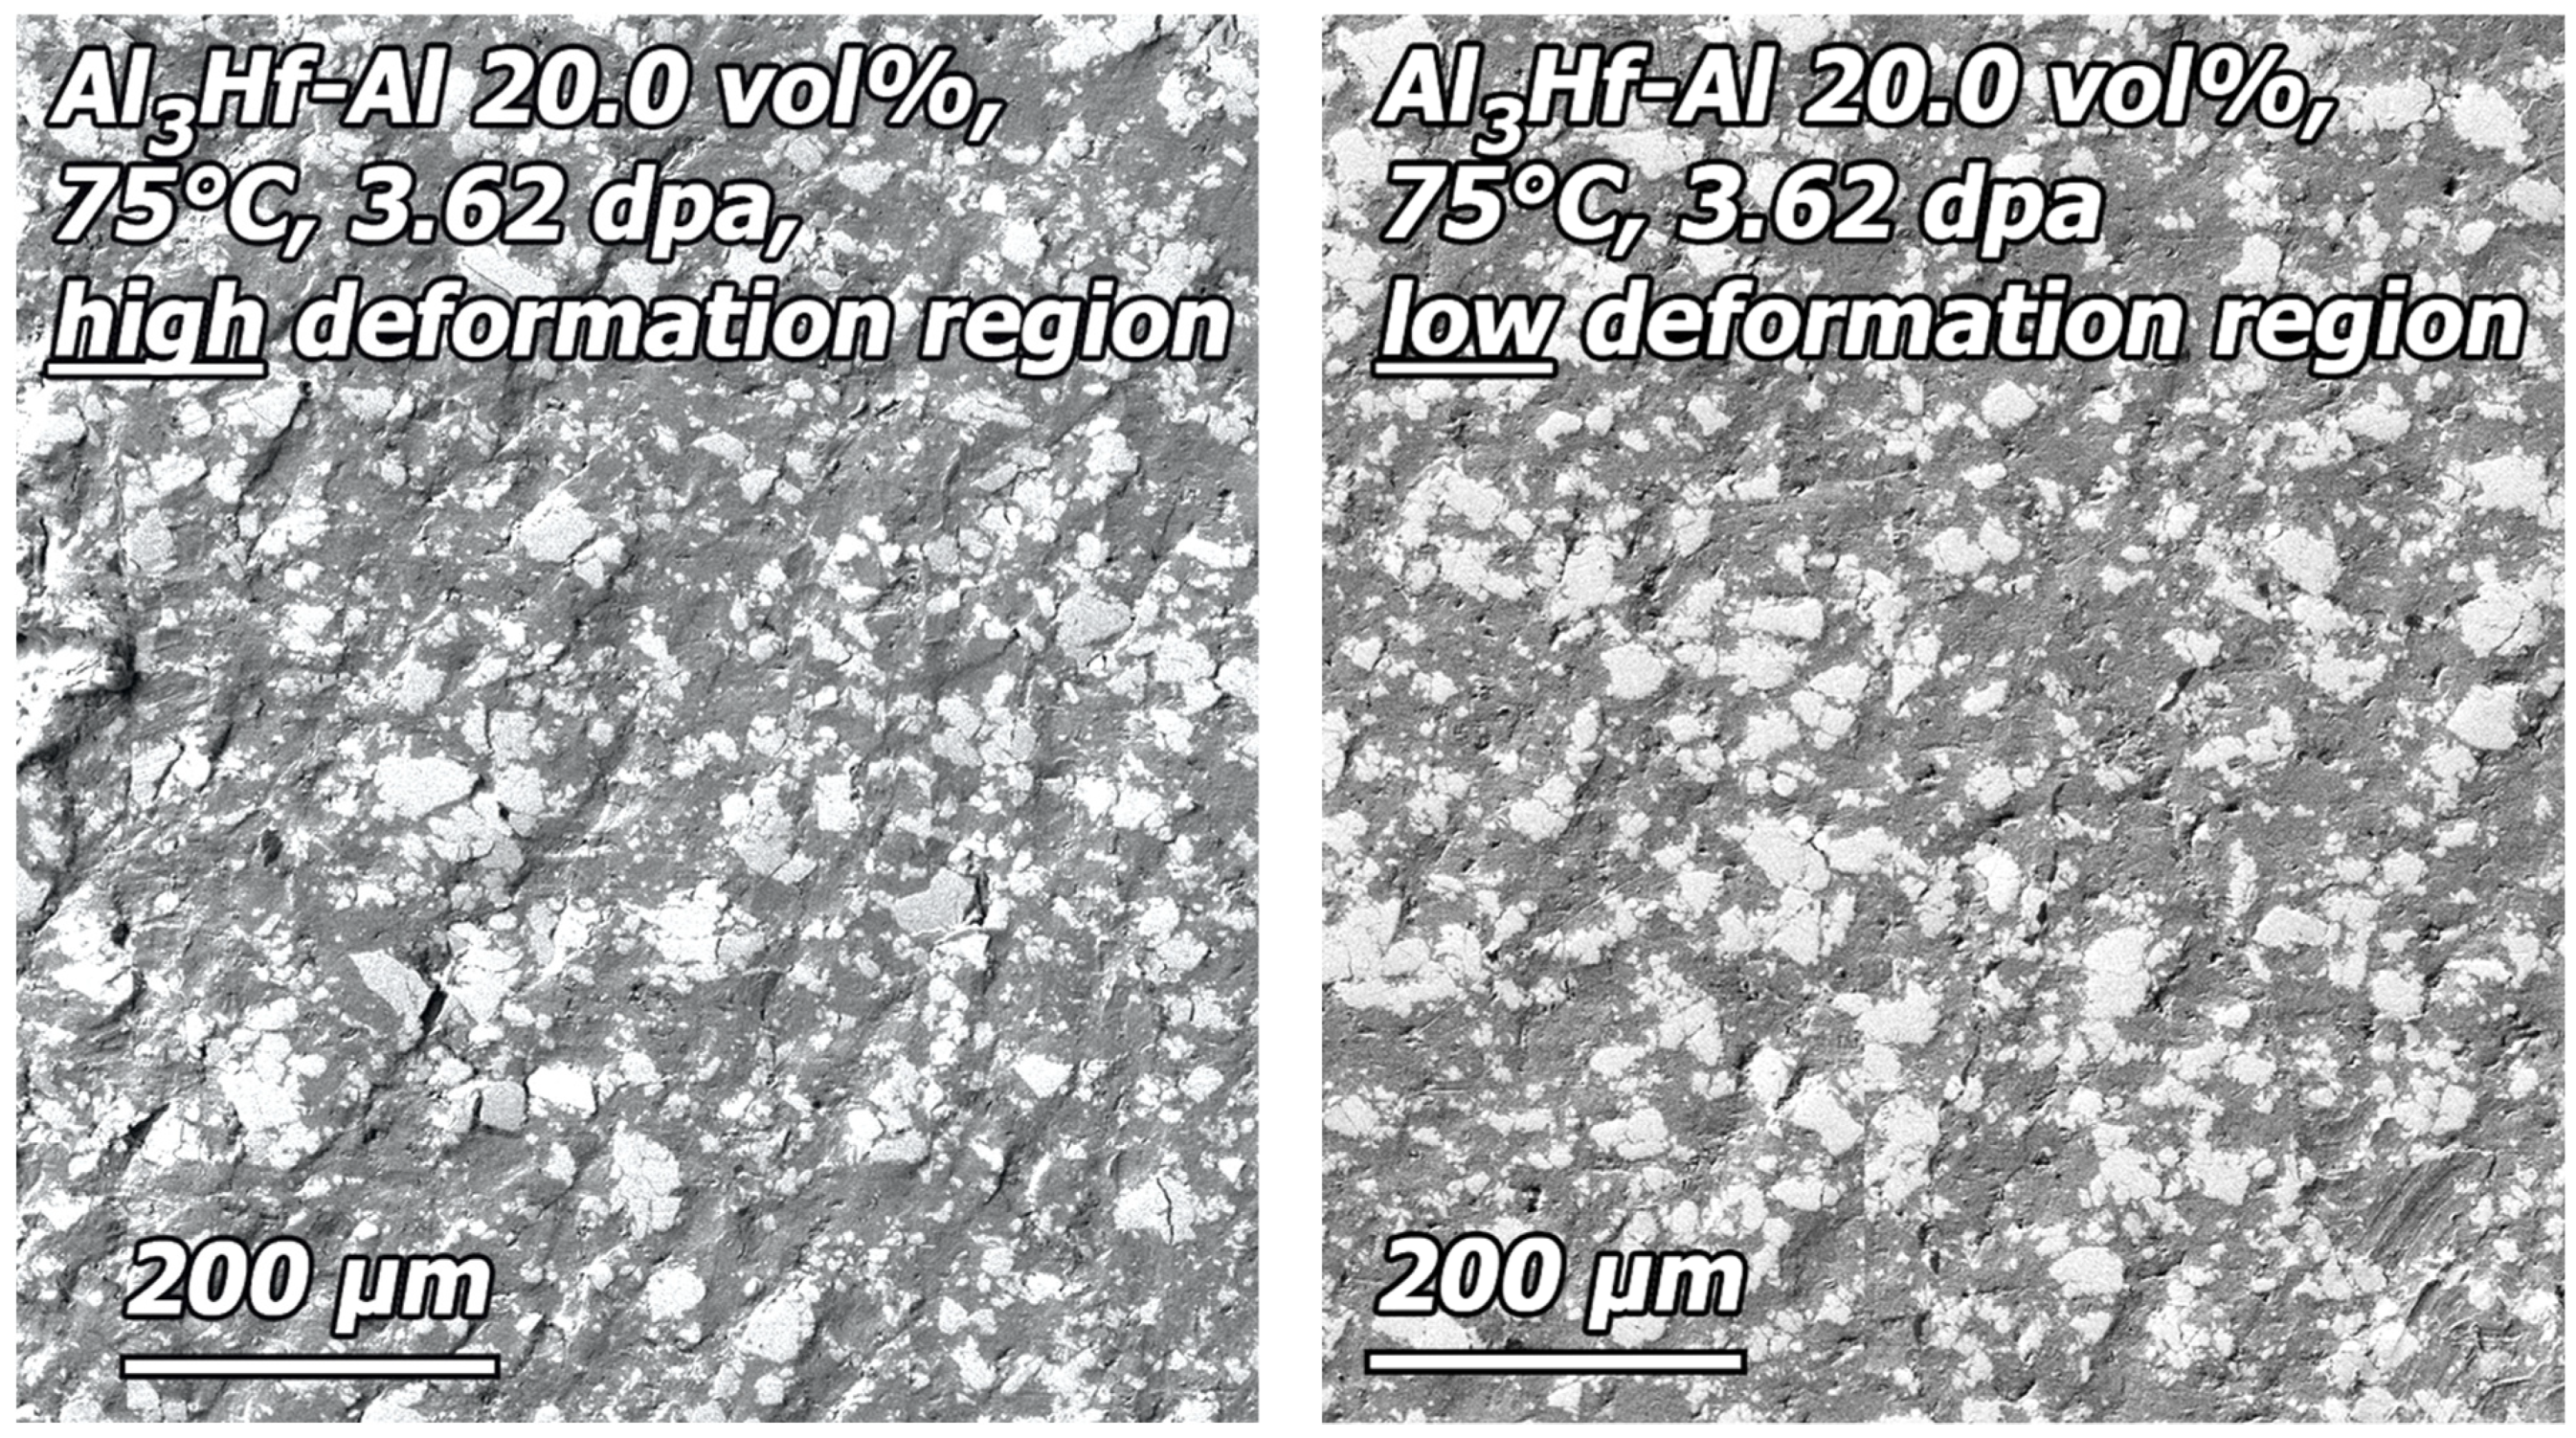
Figure 23.
SEM image of the detail region near the fracture surface an irradiated 20 vol% specimen that has been tensile tested (KGT-1528).
Figure 23.
SEM image of the detail region near the fracture surface an irradiated 20 vol% specimen that has been tensile tested (KGT-1528).
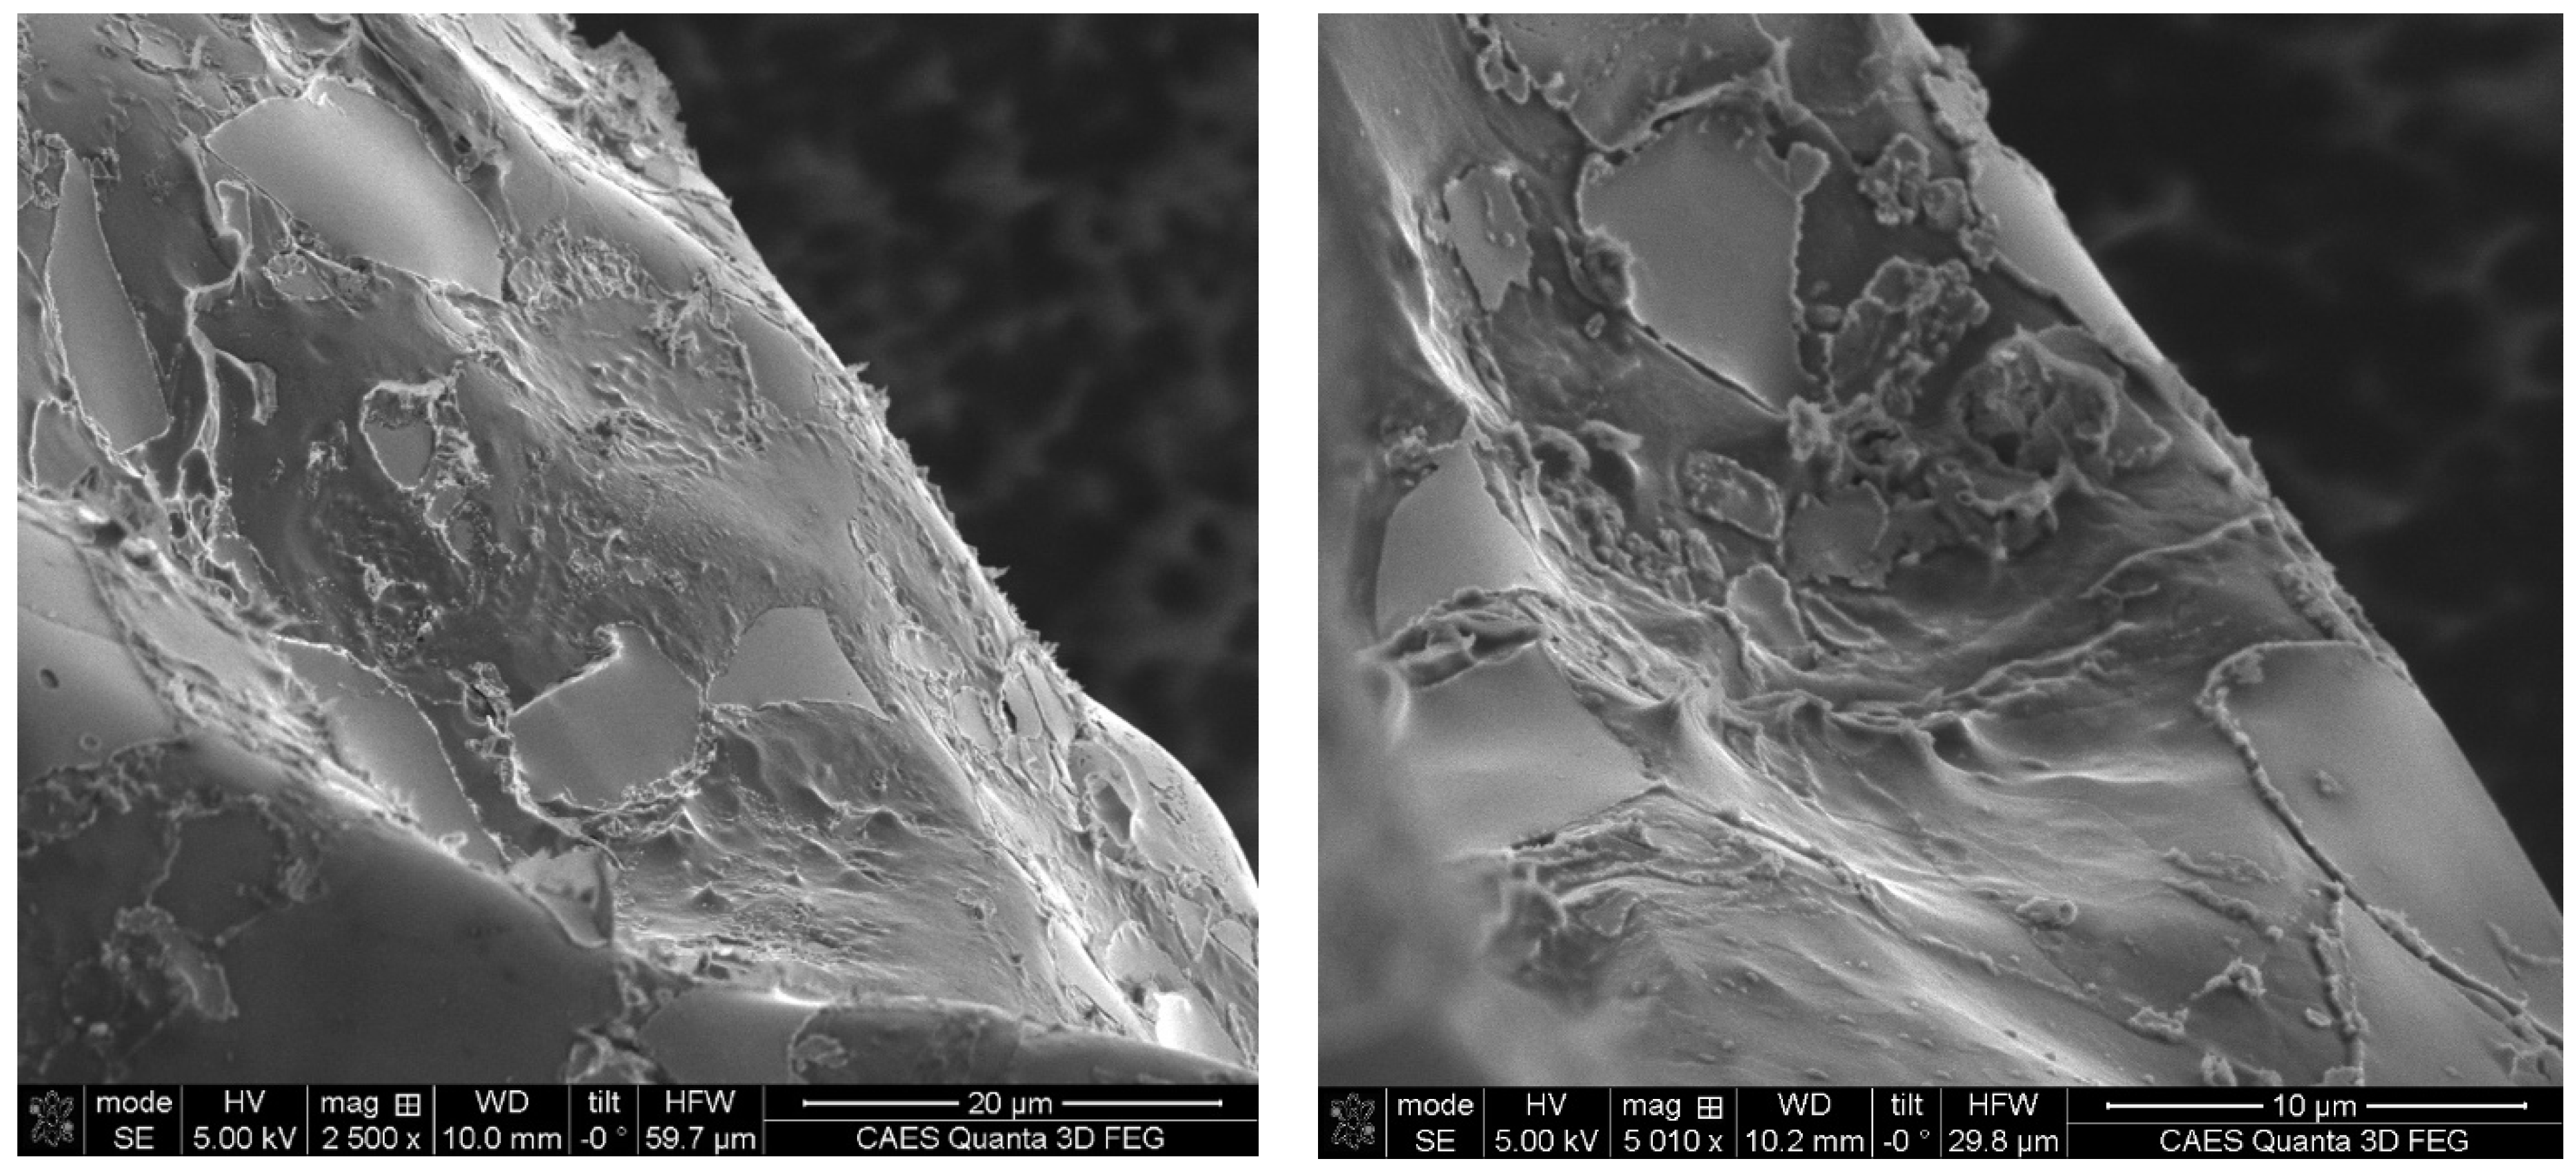
Figure 24.
SEM images of portions of the fracture surface of the 28.4 vol% Al3Hf-Al irradiated specimen (KGT-1404).
Figure 24.
SEM images of portions of the fracture surface of the 28.4 vol% Al3Hf-Al irradiated specimen (KGT-1404).
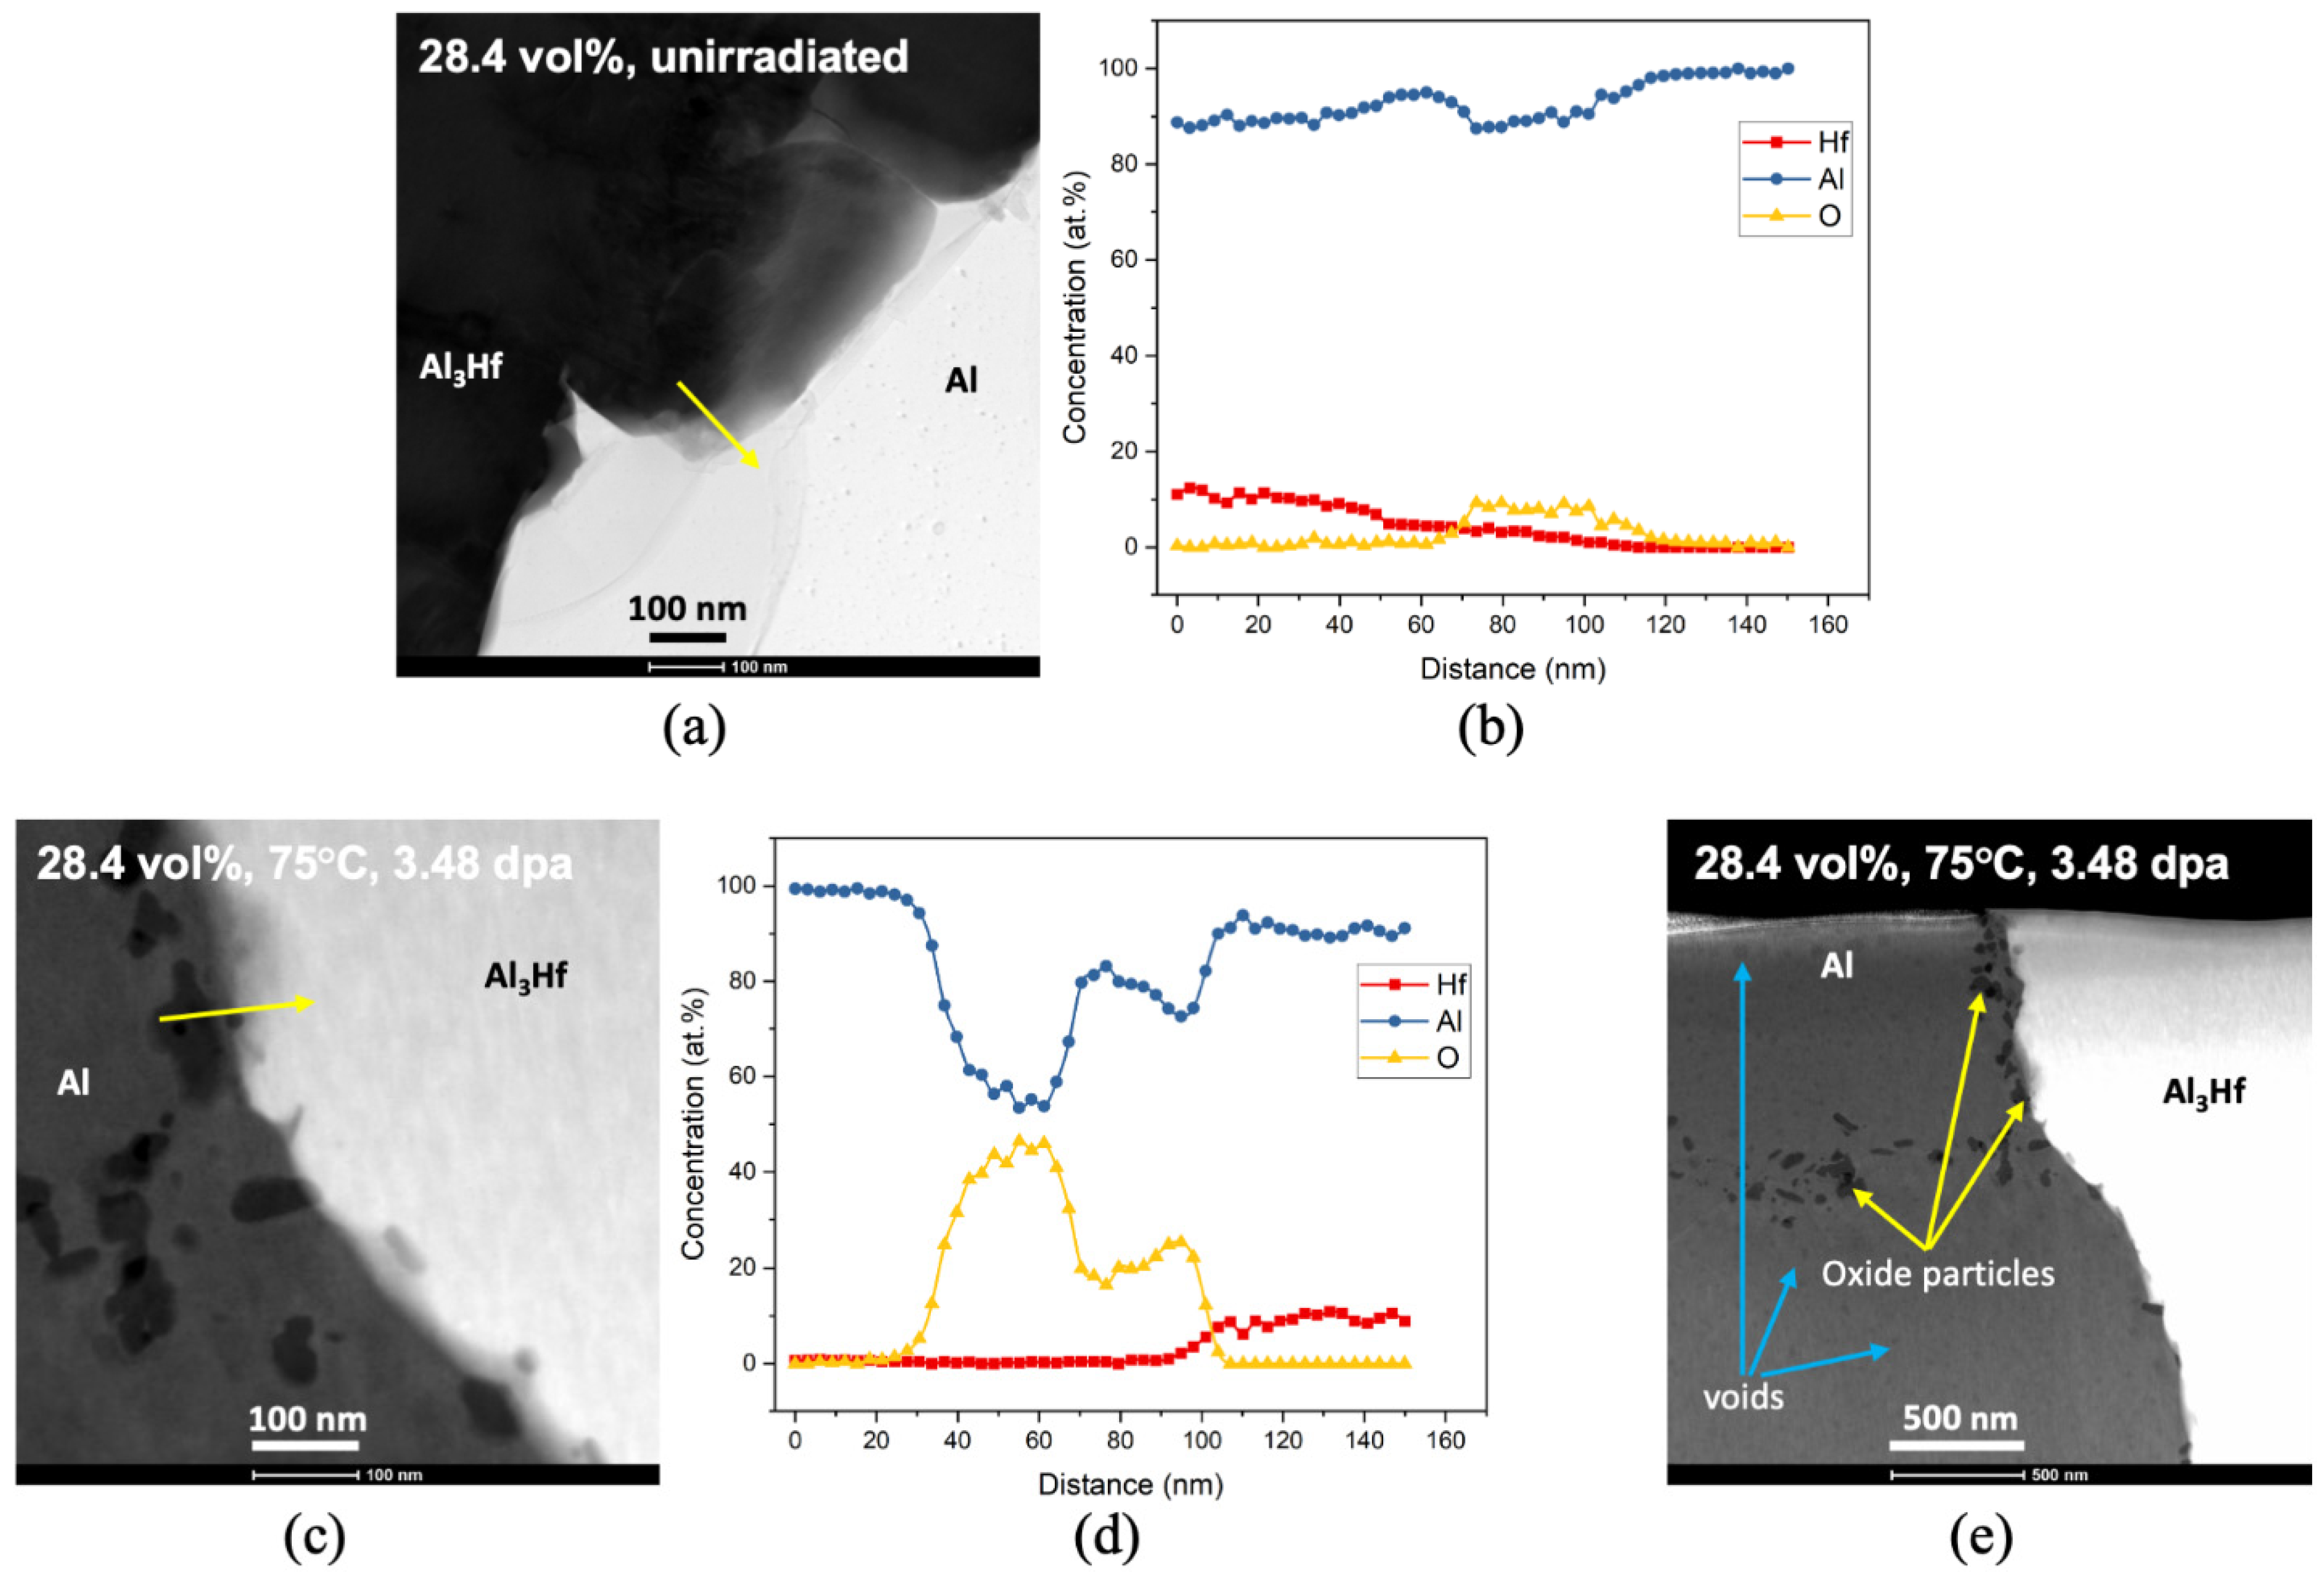
Figure 25.
(a,b) BF STEM images and corresponding EDS linescans for unirradiated 28.4 vol% Al3Hf-Al (arrow indicates direction of the linescan), (c,d) A STEM Z-contrast image and corresponding EDS linescan for irradiated 28.4 vol% Al3Hf-Al from KGT-1404 (arrow indicates direction of the linescan), (e) A STEM Z-contrast image of irradiated Al3Hf-Al to show all the features identified.
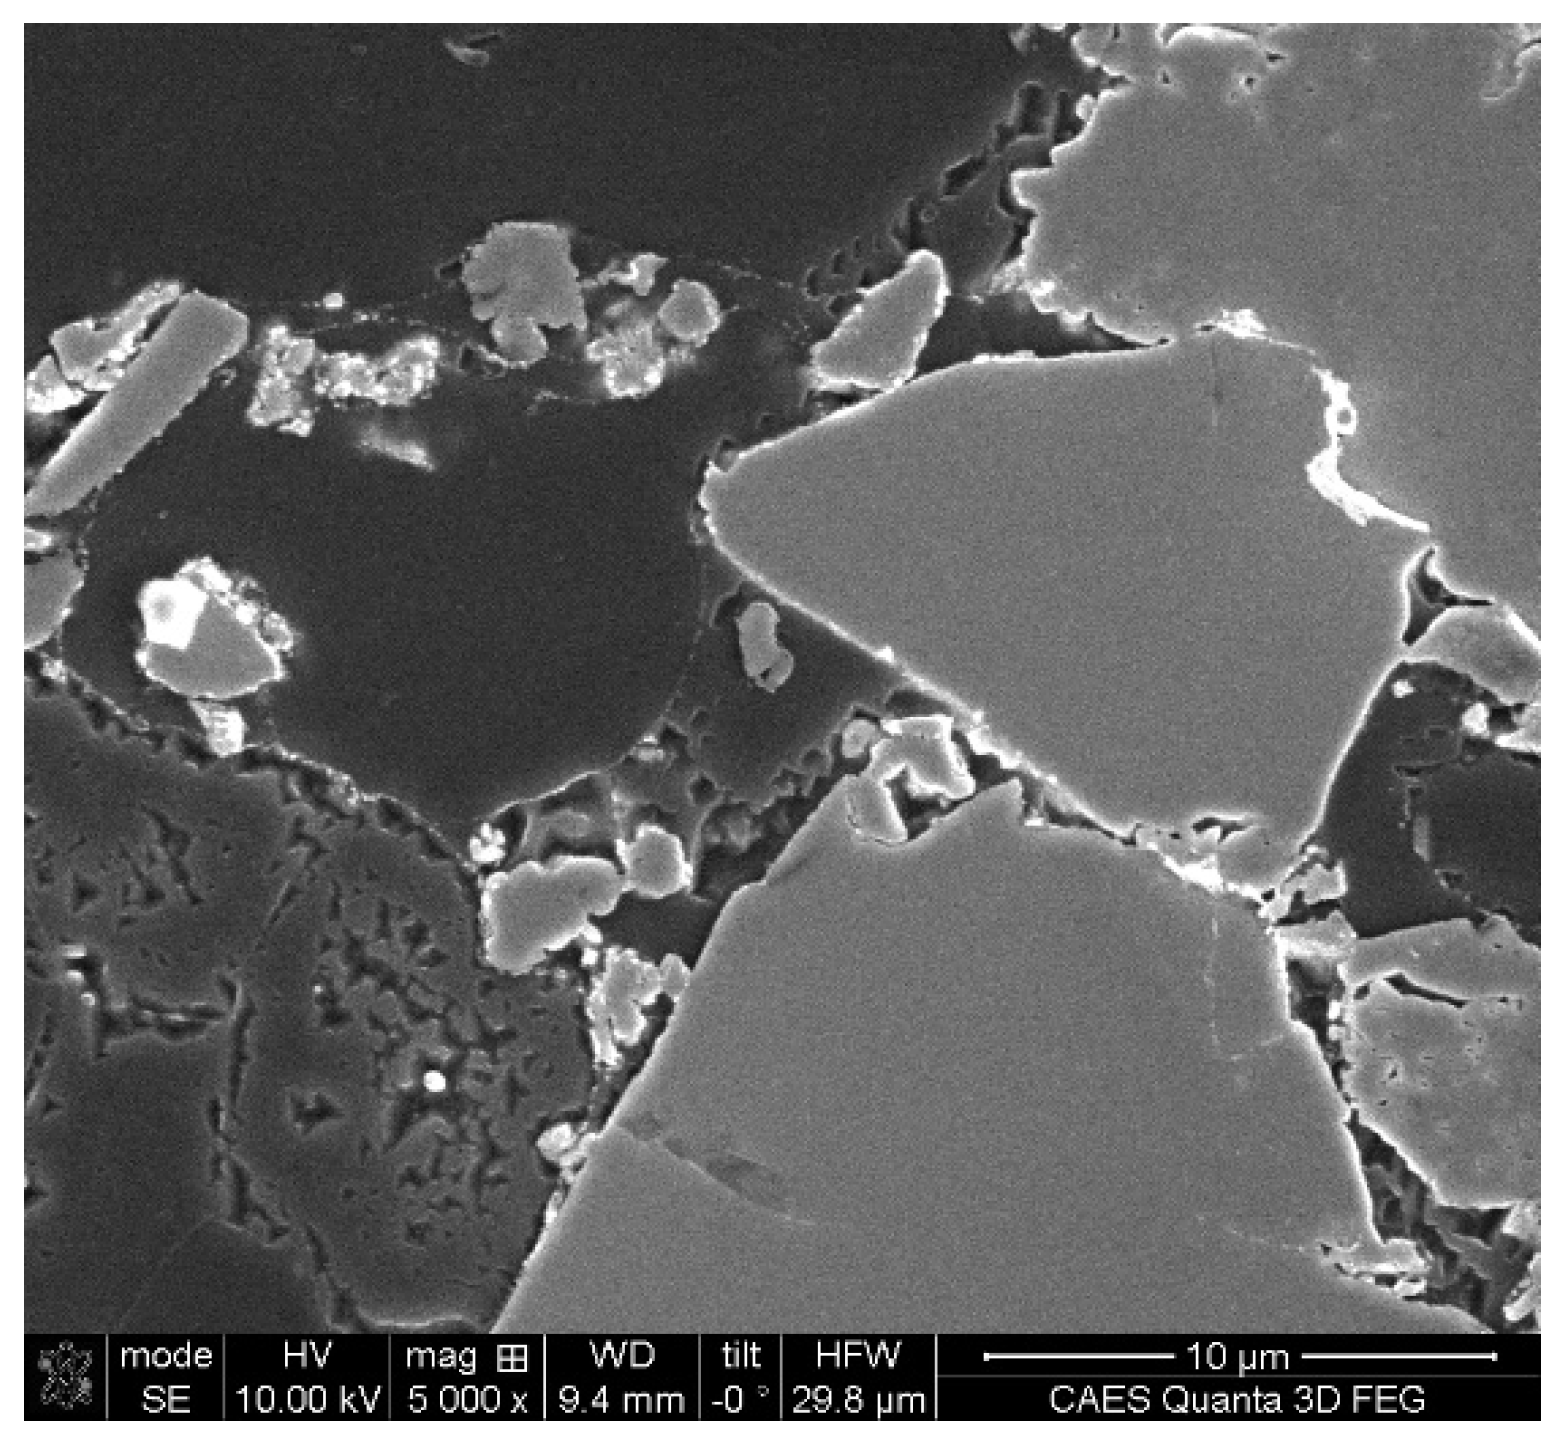
Figure 26.
SEM image showing voids in aluminum matrix (KGT-1404).
Figure 26.
SEM image showing voids in aluminum matrix (KGT-1404).
Table 1.
As-run irradiation conditions of Al
3Hf-Al tensile specimens [
27].
Table 1.
As-run irradiation conditions of Al
3Hf-Al tensile specimens [
27].
| Sample ID | Al3Hf (vol%) | MWd | Fluence (×1025 n/m2) | Est. Avg. Irr. Temp. (°C) | Dose (dpa) |
|---|
| KGT-1443 | 20.0 | 800.6 | 1.382 | 72 | 0.51 |
| KGT-1423 | 28.4 | 800.6 | 1.382 | 70 | 0.46 |
| KGT-1424 | 36.5 | 800.6 | 1.382 | 70 | 0.52 |
| KGT-1484 | 20.0 | 1965.5 | 2.403 | 66 | 1.04 |
| KGT-1448 | 28.4 | 1965.5 | 2.403 | 67 | 1.09 |
| KGT-1449 | 36.5 | 1965.5 | 2.403 | 67 | 1.24 |
| KGT-1508 | 20.0 | 3184.0 | 9.33 | 70 | 2.06 |
| KGT-1488 | 28.4 | 3184.0 | 9.33 | 69 | 1.83 |
| KGT-1489 | 36.5 | 3184.0 | 9.33 | 69 | 2.11 |
| KGT-1528 | 20.0 | 3984.6 | 12.02 | 75 | 3.62 |
| KGT-1404 | 28.4 | 3984.6 | 12.02 | 75 | 3.48 |
| KGT-1405 | 36.5 | 3984.6 | 12.02 | 74 | 3.97 |
Table 2.
Density and weight percent of elemental content as a function of Al3Hf vol%.
Table 2.
Density and weight percent of elemental content as a function of Al3Hf vol%.
| | 20 vol% Al3Hf | 28.4 vol% Al3Hf | 36.5 vol% Al3Hf | 100% Al3Hf |
|---|
| Density (kg m−3) | 3.43 | 3.74 | 3.95 | 6.03 |
| Element | Elemental Composition (wt%) |
| Al | 74.76 | 67.04 | 60.7 | 31.2 |
| Zr | 0.885 | 0.885 | 0.885 | 0.885 |
| Hf | 24.36 | 32.08 | 38.42 | 67.92 |
Table 3.
Irradiation conditions for thermal expansion specimens [
27,
28].
Table 3.
Irradiation conditions for thermal expansion specimens [
27,
28].
| Specimen ID | Al3Hf vol% | Irr. Temp. (°C) | Dose (dpa) |
|---|
| KGT-1399 | 20.0 | 84 | 3.63 |
| KGT-1536 | 28.4 | 125 | 3.56 |
| KGT-1544 | 36.5 | 84 | 3.55 |
Table 4.
Vickers microhardness values of Al3Hf-Al samples as a function of dose and volume fraction of Al3Hf.
Table 4.
Vickers microhardness values of Al3Hf-Al samples as a function of dose and volume fraction of Al3Hf.
| Specimens | Dose (dpa) | Avg. Hardness (kg/mm2) | Hardness Std. Dev. (kg/mm2) | Avg. Indent Size (µm) |
|---|
| 20 vol% | | | | |
| unirradiated | 0 | 46.9 | 2.6 | 140.7 |
| KGT-1443 | 0.51 | 55.4 | 2.5 | 129.5 |
| KGT-1484 | 1.04 | 59.2 | 3.9 | 124.9 |
| KGT-1508 | 2.06 | 59.9 | 4.4 | 124.6 |
| KGT-1528 | 3.62 | 64.8 | 4.7 | 119.7 |
| 28.4 vol% | | | | |
| unirradiated | 0 | 60.0 | 4.9 | 124.1 |
| KGT-1423 | 0.46 | 70.4 | 5.7 | 115.4 |
| KGT-1448 | 1.09 | 76.5 | 6.9 | 111.4 |
| KGT-1488 | 1.83 | 75.8 | 6.6 | 111.2 |
| KGT-1404 | 3.48 | 82.5 | 7.0 | 106.7 |
| 36.5 vol% | | | | |
| unirradiated | 0 | 77.0 | 10.4 | 111.0 |
| KGT-1424 | 0.52 | 81.9 | 4.6 | 106.7 |
| KGT-1449 | 1.24 | 89.5 | 7.1 | 101.8 |
| KGT-1489 | 2.11 | 93.9 | 10.0 | 99.7 |
| KGT-1405 | 3.97 | 97.0 | 8.7 | 98.2 |
Table 5.
Measured nanohardness for an unirradiated and irradiated specimen.
Table 5.
Measured nanohardness for an unirradiated and irradiated specimen.
| Type of Specimen | Hardness (GPa) |
|---|
| Unirradiated (36.5 vol%) | 7.6 ± 0.8 |
| Irradiated (KGT-1404; 28.5 vol%) | 8.0 ± 0.3 |
Table 6.
Room temperature tensile properties of the unirradiated Al3Hf-Al samples.
Table 6.
Room temperature tensile properties of the unirradiated Al3Hf-Al samples.
| Al3Hf vol% | Condition | Test Temp. (°C) | 0.2% Offset YS (MPa) | UTS (MPa) | UTS/YS Ratio | UE (%) | TE (%) |
|---|
| 20.0 | Unpolished | Ambient | 82 | 122 | 1.49 | 8.8 | 14.8 |
| 28.4 | Unpolished | Ambient | 126 | 148 | 1.17 | 2.6 | 4.8 |
| 36.5 | Unpolished | Ambient | 152 | 172 | 1.13 | 1.1 | 1.4 |
Table 7.
Tensile properties of the unirradiated Al3Hf-Al samples at 200 °C.
Table 7.
Tensile properties of the unirradiated Al3Hf-Al samples at 200 °C.
| Al3Hf vol% | Condition | Test Temp. (°C) | 0.2% Offset YS (MPa) | UTS (MPa) | UTS/YS Ratio | UE (%) | TE (%) |
|---|
| 20.0 | Unpolished | 200 | 62 | 76 | 1.23 | 4.3 | 20.3 |
| 20.0 | Polished | 200 | 68 | 83 | 1.22 | 7.2 | 19.5 |
| 20.0 vol% Average | 65 | 79.5 | 1.225 | 5.8 | 19.9 |
| 28.4 | Unpolished | 200 | 83 | 102 | 1.23 | 4.0 | 8.6 |
| 28.4 | Polished | 200 | 66 | 95 | 1.44 | 4.1 | 9.5 |
| 28.4 vol% Average | 74.5 | 98.5 | 1.34 | 4.05 | 9.05 |
| 36.5 | Unpolished | 200 | 93 | 125 | 1.34 | 1.9 | 4.4 |
| 36.5 | Polished | 200 | 92 | 125 | 1.36 | 1.9 | 4.6 |
| 36.5 vol% Average | 92.5 | 125 | 1.35 | 1.9 | 4.5 |
Table 8.
Tensile properties of the irradiated Al3Hf-Al samples tested at 200 °C.
Table 8.
Tensile properties of the irradiated Al3Hf-Al samples tested at 200 °C.
| Specimen Identifier | Al3Hf vol% | Irr. Temp. (°C) | Dose (dpa) | Test Temp. (°C) | 0.2% offset YS (MPa) | UTS (MPa) | UTS/YS | UE (%) | TE (%) |
|---|
| B3 (unirr) | 20.0 | N/A | 0 | 200 | 65 | 83 | 1.22 | 7.2 | 19.5 |
| KGT-1443 | 20.0 | 72 | 0.51 | 200 | 76 | 92 | 1.21 | 2.8 | 13.0 |
| KGT-1484 | 20.0 | 66 | 1.04 | 200 | 76 | 98 | 1.29 | 4.0 | 15.8 |
| KGT-1508 | 20.0 | 70 | 2.06 | 200 | 82 | 99 | 1.21 | 3.6 | 11.0 |
| KGT-1528 | 20.0 | 75 | 3.62 | 200 | 103 | 116 | 1.13 | 2.4 | 11.6 |
| B2 (unirr) | 28.4 | N/A | 0 | 200 | 74.5 | 95 | 1.44 | 4.1 | 9.5 |
| KGT-1423 | 28.4 | 70 | 0.46 | 200 | 84 | 114 | 1.36 | 2.8 | 7.8 |
| KGT-1448 | 28.4 | 67 | 1.09 | 200 | 106 | 131 | 1.24 | 2.3 | 7.1 |
| KGT-1488 | 28.4 | 69 | 1.83 | 200 | 92 | 134 | 1.34 | 2.8 | 7.8 |
| KGT-1404 | 28.4 | 75 | 3.48 | 200 | 114 | 140 | 1.23 | 2.2 | 5.2 |
| B1 (unirr) | 36.5 | N/A | 0 | 200 | 92.5 | 125 | 1.36 | 1.9 | 4.6 |
| KGT-1424 | 36.5 | 70 | 0.52 | 200 | 96 | 129 | 1.34 | 1.8 | 3.2 |
| KGT-1449 | 36.5 | 67 | 1.24 | 200 | 132 | 163 | 1.23 | 1.9 | 2.9 |
| KGT-1489 | 36.5 | 69 | 2.11 | 200 | 134 | 158 | 1.18 | 1.4 | 2.4 |
| KGT-1405 | 36.5 | 74 | 3.97 | 200 | 153 | 172 | 1.12 | 1.0 | 1.5 |
Table 9.
Changes in mechanical properties of Al3Hf-Al as a result of irradiation.
Table 9.
Changes in mechanical properties of Al3Hf-Al as a result of irradiation.
| Specimen Identifier | Al3Hf vol% | Dose (dpa) | Test Temp. (°C) | Percent Change After Irradiation |
|---|
| 0.2% offset YS | UTS | UE | TE |
|---|
| B3 (unirradiated) | 20 | 0 | 200 | 0 | 0 | 0 | 0 |
| KGT-1443 | 0.51 | 17 | 11 | −61 | −33 |
| KGT-1484 | 1.04 | 17 | 18 | −44 | −19 |
| KGT-1508 | 2.06 | 26 | 19 | −50 | −44 |
| KGT-1528 | 3.62 | 58 | 40 | −67 | −41 |
| B2 (unirradiated) | 28.4 | 0 | 200 | 0 | 0 | 0 | 0 |
| KGT-1423 | 0.46 | 13 | 20 | −32 | −18 |
| KGT-1448 | 1.09 | 42 | 38 | −44 | −25 |
| KGT-1488 | 1.83 | 23 | 41 | −32 | −18 |
| KGT-1404 | 3.48 | 53 | 47 | −46 | −45 |
| B1 (unirradiated) | 36.5 | 0 | 200 | 0 | 0 | 0 | 0 |
| KGT-1424 | 0.52 | 4 | 3 | −5 | −30 |
| KGT-1449 | 1.24 | 43 | 30 | 0 | −37 |
| KGT-1489 | 2.11 | 45 | 26 | −26 | −48 |
| KGT-1405 | 3.97 | 65 | 38 | −47 | −67 |
Table 10.
Regression results for measured linear coefficients of thermal expansion for the unirradiated materials.
Table 10.
Regression results for measured linear coefficients of thermal expansion for the unirradiated materials.
|
|---|
| | | |
| −9.499 × 10⁻³ | 8.375 × 10⁻⁴ | −4.560 × 10⁻⁶ | 2.045 |
Table 11.
Regression results for measured linear coefficients of thermal expansion for annealed irradiated material.
Table 11.
Regression results for measured linear coefficients of thermal expansion for annealed irradiated material.
|
|---|
| Al3Hf vol% | | | |
|---|
| 20.0 | −1.890 | 3.192 | 1.039 |
| 28.4 | −1.541 | 2.583 | 1.163 |
| 36.5 | −1.882 | 2.891 | 0.9447 |


 ,
, 


