Article

Structure of Complex Concentrated Alloys Derived from Iron Aluminide Fe3Al

1
Department of Physics of Materials, Faculty of Mathematics and Physics, Charles University, Ke Karlovu 5, 12116 Prague, Czech Republic
2
Department of Condensed Matter Physics, Faculty of Mathematics and Physics, Charles University, Ke Karlovu 5, 12116 Prague, Czech Republic
3
Department of Foundry Engineering, Brno University of Technology, Technická 2896/2, 61669 Brno, Czech Republic
*
Author to whom correspondence should be addressed.
Materials 2023, 16(15), 5388; https://doi.org/10.3390/ma16155388
Submission received: 15 June 2023 / Revised: 24 July 2023 / Accepted: 26 July 2023 / Published: 31 July 2023

Abstract

:
The phase structure and composition of a series of four alloys based on Fe3Al was investigated by means of scanning electron microscopy, X-ray diffraction and transmission electron microscopy. The materials were composed of Fe and Al with a fixed ratio of 3:1 alloyed with V, Cr and Ni at 8, 12, 15 and 20 at. % each (composition formula: Fe3(100−3x)/4 Al(100−3x)/4VxCrxNix). For 8% alloying, the material is single-phase D03. Furthermore, 12 and 15% alloying results in bcc–B2 phase separation on two length scales. Moreover, 20% alloying gives rise to the FeNiCrV σ phase supplemented by B2. These findings are discussed with respect to the results obtained via Calphad modeling using the TCHEA5 database and can serve in further improvement.

1. Introduction

For years, iron-aluminide-based alloys have been known as materials for the development of new structural materials with improved performance with wide applications in industry. They have excellent resistance to oxidation and sulfidation [1,2,3]. Their density is about two-thirds that of the steel density. The balance of the strength and plasticity of these materials is relatively good [4,5,6,7,8,9,10]. The input raw materials are relatively cheap due to their abundance in the Earth’s crust. Therefore, one may ask how far can these preferential properties (based on the B2 and DO3 structures) be maintained or even improved via additional alloying. Similarly, the main drawbacks of these alloys (bad workability at room temperature and low high-temperature (HT) strength) have eventually been improved.
The structural and mechanical properties of complex concentrated alloys (CCAs) are a widely studied subject [11,12,13,14,15,16,17,18,19,20,21,22,23,24,25,26,27]. Various single additives—Ti (0.5 to 4 at. %), Cr (0.5 to 8 at. %), Mo (0.5 to 4 at. %), and V (0.5 to 8 at. %)—effectively improved the yield stress of Fe3Al at 1073 K (800 °C) [11]. The effect of higher concentrations of Cr and V (up to 25 at. %) on the structural and high-temperature mechanical properties was also studied [12]. A detailed study of the ordering in highly alloyed (Cr, V) iron aluminide FeAl using the ALCHEMI method [27] showed that Cr atoms preferentially occupy the positions of Fe atoms and V those of Al. With increasing concentrations of Cr and V, the B2 order decreases, leading to full disorder (A2 structure) in the equiatomic FeAlCrV.
Adding the fifth element gets us to the realm of high-entropy alloys (HEAs). HEAs with body-centered cubic (bcc) structures possess excellent strength, but they often suffer from limited plasticity at room temperatures. Nevertheless, there are some promising results: Wu et al. [15] studied structure development and mechanical properties of TiZrNbMoxVy alloy dependent on the content of Mo (x = 0–2) and V (y = 1 and 0.3). It is shown that the HEAs with low content of V are composed of only one type of bcc solid solution phase and demonstrate excellent phase stability at 1273 K. The high content of V and Mo results in the formation of two types of bcc solid solution phase and a decrease in phase stability in the HEAs. On the other hand, the HEAs with face-centered cubic (fcc) structures have sufficient plasticity, but the strength at high temperatures is substantially lower than for materials with bcc structures [25,26]. He et al. studied a series of six-component (FeCoNiCrMn)100−xAlx (x = 0–20 at. %) HEAs. It was found that the crystalline structure changed from the initial single fcc structure to a duplex fcc+bcc structure and then a single bcc structure as the Al concentration increased. Structural changes were accompanied by corresponding variations in tensile properties. In the single fcc region, alloys behaved like a solid solution with relatively low strength but extended ductility [26].
In our previous study [12], eight iron aluminide alloys with different contents of V and Cr were prepared up to 25 at. % of both elements. All the alloys were in a solid solution condition without any major chemical inhomogeneity. For all alloys, a comparable grain size and D03 crystallographic structure was observed. In the present work, we want to extend the knowledge about the structure of CCAs based on Fe3Al for the case of simultaneous addition of Cr, V, and Ni. It will be interesting to see how far will the D03 structure of parent Fe3Al be retained under these conditions. Moreover, structural information alone can be used to verify and possibly improve material modeling within the Calphad approach.

2. Materials and Methods

A set of alloys based on Fe3Al iron aluminide was prepared. The ratio of Fe:Al was kept constant (3:1) while nominal concentrations of Ni, Cr and V varied: 8, 12, 15, and 20 at. %. These alloys were denoted as 50-F3A, 51-F3A, 54-F3A and 52-F3A, respectively. The mean concentration of the technological impurities coming from the metals used for the preparation of the alloys was: 0.01 at. % B, 0.1 at. % Mn and 0.06 at. % C. The volume fraction of such particles (mainly V carbide and Al oxide) is smaller than 1 vol.%.
The ingots were cast under a vacuum using an induction furnace with intensive stirring during melting. The subsequent slow cooling took place in the argon atmosphere. All alloys were further annealed at 1000 °C for 10 days in order to prepare homogeneous material in thermodynamic equilibrium.
A scanning electron microscope (SEM), Zeiss Auriga Compact, was used to visualize the structure of the alloys. The microscope was equipped with an EDAX detector for energy dispersive X-ray analysis (EDX). The surface of the alloys was prepared via mechanical polishing with a decreasing grain size down to 25 nm. The chemical composition of all samples was measured from a sufficiently large area—larger than 2 × 2 mm2. At least three measurements were performed for each sample.
Transmission electron microscopy (TEM) observations were carried out on JEOL JEM-2200FS operating at 200 kV. Samples were polished on SiC down to the thickness of about 100 µm. Finally, Struers Tenupol 5 was used to electropolish the specimens at 15 V and −25 °C in the 17% solution of HClO4 in methanol. Electropolishing in 20% solution of HNO3 in methanol—an usual electrolyte for FeAl alloys—resulted in preferential etching of the bcc phase.
X-ray diffraction (XRD) was performed using a Rigaku Rapid II diffractometer with a sealed Mo tube, curved 2D detector for measurement in transmission mode and a Mo Kα graphite monochromator (λ = 0.0709319 nm). Diffraction patterns from mechanically thinned TEM samples were acquired while rocking in two axes.

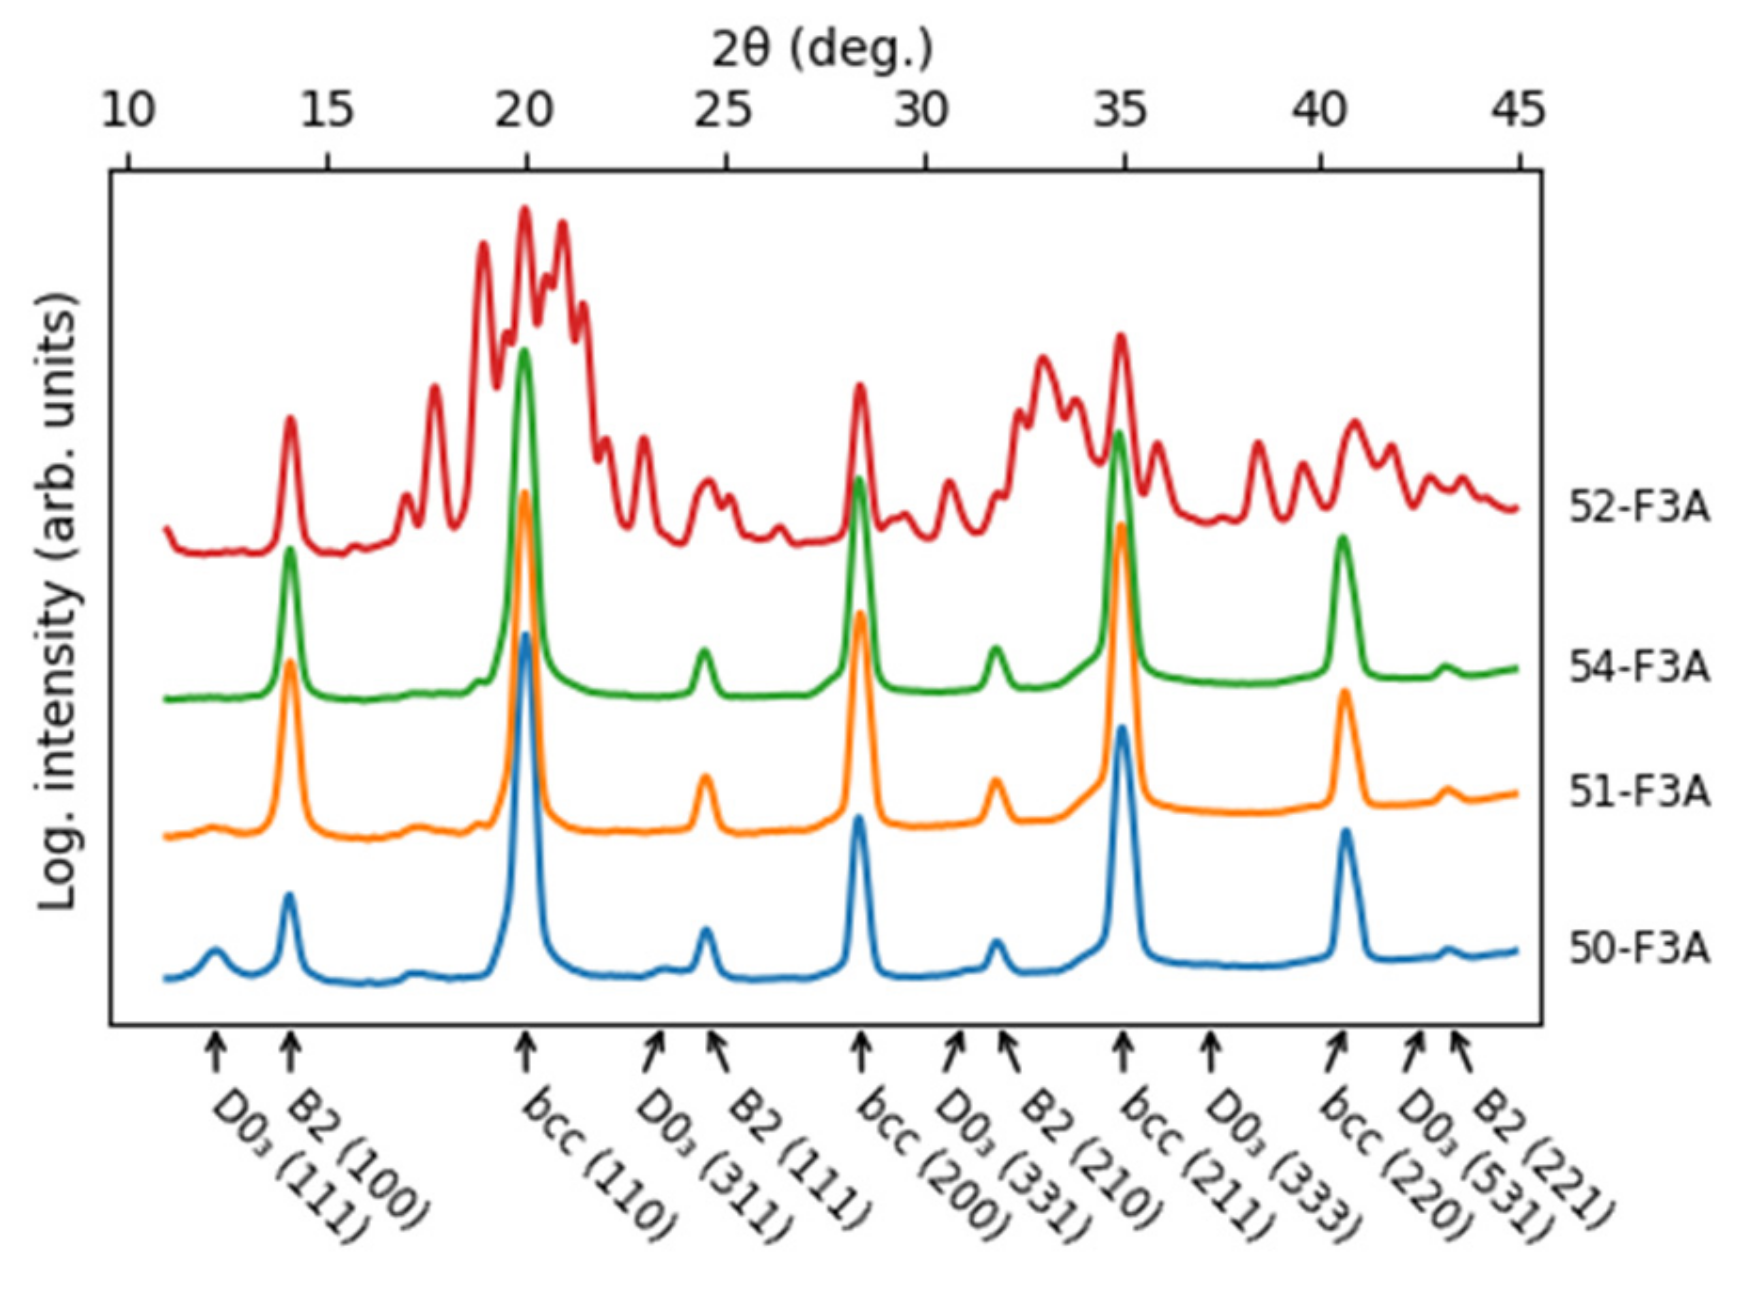
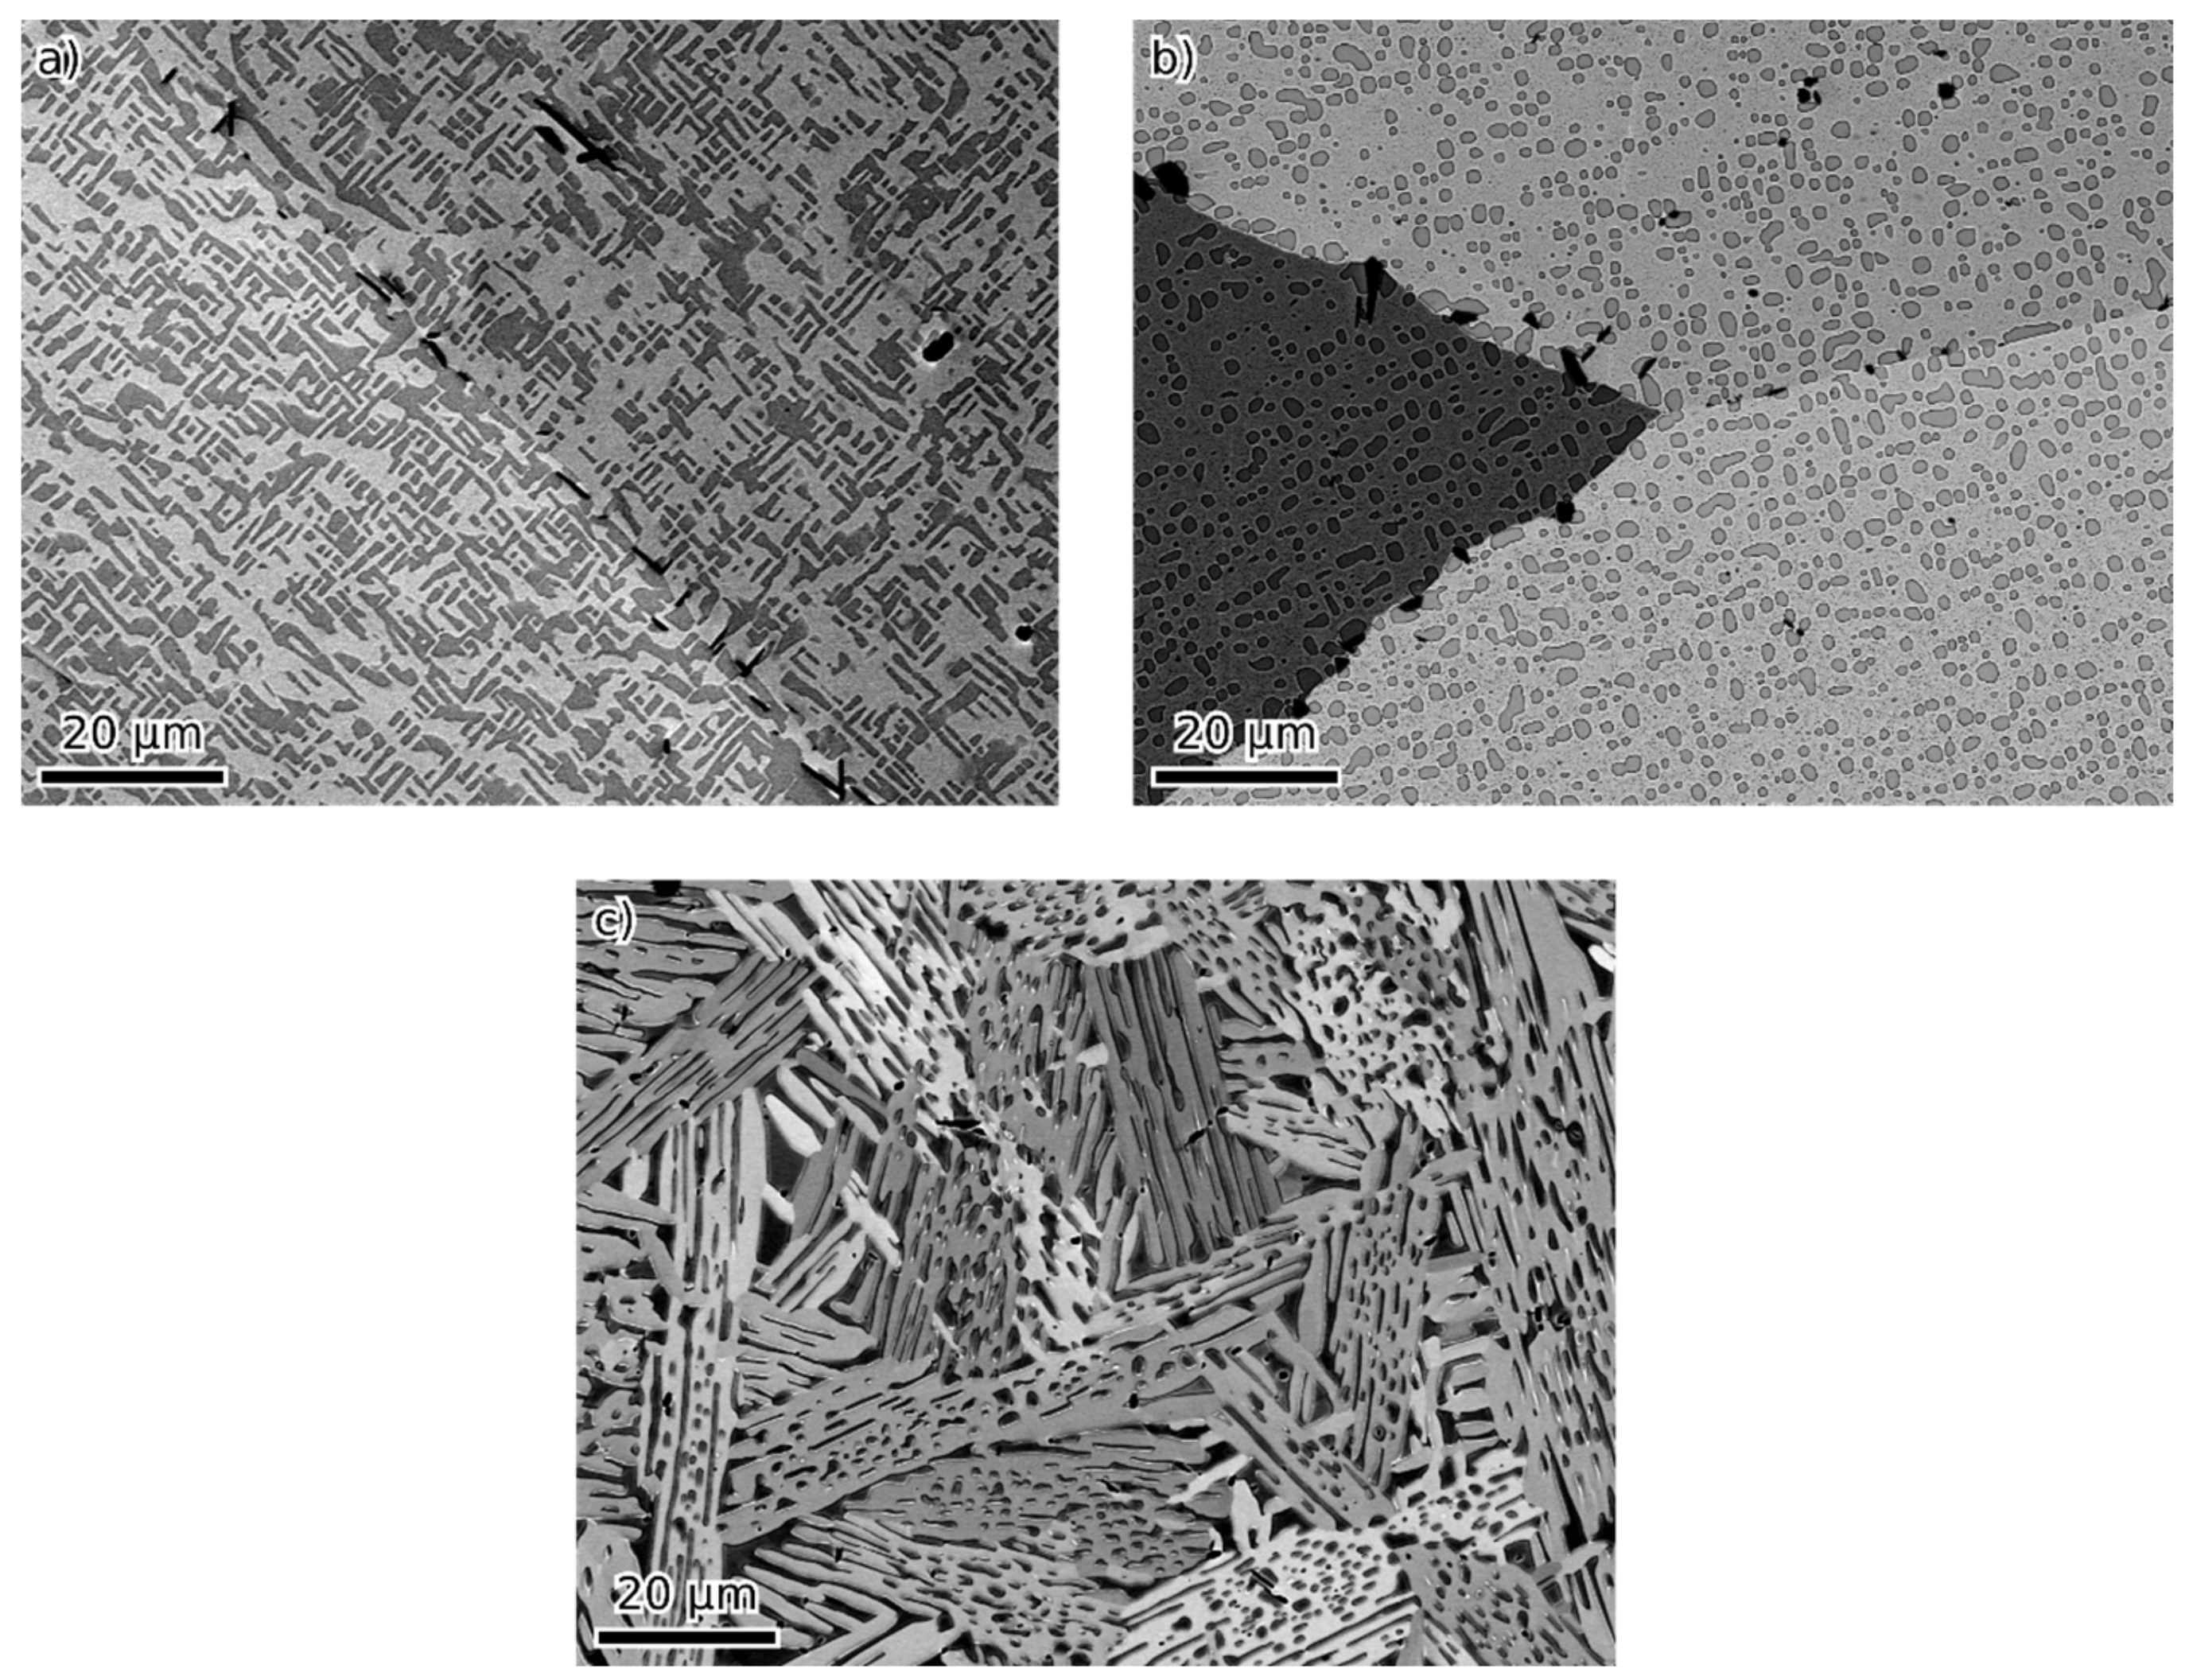
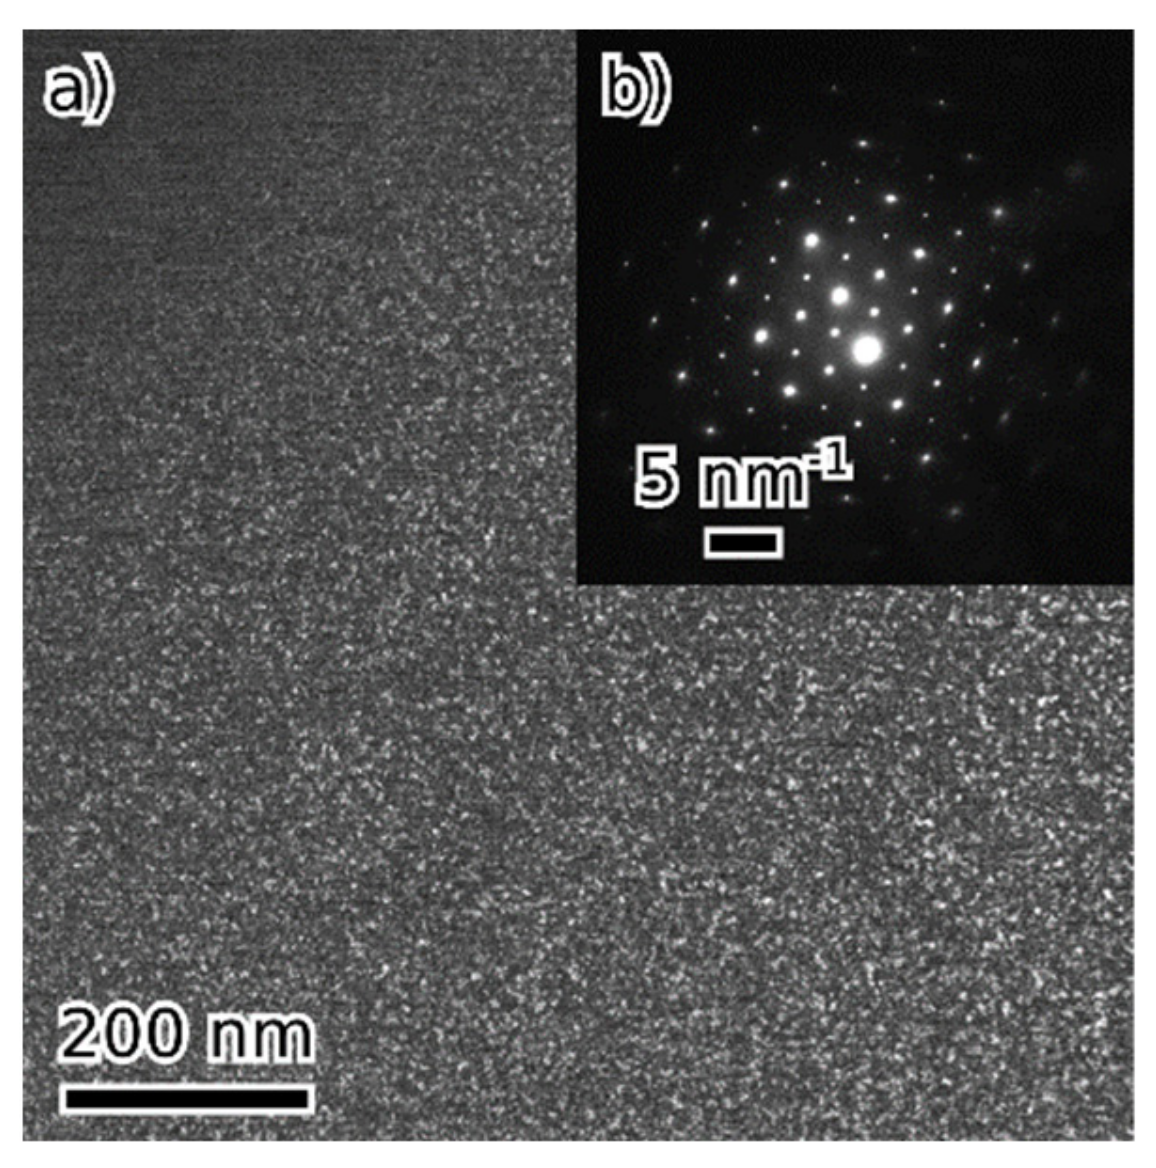
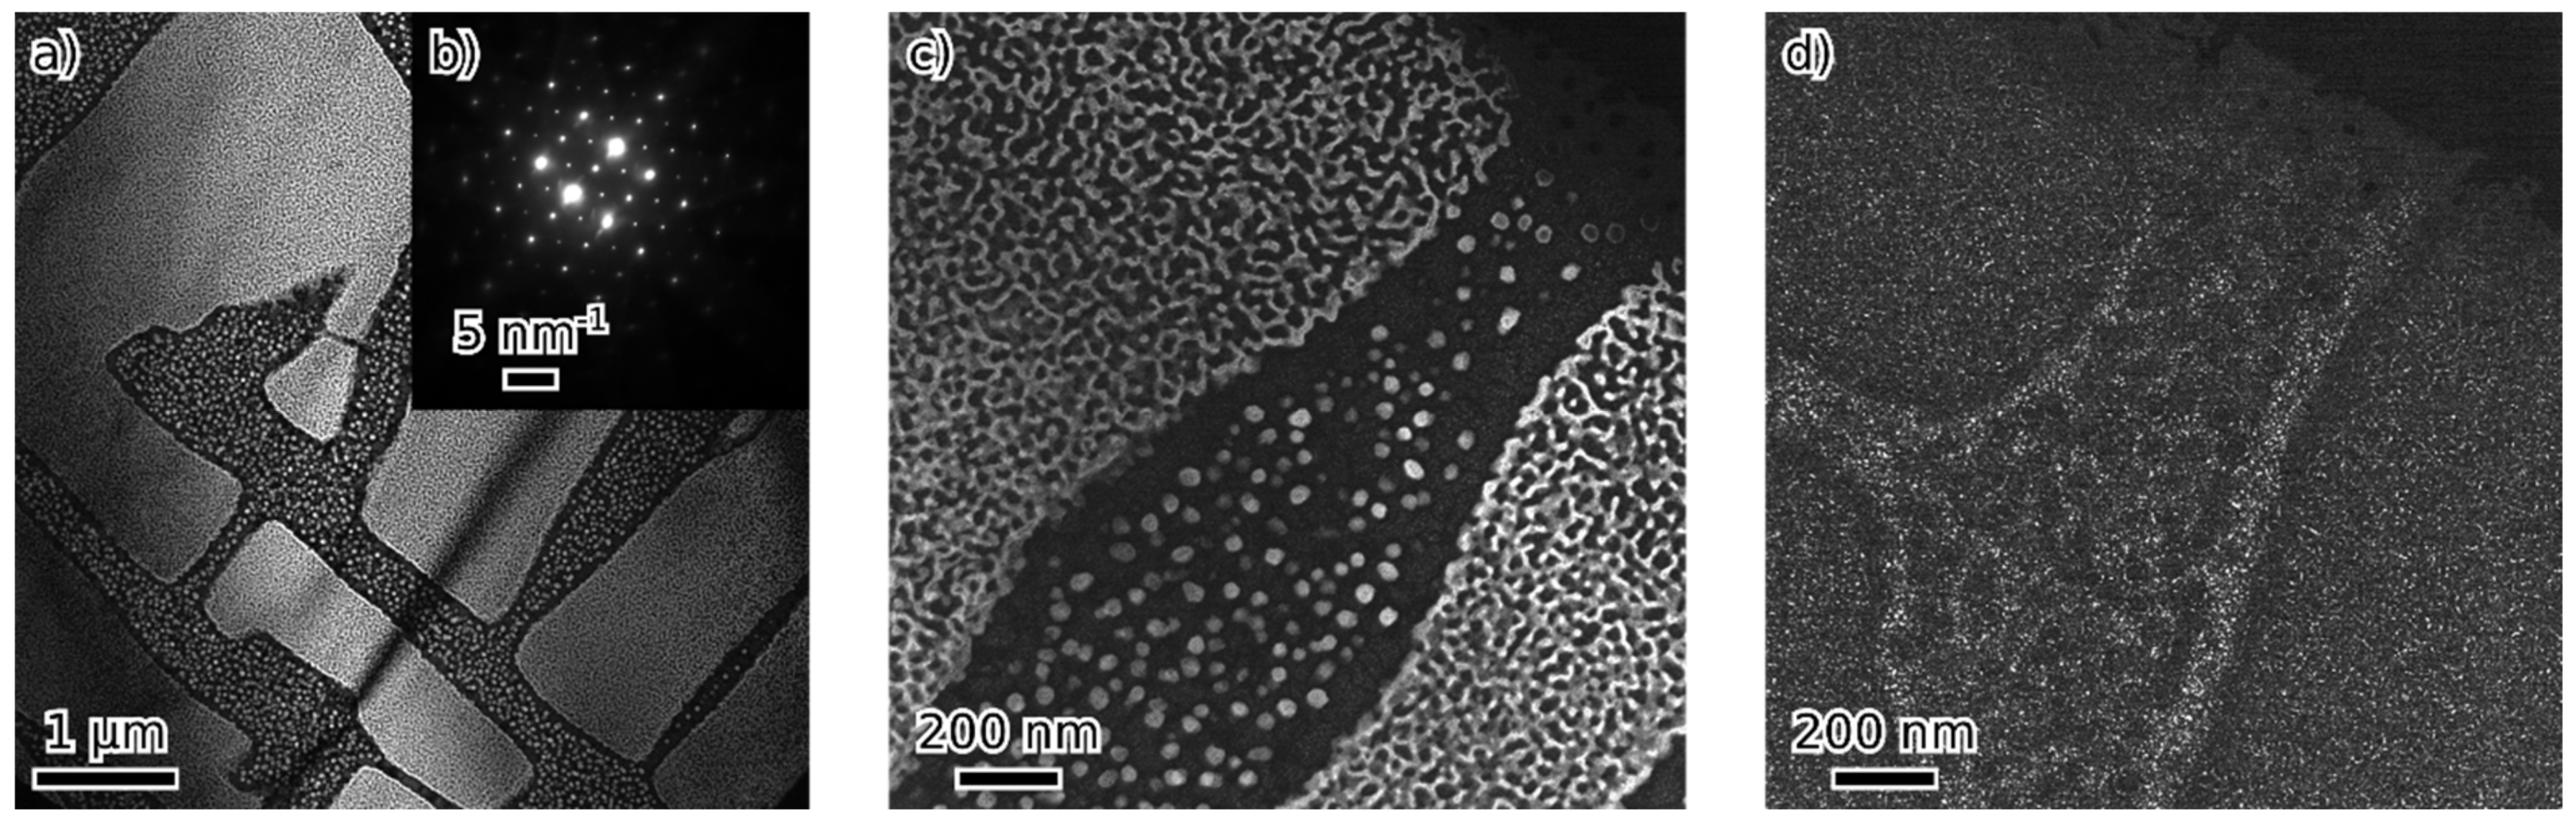
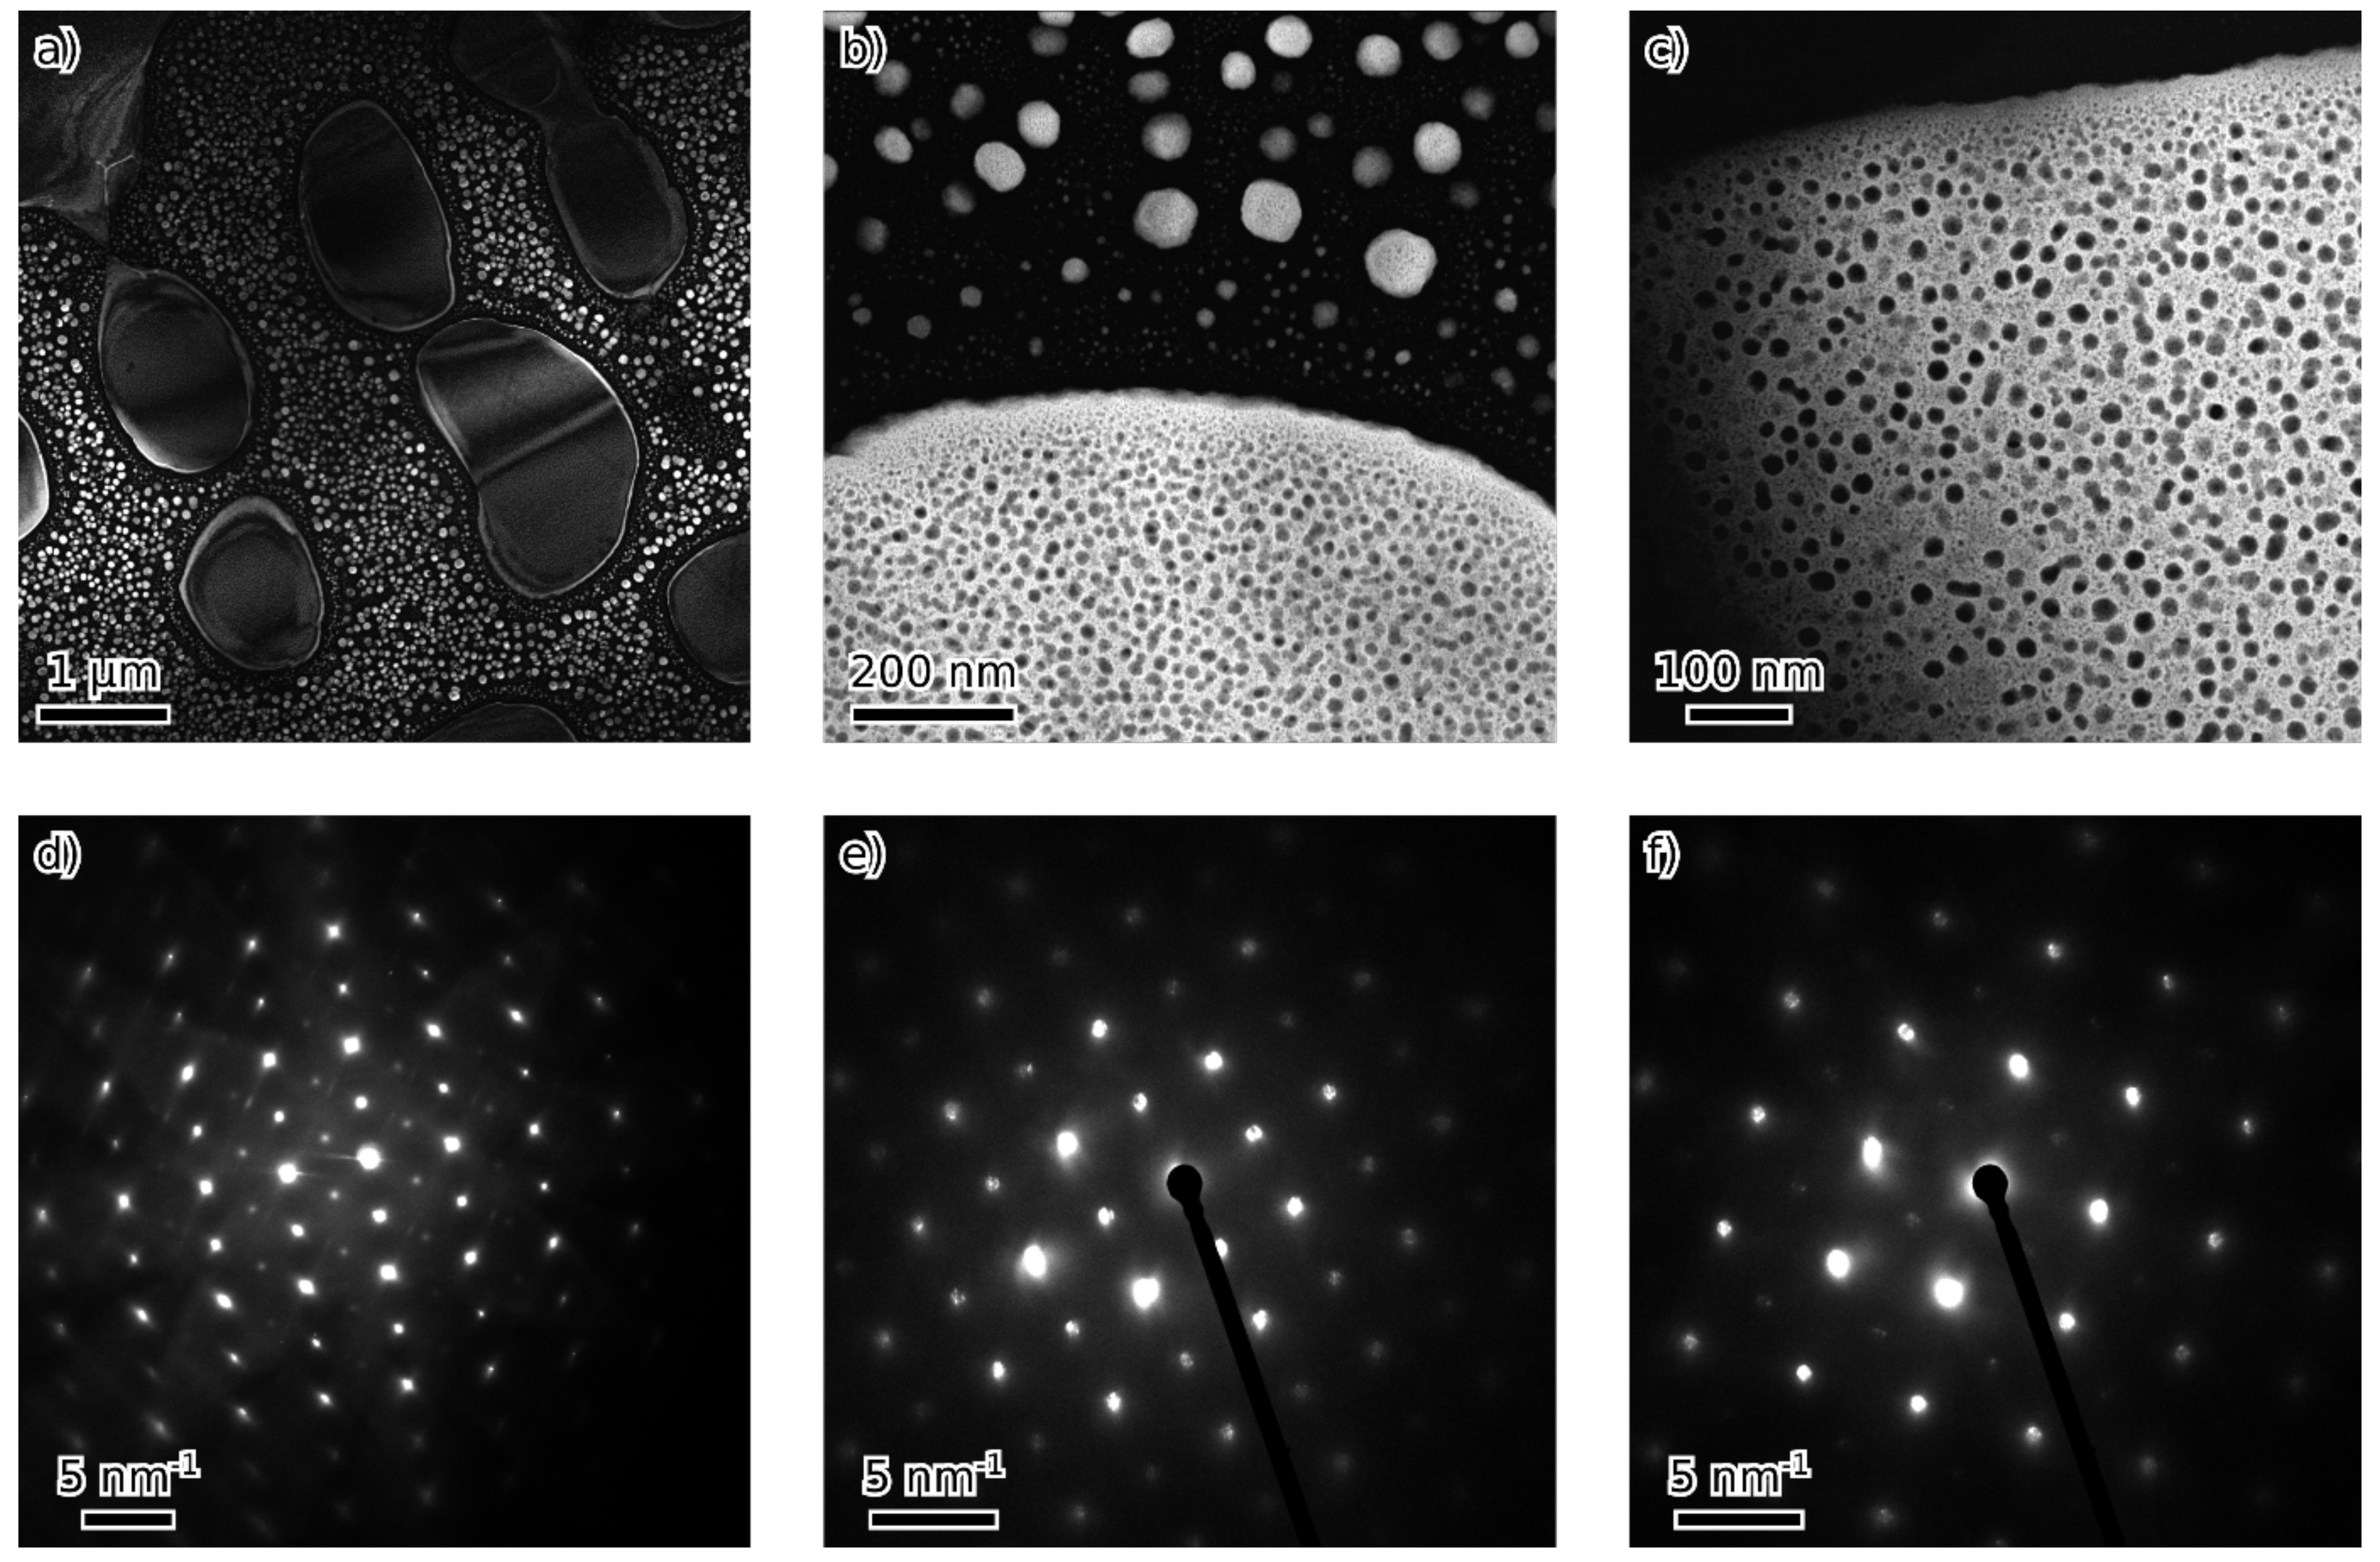
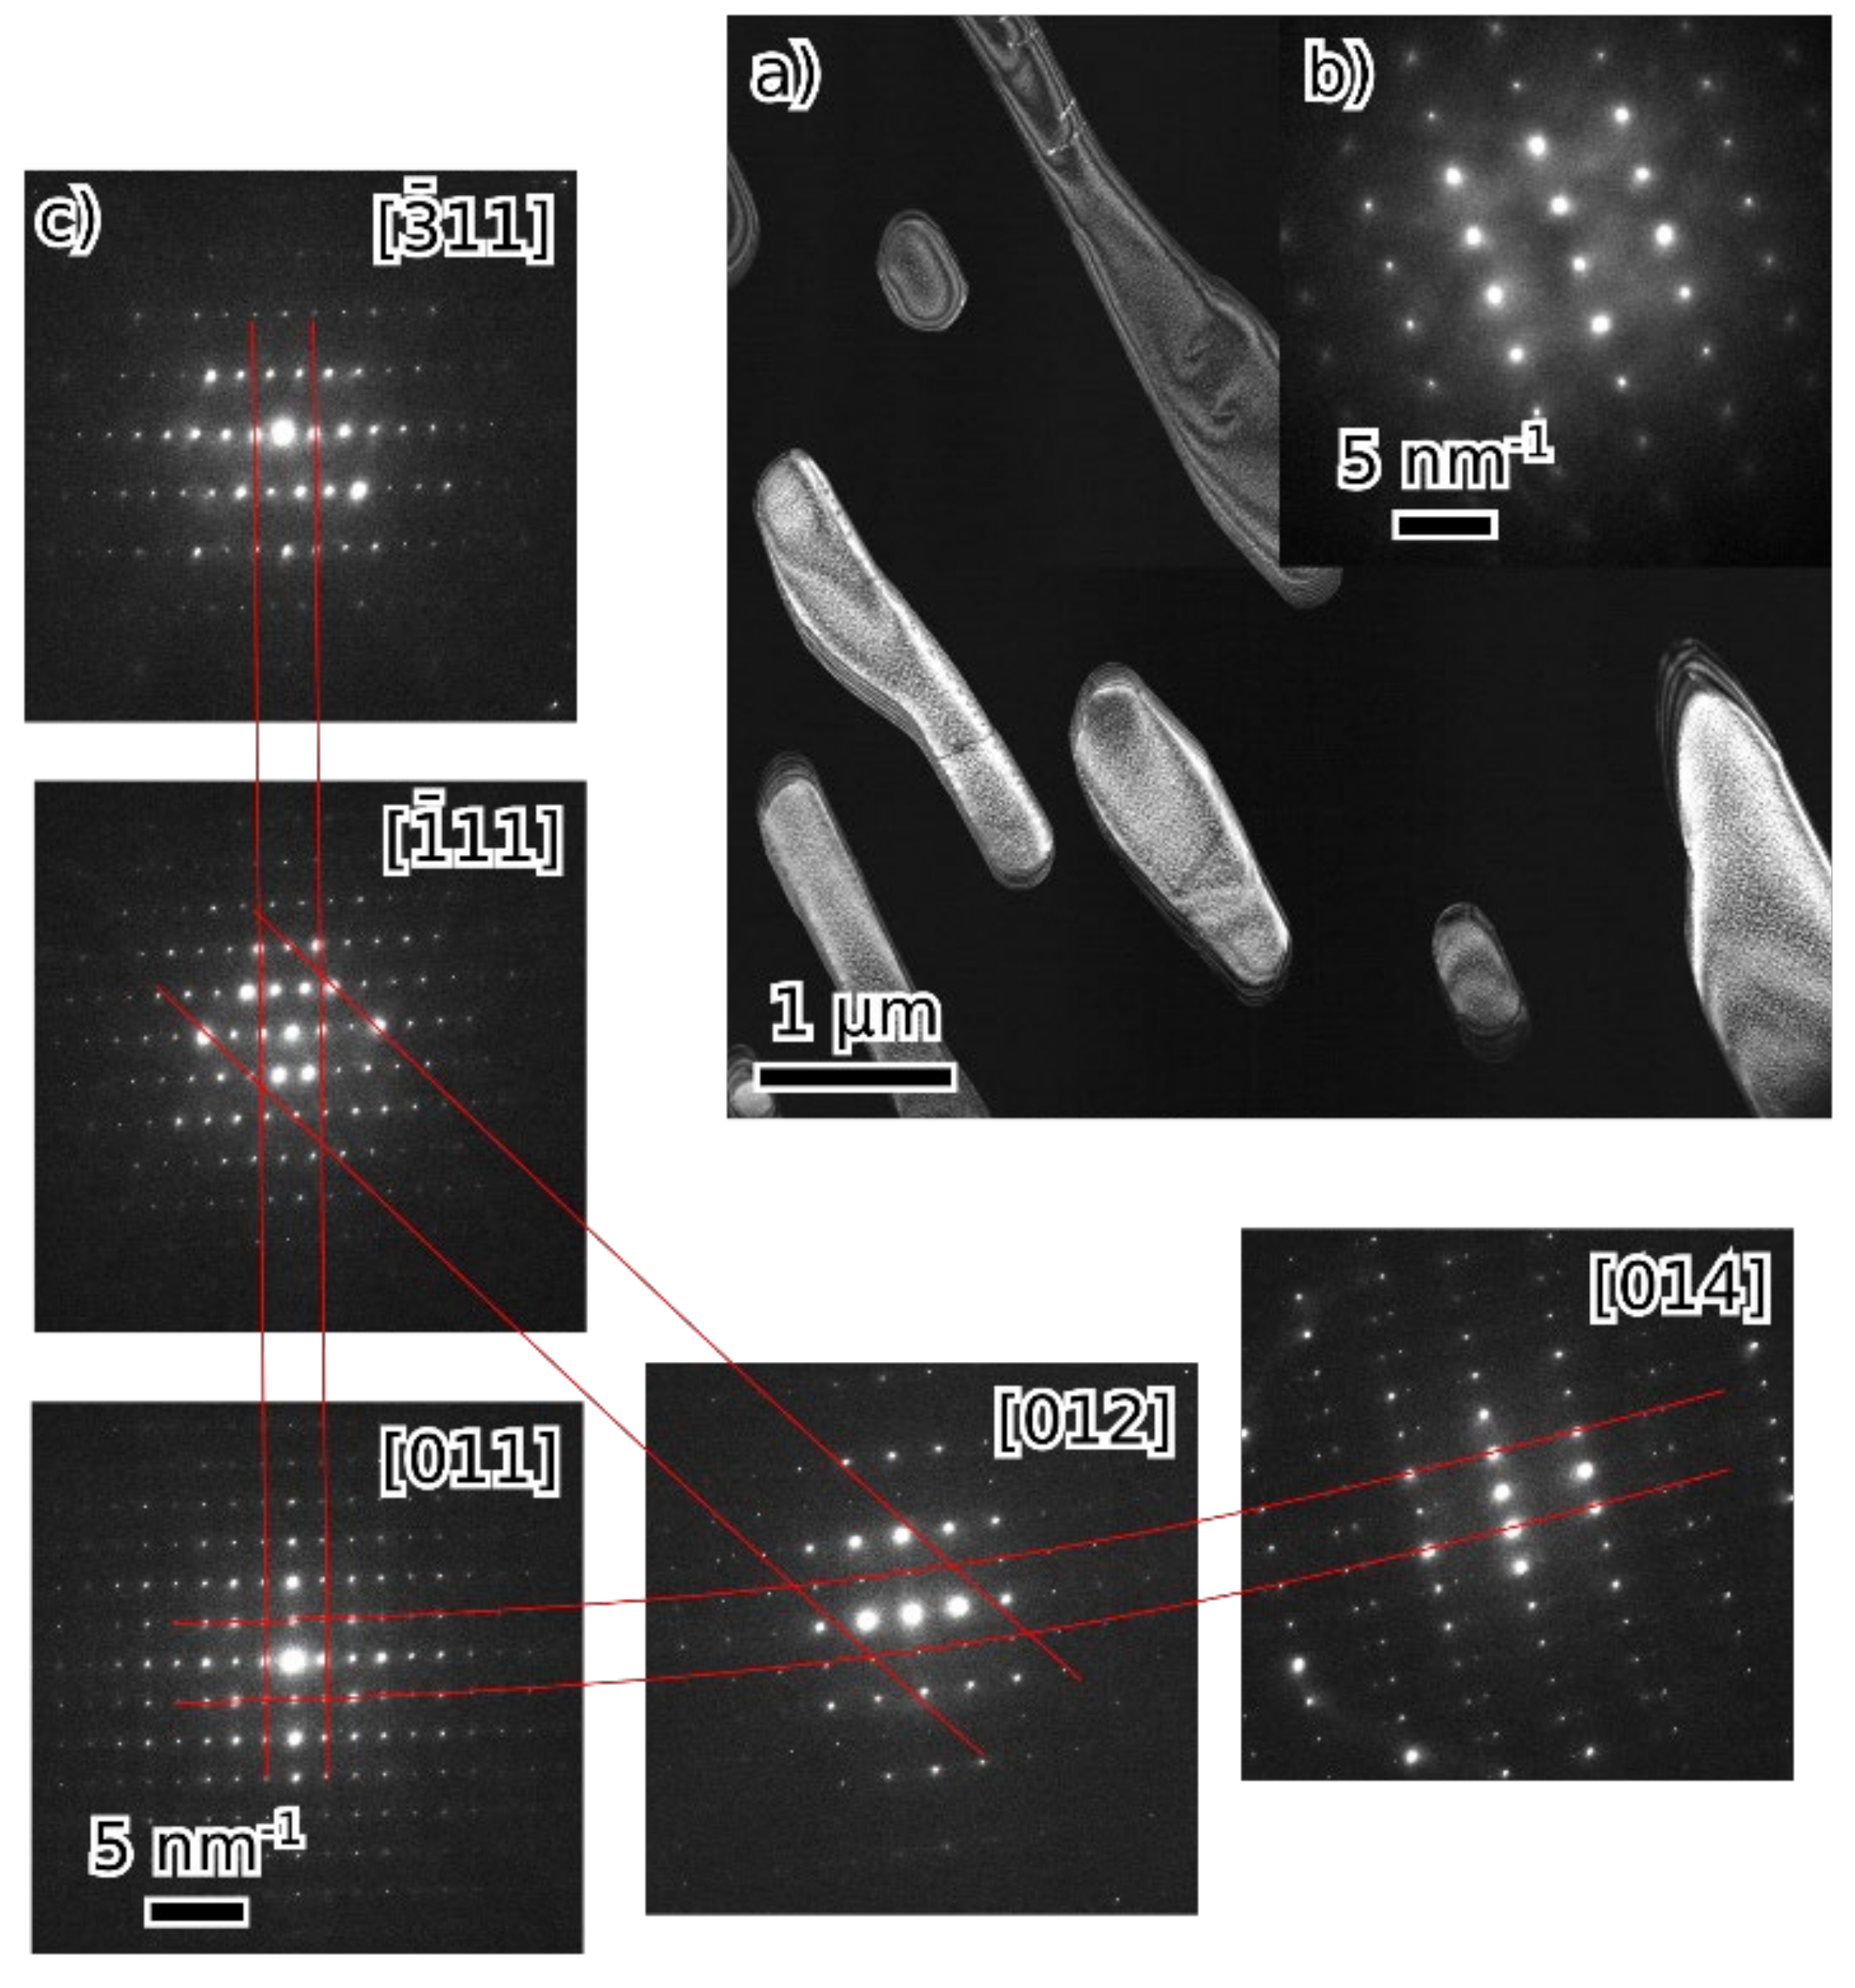
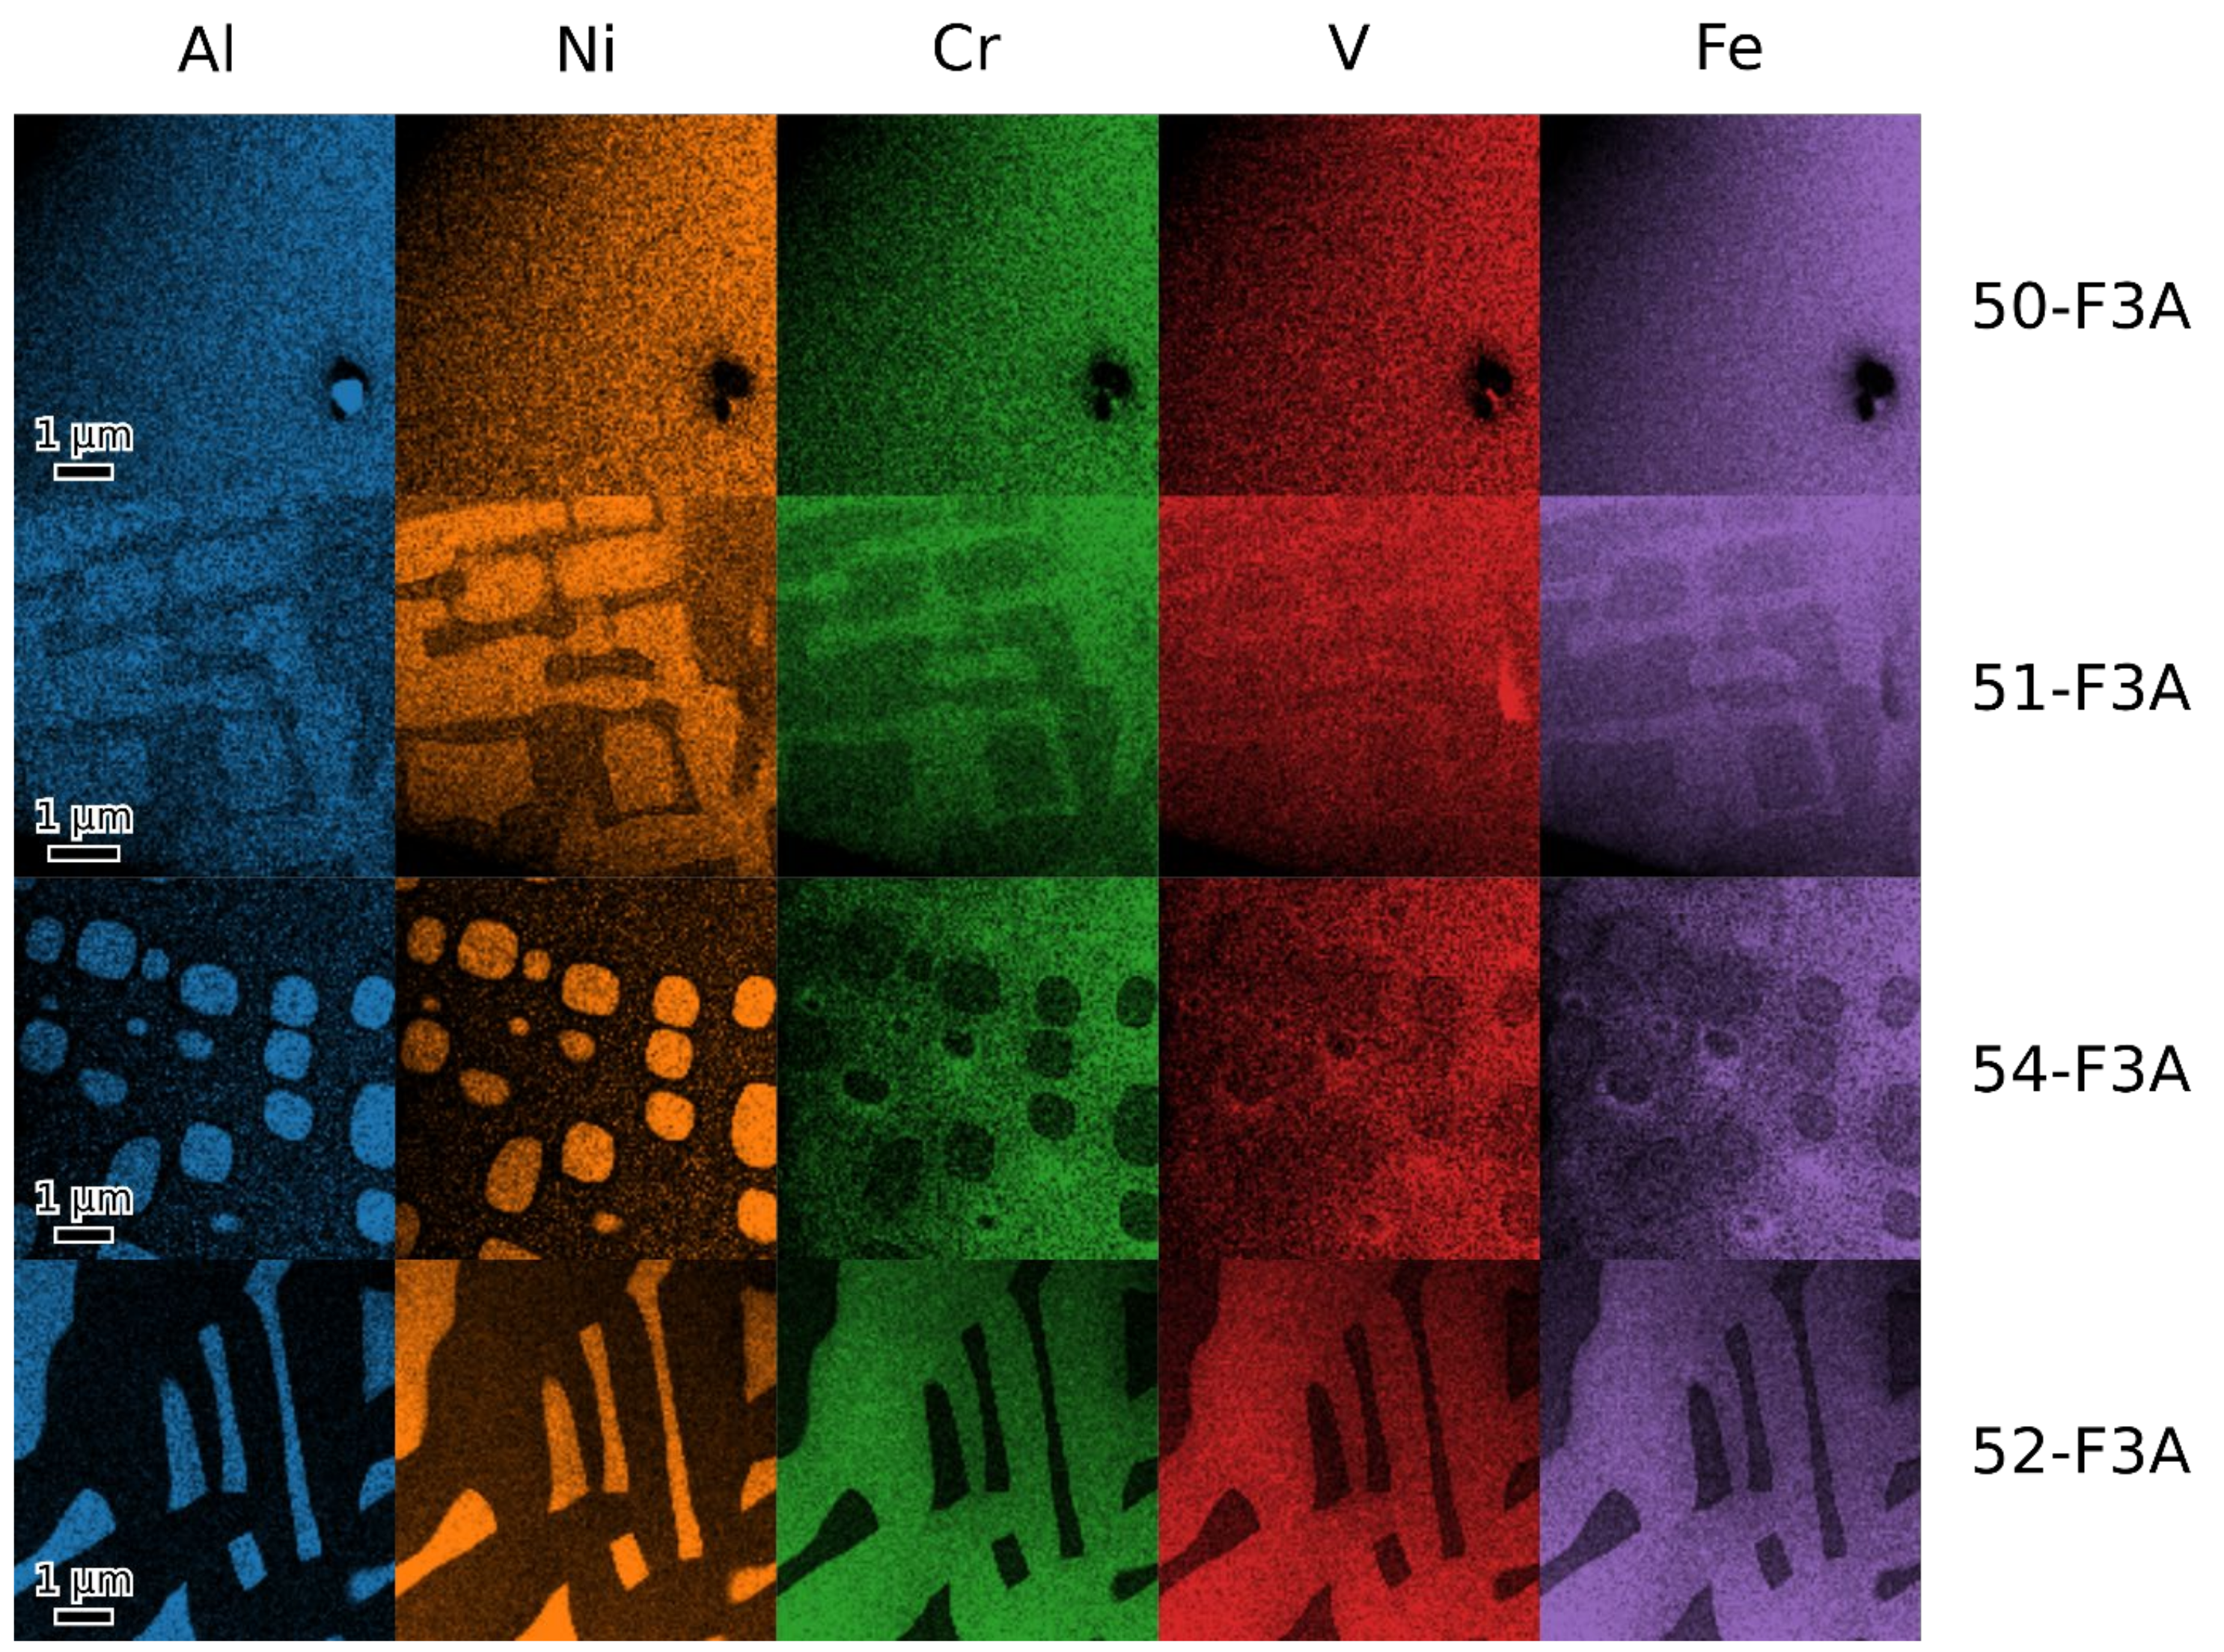
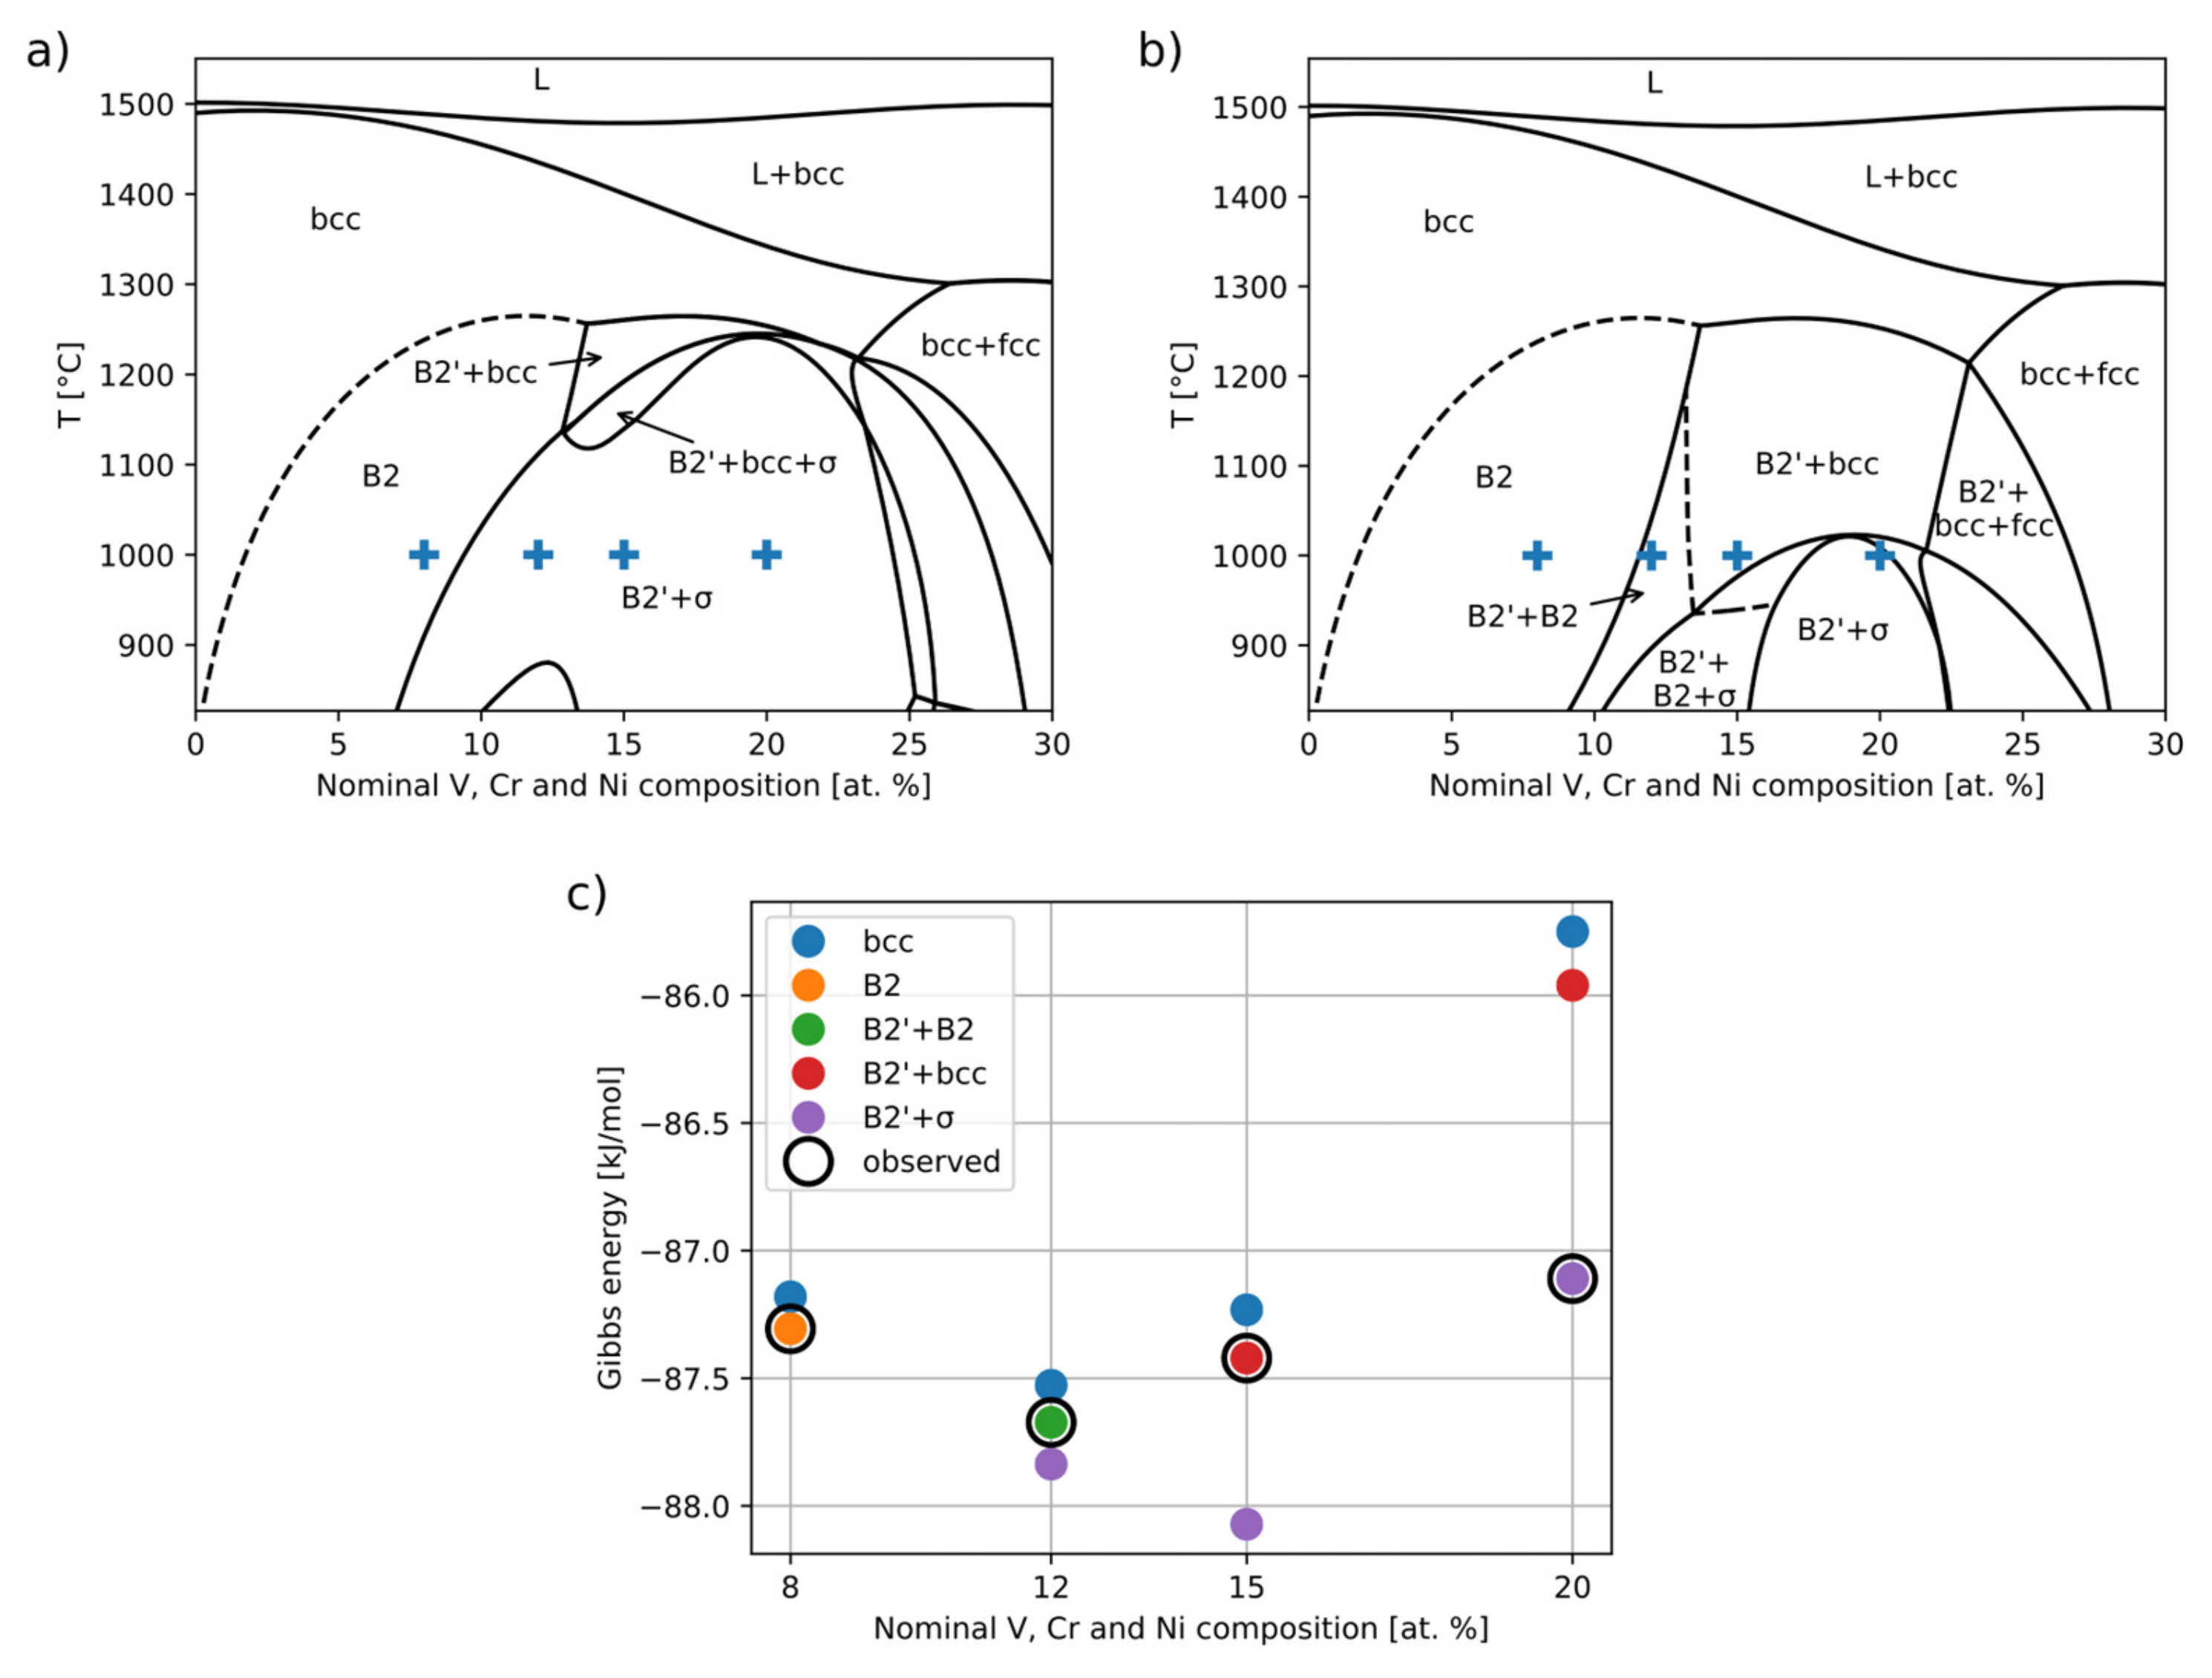
3. Results and Discussion

X-ray diffraction (Figure 1) revealed the bcc phase and its ordered variants B2 and D03. Additionally, the alloy with the highest content of additional elements also contained the so-called σ-phase with a tetragonal structure. D03 order was found in 50-F3A with a hint of a (111) D03 peak also present in 51-F3A. B2 and bcc peaks were present in all four alloys. The lattice parameters are reported in Table 1. Peak positions were determined by fitting the peak profile with a suitable function. Only prominent and well-separated peaks were used. The error of the bcc lattice parameters was taken as the standard deviation of the values determined from different peaks. The error of the lattice parameters of the σ-phase was determined via statistical bootstrapping (standard deviation of values determined from random subsets of peaks). The lattice parameters of the bcc-based phases are close to that of the bcc elements (Fe 0.2886 nm [28], Cr 0.28839 nm [28] and V 0.30338 nm [29]), B2 compounds (NiAl 0.28812 nm [30], FeAl 0.29022 nm [31]) and Fe3Al (2 × 0.28945 = 0.5789 nm [31]). σ-phase with similar lattice parameters is found in Fe-Cr (a = 0.87995 nm, c = 0.45442 [32]), Fe-V (a = 0.8956 nm, c = 0.4627 nm [33]) and Ni-V (a = 0.898 nm, c = 0.464 nm [34]) binary systems.
The chemical composition of the studied alloys is presented in Table 1. Figure 2 shows an overview of the back-scattered electron (BSE) images of alloys 51, 54 and 52-F3A. No phase contrast (only impurities) was observed in alloy 50-F3A.
TEM observations of 50-F3A revealed single-phase material (except for a few Al oxide inclusions) with D03 structure and nanometer domain size (Figure 3).
The microstructures of 51-F3A and 54-F3A were similar: both alloys show the separation of bcc and B2 on two length scales. There are alternating areas of bcc and B2 structure a few micrometers in size. These are further filled by much smaller (5–50 nm) particles of opposite phase, B2 and bcc, respectively (Figure 4 and Figure 5). The structure of 51-F3A appears more “blocky” without clear particle/matrix distinction, while B2 areas in 54-F3A seem to form rounded particles in the bcc matrix. Similarly, both B2 and bcc nanoscale particles in 54-F3A are round, while the nanoscale bcc phase in 51-F3A seems to form interconnected channels. The insides of the bigger-than-nanoscale B2 particles in both 51-F3A and 54-F3A show signs of further B2/bcc separation. Everything is crystallographically coherent. The weak (111) D03 spot is visible in the 51-F3A [110] diffraction pattern, while in 54-F3A, it is even weaker and diffused. Figure 4d (dark field from (111) D03) shows the nanometer D03 phase, presumably on bcc/B2 interfaces in 51-F3A (that are present everywhere). In 54-F3A, the (111) D03 intensity was too weak for a dark field image.
Alloy 52-F3A is composed of two phases: B2 and tetragonal σ-phase. They form distinct grains a few micrometers in size. Moreover, some grains of σ with included particles of B2 were also observed (Figure 6). In the latter case, there is a fixed orientation relationship between σ and B2. The independently determined lattice of the σ phase matches the structure identified via XRD, though hints of slight deviations from orthogonality at the limit of measurement accuracy (<1°) were noticed.
Figure 7 shows the EDX maps of the investigated alloys. The B2 phase in all two-phase materials (51, 54 and 52-F3A) shows a high content of Ni and Al. In 52-F3A, there is only very little Al in the σ phase. Quantitative results are presented in Table 2. Detailed quantitative analysis of the phase composition was complicated due to the strong absorption of Al Kα in the L lines of the other elements. This was accounted for by scaling the raw counts using custom k-factors. These were chosen so that the overall alloy composition matched the composition determined via SEM (Table 1). The nanoscale phase separation in alloys 51 and 52 is another issue; although high magnification maps and principal component analysis (PCA) were used, there is probably still some mixing between the phases. The values in Table 2 may, thus, come short of real tie-line endpoints, but the tie-line direction should be correct.
Although the idea was to keep the stoichiometry of Fe3Al fixed in order to somehow “impose” the Fe3Al’s D03 structure on a final alloy, while V, Cr and Ni were added, it did not quite work out (except for the most dilute 50-F3A). Ni binding to Al is much stronger than the binding between Fe and Al (heat of formation NiAl 0.65 eV/atom vs. FeAl 0.3 eV/atom [35]). Increasing amounts of Ni thus consume more and more Al to form B2 NiAl. In 52-F3A, there is no more Al left in the rest of the alloy and σ phase forms.
To further discuss the phase composition in this system, a phase diagram section (isopleth) containing the nominal compositions of studied alloys was calculated (Figure 8a,b). ThermoCalc (version 2022a) software with the TCHEA5 database [36,37] was used. The calculated composition of tie-line endpoints (phases) is reported along with experimental results in Table 2.
The D03 order is not modeled in this database. However, it should only become relevant at much lower temperatures than those depicted. The D03 order observed in some of our alloys thus probably does not reflect the annealing equilibrium at 1000 °C but was formed after quenching. This is consistent with its nanometer length scale.
As can be seen from Figure 8a, the σ phase is incorrectly predicted for 51 and 54-F3A. Figure 8c depicts the Gibbs energy differences between the relevant phase combinations. In order to better describe the phase relations in this system, we tried to “fix” the TCHEA5 description of the σ phase by artificially increasing its Gibbs energy by 1.5 kJ/mol (45 kJ per mole of formula unit using PHASE_ADDITION command). This shifts the B2′+σ above B2′+bcc (B2′+B2) in 54-F3A (51-F3A) while still keeping it stable in 52-F3A. The modified phase diagram in Figure 8b is more consistent with our present observations. Except for a difference in ordering in 51-F3A, this diagram now correctly reproduces the observed phase relations. Despite the experimental challenges, the match between the experimental and calculated phases= compositions (Table 2) is also rather good.

4. Conclusions

The structure of a series of CCAs derived from the iron aluminide Fe3Al alloyed by Cr, Ni and V was determined. The observations were compared to the phase compositions predicted using the CalPhad approach.
  • Fe3Al maintains the D03 structure up to at least 24 at. % of combined alloying with V, Cr and Ni.
  • Beyond that (36 and 45 at. % of combined alloying by V, Cr and Ni), the alloys are composed of B2 NiAl together with bcc solid solution. Coherent phase separation occurs on two length scales down to a few nanometers.
  • After the amount of alloyed Ni exceeds the amount of Al present in the alloy (the total combined alloying by V, Cr and Ni of 60 at. %), the alloy forms FeNiCrV σ-phase together with B2 NiAl.
  • The original TCHEA5 database overestimates the stability of the σ phase. The present experimental results can thus serve to its improvement.

Author Contributions

Conceptualization, methodology, writing and original draft preparation—J.P., P.K., R.K. and J.V.; investigation and data analysis, J.V., S.D., E.J., D.P. and P.M.; Casting of materials—L.Č. All authors have read and agreed to the published version of the manuscript.

Funding

The present work was financially supported by the Grant Agency of the Czech Republic under the project 21-03194S. E.J. acknowledges partial financial support from the Charles University Grant Agency under project number 278321.

Institutional Review Board Statement

Not applicable.

Informed Consent Statement

Not applicable.

Data Availability Statement

The data sets generated during this study of material are available from the corresponding author upon reasonable request.

Acknowledgments

The precise technological assistance of J. Kálalová and J. Buriánek is acknowledged.

Conflicts of Interest

The authors declare no conflict of interest.

References

  1. Babu, N.; Balasubramaniam, R.; Ghosh, A. High-temperature oxidation of Fe3Al-based iron aluminides in oxygen. Corros. Sci. 2001, 43, 2239–2254. [Google Scholar] [CrossRef]
  2. Hotař, A.; Palm, M. Oxidation resistance of Fe-25Al-2Ta (at. %) in air. Intermetallics 2010, 18, 1390–1395. [Google Scholar] [CrossRef]
  3. Ma, J.; Hao, J.; Bi, Q.; Fu, L.C.; Yang, J.; Liu, W. Tribological properties of a Fe3Al material in sulfuric acid corrosive environment. Wear 2010, 268, 264–268. [Google Scholar] [CrossRef]
  4. Morris, D.G.; Muñoz-Morris, M.A.; Requejo, L.M. New iron–aluminium alloy with thermally stable coherent intermetallic nanoprecipitates for enhanced high-temperature creep strength. Acta Mater. 2006, 54, 2335–2341. [Google Scholar] [CrossRef]
  5. Li, J.; Kwong, F.-L.; Shi, R.-X.; Dickon, H.L.; Yin, Y.-S. Microstructure and properties of in situ nanometric Al2O3 reinforced-Fe(Al)–Fe3Al-based composites. Mater. Sci. Eng. A 2009, 526, 50–55. [Google Scholar] [CrossRef]
  6. Kratochvíl, P.; Vodičková, V.; Hakl, J.; Vlasák, T.; Hanus, P.; Pešička, J. High temperature mechanical properties of Fe28Al4Cr alloy with additives TiB2 and Zr. Intermetallics 2010, 18, 1365–1368. [Google Scholar] [CrossRef]
  7. Gao, M.X.; Pan, Y.; Oliveira, F.J.; Baptista, J.L.; Vieira, J.M. High strength TiC matrix Fe28Al toughened composites prepared by spontaneous melt infiltration. J. Eur. Ceram. Soc. 2006, 26, 3853–3859. [Google Scholar] [CrossRef]
  8. Krein, R.; Friak, M.; Neugebauer, J.; Palm, M.; Heilmaier, M. L21-ordered Fe–Al–Ti alloys. Intermetallics 2010, 18, 1360–1364. [Google Scholar] [CrossRef]
  9. Zhang, X.; Yang, J.; Ma, J.; Bi, Q.; Cheng, J.; Liang, Y.; Liu, W. Microstructures and mechanical properties of Fe–28Al–5Cr/TiC composites produced by hot-pressing sintering. Mater. Sci. Eng. A 2011, 528, 6819–6824. [Google Scholar] [CrossRef]
  10. Zhu, S.-M.; Sakamoto, K.; Makoto Tamura, M.; Kunihiko Iwasaki, K. Comparative study of the high temperature deformation behavior of Fe-25Al and Fe-25Al-10Ti alloys. Scr. Mater. 2000, 42, 905–910. [Google Scholar] [CrossRef]
  11. Kratochvíl, P.; Daniš, S.; Minárik, P.; Pešička, J.; Král, R. Strengthening of Fe3Al Aluminides by One or Two Solute Elements. Metall. Mater. Trans. A 2017, 48, 4135–4139. [Google Scholar] [CrossRef]
  12. Kratochvíl, P.; Daniš, S.; Pešička, J.; Minárik, P.; Král, R. Fe3Al Iron Aluminides Alloyed with High Concentrations of V and Cr: Their Structure and High Temperature Strength. Metall. Mater. Trans. A 2018, 49, 6046–6051. [Google Scholar] [CrossRef]
  13. Zhang, K.; Fu, F. Effects of annealing treatment on properties of CoCrFeNiTiAlx multi-component alloys. Intermetallics 2012, 28, 34–39. [Google Scholar] [CrossRef]
  14. Dong, Y.; Zhou, K.; Lu, Y.; Gao, X.; Wang, T.; Li, T. Effect of vanadium addition on the microstructure and properties of AlCoCrFeNi high entropy alloy. Mater. Des. 2014, 57, 67–72. [Google Scholar] [CrossRef]
  15. Wu, Y.D.; Cai, Y.H.; Chen, X.H.; Wang, T.; Si, J.J.; Wang, L.; Wang, Y.D.; Hui, X.D. Phase composition and solid solution strengthening effect in TiZrNbMoV high-entropy alloys. Mater. Des. 2015, 83, 651–660. [Google Scholar] [CrossRef]
  16. Fu, Z.; Chen, W.; Wen, H.; Zhang, D.; Chen, Z.; Zheng, B.; Zhou, Y.; Lavernia, E.J. Microstructure and strengthening mechanisms in an FCC structured single-phase nanocrystalline Co25Ni25Fe25Al7.5Cu17.5 high-entropy alloy. Acta Mater. 2016, 107, 59–71. [Google Scholar] [CrossRef]
  17. He, F.; Wang, Z.; Niu, S.; Wu, Q.; Li, J.; Wang, J.; Liu, C.T.; Dang, Y. Strengthening the CoCrFeNiNb0.25 high entropy alloy by FCC precipitate. J. Alloys Compd. 2016, 667, 53–57. [Google Scholar] [CrossRef]
  18. Chen, C.; Pang, S.; Cheng, Y.; Zhang, T. Microstructure and mechanical properties of Al20-xCr20+0.5xFe20Co20Ni20+0.5x high entropy alloys. J. Alloys Compd. 2016, 659, 279–287. [Google Scholar] [CrossRef]
  19. Tong, C.J.; Chen, M.R.; Chen, S.K.; Yeh, J.W.; Shun, T.T.; Lin, S.J.; Chang, S.Y. Mechanical performance of the AlxCoCrCuFeNi high-entropy alloy system with multiprincipal elements. Metall. Mater. Trans. A 2005, 36, 1263–1271. [Google Scholar] [CrossRef]
  20. Wu, Z.; Bei, H.; Pharr, G.M.; Georgie, E.P. Temperature dependence of the mechanical properties of equiatomic solid solution alloys with face-centered cubic crystal structures. Acta Mater. 2015, 81, 428–441. [Google Scholar] [CrossRef]
  21. Tsai, C.-W.; Tsai, M.-H.; Yeh, J.-W.; Yang, C.-C. Effect of temperature on mechanical properties of Al0.5CoCrCuFeNi wrought alloy. J. Alloys Compd. 2010, 490, 160–165. [Google Scholar] [CrossRef]
  22. Chen, M.R.; Lin, S.J.; Yeh, J.W.; Chen, S.K.; Huang, Y.C.; Tu, C.P. Microstructure and Properties of Al0.5CoCrCuFeNiTix (x = 0–2.0) High-Entropy Alloys. Mater. Trans. 2006, 47, 1395–1401. [Google Scholar] [CrossRef] [Green Version]
  23. Haas, S.; Manzoni, A.M.; Holzinger, M.; Glatzel, U. Influence of high melting elements on microstructure, tensile strength and creep resistance of the compositionally complex alloy Al10Co25Cr8Fe15Ni36Ti6. Mater. Chem. Phys. 2021, 274, 125163. [Google Scholar] [CrossRef]
  24. Liu, X.; Vechio, K. Processing, microstructure evolution and mechanical property improvements of an Al–V–Cr–Mn–Fe–Ni CCA with an as-cast BCC/B2 coherent nanostructure. Mater. Sci. Eng. A 2022, 852, 143698. [Google Scholar] [CrossRef]
  25. He, J.Y.; Liu, W.H.; Wang, H.; Wu, Y.; Liu, X.J.; Nieh, T.G.; Lu, Z.P. Effects of Al addition on structural evolution and tensile properties of the FeCoNiCrMn high-entropy alloy system. Acta Mater. 2014, 62, 105–113. [Google Scholar] [CrossRef]
  26. Kao, Y.-F.; Chen, T.-J.; Chen, S.-K.; Yeh, J.-W. Microstructure and mechanical property of as-cast, -homogenized, and -deformed AlxCoCrFeNi (0 ≤ x ≤ 2) high-entropy alloys. J. Alloys Compd. 2009, 488, 57–64. [Google Scholar] [CrossRef]
  27. Kratochvíl, P.; Král, R.; Daniš, S.; Pešička, J.; Minárik, P.; Veselý, J. Atom Location by Channeling-Enhanced Microanalysis (ALCHEMI) Study of Structure of Complex Concentrated Alloys Derived from FeAl Iron Aluminide. Metall. Mater. Trans. A 2022, 53, 3967–3976. [Google Scholar] [CrossRef]
  28. Swanson, H.E.; Tatge, E.; Gilfrich, N.T.; Ugrinic, G.M. Standard X-ray diffraction powder patterns. Natl. Bur. Stand. Circ. 1955, 539, 1–75. [Google Scholar]
  29. Neuburger, M.C. Praezisionsmessung der Gitterkonstante von reinem Vanadium. Zeitsch. Krist. 1936, 93, 314–315. [Google Scholar]
  30. Bradley, A.J.; Taylor, A. An X-ray analysis of the nickel-aluminium system. Proc. Roy. Soc. Lon. 1937, 159, 56–72. [Google Scholar]
  31. Bradley, A.J.; Jay, A.H. The lattice spacings of iron-aluminium alloys. J. Iron Steel Inst. 1932, 125, 339–357. [Google Scholar]
  32. Bergman, G.; Shoemaker, D.P. The determination of the crystal structure of the sigma-phase in the Fe-Cr and Fe-Mo systems. Acta Cryst. 1954, 7, 857–865. [Google Scholar] [CrossRef]
  33. Hanneman, R.E.; Mariano, A.N. Lattice-parameter and volumetric data of the iron-vanadium system. Trans. Met. Soc. AIME 1964, 230, 937–938. [Google Scholar]
  34. Kasper, J.S.; Waterstrat, R.M. Ordering of atoms in the sigma phase. Acta Cryst. 1956, 9, 289–295. [Google Scholar] [CrossRef]
  35. Fu, C.L.; Wang, X. The effect of electronic structure on the defect properties of FeAl. Mat. Sci. Eng. A 1997, 239–240, 761–768. [Google Scholar] [CrossRef]
  36. Mao, H.; Chen, H.-L.; Chen, Q. TCHEA1: A Thermodynamic Database Not Limited for “High Entropy” Alloys. J. Phase Equilibria Diffus. 2017, 38, 353–368. [Google Scholar] [CrossRef] [Green Version]
  37. Chen, H.-L.; Mao, H.; Chen, Q. Database development and Calphad calculations for high entropy alloys: Challenges, strategies, and tips. Mater. Chem. Phys. 2018, 210, 279–290. [Google Scholar] [CrossRef]
Figure 1. X-ray diffraction patterns from studied alloys. Positions and indices of peaks of bcc-based phases are indicated. Additional peaks in 52-F3A belong to σ-phase.
Materials 16 05388 g001
Figure 2. SEM BSE images of alloys 51, 54 and 52-F3A (a), (b) and (c), respectively.
Materials 16 05388 g002
Figure 3. Single-phase 50-F3A with nanoscale D03 domains: dark field image from (111) D03 diffraction spot (a), [110] diffraction pattern (b).
Materials 16 05388 g003
Figure 4. Alloy 51-F3A: dark field image from (100) B2 spot (a,c), bcc phase is dark, [110] diffraction pattern (b), microstructure detail (c) and a dark field image from (111) D03 spot (d).
Materials 16 05388 g004
Figure 5. Alloy 54-F3A: dark field images from (100) B2 spot at different levels of detail (ac), bcc phase is dark, [110] diffraction pattern (d). [100] nanodiffraction from B2 (e) and bcc (f) areas.
Materials 16 05388 g005
Figure 6. Alloy 52-F3A: dark field image showing B2 particles in a single grain of σ-phase ((a), σ is dark), [110] B2 diffraction pattern (b) and several low index σ diffraction patterns (c) from single a grain with a schematic depiction of their arrangement and lines highlighting common planes.
Materials 16 05388 g006
Figure 7. EDX composition maps of alloys 50, 51, 54 and 52-F3A shown in respective rows.
Materials 16 05388 g007
Figure 8. Isopleth phase diagram calculated from original TCHEA5 data (a) and with modified (see main text) description of σ phase (b). Composition and annealing temperature of studied phases are indicated by crosses. Plot (c) shows relative phase stability of relevant phase combinations. B2 and B2′ represent two distinct B2 phases corresponding approximately to FeAl and NiAl, respectively.
Materials 16 05388 g008
Table 1. Overall composition of studied alloys determined via EDX analysis together with an overview of phases identified using TEM and lattice parameters determined via XRD (½ of D03 lattice is reported for 50-F3A).
at. %FeAlNiVCrPhasesLattice Parameters (nm)
50-F3A56.819.18.18.08.5D03a = 0.2890(3)
51-F3A46.518.011.511.511.6bcc + B2 + D03a = 0.2890(1)
54-F3A40.114.415.515.114.8bcc + B2 (+D03)a = 0.2893(2)
52-F3A29.89.419.920.520.4B2 + σa = 0.2888(1)
aσ = 0.8887(2)
cσ = 0.4605(2)
Table 2. Composition of phases in two phase alloys determined by TEM EDX (exp.) and calculated via ThermoCalc (TC). B2 and B2′ represent two distinct B2 phases corresponding approximately to FeAl and NiAl, respectively.
at. % ± ~3 at. %AlVCrFeNi
51-F3Aexp.bcc13.612.613.551.78.5
B2′23.110.49.541.615.3
TCB215.112.412.549.210.9
B2′33.44.22.626.533.3
54-F3Aexp.bcc6.318.720.650.04.3
B2′26.09.86.025.932.3
TCbcc9.817.117.445.410.3
B2′34.83.92.118.940.3
52-F3Aexp.σ4.024.024.934.112.9
B2′26.68.75.014.744.9
TCσ0.0226.327.337.98.5
B2′33.85.02.611.147.5
Disclaimer/Publisher’s Note: The statements, opinions and data contained in all publications are solely those of the individual author(s) and contributor(s) and not of MDPI and/or the editor(s). MDPI and/or the editor(s) disclaim responsibility for any injury to people or property resulting from any ideas, methods, instructions or products referred to in the content.

