Article

Structural Evolution of Polyaluminocarbosilane during the Polymer–Ceramic Conversion Process

1
Engineering Laboratory of Advanced Energy Materials, Ningbo Institute of Materials Technology and Engineering, Chinese Academy of Sciences, Ningbo 315201, China
2
College of Chemical Engineering, Zhejiang University of Technology, Hangzhou 310000, China
3
Advanced Energy Science and Technology Guangdong Laboratory, Huizhou 516003, China
*
Author to whom correspondence should be addressed.
These authors contributed equally to this work.
Materials 2023, 16(11), 4172; https://doi.org/10.3390/ma16114172
Submission received: 14 May 2023 / Revised: 1 June 2023 / Accepted: 1 June 2023 / Published: 3 June 2023
(This article belongs to the Section Advanced and Functional Ceramics and Glasses)

Abstract

:
Polyaluminocarbosilane (PACS) is an important precursor for silicon carbide (SiC) fibers and ceramics. The structure of PACS and the oxidative curing, thermal pyrolysis, and sintering effect of Al have already been substantially studied. However, the structural evolution of polyaluminocarbosilane itself during the polymer–ceramic conversion process, especially the changes in the structure forms of Al, are still pending questions. In this study, PACS with a higher Al content is synthesized and the above questions are elaborately investigated by FTIR, NMR, Raman, XPS, XRD, and TEM analyses. It is found that up to 800–900 °C the amorphous SiOxCy, AlOxSiy, and free carbon phases are initially formed. With increasing temperature, the SiOxCy phase partially separates into SiO2 then reacts with free carbon. The AlOxSiy phase changes into Al3C4 and Al2O3 by reaction with free carbon at around 1100 °C. The complicated reactions between Al3C4, Al2O3, and free carbon occur, leading to the formation of the Al4O4C and Al2OC phases at around 1600 °C, which then react with the SiC and free carbon, resulting in the formation of the Al4SiC4 phase at 1800 °C. The amorphous carbon phase grows with the increasing temperature, which then turns into a crystalline graphitic structure at around 1600 °C. The growth of β-SiC is inhibited by the existence of the Al4O4C, Al2OC, and Al4SiC4 phases, which also favor the formation of α-SiC at 1600–1800 °C.

1. Introduction

Polymer-derived ceramics (PDCs) have been widely utilized in fibers and composites, energy storage materials, porous materials, high-temperature sensors, etc. [1,2,3,4,5,6] due to their high-temperature stability, good high-temperature oxidation and corrosion resistance, and low-temperature processing and designable precursor structure. It is common that for fabricating PDCs, polymer synthesis, curing, pyrolysis, or sinter processes are often needed. The structure and property of the precursor influence the structure and quality of the final PDCs to a great extent.
Polyaluminocarbosilane (PACS) is one of the important precursors for silicon carbide (SiC) fibers, ceramics, SiCf/SiC and Cf/SiC composites, SiC coatings and adhesion agents, etc. PACS is usually prepared by the reactions of silicon resins (such as solid carbonsilane (PCS) [2,7], liquid PCS [8] or polysilacarbosilane(PSCS) [9], polydimethylsilane (PDMS) [10],) with aluminium compounds (such as aluminium(III) acetylacetonate (Al(acac)3), aluminium butanoxide (Al(C4H9O)), and dimethyaluminium chloride ((CH3)2AlCl) [11]), at high temperatures [12]. The molecular structure of PACS and the spinning rheological properties have been substantially studied. Yang et al. [13] have found that in the molecular structure of PACS derived from PCS, the formed AlOx (x = 4–6) groups are the connection centers of PCS, which mainly consists of six-member Si–C rings. It is accepted that the smaller PCS molecules in PACS are crosslinked mainly by Si–O–Al bonds [6,7,8,9,10,11,12,13]. Increasing the weight percentage of Al will result in an increase in the relative branching degree of the molecular structure and the apparent melt viscosity and a decrease in the spinnability of the precursor [14]. The addition of Al to thePDCs will improve their high-temperature oxidation resistance. An et al. [15] and Wang et al. [16] reported that the addition of Al to SiCN ceramics leads to a low oxidation rate when subjected to oxidation at temperatures higher than 1000 °C; the reason is that the formed Al-doped cristobalite oxide layer has a lower permeability to molecular oxygen. Furthermore, during the polymer–ceramic conversion process of oxidative curing PCS, the SiCxOy phase is subjected to thermal decomposition above 1300 °C [17,18,19,20], which would form coarser crystals with releasing CO and SiO gases [21,22] and lead to a rapid decrease in mechanical properties for the final SiC products. However, the addition of Al into PCS will inhibit the occurrence of this phenomenon by increasing the compactness and hindering the β-SiC grain growth of the SiC products. During the sintering process of PACS cured by oxygen, the Al2O3, Al4O4C, Al2OC, and Al4SiC4 phases have been inferred to be formed, the formed Al-O and Al-C bonds in these phases enrich in the SiC grain boundaries, the Al-C bonds can enter into the SiC lattice, and the Al-O bonds can react with the surface of the SiC grains and even enter into the SiC grains, which will hinder the grain growth of β-SiC [23,24]. However, the structural change for the chemical environment of Al in the broad temperature range from precursor to ceramics is still a pending question, especially for the PACS precursor itself during the polymer–ceramic conversion process.
In this study, PACS with a higher Al content is synthesized using PSCS and Al (acac)3 in an autoclave under inert atmosphere [12]. This precursor is thermally pyrolyzed in argon atmosphere, and the structural evolutions—especially the changes for the structural form of Al during the pyrolysis process—are elaborately investigated by FTIR, NMR, Raman, XPS, XRD, and TEM analyses, which is beneficial for regulating the structure and property of the final product.

2. Experimental

2.1. Synthesis and Pyrolysis of PACS

The PACS was prepared by the high pressure method [12]. Aluminium acetylacetonate (Al(acac)3) and liquid polysilacarbosilane (PSCS) with ratios of 9% were used as raw materials. Al(acac)3 were purchased from Alfa Aesar. The PSCS were prepared in our laboratory by the thermal decomposition of polydimethylsilane (PDMS) at above 400 °C under inert atmosphere. The weight-average molecular weights Mw and polydispersity Mw/Mn, the softening point, and the Al content of the precursor are listed in Table 1.
The PACS precursor was thermally pyrolyzed in the temperature ranges of 300–1800 °C at a heating rate of 5–10 °C min−1 in an alumina tube/graphite furnace under argon atmosphere, with holding time of 1 h at each heat treatment temperature. In order to investigate the structural evolution during the pyrolysis process, the pyrolysis residues were characterized by various tests.

2.2. Characterization

Fourier transform-infrared (FT-IR) spectra (Nicolet 6700 spectrometer, Waltham, MA, USA) were obtained between 4000 and 400 cm−1. The molecular weights of the PACS were tested by the gel permeation chromatography (GPC) (HLC-8320, EcoSEC, Tokyo, Japan) method; tetrahydrofuran (THF) was used as the solvent and eluent, and the results were calibrated by polystyrene standards. The softening point of the PACS was measured on a melting point apparatus (Mettler Toledo MP90, Zurich, Switzerland). Solid-state 13C CP/MAS NMR spectra, 29Si DD/MAS NMR spectra, and 27Al MAS NMR spectra were obtained (Agilent 600 DD2, Santa Clara, CA, USA) at resonance frequencies of 150.72 MHz, 199.13 MHz, and 156.25 MHz, respectively. X-ray photoelectron spectroscopy spectra (XPS) were determined (Axis Ultra DLD, Kratos, Japan) using the binding energy of C 1 s (284.8 eV) as a reference. Raman spectroscopy spectra were recorded (Renishaw inVia Reflex spectrometer, London, England) with a wavelength of 532 nm of the excitation source. The X-ray diffraction (XRD) patterns were obtained (Bruker D8 Advance, Karlsruhe, Germany, Cu-Kα radiation) at λ = 0.154 nm in the 2θ ranges of 10–80°. The apparent mean grain size, L, of the SiC crystalline phase was calculated according to the Scherrer equation: L = Kλ/Dcosθ, where K = 0.89, D is the width of the (111) diffraction peak at mid-height. The thermogravimetric (TG) analysis was conducted (PerkinElmer Diamond TG/DTA instrument, Waltham, MA, USA) at a heating rate of 10 °C/min up to 1000 °C under argon atmosphere. The weight ratios of the elements C, O, N, and H were determined using a carbon sulphur analyser (CS844, LECO, St. Joseph, MO, USA), an oxygen nitrogen analyser (EMGA-620 W, HORIBA Jobin Yvon, St. Joseph, MO, USA), and an organic element analyser (Elementar, Langenselbold, Germany), respectively. The Al content was measured by the inductively coupled plasma emission spectrum (ICP) method (Spectro Arcos II spectrometer, Düsseldorf, Germany). Before the measurement, the specimen was heat-treated with molten mixtures of sodium carbonate and boric acid, then dissolved with deionized water. The weight ratio of the Si was obtained by difference subtraction. TEM measurements were conducted (FEI Tecnai F20 device, Waltham, MA, USA) at an acceleration voltage of 200 kV.

3. Results and Discussion

3.1. Molecular Structure Changes and TG Analysis

Figure 1 shows the thermogravimetric (TG) and derivative thermogravimetric (DTG) curves as a function of the temperature in the argon flow. It is observed that the precursor has a ceramic yield of 71.4% at 1000 °C, higher than typical PCS whose ceramic yield is about 60%. The reason is that this precursor has a relatively high Al content and thus more branched and ring molecular structures, leading to a lower weight loss [14]. It is known that the TG curve can be divided into three main stages: (I) up to 400 °C, the weight loss is 10.6%, which is ascribed to the evaporation of the small molecules in the precursor [14,25]. In the DTG curve, the peak at 288 °C may correspond to this weight loss. During this stage, in the FTIR spectra shown in Figure 2, the typical absorption bands observed at 2950 and 2900 cm−1, 2100 cm−1, 1410 cm−1, 1350 cm−1, 1250 cm−1, 1020 cm−1, and 830 cm−1 are ascribed to C-H stretching, Si-H stretching of Si-CH3, C-H deformation in Si-CH3, CH2 deformation in Si-CH2-Si, Si-CH3 deformation, CH2 wagging in Si-CH2-Si, Si-CH3 rocking, and Si-C stretching, respectively. They do not change to any great degree at this stage. The weak bands at 2351 cm−1 at 1100 °C and 1300 °C are ascribed to CO2. (II) From 400 °C to 800 °C, the weight loss is 16.8%. Similar to PCS, the weight loss stems from thermal decomposition of the precursor molecules. During this stage, decomposition of the side chains and dehydrogenation and dehydrocarbonation condensation reactions occur, accompanied by release of some gases such as H2, CH4, etc. A three-dimensional network inorganic structure is eventually formed [14,25]. It is reasonable to infer that the dehydrogenation and dehydrocarbonation condensation reactions occur mainly at 400–550 °C and that the decomposition of the side chains occurs mainly at 550–800 °C [25]. Therefore, it is reasonable to infer that the two peaks at 509 °C and 655 °C in the DTG curve correspond to the dehydrogenation and dehydrocarbonation condensation reactions and the decomposition of the side chains, respectively. During this stage, the typical absorption bands for C-H stretching, Si-H stretching, C-H deformation, CH2 deformation, Si-CH3 deformation, and CH2 wagging decrease obviously or even vanish as the temperature increases, with only the broad Si-C stretching band (850 cm−1) remaining in the end. (III) From 800 °C to 1000 °C, there is a slight weight loss, because the gas evolution by thermal decomposition in this stage is almost complete. During this stage, there is little characteristic structural change and the pyrolysis residues are still amorphous [14,25]. In the FTIR spectra, two weak bands at about 1100 cm−1 and 480 cm−1, related to Si-O bonds in the SiO2 phase, emerge at temperatures higher than 1000 °C, then diminish with increasing temperature and finally vanish at 1600 °C. This will be explained in the following.

3.2. Structural Form Changes for the Elements of Si, C, and Al

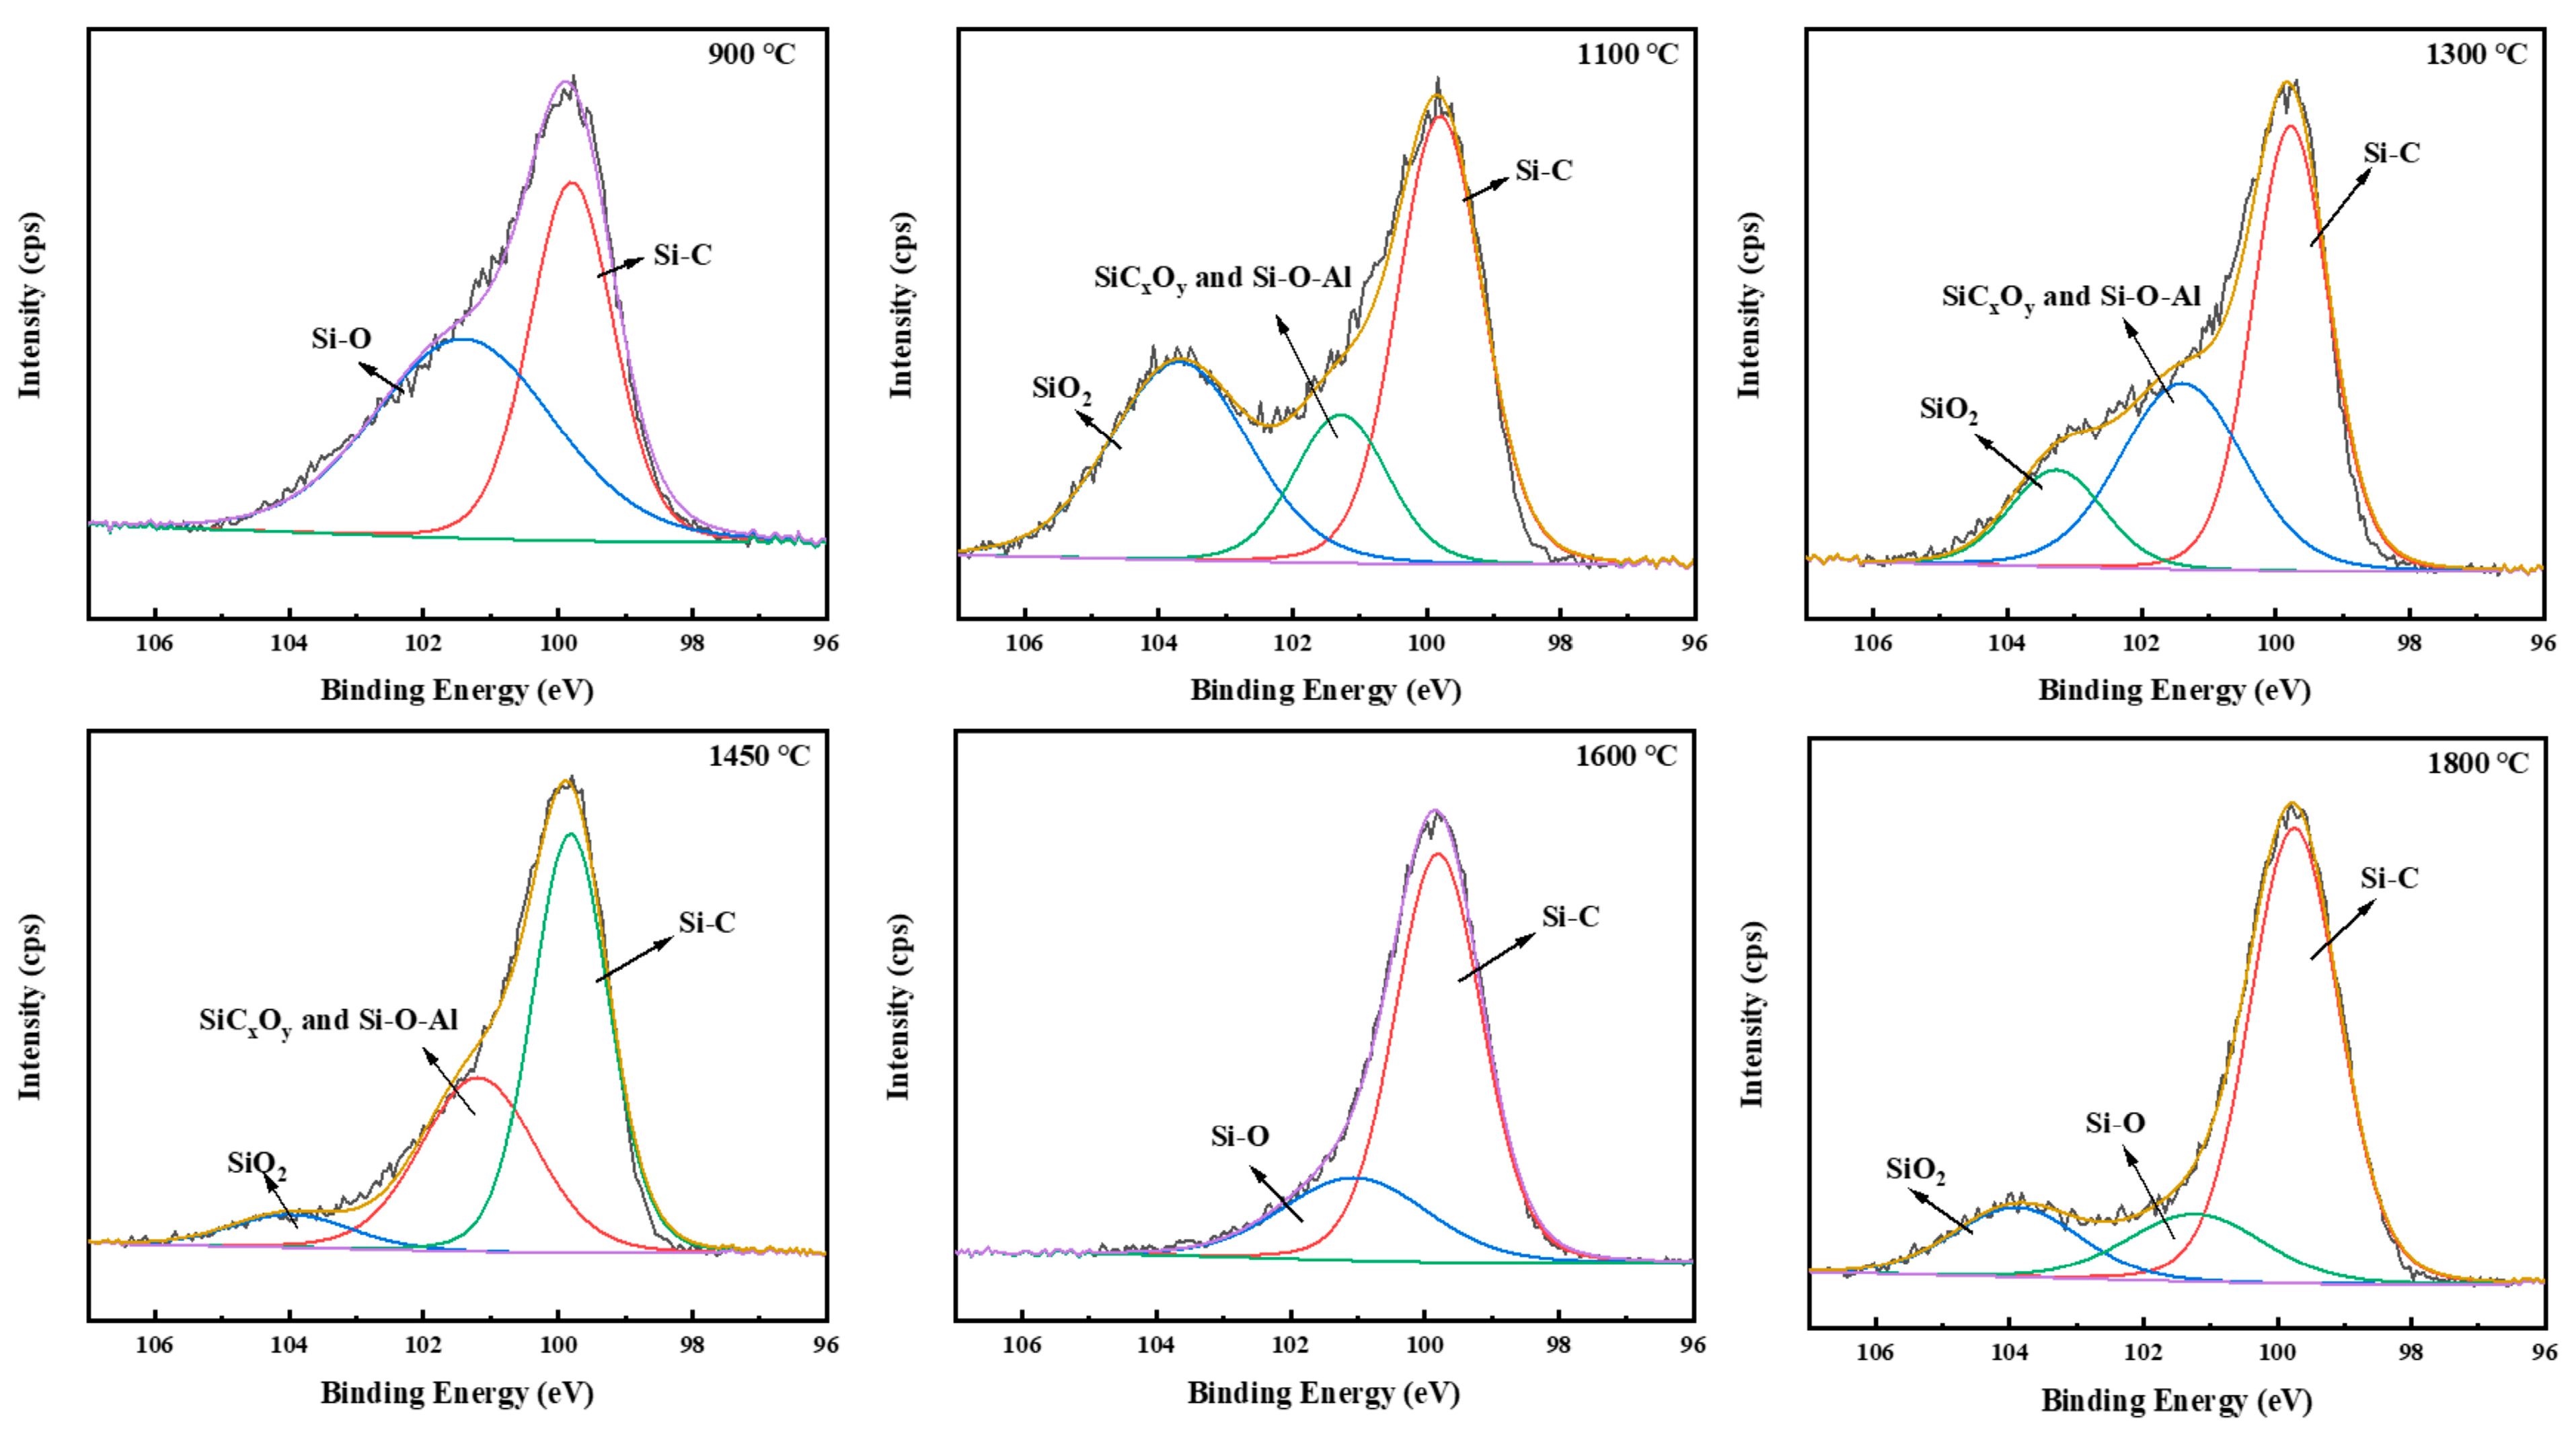
The structural form changes in Si during the pyrolysis process can be expressed by 29Si MAS NMR and XPS spectra of Si 2p, as shown in Figure 3 and Figure 4, respectively. In the 29Si MAS NMR spectra, at 500 °C, two resonance peaks at −2 ppm and −19 ppm appear, which are attributed to the SiC4 and SiC3H units as in the PACS precursor [25,26,27]. A weak shoulder peak at 16 ppm is related to the SC3O units, which contain Si-O-Si and Si-O-Al bonds [14]. At 900 °C, the broad resonance peak at −12 ppm is ascribed to the amorphous SiC phase [26,27]. As the temperature increases, the broad SiC peak sharpens and shifts upfield, suggesting that the SiC phase becomes more and more ordered and crystallized. A broad-shouldered peak on the right side emerges at 1800 °C, indicating formation of α-SiC and disordered β-SiC in addition to the ordered β-SiC. It is mentioned that a broad resonance peak in the vicinity of −110 ppm is related to the SiO4 unit, stemming from SiO2 [28] when the precursor is pyrolyzed without air curing. In the XPS spectra of Si 2p, the spectrum at 900 °C can be deconvolved into two main peaks located around 100 eV and 102 eV, which represent the Si-C and Si-O bonds, respectively, although the binding energies of the SiO2 and SiOxCy phases are a little different [29,30]. The Si-O bonds here mainly come from the SiOxCy phase and the Si-O-Al bonds. At 1100 °C, another evident peak at 103.5–104 eV can be deconvolved, which represents the SiO2 phase [29,30]. The Si-O bond also has the largest intensity of the FTIR results at this temperature, indicating that the SiO2 phase has been formed. SiO2 can evolve from the decomposition of the SiOxCy phase, shown in Equation (1). The SiO2 phase reacts with free carbon with increasing temperature, resulting in SiC, SiO, and CO [28], shown in Equations (2) and (3). Hence the intensity of the SiO2 phase decreases at temperatures higher than 1100 °C. Moreover, the SiO2 phase can stem from oxygen pollution during the pyrolysis process, as at 1800 °C. At 1600–1800 °C, the Si-O bonds at 101–102 eV may come from the residue Si-O-Si and Si-O-Al bonds in the specimens.
S i C x O y s S i O 2 s + S i C s
S i O 2 s + C s = S i O g + C O g
S i O 2 s + 3 C s = S i C s + 2 C O g
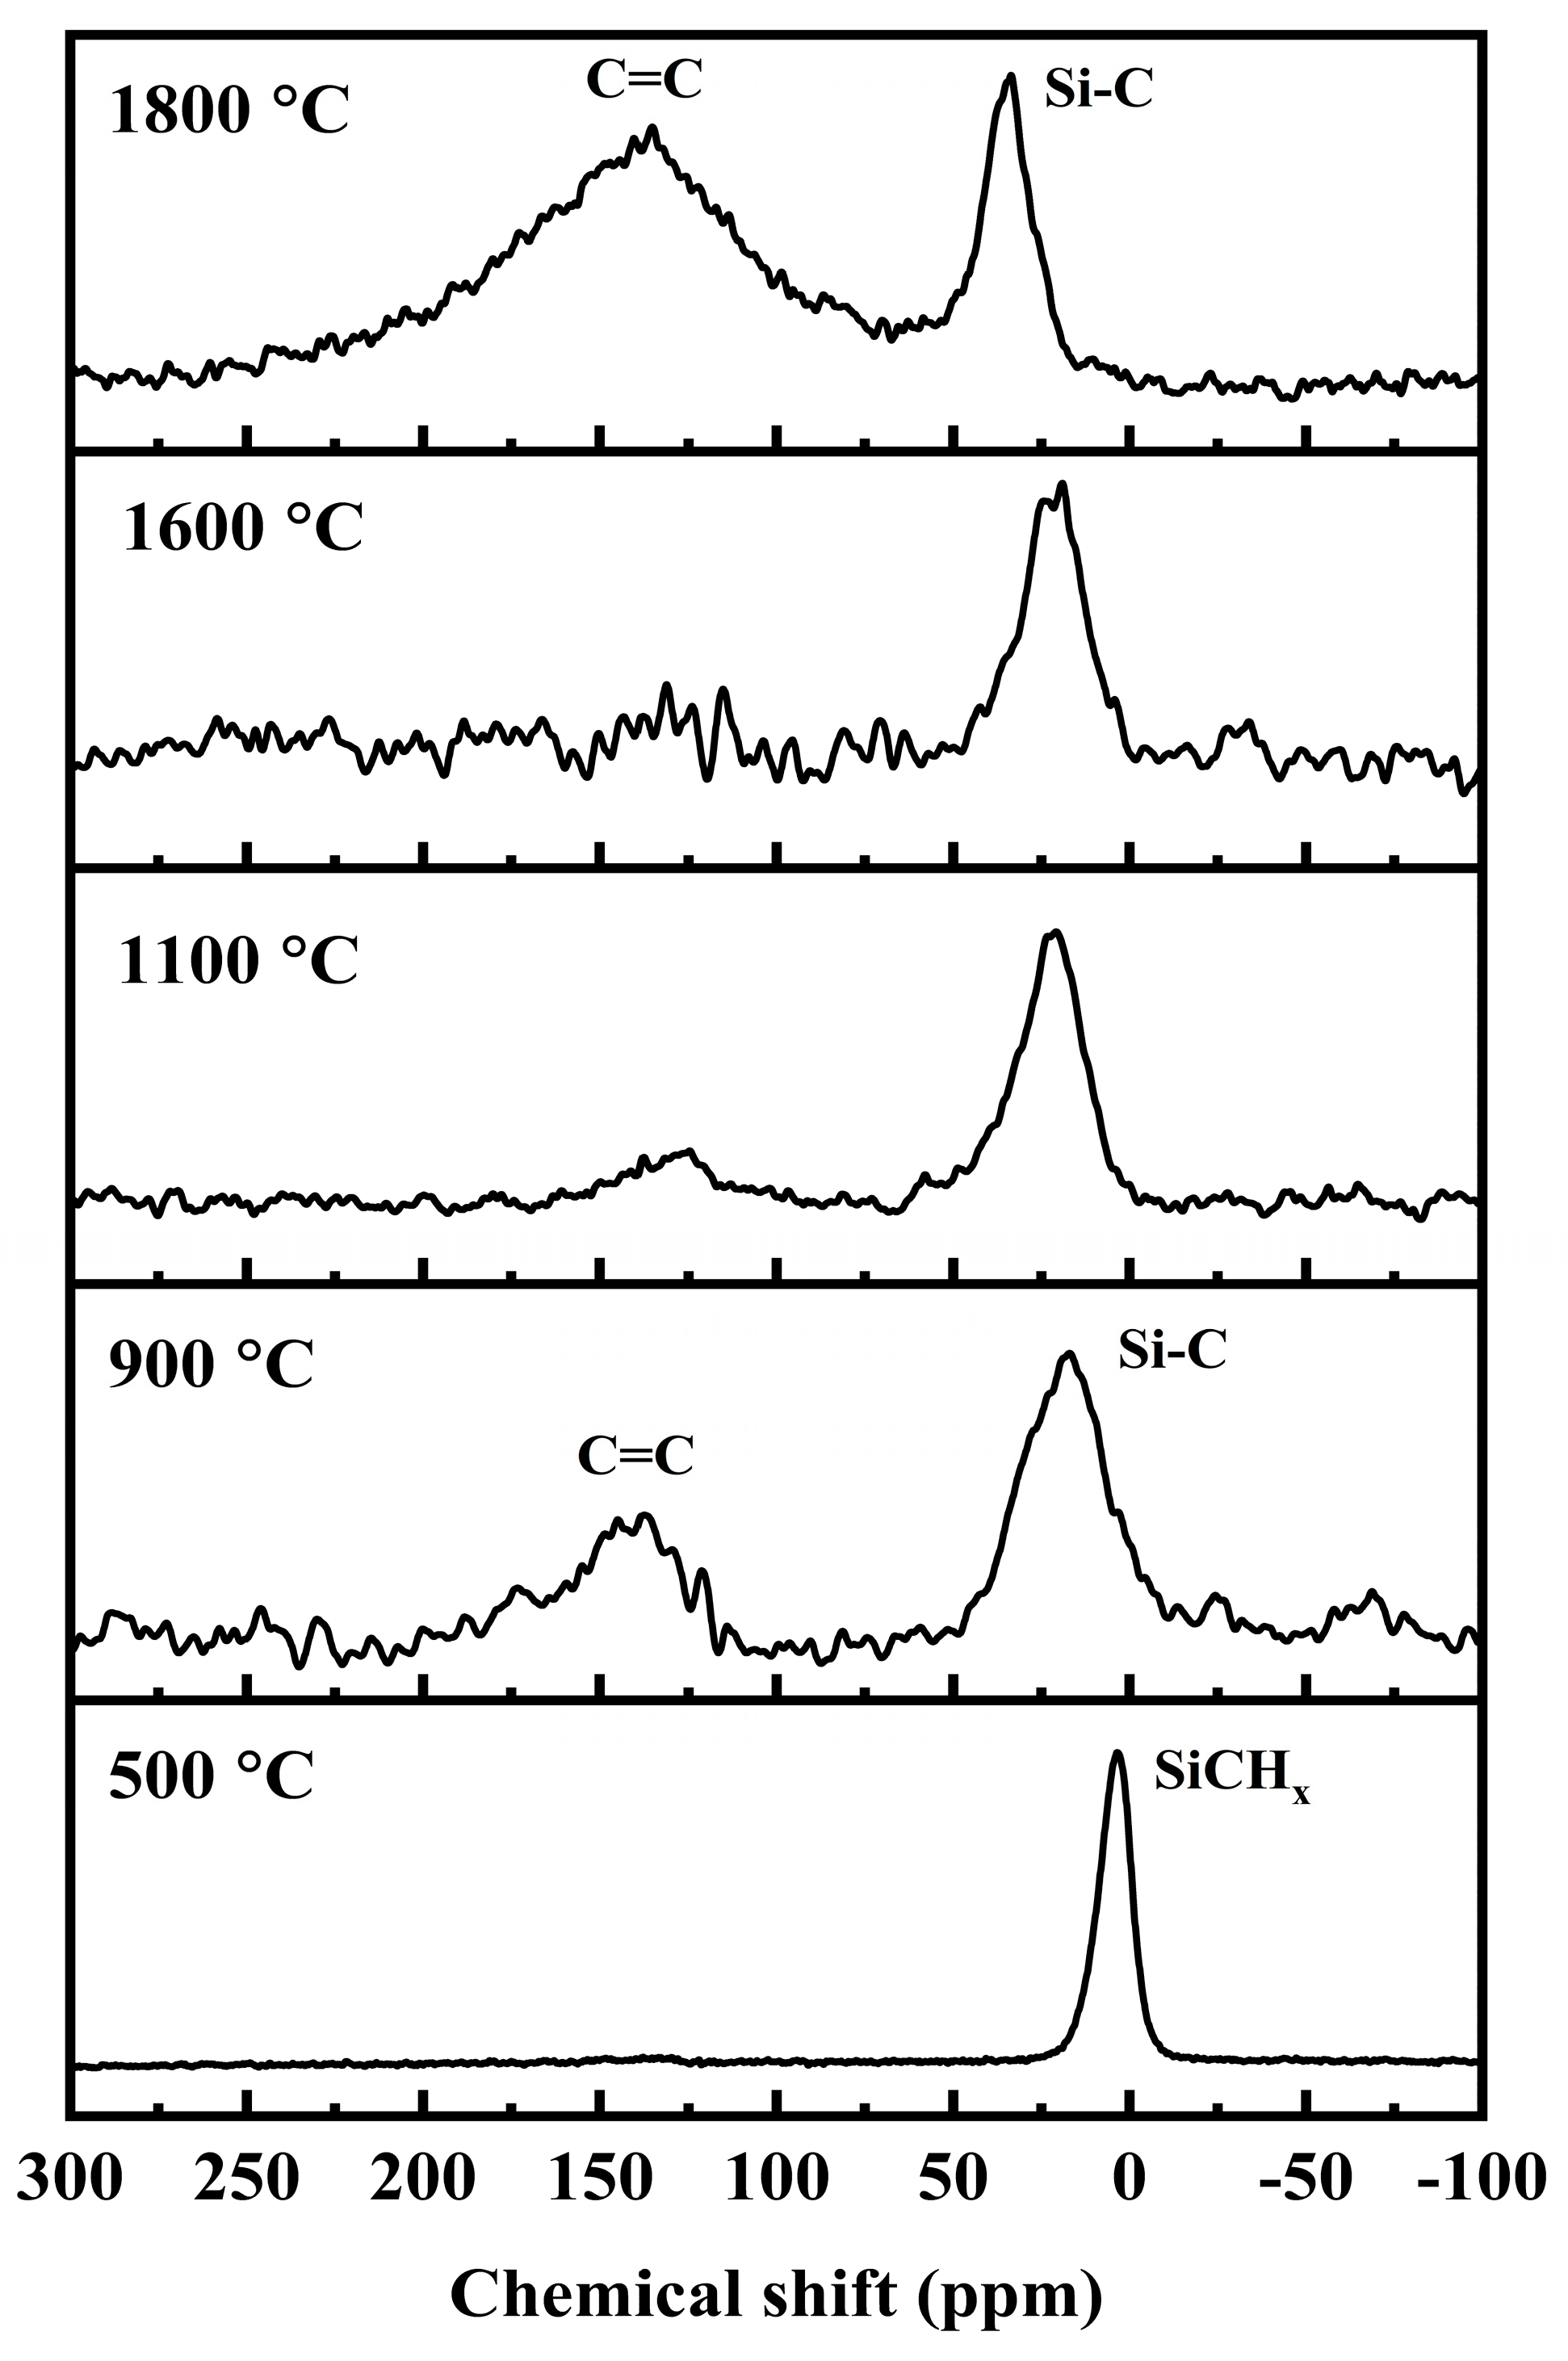
The 13C MAS NMR spectra are shown in Figure 5. In the spectra, the peak at 3 ppm at 500 °C is ascribed to SiCHx (x = 1, 2, 3) groups, which are the same as in the precursors [27,28]. As the temperature increases to 900 °C, a resonance peak at about 16 ppm appears and represents the amorphous SiC phase. The broad SiC peak sharpens and shifts downfield with increasing temperature, also suggesting crystallizing and ordering of the SiC phase. At 900 °C, another weak peak at 130–140 ppm appears, which is due to the C=C bonds of the free carbon phase [26,27,28].
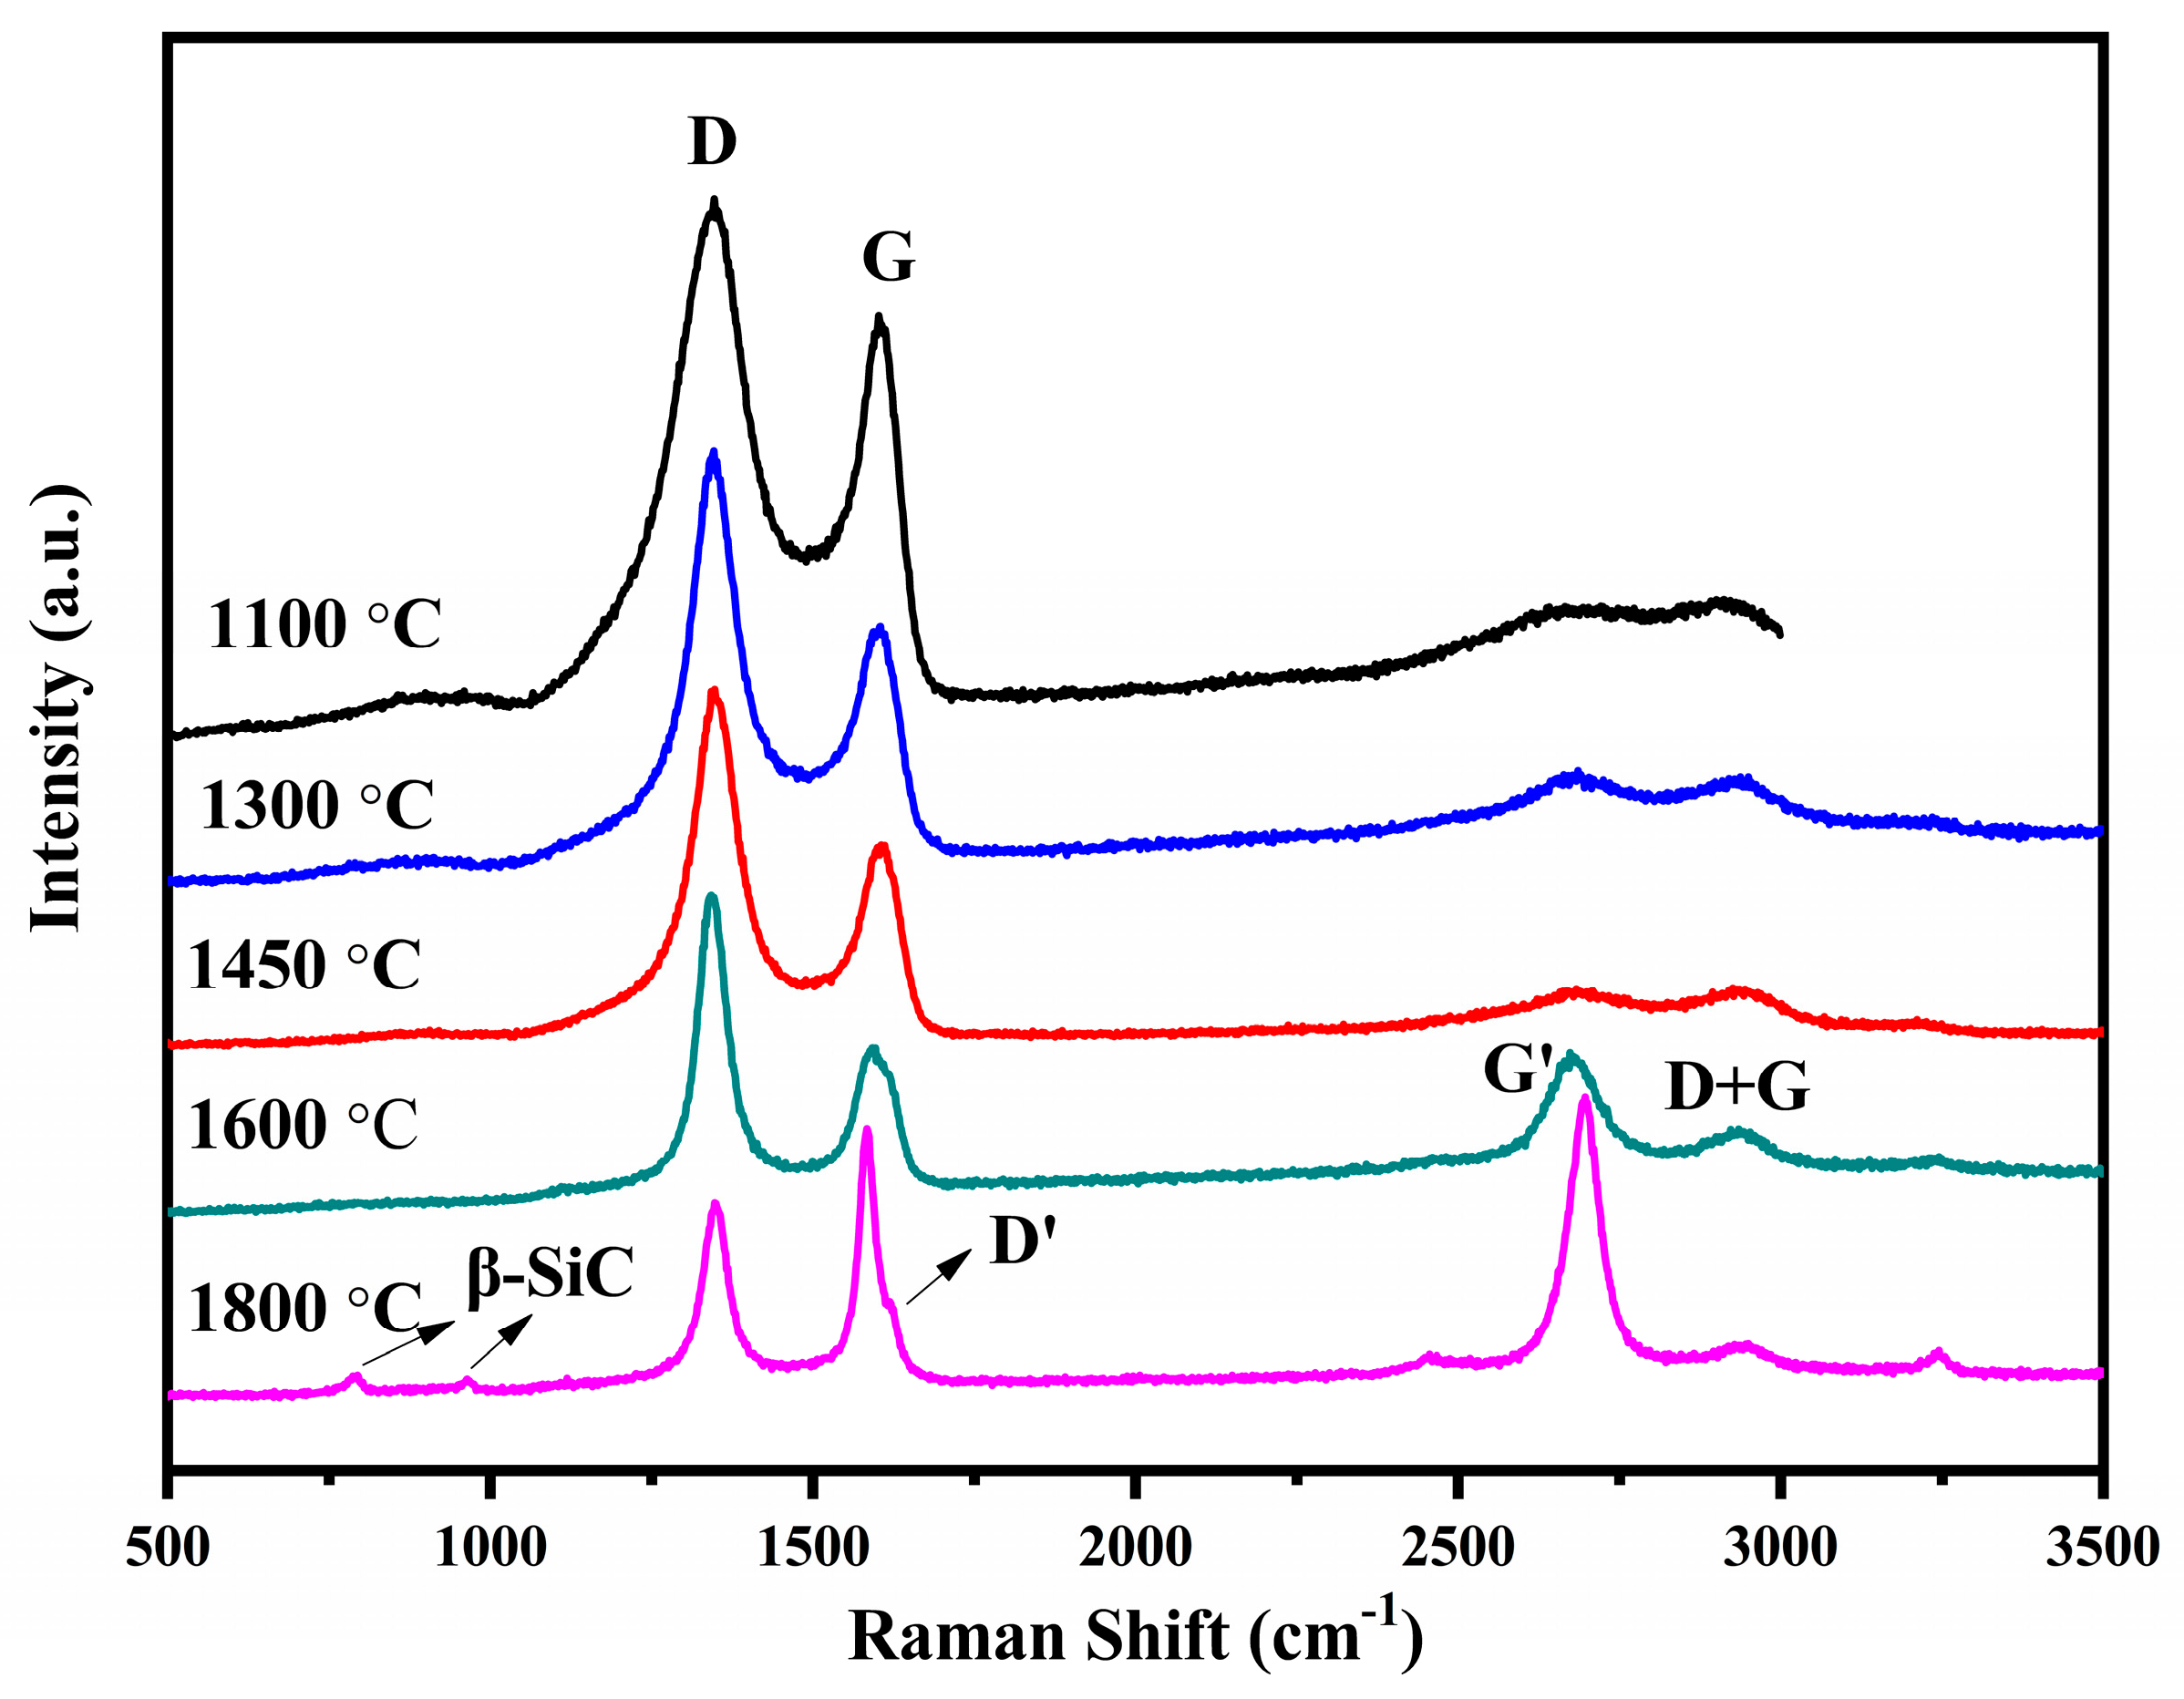
Raman spectroscopy is an effective tool for probing the information of the free carbon phase, which is shown in Figure 6. In the spectra, two peaks at around 1350 cm−1 and 1580 cm−1 usually appear, called the D band and G band, which typically represent disordering of the free carbon and basal-plane bond stretching of sp2 carbon for crystalline graphite, respectively [31,32]. In addition, in the second-order Raman spectra, G’ and D + G bands at approximately 2700 cm−1 and 2945 cm−1 sometimes appear. Accordingly, the G’ band as an overtone of the D band is commonly found in defect-free graphite specimens. The D + G band can be attributed to a combination of the G and D modes, and is usually found in disturbed graphitic structures [31]. The Raman characteristics are presented in Table 2. With increasing temperature, the G band position shifts toward low wavenumbers, and the intensity ratio of the D and G bands, ID/IG, increases in the temperature ranges of 1100–1600 °C and then decreases to 1800 °C. From 1600 °C to 1800 °C, the intensity of the G’ band enlarges profoundly. At 1800 °C, a shoulder at 1620 cm−1 called the D’ band appears, indicating that crystalline grains of graphitic carbon have been formed. These indicate that at 1600 °C the crystalline graphitic carbon is formed and that the turning point for the free carbon phase changing from amorphous to crystalline is in the temperature range of 1400–1600 °C. From 1100 °C to 1450 °C, with increasing temperature, the number of the ordered C-C rings increases, thus the amorphous carbon becomes more and more turbostratically ordered; therefore, the G band position turns into red-shift and the ID/IG increases. With increasing temperature sequentially, the turbostratic free carbon phase continues the growth and rearrangement, leading to formation of graphitic carbon nanocrystallites, which grow again. The graphitic carbon becomes more and more ordered, and therefore the G band position turns into red-shift and the ID/IG is decreases to 1600–1800 °C. The size of the amorphous turbostratic carbon clusters and graphitic carbon crystallites, La, can be evaluated by ID/IG using the Ferrari–Robertson correlation [33]: I D / I G = C ( λ ) × L a 2 , and the TK-correlation [34]: I D / I G = C ( λ ) / L a , respectively. The values of La are calculated according to the above correlations [31]. At 1100–1450 °C, the La for amorphous turbostratic carbon clusters is calculated by the F-R method and the La for graphitic carbon crystallites is calculated by the TK method at 1600–1800 °C. The results are listed in Table 2. The La increases along with the increasing temperature, whether it represents the size of the amorphous carbon cluster or the lateral crystallite size of the graphitic carbon.
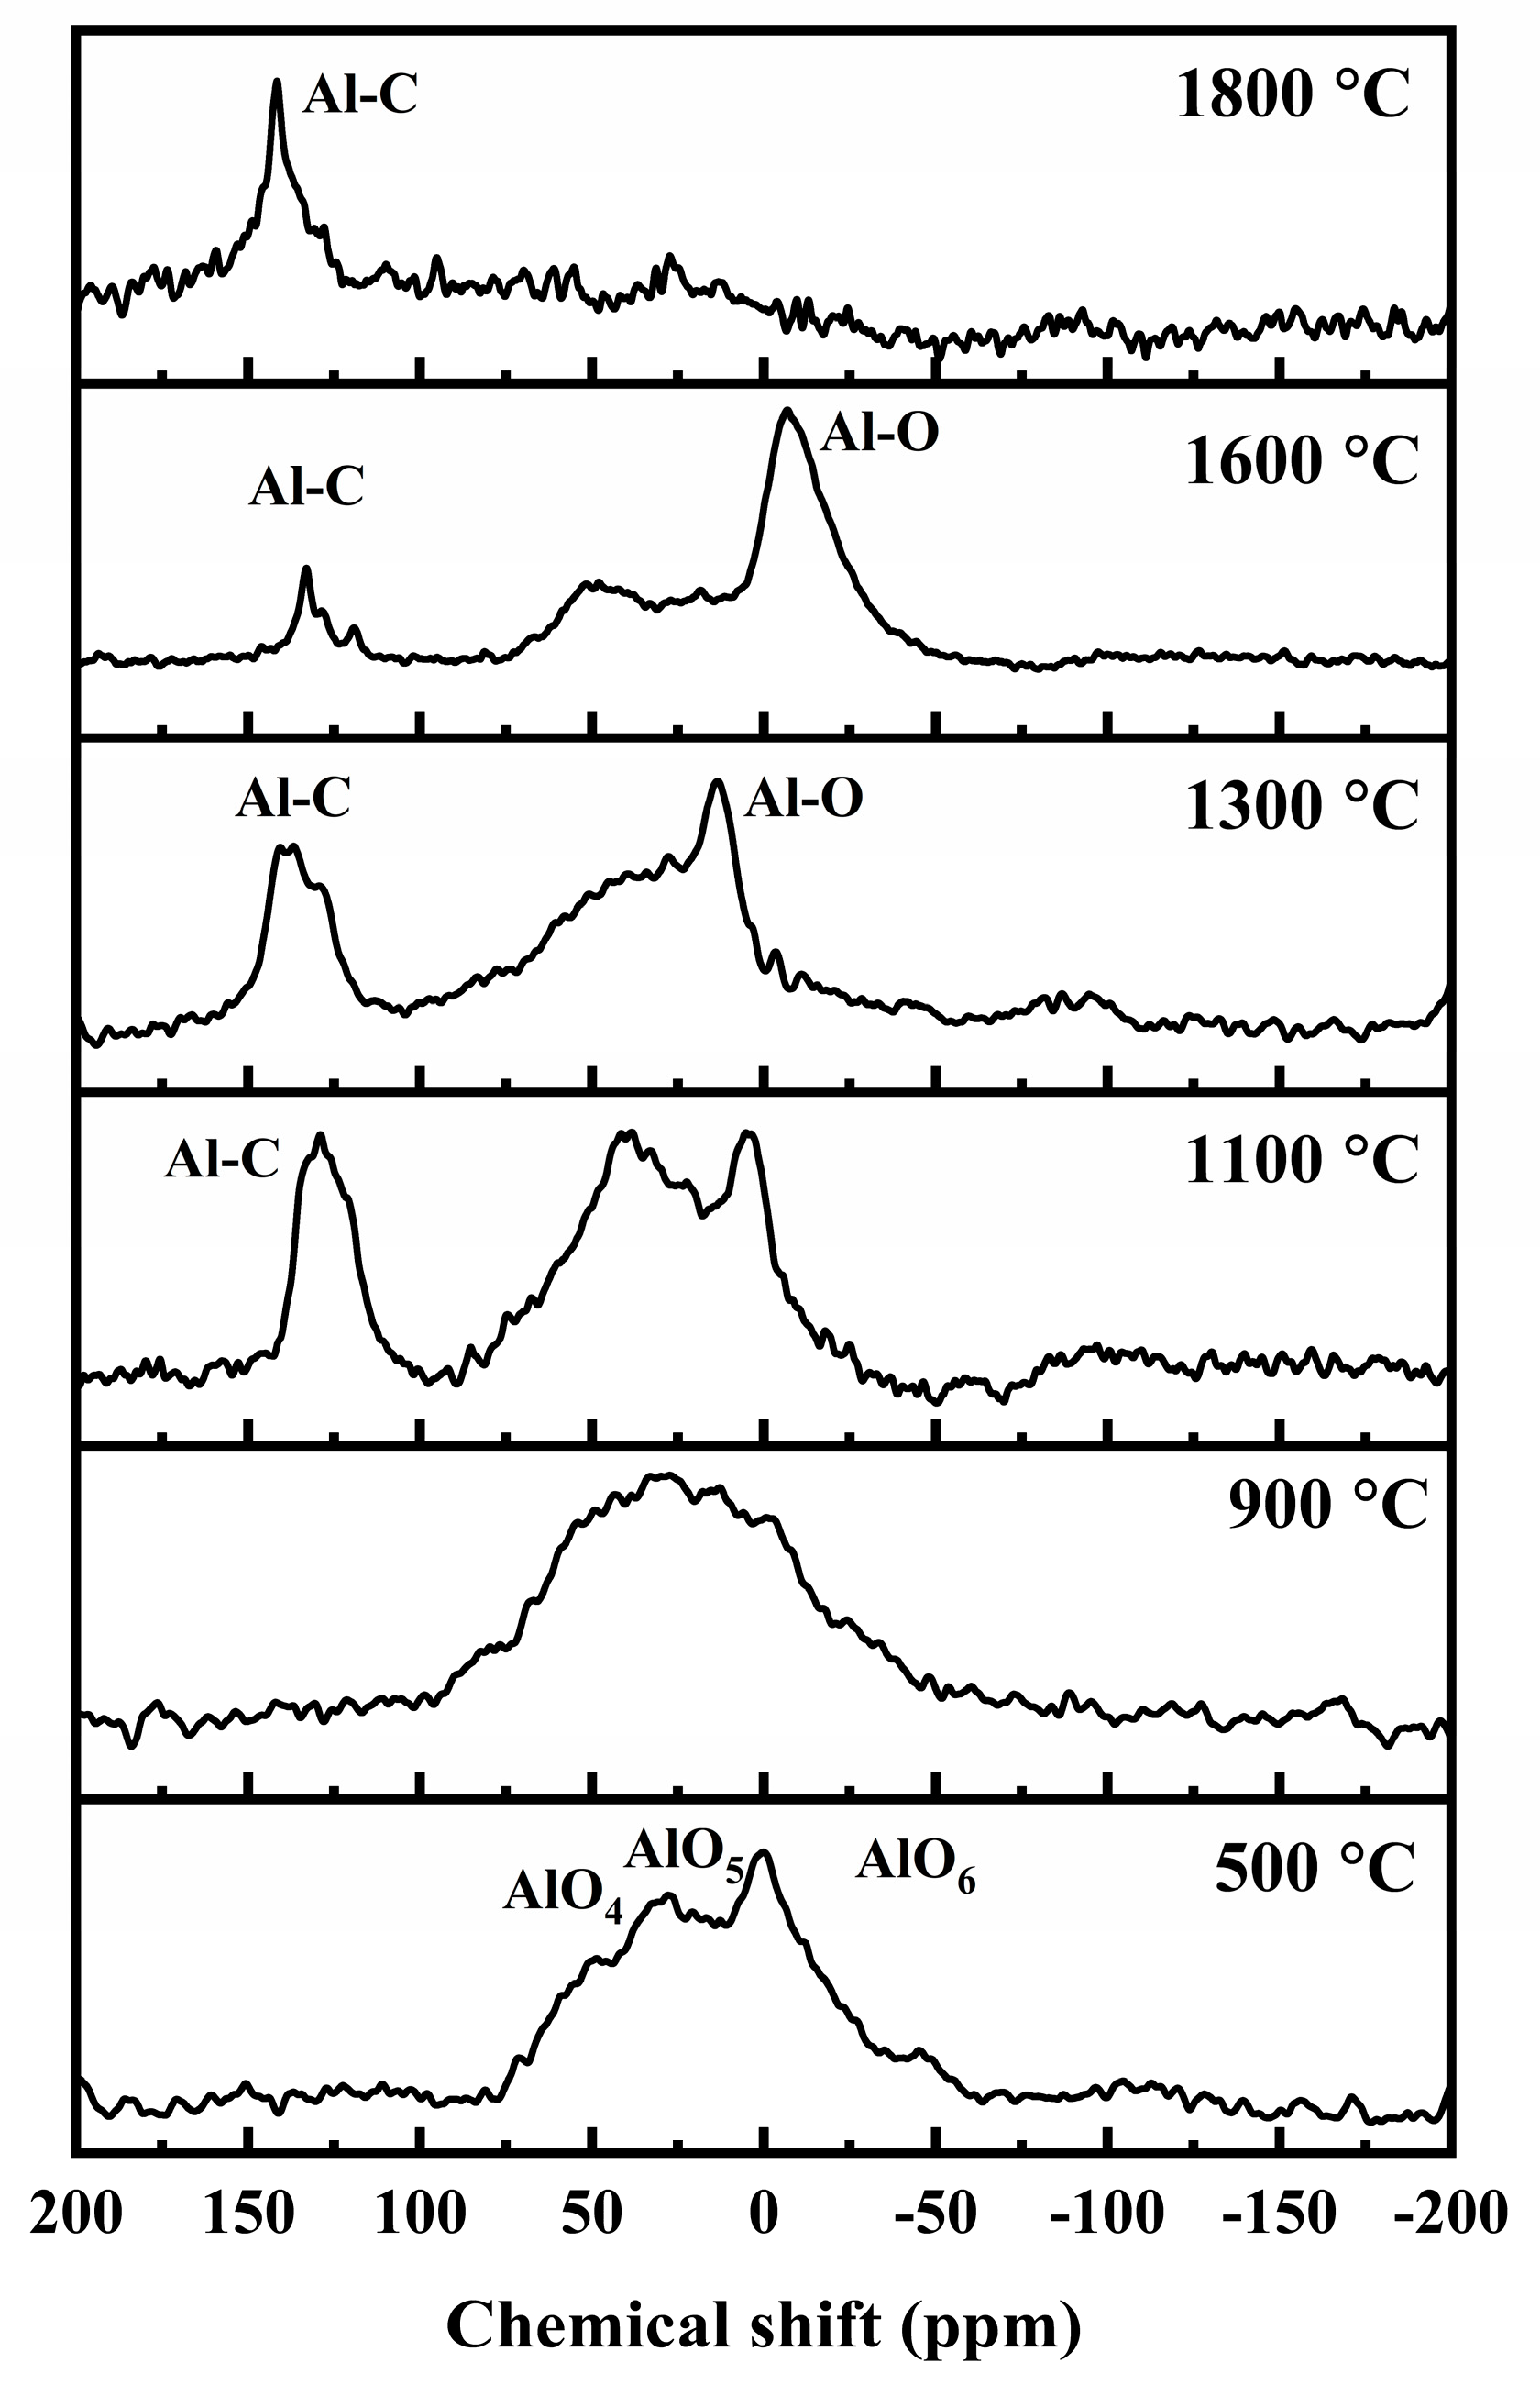
The XPS spectra of C 1 s are shown in Figure 7. In a typical XPS spectra of C 1 s for a polymer-derived ceramic (PDC), the C-Si, C=C, and C-C/C-H bonds should be the main chemical bonds with a binding energy of around 283.8, 284.5, and 285.5 eV, respectively. The C-Si bonds (sp3 hybridization), the C=C bonds (sp2 hybridization), and the C-C bonds (sp3 hybridization) are mainly in the SiC-based ceramic matrix, free carbon phase, and aliphatic carbon chains of the precursors, respectively [31]. The C-H bonds (sp3 hybridization) are usually present below 1250 °C in the periphery of the free carbon [31]. Accordingly, the peaks for C-Si bonds, the free carbon phase (C=C bonds), and the C-H bonds (below 1250 cm−1) are fitted in the spectra as shown in Figure 7. However, there exists another peak located at about 282.2 eV at each temperature which can’t be neglected. The peak is also fitted and ascribed to the C-Al and/or the C-O-Al bonds [35]. To differentiate these bonds more clearly, 27Al MAS NMR tests are conducted; the spectra are shown in Figure 8. At 500 °C, three resonance peaks, located at approximately 0, 32, and 55 ppm, are attributed to octahedral AlO6, pentacoordinated AlO5, and tetrahedral AlO4, respectively, as in the PACS precursor [12,13,14]. At 900 °C, these three peaks evolve into a broad peak which is related to amorphous Al-O bonds [18]. The changes in the Al-O bonds suggest that the Si-O-Al bonds may form an amorphous AlOxSiy phase by structural rearrangements at 900 °C. The Al-C bonds are not found in the 27Al MAS NMR spectrum at 900 °C; therefore, the fitted peak at about 282.2 eV in the XPS spectra of C 1 s can be attributed to the C-O-Al bond at this temperature. The C-O-Al bonds result from the reaction between the Si-O-Al bonds and free carbon, shown in Equation (4). At 1100 °C and 1300 °C, the Al-O bonds split again and an evident peak appears at around 130 ppm, which is ascribed to Al-C bonds [18,19,20,23,24]. In the low temperature range of 1100–1300 °C, the appearance of the Al-C bond can be ascribed to the formation of an Al4C3 phase; the split of Al-O bonds indicates the formation of the Al2O3 phase, which both originate from the amorphous AlOxSiy phase, as shown in Equation (5). At 1600 °C, the intensity of the Al-C bond decreases while the intensity of the Al-O bonds increases, suggesting the formation of new phase. Based on thermodynamics analysis and experimental research [36,37], Equations (6) and (7) may occur when T ≥ 1560 °C and T ≥ 1259 °C, and Equations (8) and (9) may occur when T ≥ 1620 °C. Therefore, it is reasonable to infer that at temperatures around 1600 °C the Al4O4C and Al2OC phases have been formed by the consumption of Al4C3, Al2O3, and free carbon. With an increase in temperature, the Al4O4C and Al2OC phases can be converted into Al4SiC4 by reactions with SiC and free carbon [38], as shown in Equations (10) and (11). Hence the Al-C bonds increase to a great degree, while the Al-O bonds decease and even vanish at 1800 °C in the 27Al MAS NMR spectra.
S i O A l + 2 C = A l O C + S i C
A l O x S i y s + C s A l 4 C 3 s + A l 2 O 3 s + S i C s + C O g
A l 4 C 3 s + 4 A l 2 O 3 s = 3 A l 4 O 4 C s
2 A l 2 O 3 s + 3 C s = A l 4 O 4 C s + 2 C O g
A l 4 C 3 s + A l 2 O 3 s = 3 A l 2 O C s
A l 2 O 3 s + 3 C = A l 2 O C s + 2 C O g
A l 4 O 4 C s + S i C s + 6 C ( s ) = A l 4 S i C 4 ( s ) + 4 C O g
2 A l 2 O C s + S i C s + 3 C ( s ) = A l 4 S i C 4 ( s ) + 2 C O g

3.3. Chemical Position and Crystal Structure Changes

The chemical compositions for the PACS and the pyrolysis products at 1300 °C and 1800 °C are listed in Table 3. The PACS precursor is not subjected to oxidative curing; thus the precursor and the pyrolysis residues are all carbon-rich. The decease in oxygen content at above 1300 °C corresponds to the thermal decomposition of the SiOxCy phase and the consumption of the AlOxSiy phase, as illustrated above. Strangely, the Al content drops largely at 1800 °C. One reason for this is that the Al content is not easily determined precisely at this temperature, and another reason may be the reaction between the SiC and the Al2O3 at high temperature, with the release of Al2O, as shown in Equation (12).
S i C s + A l 2 O 3 s = S i O g + A l 2 O g + C O g
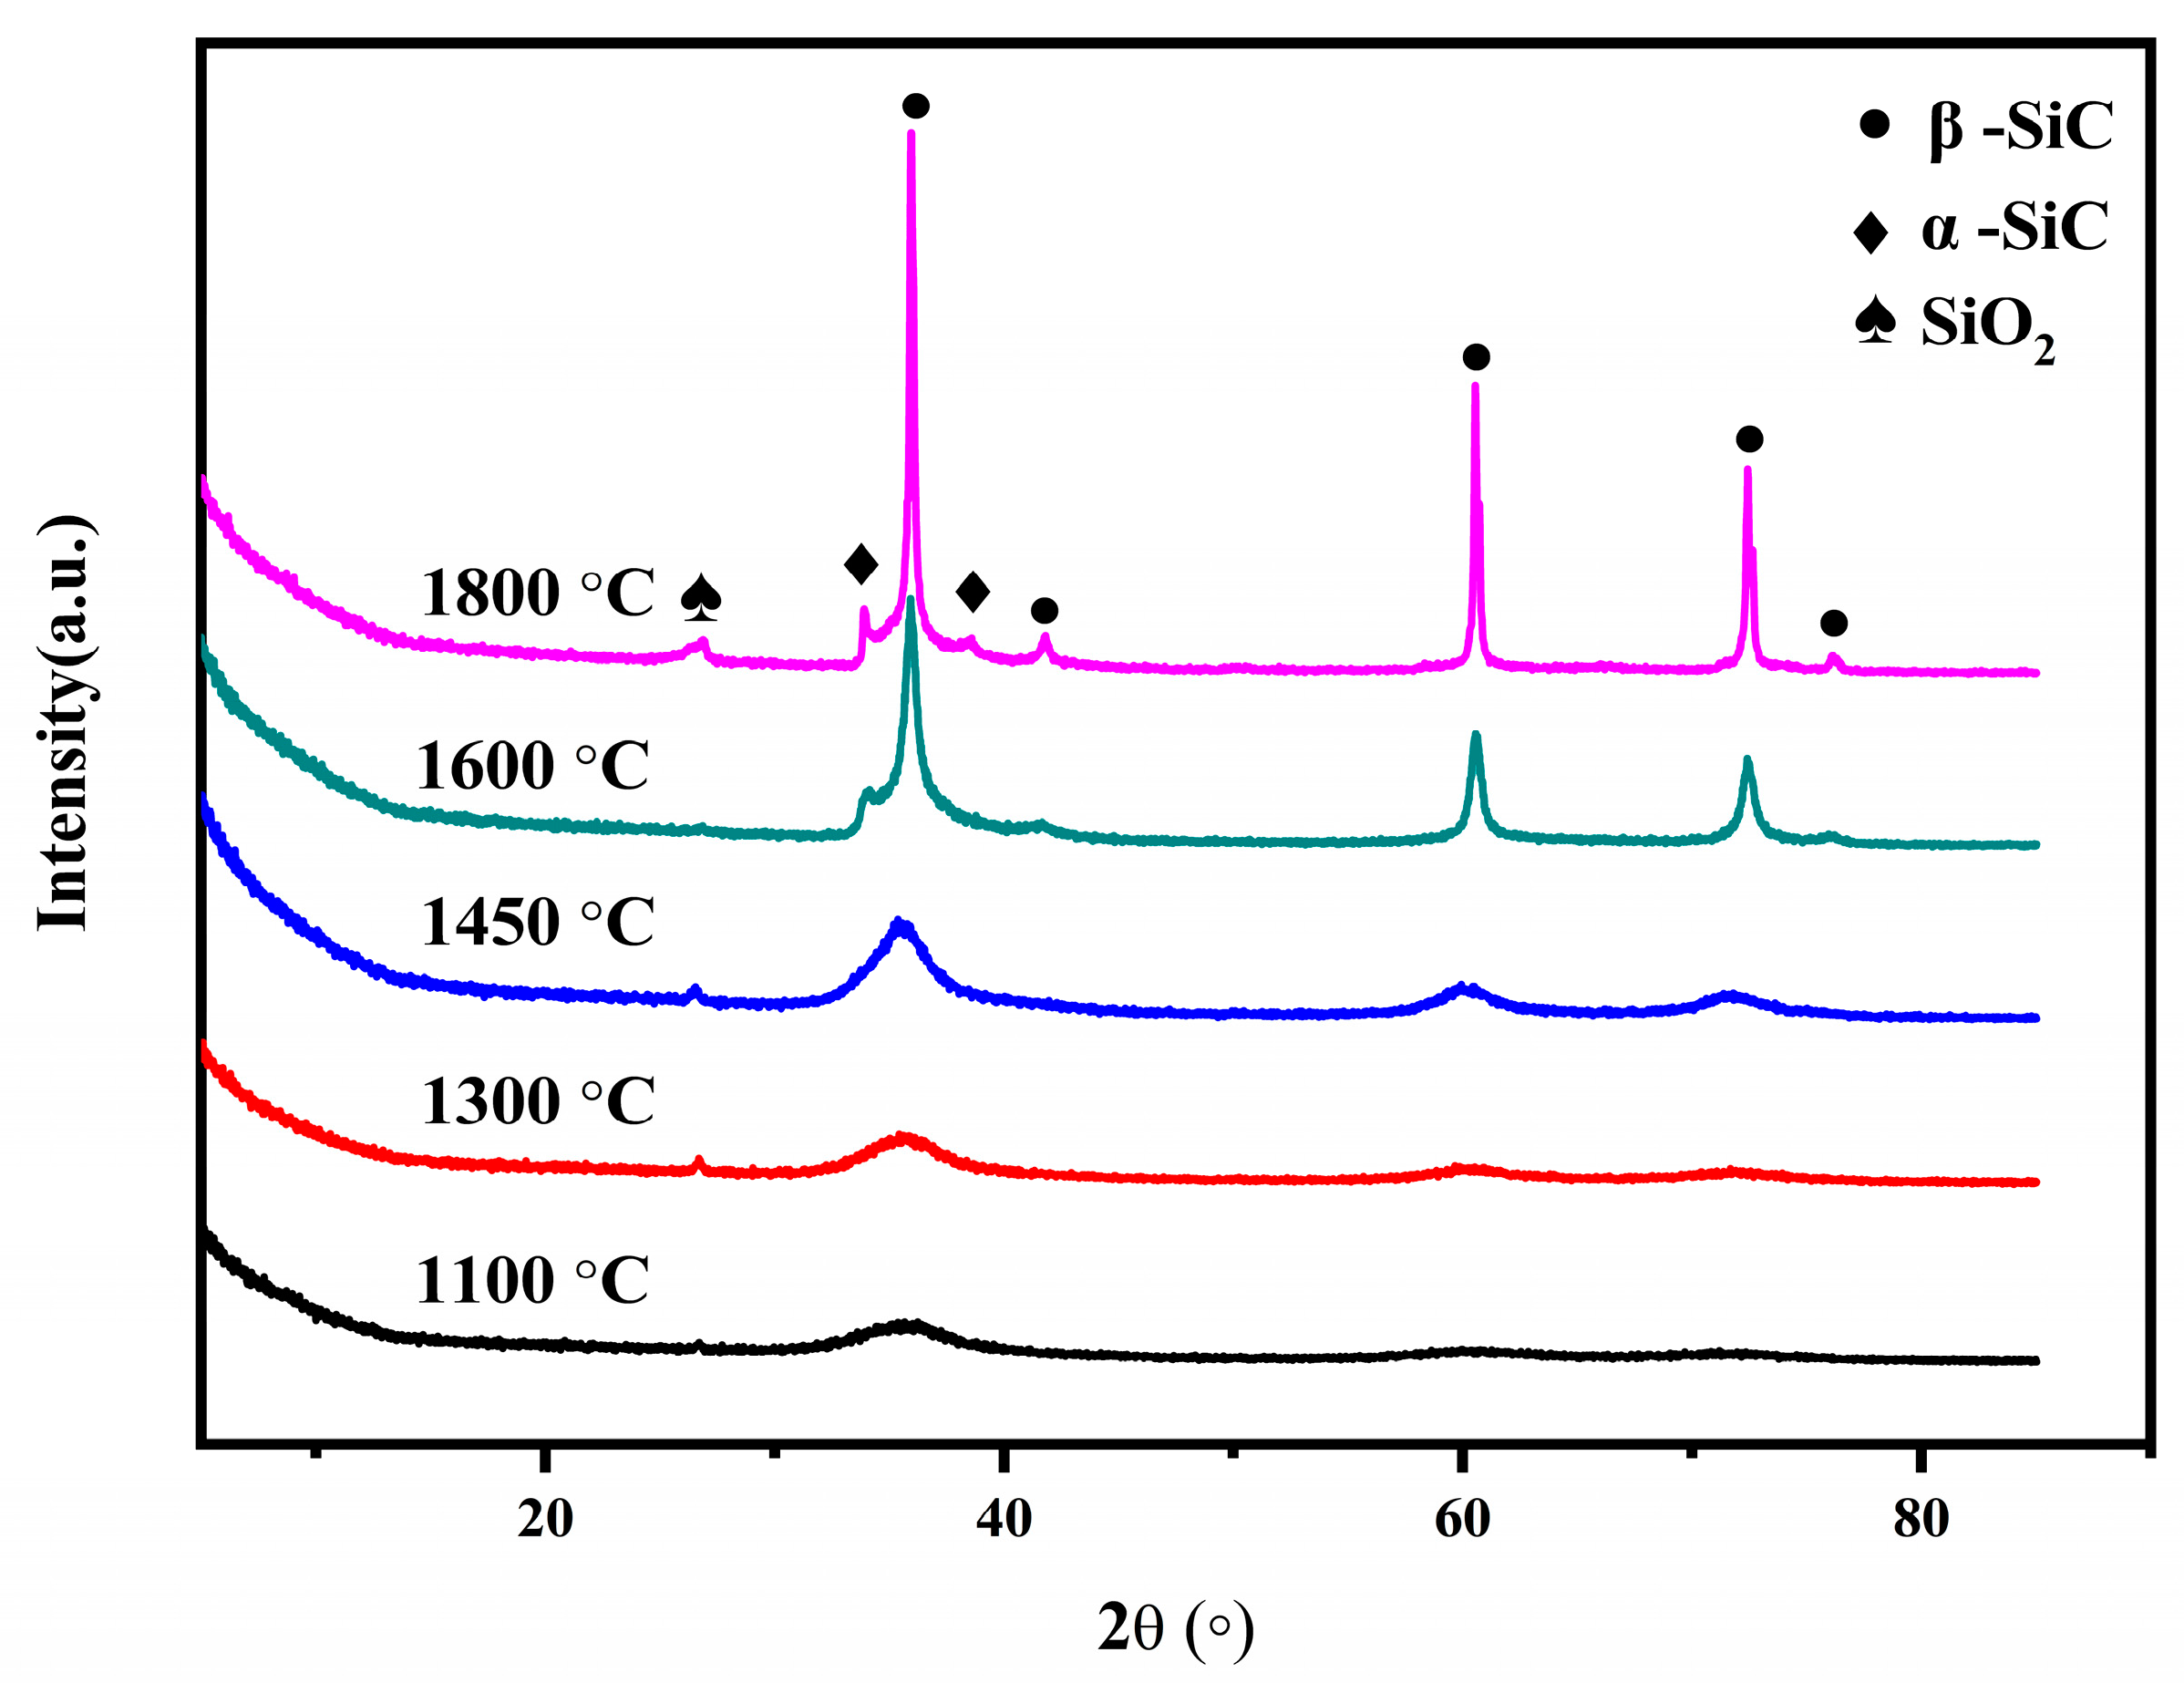
The XRD patterns for the pyrolysis residues of the PACS at various temperatures are shown in Figure 9. It is seen that at 1100 °C there exists a broad weak peak at 35.7°, suggesting that the residue is still amorphous at this temperature. At 1300 °C, the peaks at 35.7°, 60.5°, and 72.4° emerge distinctly, which are assigned to (111), (220), and (311) diffraction peaks of β-SiC. With increasing temperature, the intensities are increased. At 1600 °C and 1800 °C, the peaks at 34.1° and 38.6° appear, which are assigned to α-SiC. The apparent mean grain sizes of the SiC crystalline phase (111) are calculated by the Scherrer equation, which are 16 nm, 19 nm, 32 nm, and 59 nm at 1300 °C, 1450 °C, 1600 °C, and 1800 °C, respectively. The little weak peak at 26.6° is attributed to SiO2, coinciding with the XPS and FTIR results. At high temperatures, the formed Al4O4C, Al2OC, and Al4SiC4 phases enrich in the SiC grain boundaries and the Al-C bonds in Al4SiC4 can easily enter into the SiC lattice because of the similar bond length of Al-C (0.195 nm) and Si-C (0.188 nm), which can easily inhibit the SiC grain growth. The Al4O4C and Al2OC phases react with the SiC phase to favor the formation of the α-SiC at the expense of the β-SiC via formation of a solid solution between the phases.
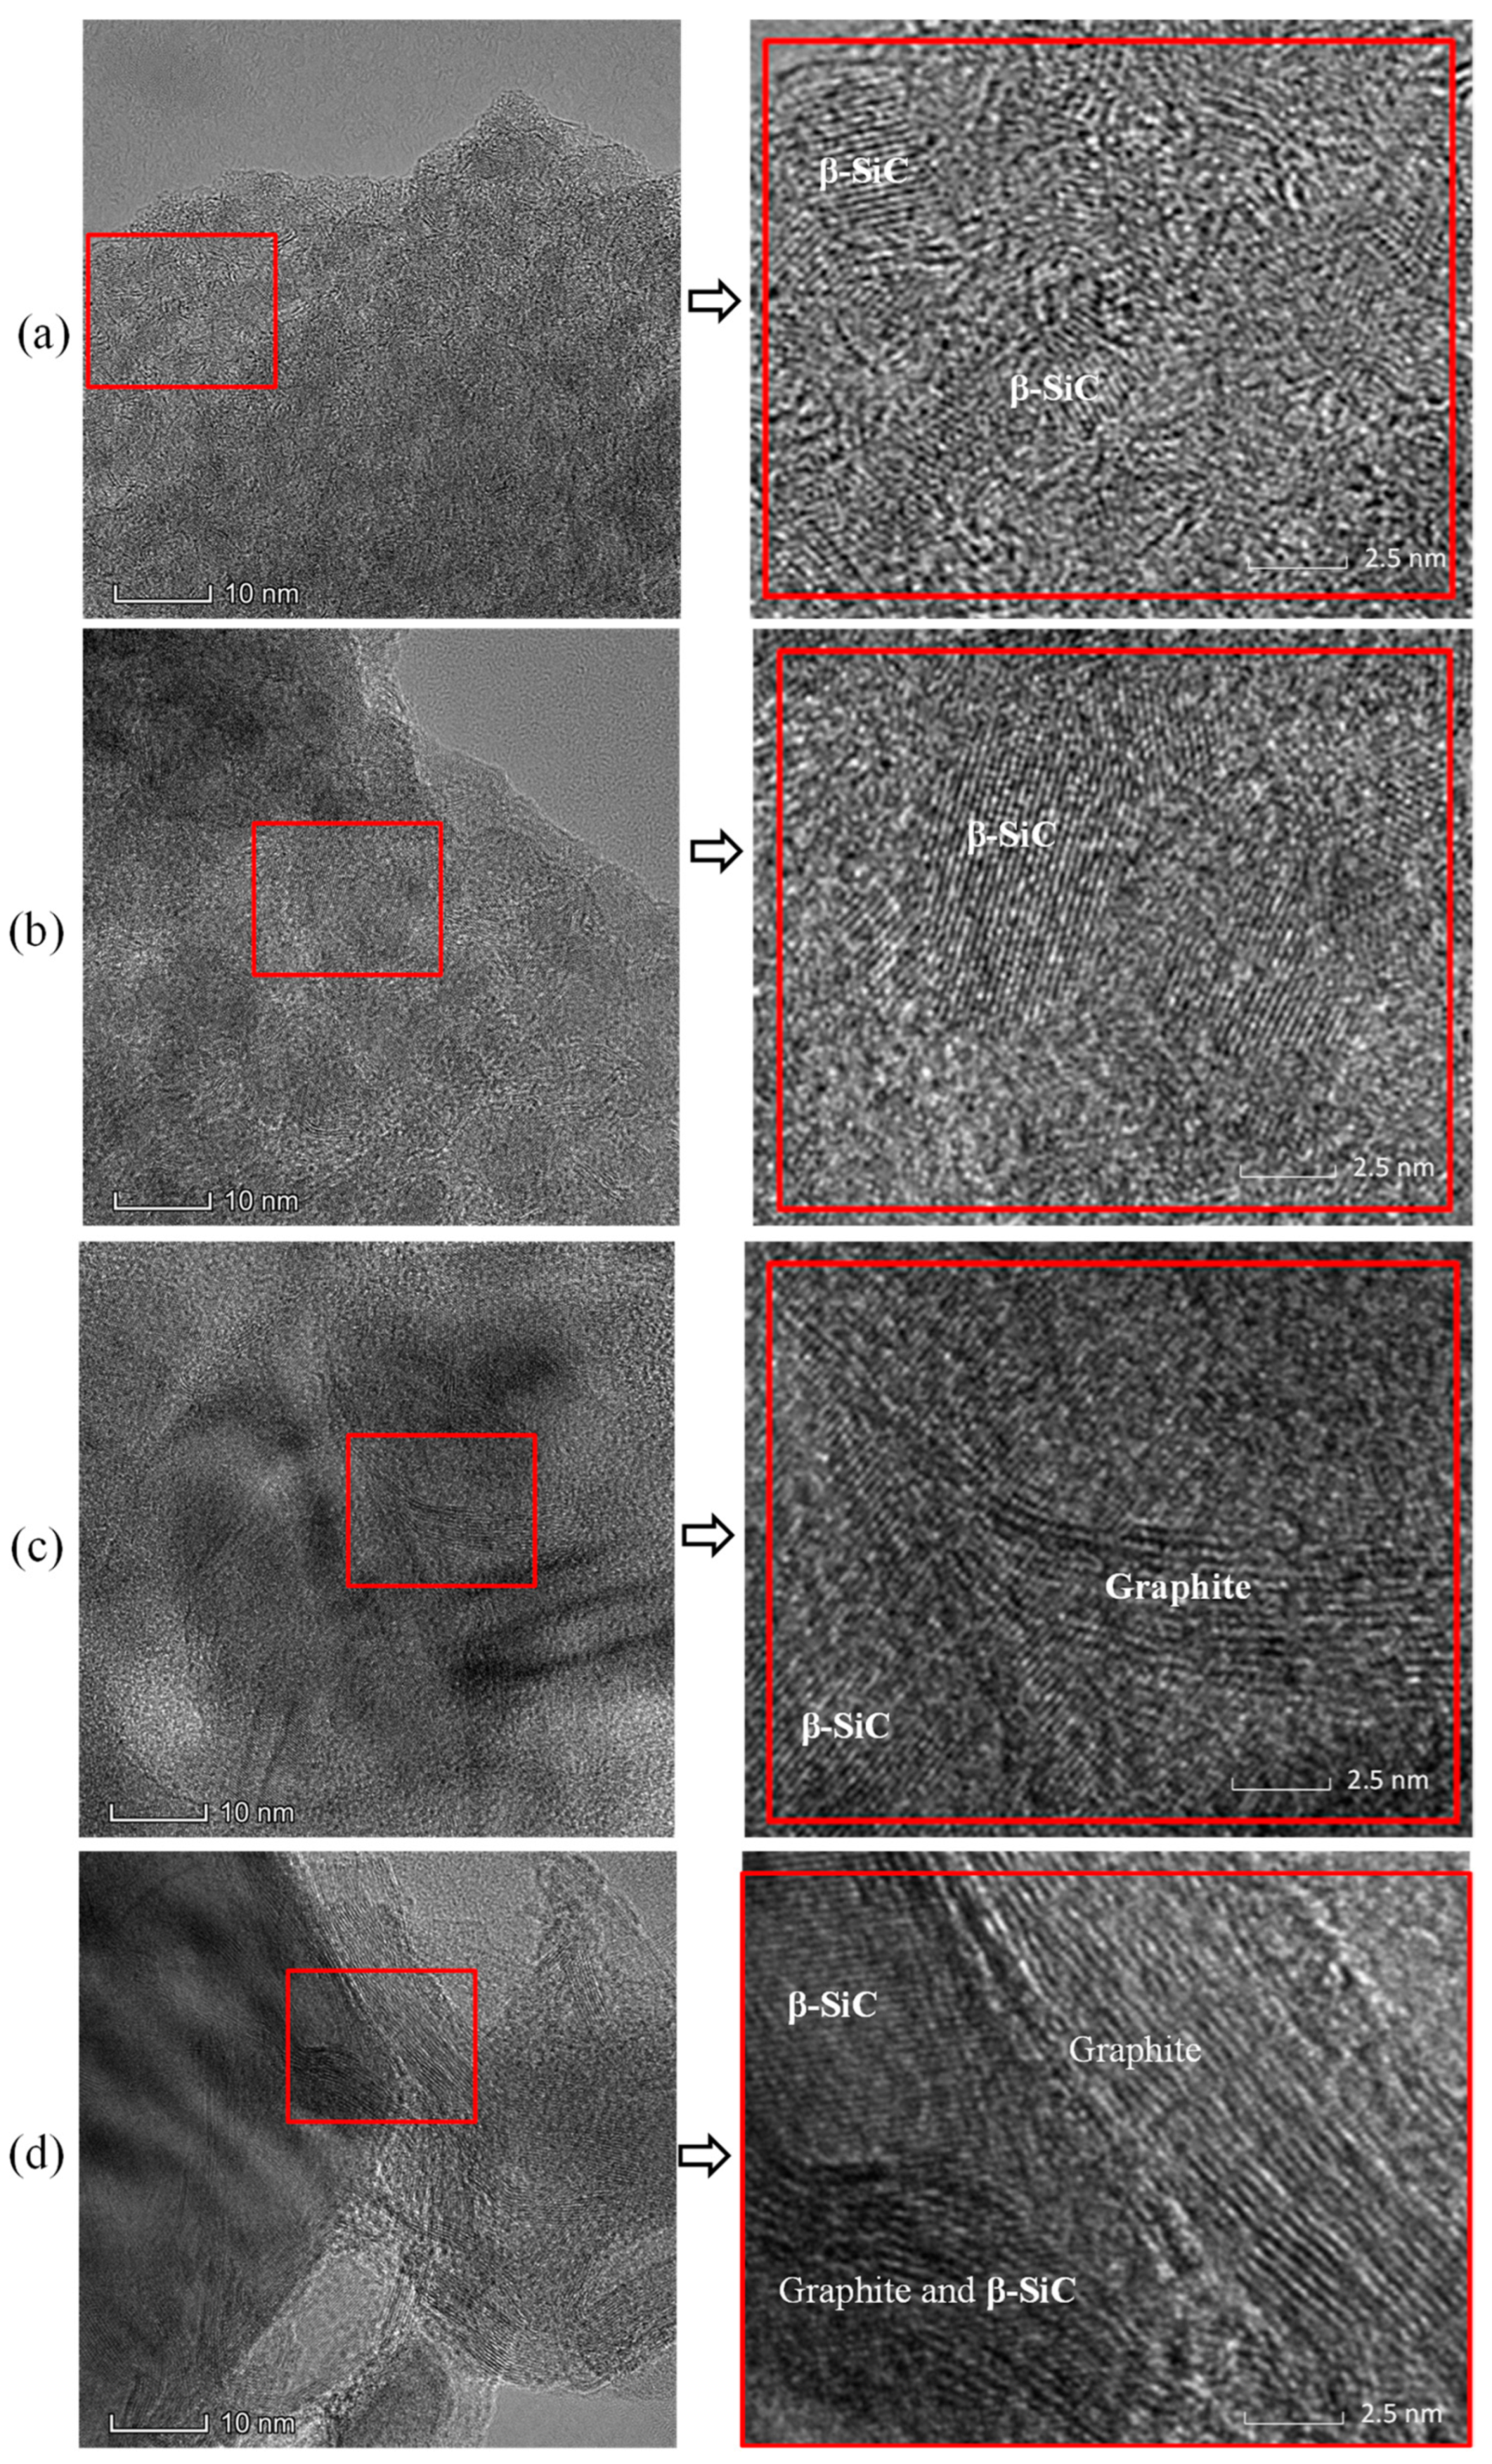
The HRTEM images for the pyrolysis residues of the PACS at 1300–1800 °C are presented in Figure 10. The crystalline β-SiC phase is clearly seen, and the grain size enlarges with increasing temperature, corresponding to the XRD results. At 1300 °C and 1450 °C, the graphitic carbon phase is not seen, indicating the free carbon is almost amorphous. As the temperature increases to 1600 °C, the graphitic carbon phase can be clearly observed, and the size enlarges with increasing temperature. The results coincide with the Raman analysis.

4. Conclusions

In this study, PACS with a higher Al content is synthesized and the structural evolutions as well as the changes for the structural form of the elements of Si, C, and Al during the pyrolysis process are elaborately investigated. It is found that the polymer turns into a three-dimensional network inorganic structure up to 800–900 °C by dehydrogenation and dehydrocarbonation condensation reactions (400–550 °C) and decomposition of the side chains (550–800 °C). The amorphous SiOxCy, AlOxSiy, and free carbon phase are initially formed. From 800 °C to 1200 °C, the pyrolysis products are mainly amorphous, but the SiOxCy phase partially separates into SiO2, and the AlOxSiy phase turns into Al3C4 and Al2O3 by reaction with free carbon. Amorphous turbostratic carbon is formed, and the cluster size enlarges with the increasing temperature. From 1200 °C to 1600 °C, the formed SiO2 reacts with free carbon with the formation of SiC and the release of SiO and CO. The crystalline β-SiC phase is formed, and the grain size enlarges with the increasing temperature. Complicated reactions between the Al3C4, Al2O3, and free carbon occur, leading to the formation of an Al4O4C and Al2OC phase at around 1600 °C. The amorphous turbostratic carbon phase continues to grow, and it changes into a crystalline graphitic structure at around 1600 °C. From 1600 °C to 1800 °C, the β-SiC and crystalline graphitic carbon phases continue to grow. The Al4O4C and Al2OC phases are gradually converted into Al4SiC4 by reactions with the SiC and free carbon, which favors the formation of α-SiC via formation of a solid solution between the phases. Moreover, the SiC grain growth is inhibited because of the Al4O4C, Al2OC, and Al4SiC4 phases enriching in the SiC grain boundaries and the Al-C bonds in the Al4SiC4 entering into the SiC lattice. In addition, the Al element is partially lost by the evaporation of the formed Al2O gas. These new discoveries may provide theoretical references for regulating the structures and properties of the final product, such as fibers, bulk ceramics, membranes, foams, etc.

Author Contributions

Data curation, Formal analysis, Investigation, Writing—original draft, F.X.; Data curation, Formal analysis, Investigation, Writing—original draft, Y.D.; Conceptualization, Funding acquisition, Methodology, Visualization, Writing—review & amp, editing, G.M.; Conceptualization, Funding acquisition, Methodology, Project administration, Visualization, Q.H.; Project administration, Supervision, Funding acquisition, Z.H. All authors have read and agreed to the published version of the manuscript.

Funding

This study is supported by the Natural Science Foundation of Zhejiang Province (Project LY21B040003), the Ningbo “3315 Plan” Innovation Team Project (No. 2018A-03-A), and the Advanced Energy Science and Technology Guangdong Laboratory (Grant No. HND20TDTHGC00).

Institutional Review Board Statement

Not applicable.

Informed Consent Statement

Not applicable.

Data Availability Statement

The data presented in this study are available on request from the corresponding author.

Conflicts of Interest

The authors declare no conflict of interest.

References

  1. Yajima, S.; Hayashi, J.; Omori, M.; Okamur, K. Development of a silicon carbide fibre with high tensile strength. Nature 1976, 261, 683–685. [Google Scholar] [CrossRef]
  2. Ishikawa, T.; Kohtoku, Y.; Kumagawa, K.; Yamamura, T.; Nagasawa, T. High-strength alkali-resistant sintered SiC fibre stable to 2200 °C. Nature 1998, 391, 773–775. [Google Scholar] [CrossRef]
  3. Riedel, R.; Kleebe, H.; Schönfelder, H.; Aldinger, F. A covalent micro/nano- composite resistant to high-temperature oxidation. Nature 1995, 374, 526–528. [Google Scholar] [CrossRef]
  4. Chen, Y.; Li, C.; Wang, Y.; Zhang, Q.; Xu, C.; Wei, B.; An, L. Self-assembled carbon-silicon carbonitride nano-composites: High-performance anode materials for li-thium-ion batteries. J. Mater. Chem. 2011, 21, 18186–18190. [Google Scholar] [CrossRef]
  5. Bernard, S.; Miele, P. ChemInform abstract: Ordered mesoporous polymer-derived ceramics and their processing into hierarchically porous boron nitride and silico-boron carbonitride monoliths. Cheminform 2014, 38, 1923–1931. [Google Scholar] [CrossRef]
  6. Zhao, R.; Shao, G.; Cao, Y.; An, L.; Xu, C. Temperature sensor made of polymer-derived ceramics for high-temperature applications. Sens. Actuat. A—Phys. 2016, 219, 58–64. [Google Scholar] [CrossRef] [Green Version]
  7. Cao, F.; Kim, D.; Li, X.; Feng, C.; Song, Y. Synthesis of polyaluminocarbosilane and reaction mechanism study. J. Appl. Polym. Sci. 2002, 85, 2787–2792. [Google Scholar] [CrossRef]
  8. Gou, Y.; Wang, H.; Jian, K.; Wang, Y.; Wang, J.; Song, Y.; Xie, Z. Facile synthesis of melt-spinnable polyaluminocarbosilane using low-softening-point polycarbosilane for Si-C-Al-O fibers. J. Mater. Sci. 2016, 51, 8240–8249. [Google Scholar] [CrossRef]
  9. Yu, Y.; Li, X.; Cao, F. Synthesis and characterization of polyaluminocarbosilane. J. Mater. Sci. Lett. 2005, 40, 2093–2095. [Google Scholar] [CrossRef]
  10. He, G.; Chen, J.; Chen, L.; Xia, H.; Zhang, L. Method for preparing polyaluminocarbosilane. J. Appl. Polym. Sci. 2009, 113, 3725–3731. [Google Scholar] [CrossRef]
  11. Xie, Z.; Gou, Y. Polyaluminocarbosilane as precursor for aluminum-containing SiC fiber from oxygen-free sources. Ceram. Int. 2016, 42, 10439–10443. [Google Scholar] [CrossRef]
  12. Duan, Y.; Mo, G.; Chen, H.; Liang, Y.; Cui, Z.; Yang, X.; Zhu, S.; Li, Z.; He, L.; Huang, Q. Synthesis of polyaluminocarbosilane with low branching extent using liquid polysilacarbosilane and aluminum acetylacetonate by high-pressure method. Appl. Organomet. Chem. 2019, 33, e4720. [Google Scholar]
  13. Yang, J.; Cheng, X.; Yu, Y.; Zhang, Y. Quantitative determinations in the molecular structures of polyaluminocarbosilane. Polymer 2011, 52, 3811–3818. [Google Scholar] [CrossRef]
  14. Duan, Y.; Mo, G.; Huangfu, Z.; Liang, Y.; Cui, Z.; He, L.; Huang, Z.; Chai, Z.; Huang, Q. Effects of aluminium content on the molecular structure and properties of polyaluminocarbosilane for SiC fibre fabrication. Ceram. Int. 2019, 45, 16380–16386. [Google Scholar] [CrossRef]
  15. An, L.; Wang, Y.; Bharadwaj, L.; Zhang, L.; Fan, Y.; Jiang, D.; Sohn, Y.; Desai, V.; Kapat, J.; Chow, L. Silicoaluminum carbonitride with anomalously high resistance to oxidation and hot corrosion. Adv. Eng. Mater. 2004, 6, 337–340. [Google Scholar] [CrossRef]
  16. Wang, Y.; An, L.; Fan, Y.; Zhang, L.; Burton, S.; Gan, Z. Oxidation of polymer-derived SiAlCN ceramics. J. Am. Ceram. Soc. 2005, 88, 3075–3080. [Google Scholar] [CrossRef]
  17. Babonneau, F.; Sorarú, G.; Thorne, K.; Mackenzie, J. Chemical characterization of Si-Al-C-O precursor and its pyrolysis. J. Am. Ceram. Soc. 1991, 74, 1725–1728. [Google Scholar] [CrossRef]
  18. Li, X.; Edirisinghe, M. Evolution of the ceramic structure during thermal degradation of a Si-Al-C-O precursor. Chem. Mater. 2004, 16, 1111–1119. [Google Scholar] [CrossRef]
  19. Zheng, C.; Li, X.; Wang, H.; Zhao, D.; Hu, T. Evolution of crystallization and its effects on properties during pyrolysis of Si-Al-C-(O) precursor fibers. J. Mater. Sci. 2008, 43, 3314–3319. [Google Scholar] [CrossRef]
  20. Chen, L.; Zhang, L.; Cai, Z.; Yu, Y.; Gu, H.; Zhang, L. Effects of oxidation curing and sintering additives on the formation of polymer-derived near-stoichiometric silicon carbide fibers. J. Am. Ceram. Soc. 2008, 91, 428–436. [Google Scholar] [CrossRef]
  21. Mah, T.; Hecht, N.; Mccullum, J.; Hoenigman, K.H.; Katz, A.; Lipsitt, H. Thermal stability of SiC fibres (Nicalon). J. Mater. Sci. 1984, 19, 1191–1201. [Google Scholar] [CrossRef]
  22. Ichikawa, H. Polymer-derived ceramic fibers, Annu. Rev. Mater. Res. 2016, 46, 6.1–6.22. [Google Scholar] [CrossRef]
  23. Yu, Y.; Tang, X.; Li, X. Characterization and microstructural evolution of SiC(OAl) fibers to SiC(Al) fibers derived from aluminum-containing polycarbosilane, Compos. Sci. Technol. 2008, 68, 1697–1703. [Google Scholar]
  24. Yao, R.; Feng, Z.; Chen, L.; Zhang, Y. Effects of oxidation curing and Al atoms on the formation of near-stoichiometric freestanding SiC(Al) films derived from polyaluminocarbosilane (PACS). J. Eur. Ceram. Soc. 2013, 33, 1675–1683. [Google Scholar] [CrossRef]
  25. Hesegawa, Y.; Okamura, K. Synthesis of continuous silicon carbide fibre, Part 3 Pyrolysis process of polycarbosilane and structure of the products. J. Mater. Sci. 1983, 18, 3633–3648. [Google Scholar] [CrossRef]
  26. Babonneau, F.; Sorarù, G.D.; Mackenzie, J.D. 29Si MAS-NMR investigation of the conversion process of a polytitanocarbosilane into SiC-TiC ceramics. J. Mater. Sci. 1990, 25, 3664–3670. [Google Scholar] [CrossRef]
  27. Sorarù, G.D.; Babonneau, F.; Mackenzie, J.D. Structural evolutions from polycarbosilane to SiC ceramic. J. Mater. Sci. 1990, 25, 3886–3893. [Google Scholar] [CrossRef]
  28. Ly, H.; Taylor, R.; Day, R.; Heatley, F. Conversion of polycarbosilane (PCS) to SiC-based ceramic Part II. Pyrolysis and characterization. J. Mater. Sci. 2001, 36, 4045–4057. [Google Scholar]
  29. Porte, L.; Sartre, A. Evidence for a silicon oxycarbide phase in the Nicalon silicon carbide fibre. J. Mater. Sci. 1989, 24, 271–275. [Google Scholar] [CrossRef]
  30. Laffon, C.; Flank, A.; Lagarde, P.; Laridjani, M.; Olry, P.; Cotteret, J.; Dixmier, J.; Miquel, J.; Hommel, H.; Legrand, A. Study of Nicalon-based ceramic fibres and powders by EXAFS spectrometry, X-ray diffractometry and some additional methods. J. Mater. Sci. 1989, 24, 1503–1512. [Google Scholar] [CrossRef]
  31. Wen, Q.; Yu, Z.; Riedel, R. The fate and role of in situ formed carbon in polymer-derived ceramics. Prog. Mater. Sci. 2020, 109, 100623. [Google Scholar] [CrossRef]
  32. Chen, D.; Mo, G.; Qian, J.; He, L.; Huang, Q.; Huang, Z. Synthesis of cyano-polycarbosilane and investigation of its pyrolysis process. J. Eur. Ceram. Soc. 2020, 40, 5226–5237. [Google Scholar] [CrossRef]
  33. Ferrari, A.C.; Robertson, J. Interpretation of Raman spectra of disordered and amorphous carbon. Phys. Rev. B 2000, 61, 14095–14107. [Google Scholar] [CrossRef] [Green Version]
  34. Tuinstra, F.; Koenig, J. Raman spectrum of graphite. J. Chem. Phys. 1970, 53, 11261130. [Google Scholar] [CrossRef] [Green Version]
  35. Maruyama, B.; Ohuchi, F. H2O catalysis of aluminum carbide formation in the aluminum-silicon carbide system. J. Mater. Res. 1991, 6, 1131–1134. [Google Scholar] [CrossRef]
  36. Lihrmann, J.M.; Tirlocq, J.; Descamps, P.; Cambier, F. Thermodynamics of the Al-O-C system and properties of SiC-AlN-Al2OC composites. J. Eur. Ceram. Soc. 1999, 19, 2781–2787. [Google Scholar] [CrossRef]
  37. Yang, L.; Zhu, H.; Deng, C.; Cui, P. Synthesis of Al2OC compound by carbothermal reduction process with boron oxide additive. China’s Refract 2014, 23, 41–44. [Google Scholar]
  38. Inoue, K.; Yamaguchi, A. Synthesis of Al4SiC4. J. Am. Ceram. Soc. 2003, 6, 1028–1030. [Google Scholar] [CrossRef]
Figure 1. TG and DTG curves as a function of temperature for PACS.
Materials 16 04172 g001
Figure 2. FTIR spectra for pyrolysis residues of PACS at various temperatures.
Materials 16 04172 g002
Figure 3. 29Si MAS NMR spectra for pyrolysis residues of PACS at various temperatures.
Materials 16 04172 g003
Figure 4. XPS spectra of Si 2p for pyrolysis residues of PACS at various temperatures.
Materials 16 04172 g004
Figure 5. 13C MAS NMR spectra for pyrolysis residues of PACS at various temperatures.
Materials 16 04172 g005
Figure 6. Raman spectra for pyrolysis residues of PACS at various temperatures.
Materials 16 04172 g006
Figure 7. XPS spectra of C 1 s for pyrolysis residues of PACS at various temperatures.
Materials 16 04172 g007
Figure 8. 27Al MAS NMR spectra for pyrolysis residues of PACS at various temperatures.
Materials 16 04172 g008
Figure 9. XRD patterns for the pyrolysis residues of PACS at various temperatures.
Materials 16 04172 g009
Figure 10. HRTEM images for the pyrolysis residues of PACS at (a) 1300 °C, (b) 1450 °C, (c) 1600 °C, and (d) 1800 °C.
Materials 16 04172 g010
Table 1. Molecular weights and polydispersity, softening point, and Al content of PACS.
SampleMwMnMw/MnSoftening Point (°C)Al Content (wt%)
PACS-3315010792.92220.71.24
Table 2. Raman characteristics for the pyrolysis residues of PACS at various temperatures.
SampleG Band Position (cm−1)ID/IGLa (nm)
PACS-110016061.251.5
PACS-130016051.571.7
PACS-145016021.721.77
PACS-160015931.812.74
PACS-180015830.756.61
Table 3. Chemical compositions for PACS and the pyrolysis residues at typical temperatures.
Si (wt%)C (wt%)O (wt%)Al (wt%)nC/nSi
PACS47.6938.34.851.241.87
PACS-130055.75348.242.011.42
PACS-180064.4133.91.120.571.23
Disclaimer/Publisher’s Note: The statements, opinions and data contained in all publications are solely those of the individual author(s) and contributor(s) and not of MDPI and/or the editor(s). MDPI and/or the editor(s) disclaim responsibility for any injury to people or property resulting from any ideas, methods, instructions or products referred to in the content.