Article

Modulation of Structure and Optical Property of Nitrogen-Incorporated VO2 (M1) Thin Films by Polyvinyl Pyrrolidone

1
School of Architectural Engineering, Huanggang Normal University, Huanggang 438000, China
2
MOE Key Laboratory for Non-Equilibrium Synthesis and Modulation of Condensed Matter, School of Physics, Xi’an Jiaotong University, Xi’an 710049, China
3
State Key Laboratory of Silicate Materials for Architectures, Wuhan University of Technology, Wuhan 430070, China
4
KAUST Catalysis Center, King Abdullah University of Science and Technology, Thuwal 23955, Saudi Arabia
5
Huanggang Ecological Architecture and Renewable Resources Research Center, Huanggang 438000, China
*
Authors to whom correspondence should be addressed.
Materials 2023, 16(1), 208; https://doi.org/10.3390/ma16010208
Submission received: 9 November 2022 / Revised: 10 December 2022 / Accepted: 21 December 2022 / Published: 26 December 2022

Abstract

:
VO2, as a promising material for smart windows, has attracted much attention, and researchers have been continuously striving to optimize the performance of VO2-based materials. Herein, nitrogen-incorporated VO2 (M1) thin films, using a polyvinylpyrrolidone (PVP)-assisted sol–gel method followed by heat treatment in NH3 atmosphere, were synthesized, which exhibited a good solar modulation efficiency (ΔTsol) of 4.99% and modulation efficiency of 37.6% at 2000 nm (ΔT2000 nm), while their visible integrated transmittance (Tlum) ranged from 52.19% to 56.79% after the phase transition. The crystallization, microstructure, and thickness of the film could be regulated by varying PVP concentrations. XPS results showed that, in addition to the NH3 atmosphere-N doped into VO2 lattice, the pyrrolidone-N introduced N-containing groups with N–N, N–O, or N–H bonds into the vicinity of the surface or void of the film in the form of molecular adsorption or atom (N, O, and H) filling. According to the Tauc plot, the estimated bandgap of N-incorporated VO2 thin films related to metal-to-insulator transition (Eg1) was 0.16–0.26 eV, while that associated with the visible transparency (Eg2) was 1.31–1.45 eV. The calculated Eg1 and Eg2 from the first-principles theory were 0.1–0.5 eV and 1.4–1.6 eV, respectively. The Tauc plot estimation and theoretical calculations suggested that the combined effect of N-doping and N-adsorption with the extra atom (H, N, and O) decreased the critical temperature (τc) due to the reduction in Eg1.

1. Introduction

Monoclinic phase vanadium dioxide [VO2 (M1)] has attracted great attention for smart coating applications because of its promising thermochromic properties [1,2,3,4]. VO2 (M1) material undergoes a reversible metal-to-insulator transition (MIT) at a critical temperature (τc) of around 65 °C. It exhibits an insulating monoclinic (M1) phase at room temperature and exhibits metal characteristics as a rutile (R) phase while above the critical temperature. However, the high phase transition temperature (τc), low luminous transmittance (Tlum), not remarkable enough thermochromic modulation efficiency for solar energy (ΔTsol) or near-infrared modulation efficiency (ΔTNIR), and the less desirable color of the intrinsic VO2 (M1) thin films constrain the practical application of VO2 materials. The thermochromic performance of VO2 is closely related to the phase composition and the microstructure, which are largely dependent on the synthesis method and growth control. Furthermore, changing the microstructure and the thickness of the VO2 (M1) thin film can significantly regulate its physical properties.
Polymer-assisted deposition (PAD) [5,6,7] is a chemical solution route to high-quality thin films of metal oxides. This technique employs coordination between metal ions and polymers to guarantee the homogeneous distribution of metal ions and, thus, the formation of uniform VO2 thin films. It provides a cost-effective and scalable alternative method for the sol–gel method. Polyvinylpyrrolidone (PVP) is a synthetic water-soluble polymer compound that is soluble in both water and most organic solvents. PVP is widely used due to its colloidal protection, film-forming and bonding effects, and performance advantages of very low toxicity and good physiological compatibility. Kang et al. [6] revealed that PVP not only acted as a film-forming promoter but also facilitated the formation of M1/R-phase VO2. PVP could promote the formation of crosslinked high-quality gel films after solvent evaporation via the interactions among the charged amide groups and metal ions. At the same time, PVP could also prevent the segregation of inorganic solute in the precursor solution through the interaction between the polymer and the metal ions. Furthermore, VO2 film prepared using the PAD method through spin-coating is not as compact as that fabricated using physical vapor deposition methods [8,9,10]. This is beneficial to the improvement of visible-light transmission.
Element doping can also effectively adjust the performances of VO2 at the electronic structure level, as the τc, the Tlum, or the film color can be modulated by changing the MIT-related band gap (Eg1) or visible-transparency-related band gap (Eg2). The metal elements used for doping in the VO2 films include W [11,12,13], Ta [14], Nb [15], Cr [16], Tb [17], Mo [18], and Mg [19,20]. A dopant with high valence leads to an n-type conductivity, which reduces τc. Doping with Mg improves visible-light transmission and increases Eg2, which lightens the yellow appearance of VO2 films. Doping with nonmetal elements such as H [21,22], B [23], F [24], Ar [25], and N [8,26,27] can also modulate the τc of VO2 (M1). For example, N-doped VO2 thin films prepared by low-energy N2+ ion sputtering and annealing in an ultrahigh-vacuum chamber exhibited a reduction in electrical τc by 18 °C [26]. Another N-doped VO2 (M1) thin film deposited on fused silica substrate at 500 °C by reactive pulsed laser deposition (RPLD) using a VN target reactive with O2 flow demonstrated a decrease in optical τc by 16 °C extracted from infrared reflectance at λ = 12 μm [8]. Moreover, N-doped VO2 (M1) films can be obtained via the chemical solution route using a heat treatment in a vacuum environment with trace NH3 concentration, showing an optical τc by 17 °C estimated from the thermal hysteresis loop of transmittance measured at λ = 2 μm [27]. Despite the different methods of preparation and phase transition temperature testing of N-doped VO2, all cases revealed that N doping can lower the τc by 16–18 °C.
As mentioned above, N doping can effectively modulate the optical and electrical properties of the VO2 thin films. In our previous work, it was reported and confirmed that annealing in an NH3 atmosphere is a facile way to fabricate N-doped VO2 (M1) thin films [27,28]. Nitrogen element can be doped into the VO2 lattice but exists in two different forms: substitutional N-doping and interstitial N-doping. However, as the VOCl2-PVP sol precursor contains pyrrolidone-N from PVP, this N source may also introduce nitrogen elements into the VO2 thin film. Following annealing in the NH3 atmosphere, the final forms of N cooperating with other elements might also affect the properties of VO2 thin films, which has not been discussed so far.
In this work, we fabricate VO2 (M1) thin films via spin coating and enclosed NH3 atmosphere heat treatment using VOCl2-PVP as the precursor. The effects of PVP content in the precursor on the composition, structure, and properties of VO2 thin films were studied. The microstructures and optical properties including Tlum, ΔTsol, ΔTNIR, modulation ability at 2000 nm (ΔT2000 nm), and Eg of VO2 films were adjusted by varying the concentration of PVP in the precursor. Meanwhile, the possible influences of various forms of N elements including N-doping and N-adsorption introduced in the system on the properties of VO2 thin films were analyzed and discussed. According to the XPS analysis results, the N introduced by PVP from the precursor mainly presented in the adsorbed state in the VO2 film. Moreover, first-principles calculations were performed to inspect the band structures of VO2 affected by different bonding models between N and additional elements (H, N, O, and C).

2. Materials and Methods

2.1. Sample Preparation

The VO2 thin films were synthesized using the polymer-assisted chemical solution method. Vanadium (V) pentoxide (V2O5, 99.9%,) and hydrazine dihydrochloride (N2H4·2HCl, 99.9%,) were the raw materials for the preparation of vanadium-containing solutions. PVP (K88-96, Aladdin reagent Co., Ltd., Shanghai, China) was employed as the film-forming promoter. A yellow or orange aqueous suspension (~50 mL) containing 1.820 g of V2O5 was kept at 60 °C with continuously stirring. Then, the suspension color turned dark to yellowish brown, as 0.525 g of N2H4·2HCl was added. The suspension color continued to change from dark green to blue through the slow addition of a concentrated HCl solution (38%, 4 mL). Finally, a clear blue solution of VOCl2 was formed after heating and stirring for an appropriate period. The concentration of VOCl2 solution was then adjusted to 0.1 mol/L, and different contents of PVP (0 wt.%, 3 wt.%, 6 wt.%, and 9 wt.%) were added. Accordingly, the film samples prepared from the VOCl2-PVP precursors with different PVP contents were labeled as P1 (or 0%), P2 (or 3%), P3 (or 6%), and P4 (or 9%).
All the precursor films were spin-coated on quartz glass (25 mm × 25 mm) at 500 rpm for 9 s, followed by 3000 rpm for 30 s. Subsequently, the wet sol films were dried at 70 °C for 10 min. The coating and drying procedure was repeated once. The annealing procedure was implemented in a closed vacuum tube furnace. The amount of NH4HCO3 deposited in the furnace was 0.1 g. Meanwhile, 1 g of CaO powder was also placed to establish a dry NH3 atmosphere during heat treatment. The vacuum pump was turned off when the base pressure reached 1800 ± 100 Pa. All film samples were annealed in the furnace at 500 °C with a heating rate of 10 °C/min and then kept at this temperature for 30 min. More details about the preparation of vanadium-containing sol and dry gel film can be found in [27,28].

2.2. Characterization

The crystal phase of the thin films was ensured using glance incident X-ray diffraction (GIXRD, Empyrean, Panalytical Inc., Almelo, The Netherlands) at room temperature with a grazing angle of 0.5°. Raman spectra were measured through a Raman microscope spectrometer (Invia, Renishaw, Wotton-under-Edge, UK) using a laser emission wavelength of 632.8 nm with an output power of 5 mW. According to the reproducibility correction of the 520 cm−1 peak position of monocrystalline silicon, the error was less than 0.03 cm−1. The micro-morphologies of the film samples were observed by field-emission scanning electron microscopy (FESEM, ULTPAPLUS-43-13, Zeiss, Jena, Germany). The FESEM sample preparation method was applied to cut the VO2 film-coated quartz glass into small pieces of about 2 × 2 × 1 mm, to glue the back side of the glass (film side up) to the sample table with conductive tape, and to spray carbon before electron microscope observation. The X-ray photoemission spectroscopy (XPS) measurements were recorded using a THERMO PHI Quantum 2000 system. Since V on the surface of the film is easily oxidized to a high valence state, the chemical binding energy of elements inside the sample was studied by sputtering etching with an Ar+ ion beam at a depth of about 1 nm/min. The peak positions of elements in the test results were corrected through the 284.6 eV peak of C1s or 530.0 eV peak of O1s using XPSPEAK4.1. Optical performance tests were carried out on a UV/Vis/NIR spectrometer (UV-3600, Shimadzu, Kyoto, Japan) in the wavelength range of 300–2500 nm. Transmittance spectra before and after phase transition were recorded at room temperature (around 20 °C) and heated temperature (set at 90 °C), respectively. The details of the optical performance test and dimming performance evaluation methods of thin films can be found in [27,28].

2.3. Ab Initio Calculations

On the basis of the experimental results of XPS, density functional theory (DFT) in the Vienna Ab initio Simulation Package (VASP) [29] was used to ab initio calculate the electronic band structures of various N-containing VO2 systems. All structures were completely relaxed and highly accurate. The GGA + U method [30] was employed, where the effective Coulomb repulsion potential Ueff = UJ was set to 3.4 eV [31,32]. The cutoff energy was set as 600 eV, and a 5 × 5 × 5 Monkhorst–Pack grid of k points was selected for all structures. The total energy convergence criterion for electron self-consistent rings was 1 × 10⁻⁵ eV. The geometry of the system was completely relaxed to a maximum force of less than 0.01 eV/Å.

3. Results and Discussion

3.1. Phase Determination of VO2 (M1) Thin Films

The phase composition of vanadium oxide films prepared by mixing different mass fractions of PVP in the precursor was determined from the glance incident XRD patterns and Raman spectra (Figure 1). As shown in Figure 1a, the broad peaks at 2θ of 15–25° were attributed to the amorphous quartz glass substrates. There were very weak diffraction peaks corresponding to the VO2 (M1) phase in sample P1 (0%) and sample P2 (3%) with low PVP content. As the content of PVP was increased to 6–9 wt.%, the peaks corresponding to the VO2 (M1) phase appeared, although very small amounts of impure phases of V2O5 and vanadium oxide Magnéli phases (VnO2n−1) emerged. The main peaks were indexed to the JCPDS Card No. 82-0661. It is well known that the chemical valence of V is variable due to the coexistence of many nonstoichiometric VO2 phases [33]. Nevertheless, this issue can be resolved by annealing in an appropriate concentration of NH3 and air [27,28]. However, the increase in PVP content seems to inhibit the preferred growth orientation of VO2 crystal on the (011) crystal plane, while diffraction peaks of other crystal planes go higher. The Raman scattering spectra (Figure 1b) of these four samples tested at room temperature were consistent with the XRD results. The tested Raman modes at 142 (B1g), 191 (Ag), 222 (Ag), 304 (Ag), 389 (Ag), 496 (Ag), and 612 (A1g) cm−1 were well marched with the pure VO2 (M1) phase [16,27,28,34]. With the increase in PVP content, it can be detected that the crystallization of the corresponding VO2 (M1) phase in the film improved. According to the results above, we can see that PVP is a good film-forming agent, which can form a network structure by complexing metal group VO2+ through crosslinking polymerization. The increasing content of PVP was helpful to improve the viscosity of the precursor sol. Under the same spinning speed, the VO2 film became thicker with the increase in the viscosity of precursor sol, resulting in the growth of VO2 crystals in certain lattice planes.

3.2. Microstructures of VO2 (M1) Thin Films

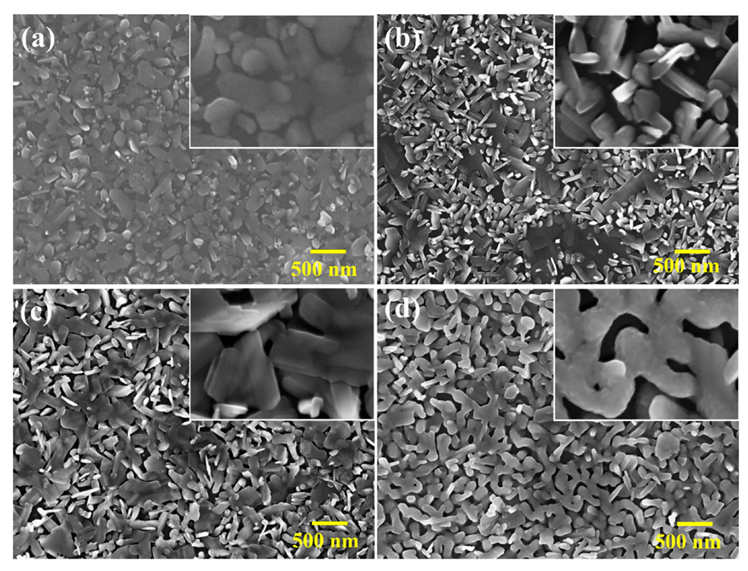
The microstructure and thickness of VO2 films were observed from the top view and cross-sectional view by scanning electron microscopy (SEM), as shown in Figure 2 and Figure 3, respectively. Figure 2 displays that this group of film samples consisted of crystal sheets or tetragonal prism crystal particles with a large number of pores. Unlike the spherical or tetragonal morphology of the particles in [27,28], the crystals in Figure 2 exhibited short bar or prismatic shapes. All characteristic XRD peaks in Figure 1a were not very strong, indicating that the films were not well crystallized. Accordingly, we can see a disordered arrangement of crystal particles on the surface of the film. This result reveals that the change in the film sample morphology was closely related to the concentration of vanadium ion complexed with polymers in the precursor. The porosity of the films increased when the concentration of vanadium decreased. Due to the addition of PVP, the crystal particles in the films were packed from loose texture to tight arrangement. Crystal boundaries became obvious, consistent with the rise in peak intensity of some feature peaks of VO2 and V2O5 in Figure 1a. Furthermore, the crystal particle shape and size were more uniform, and the crystal angular morphology became smoother. Thus, a certain content of PVP could regulate the crystal particle morphology and the pore structure of VO2 films due to the space hindrance.
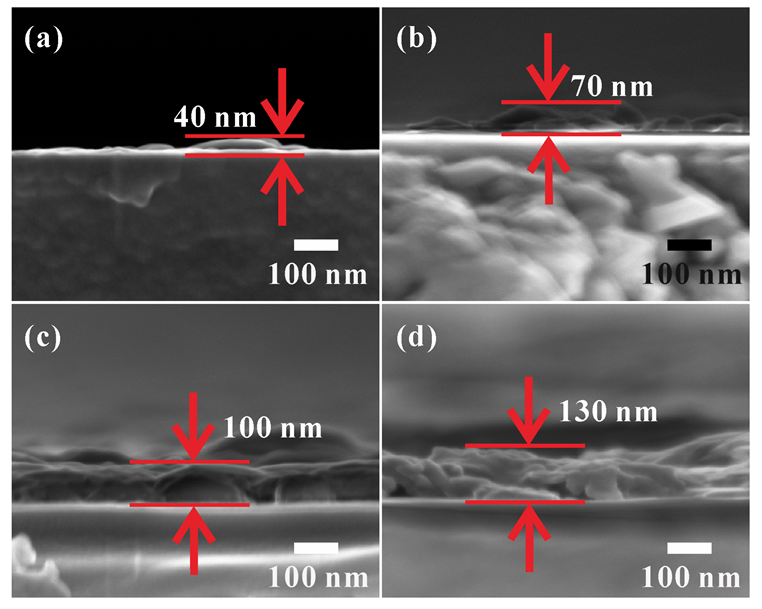
With the increase in PVP content, the crystal particles in the film sample became denser and more closely packed. The pores in the film reduced in number, and the crystal particle size distribution became more uniform. Otherwise, due to the increase in PVP content, the viscosity of the prepared sol increased. As a result, the thickness of the prepared film, as well as the adhesion strength of the film on the substrate, increased. As the film thicknesses could also be controlled by varying the spin-coating parameters, the spinning speed and coating times were fixed. The cross-section morphology of sample P1 prepared without PVP can be observed in Figure 3a, where only a small quantity of particles were attached to the glass substrate. The film formation of this sample was poor, and its adhesion to the substrate was weak in the absence of PVP. Most of the VO2 film was detached from the substrate during sample preparation. As can be seen from the cross-section, the film thickness of the sample increased from a few tens of nanometers (P2) to around 100 nm (P3), and the thickness of P4 increased to approximately 120–200 nm (Figure 3d). However, the edge and surface of the P4 film were rough, which could be ascribed to the increased viscosity of the precursor solution. On the one hand, the homogeneous deposition of sol on the substrate was hindered by the high viscosity; on the other hand, the crystalline process was hindered by the viscous resistance. Therefore, PVP from a high-viscosity precursor reduced the flatness of the VO2 film.

3.3. Chemical Analysis of VO2 (M1) Thin Films

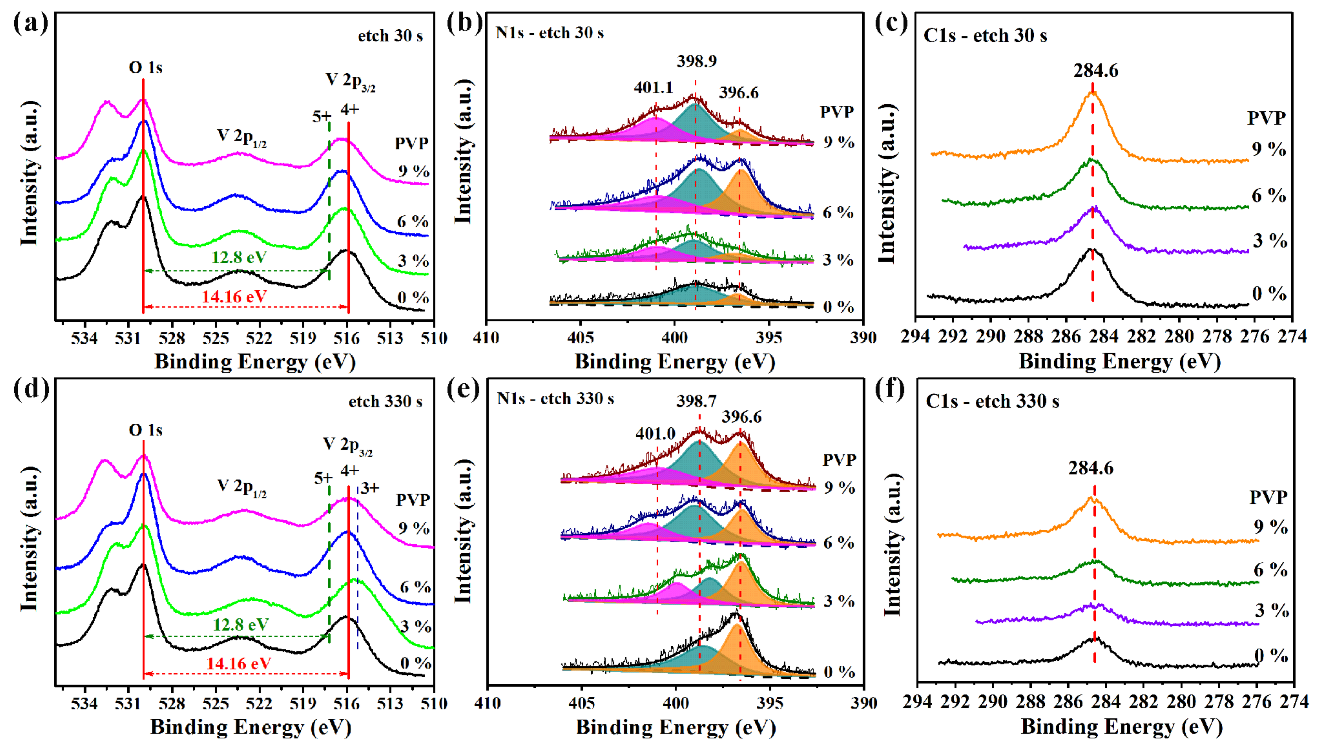
The chemical composition of the vanadium oxide films was determined by XPS testing. To eliminate the effect of surface oxidation and contamination, a survey scan and high-resolution XPS measurements were performed after Ar+ ion etching. The XPS full-spectrum scan of the VO2 film sample showed that the film consisted of O, V, C, and N elements. Cl element appeared in the precursor gel volatilized by pyrolysis during the subsequent heat treatment. The chemical valence states of O 1s, V 2p, N 1s, and C 1s elements inside the film surfaces are shown in Figure 4. The corresponding etching depth was approximately 0.5 nm (Figure 4a–c) and 5.5 nm (Figure 4d–f) after Ar+ ion sputtering for 30 s and 330 s, respectively.
The V 2p–O 1s curves (Figure 4a,d) were calibrated according to the O 1s core level at binding energies (BE) of 530.0 eV. The ΔBE values (the difference between O 1s and V 2p3/2 core levels) for V5+, V4+, and V3+ were 12.8 eV, 14.16 eV, and 14.71 eV, respectively. Accordingly, the oxidation states of vanadium corresponding to V 2p core level energies were V5+ (517.2 eV), V4+ (515.84 eV), and V3+ (515.29 eV) [35,36,37]. The V valence states inside the VO2 thin-film samples were V4+, while the V valence states near the film surface increased in valence to between V4+ and V5+. This indicates that the VO2 film exposed to air was gradually oxidized to V2O5 from the surface to the center. The bulges produced on the higher BE shoulder of O 1s around 532 eV were due to the collective effects of satellite peaks of V4+ 2p1/2, V5+ 2p3/2, and V3+ 2p1/2, as well as the influence of O–Si, O–H, O–C, or O–N bonds [37,38,39]. Si element was derived from the quartz substrate, while H, C, and N elements could have resulted from the pyrolysis of PVP and the NH3 atmosphere.
The C 1s curves (Figure 4c,f) and N 1s curves (Figure 4b,e) were calibrated according to the C 1s core level at 284.6 eV. The C 1s peaks of all samples located around 284.6 eV were mainly ascribed to the sp2 binding of the C–C bond, C–H bond, and C–O bond [40,41,42,43]. The C 1s peak intensity of the film sample weakened with the etching of the Ar+ ion. Therefore, these detected C 1s peaks may have been derived from the elemental carbon from the XPS instrument or the absorbed carbonate species from the environment. It is worth noting that the C atom was not doped into the VO2 crystal lattice, since no characteristic peak of the V–C bond (around 282 eV) was detected.
The XPS spectra of N 1s peaks probed at depths of about 0.5 nm and 5.5 nm of VO2 thin-film samples are presented in Figure 4b,e, respectively. All broad N 1s peaks could be resolved into two or three peaks with locations around 401 eV (molecularly adsorbed N2 or NOx) [44], 398.7–398.9 eV (N–H bond [27,45,46], N–O bond [47], or N–C bond) and 396.6 eV (V–N bond [27]). Thus, in addition to the N atoms doped into VO2 crystal lattice in the form of substitution, there were interstitial N atoms that could trap other nonmetallic atoms such as H, O, N, and C into voids of VO2 bulk phase through bonding. Compared with samples fabricated from PVP-containing precursors, the VO2 film sample (P1) prepared without PVP showed that the N source from the NH3 atmosphere mainly existed in the form of interstitial filling and substitutional doping. When PVP was added, adsorbed N species (N2 or NOx molecules) were also detected in all film samples (P2, P3, and P4). Thus, the N introduced by PVP mainly appeared in the form of adsorption in VO2 film, while the N derived from the NH3 atmosphere promoted the substituted N-doping mode and formed V–N bonds as previously verified [27].
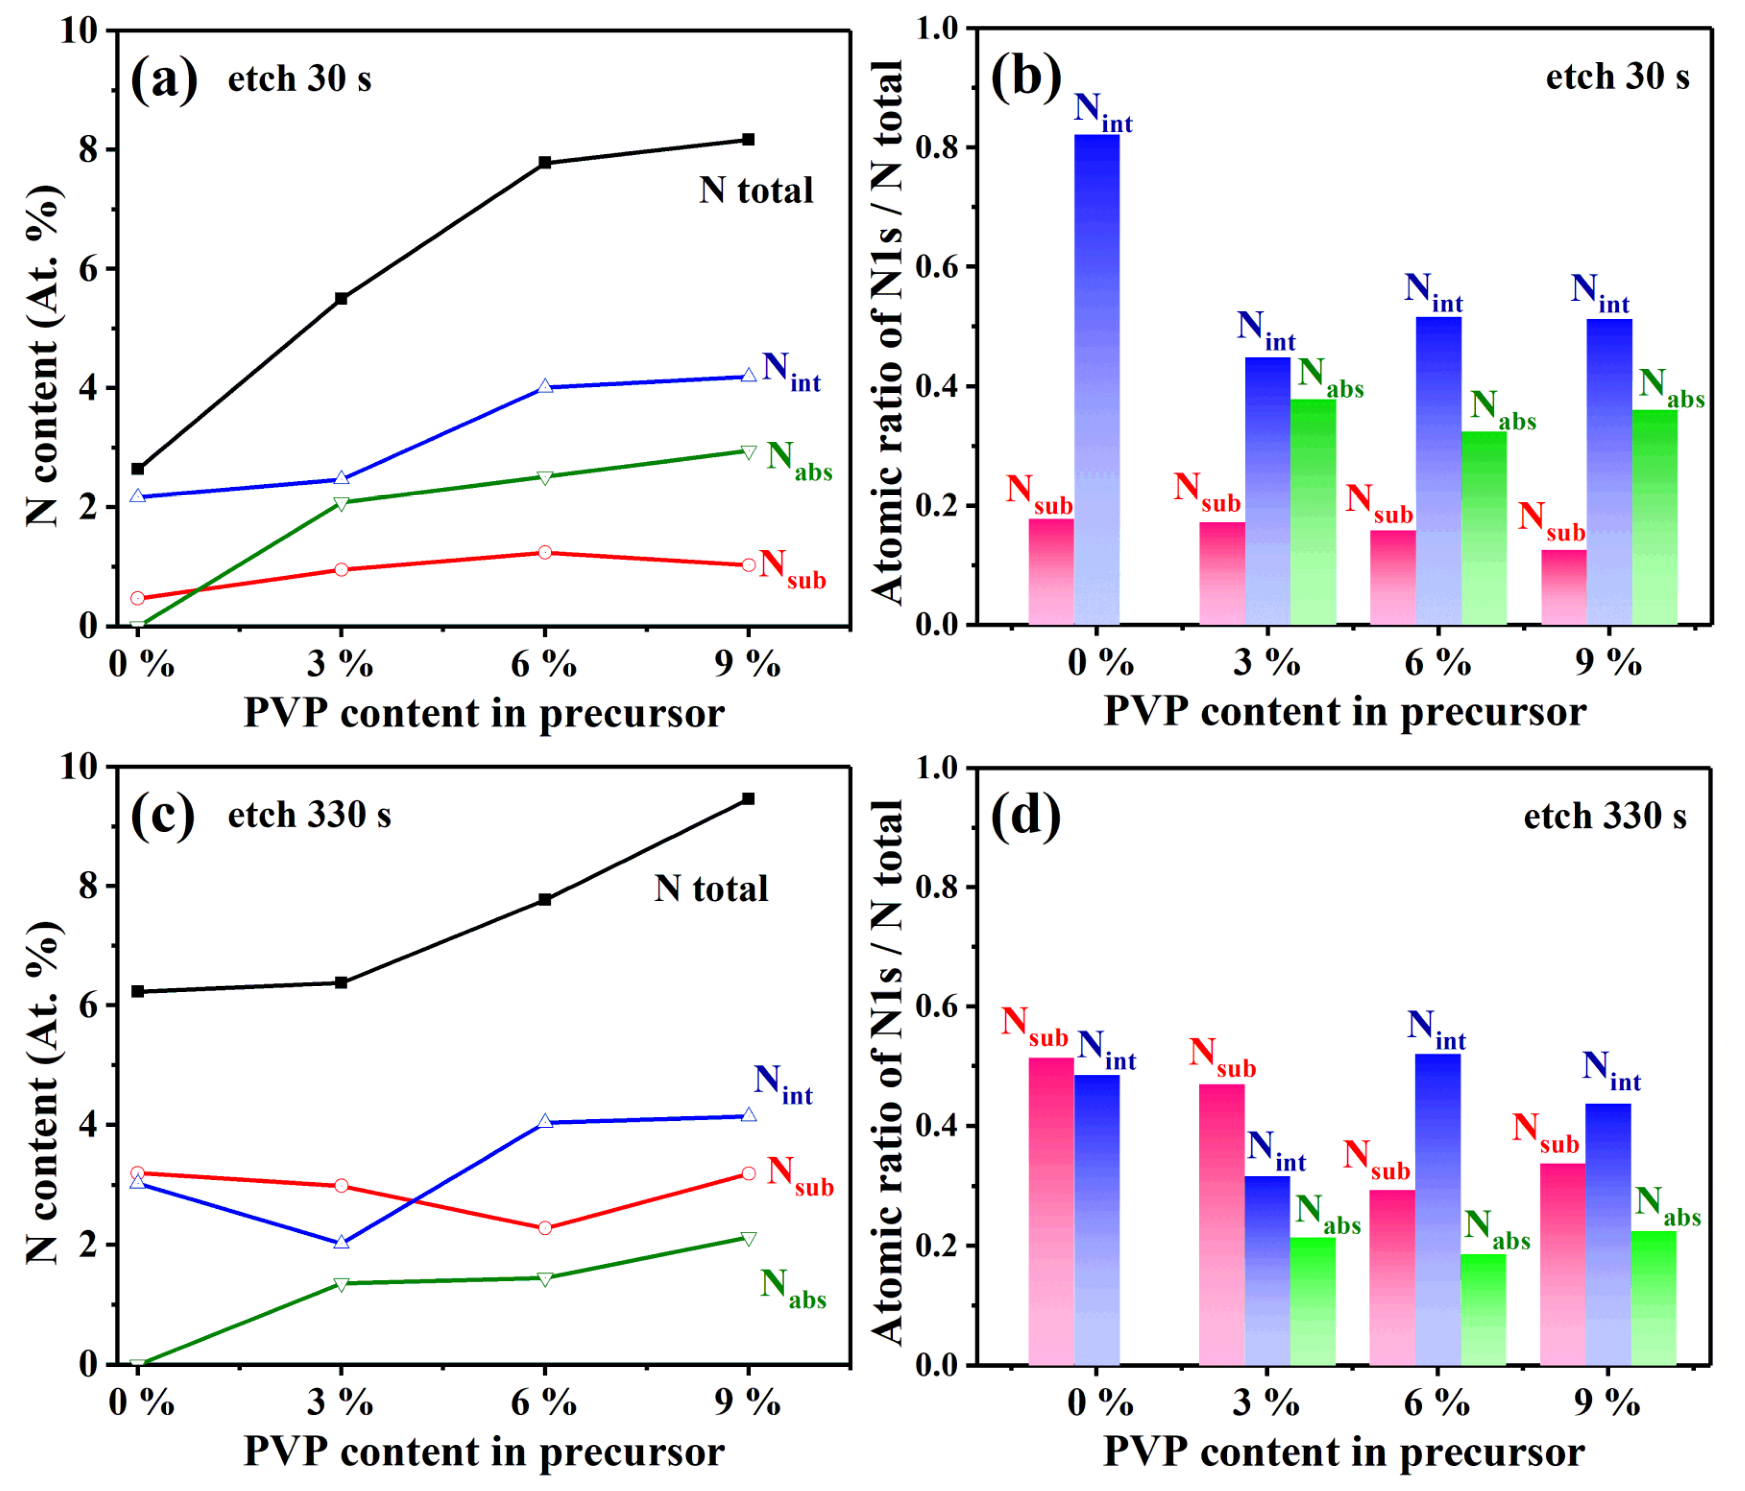
The estimates of the concentration of N species in VO2 thin film could be extracted from the XPS data [48]. According to the different N 1s BE locations, N 1s peaks were divided into adsorbed N (Nads) around 401 eV, substituted N (Nsub) close to 396.6 eV, and interstitial N (Nint) around 399 eV. The concentrations of different N species inside VO2 thin-film samples are listed in Table 1. For further intuition, the correlations between the detected amount of nitrogen content in VO2 thin films and the PVP concentration in vanadium precursor are illustrated in Figure 5.
The contents of the N element and its different species in VO2 thin films are exhibited in Figure 5a,c. Both graphs show that the total N content and adsorbed N species (Nads) content gradually increased with the increase in PVP content in the vanadium precursor. As the etching time was prolonged, the probe depth increased, and the detected total N content was enhanced. In particular, because the V–N bond could be produced by Ar+ ion sputtering [49], the Nsub content (V–N bond) increased with the probe depth, while the variation of Nint content was not significant. Meanwhile, the content of Nads in samples containing 3% to 9% PVP slightly decreased with the etching time. Furthermore, it is noticeable that the Nads proportion with the same depth in VO2 thin film increased as the PVP content increased. Interestingly, this is the opposite of the influence rule of NH3 concentration on Nads content in samples during heat treatment presented in a previous study [27].
The relative proportion of each N species in total N is illustrated in Figure 5b,d. It can be seen from the graphs that the increase in PVP from 3% to 9% content in the precursor did not affect the relative proportion of the three N species (Nads, Nsub, and Nint) in thin-film samples. In the vicinity of the sample surfaces, all the Nsub proportions of prepared VO2 thin films are in the range of 10% to 20% whether the PVP was added or not. In comparison, the Nint proportion varied from 40% to 50%, and the Nads proportion varied from 30% to 40% when the PVP was appended to the precursor. However, no Nads species were detected in the sample without the addition of PVP in the precursor. Underneath the film surface, it was found that Nads species, whose proportion was maintained around 20%, only existed in the samples with the addition of PVP in the precursor.
In summary, it was deduced from the VO2 film fabrication process that an N source could be introduced from pyrrolidone-N of PVP into a vanadium precursor. The N source originating from the NH3 atmosphere during heat treatment played different roles and led to different products. The NH3 atmosphere during heat treatment mainly played a role in promoting the substitution doping of nitrogen for oxygen in VO2. This is consistent with the conclusion verified in previous work [27]. The pyrrolidone-N may have introduced N-containing groups with N–H or N–C bonds into the vicinity of the surface or void of the film in the form of molecular adsorption or atom (N, O, H, and C) filling.

3.4. Optical Properties of N-Incorporated VO2 (M1) Thin Films

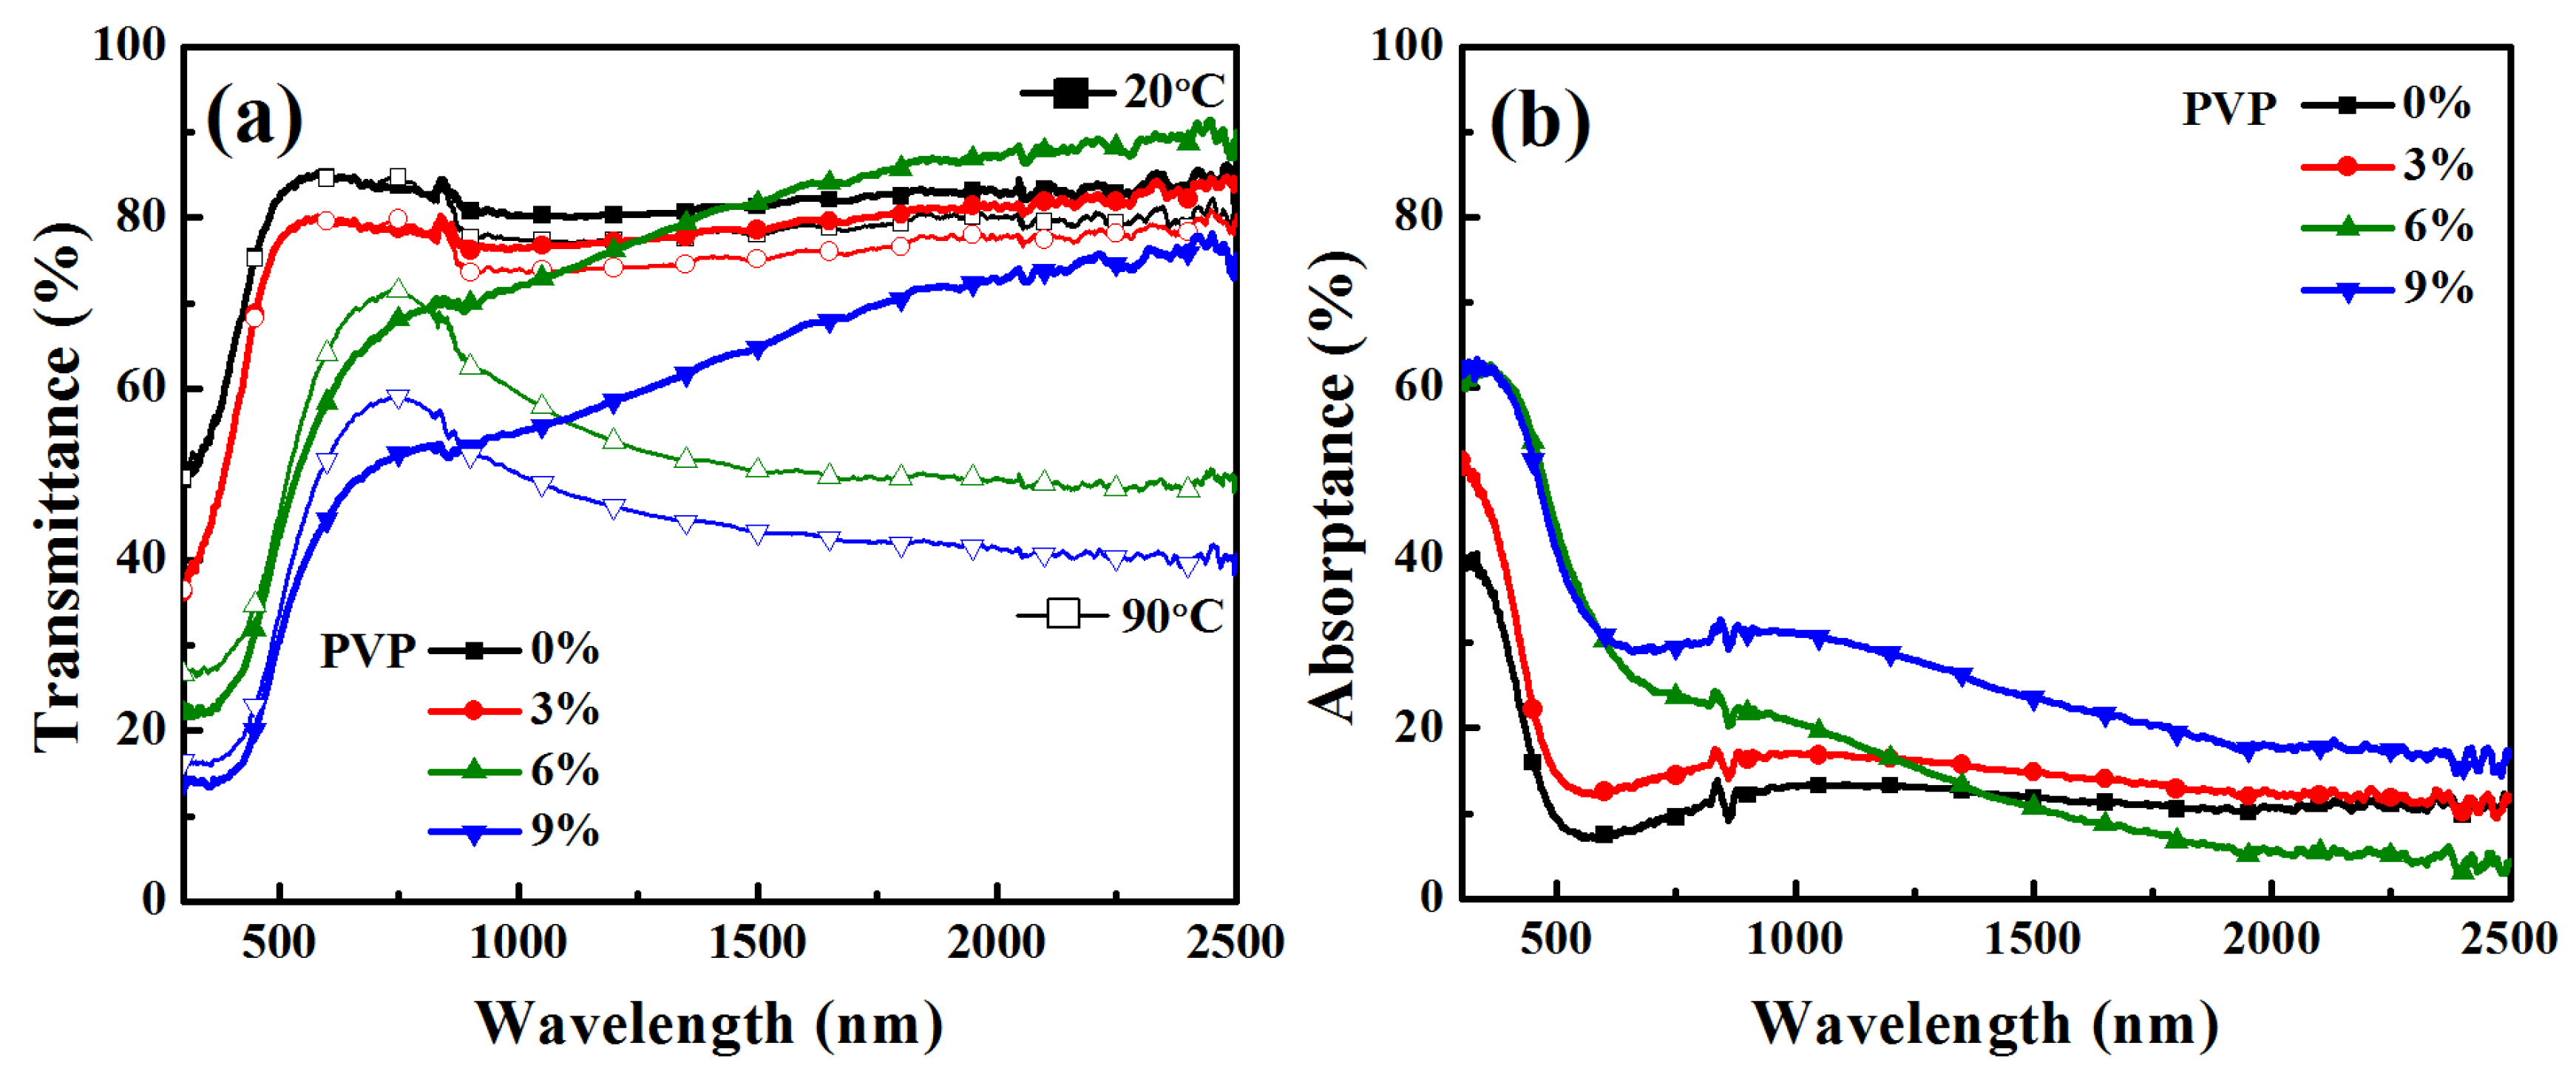
Figure 6 shows the optical transmission and absorption profiles of VO2 thin films prepared with different PVP contents in vanadium precursors. Table 2 illustrates the luminous transmittance (Tlum), regulation efficiency of solar transmittance (ΔTsol), and modulation efficiency at 2000 nm (ΔT2000 nm) between ambient temperature (20 °C) and heated state (90 °C). It can be observed that the Tlum of the film decreased successively, while the values of ΔTsol, ΔTNIR, and ΔT2000 nm first increased with PVP concentration from 0 to 6 wt.%, and then decreased when the PVP concentration increased to 9 wt.%. The optical properties of different samples were affected by the phase composition and the thickness of the films, which varied with the content of PVP. Numerous well-crystallized VO2 (M1) crystal particles in films yielded a good thermochromic modulation effect, corresponding to high ΔTsol and ΔTNIR. However, the thick film was harmful to the transmittance of visible light, corresponding to lower Tlum. Meanwhile, the increase in film thickness also led to the enhancement of light absorption by the film samples, as shown in Figure 6b. The optical absorption edges (λ*) [50] of VO2 thin films differed, resulting in the different colors of the films observed.

3.5. Band Structure of N-Incorporated VO2 (M1)

The bandgap energy (Eg) of N-incorporated vanadium oxide thin films at room temperature can be estimated from the Tauc formula [8,51,52]:
( α h ν ) n = A ( h ν E g ) ,
where is the photon energy, A is a constant coefficient, and n was chosen to be 1/2 (most authors assume that M1 phase VO2 follows an indirect allowed transition). The optical absorption coefficients α can be obtained according to the following equation:
α = 1 / d   l n [ ( 1 R ) / T ] ,
where d is the film thickness, T is the transmission, and R is the reflection. The transmission spectra and reflection spectra corresponding to 300–2500 nm could be measured directly, and the film thickness was averaged according to the observed sample cross-section. According to the Tauc plot results of samples P1 to P4 in Figure 7a, two kinds of different energy bandgaps were sketched.
According to octahedral crystal field theory, a bandgap exists between the antibongding π orbitals (π*) band at a higher level and the dǁ band at a lower level in the vicinity of the Fermi energy level (EF) in the insulating phase VO2. This bandgap is called Eg1. Another bandgap that corresponds to the bandgap between bonding π orbitals and π* is Eg2. A schematic of the energy band structure of Eg1 and Eg2 is distinguished in Figure 7b [53,54,55]. Eg1 is related to the MIT phase transition, whereas Eg2 correlates with the visible-light transmittance and color.
For samples P1 and P2, only the energy gap Eg2 appeared with the same value of approximately 1.90 eV. Both Eg1 and Eg2 were found in sample P3 and sample P4, of which Eg2 increased from 1.31 to 1.45 eV. However, Eg1 decreased from 0.26 eV to 0.16 eV with the increase in PVP content from 6 wt.% to 9 wt.%. Combining the changing trend of energy gaps in different PVP contents with the XPS results and optical performance, it could be conjectured that the adsorption of N species (Nads) on the surface and pores of the VO2 film and N species bonded with H, N, O, or C (Nint) may have altered the values of Eg1 and Eg2, thereby regulating the phase transition of VO2 and the film color. However, the hypothesis of N adsorption and filling of elements such as H, N, O, or C inferred from XPS analysis on the surface and in the voids of the VO2 thin film needs further experimental verification.
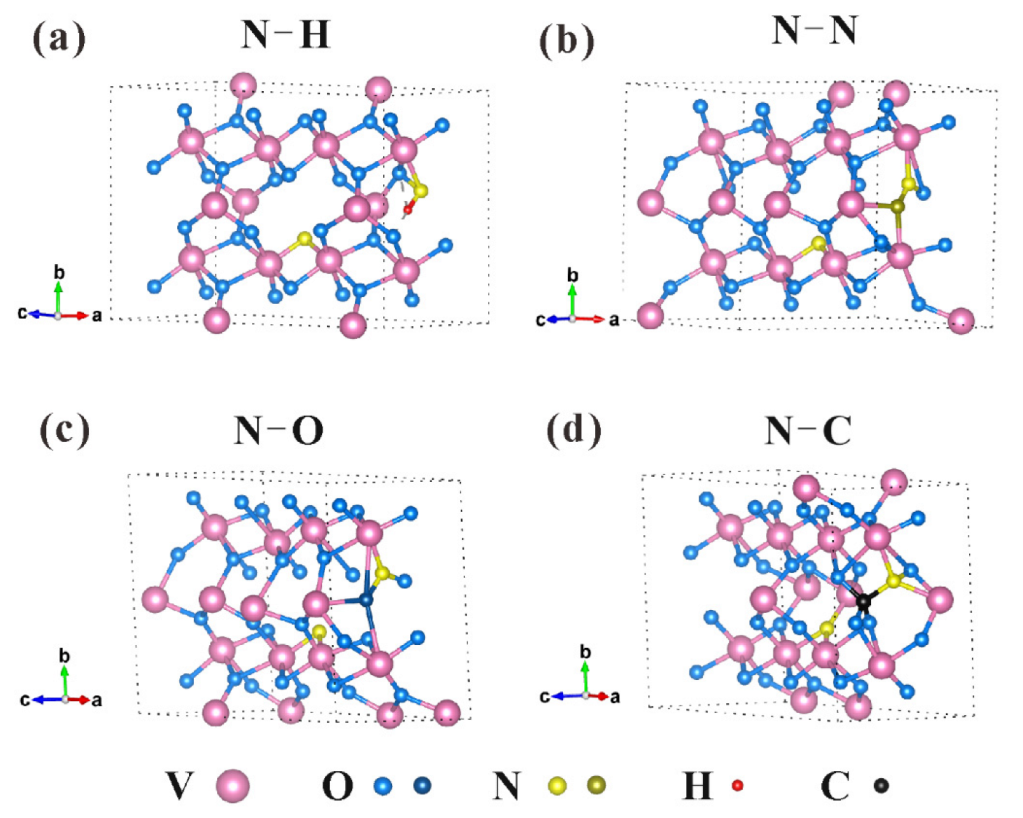
To reveal the possible fine-tuning effects of N species on optical properties (both τc and color) of N-incorporated VO2 (M1) thin films, DFT calculations were performed using VASP. According to the XPS results of sample P4, the doping ratio of substitutional N atoms, interstitial N atoms, and adsorbent N relative to O atoms were all about 3%. Therefore, the chosen doping amount of each N species in the N-incorporated VO2 (M1) model established was about 3.13% (2.75 wt.%), in which one N atom was substituted for one of 32 O atoms. These calculations took substitutional N-doping, interstitial N-doping, and N-adsorption into account (Figure 8) to be in line with the experimental investigation. On the basis of previous calculation work [27] on pure VO2 (M1) and N-doped VO2 (M1), models of VO2 (M1) doped with 3.13% substitutional N atom, doped with 3.13% interstitial N atom, and bonded with H, N, O, or C atom were used. Nint–N, Nint–H, and Nint–O could also be regarded as the adsorption of N2, NHx, and NOx, respectively.
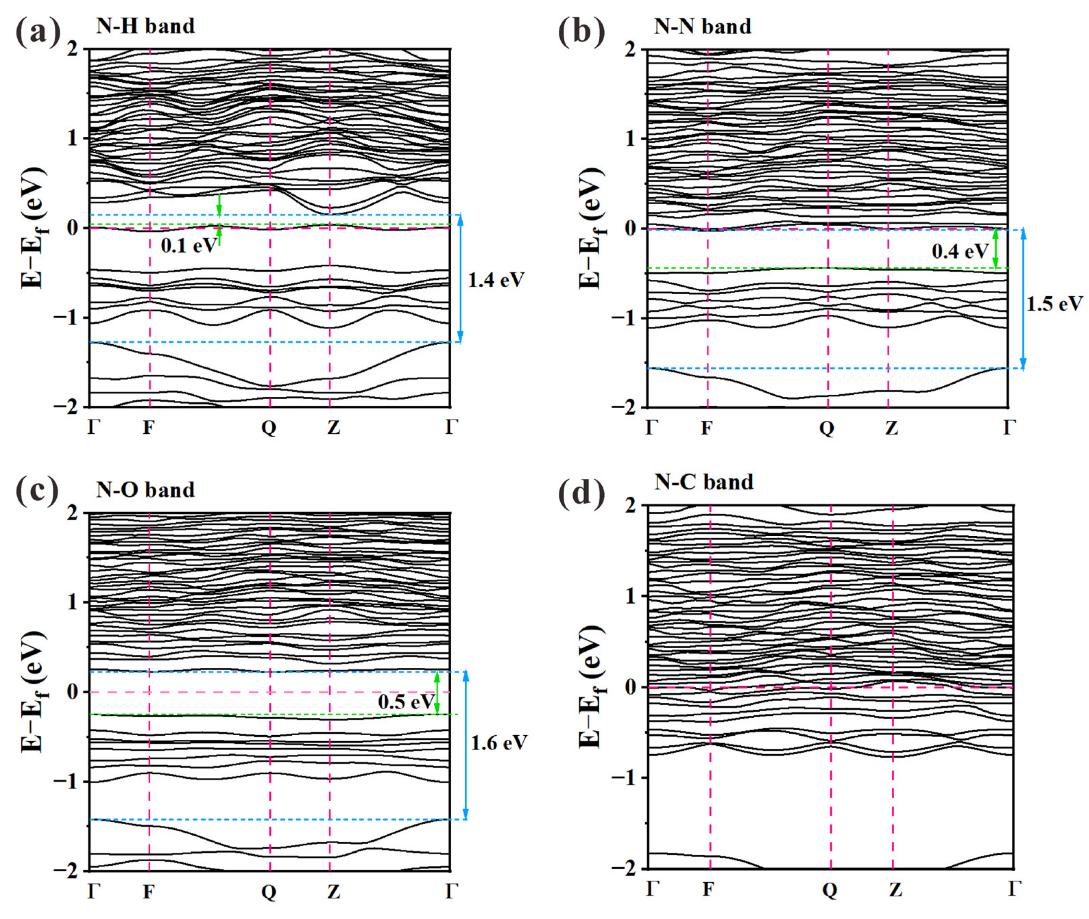
The simulated band structures for the N-doped VO2 (M1) absorbing H, N, O, and C atoms are illustrated in Figure 9. The various energy levels of N-containing VO2 (M1) calculated from Figure 9 are summarized in Table 3. Concerning previous work [27] for pure VO2 (M1), Eg1 was taken as 0.62 eV, and Eg2 was taken as 1.44 eV. Considering the combined effect of Nsub and Nint with additional atoms (C, H, O, or N), a comparison of calculation results and estimated experimental results is also provided in Table 3. The calculated Eg1 values of N-incorporated VO2 (M1) ranged from 0.1 eV to 0.5 eV, and the values of Eg2 ranged from 1.4 eV to 1.6 eV. The theoretical calculation results of Eg1 were generally smaller than those of pure VO2 (M1), indicating that the introduction of N, including doping and adsorption, decreased the phase transition temperature (τc) of VO2. Furthermore, the existence of Nint–H could sharply decrease the Eg1, in good agreement with the absence of Eg1 in P1 and P2 samples. Similarly, the appearance of Eg1 in P3 and P4 could be attributed to the existence of N–N (N2 molecule adsorption) and N–O bonds. Unlike the N–H, N–N, and N–O cases in N-incorporated VO2 (M1), the band structure of the case containing the N–C bond showed metal properties. The slight increase in Eg2 could have theoretically caused a decrease in the near-infrared absorption of VO2, thereby enhancing the Tlum of VO2 film and diluting the film color. However, in contrast to the theoretical calculation results, the experimental values of Eg2 varied from 1.31 eV to 1.90 eV, which could have been mainly affected by the crystal phase composition and film thickness.

4. Conclusions

N-incorporated VO2 (M1) thin films were synthesized through a PVP-assisted sol–gel route followed by heat treatment in vacuum containing a small amount of NH3 gas. The microporous structure, crystallization, film thickness, and optical properties of VO2 (M1) film could be effectively regulated by varying the PVP concentration in the vanadium precursor solution. XPS analysis demonstrated that the N element introduced by the pyrrolidone-N in PVP mainly existed in the form of N2 or NOx molecular adsorption in VO2 film or combined atom (N, O, and H) filling in the vicinity of the surface or void of the film. The subsequent annealing in NH3 was attributed to the generation of substitutional N–V bonds in the VO2 crystals. As the PVP concentration increased, Tlum of the VO2 thin film decreased due to the increase in film thickness, while ΔTsol and ΔTNIR first increased and then decreased. The best results of thermochromic film in this work showed a Tlum of 52.19–56.79%, a ΔTsol of 4.99%, a ΔTNIR of 7.39%, and a ΔT2000 nm of 37.6%. Both the Tauc plot estimation and the theoretical calculation suggested that the combined effect of substitutional N atom, interstitial N–X species (X = H, N, or O), and adsorbed N-containing molecules decreased the τc due to the reduction in Eg1. According to the calculated value of Eg2, the introduction of elements such as N, H, or O had little effect on the bandgap between π and π* in the insulating VO2 (M1) phase. Actually, the film thickness and the micro-morphology had significant impacts on the visible-light transmittance and color of the films. This work presents an approach to adjust the optical properties of VO2 (M1) film, which is expected to be applied to smart windows or other VO2-based devices.

Author Contributions

Conceptualization, M.W. and S.T.; methodology, M.W. and B.L.; software, M.X. and X.C.; formal analysis, M.W., M.X., X.C. and B.L.; data curation, M.X.; writing—original draft preparation, M.W.; writing—review and editing, S.T., X.L. and X.Z.; funding acquisition, M.W., X.Z. and S.T. All authors have read and agreed to the published version of the manuscript.

Funding

This research was funded by the Natural Science Foundation of Hubei Province (grant number 2019CFB400), the Research Project of the Hubei Provincial Department of Education (grant number Q20192902), the Fundamental Research Funds for the Central Universities (grant number xzy012022024), the Research Project of the Huanggang Eco-Building and Renewable Resources Research Center (grant number 202204304), and the Doctoral Foundation of Huanggang Normal University (grant number 2019033).

Institutional Review Board Statement

Not applicable.

Informed Consent Statement

Not applicable.

Data Availability Statement

Not applicable.

Acknowledgments

The authors thank the Analytical and Testing Center of WUT for the help with carrying out GIXRD, Raman, and FESEM analyses, as well as the State Key Laboratory of Silicate Materials for Architectures for the help with performing the UV/Vis/NIR test.

Conflicts of Interest

The authors declare no conflict of interest.

Abbreviations

Nomenclature for the symbols and abbreviations
VO2 (M1):M1 phase VO2
PVP: polyvinyl pyrrolidone
Tlum: visible integrated transmittance
Tsol: solar integrated transmittance
ΔTsol: solar modulation efficiency
ΔTNIR: near-infrared modulation efficiency
ΔT2000 nm: modulation efficiency at 2000 nm
τc: critical temperature of phase transition
EF: Fermi energy level
Eg: bandgap energy
Eg1: bandgap energy related to metal-to-insulator transition
Eg2: bandgap energy related to the visible transparency
GIXRD: glance incident X-ray diffraction
XPS: X-ray photoemission spectroscopy
FESEM: field-emission scanning electron microscopy
UV/Vis/NIR: ultraviolet/visible/near-infrared light
DFT: density functional theory
VASP: Vienna Ab initio Simulation Package
Nads: adsorbed N
Nsub: substituted N
Nint: interstitial N

References

  1. Morin, F.J. Oxides Which Show a Metal-to-Insulator Transition at the Neel Temperature. Phys. Rev. Lett. 1959, 3, 34–36. [Google Scholar] [CrossRef]
  2. Ke, Y.; Chen, J.; Lin, G.; Wang, S.; Zhou, Y.; Yin, J.; Lee, P.S.; Long, Y. Smart Windows: Electro-, Thermo-, Mechano-, Photochromics, and Beyond. Adv. Energy Mater. 2019, 9, 1902066. [Google Scholar] [CrossRef]
  3. Cao, X.; Chang, T.; Shao, Z.; Xu, F.; Luo, H.; Jin, P. Challenges and Opportunities toward Real Application of VO2-Based Smart Glazing. Matter 2020, 2, 862–881. [Google Scholar] [CrossRef]
  4. Zhang, Y.; Xiong, W.; Chen, W.; Zheng, Y. Recent Progress on Vanadium Dioxide Nanostructures and Devices: Fabrication, Properties, Applications and Perspectives. Nanomaterials 2021, 11, 338. [Google Scholar] [CrossRef] [PubMed]
  5. Burrell, A.K.; Mark McCleskey, T.; Jia, Q.X. Polymer assisted deposition. Chem. Commun. 2008, 11, 1271–1277. [Google Scholar] [CrossRef]
  6. Kang, L.; Gao, Y.; Luo, H. A novel solution process for the synthesis of VO2 thin films with excellent thermochromic properties. ACS Appl. Mater. Interfaces 2009, 1, 2211–2218. [Google Scholar] [CrossRef]
  7. Kang, L.T.; Gao, Y.F.; Luo, H.J. VO2 Films by Polymer-Assisted Deposition: Investigation of Thermal Decomposition of Precursor Gel and Control of Phase Transition Temperatures. Mater. Sci. Forum 2011, 687, 791–797. [Google Scholar] [CrossRef]
  8. Chouteau, S.; Mansouri, S.; Mohamedou, M.L.O.N.; Chaillou, J.; Suleiman, A.O.; Drogoff, B.L.; Chaker, M. Investigation of the metal-to-insulator transition of N-doped VO2(M1) thin films. Appl. Surf. Sci. 2021, 554, 149661. [Google Scholar] [CrossRef]
  9. Yuan, L.; Hu, Z.; Hou, C.; Meng, X. In-Situ thermochromic mechanism of Spin-Coated VO2 film. Appl. Surf. Sci. 2021, 564, 150441. [Google Scholar] [CrossRef]
  10. Zong, H.; Wu, J.; Zhou, D.; Yin, Y.; Yan, L.; Li, M.; Qiao, W.; Hu, Q.; Yang, Y. Realization of high luminous transmittance and solar modulation ability of VO2 films by multistep deposition and in-situ annealing method. Surf. Interfaces 2022, 30, 101882. [Google Scholar] [CrossRef]
  11. Li, B.; Tian, S.; Tao, H.; Zhao, X. Tungsten doped M-phase VO2 mesoporous nanocrystals with enhanced comprehensive thermochromic properties for smart windows. Ceram. Int. 2019, 45, 4342–4350. [Google Scholar] [CrossRef]
  12. Chae, J.-Y.; Lee, D.; Lee, D.W.; Woo, H.-Y.; Kim, J.B.; Paik, T. Direct transfer of thermochromic tungsten-doped vanadium dioxide thin-films onto flexible polymeric substrates. Appl. Surf. Sci. 2021, 545, 148937. [Google Scholar] [CrossRef]
  13. Zhang, L.; Xia, F.; Yao, J.; Zhu, T.; Xia, H.; Yang, G.; Liu, B.; Gao, Y. Facile synthesis, formation mechanism and thermochromic properties of W-doped VO2(M) nanoparticles for smart window applications. J. Mater. Chem. C 2020, 8, 13396–13404. [Google Scholar] [CrossRef]
  14. Li, B.; Tian, S.; Wang, Z.; Liu, B.; Gong, X.; Zhao, X. Thermochromic Ta Doped VO2 Films: Enhanced Luminous Transmittance, Significantly Depressed Phase Transition Temperature and Hysteresis Width. Appl. Surf. Sci. 2021, 568, 150959. [Google Scholar] [CrossRef]
  15. Li, H.; Wang, J.; You, Z.; Yu, Y.; Li, P.; Xiong, L.; He, Y. Nb-doped VO2 thin films with enhanced thermal sensing performance for uncooled infrared detection. Mater. Res. Bull. 2022, 146, 111615. [Google Scholar] [CrossRef]
  16. Suleiman, A.O.; Mansouri, S.; Margot, J.; Chaker, M. Tuning VO2 phase stability by a combined effect of Cr doping and oxygen pressure. Appl. Surf. Sci. 2022, 571, 151267. [Google Scholar] [CrossRef]
  17. Wang, N.; Duchamp, M.; Dunin-Borkowski, R.E.; Liu, S.; Zeng, X.; Cao, X.; Long, Y. Terbium-Doped VO2 Thin Films: Reduced Phase Transition Temperature and Largely Enhanced Luminous Transmittance. Langmuir 2016, 32, 759–764. [Google Scholar] [CrossRef] [PubMed]
  18. Lv, X.; Chai, X.; Lv, L.; Cao, Y.; Zhang, Y.; Song, L. Preparation of porous Mo-doped VO2 films via atomic layer deposition and post annealing. Jpn. J. Appl. Phys. 2021, 60, 085501. [Google Scholar] [CrossRef]
  19. Li, D.; Zhao, Z.; Wang, C.; Deng, S.; Yang, J.; Wang, X.; Li, J.; Zhao, Y.; Jin, H. Influence of the charge compensation effect on the metal–insulator transition of Mg-W co-doped VO2. Appl. Surf. Sci. 2022, 579, 151990. [Google Scholar] [CrossRef]
  20. Li, S.-Y.; Niklasson, G.A.; Granqvist, C.G. Thermochromic undoped and Mg-doped VO2 thin films and nanoparticles: Optical properties and performance limits for energy efficient windows. J. Appl. Phys. 2014, 115, 053513. [Google Scholar] [CrossRef]
  21. Chen, S.; Wang, Z.; Ren, H.; Chen, Y.; Yan, W.; Wang, C.; Li, B.; Jiang, J.; Zou, C. Gate-controlled VO2 phase transition for high-performance smart windows. Sci. Adv. 2019, 5, eaav6815. [Google Scholar] [CrossRef] [PubMed] [Green Version]
  22. Fan, L.; Zhu, Y.; Zhao, S.; Wang, Z.; Liu, Z.; Zhu, L.; Wang, B.; Zhang, Q. Modulation of VO2 metal-insulator transition by co-doping of hydrogen and oxygen vacancy. Sol. Energy Mater. Sol. Cells 2020, 212, 110562. [Google Scholar] [CrossRef]
  23. Zhou, Q.; Lv, W.; Qiu, Q.; Zhou, T.; Huang, C.; Li, L. Boron doped M-phase VO2 nanoparticles with low metal-insulator phase transition temperature for smart windows. Ceram. Int. 2020, 46, 4786–4794. [Google Scholar] [CrossRef]
  24. Dai, L.; Chen, S.; Liu, J.; Gao, Y.; Zhou, J.; Chen, Z.; Cao, C.; Luo, H.; Kanehira, M. F-doped VO2 nanoparticles for thermochromic energy-saving foils with modified color and enhanced solar-heat shielding ability. Phys. Chem. Chem. Phys. 2013, 15, 11723–11729. [Google Scholar] [CrossRef] [PubMed]
  25. Liubchenko, O.; Kladko, V.; Melnik, V.; Romanyuk, B.; Gudymenko, O.; Sabov, T.; Dubikovskyi, O.; Maksimenko, Z.; Kosulya, O.; Kulbachynskyi, O. Ar-implanted vanadium dioxide thin film with the reduced phase transition temperature. Mater. Lett. 2022, 314, 131895. [Google Scholar] [CrossRef]
  26. Zhang, W.; Wang, K.; Fan, L.; Liu, L.; Guo, P.; Zou, C.; Wang, J.; Qian, H.; Ibrahim, K.; Yan, W.; et al. Hole Carriers Doping Effect on the Metal–Insulator Transition of N-Incorporated Vanadium Dioxide Thin Films. J. Phys. Chem. C 2014, 118, 12837–12844. [Google Scholar] [CrossRef]
  27. Wan, M.; Xiong, M.; Li, N.; Liu, B.; Wang, S.; Ching, W.-Y.; Zhao, X. Observation of reduced phase transition temperature in N-doped thermochromic film of monoclinic VO2. Appl. Surf. Sci. 2017, 410, 363–372. [Google Scholar] [CrossRef]
  28. Wan, M.; Liu, B.; Wang, S.; Hu, L.; He, Y.; Tao, H.; Zhao, X. Optical properties and formation mechanism of M1-phase VO2 thin films annealed in a closed NH3 atmosphere. J. Alloys Compd. 2017, 706, 289–296. [Google Scholar] [CrossRef]
  29. Kresse, G.; Furthmuller, J. Efficient iterative schemes for ab initio total-energy calculations using a plane-wave basis set. Phys. Rev. B 1996, 54, 11169–11186. [Google Scholar] [CrossRef]
  30. Biermann, S.; Poteryaev, A.; Lichtenstein, A.I.; Georges, A. Dynamical singlets and correlation-assisted Peierls transition in VO2. Phys. Rev. Lett. 2005, 94, 026404. [Google Scholar] [CrossRef]
  31. Suh, J.Y.; Lopez, R.; Feldman, L.C.; Haglund, R.F. Semiconductor to metal phase transition in the nucleation and growth of VO2 nanoparticles and thin films. J. Appl. Phys. 2004, 96, 1209–1213. [Google Scholar] [CrossRef]
  32. Wei, J.; Ji, H.; Guo, W.; Nevidomskyy, A.H.; Natelson, D. Hydrogen stabilization of metallic vanadium dioxide in single-crystal nanobeams. Nat. Nanotechnol. 2012, 7, 357–362. [Google Scholar] [CrossRef]
  33. Liang, W.; Gao, M.; Lu, C.; Zhang, Z.; Chan, C.H.; Zhuge, L.; Dai, J.; Yang, H.; Chen, C.; Park, B.H.; et al. Enhanced Metal-Insulator Transition Performance in Scalable Vanadium Dioxide Thin Films Prepared Using a Moisture-Assisted Chemical Solution Approach. ACS Appl. Mater. Interfaces 2018, 10, 8341–8348. [Google Scholar] [CrossRef] [PubMed]
  34. Ashok, P.; Chauhan, Y.S.; Verma, A. Effect of vanadium thickness and deposition temperature on VO2 synthesis using atmospheric pressure thermal oxidation. Thin Solid 2021, 724, 138630. [Google Scholar] [CrossRef]
  35. Mendialdua, J.; Casanova, R.; Barbaux, Y. XPS studies of V2O5, V6O13, VO2 and V2O3. J. Electron Spectrosc. Relat. Phenom. 1995, 71, 249–261. [Google Scholar] [CrossRef]
  36. Silversmit, G.; Depla, D.; Poelman, H.; Marin, G.B.; De Gryse, R. Determination of the V2p XPS binding energies for different vanadium oxidation states (V5+ to V0+). J. Electron Spectrosc. Relat. Phenom. 2004, 135, 167–175. [Google Scholar] [CrossRef]
  37. Ureña-Begara, F.; Crunteanu, A.; Raskin, J.-P. Raman and XPS characterization of vanadium oxide thin films with temperature. Appl. Surf. Sci. 2017, 403, 717–727. [Google Scholar] [CrossRef]
  38. Lamb, R.N.; Baxter, J.; Grunze, M.; Kong, C.W.; Unertl, W.N. An XPS study of the composition of thin polyimide films formed by vapor deposition. Langmuir 1988, 4, 249–256. [Google Scholar] [CrossRef]
  39. Wang, Y.; Feng, C.; Zhang, M.; Yang, J.; Zhang, Z. Enhanced visible light photocatalytic activity of N-doped TiO2 in relation to single-electron-trapped oxygen vacancy and doped-nitrogen. Appl. Catal. B Environ. 2010, 100, 84–90. [Google Scholar] [CrossRef]
  40. Myhre, K.G.; Delashmitt, J.C.; Sims, N.J.; Van Cleve, S.M.; Boll, R.A. Samarium thin films molecular plated from N,N-dimethylformamide characterized by XPS. Surf. Sci. Spectra 2018, 25, 024003. [Google Scholar] [CrossRef]
  41. Desimoni, E.; Casella, G.I.; Morone, A.; Salvi, A.M. XPS determination of oxygen-containing functional groups on carbon-fibre surfaces and the cleaning of these surfaces. Surf. Interface Anal. 1990, 15, 627–634. [Google Scholar] [CrossRef]
  42. Tyan, Y.-C.; Liao, J.-D.; Klauser, R.; Wu, I.-D.; Weng, C.-C. Assessment and characterization of degradation effect for the varied degrees of ultra-violet radiation onto the collagen-bonded polypropylene non-woven fabric surfaces. Biomaterials 2002, 23, 65–76. [Google Scholar] [CrossRef] [PubMed]
  43. Zou, X.-X.; Li, G.-D.; Zhao, J.; Su, J.; Wei, X.; Wang, K.-X.; Wang, Y.-N.; Chen, J.-S. Light-Driven Preparation, Microstructure, and Visible-Light Photocatalytic Property of Porous Carbon-Doped TiO2. Int. J. Photoenergy 2012, 2012, 720183. [Google Scholar] [CrossRef] [Green Version]
  44. Asahi, R.; Morikawa, T.; Ohwaki, T.; Aoki, K.; Taga, Y. Visible-light photocatalysis in nitrogen-doped titanium oxides. Science 2001, 293, 269–271. [Google Scholar] [CrossRef]
  45. Long, R.Q.; Yang, R.T. Catalytic Performance and Characterization of VO2+-Exchanged Titania-Pillared Clays for Selective Catalytic Reduction of Nitric Oxide with Ammonia. J. Catal. 2000, 196, 73–85. [Google Scholar] [CrossRef]
  46. Diwald, O.; Thompson, T.L.; Zubkov, T.; Ed, G.G.; Walck, S.D.; Yates, J.T. Photochemical Activity of Nitrogen-Doped Rutile TiO2(110) in Visible Light. J. Phys. Chem. B 2004, 108, 6004–6008. [Google Scholar] [CrossRef]
  47. Lin, Z.; Orlov, A.; Lambert, R.M.; Payne, M.C. New insights into the origin of visible light photocatalytic activity of nitrogen-doped and oxygen-deficient anatase TiO2. J. Phys. Chem. B 2005, 109, 20948–20952. [Google Scholar] [CrossRef]
  48. Wagner, C.D.; Davis, L.E.; Zeller, M.V.; Taylor, J.A.; Raymond, R.H.; Gale, L.H. Empirical atomic sensitivity factors for quantitative analysis by electron spectroscopy for chemical analysis. Surf. Interface Anal. 1981, 3, 211–225. [Google Scholar] [CrossRef]
  49. Wang, J.; Tafen de, N.; Lewis, J.P.; Hong, Z.; Manivannan, A.; Zhi, M.; Li, M.; Wu, N. Origin of photocatalytic activity of nitrogen-doped TiO2 nanobelts. J. Am. Chem. Soc. 2009, 131, 12290–12297. [Google Scholar] [CrossRef]
  50. Burkhardt, W.; Christmann, T.; Franke, S.; Kriegseis, W.; Meister, D.; Meyer, B.K.; Niessner, W.; Schalch, D.; Scharmann, A. Tungsten and fluorine co-doping of VO2 films. Thin Solid Film. 2002, 402, 226–231. [Google Scholar] [CrossRef]
  51. Zhou, J.; Gao, Y.; Liu, X.; Chen, Z.; Dai, L.; Cao, C.; Luo, H.; Kanahira, M.; Sun, C.; Yan, L. Mg-doped VO2 nanoparticles: Hydrothermal synthesis, enhanced visible transmittance and decreased metal-insulator transition temperature. Phys. Chem. Chem. Phys. 2013, 15, 7505–7511. [Google Scholar] [CrossRef] [PubMed]
  52. Li, S.-Y.; Mlyuka, N.R.; Primetzhofer, D.; Hallén, A.; Possnert, G.; Niklasson, G.A.; Granqvist, C.G. Bandgap widening in thermochromic Mg-doped VO2 thin films: Quantitative data based on optical absorption. Appl. Phys. Lett. 2013, 103, 161907. [Google Scholar] [CrossRef] [Green Version]
  53. Haverkort, M.W.; Hu, Z.; Tanaka, A.; Reichelt, W.; Streltsov, S.V.; Korotin, M.A.; Anisimov, V.I.; Hsieh, H.H.; Lin, H.J.; Chen, C.T.; et al. Orbital-assisted metal-insulator transition in VO2. Phys. Rev. Lett. 2005, 95, 196404. [Google Scholar] [CrossRef] [PubMed] [Green Version]
  54. Ruzmetov, D.; Senanayake, S.D.; Narayanamurti, V.; Ramanathan, S. Correlation between metal-insulator transition characteristics and electronic structure changes in vanadium oxide thin films. Phys. Rev. B 2008, 77, 195442. [Google Scholar] [CrossRef]
  55. Geng, C.; Dou, S.; Zhao, J.; Ren, F.; Gu, J.; Wei, H.; Guan, H.; Liang, S.; Li, L.; Li, Y.; et al. Self-templated method to fabricate VO2 nanoparticles with ultrahigh luminous transmittance for energy-efficient thermochromic windows. Appl. Surf. Sci. 2022, 592, 153267. [Google Scholar] [CrossRef]
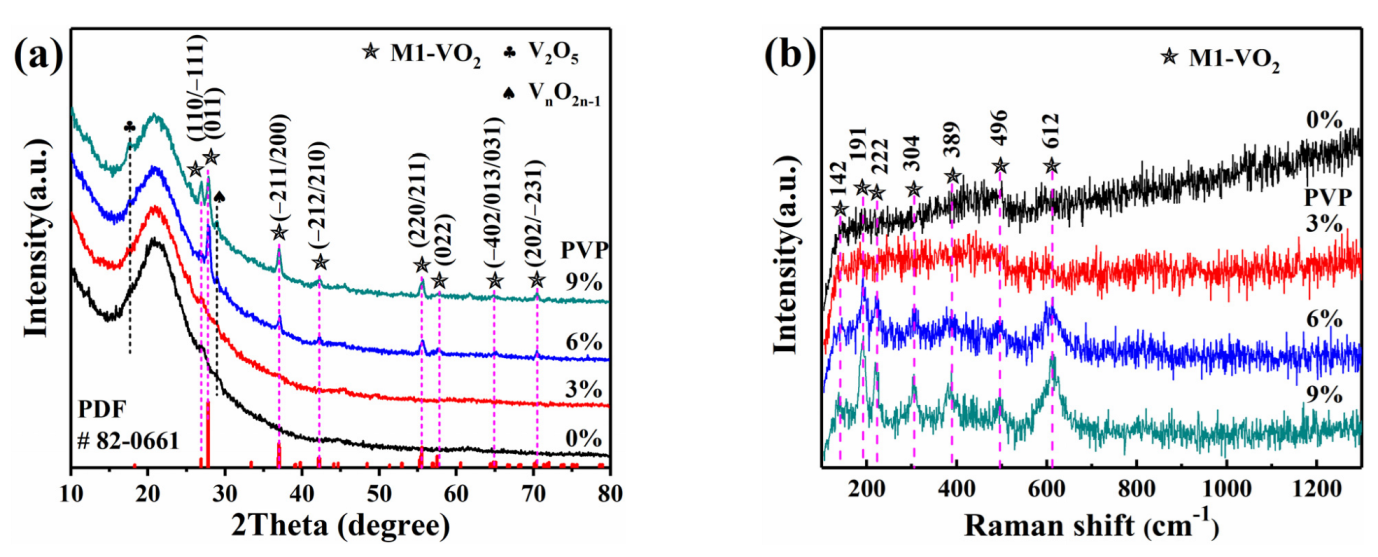
Figure 1. GIXRD pattern (a) and Raman spectra (b) of VO2 thin films prepared from VOCl2-PVP precursors with different PVP contents (0 wt.%, 3 wt.%, 6 wt.%, and 9 wt.%, respectively).
Materials 16 00208 g001
Figure 2. The top-view FESEM images (magnification = 20,000×; magnification for each inserted picture in the top right = 100,000×) of VO2 thin films prepared using different PVP contents in the precursor: 0 wt.% (a); 3 wt.% (b); 6 wt.% (c); 9 wt.% (d).
Materials 16 00208 g002
Figure 3. The cross-section photos of VO2 thin-film samples prepared using different PVP contents in the precursor: 0 wt.% (a); 3 wt.% (b); 6 wt.% (c); 9 wt.% (d).
Materials 16 00208 g003
Figure 4. High-resolution XPS spectra of O 1s–V 2p (a,d), N 1s (b,e), and C 1s (c,f) core level energies for VO2 thin films prepared by different PVP contents in precursor: (ac) after etching for 30 s by Ar+; (df) after etching for 330 s by Ar+.
Materials 16 00208 g004
Figure 5. The content of N 1s contained in Nsub (396.6 eV), Nint (399 eV), and Nads (401 eV) (a,c), and the ratio of N 1s/total N (b,d) in the VO2 thin films prepared using different PVP contents in precursor ((a,b): etching for 30 s, the corresponding etching depth was approximately 0.5 nm; ((c,d): etching for 330 s, the corresponding etching depth was approximately 5.5 nm).
Materials 16 00208 g005
Figure 6. The UV/Vis/NIR transmittance (a) and absorptance (b) spectra of VO2 thin films prepared using different contents of PVP in precursor. The transmittance spectra were measured at 20 °C and 90 °C, respectively; the absorptance spectra were measured at 20 °C.
Materials 16 00208 g006
Figure 7. (a) Tauc plots of VO2 thin-film samples prepared using different contents (0, 3, 6, and 9 wt.%) of PVP in precursors. (b) Schematic illustration of band structure near the Fermi level for pure VO2 (M1).
Materials 16 00208 g007
Figure 8. Calculation models of N-containing VO2(M1). (a) Nsub, Nint–H; (b) Nsub, Nint–N (Nads of N2); (c) Nsub, Nint–O; (d) Nsub, Nint–C.
Materials 16 00208 g008
Figure 9. The calculated band structures of N-incorporated VO2 (M1) according to density functional theory (DFT) calculations. All calculations were based on the corresponding models in Figure 8.
Materials 16 00208 g009
Table 1. The concentration of different N species in VO2 thin films, as determined by XPS analysis after Ar+ sputtering for 30 s and 330 s.
SamplePVP Content
(wt.%)
N/(N+O)NsubNintNadsN/(N+O)NsubNintNads
Etching for 30 sEtching for 330 s
P102.64%0.47%2.17%06.23%3.20%3.03%0
P235.50%0.95%2.47%2.08%6.37%2.99%2.02%1.36%
P367.78%1.24%4.01%2.52%7.77%2.28%4.04%1.45%
P498.17%1.03%4.19%2.95%9.46%3.19%4.14%2.13%
Table 2. Optical properties of VO2 thin films prepared using different contents of PVP in the precursor.
SamplePVP Dosage
(wt.%)
Film Colorλ*
(nm)
Tlum (%)∆Tsol
(%)
∆TNIR
(%)
∆T2000 nm
(%)
20 °C90 °C
P10Pale yellow42684.0884.030.921.022.9
P23Pale yellow43278.9578.950.971.033.9
P36Yellow green47252.1956.794.997.3937.6
P49Yellow green48239.2644.551.274.1731.3
Table 3. Calculated energy levels (in eV) of VO2 and N-containing VO2 (M1) in contrast with previous calculations [27] and experimental results.
Pure VO2 cal. N: VO2 (N-sub-int-ads) cal.N: VO2 exp.
N–HN–NN–ON–CP1P2P3P4
Eg10.620.10.40.5---0.260.16
Eg21.441.41.51.6-1.901.901.311.45
Disclaimer/Publisher’s Note: The statements, opinions and data contained in all publications are solely those of the individual author(s) and contributor(s) and not of MDPI and/or the editor(s). MDPI and/or the editor(s) disclaim responsibility for any injury to people or property resulting from any ideas, methods, instructions or products referred to in the content.