
Assessment of the Influence of Additives on the Mechanical Properties and Machinability of Al-11%Si Cast Alloys: Application of DOE and ANOVA Methods


Abstract
:1. Introduction
2. Scheme of Investigation
- 1.
- Identifying the important factors which influence the characteristics of Al–Si casting alloys;
- 2.
- Finding the upper and lower limits of the factors identified;
- 3.
- Developing the experimental design matrix using the design of experiments method;
- 4.
- Conducting the experiments as per the design matrix;
- 5.
- Developing regression equations between the response variable and the independent factor;
- 6.
- Assessing the factors and their effects using a standardized Pareto chart; and
- 7.
- Analyzing the results using analysis of variance (ANOVA).
2.1. Developing the Experimental Design Matrix
2.2. Evaluation of Response Variables
- 1.
- Total Cutting Force and Power
Mtm = [(Mxm)2 + (Mym)2 + (Mzm)2]1/2
σMtm = [(Mxm)2 (σMxm)2 + (Mym)2 (σMym)2 + (Mzm)2 (σMzm)2)]1/2/Mtm
- 2.
- Tool Life Criteria
3. Experimental Procedures
- (i)
- An ASTM B-108 permanent mold (five bars per each condition);
- (ii)
- A waffle-plate graphite-coated metallic mold to obtain castings for machinability test blocks (eighteen machinability test blocks per each condition).
4. Assessing the Factors and Their Effects
4.1. Mathematical Modeling
(R2 = 90.99%)
(R2 = 80.68%)
(R2 = 94.199%)
(R2 = 94.79%)
(R2 = 93.522%)
(R2 = 91.528%)
(R2 = 89.81%)
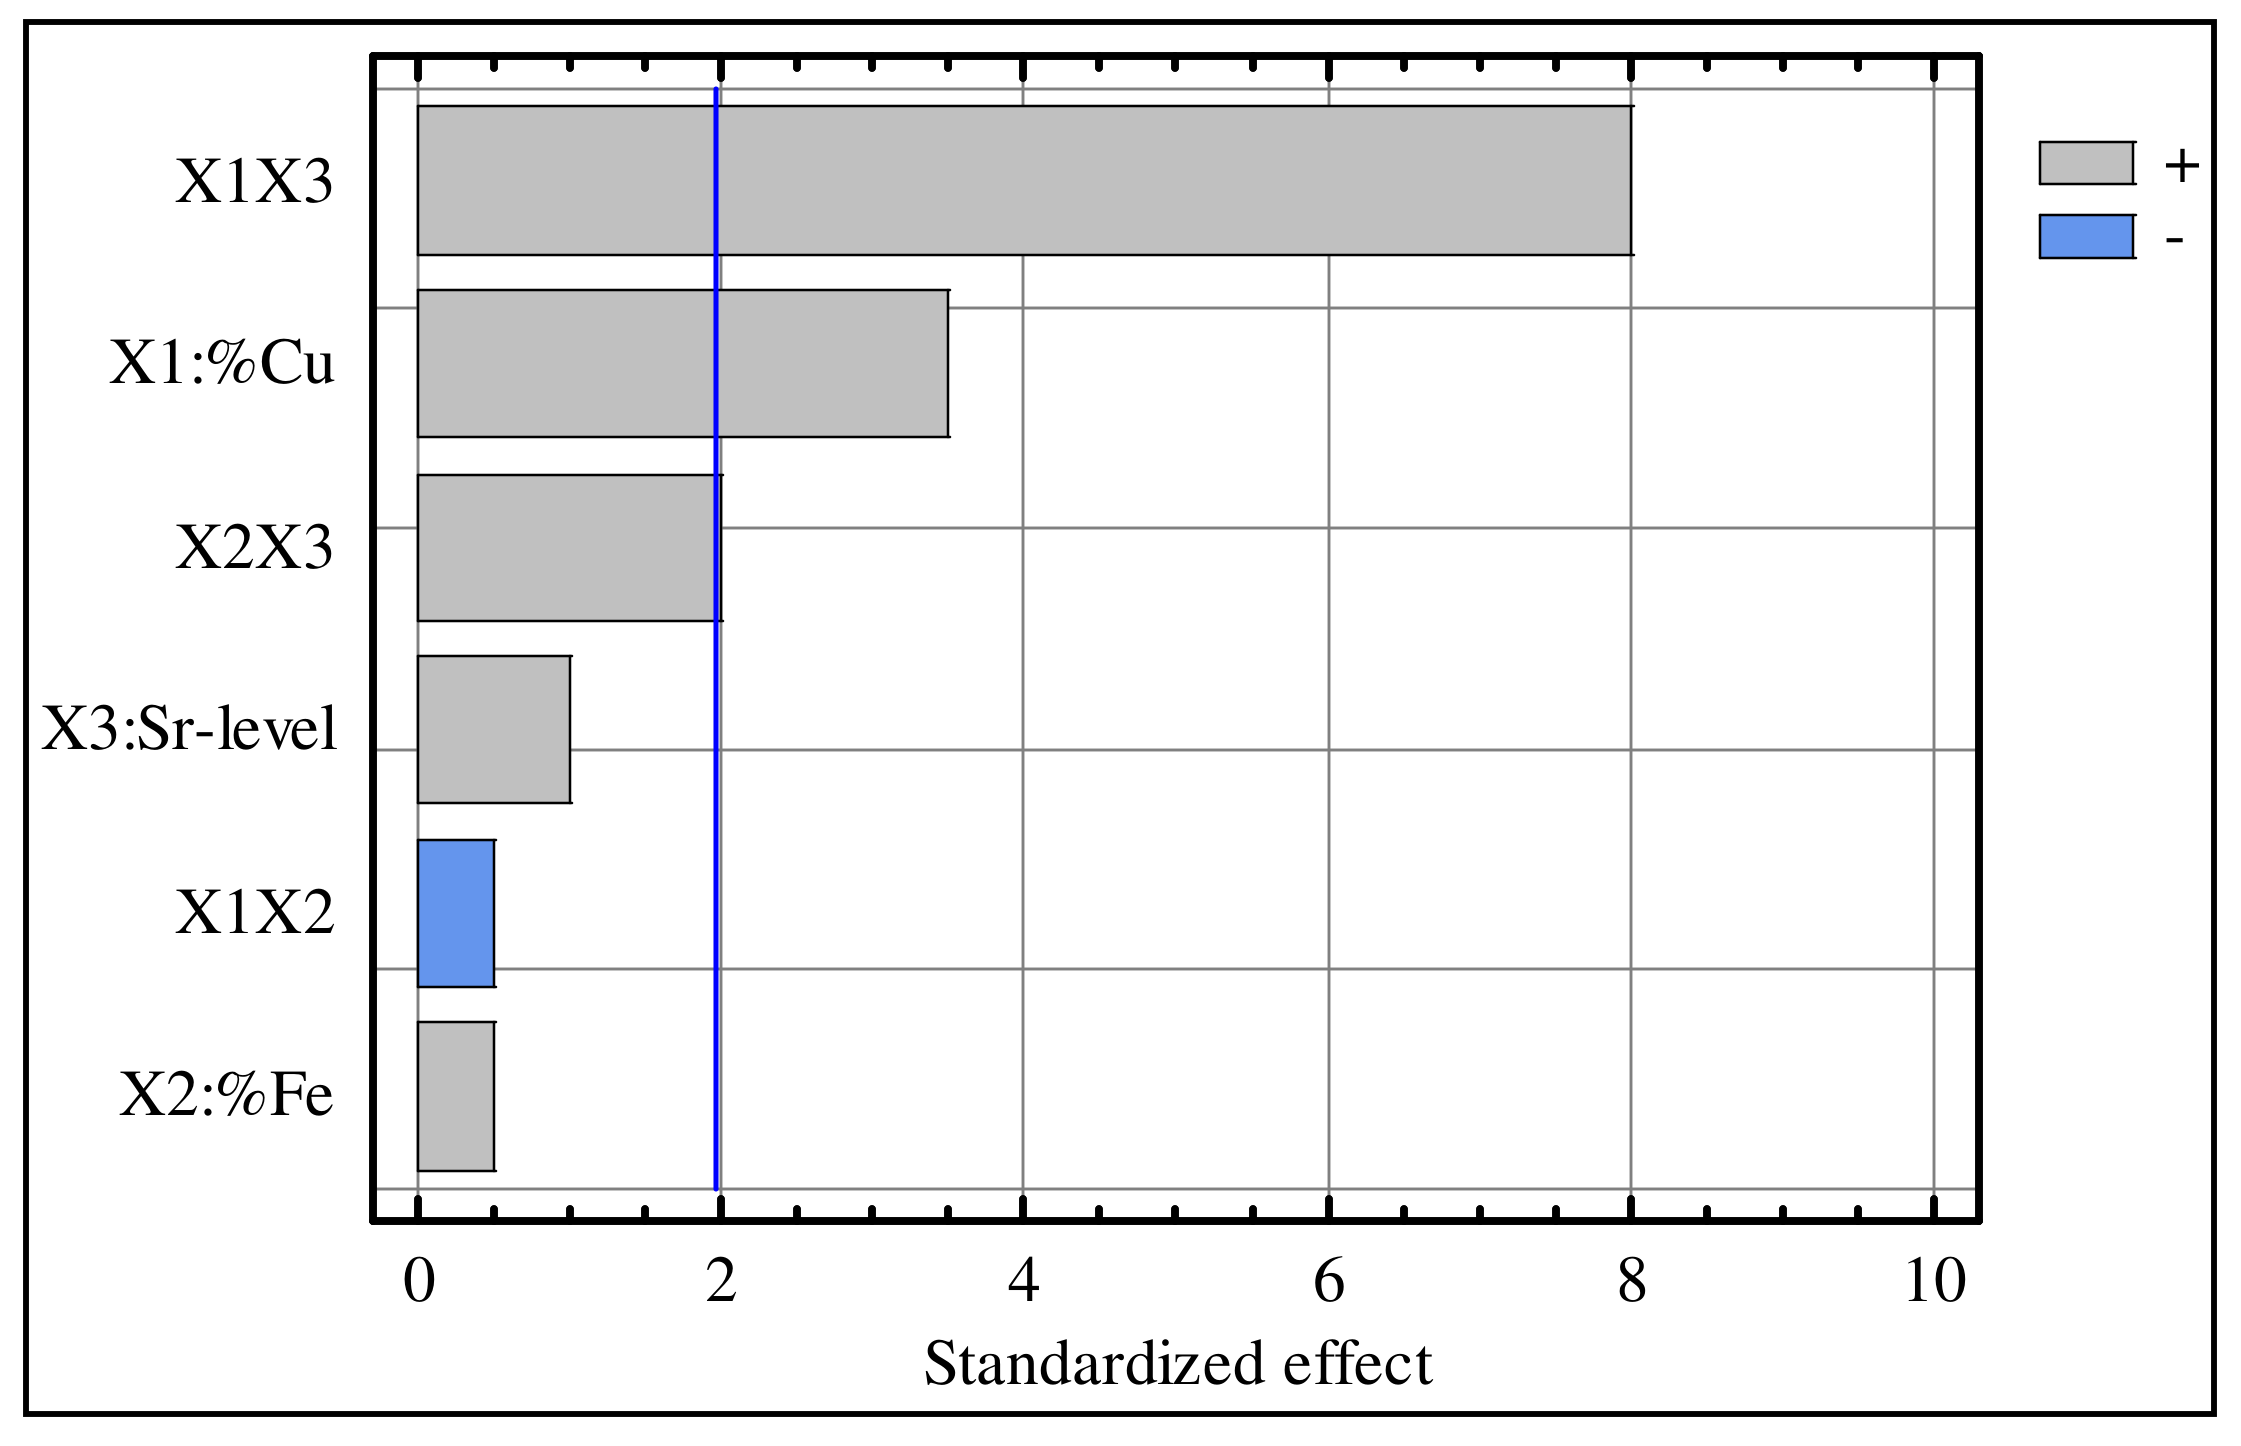
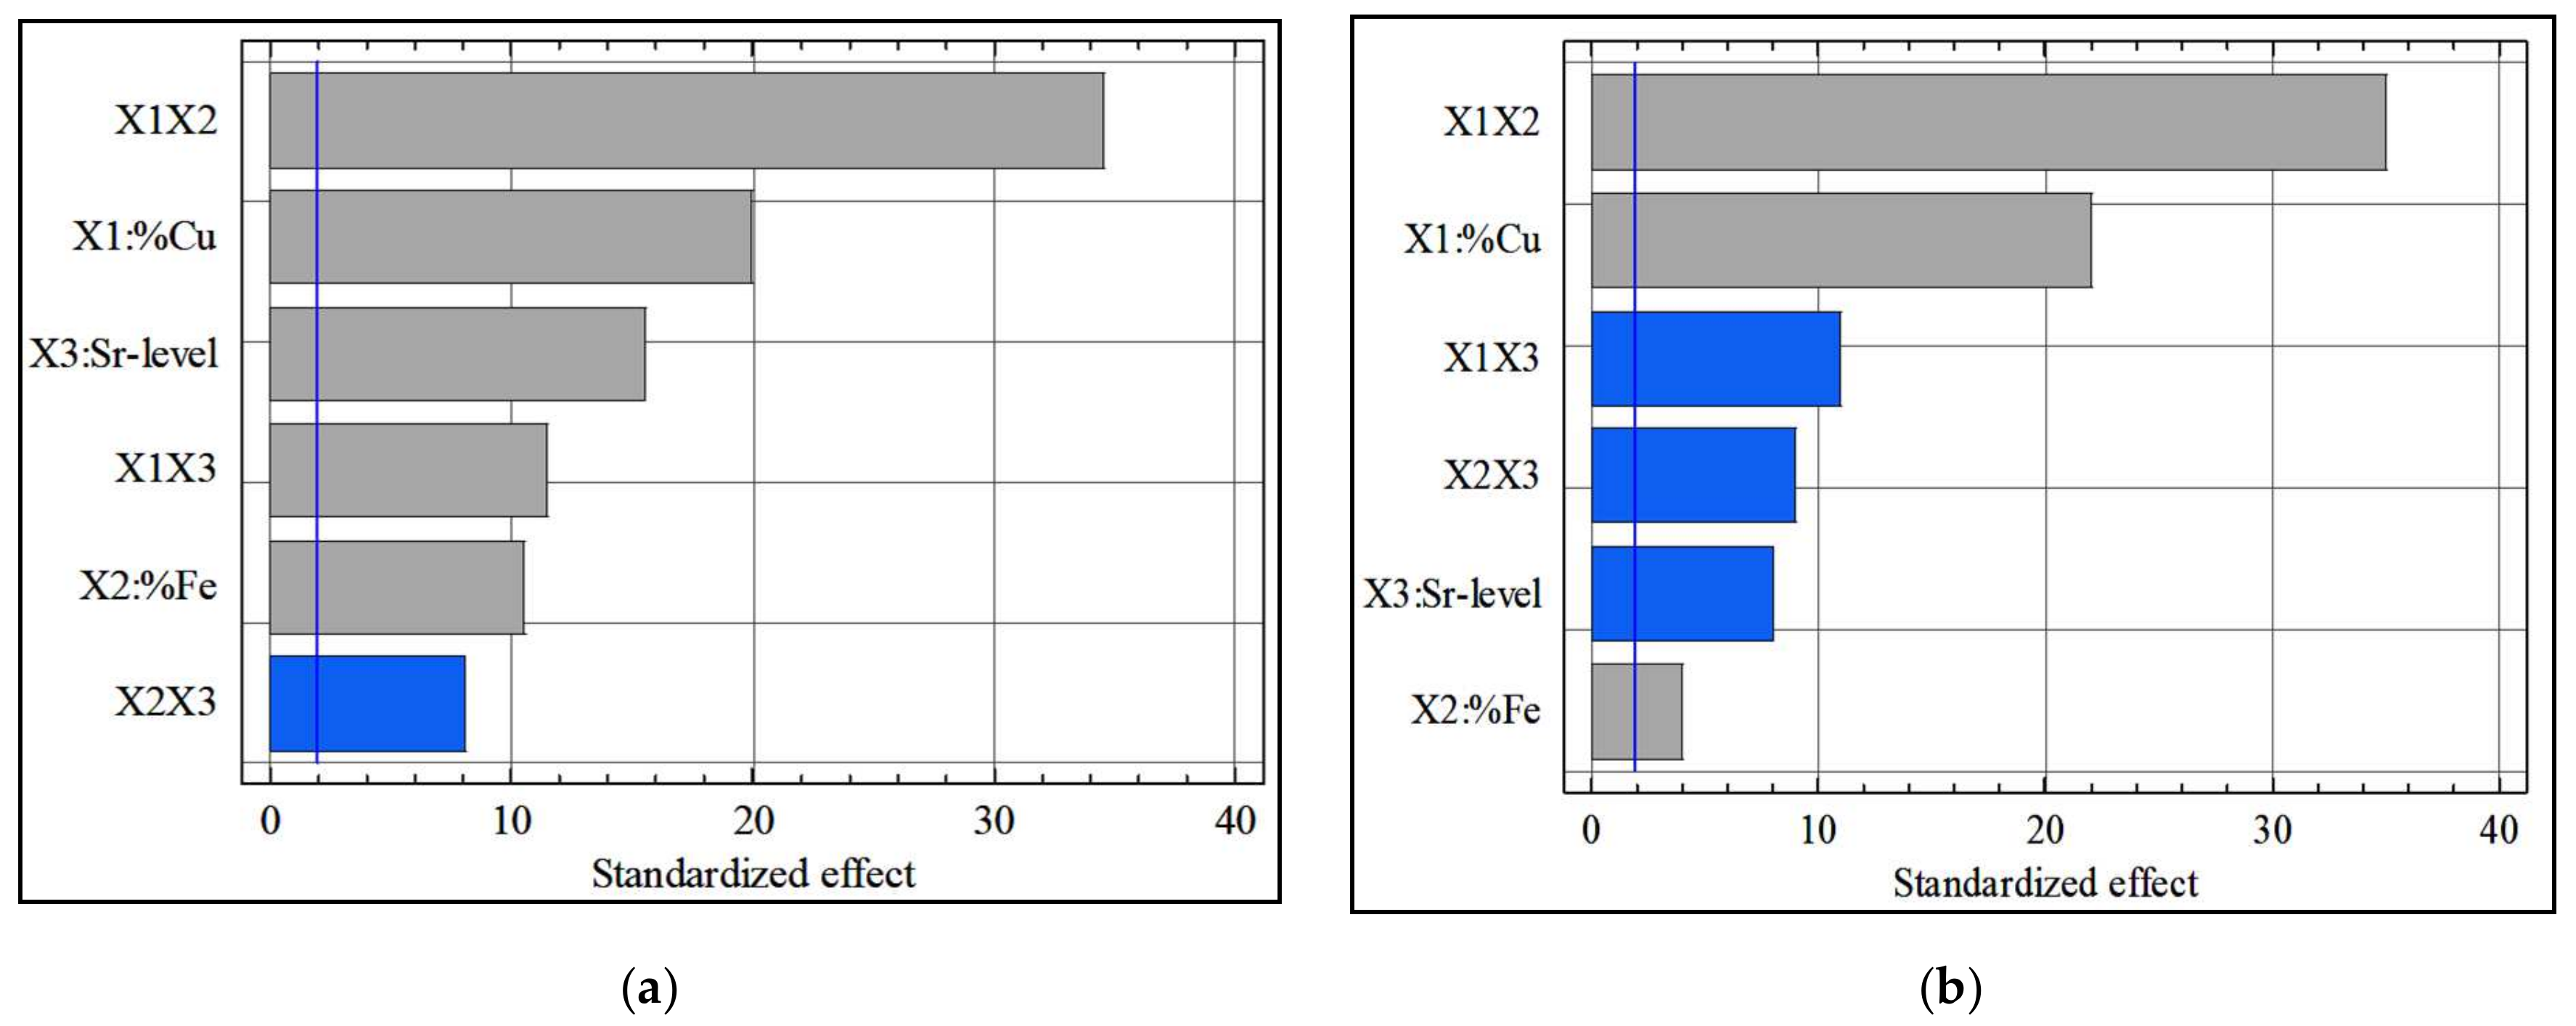
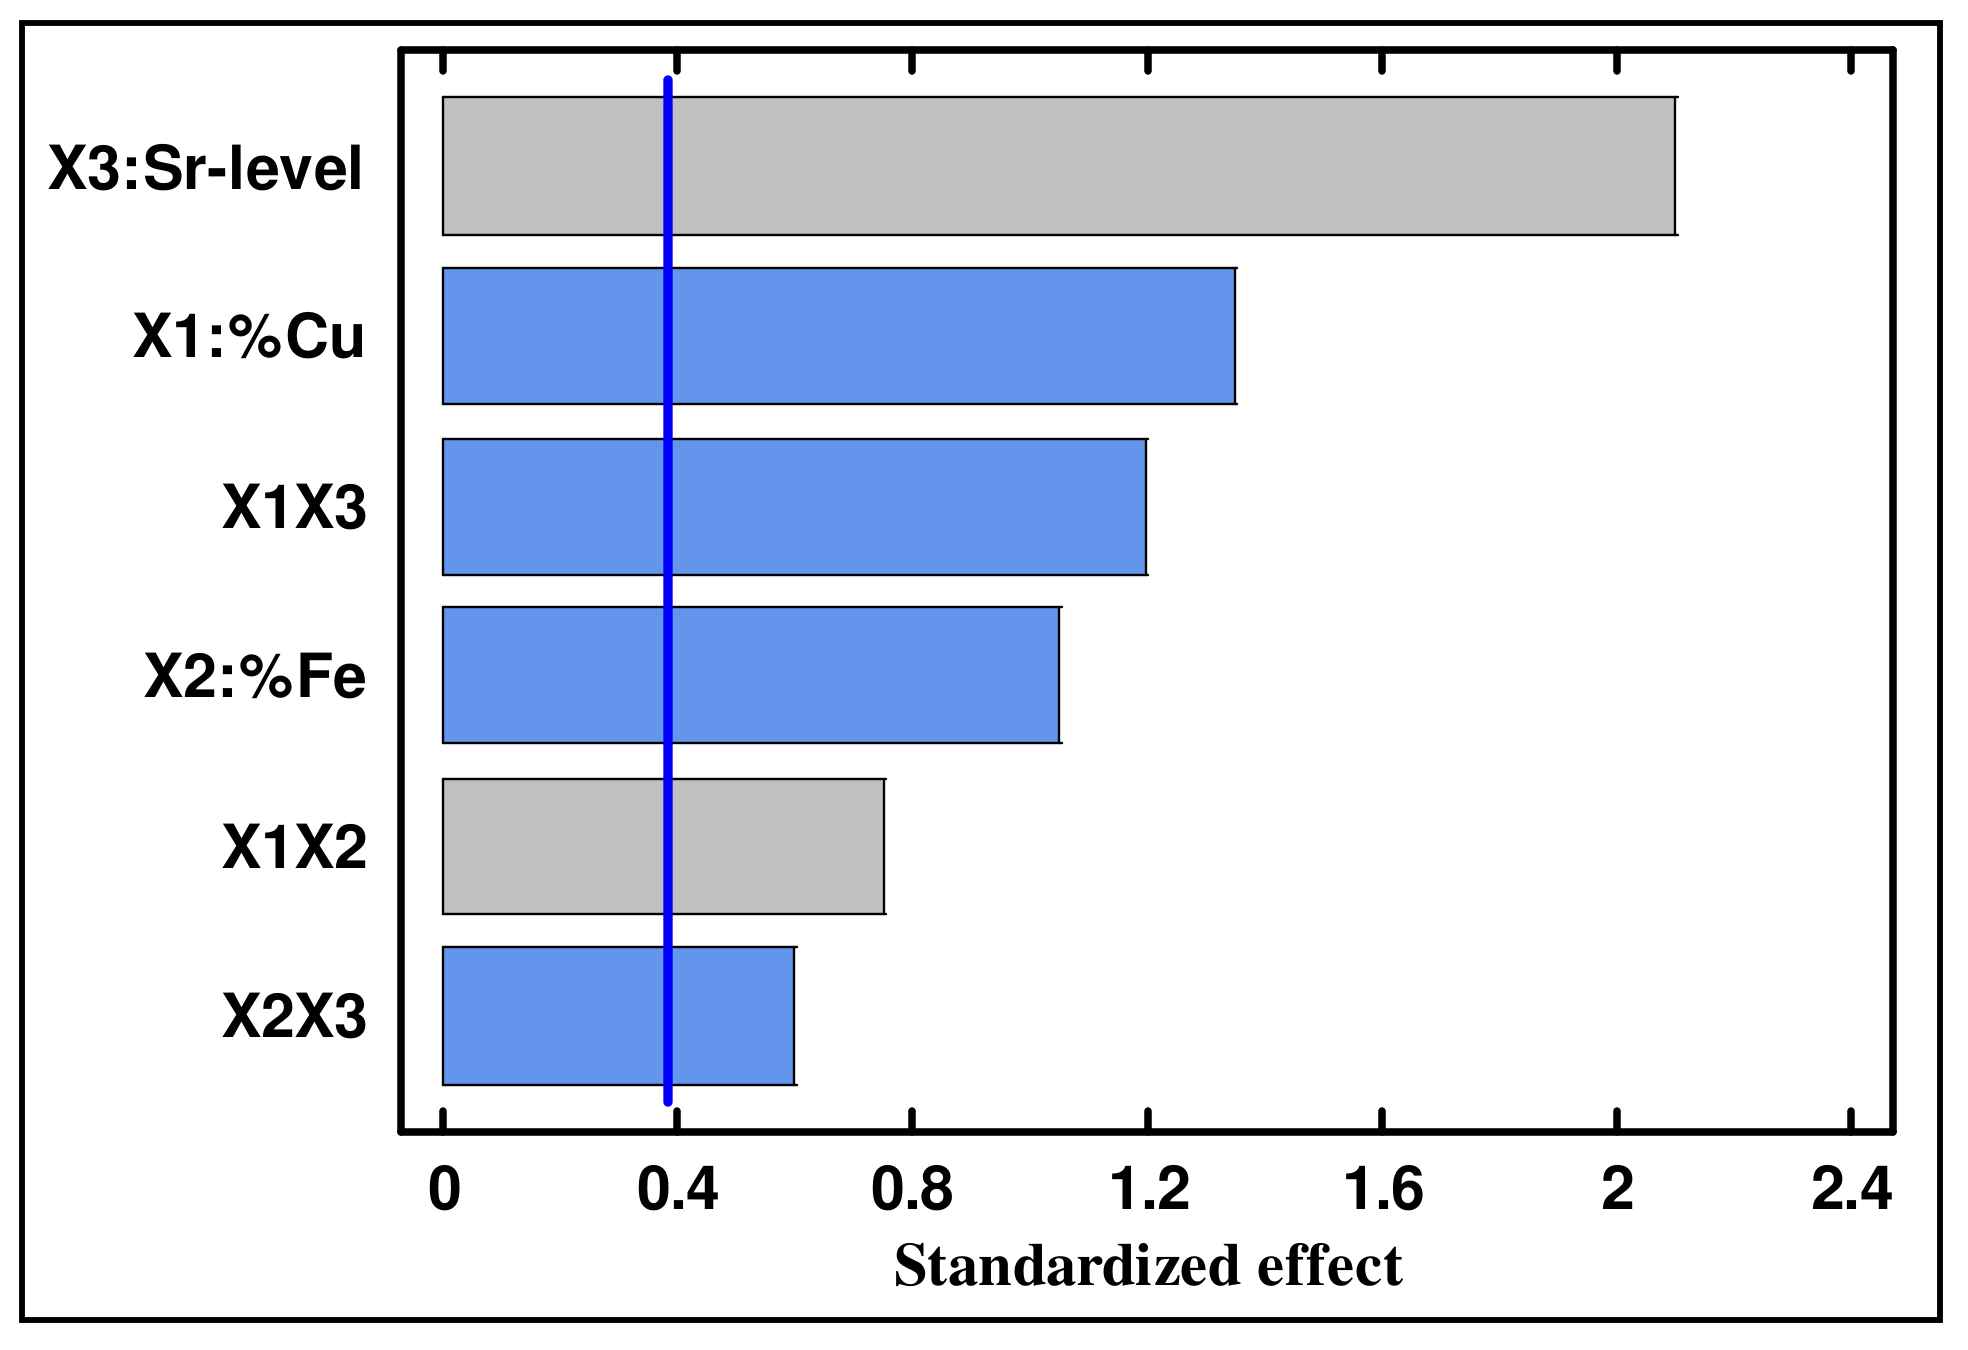
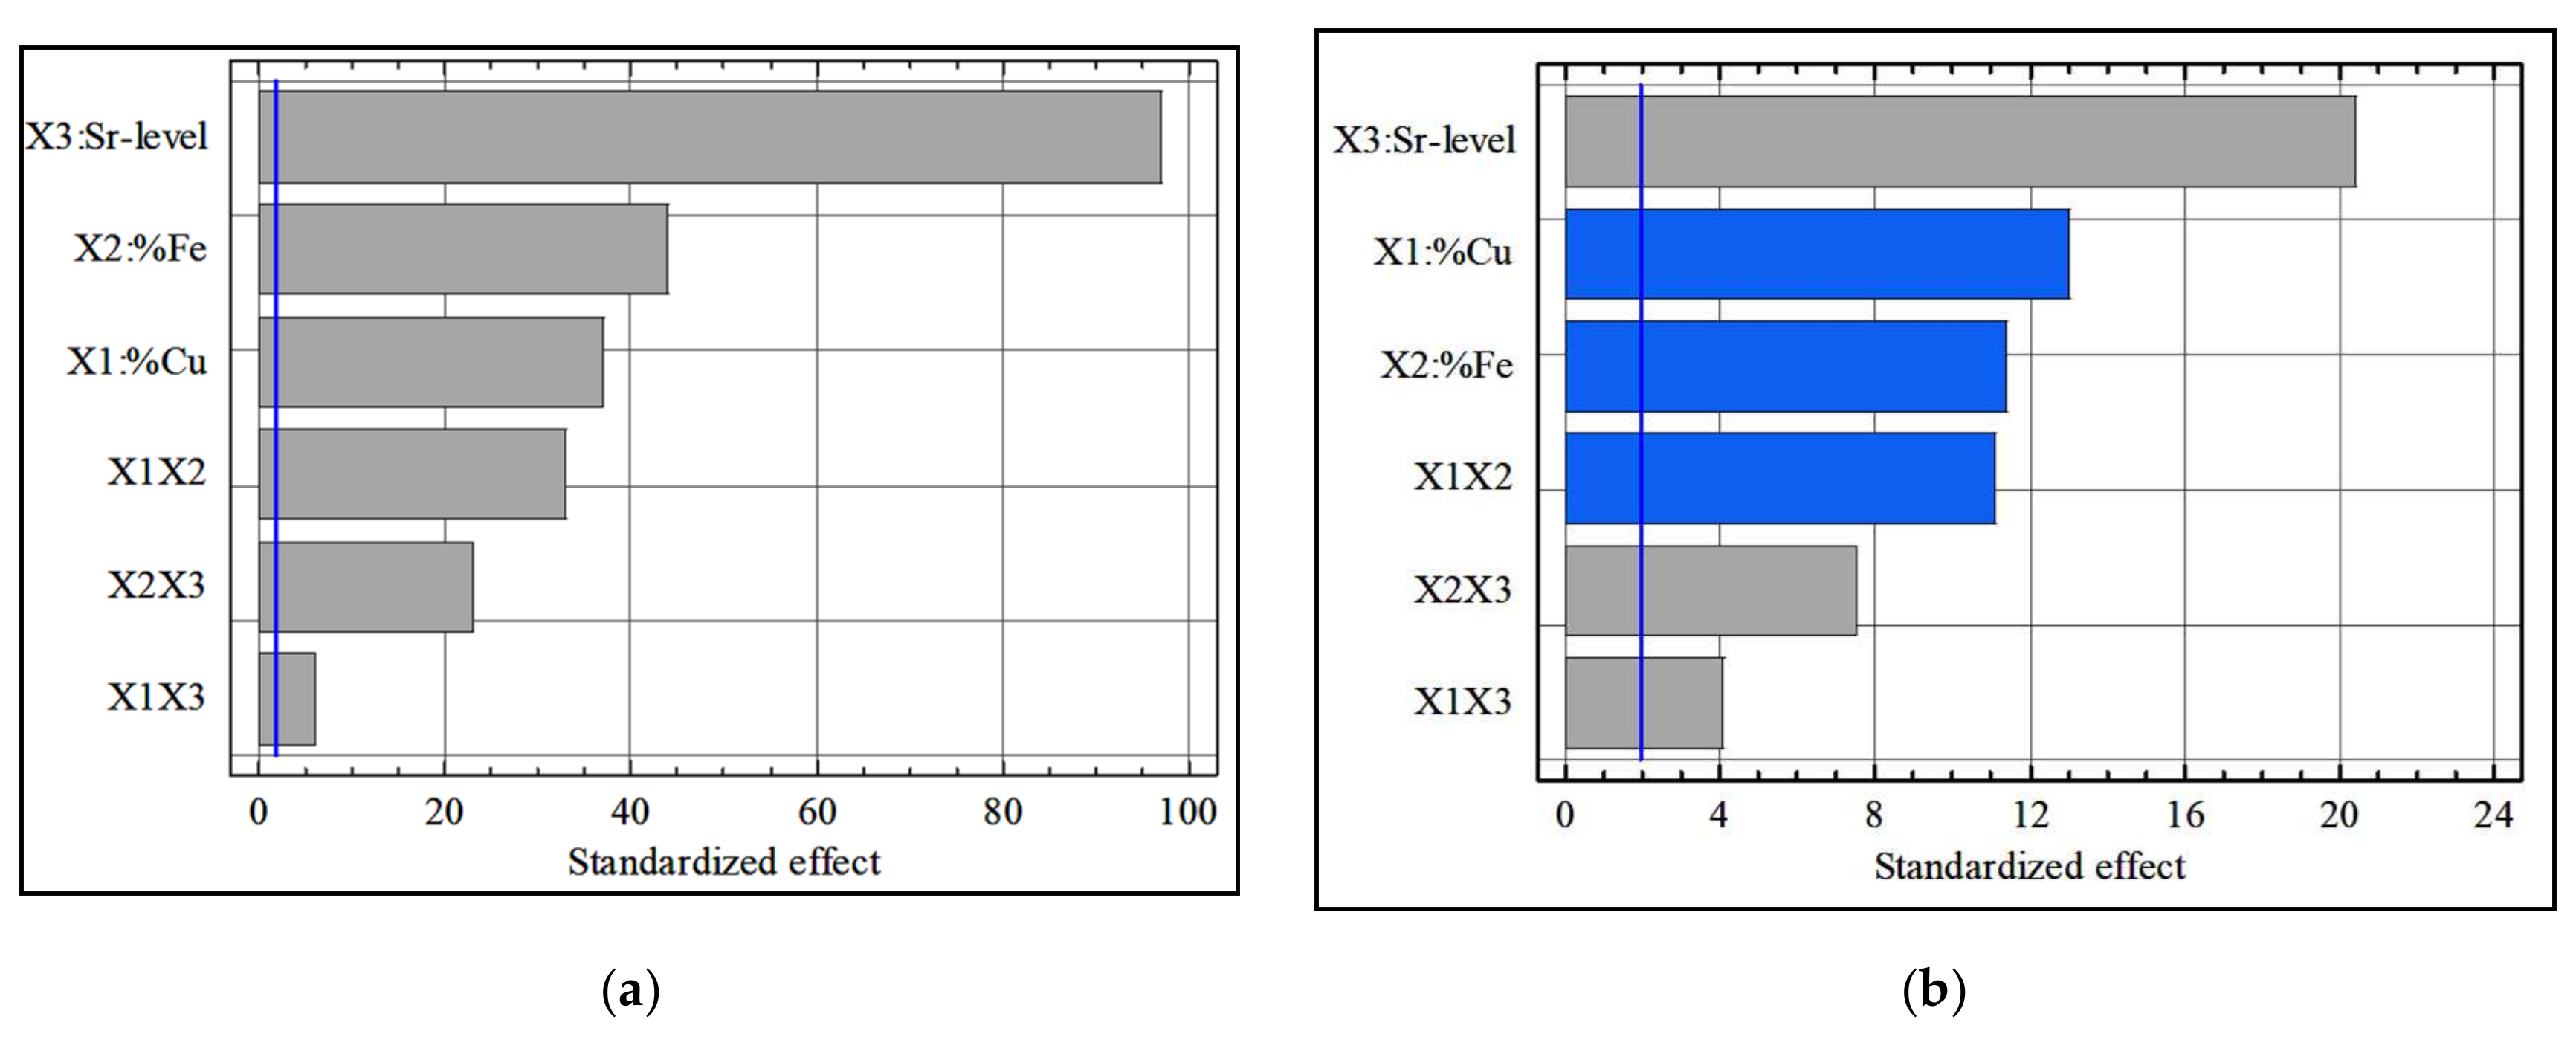
4.2. Standardized Pareto Chart
4.3. Analysis of Variance (ANOVA) Technique
5. Discussion
6. Conclusions
- 1.
- Based on the statistical analysis, the corresponding hardness data indicated that the decrease in the hardness value of Sr-modified alloys compared to the non-modified alloys was mainly the result of changes in the morphology of the eutectic Si particles, from brittle coarse acicular plates in the non-modified alloy to a rounded fibrous form;
- 2.
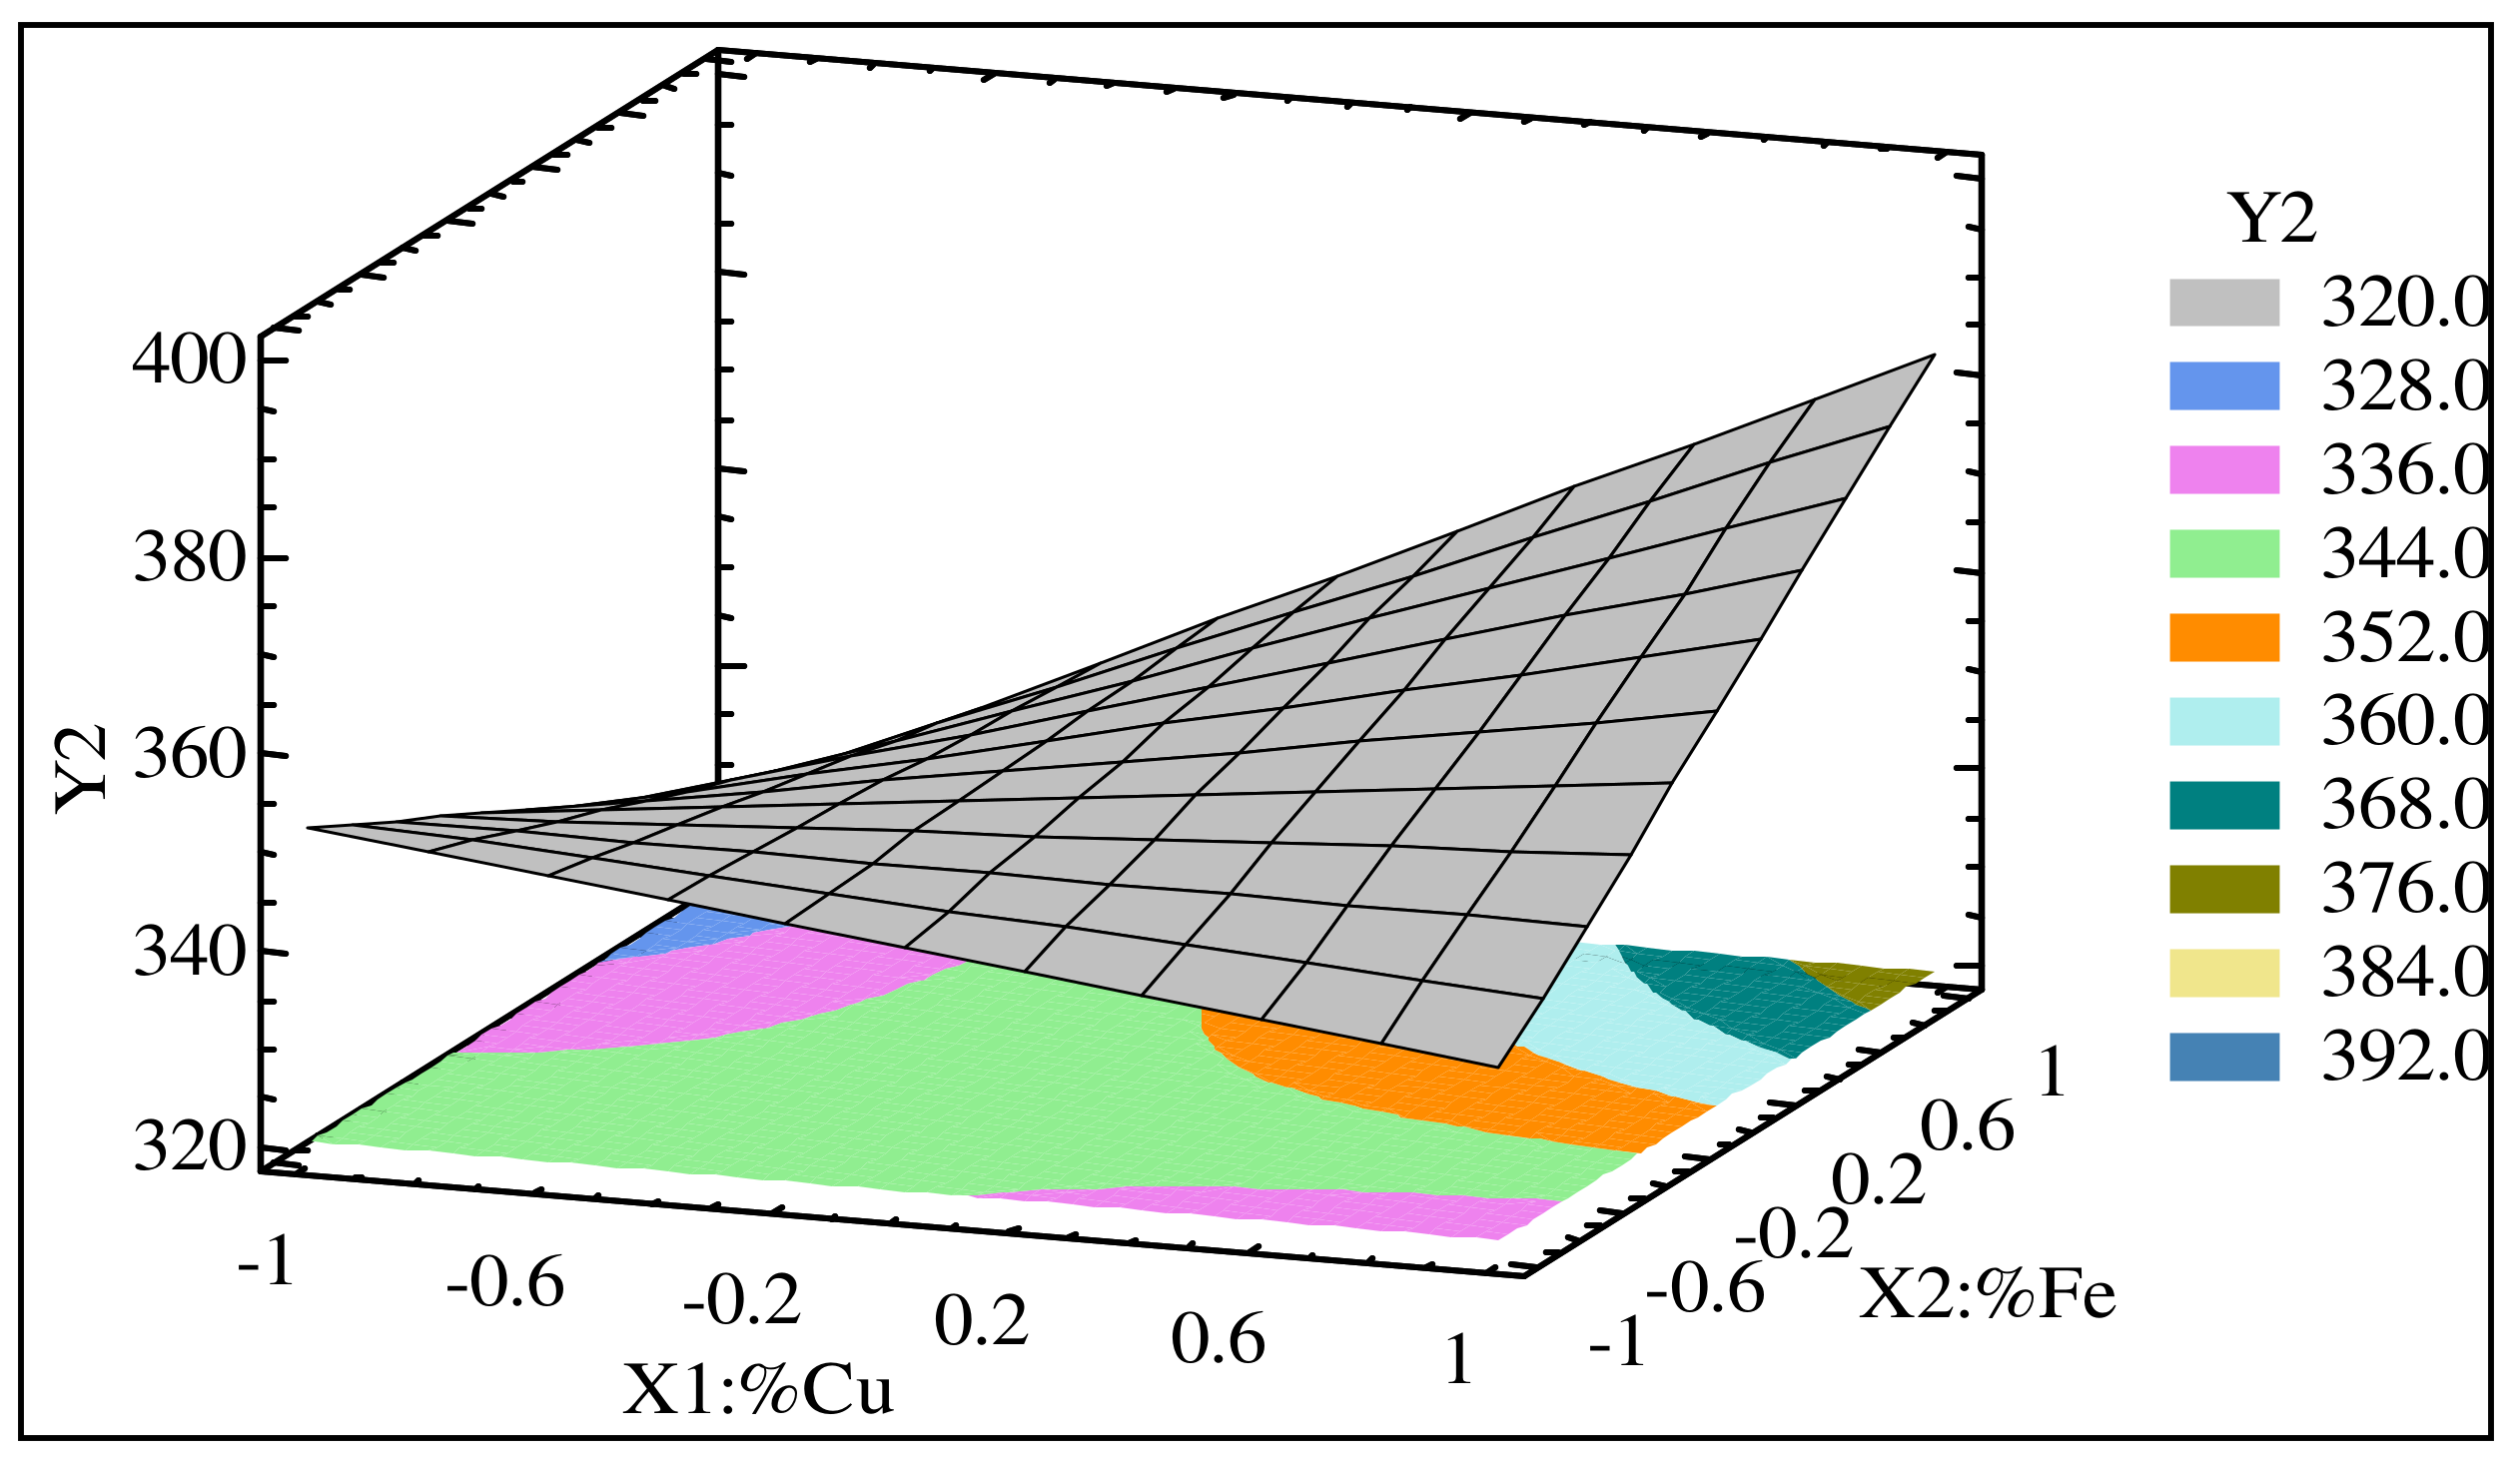
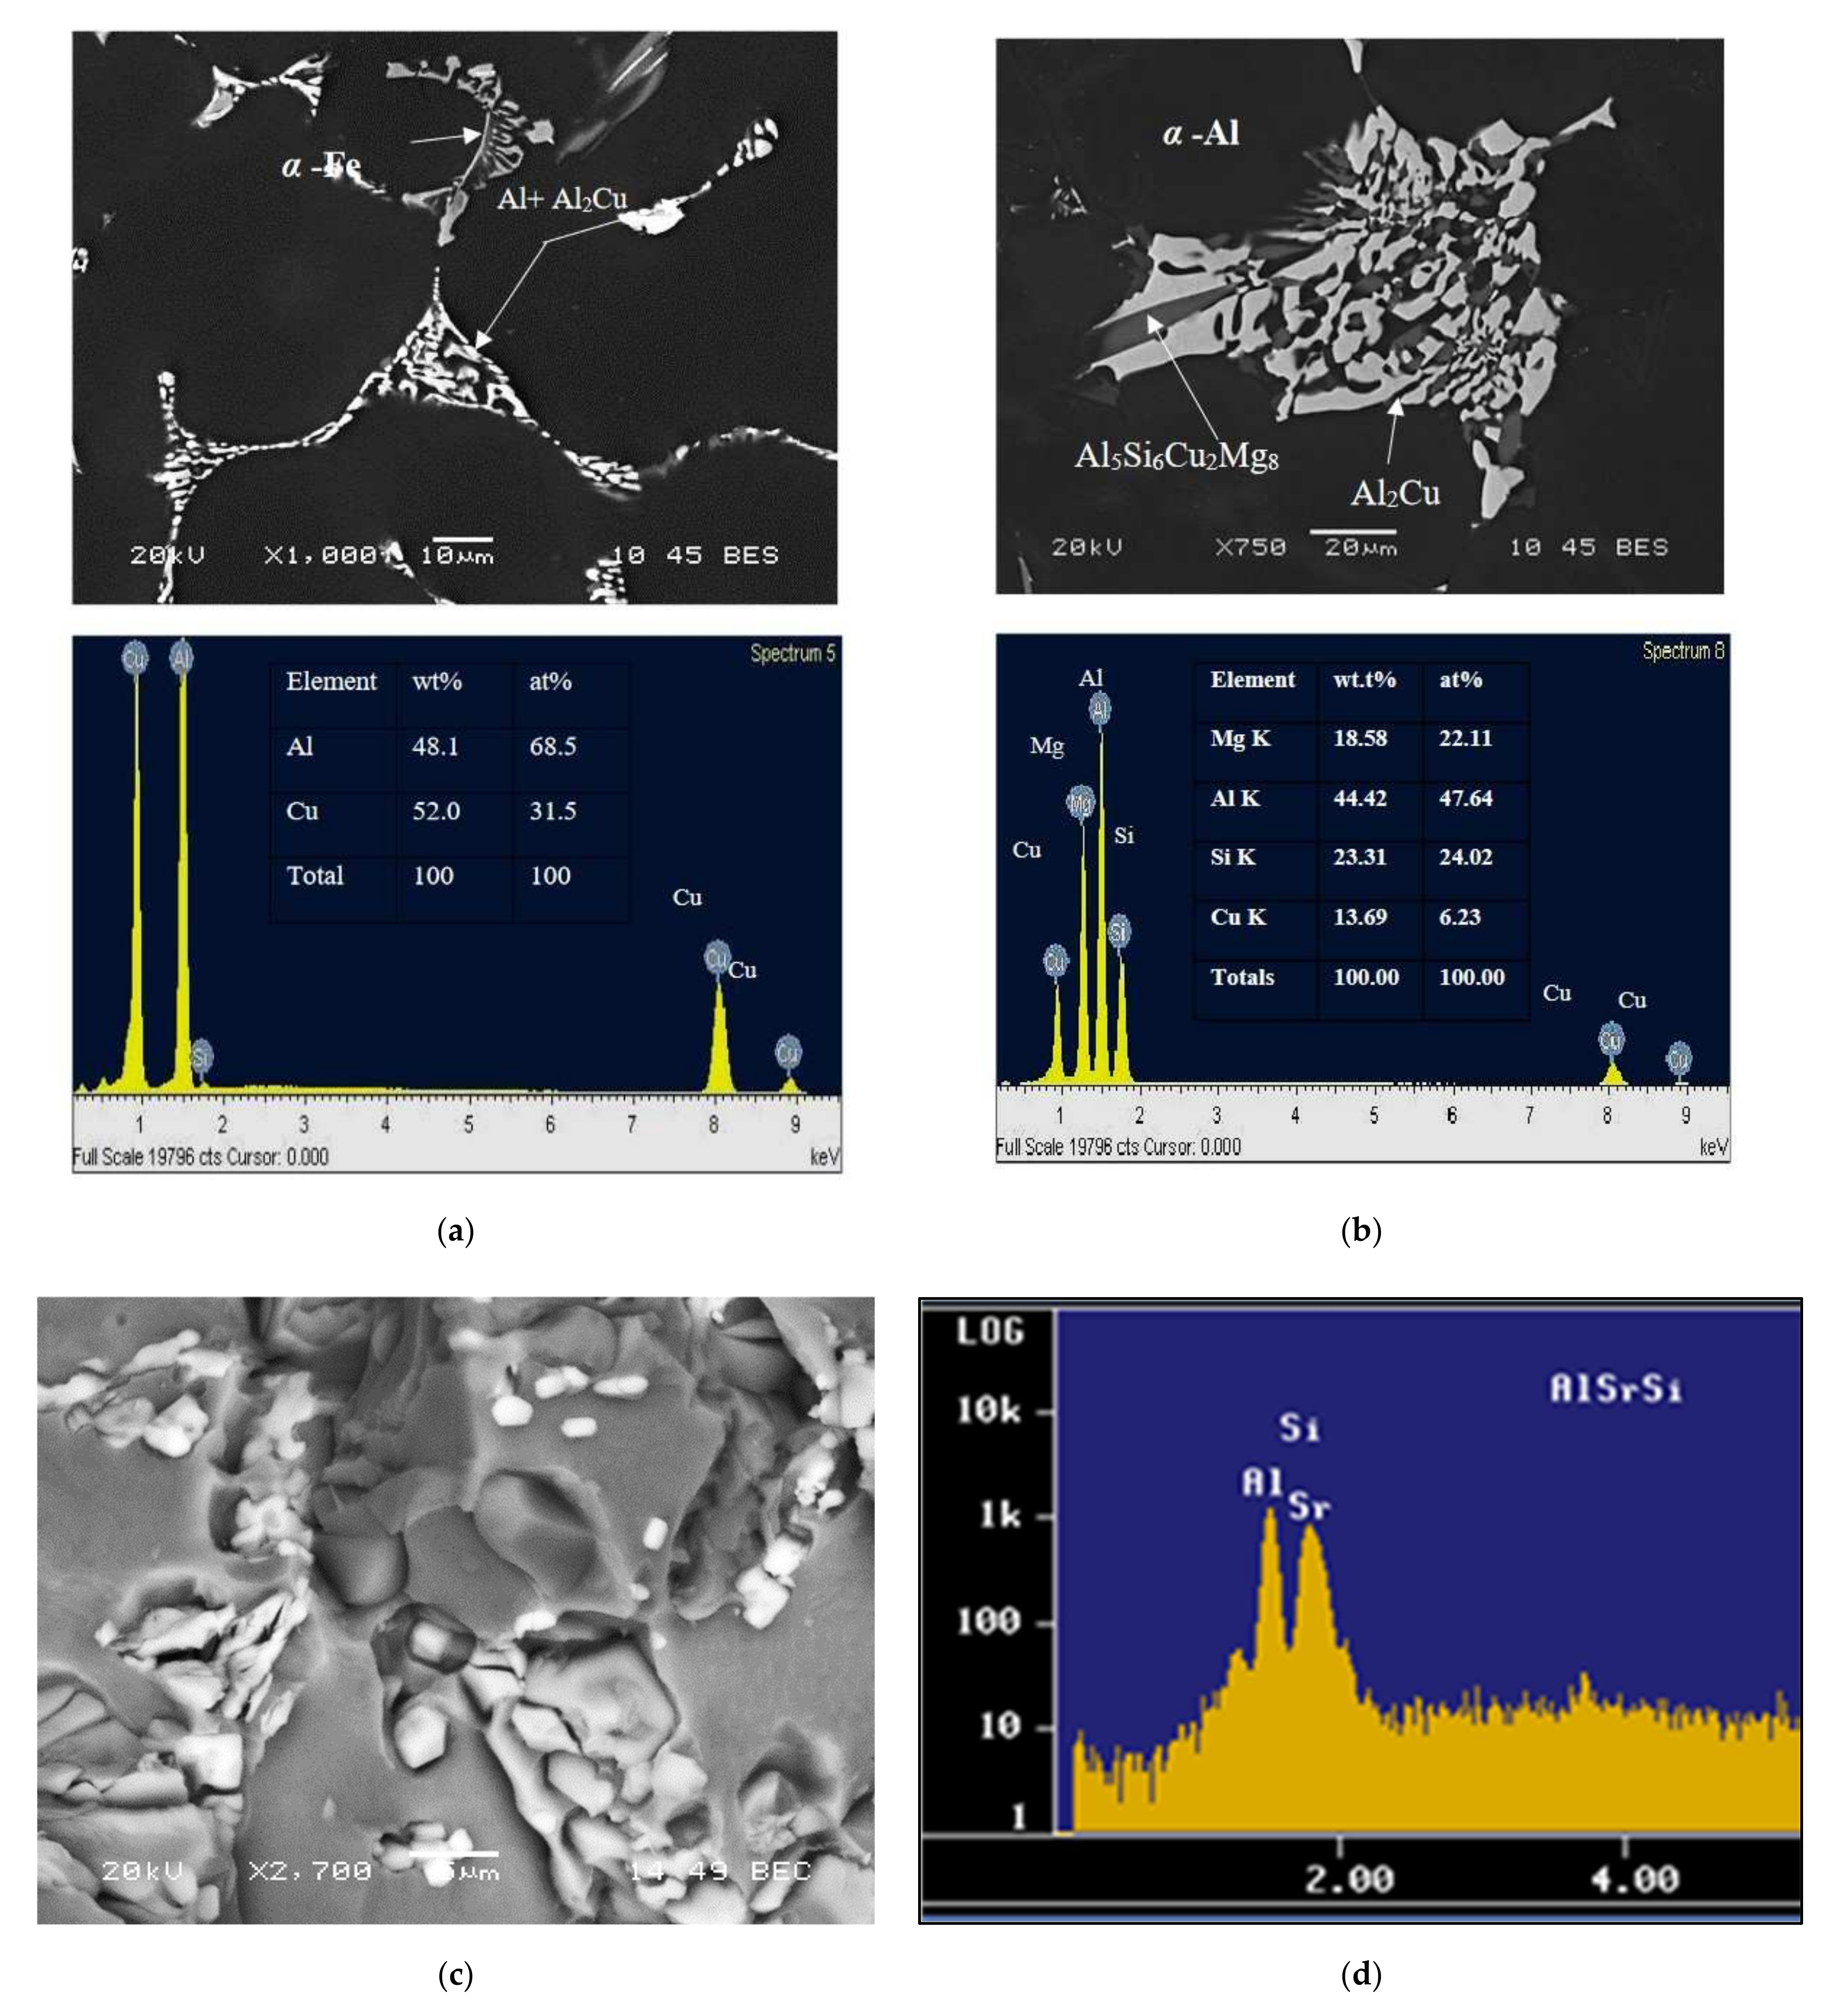
- The results proved that of the three alloying elements, Cu had the greatest effect in terms of increasing the yield stress and ultimate tensile strength values. This fact may be attributed to the formation of the hard and brittle (metastable) intermetallic phases Al2Cu and Al–Cu–Mg. It was also found that an increase in the Fe content resulted in a slight increase in hardness values;
- 3.
- The elongation percentage of alloys was effected by three elements, with Fe and Cu having the greatest effect and Sr having the least;
- 4.
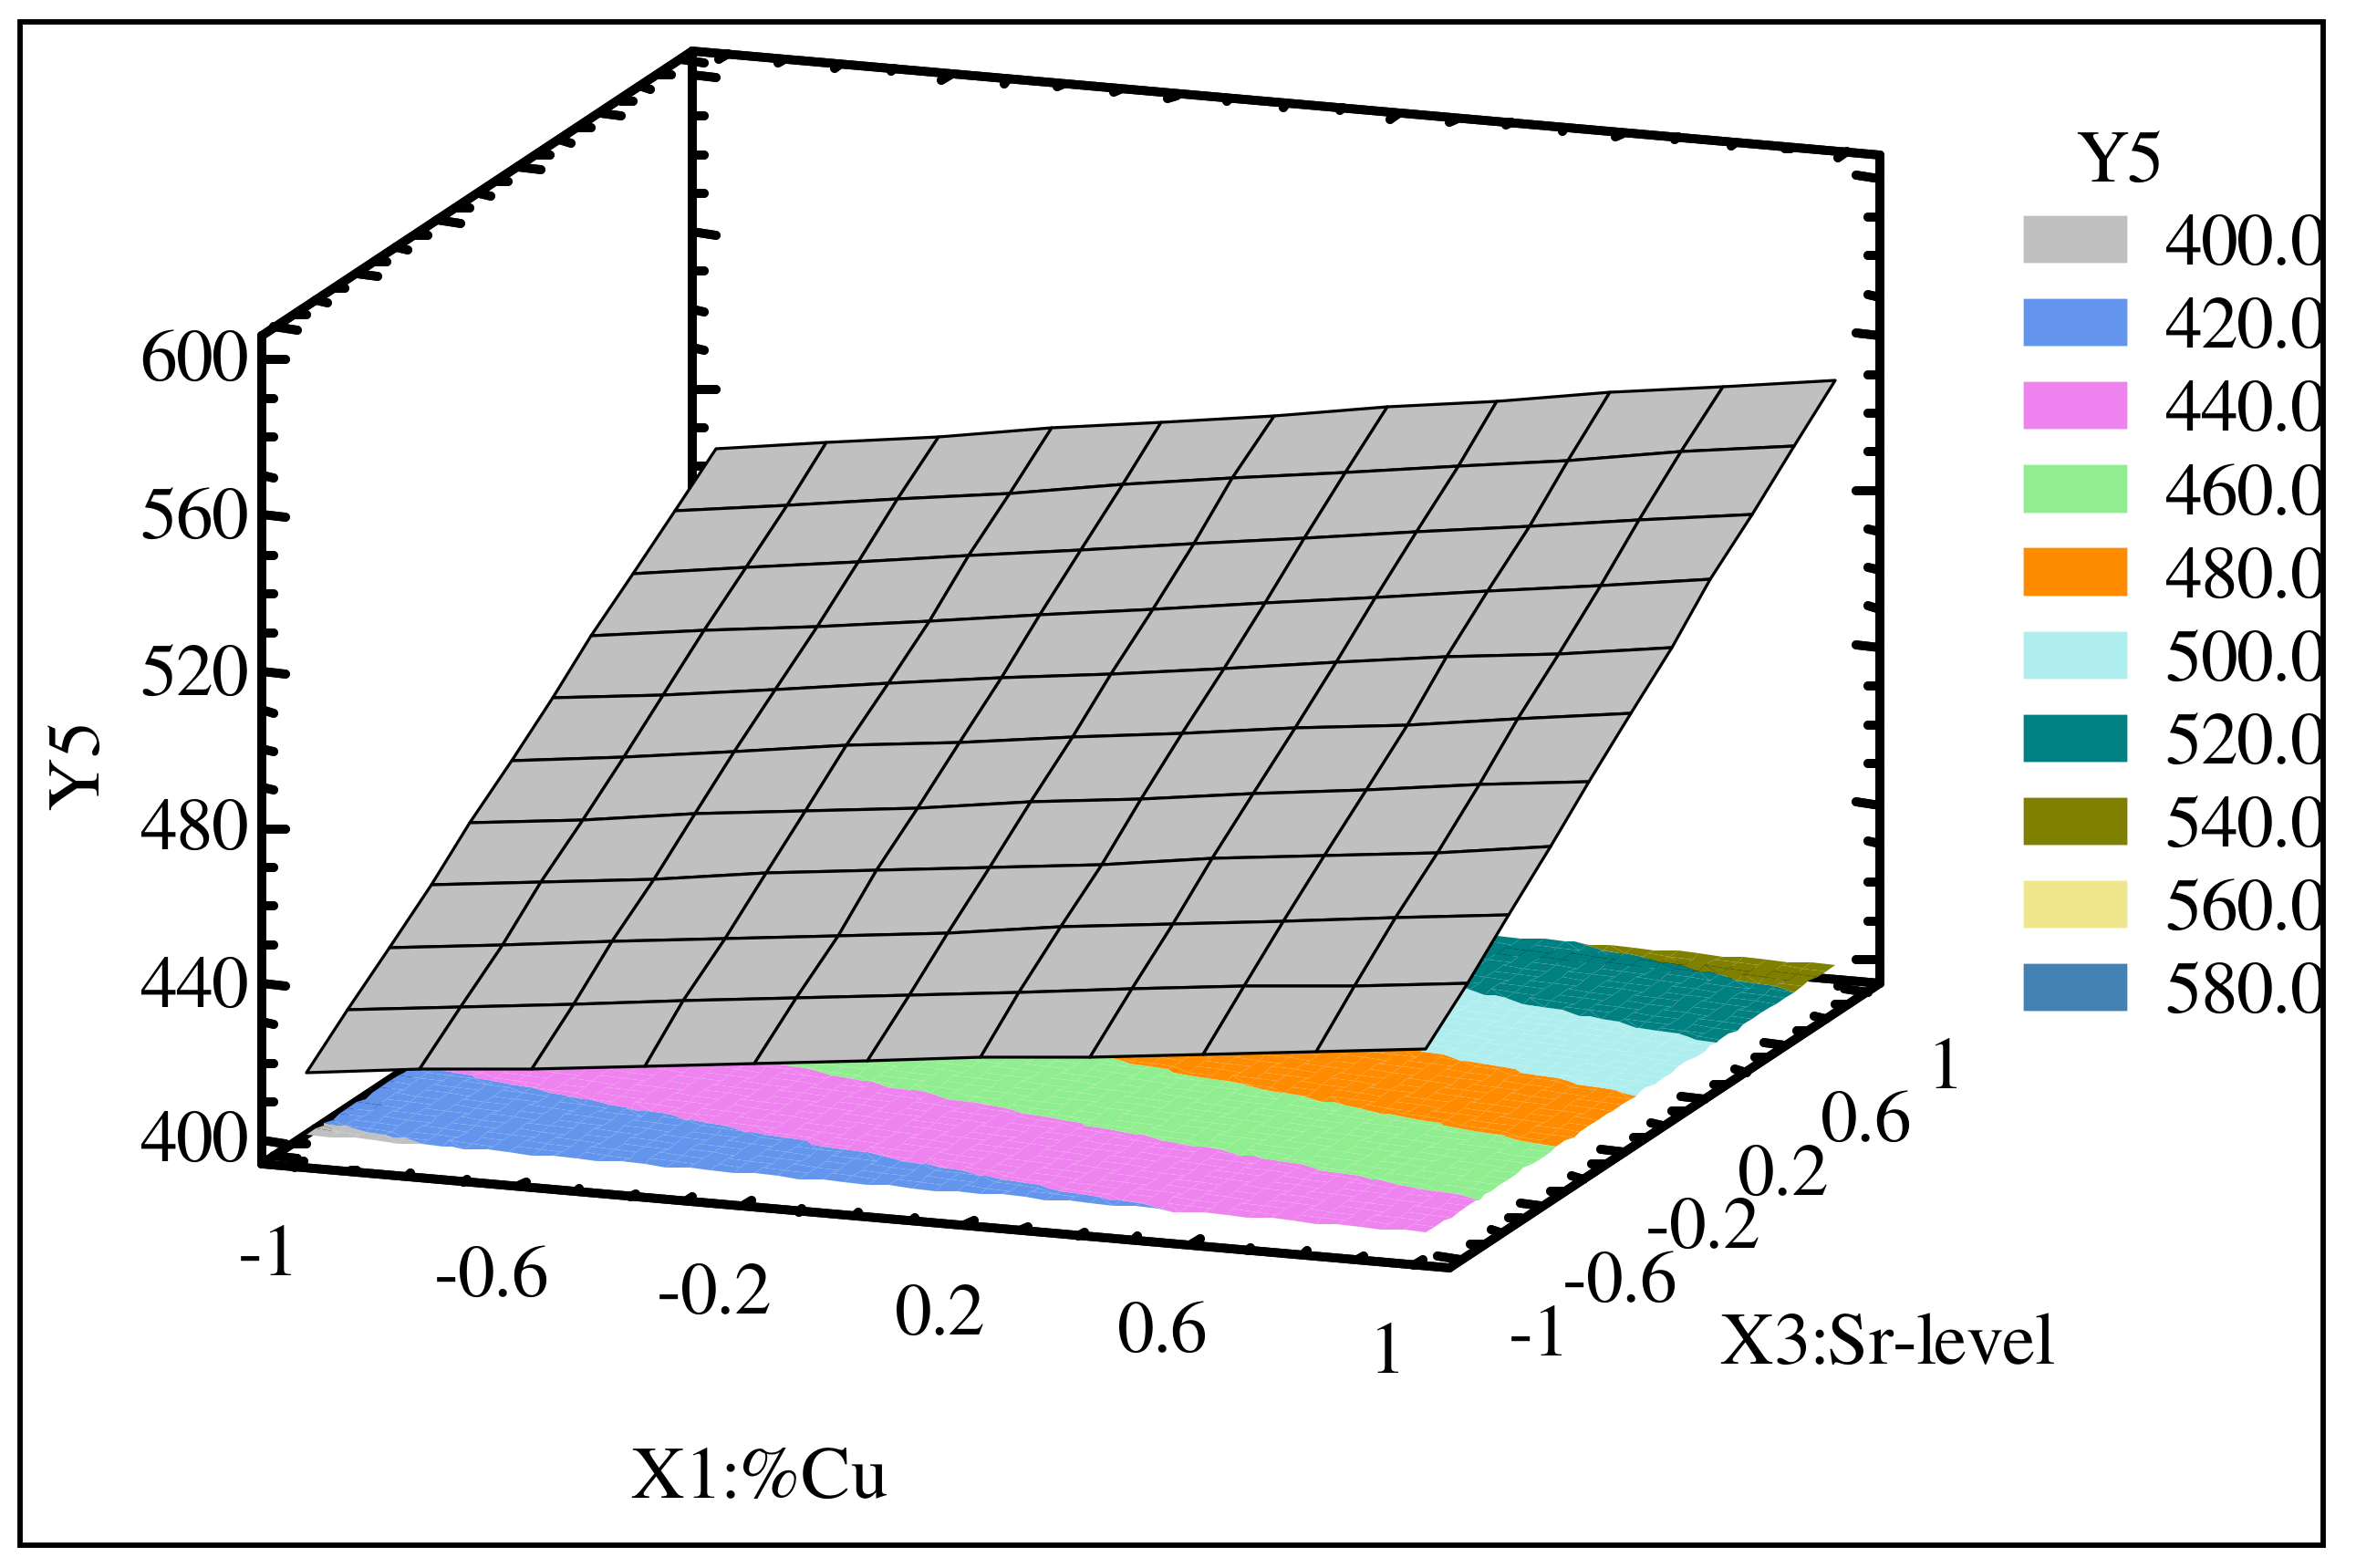
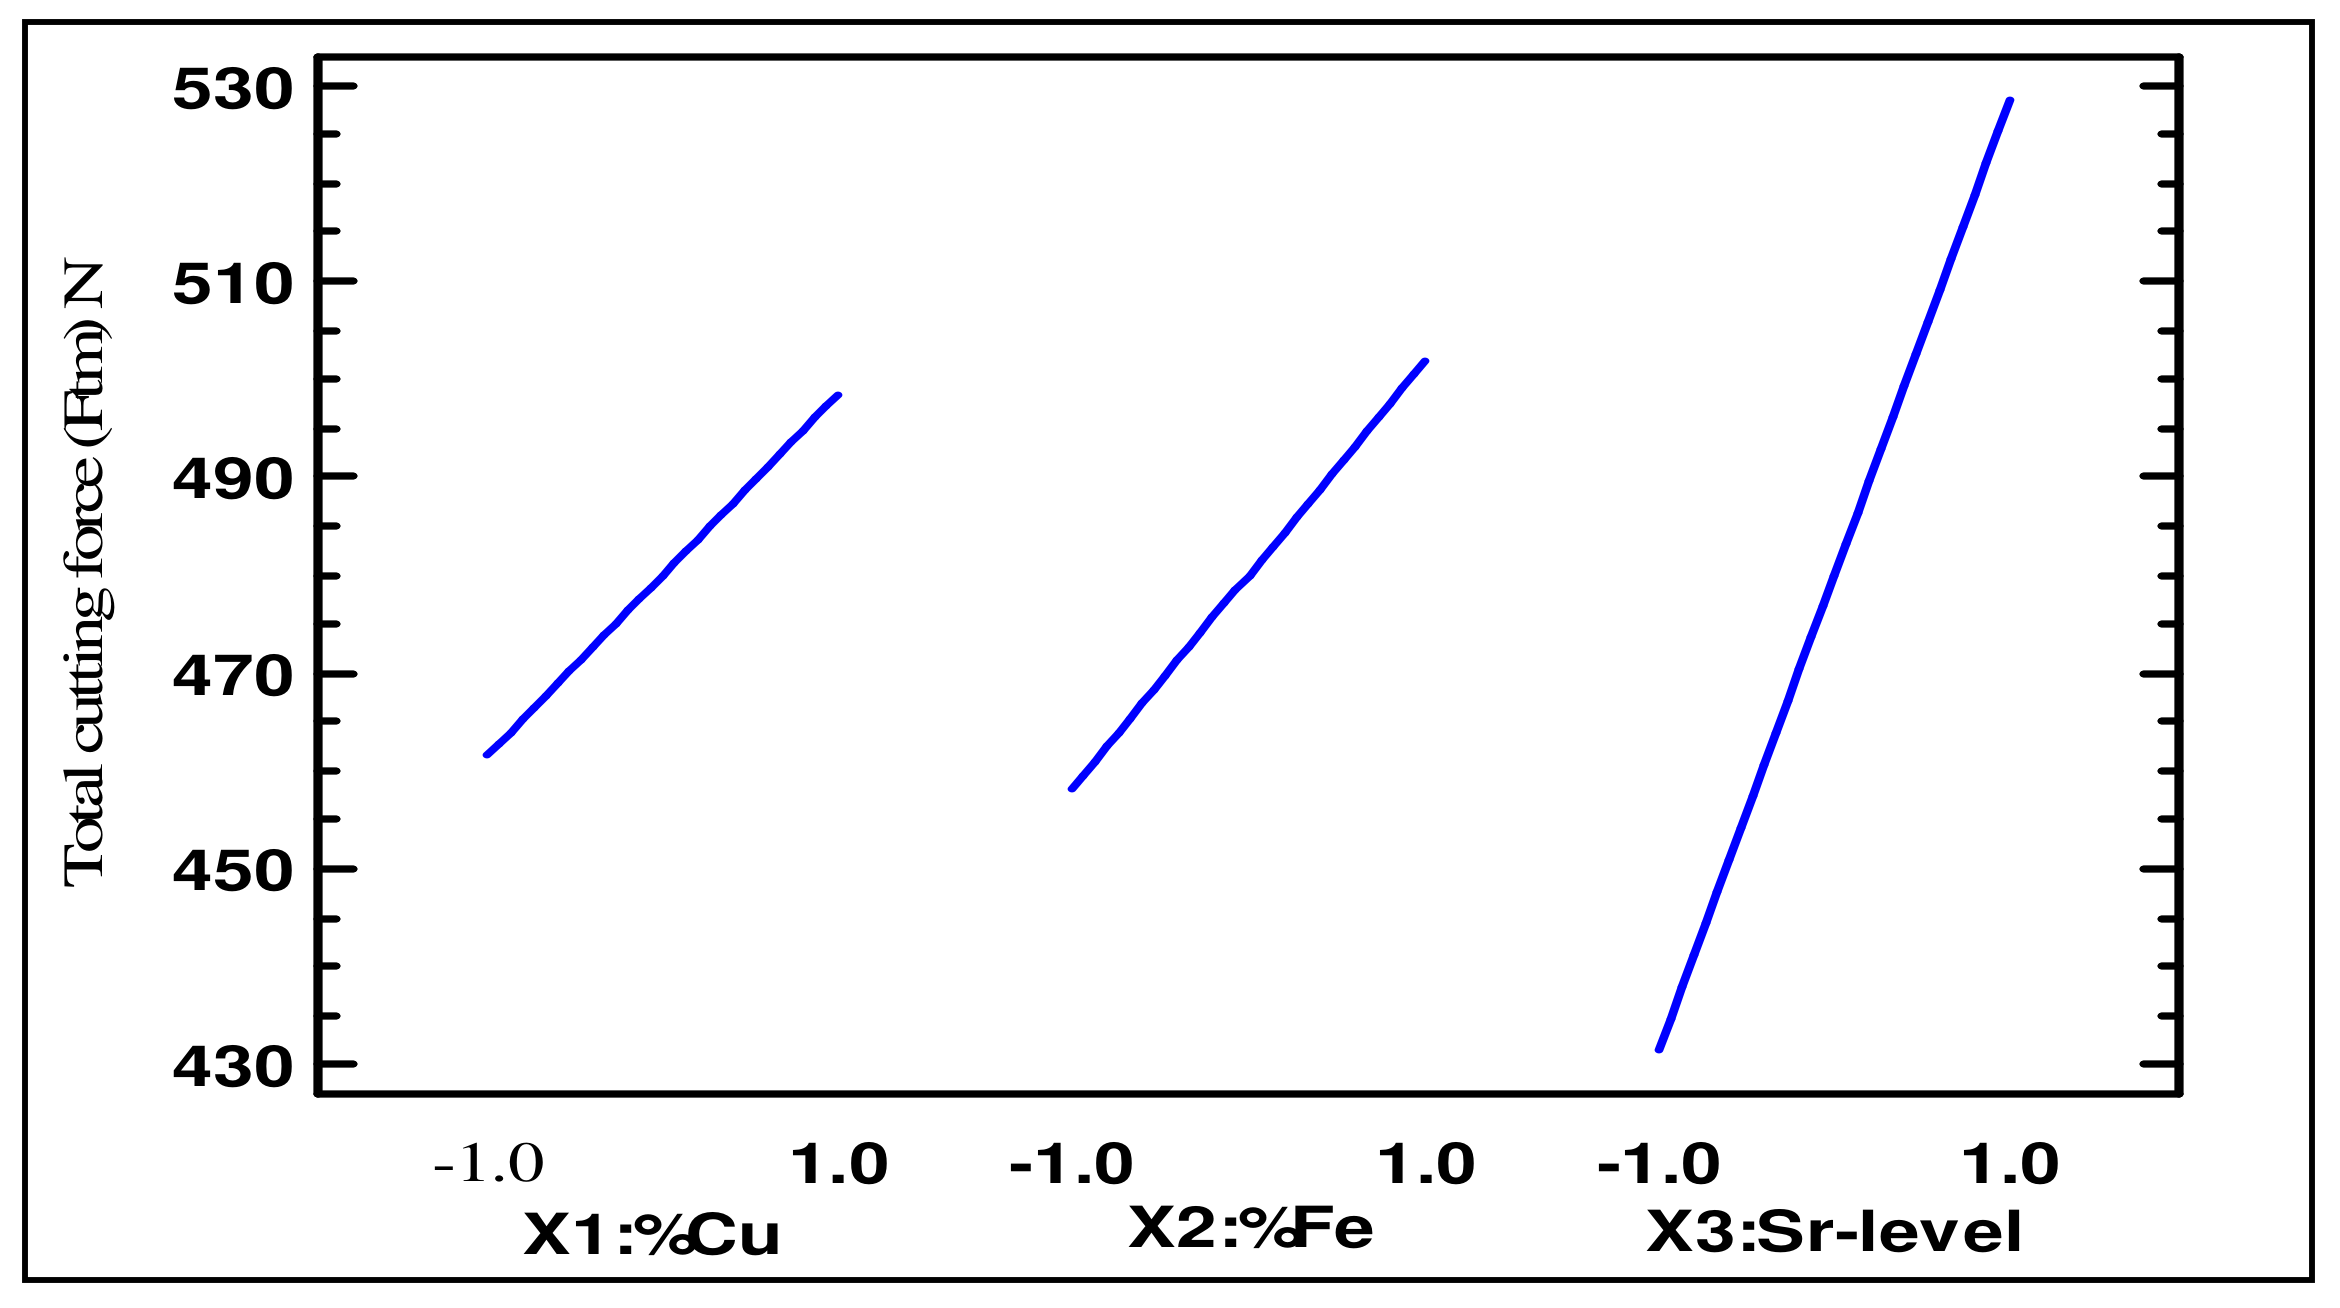
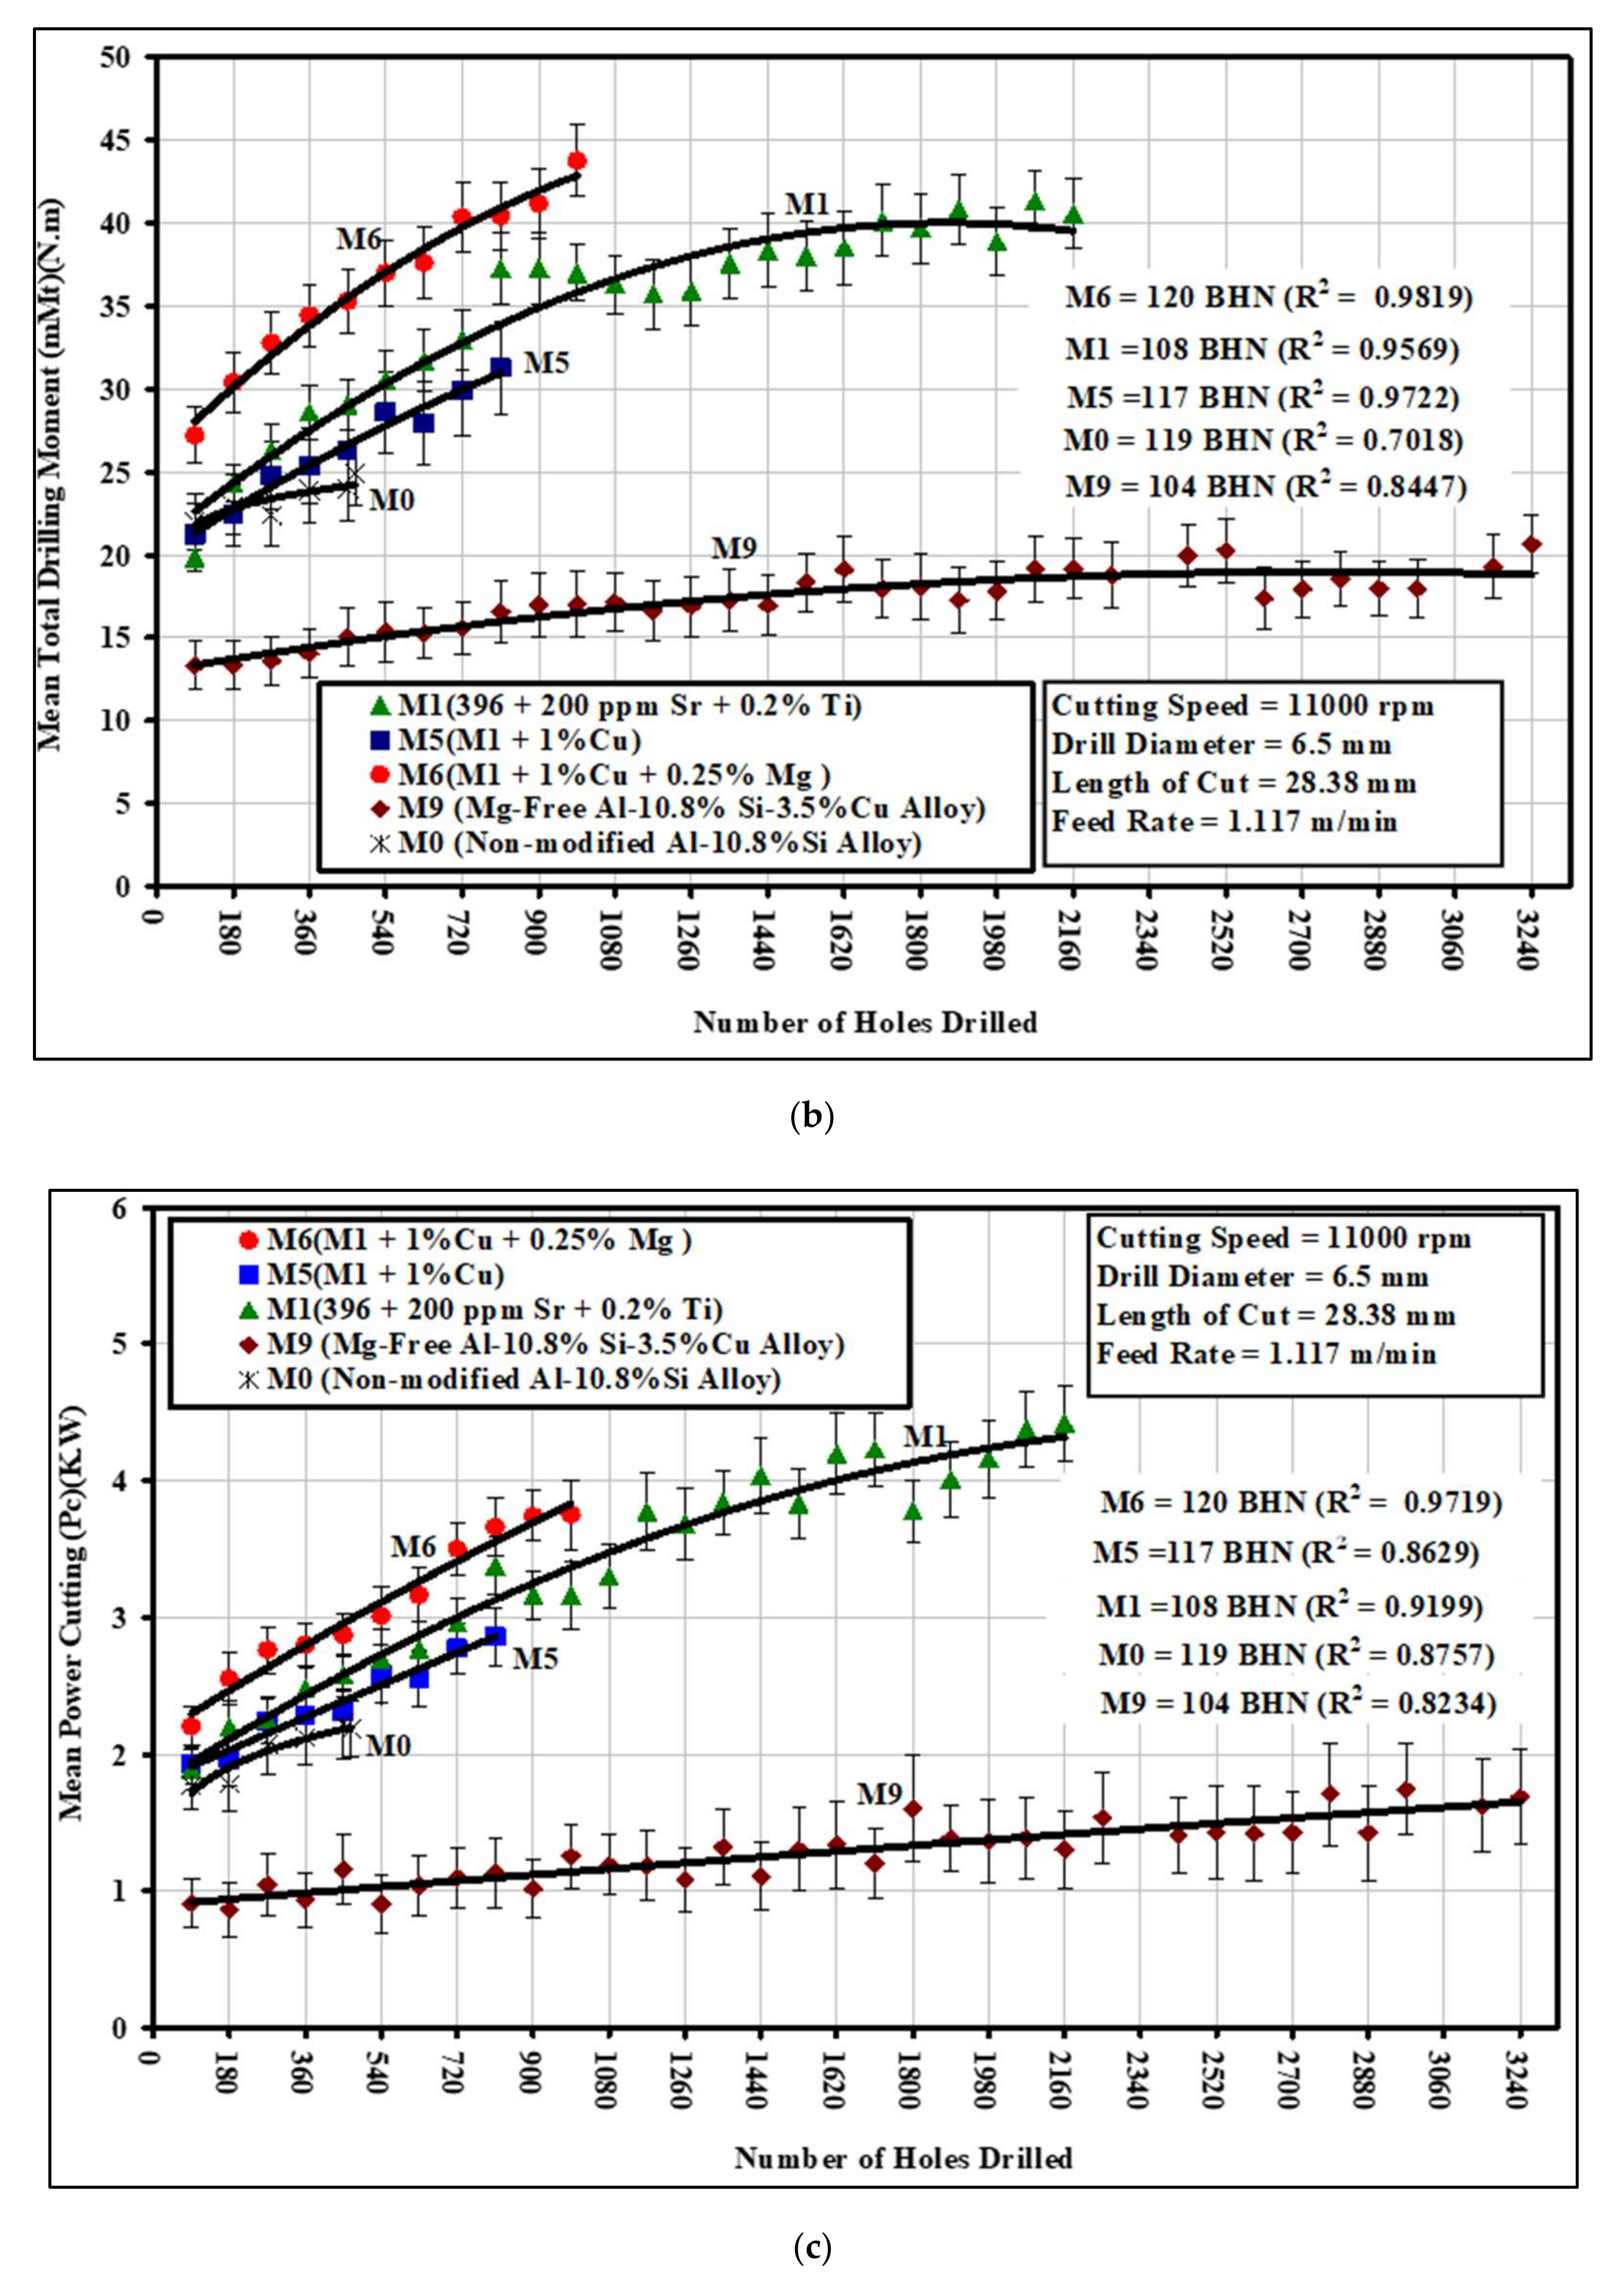
- The morphology of eutectic silicon in the Al–Si alloys has a major influence on the machining behavior. Through our analysis, we found that an increase in the Sr level had the greatest effect in terms of increasing the total cutting force and power values;
- 5.
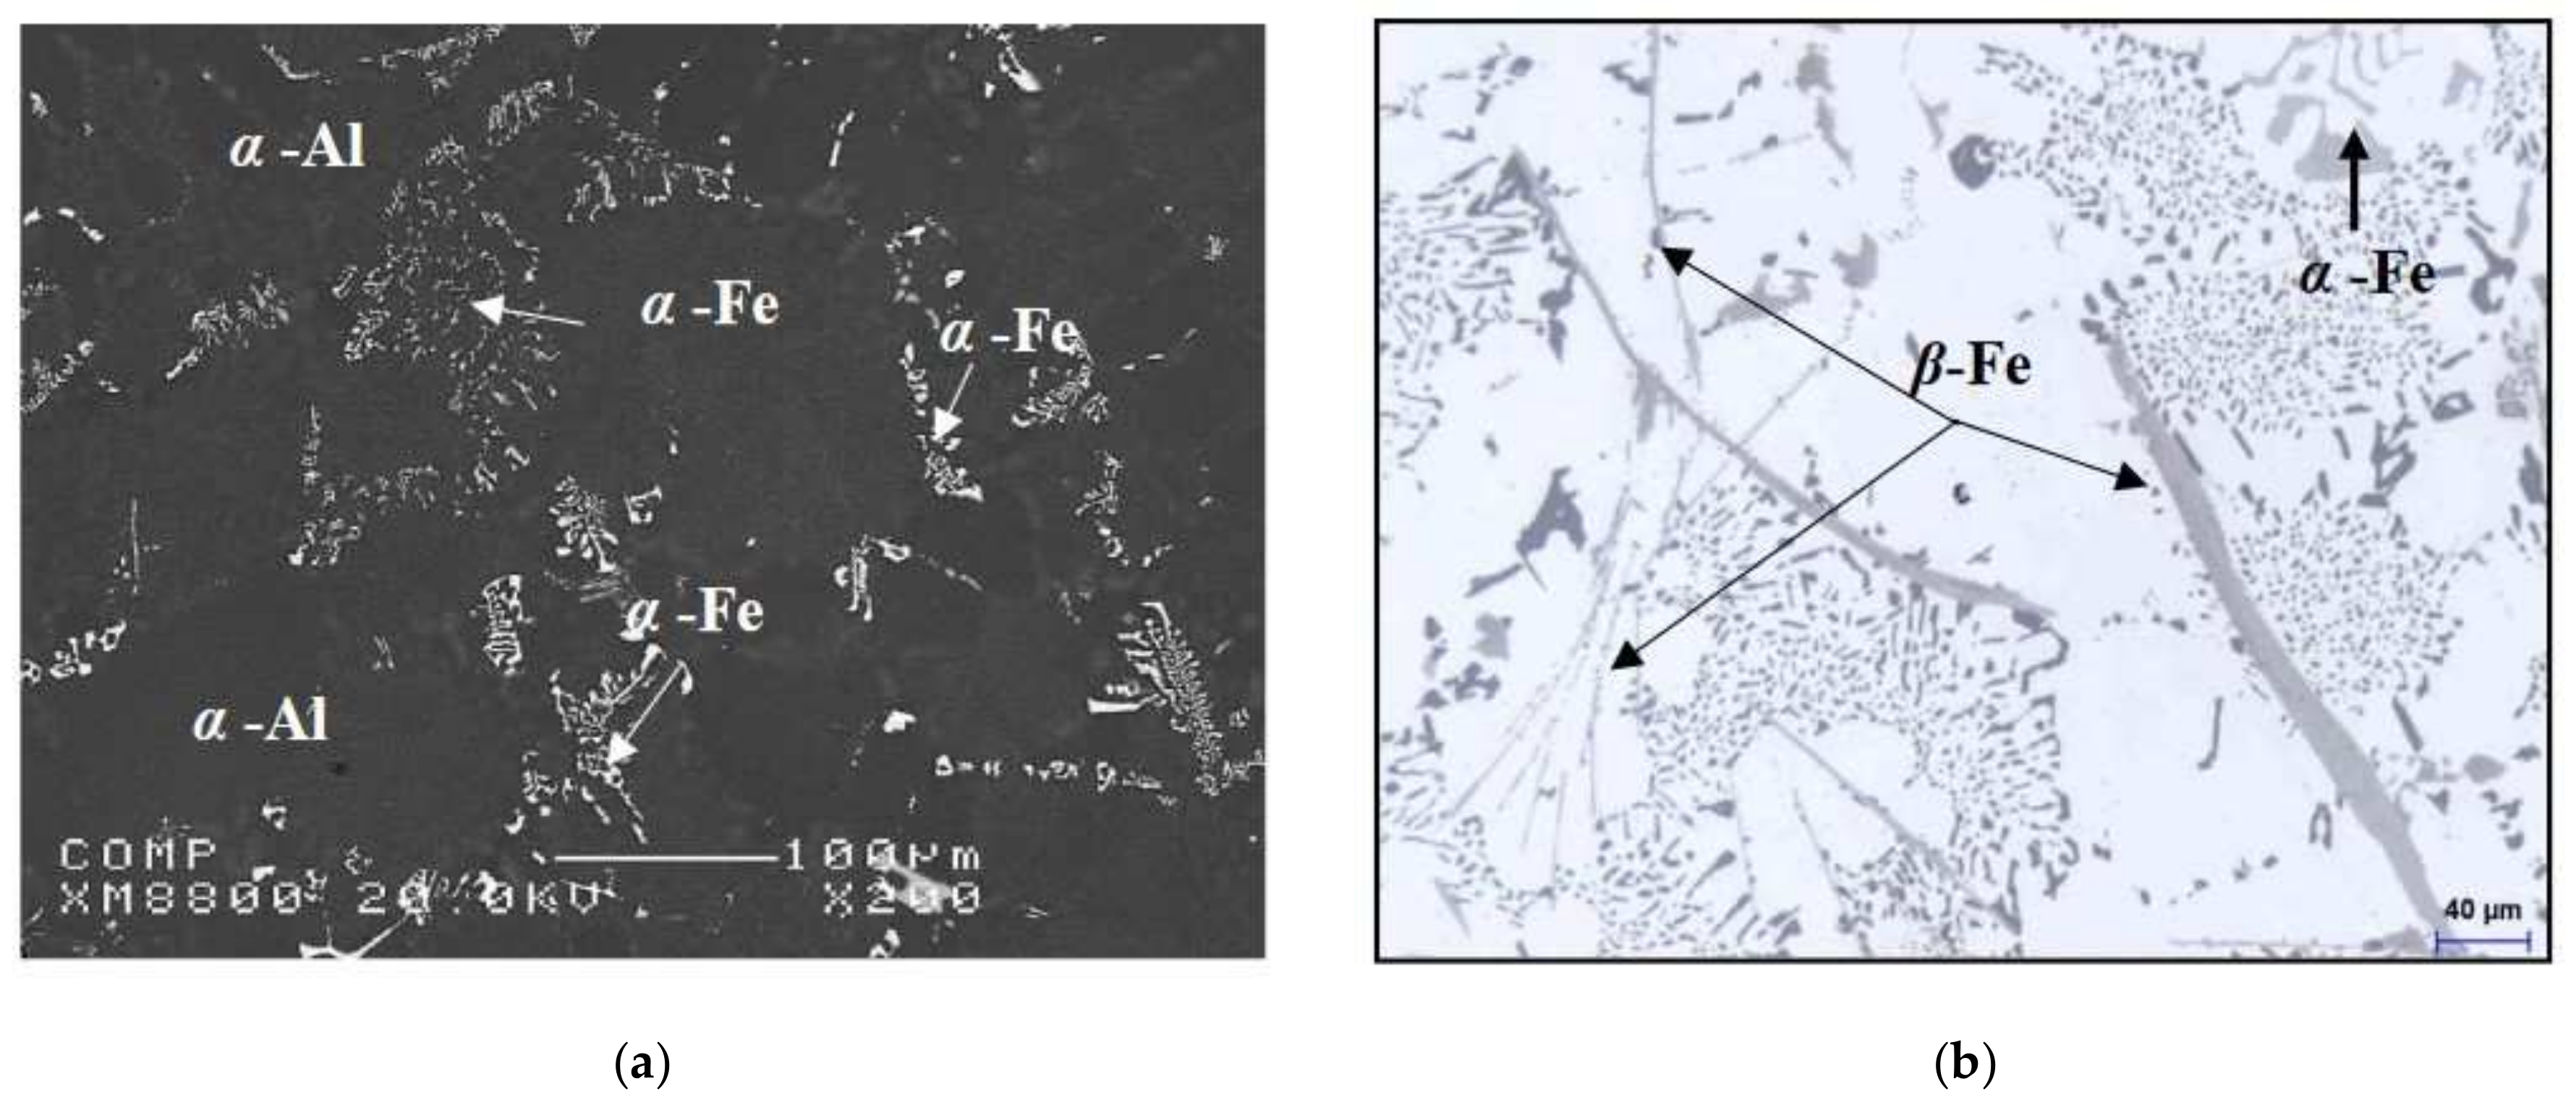
- The higher drilling force and power with an increased level of Cu and Fe may be attributed to an increase in the volume fraction of Cu- and Fe-intermetallics with an increase in the Cu and Fe content;
- 6.
- The presence of a number of binary interactions indicated the formation of various intermetallic compounds. Therefore, several interaction effects were present, and they may have had the most significant effect on the tool life. These interaction effects included those of the Cu content and Fe content (X1X2), the Cu content and Sr level (X1X3), and the Fe content and Sr level (X2X3);
- 7.
- The validity of the equation was checked and the results indicated that there was a close match between the properties obtained by performing random experiments and those calculated by means of the respective regression equations. The closeness of the match indicates that the equations were sufficiently accurate over the range of variables.
Author Contributions
Funding
Institutional Review Board Statement
Informed Consent Statement
Data Availability Statement
Conflicts of Interest
References
- Moustafa, M.A.; Samuel, F.H.; Doty, H.W. Effect of Solution Heat Treatment and Additives on the Microstructure of Al-Si (A413.1) Automotive Alloys. J. Mater. Sci. 2003, 38, 4507–4522. [Google Scholar] [CrossRef]
- Fracchia, E.; Gobber, F.S.; Rosso, M. Effect of Alloying Elements on the Sr Modification of Al-Si Cast Alloys. Metals 2021, 11, 342. [Google Scholar] [CrossRef]
- Alyaldin, L.; Abdelaziz, M.H.; Samuel, A.M.; Doty, H.W.; Samuel, F.H. Effect of Transition Metals Addition on Tensile Properties of Al–Si–Cu-Based Alloys at 25 °C and 250 °C: Role of Heat Treatment. Int. J. Met. 2021, 15, 60–75. [Google Scholar] [CrossRef]
- Grum, J.; Kisin, M. Influence of the Microstructure on Surface Integrity in Turning-Part II: The Influence of a Microstructure of the Workpiece Material on Cutting Forces. Int. J. Mach. Tools Manuf. 2003, 43, 1545–1551. [Google Scholar] [CrossRef]
- Samuel, E.; Samuel, A.M.; Doty, H.W.; Valtierra, S.; Samuel, F.H. Intermetallic phases in Al-Si based cast alloys: New perspective. Int. J. Cast Met. Res. 2014, 27, 107–114. [Google Scholar] [CrossRef]
- Zedan, Y.; Samuel, F.H.; Samuel, A.M.; Doty, H.W. Effects of Fe Intermetallics on the Machinability of Heat-Treated Al-(7–11) % Si Alloys. J. Mater. Process. Technol. 2010, 210, 245–257. [Google Scholar] [CrossRef]
- Pathak, B.N.; Shoo, K.L.; Mishra, M. Effect of Machining Parameters on Cutting Forces and Surface Roughness in Al-(1–2) Fe-1V-1Si Alloys. Mater. Manuf. Processes 2013, 28, 463–469. [Google Scholar] [CrossRef]
- Tavitas-Medrano, F.J.; Samuel, F.H.; Valtierra, S.; Doty, H.W. Artificial Aging Behavior of 319-Type Cast Aluminum Alloys with Mg and Sr Additions. AFS Trans. 2007, 115, 135–150. [Google Scholar]
- Tash, M.; Samuel, F.H.; Mucciardi, F.; Doty, H.W. Effect of Metallurgical Parameters on the Hardness and Microstructural Characterization of As-Cast and Heat-Treated 356 and 319 Aluminum Alloys. Mater. Sci. Eng. A 2007, 443, 185–201. [Google Scholar] [CrossRef]
- Barzani, M.M.; Sarhan, A.A.D.; Farahany, S.; Ramesh, S.; Maher, I. Investigating the Machinability of Al-Si–Cu cast alloy containing bismuth and antimony using coated carbide insert. Measurement 2015, 62, 170–178. [Google Scholar] [CrossRef]
- Guru, P.R.; Mohammad, F.K.; Panigrahi, S.K.; Ram, G.D.J. Enhancing strength, ductility and machinability of an Al–Si cast alloy by friction stir processing. J. Manuf. Processes 2015, 18, 67–74. [Google Scholar] [CrossRef]
- Fromentin, G.; Döbbeler, B.; Lung, D. Computerized Simulation of Interference in Thread Milling of Non-Symmetric Thread Profiles. Procedia CIRP 2015, 31, 496–501. [Google Scholar] [CrossRef]
- Major, J.; McLeod, A.; Rutter, J. Designed Experimentation: Microstructural Optimization of Al AA 512 for the PM Process and Its Possible Use as a Structural Diecasting. AFS Trans. 2000, 108, 287–296. [Google Scholar]
- Kaplan, Y.; Okay, Ş.; Motorcu, A.R.; Nalbant, M. Investigation of the effects of machining parameters on the thrust force and cutting, torque in the drilling of AISI D2 and AISI D3 cold work tool steels. Indian J. Eng. Mater. Sci. 2014, 21, 128–138. [Google Scholar]
- Karabulut, S. Study on Machining Parameters for Thrust Force and Torque in Milling AA7039 Composites Reinforced with Al2O3/B4C/SiC Particles. Int. J. Eng. Technol. 2016, 2, 68–75. [Google Scholar] [CrossRef]
- Khanna, N.; Davim, J.P. Design-of-experiments application in machining titanium alloys for aerospace structural components. Measurement 2015, 61, 280–290. [Google Scholar] [CrossRef]
- Ji, Z.; Yang, H.; Li, H. Predicting the effects of microstructural features on strain localization of a two-phase titanium alloy. Mater. Des. 2015, 87, 171–180. [Google Scholar] [CrossRef]
- Othman1, K.; Ghani, J.A.; Juri, A. Optimization of Tool Life and Surface Roughness for Hypereutectic Al-Si Alloys in Face Milling. J. Mech. Eng. 2020, 17, 27–44. [Google Scholar]
- Khorasani, A.M.; Yazdi, M.R.S.; Safizadeh, M.S. Tool Life Prediction in Face Milling Machining of 7075 Al by Using Artificial Neural Networks (ANN) and Taguchi Design of Experiment (DOE). Int. J. Eng. Technol. 2011, 3, 30. [Google Scholar] [CrossRef] [Green Version]
- Tash, M. Effect of Metallurgical Parameters on the Machining Behaviour of 356 and 319 Alloys. Ph.D. Thesis, Université du Québec à Chicoutimi, Chicoutimi, QC, Canada, 2006. [Google Scholar]
- Mohamed, A.M.A.; Samuel, A.M.; Samuel, F.H.; Doty, H.W. Influence of Additives on the Microstructure and Tensile Properties of Near-Eutectic Al-10.8%Si Cast Alloy. Mater. Des. 2009, 30, 3943–3957. [Google Scholar] [CrossRef]
- Mohamed, A.M.A.; Samuel, E.; Zedan, Y.; Samuel, A.M.; Doty, H.W.; Samuel, F.H. Intermetallics Formation during Solidification of Al-Si-Cu-Mg Cast Alloys. Materials 2022, 15, 1335. [Google Scholar] [CrossRef]
- Ojolo, S.J.; Ogunkomaiy, O. A study of effects of machining parameters on tool life. Int. J. Mater. Sci. Appl. 2014, 3, 183–199. [Google Scholar] [CrossRef] [Green Version]
- Zedan, Y.; Garza-Elizondo, G.H.; Tash, M.; Samuel, A.M.; Doty, H.W.; Songmene, V.; Samuel, F.H. Effect of intermetallics and drill materials on the machinability of Al-Si cast alloys. Materials 2022, 15, 916. [Google Scholar] [CrossRef]
- Zedan, Y.; Samuel, A.M.; Doty, H.W.; Songmene, V.; Samuel, F.H. Effects of Trace Elements on the Microstructural and Machinability Characteristics of Al-Si-Cu-Mg Castings. Materials 2022, 15, 377. [Google Scholar] [CrossRef]


| No. | Parameters | Notation | Unit | Level | |||
|---|---|---|---|---|---|---|---|
| Original | Coded | ||||||
| Low | High | Low | High | ||||
| 1 | % Copper (Cu)-content | X1 | wt% | 2.25 | 3.5 | −1 | 1 |
| 2 | % Iron (Fe)-content | X2 | wt% | 0.5 | 1 | −1 | 1 |
| 3 | Strontium (Sr)-level | X3 | ppm | 0 | 200 | −1 | 1 |
| Response Variable | Unit | Code |
|---|---|---|
| Hardness | BHN | Y1 |
| Yield stress (YS) | MPa | Y2 |
| Ultimate tensile strength (UTS) | MPa | Y3 |
| Elongation (El) | % | Y4 |
| Total cutting force (Ftm) | N | Y5 |
| Drilling power (Pc) | K.W | Y6 |
| Tool life | No. of holes | Y7 |
| Parameters | Drilling |
|---|---|
| Speed | 234.5 m/min or 11,000 rpm |
| Drill type | Solid carbide “K20” drills: 6.5 mm |
| Hole depth | Length of cut ≤ 4.5 × D (28.38 mm) |
| Feed rate | 1.117 m/min |
| Independent Variable | Response Variable | ||||||||||||
|---|---|---|---|---|---|---|---|---|---|---|---|---|---|
| Run | Coded Value | Original Value | Y1 (Hardness) | Y2 (Y.S) | Y3 (UTS) | Y4 (%El) | Y5 (Ftm) c | Y6 (Pc) c | Y7 (Tool Life) | ||||
| X1 | X2 | X3 | %Cu | %Fe | Sr | ||||||||
| 1 | −1 | −1 | −1 | 2.25 | 0.5 | NM a | 117 ± 4.55 | 346 ± 4.7 | 382 ± 2.96 | 0.66 ± 0.47 | 422 ± 7.87 | 2.3 ± 0.21 | 468 |
| 2 | 1 | −1 | −1 | 3.5 | 0.5 | NM | 113 ± 3.76 | 320.39 ± 3.34 | 380.61 ± 1.75 | 0.57 ± 0.14 | 420 ± 6.24 | 2 ± 0.14 | 800 |
| 3 | −1 | 1 | −1 | 2.25 | 1 | NM | 116 ± 3.45 | 330.11 ± 5.92 | 360.78 ± 2.36 | 0.54 ± 0.09 | 410 ± 17.9 | 1.91 ± 0.25 | 637 |
| 4 | 1 | 1 | −1 | 3.5 | 1 | NM | 110 ± 3.95 | 320.4 ± 6.13 | 339.5 ± 9.85 | 0.51 ± 0.02 | 460 ± 14.5 | 2.06 ± 0.24 | 1867 |
| 5 | −1 | −1 | 1 | 2.25 | 0.5 | M b | 108 ± 3.56 | 358.1 ± 1.55 | 394.04 ± 6.27 | 1.05 ± 0.12 | 490 ± 10.1 | 2.74 ± 0.21 | 2160 |
| 6 | 1 | −1 | 1 | 3.5 | 0.5 | M | 120 ± 3.19 | 355.94 ± 7.45 | 369.99 ± 8.54 | 0.72 ± 0.14 | 500 ± 13.5 | 2.85 ± 0.16 | 835 |
| 7 | −1 | 1 | 1 | 2.25 | 1 | M | 111 ± 4.39 | 326.84 ± 2.13 | 354.72 ± 4.86 | 0.81 ± 0.04 | 524 ± 17.1 | 3.1 ± 0.34 | 971 |
| 8 | 1 | 1 | 1 | 3.5 | 1 | M | 122 ± 4.45 | 392.7 ± 6.8 | 400.72 ± 6.8 | 0.63 ± 0.02 | 600 ± 17.9 | 3.01 ± 0.21 | 1011 |
| Response Variables | Coded | R2 | |
|---|---|---|---|
| Hardness | Y1 | 0.90997 | 0.85944 |
| Yield Stress (YS) | Y2 | 0.8068 | 0.6136 |
| Ultimate tensile strength (UTS) | Y3 | 0.9419 | 0.8839 |
| Elongation (El) | Y4 | 0.9479 | 0.895857 |
| Total cutting force (Ftm) | Y5 | 0.9352 | 0.87044 |
| Drilling power (Pc) | Y6 | 0.9152 | 0.830563 |
| Tool life | Y7 | 0.898129 | 0.796258 |
| Variables | Hardness BHN | YS MPa | UTS MPa | %El | Ftm (N) | Pc (Kw) | Tool Life | ||
|---|---|---|---|---|---|---|---|---|---|
| %Cu | %Fe | %Sr | Predicted Values | ||||||
| 2.35 | 0.70 | 0.02 | 118.838 | 405.92 | 439.136 | 0.5627 | 466 | 2.611 | 1527.67 |
| 2.5 | 0.9 | 0.02 | 119.016 | 418.91 | 451.739 | 0.5644 | 466.4 | 2.629 | 1699.19 |
| 2.45 | 0.5 | 0.02 | 119.072 | 398.65 | 432.493 | 0.5507 | 465.9 | 2.596 | 1404.47 |
| 3 | 0.6 | 0 | 119.7 | 414.2 | 449.2 | 0.531 | 463.5 | 2.603 | 1584.56 |
| Variables | Hardness BHN | YS MPa | UTS MPa | %El | Ftm (N) | Pc (Kw) | Tool Life | ||
|---|---|---|---|---|---|---|---|---|---|
| %Cu | %Fe | %Sr | Experimental Values | ||||||
| 2.35 | 0.70 | 0.02 | 115 ± 3.19 | 351.6 ± 2.75 | 390.5 ± 5.7 | 0.89 ± 0.15 | 488 ± 7.78 | 2.26 ± 0.2 | 1620 |
| 2.5 | 0.9 | 0.02 | 117 ± 3.95 | 320.4 ± 12.7 | 339 ± 9.85 | 0.51 ± 0.02 | 437 ± 6.24 | 2.08 ± 0.2 | 1867 |
| 2.45 | 0.5 | 0.02 | 110 ± 1.3 | 335.75 ± 5.76 | 371.7 ± 6.5 | 0.68 ± 0.13 | 401 ± 10.1 | 1.46 ± 0.2 | 1512 |
| 3.00 | 0.6 | 0 | 120 ± 3.45 | 346.11 ± 5.92 | 382.7 ± 2.36 | 0.84 ± 0.16 | 422 ± 13.5 | 2.3 ± 0.5 | 900 |
| Source | Sum of Squares | DOF | Mean Square | Estimate Effects (%) | F-Ratio | p-Value | Remark |
|---|---|---|---|---|---|---|---|
| X1:%Cu | 400.0 | 1 | 400.0 | 20 | 400.00 | 0.0000 | Significant |
| X2:%Fe | 110.25 | 1 | 110.25 | 10.5 | 110.25 | 0.0000 | Significant |
| X3:Sr-level | 240.25 | 1 | 240.25 | 15.5 | 240.25 | 0.0000 | Significant |
| X1X2 | 1193.7 | 1 | 1193.7 | 34.55 | 1193.70 | 0.0000 | Significant |
| X1X3 | 131.103 | 1 | 131.103 | 11.45 | 131.10 | 0.0000 | Significant |
| X2X3 | 64.8025 | 1 | 64.8025 | −8.05 | 64.80 | 0.0000 | Significant |
| Total error | 1.33554 × 10⁻¹⁰ | 0 | |||||
| External sigma | 1.0 | ||||||
| Total (corr.) | 3671.69 | 6 |
| Source | Sum of Squares | DOF | Mean Square | Estimate Effects | F-Ratio | p-Value | Remark |
|---|---|---|---|---|---|---|---|
| X1:%Cu | 1369.0 | 1 | 1369.0 | 37.0 | 1369.00 | 0.0000 | Significant |
| X2:%Fe | 1936.0 | 1 | 1936.0 | 44.0 | 1936.00 | 0.0000 | Significant |
| X3:Sr-level | 9409.0 | 1 | 9409.0 | 97.0 | 9409.00 | 0.0000 | Significant |
| X1X2 | 1089.0 | 1 | 1089.0 | 33.0 | 1089.00 | 0.0000 | Significant |
| X1X3 | 36.0 | 1 | 36.0 | 6.0 | 36.00 | 0.0000 | Significant |
| X2X3 | 529.0 | 1 | 529.0 | 23.0 | 529.00 | 0.0000 | Significant |
| Total error | 1.16529 × 10⁻¹⁰ | 0 | |||||
| External sigma | 1.0 | ||||||
| Total (corr.) | 28,694.9 | 6 |
| Source | Sum of Squares | DOF | Mean Square | Estimate Effects | F-Ratio | p-Value | Remark |
|---|---|---|---|---|---|---|---|
| X1:%Cu | 34,596.0 | 1 | 34,596.0 | 186.0 | 34,596.00 | 0.0000 | Significant |
| X2:%Fe | 29,756.2 | 1 | 29,756.2 | 172.0 | 29,756.25 | 0.0000 | Significant |
| X3:Sr-level | 34,040.3 | 1 | 34,040.3 | 184.0 | 34,040.25 | 0.0000 | Significant |
| X1X2 | 465,806.0 | 1 | 465,806.0 | 682.5 | 465,806.25 | 0.0000 | Significant |
| X1X3 | 686,412.0 | 1 | 686,412.0 | −828.5 | 686,412.25 | 0.0000 | Significant |
| X2X3 | 461,041.0 | 1 | 461,041.0 | −679.0 | 461,041.00 | 0.0000 | Significant |
| Total error | 5.82077 × 10⁻¹⁰ | 0 | |||||
| External sigma | 1.0 | ||||||
| Total (corr.) | 1.82659 × 10⁻⁶ | 6 |
Publisher’s Note: MDPI stays neutral with regard to jurisdictional claims in published maps and institutional affiliations. |
© 2022 by the authors. Licensee MDPI, Basel, Switzerland. This article is an open access article distributed under the terms and conditions of the Creative Commons Attribution (CC BY) license (https://creativecommons.org/licenses/by/4.0/).
Share and Cite
Zedan, Y.; Songmene, V.; Samuel, A.M.; Samuel, F.H.; Doty, H.W. Assessment of the Influence of Additives on the Mechanical Properties and Machinability of Al-11%Si Cast Alloys: Application of DOE and ANOVA Methods. Materials 2022, 15, 3297. https://doi.org/10.3390/ma15093297
Zedan Y, Songmene V, Samuel AM, Samuel FH, Doty HW. Assessment of the Influence of Additives on the Mechanical Properties and Machinability of Al-11%Si Cast Alloys: Application of DOE and ANOVA Methods. Materials. 2022; 15(9):3297. https://doi.org/10.3390/ma15093297
Chicago/Turabian StyleZedan, Yasser, Victor Songmene, Agnes M. Samuel, Fawzy H. Samuel, and Herbert W. Doty. 2022. "Assessment of the Influence of Additives on the Mechanical Properties and Machinability of Al-11%Si Cast Alloys: Application of DOE and ANOVA Methods" Materials 15, no. 9: 3297. https://doi.org/10.3390/ma15093297
APA StyleZedan, Y., Songmene, V., Samuel, A. M., Samuel, F. H., & Doty, H. W. (2022). Assessment of the Influence of Additives on the Mechanical Properties and Machinability of Al-11%Si Cast Alloys: Application of DOE and ANOVA Methods. Materials, 15(9), 3297. https://doi.org/10.3390/ma15093297