
Characterization of Si and SiO2 in Dust Emitted during Granite Polishing as a Function of Cutting Conditions


Abstract
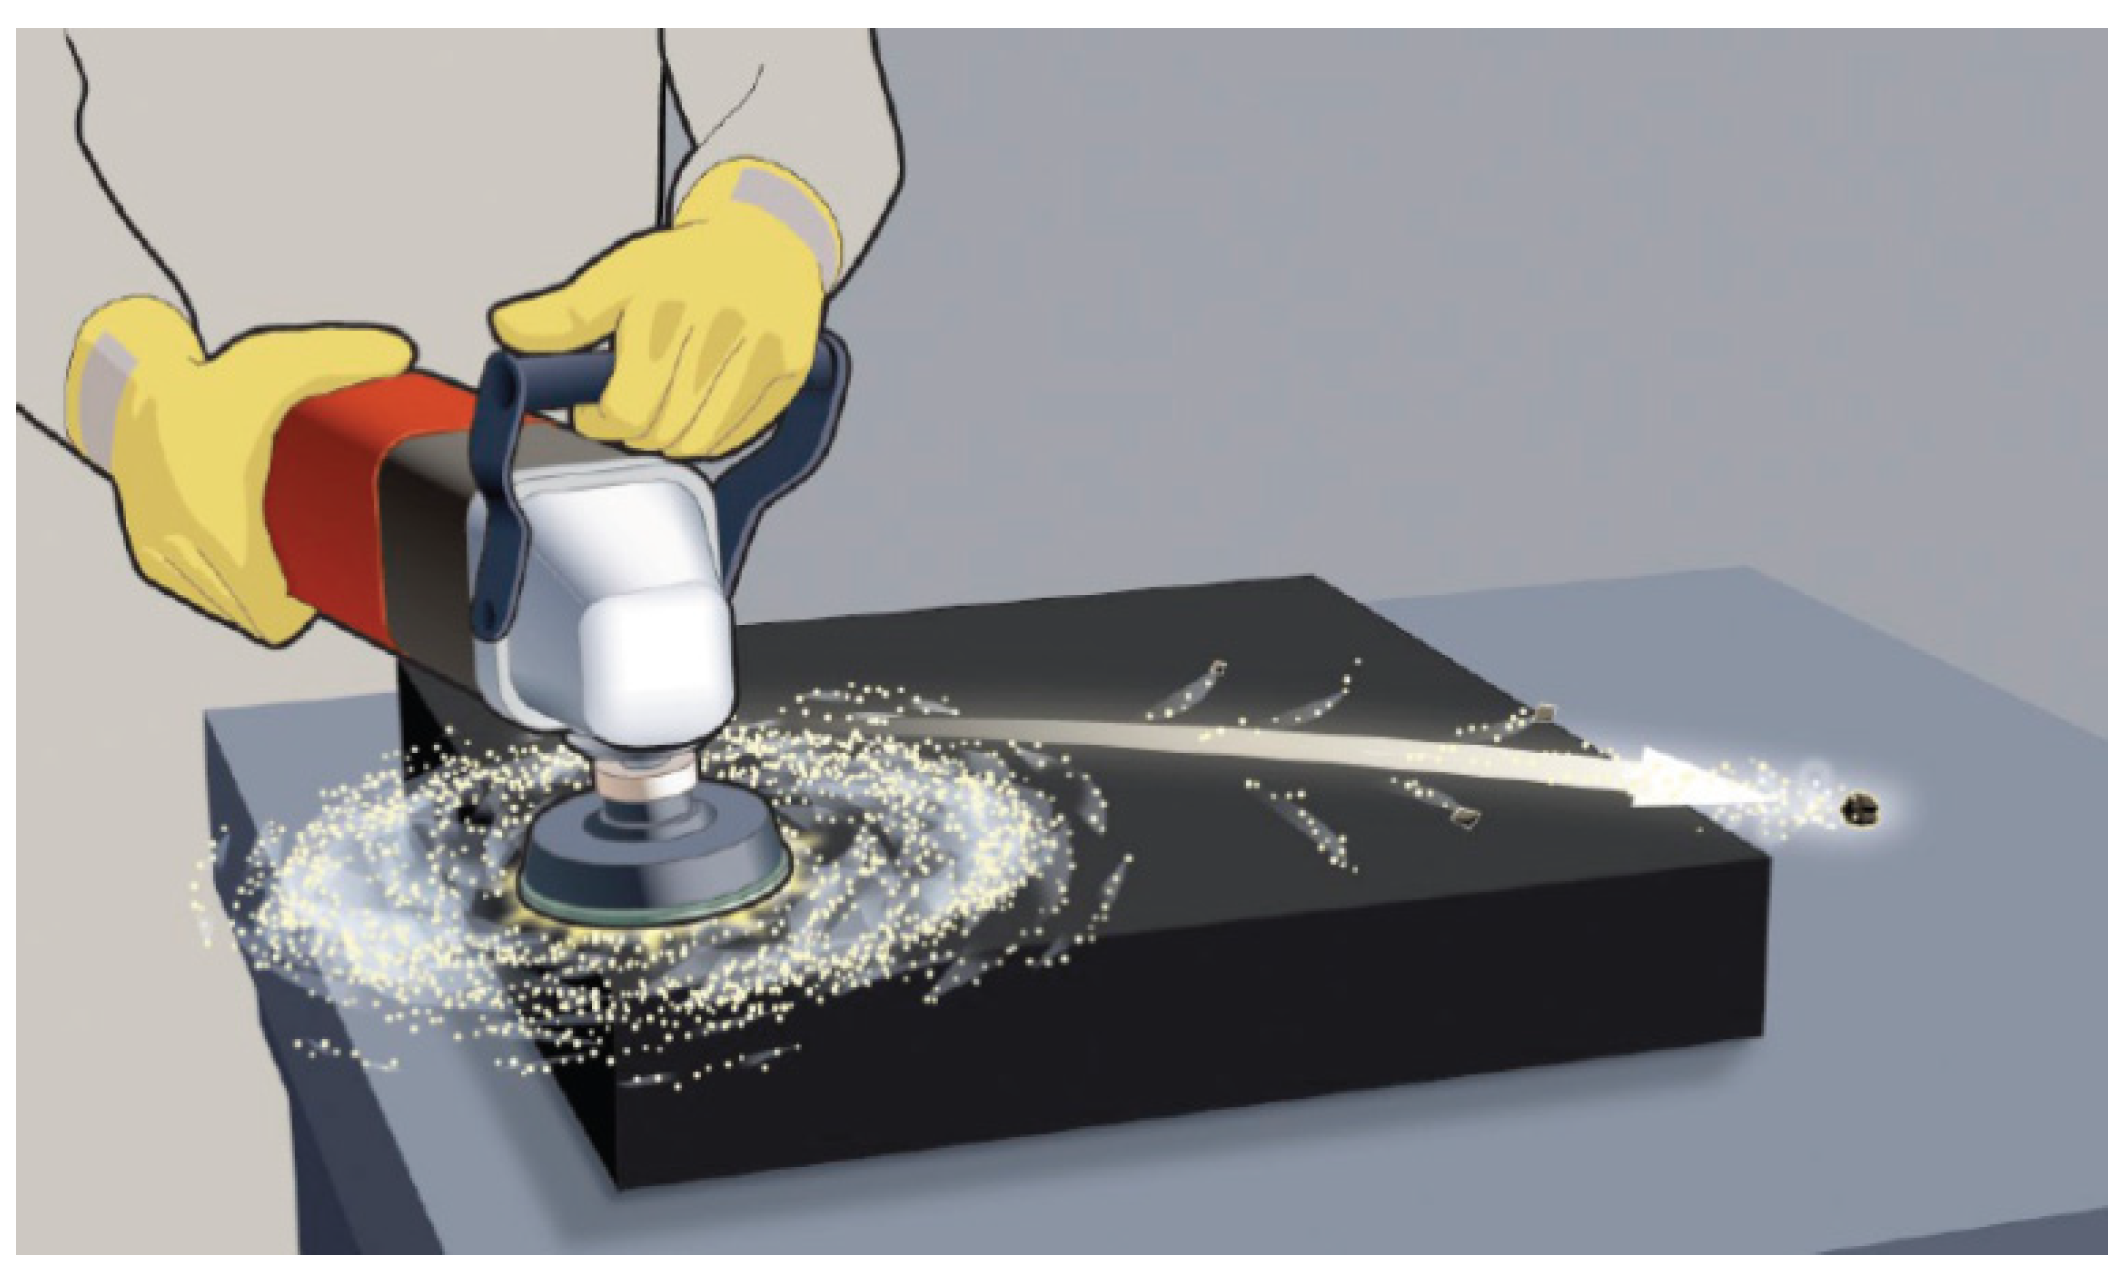
:1. Introduction
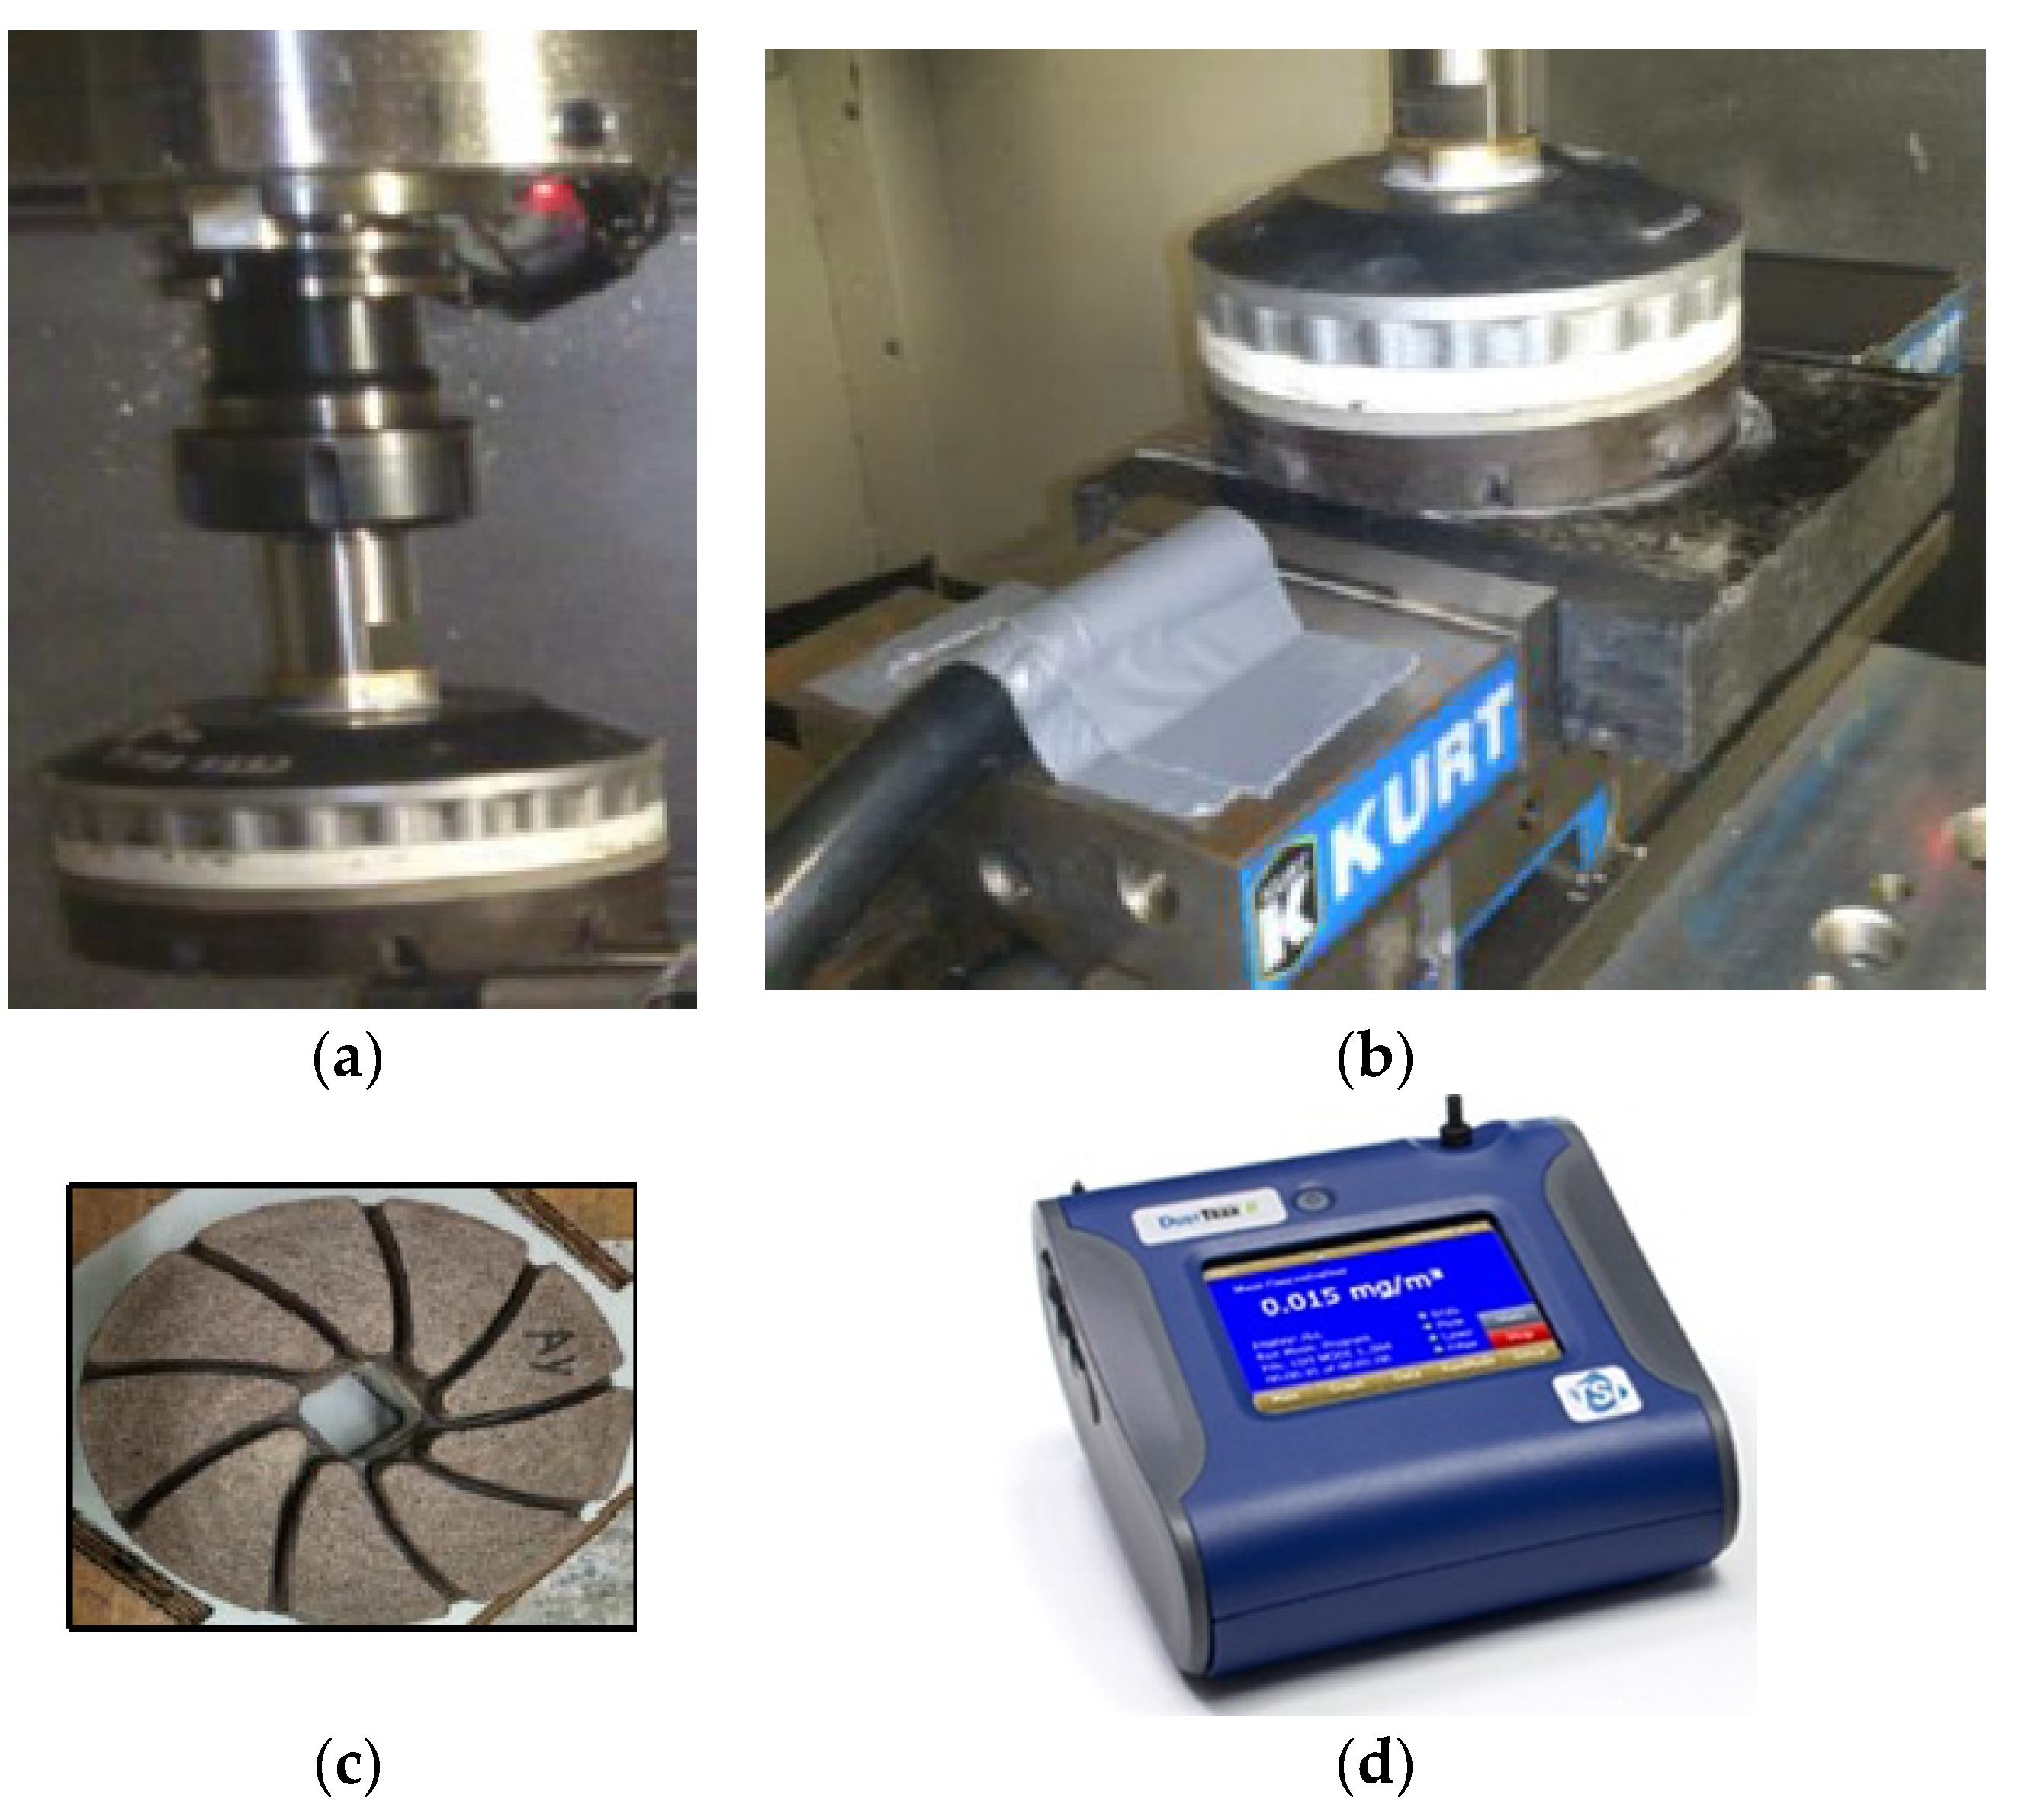
2. Materials and Methods
- Reception of workpieces from A. Lacroix Granit, Saint-Sébastien, QC, Canada;
- SEM and petrographic characterization of samples;
- Sample preparation (polishing using grit 45);
- Experimental tests using different polishing speeds and feed rates;
- Collection of polishing granite residues, using filters installed in TSI DustTrak Aerosol Monitor instrument;
- SEM characterization of granite residues;
- EDX characterization of granite residues;
- X-ray diffraction analysis of granite residues to compare phases grain sizes.
- Polishing speeds: 250–2500 rpm
- Feed rate: 254–2032 mm/min
- Pressure: 0.2 bar
- Abrasive grit: 45, 60 and 100
3. Results and Discussion
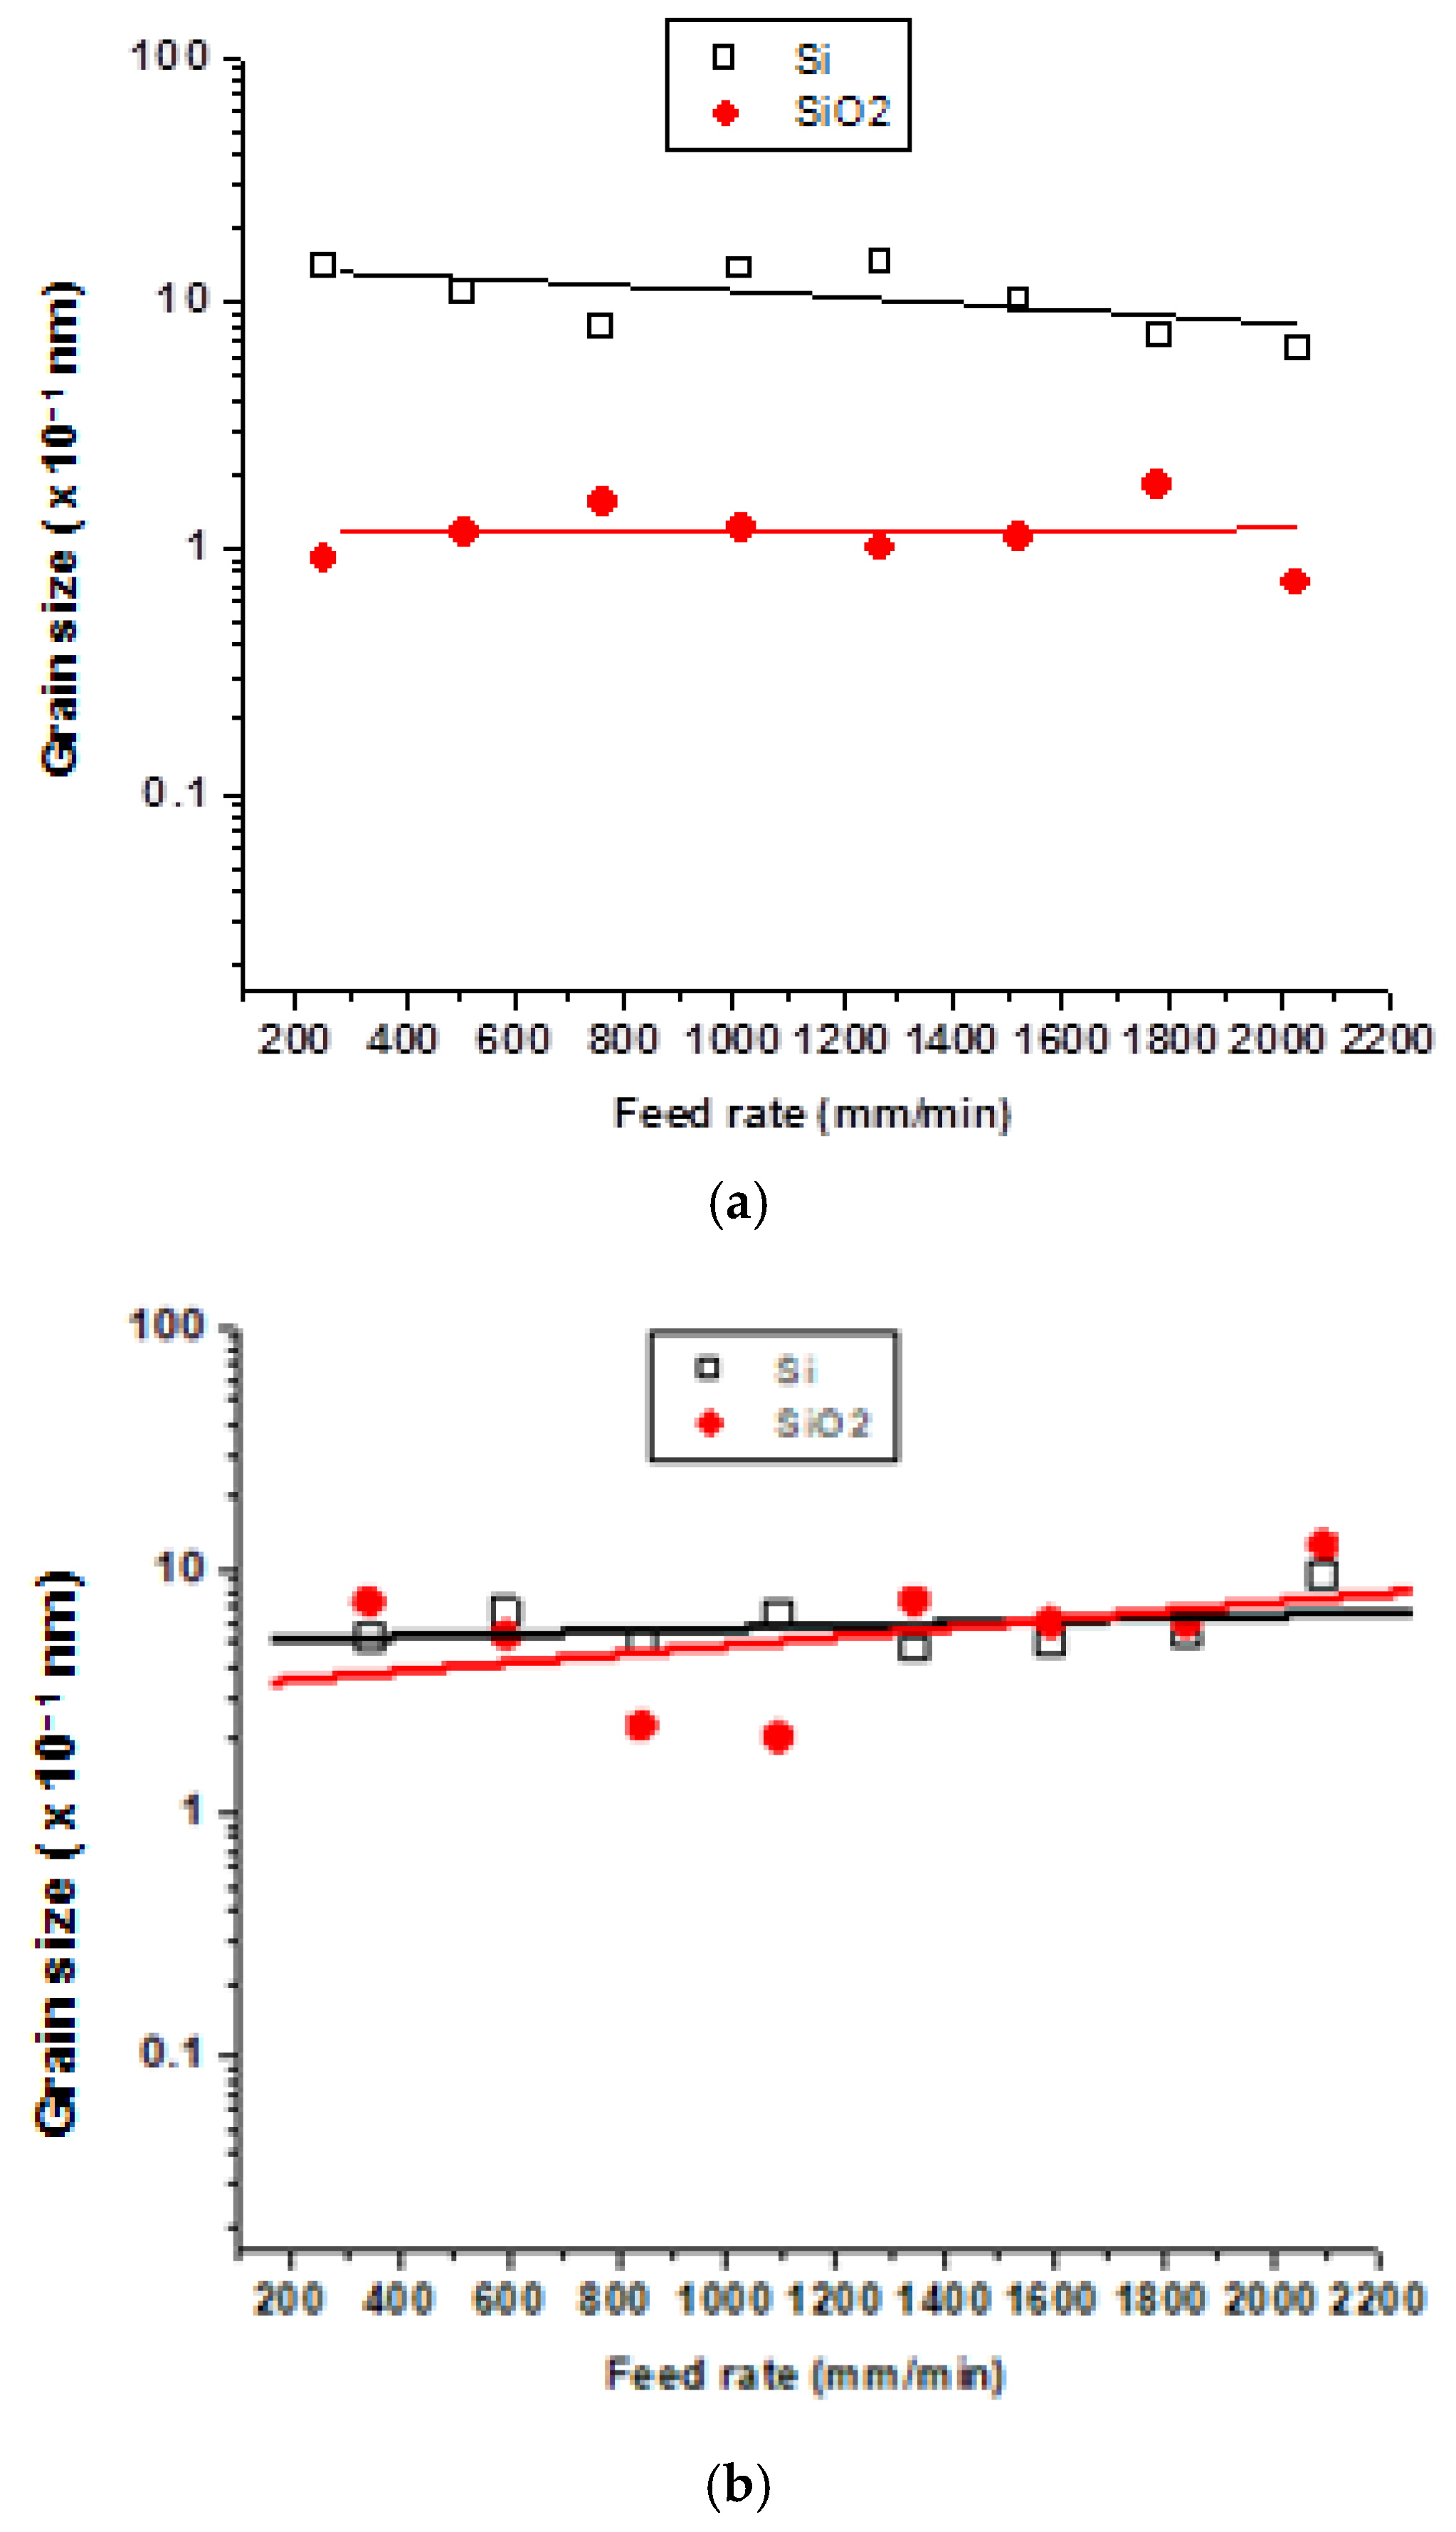
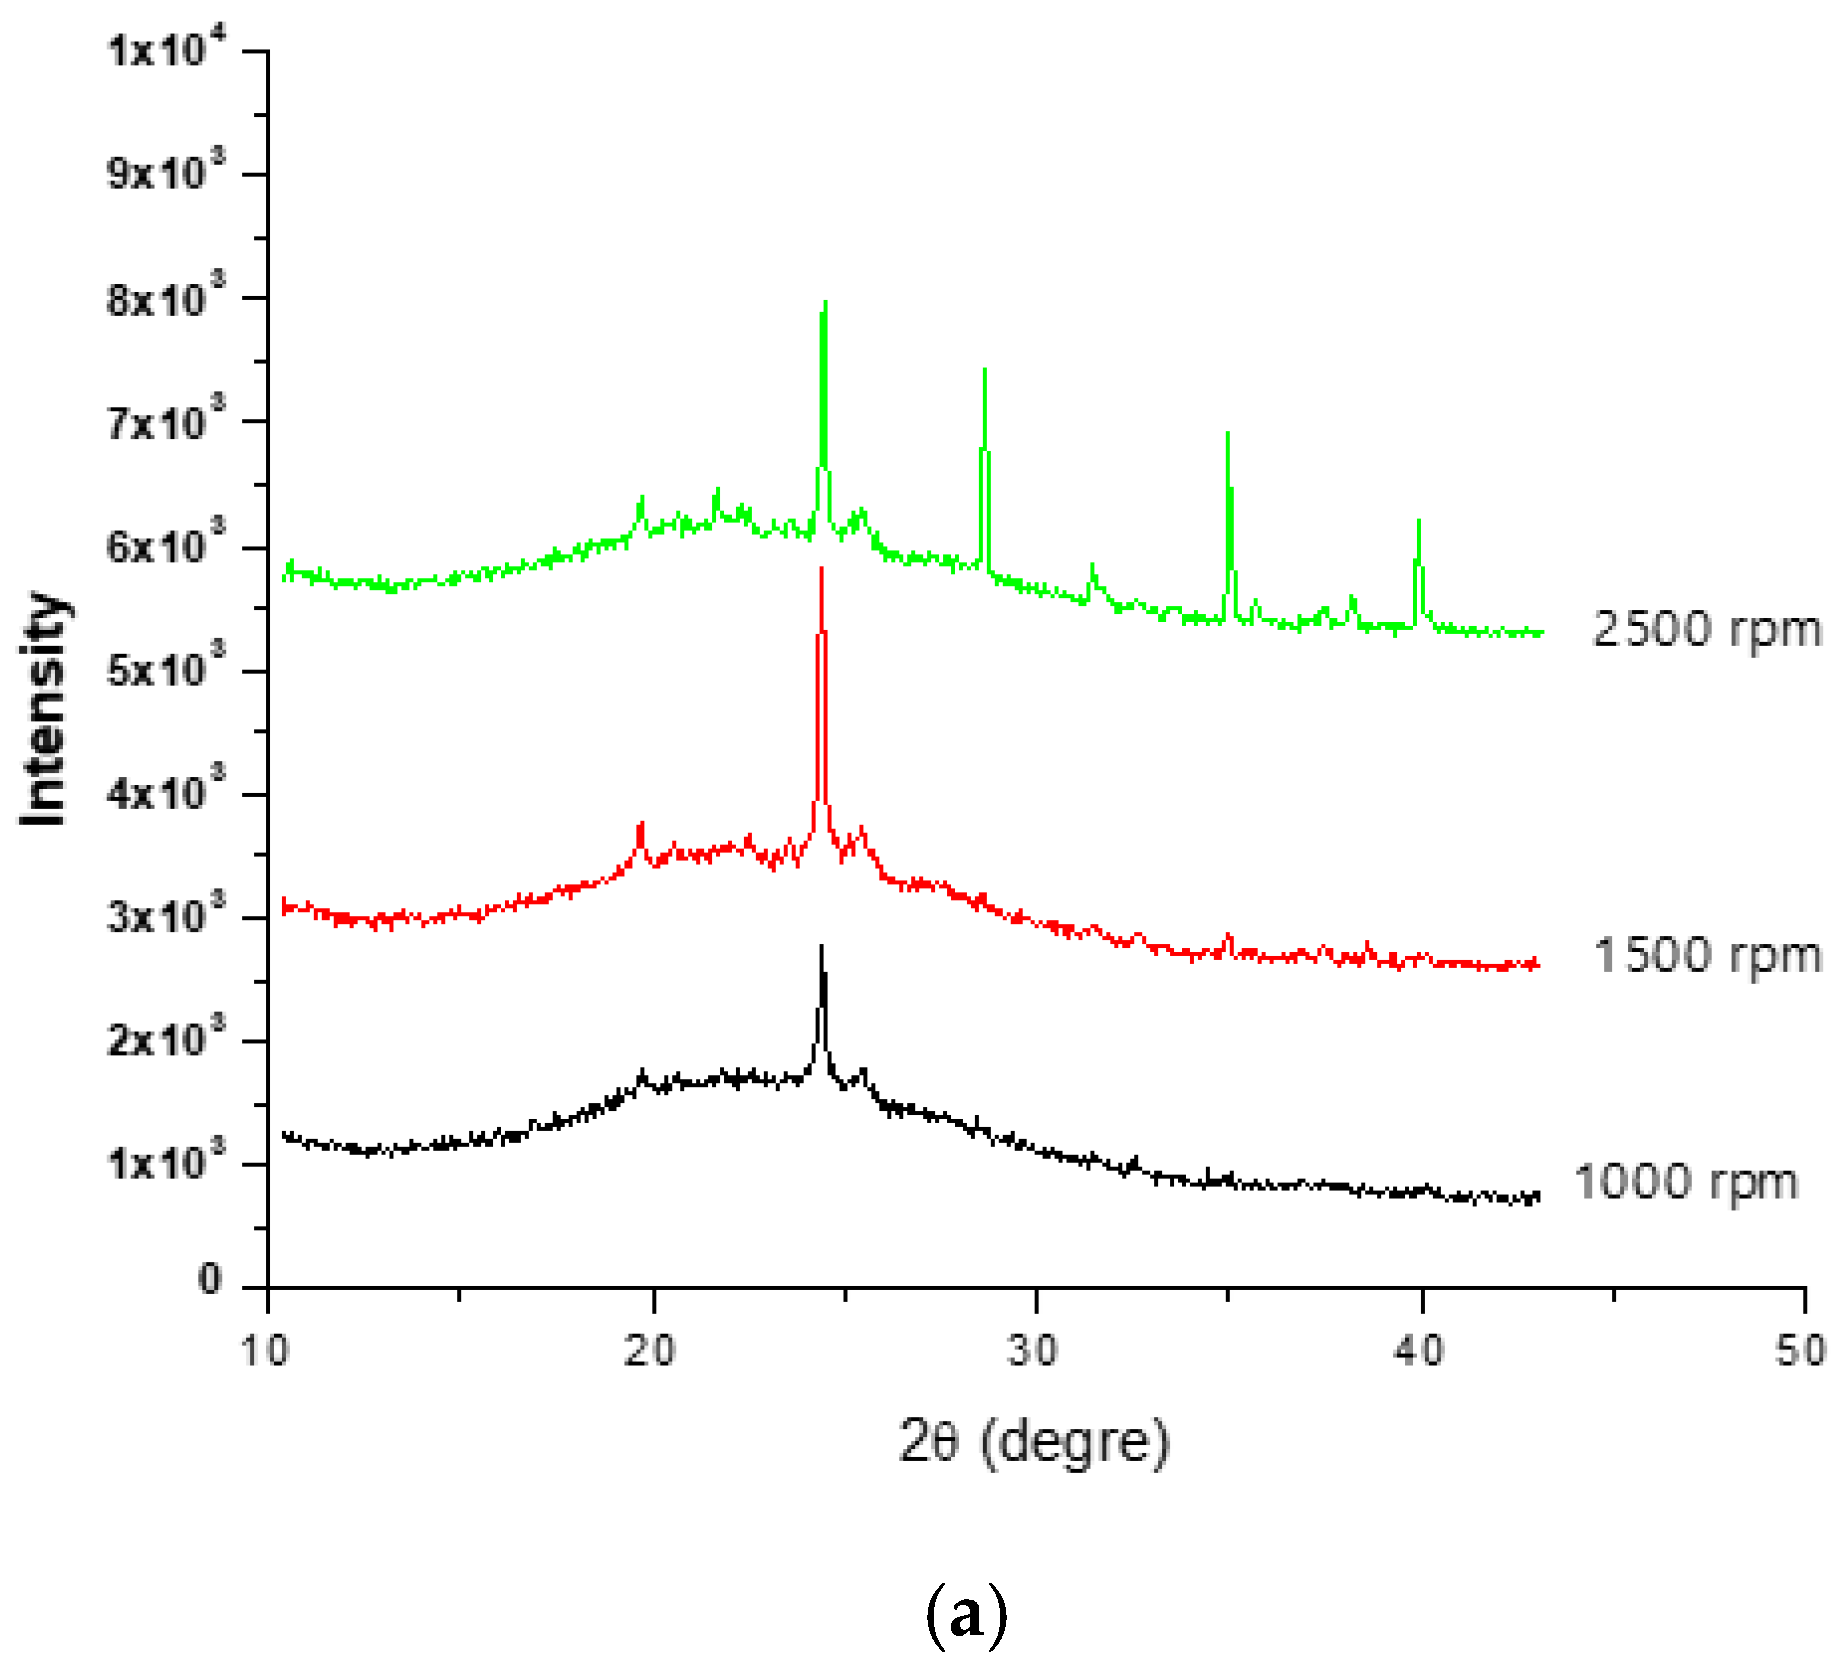
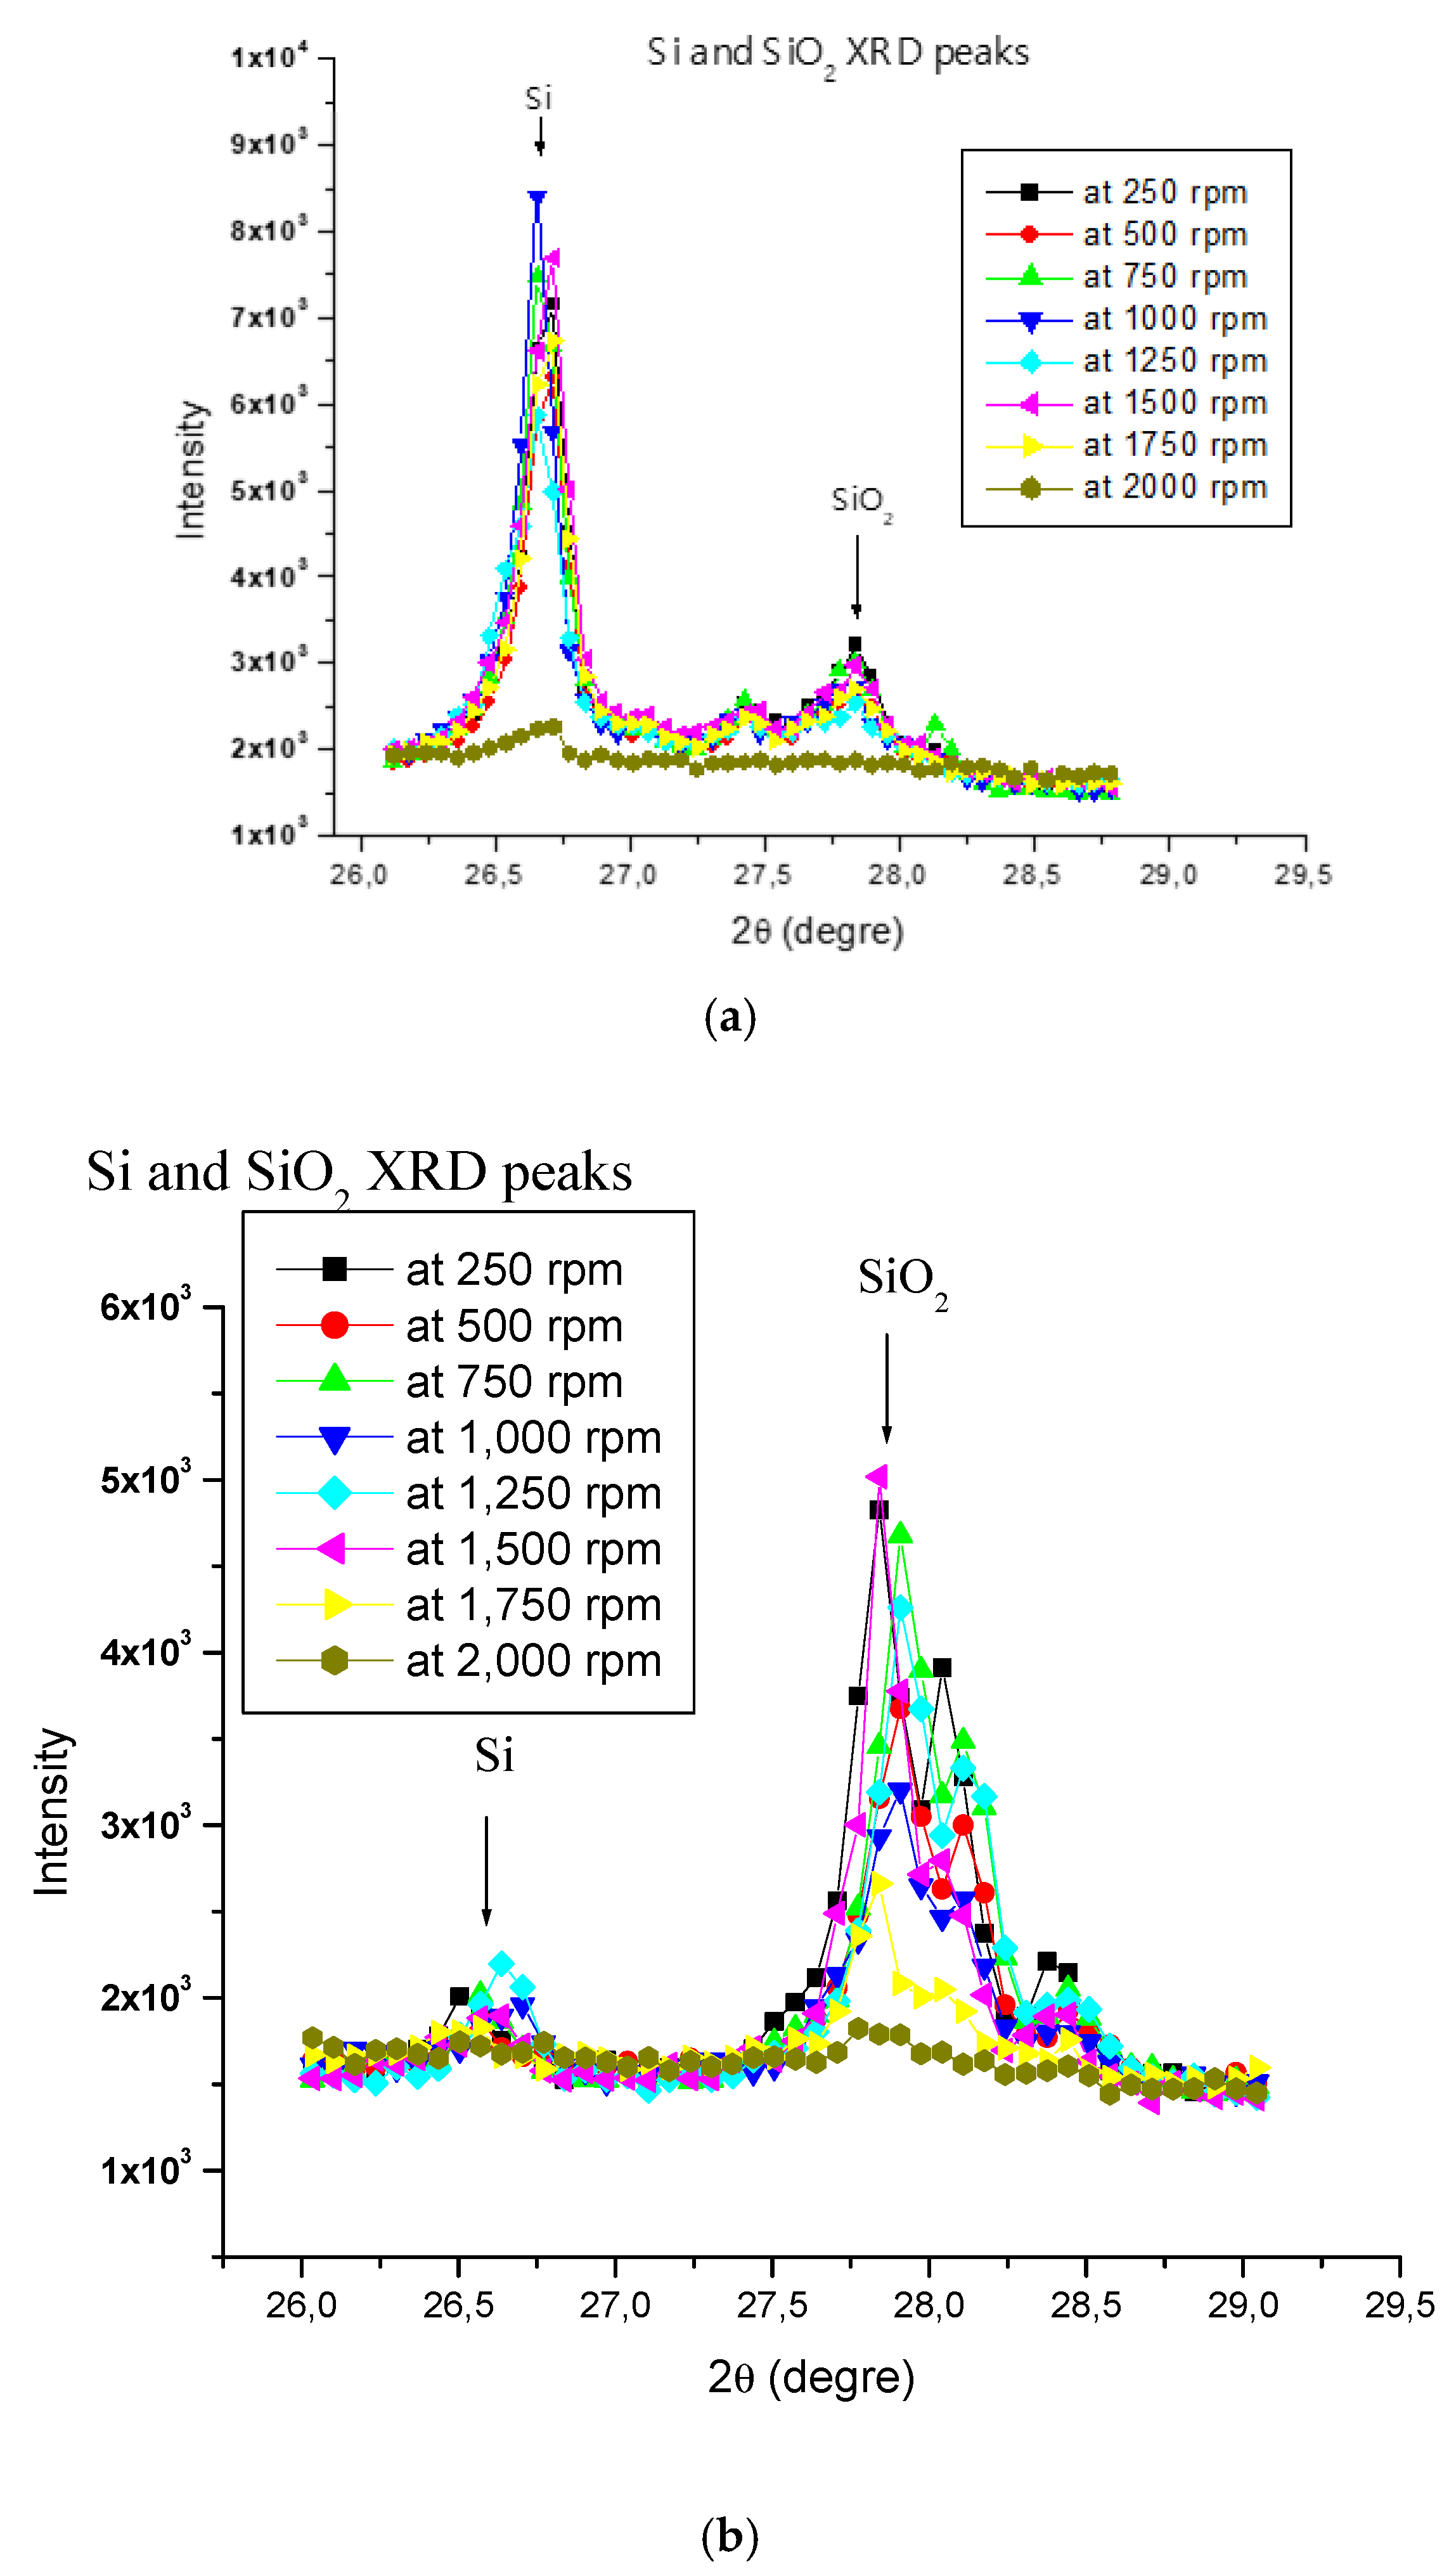
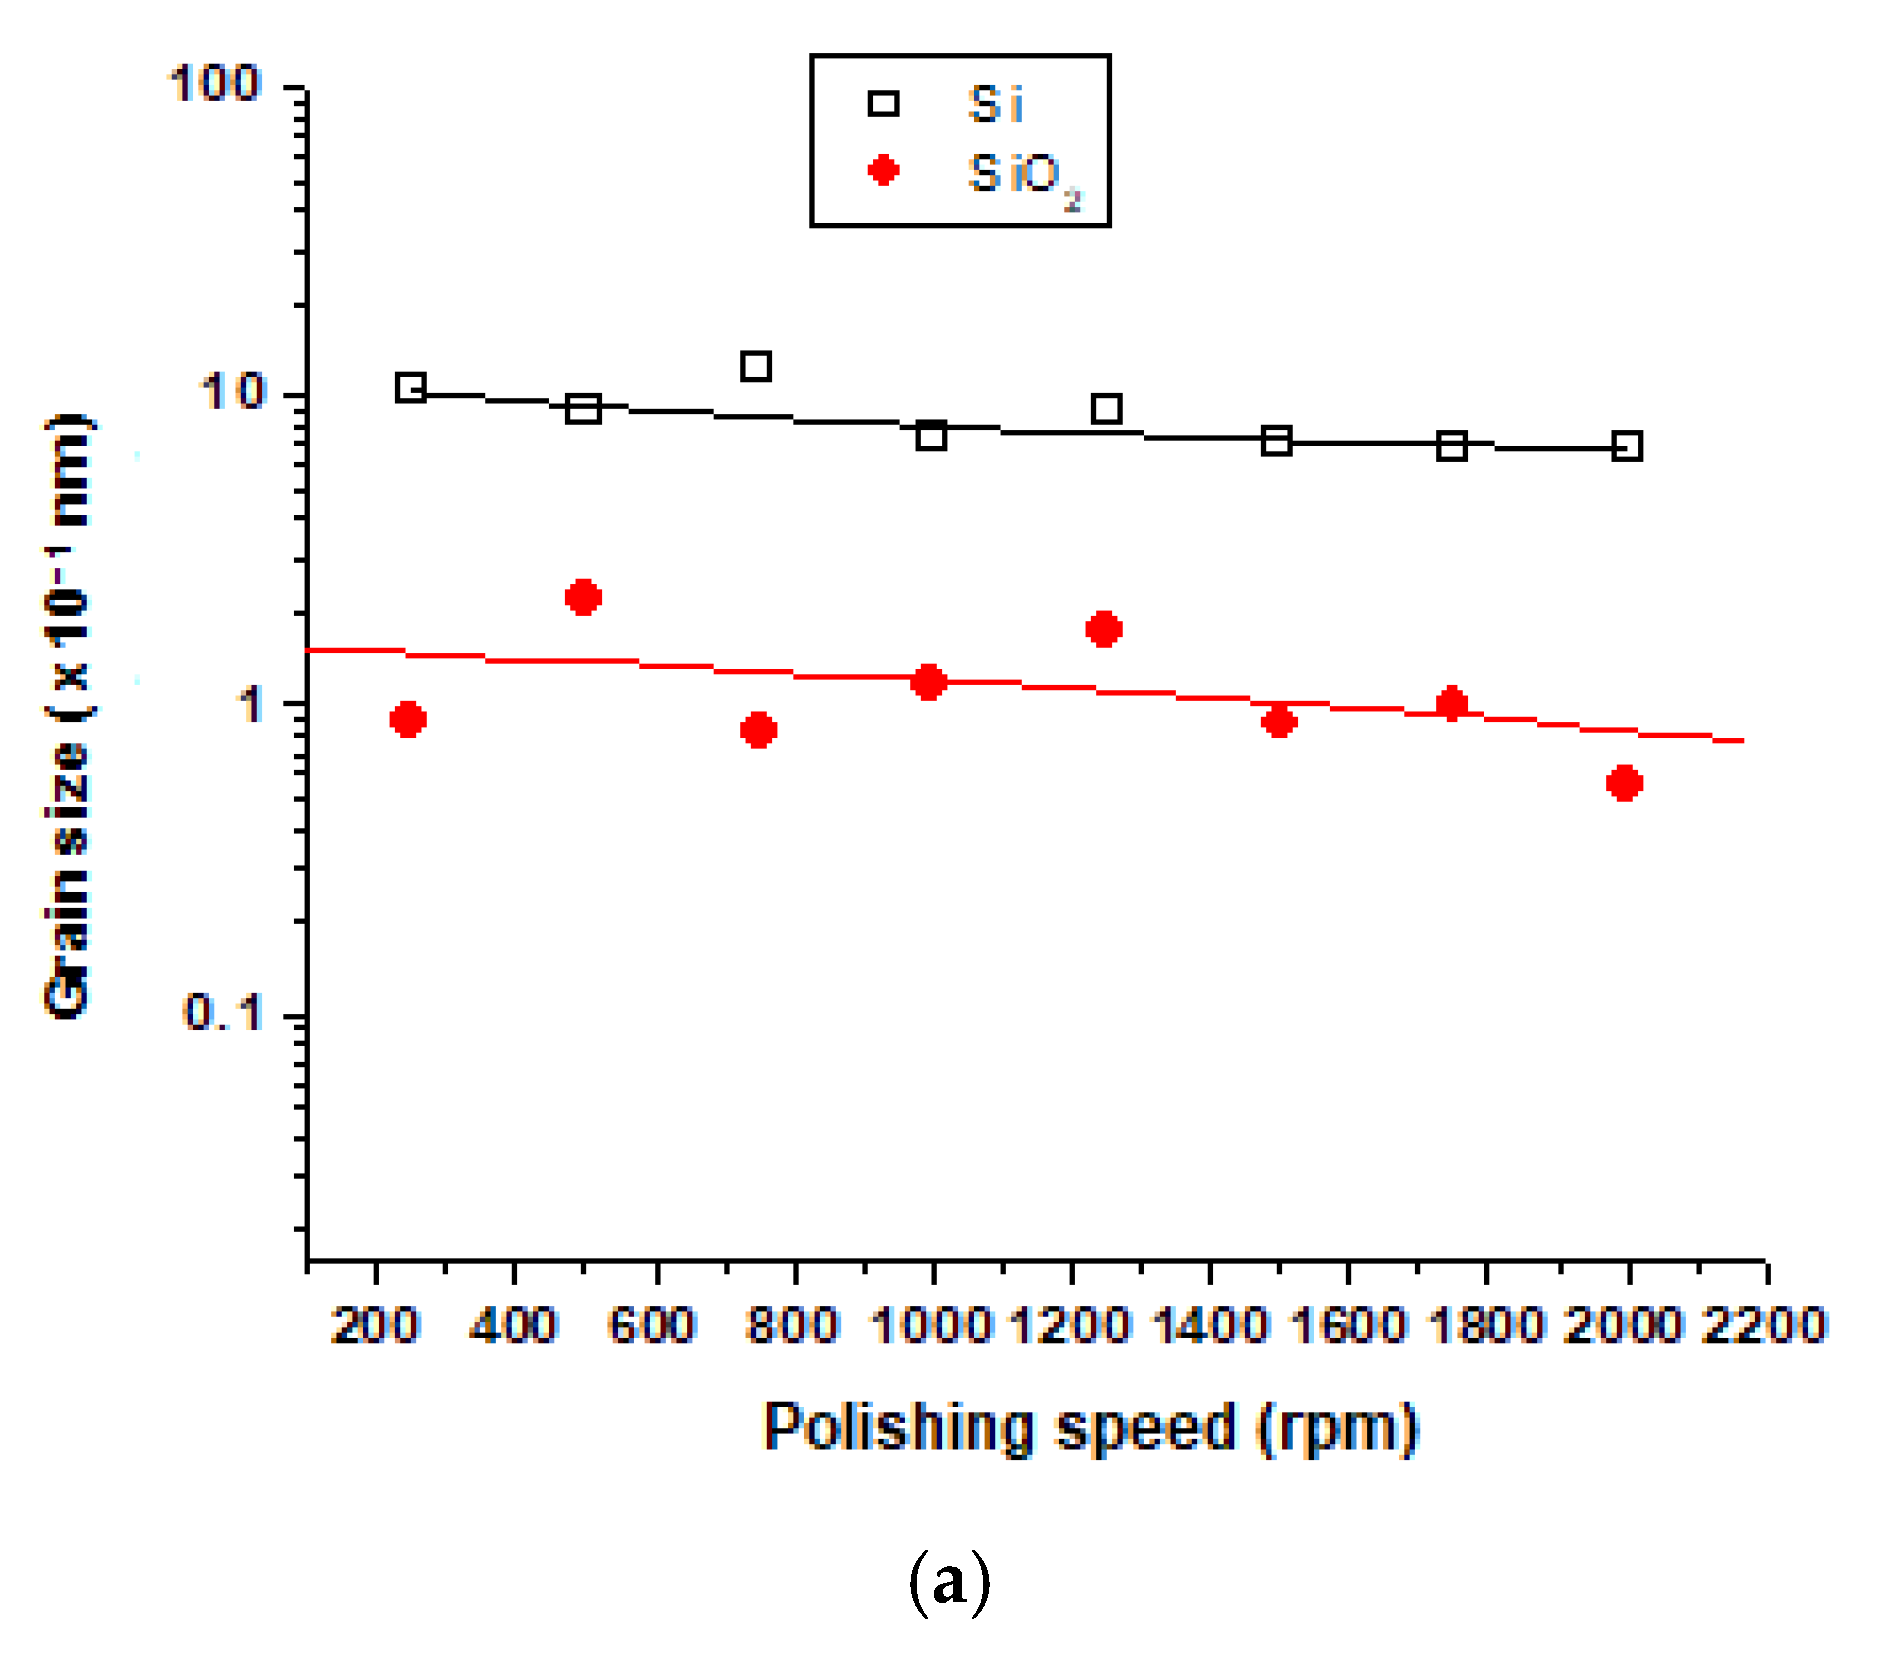
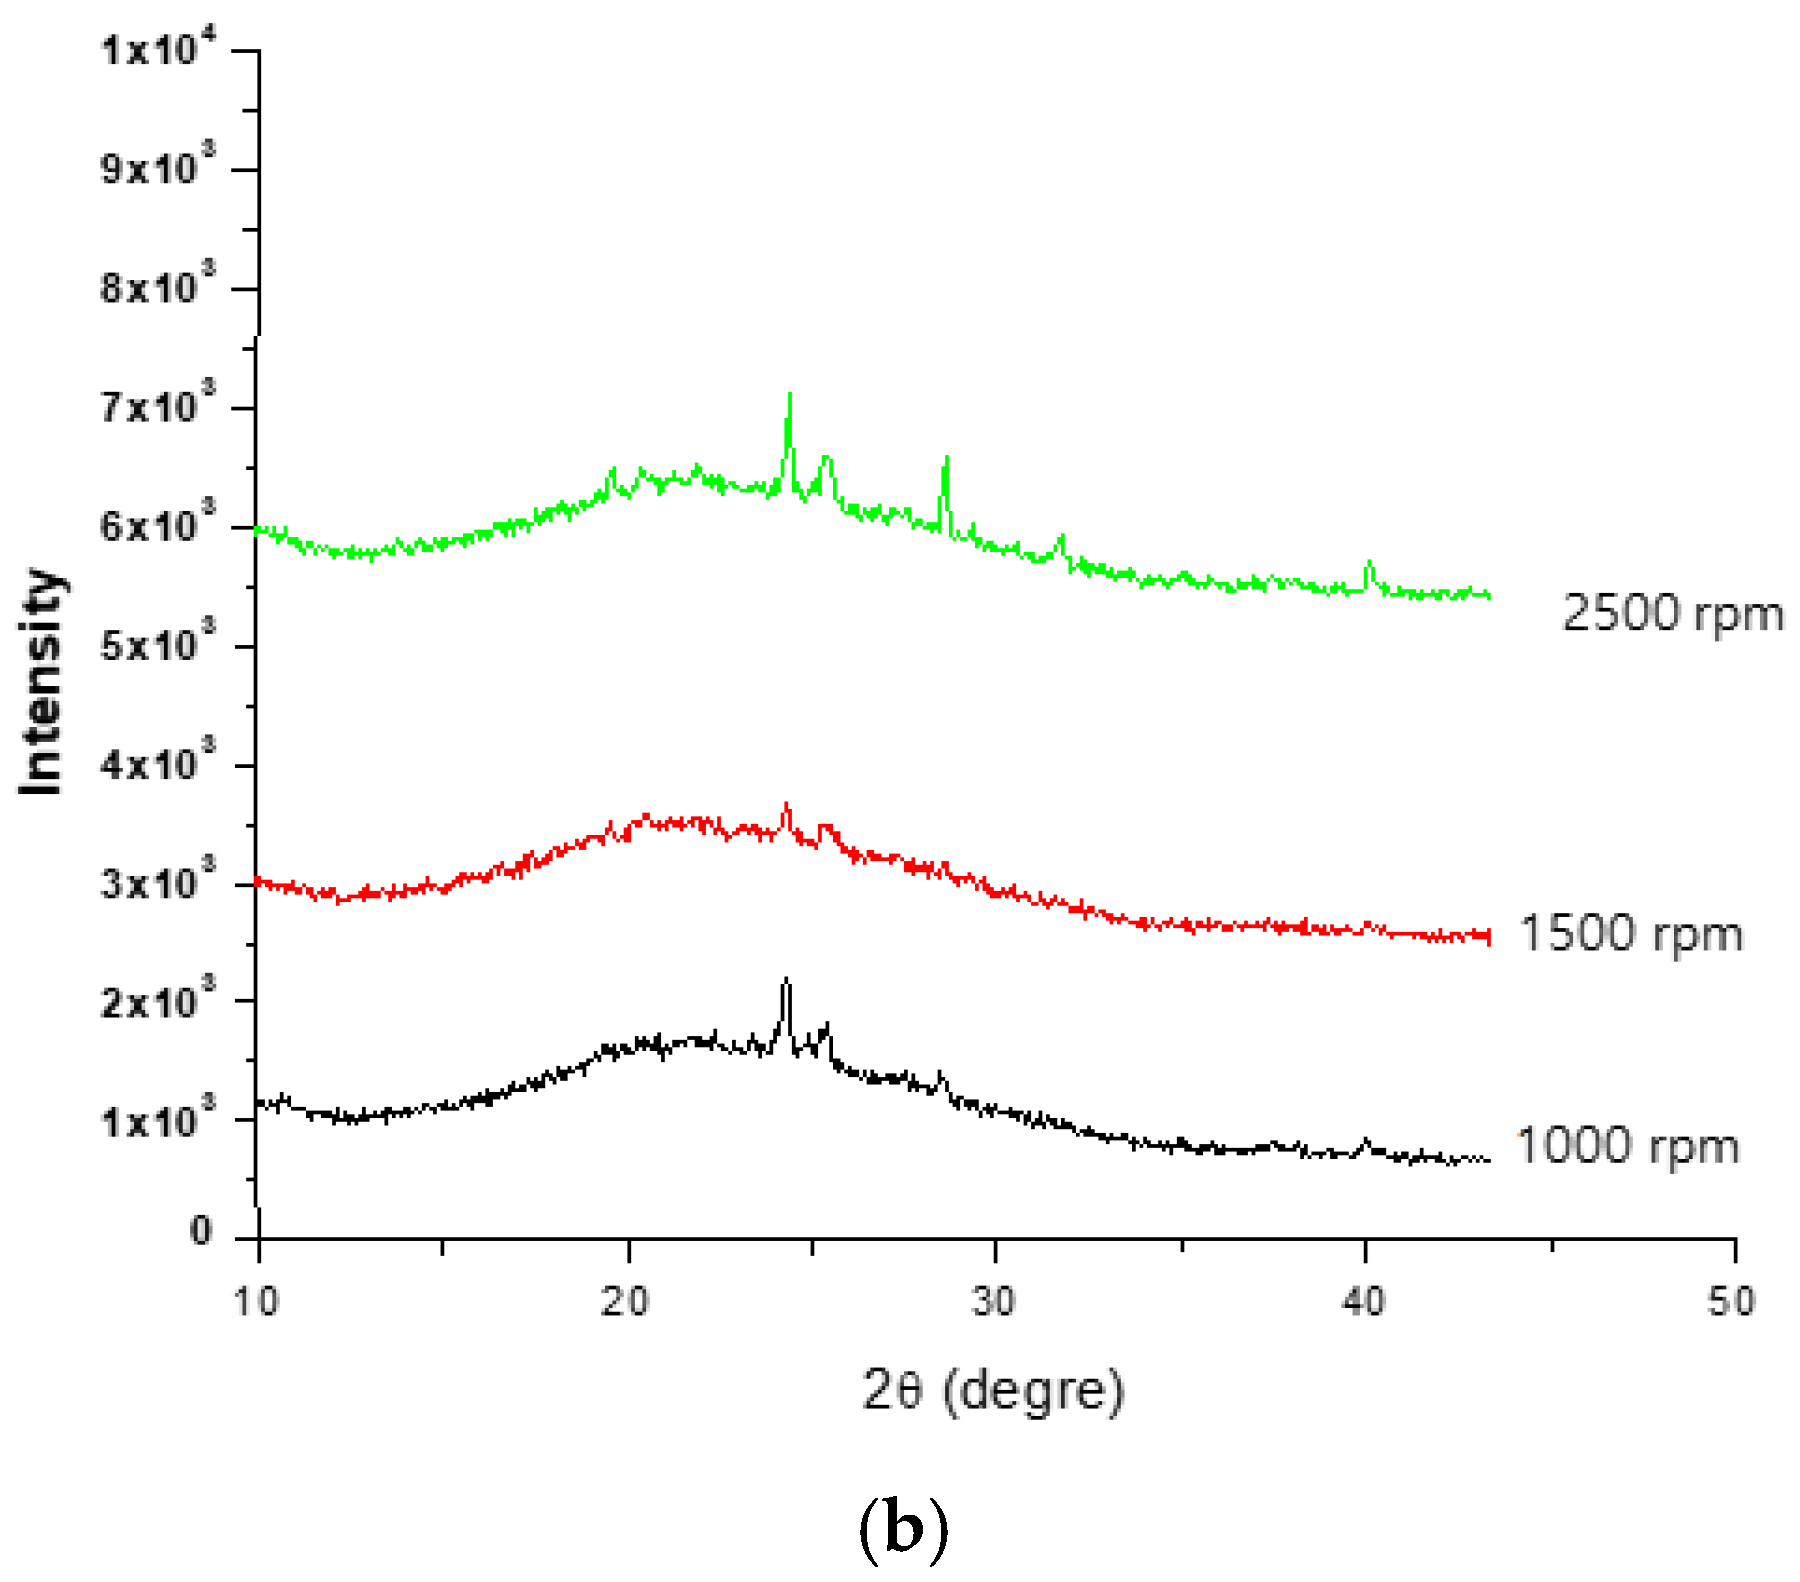
3.1. Analysis of Si and SiO2 Particle Grain Size Using X-ray Diffraction (XRD)
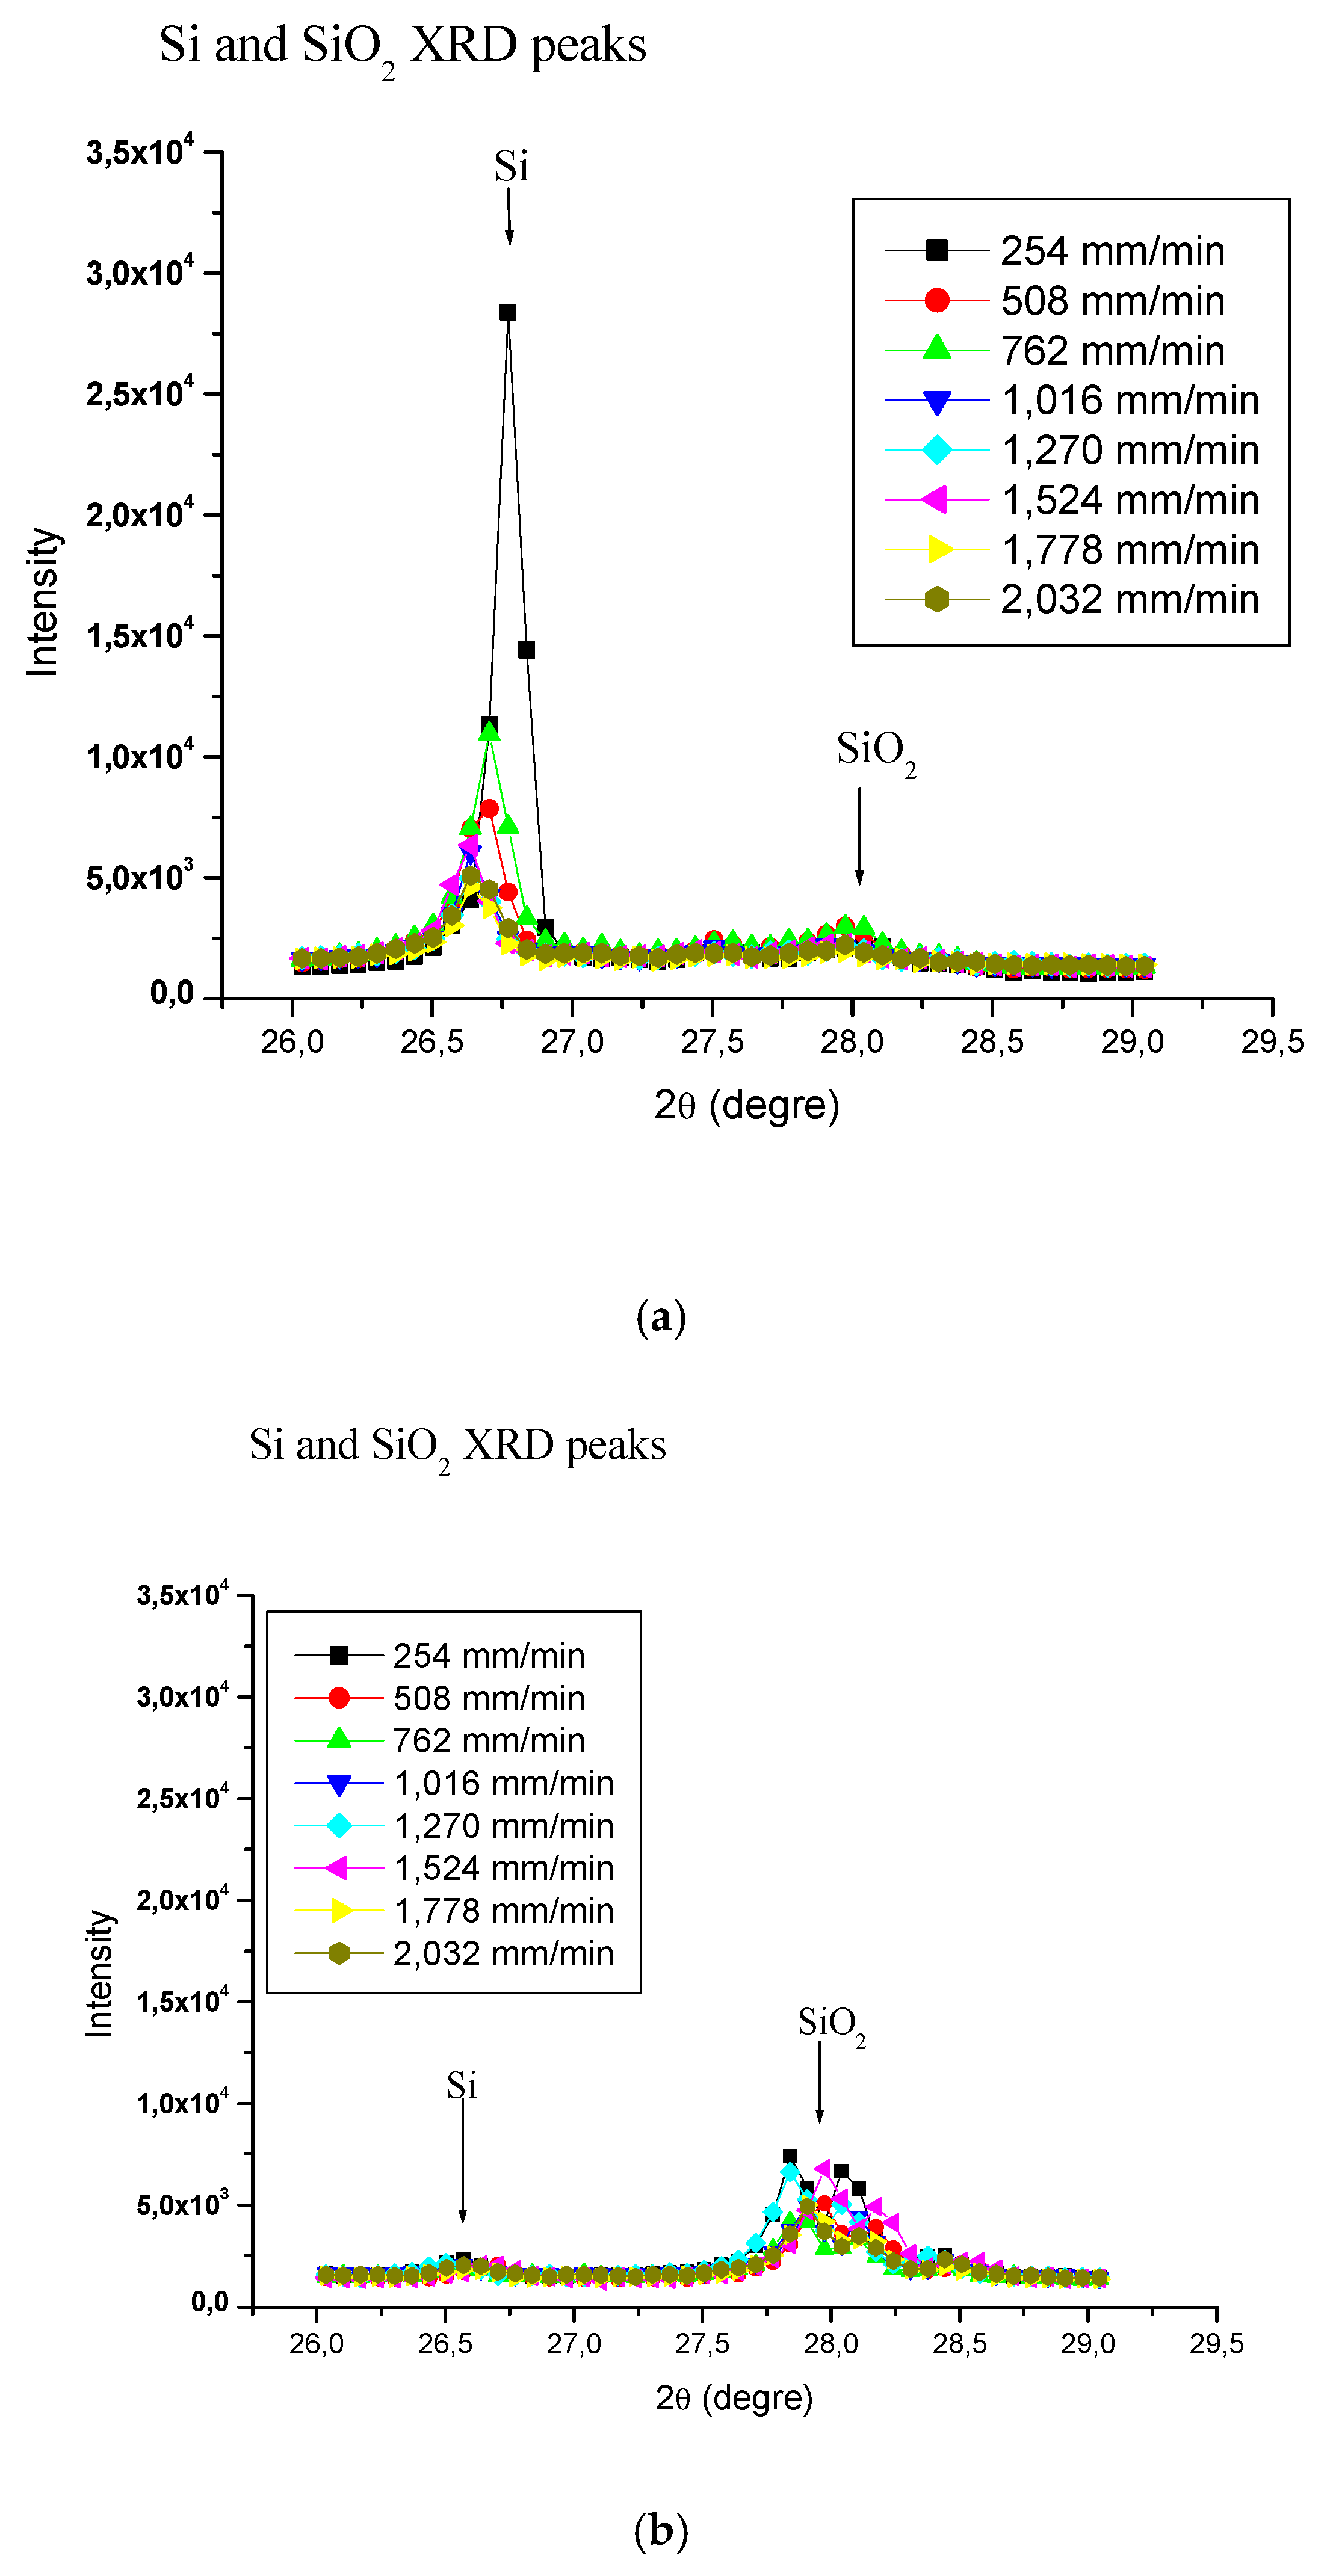
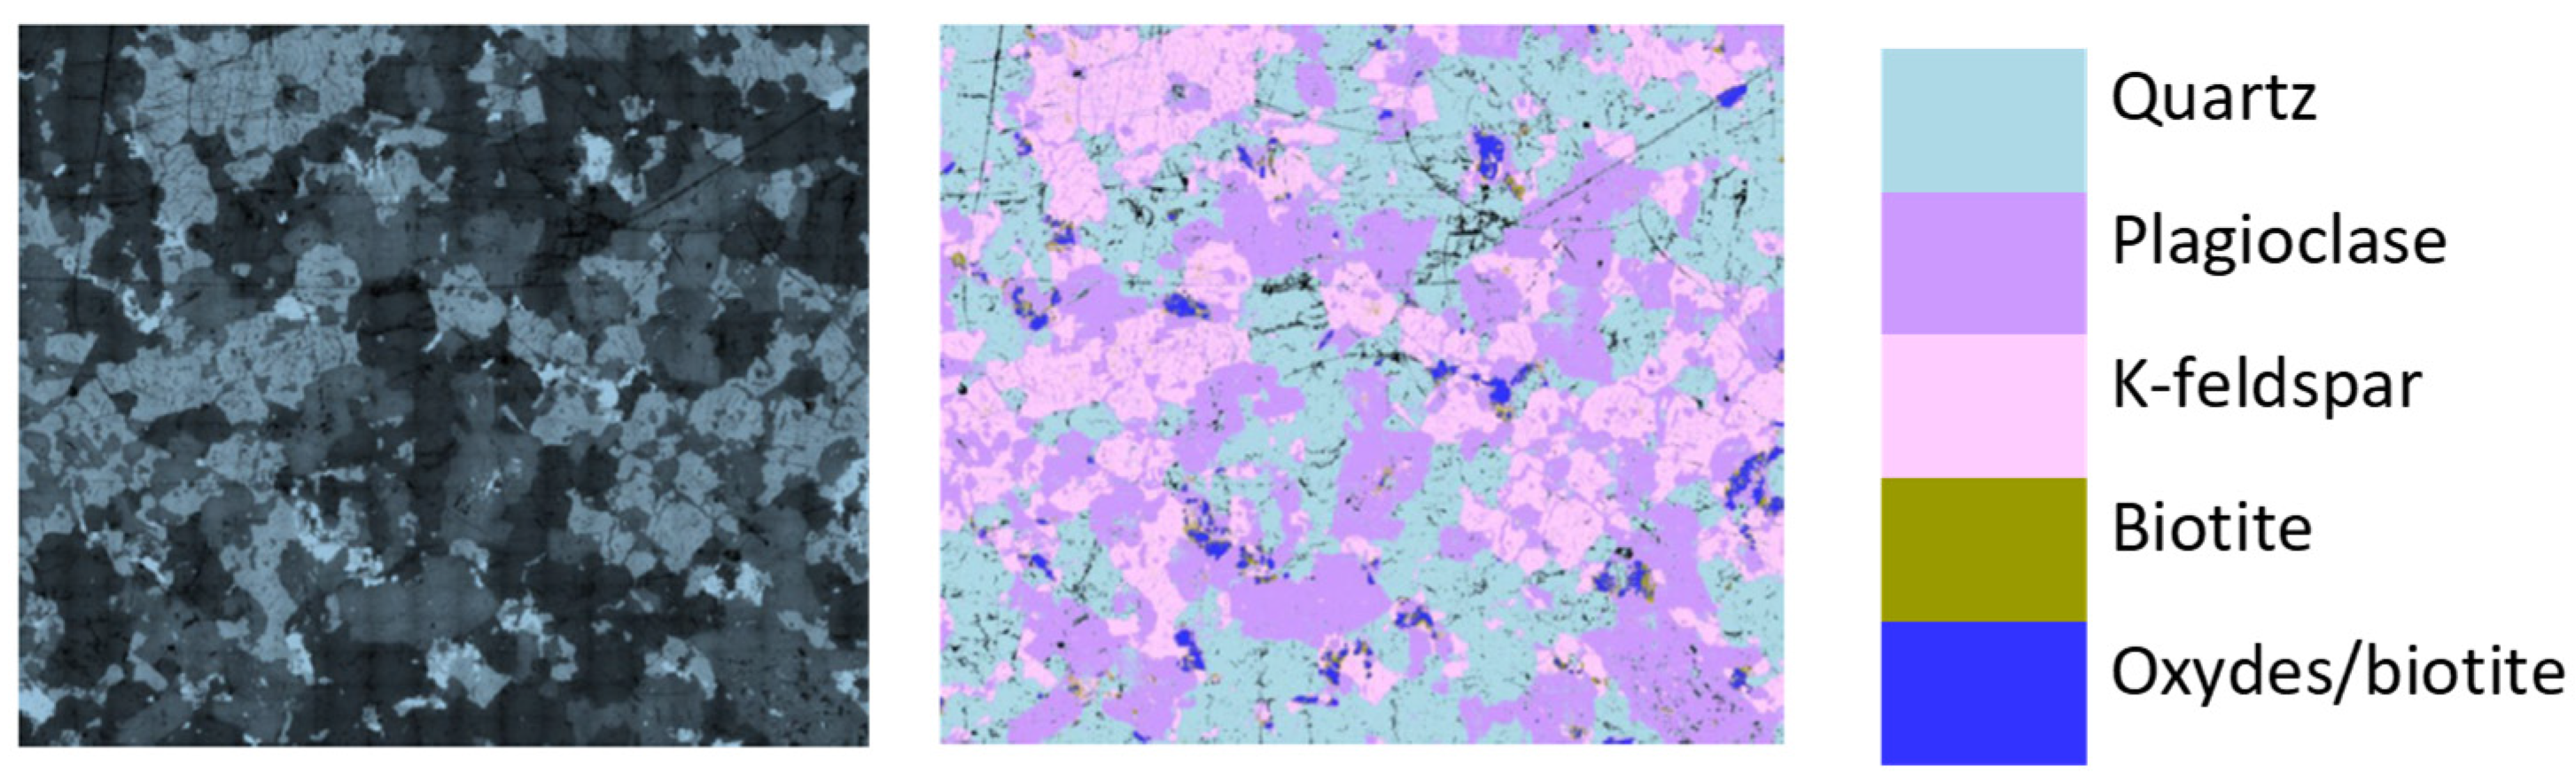
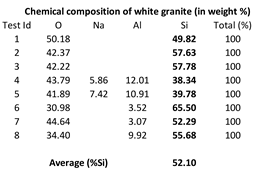
- The peak intensity of Si is high in the white granite as compared to the Canadian anorthosite while that for SiO2 is low in the white granite compared to the Canadian anorthosite. This general observation could be explained by the initial Si content of the granite workpiece, which is higher in the white granite than in the Canadian anorthosite. If we consider the mineralogy of the two stones (presented in Supplementary Materials), it is seen that white granite contains about 42% quartz or SiO2 with a Mohs hardness of 7), whereas the Canadian anorthosite contains no quartz at all, but 67% plagioclase, which has the formula NaAlSi3O8–CaAl2Si2O8 and is a continuous solid solution series, categorized more properly as the plagioclase feldspar series within the feldspar group. It has a hardness of 6 to 6.5 on the Mohs hardness scale. In addition, white granite also contains 38% K-feldspar and 19% plagioclase. The mineral feldspar contains mainly Al, Si, and O atoms (with the formula KAlSi3O8–NaAlSi3O8–CaAl2Si2O8, Mohs hardness 6–6.5) whereas quartz contains Si and O atoms. Thus, the major chemical element present in quartz is Si, whereas in feldspar it is Al. Taking all these points into consideration, it is expected that the Si peak will have a much higher intensity in the white granite XRD pattern, compared to the Canadian anorthosite.
- The peak diffraction intensities of Si and SiO2 are low (Figure 3a) as compared to the peak intensities of Si and SiO2 observed in Figure 4a for white granite with variation in feed rate, at a polishing speed of 1000 rpm. Similar observations are noted for the Canadian anorthosite (Figure 3b and Figure 4b), with the intensities much weaker in this case. These results indicate that the feed rate has a greater influence on the peak intensities than the polishing speed.
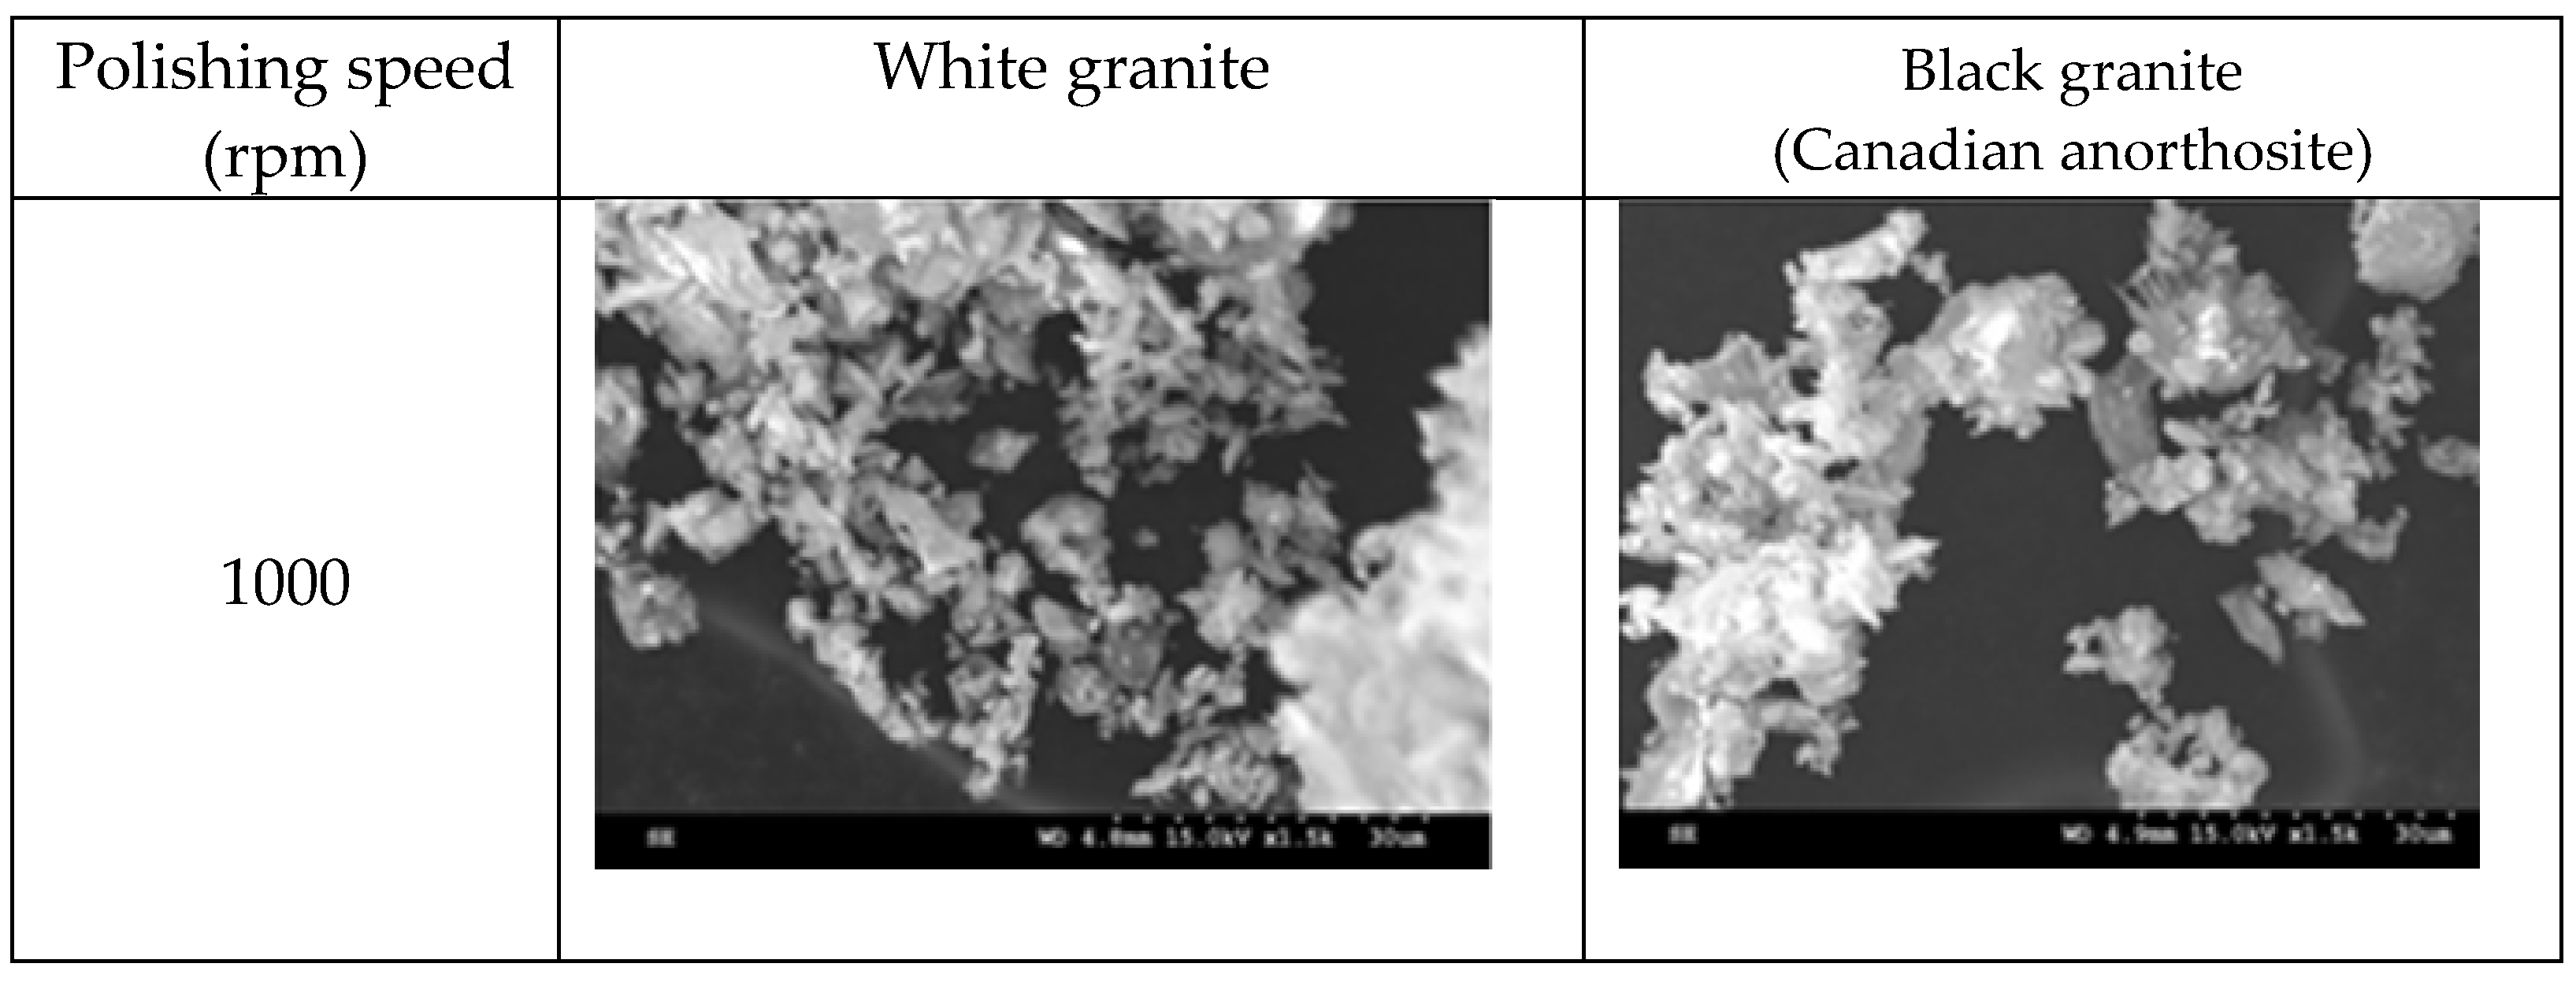
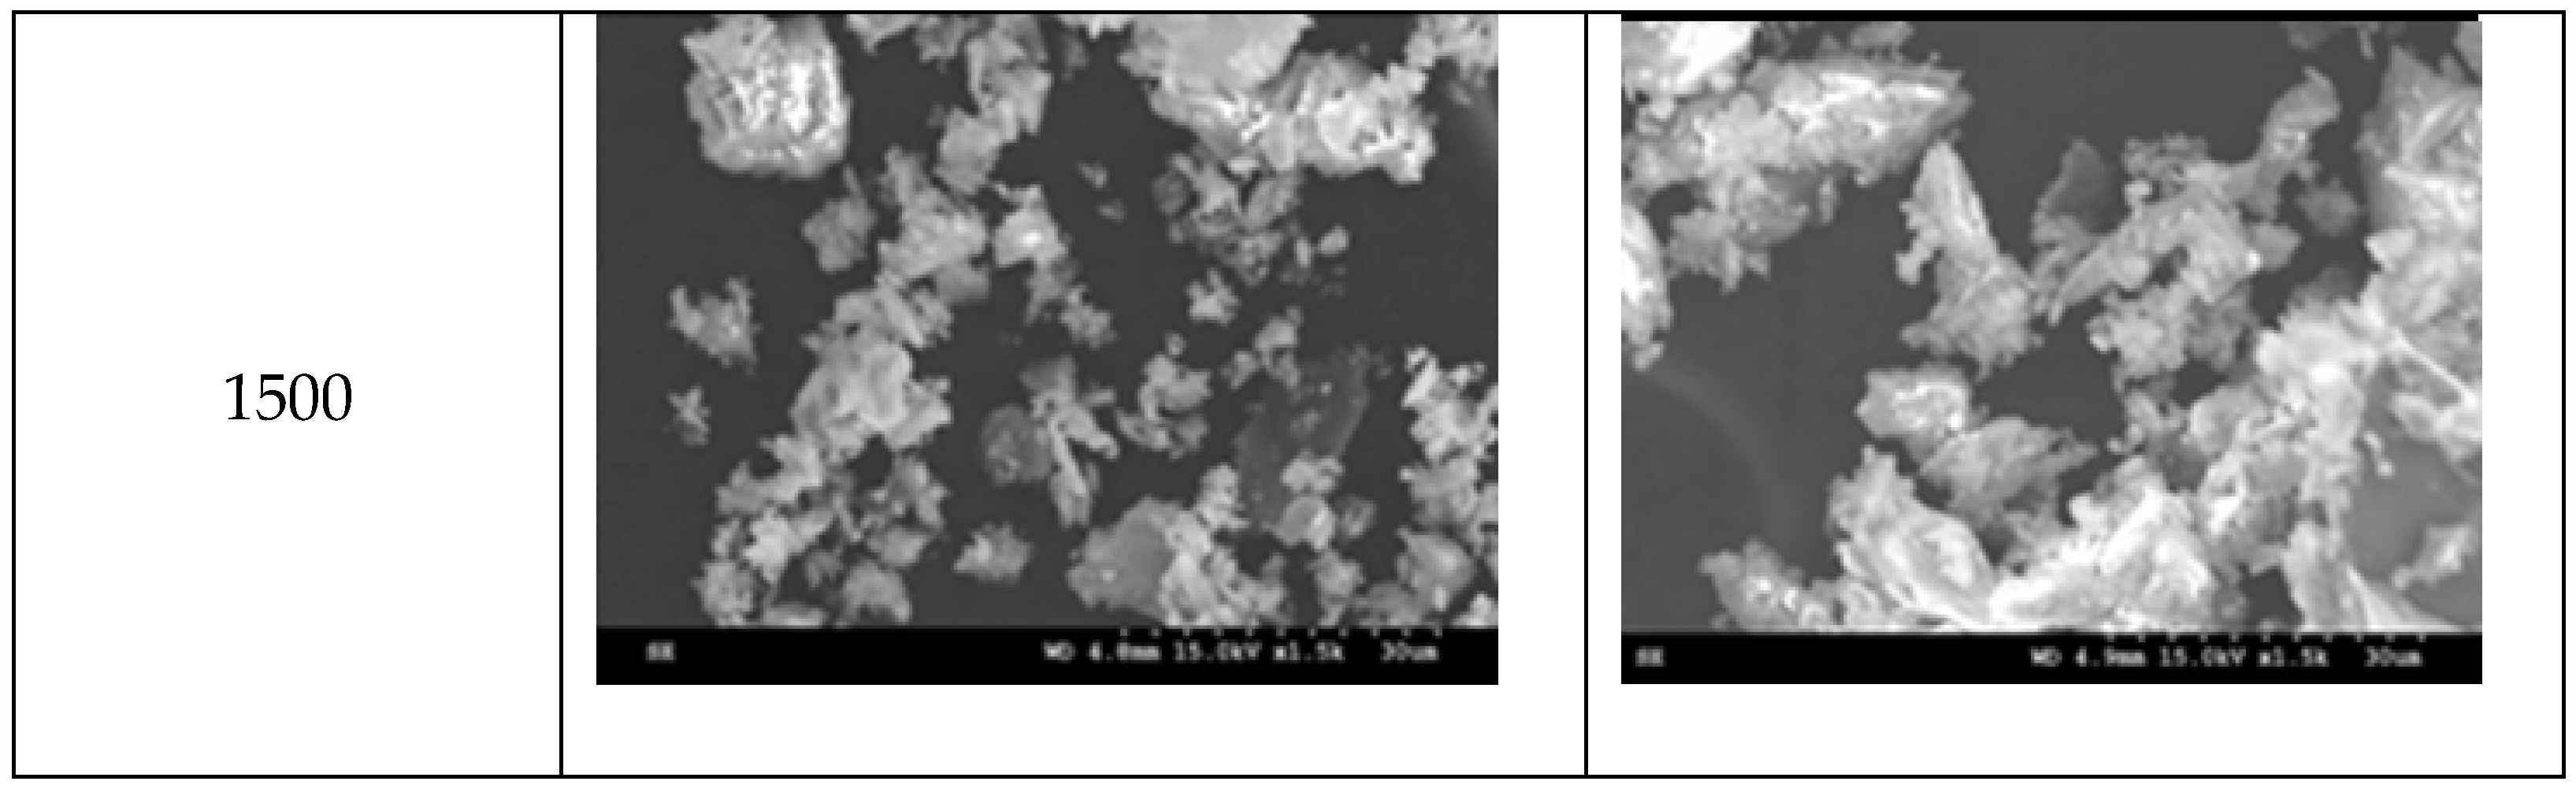
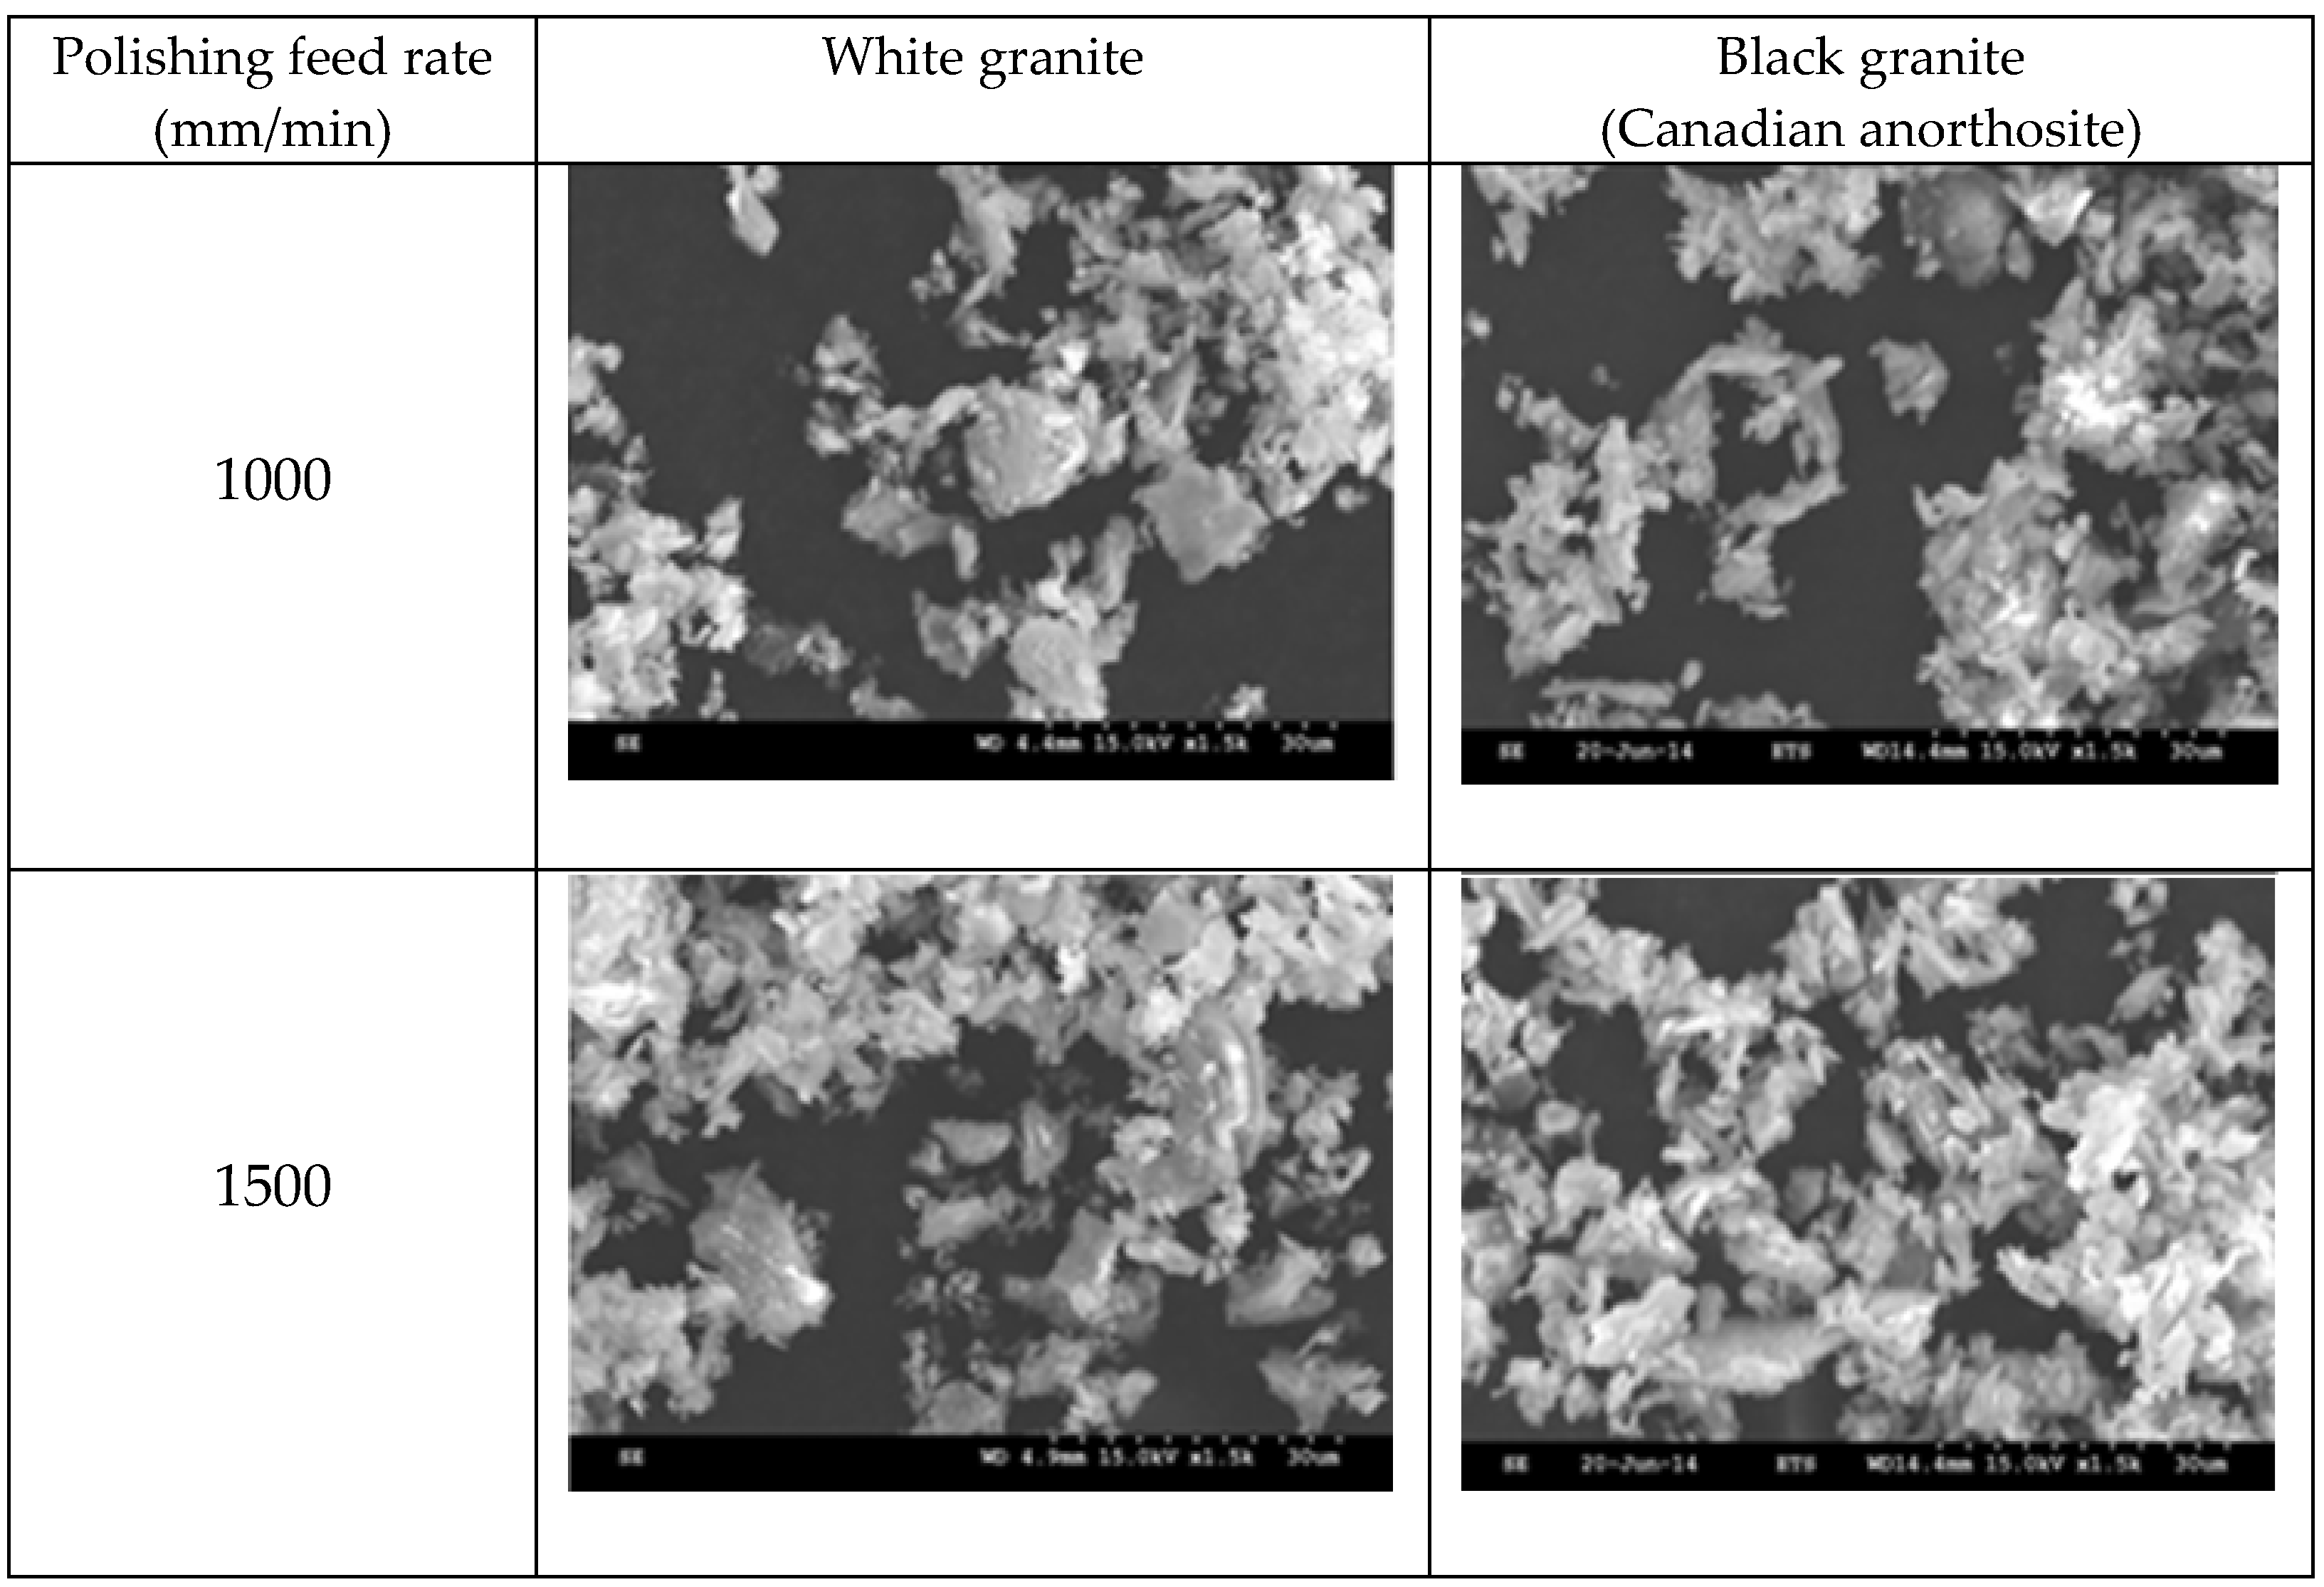
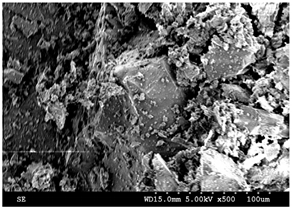
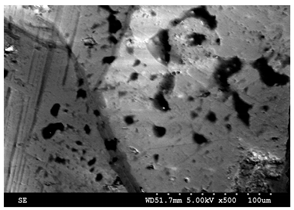
3.2. Qualitative Analysis of Emitted Particles Using Scanning Electron Microscopy (SEM)
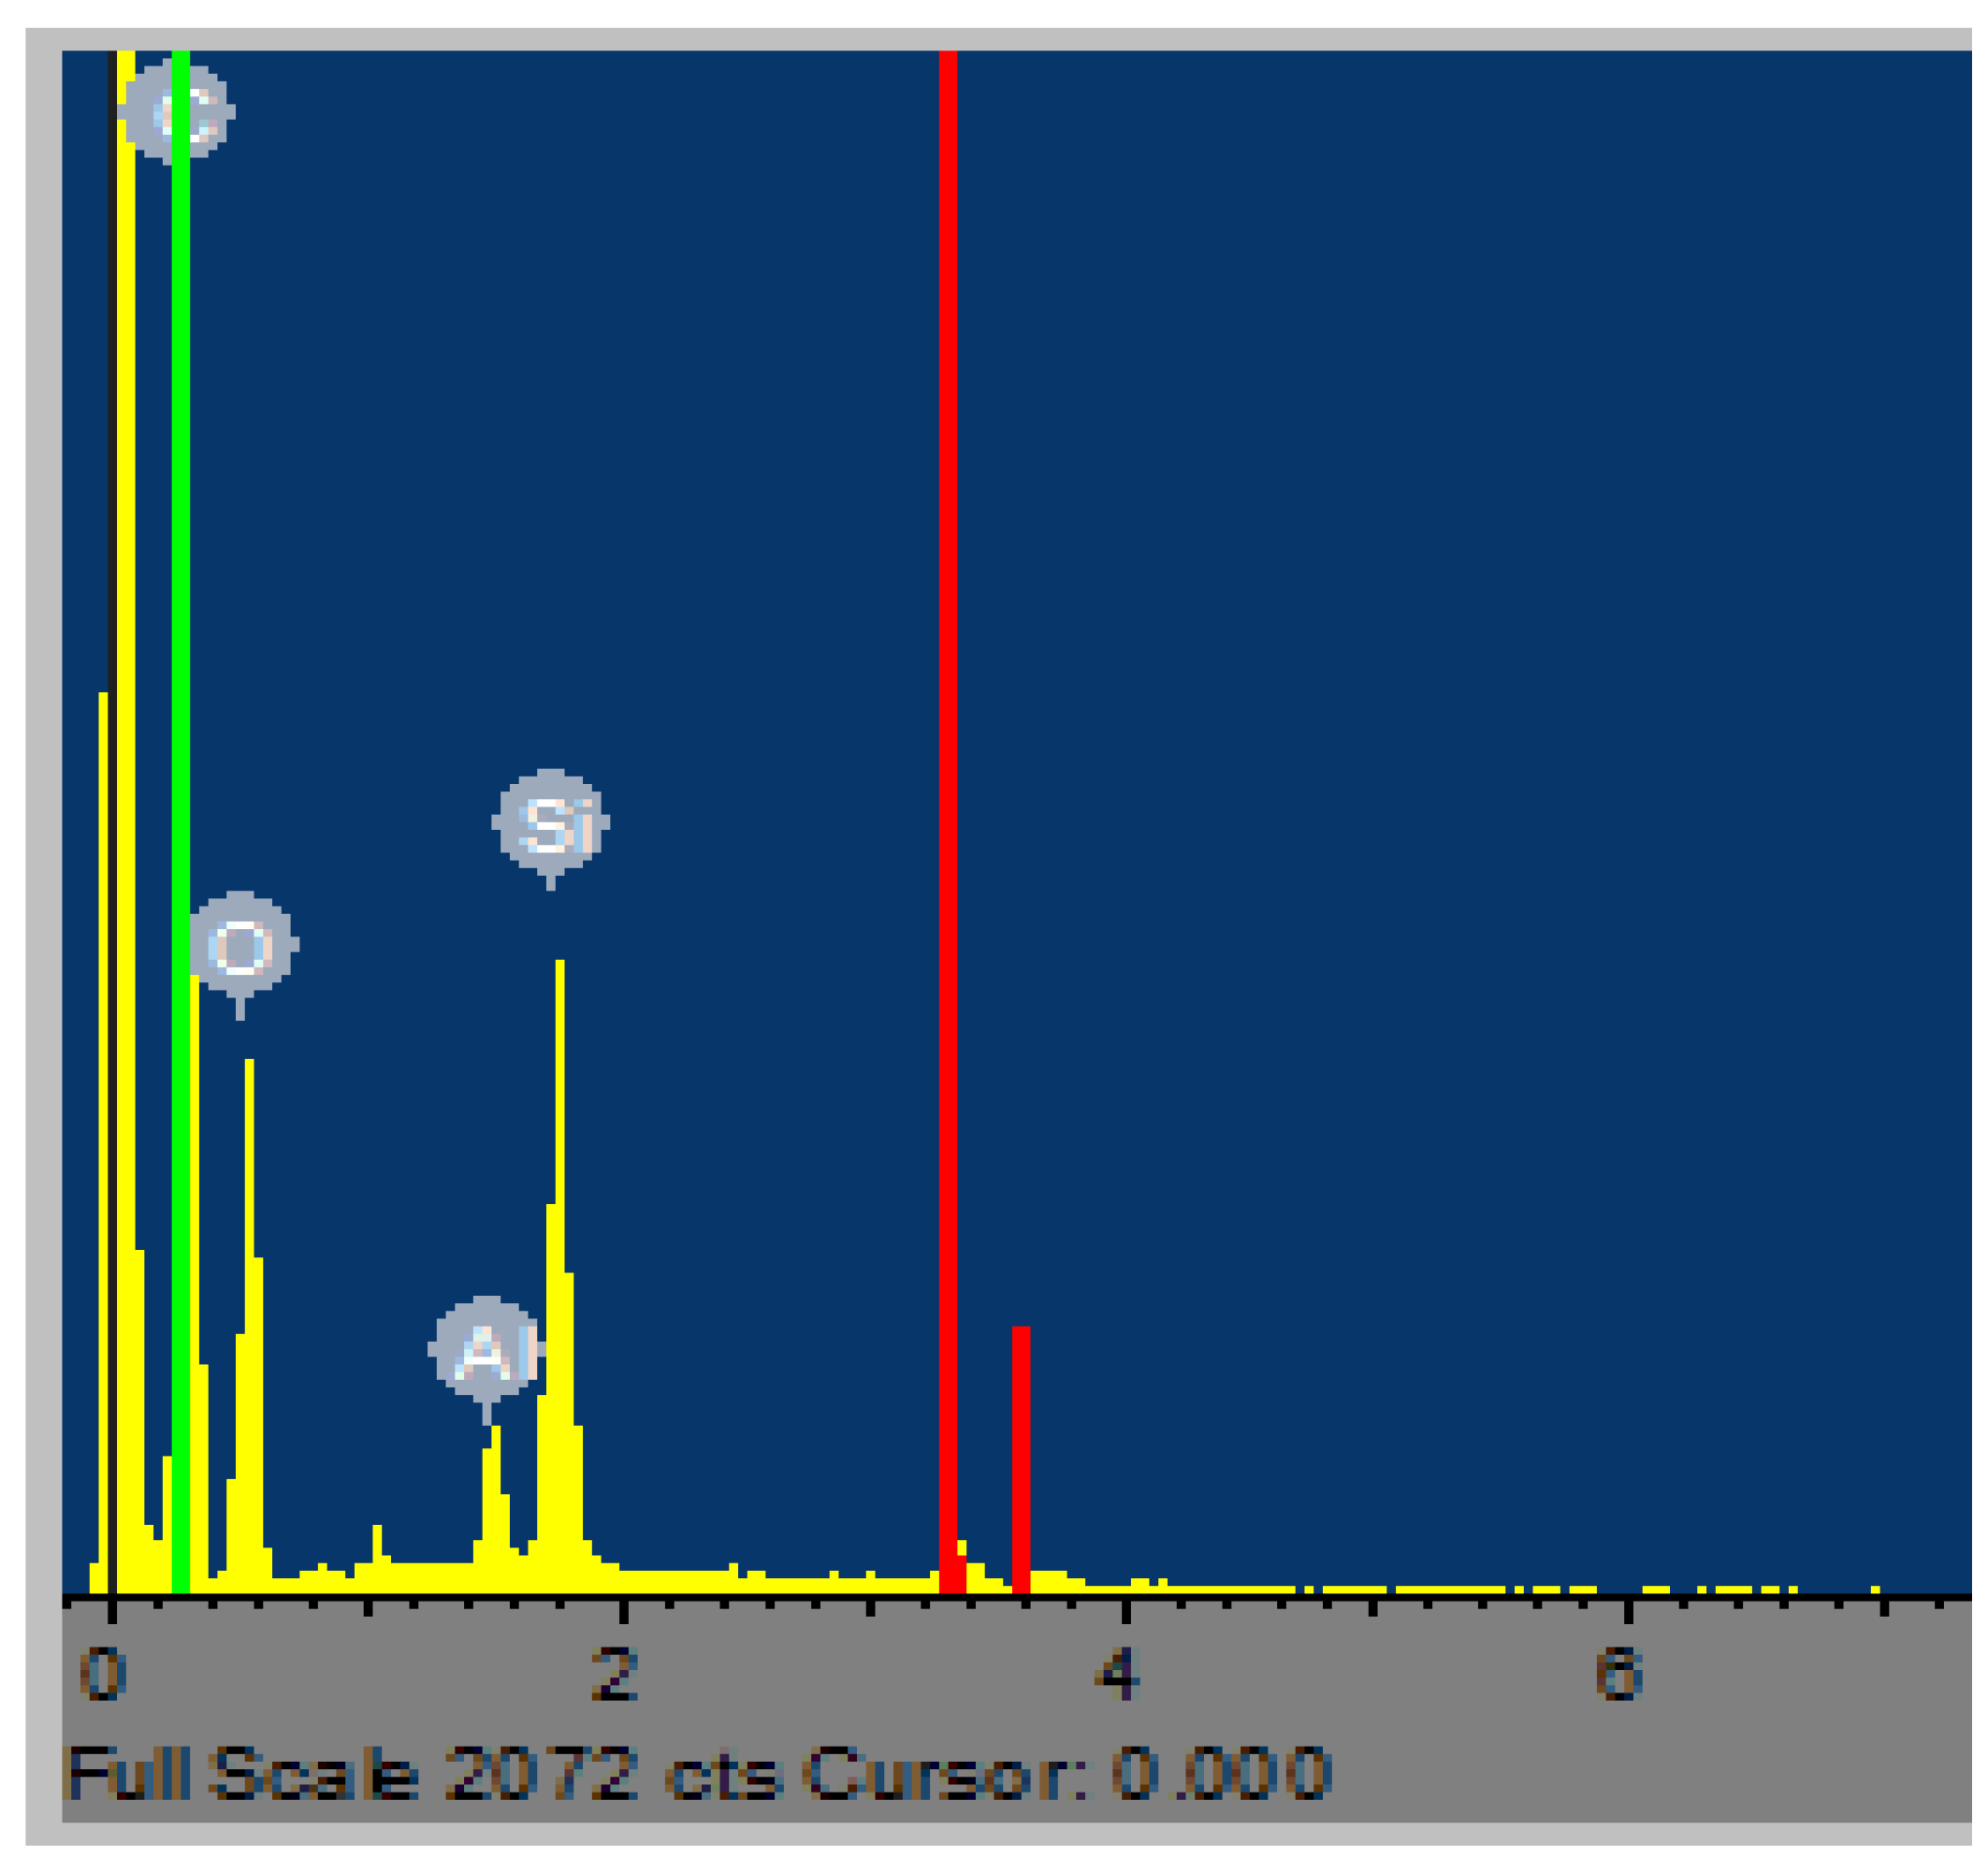
3.3. Composition of Emitted Particles Using Energy Dispersive X-ray (EDX) Analysis
4. Conclusions
- The grain size, morphology, and chemical composition of particles emitted during polishing of granite depend on the type of material, namely white granite versus Canadian anorthosite, the mineralogy, the abrasion coefficients of the constituent minerals, the polishing conditions (polishing speed and feed rate), and the abrasive tool used in the polishing process.
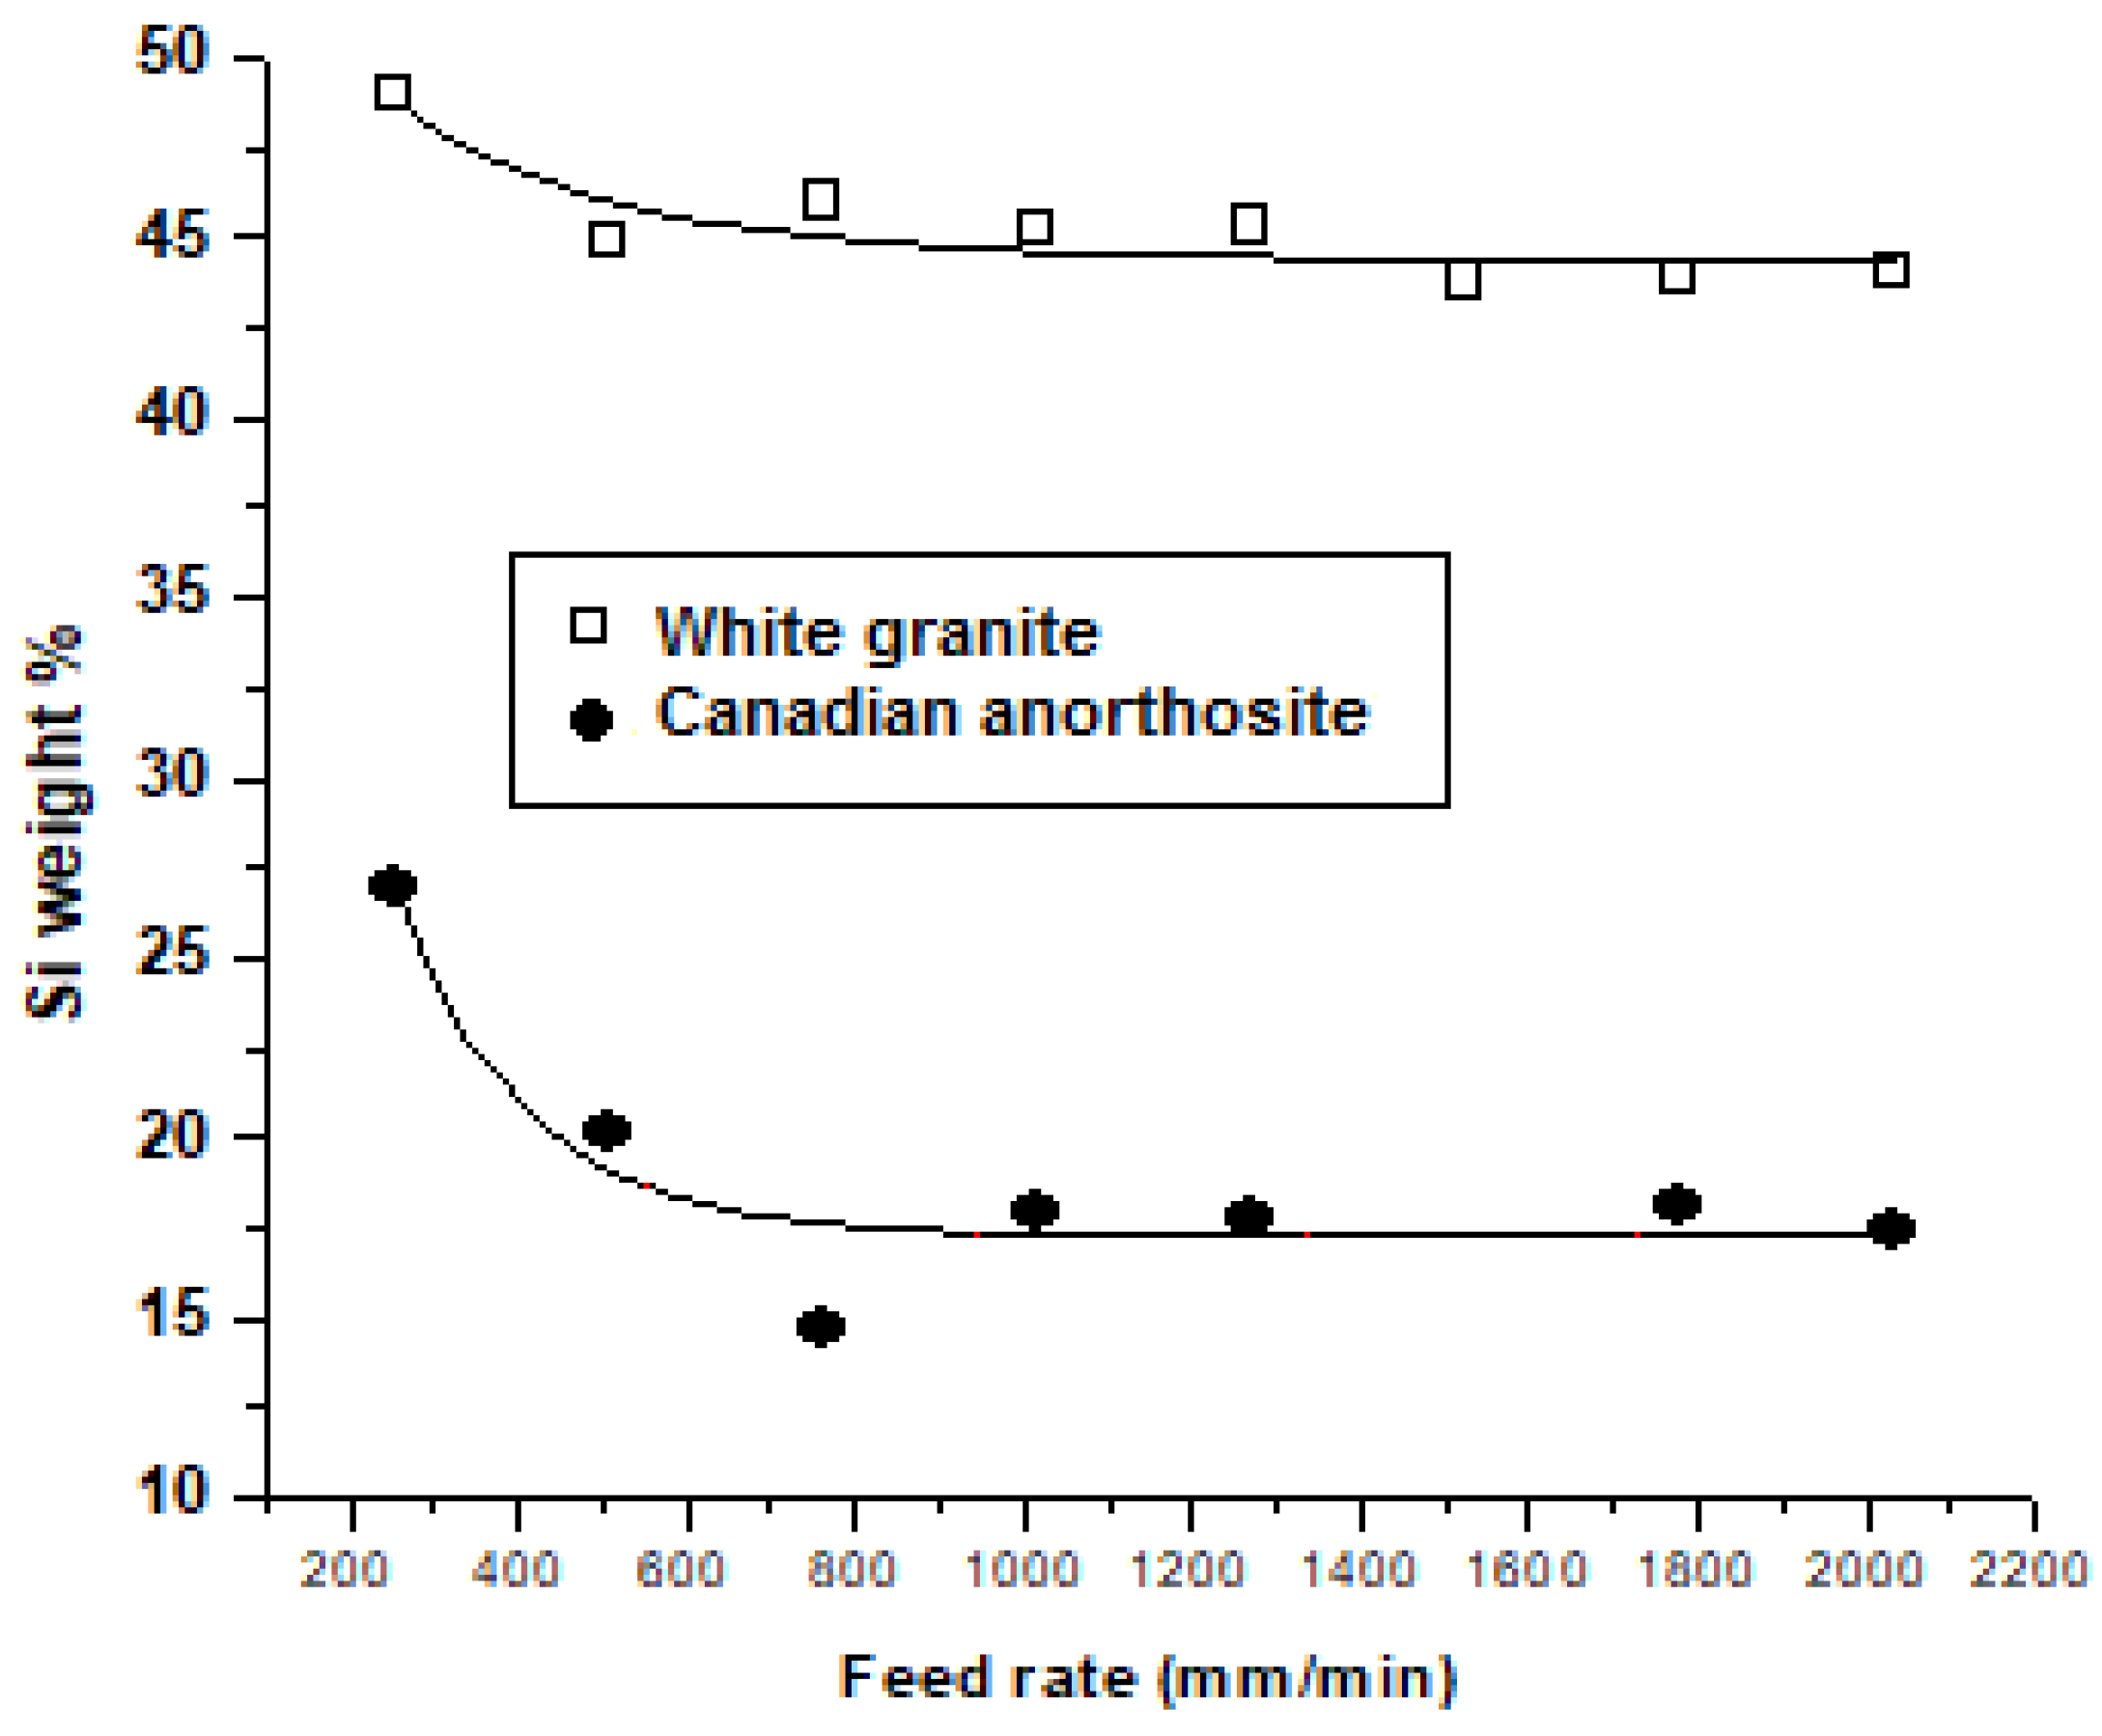
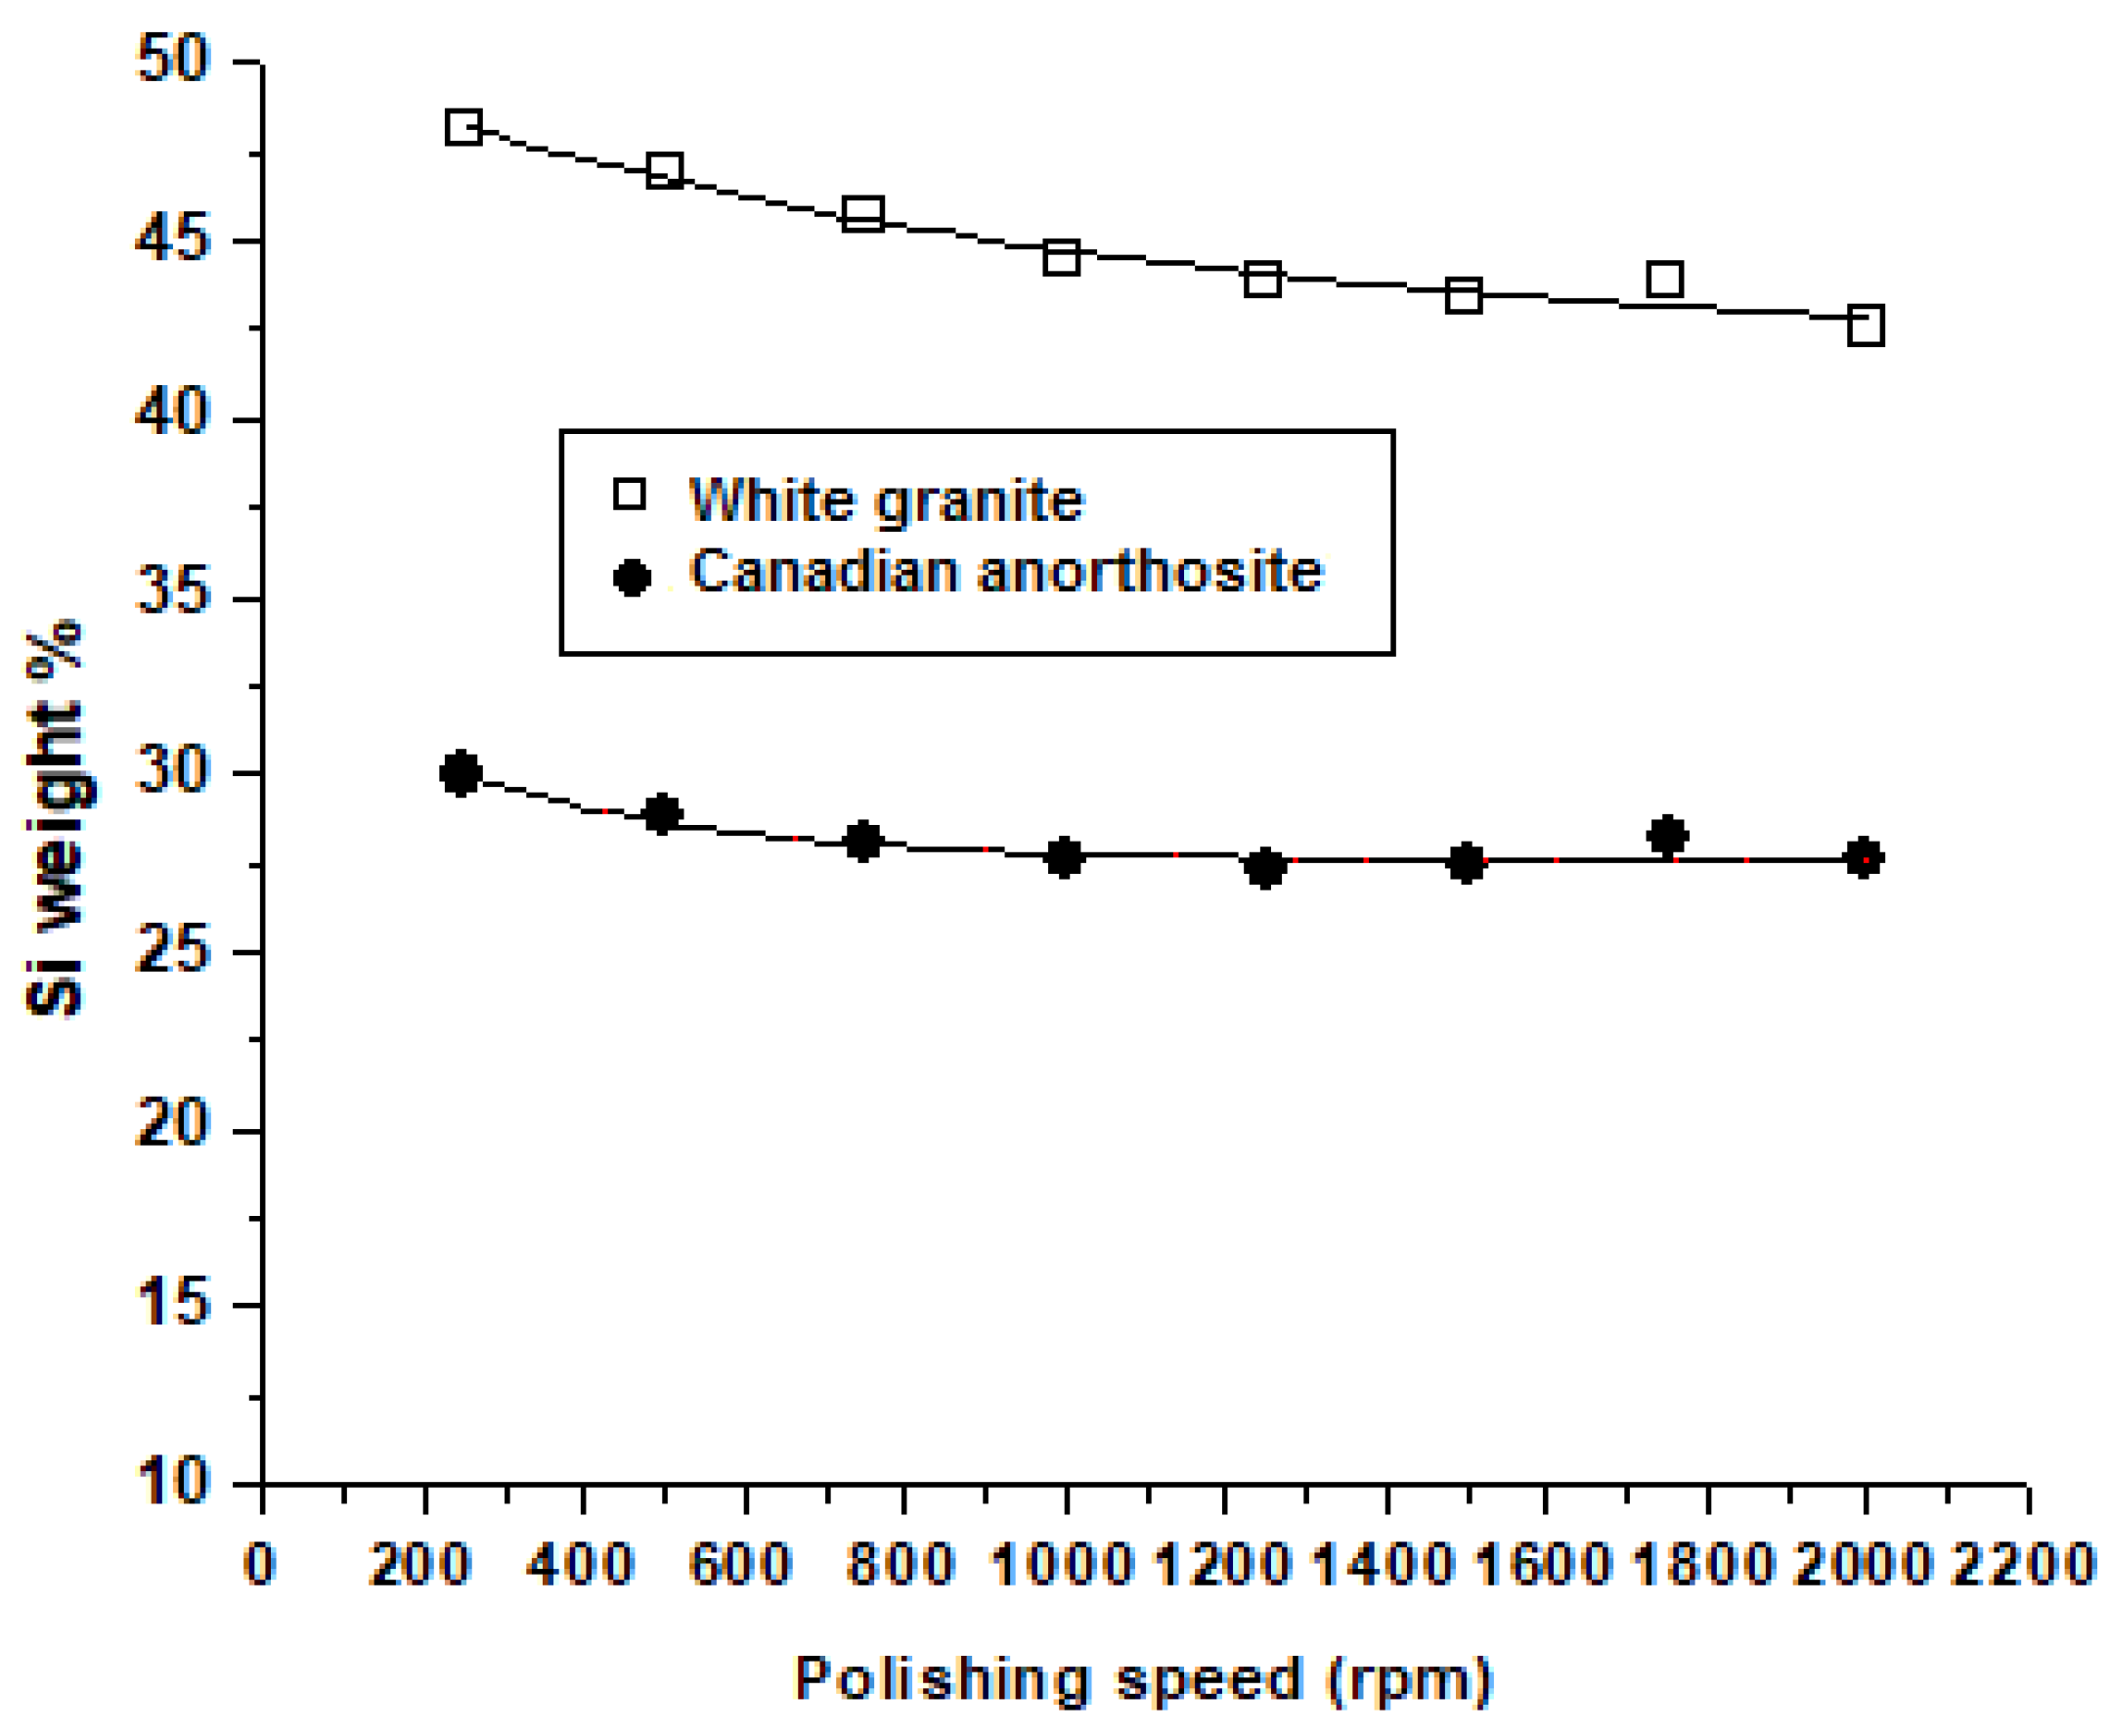
- XRD analysis reveals that the peak diffraction intensity of Si is high, while that of SiO2 is low in white granite and vice versa in Canadian anorthosite due to the higher Si content of white granite (cf. 92% vs. 11%). Feed rate has a greater influence on the peak intensities than the polishing speed.
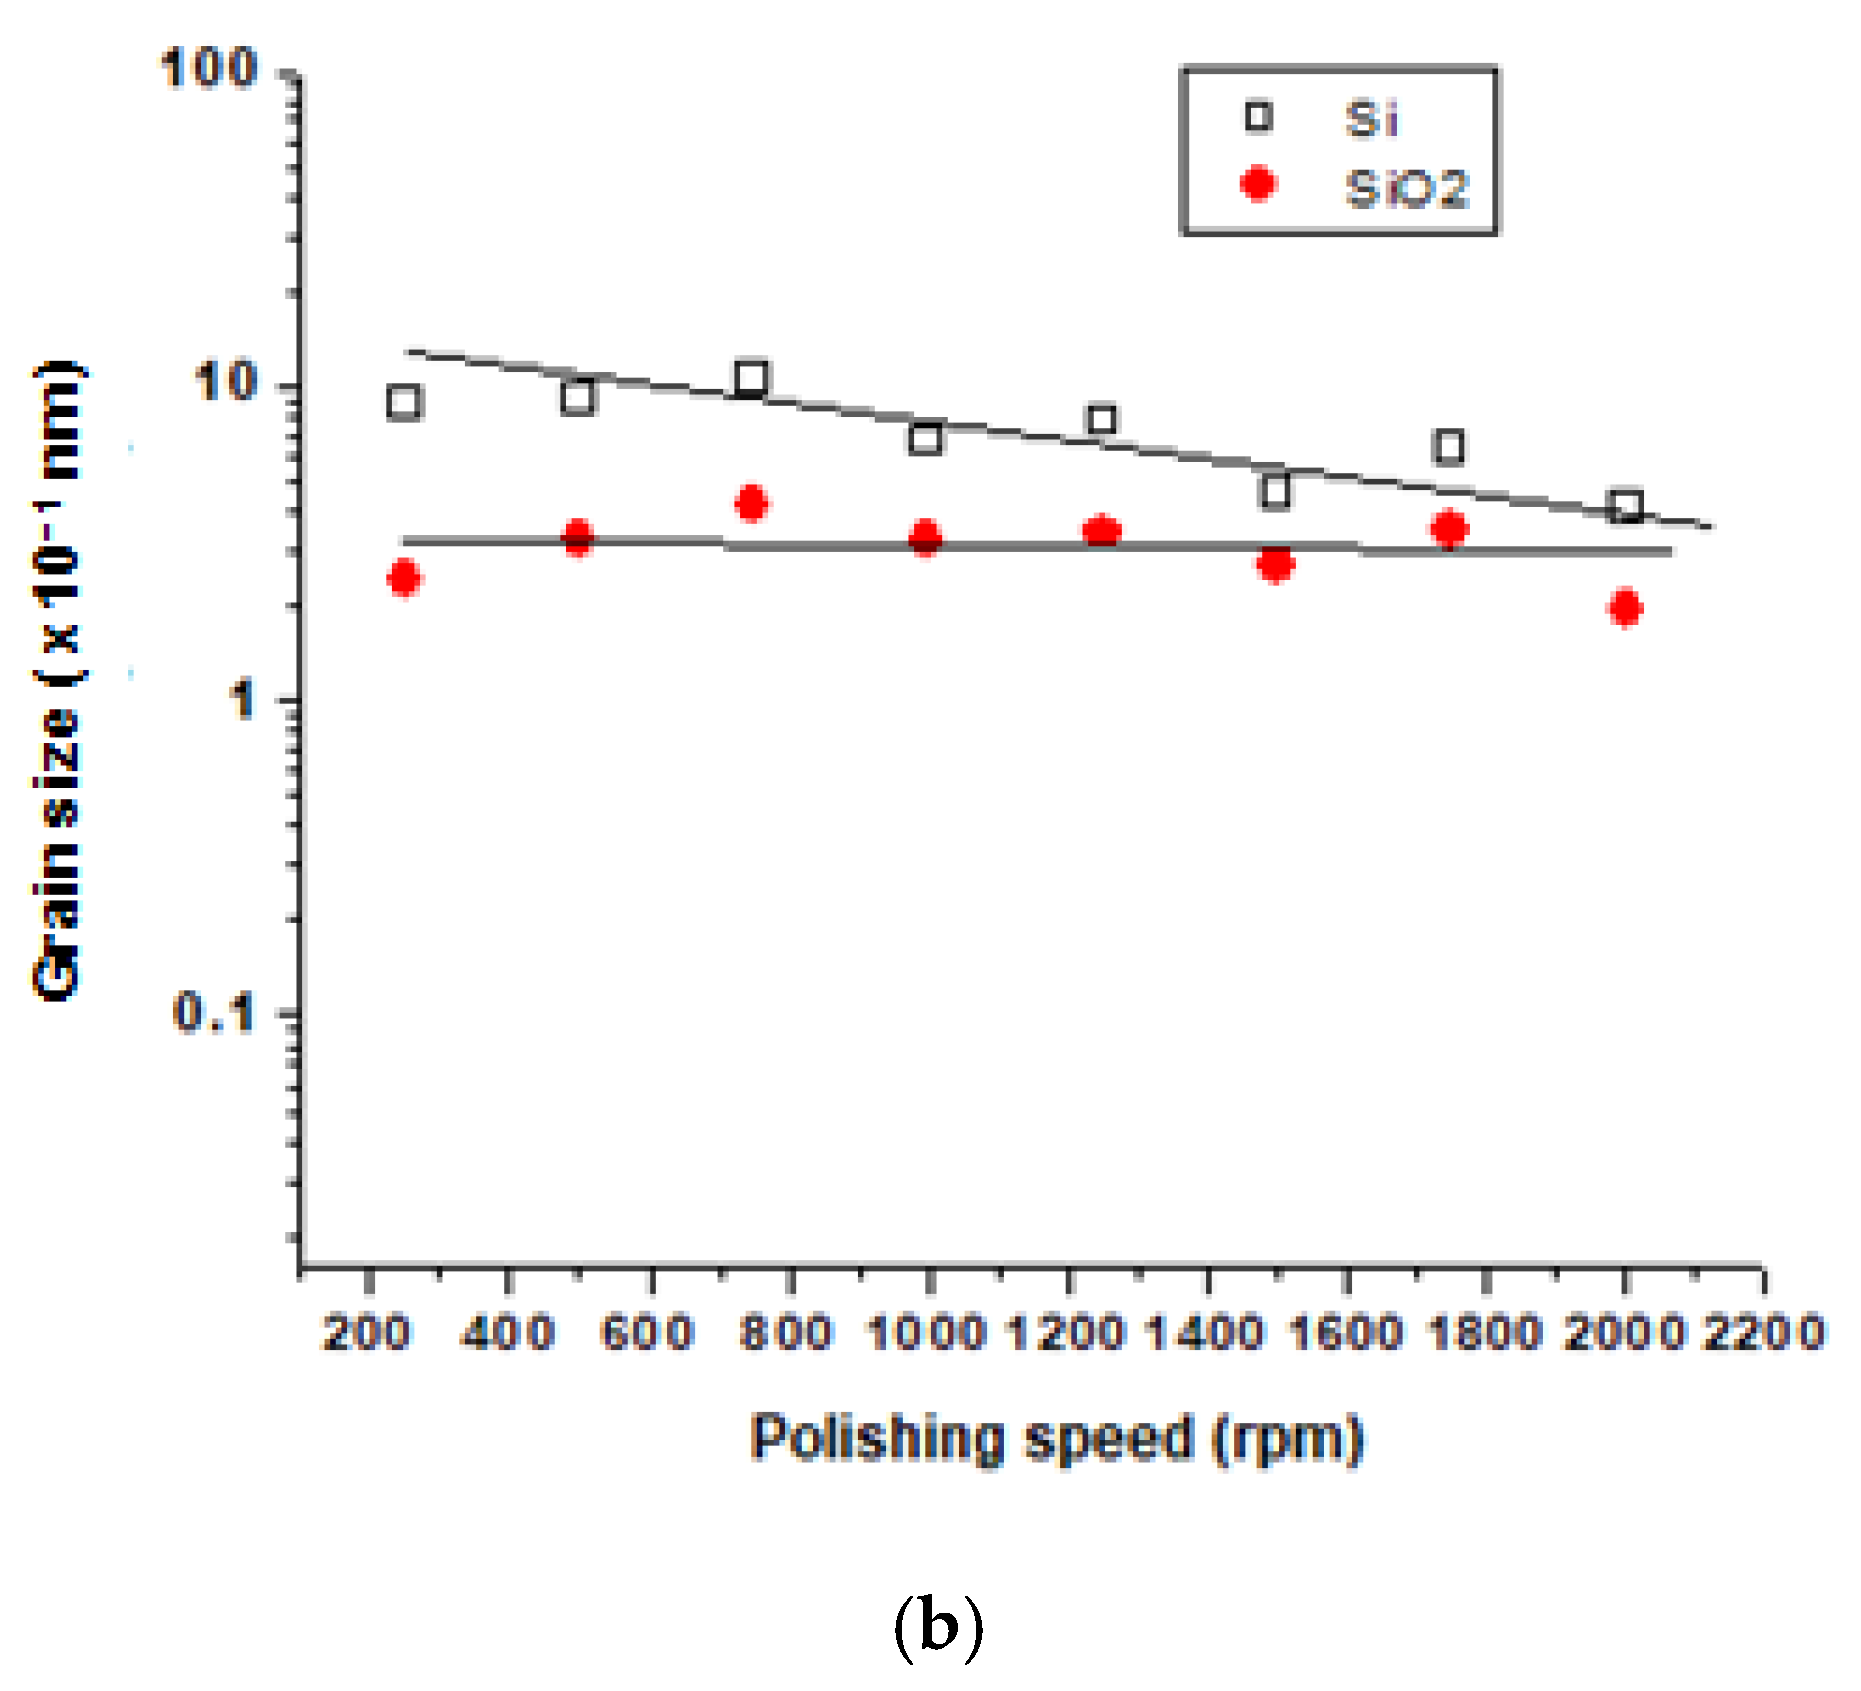
- Polishing speed and feed rate have the same influence when polishing white granite, in that the grain size of emitted Si particles is higher than that of SiO2 particles, and the grain size of both particle types decreases with increase in polishing speed or feed rate. For the Canadian anorthosite, with increase in polishing speed, the Si particle grain size decreases more rapidly compared to SiO2, while there is no influence on the increase in feed rate. This information could prove useful in controlling the grain size of the particles emitted during polishing.
- SEM images of emitted particles show that particles have an elongated morphology. Taking into account the sizes of the chips and particles emitted during the polishing process, we think that this is a consequence of the polishing (abrasive) action. Particle agglomeration is also observed, and increases with increase in polishing speed for the Canadian anorthosite compared to the white granite. While particle morphology is similar at different feed rates for both granite types, particle agglomeration is more pronounced at different feed rates compared to that at different polishing speeds.
- EDX investigations show that the Si content (wt%) of particles emitted depends on the polishing conditions and on the grit size of the abrasive used for polishing. A relationship was proposed to predict the Si wt% as a function of the feed rate during polishing. Increasing the polishing speed and feed rate both reduce the Si content.
Supplementary Materials
Author Contributions
Funding
Institutional Review Board Statement
Informed Consent Statement
Data Availability Statement
Acknowledgments
Conflicts of Interest
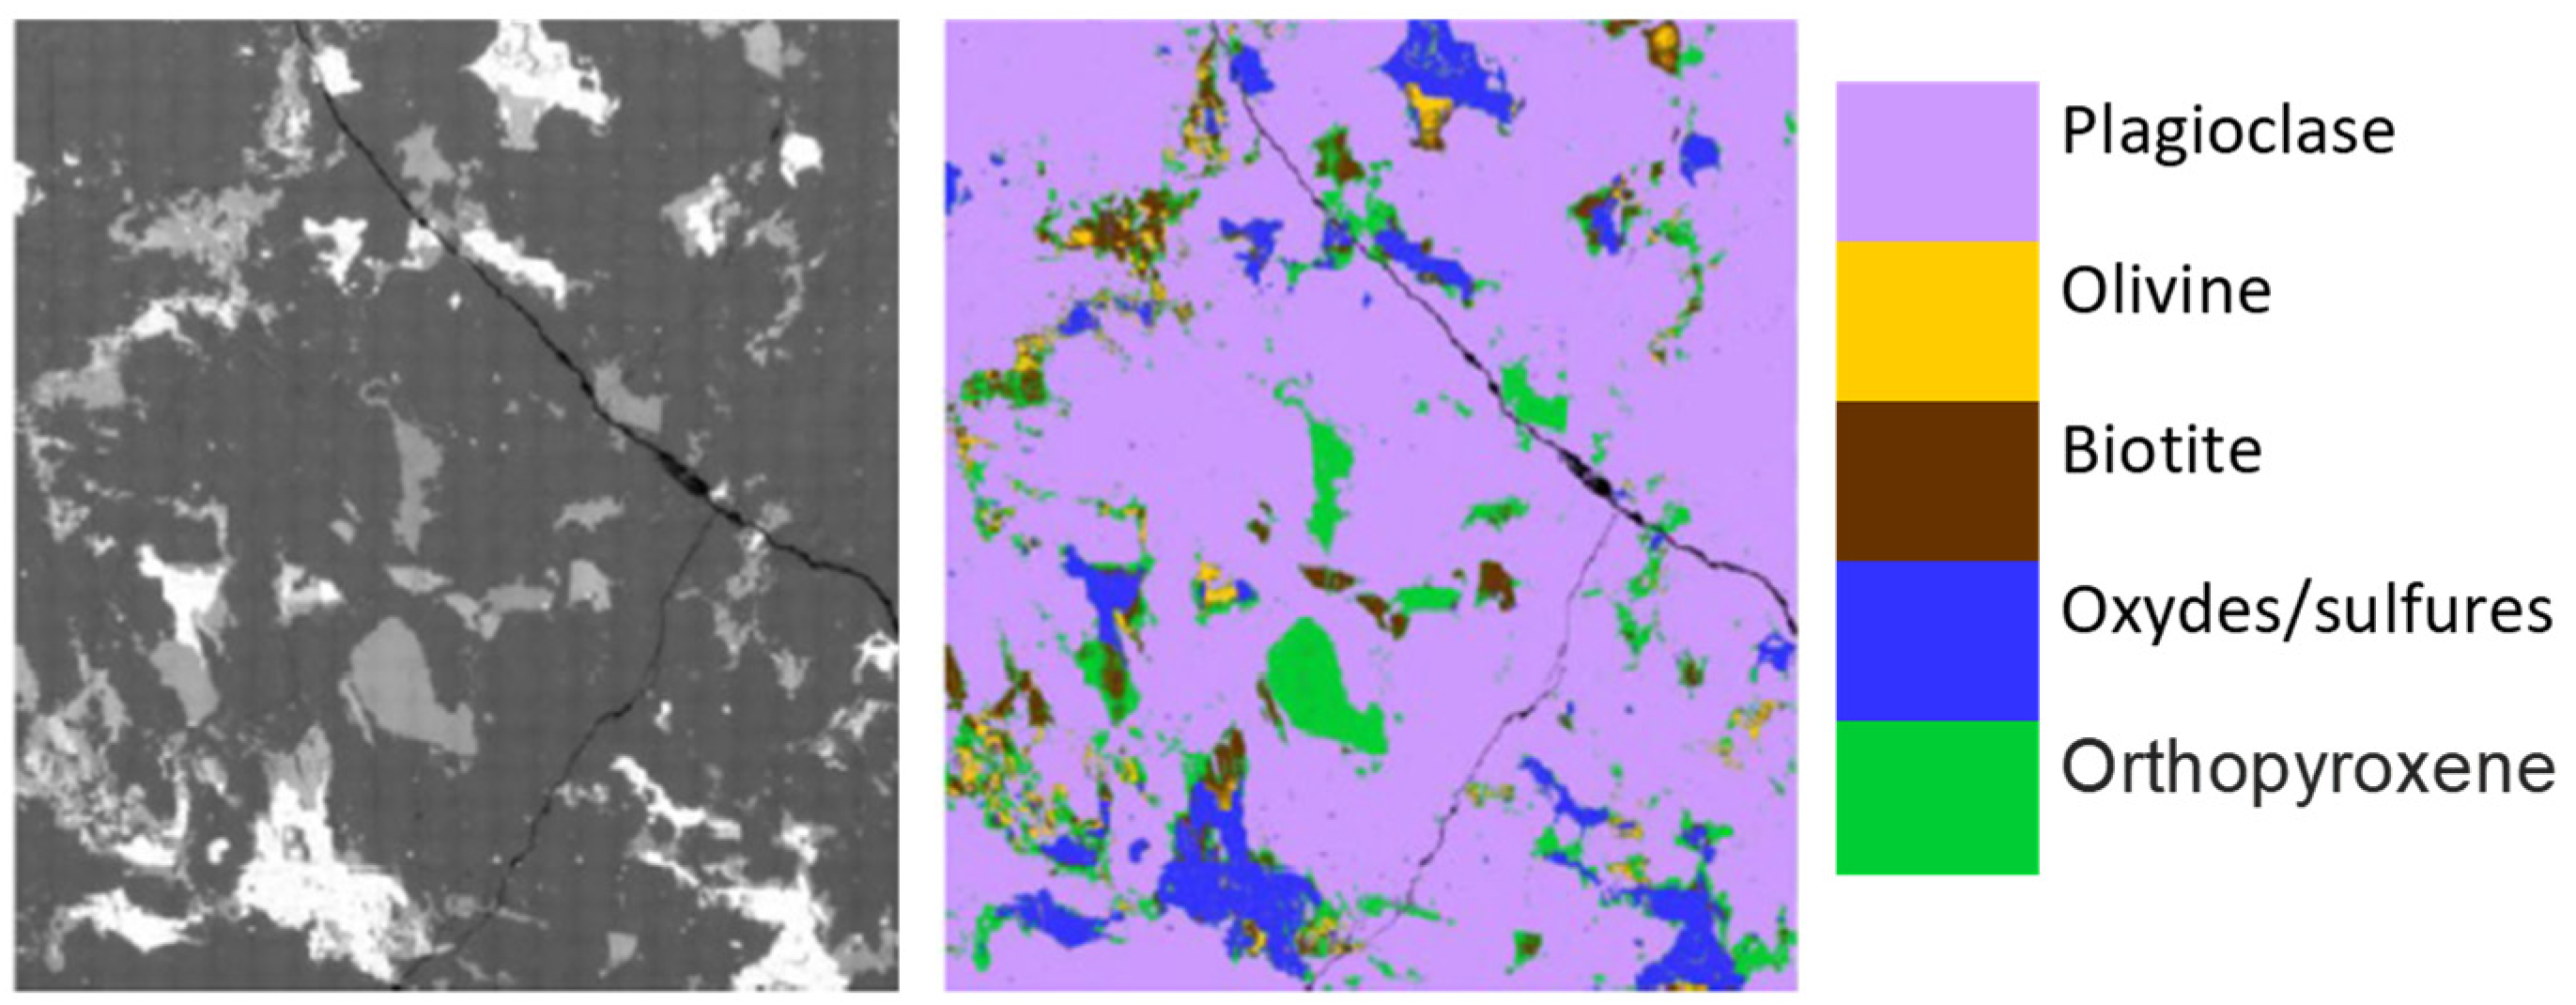
Appendix A. Mineralogical Data for the Granites Used in This Study


| White Granite | Canadian Anorthosite | ||
|---|---|---|---|
| Mineral | Proportion (%) ± 2% | Mineral | Proportion (%) ± 2% |
| Quartz | 41.38 | Quartz | 0 |
| Plagioclase | 32.39 | Plagioclase | 83.61 |
| Feldspar-K | 23.14 | Olivine | 1.51 |
| Biotite | 1.14 | Biotite | 2.83 |
| Oxides/biotite | 1.95 | Oxides/sulphides | 5.20 |
| Orthopyroxene | 6.85 | ||
References
- Yilmaz, N.G.; Goktan, R.M.; Gasan, H.; Celik, O.N. Particle size distribution and shape characterization of the chips produced during granite machining in relation to process forces and specific energy. Part. Sci. Technol. 2013, 31, 277–286. [Google Scholar] [CrossRef]
- Ling, Y. Investigation on the characteristics of damaged surface layer of marble during polishing. Abras. Grind. 1993, 74, 212–220. [Google Scholar]
- Li, X.D. The Research on the Mechanism and Technology of Rock Grinding and Polishing. Ph.D. Thesis, Dalian University of Technology, Dalian, China, 1990. [Google Scholar]
- Huang, H.; Li, Y.; Shen, J.Y.; Zhu, H.M.; Xu, X.P. Microstructure detection of a glossy granite surface machined by the grinding process. J. Mater. Processing Technol. 2002, 129, 403–407. [Google Scholar] [CrossRef]
- Xie, J. Precision grind ability of granite in Relation to Discrete Distribution Parameters of Microhardness and Microbrittleness. J. Manuf. Sci. Eng. 2010, 132, 1–7. [Google Scholar] [CrossRef]
- Xie, J.; Tamaki, J. Parameterization of micro-hardness distribution in granite related to abrasive machining performance. J. Mater. Processing Technol. 2007, 186, 253–258. [Google Scholar] [CrossRef]
- Goyer, N.; Bahloul, A.; Veillette, C. Prévention de L’exposition des Travailleurs à la Silice. Guide de CNESST 2010 (En Lgine). Available online: http://www.csst.qc.ca/NR/rdonlyres/E1E756BF-3252-4987-8989-89617519FAAF/7633/DC200_1039web1.pdf (accessed on 15 November 2010).
- Ahmad, I.; Khan, M.I.; Patil, G. Nanotoxicity of occupational dust generated in granite stone saw mill. In Proceedings of the International Conference on Nanoscience, Technology and Societal Implications, Bhubaneswar, India, 8–10 December 2011. [Google Scholar]
- Pozzi, R.; De Barardis, B.; Paoletti, L.; Guastadisegni, C. Inflammatory mediators induced by coarse (PM2.5–10) and fine (PM2.5) urban air particles in RAW 264.7 cells. Toxicology 2003, 183, 143–254. [Google Scholar] [CrossRef]
- Chung, A. The uptake of mineral particles by pulmonary epithelial cells. Am. J. Respir. Crit. Care Med. 1996, 154, 1124–1140. [Google Scholar]
- Graham, W.G.; Costello, J.; Vacek, P.M. Vermont granite mortality study: An update with an emphasis on lung cancer. J. Occup. Environ. Med. 2004, 46, 459–466. [Google Scholar] [CrossRef]
- Kulkarni, G.K. Prevention and control of silicosis: A national challenge. Indian J. Occup. Environ. Med. 2007, 11, 95–96. [Google Scholar] [CrossRef] [Green Version]
- Seaton, A.; MacNee, W.; Godden, D.; Donaldson, K. Particulate air pollution and acute health effects. Lancet 1995, 345, 176–178. [Google Scholar] [CrossRef]
- Sutherland, J.W.; Kulur, V.N.; King, N.C. Experimental investigation of air quality in wet and dry turning. CIRP Ann. Manuf. Technol. 2000, 49, 61–64. [Google Scholar] [CrossRef]
- Songmene, V.; Balout, B.; Masounave, J. Clean machining: Experimental investigation on dust formation: Part I and Part II. Int. J. Environ. Conscious Mach. ECDM 2008, 14, 1–33. [Google Scholar]
- Kouam, J.; Songmene, V.; Djebara, A.; Khettabi, R. Effect of Friction Testing of Metals on Particle Emission. J. Mater. Eng. Perform. 2012, 21, 965–972. [Google Scholar] [CrossRef] [Green Version]
- Khettabi, R.; Fatmi, L.; Masounave, J.; Songmene, V. On the micro and nanoparticule emission during machining of titanium and aluminum alloys. J. Manuf. Sci. Technol. 2013, 6, 175–180. [Google Scholar] [CrossRef]
- Saidi, M.N.; Songmene, V.; Kouam, J.; Bahloul, A. A study of surface quality and dust particles emission and dispersion during dry polishing of granite. Int. J. Adv. Manuf.Technol. 2019, 104, 4675–4684. [Google Scholar] [CrossRef]
- OSHA. Silica, Crystalline. 2016. Available online: https://www.osha.gov/dsg/topics/silicacrystalline/health_effects_silica.html (accessed on 19 February 2021).
- Songmene, V.; Miazza, A.; Hechmi, M.A.; Olufayo, O.A.; Kouam, J. Granite polishing: Effects of polishing parameters and tool paths on part quality and dust emission. Procedia CIRP 2018, 77, 139–142. [Google Scholar] [CrossRef]
- Songmene, V.; Kouam, J.; Bahloul, A. Effect of minimum quantity lubrication (MQL) on fine and ultrafine particle emission and distribution during polishing of granite. Measurement 2018, 114, 398–408. [Google Scholar] [CrossRef]
- Bahloul, A.; Jorge, R.F.V.; Djebara, A.; Songmene, V.; Saidi, M.N.; Kouam, J.; Reggio, M.; Villalpando, F. Transformation du Granit—Caractérisation et Contrôle de la Poussière de la Silice Émise par le Polissage, Rapport Scientifique R-1054; IRSST: Montréal, QC, Canada, 2019; 115p, Available online: https://www.irsst.qc.ca/media/documents/PubIRSST/R-1054.pdf?v=2019-06-12 (accessed on 14 May 2022).
- De Azevedo, A.R.G.; Marvila, M.T.; da Silva Barroso, L.; Zanelato, E.B.; Alexandre, J.; de Castro Xavier, G.; Monteiro, S.N. Effect of Granite Residue Incorporation on the Behavior of Mortars. Materials 2019, 12, 1449. [Google Scholar] [CrossRef] [PubMed] [Green Version]
- Prokopski, G.; Marchuk, V.; Huts, A. The effect of using granite dust as a component of concrete mixture. Case Stud. Constr. Mater. 2020, 13, e00349. [Google Scholar] [CrossRef]
- Tangaramvong, S.; Nuaklong, P.; Khine, M.T.; Jongvivatsakul, P. The influences of granite industry waste on concrete properties with different strength grades. Case Stud. Constr. Mater. 2021, 15, e00669. [Google Scholar] [CrossRef]
- Kouam, J.; Songmene, V.; Balhoul, A. Experimental investigation on PM2.5 particle emission during polishing of granite. J. Health 2013, 5, 29–35. [Google Scholar] [CrossRef] [Green Version]
- Saidi, M.N.; Songmene, V.; Kouam, J.; Bahloul, A. Experimental investigation on fine particle emission during granite polishing process. Int. J. Adv. Manuf. Technol. 2015, 81, 2109–2121. [Google Scholar] [CrossRef]
- Saidi, M.N.; Songmene, V.; Kouam, J.; Bahloul, A. Rotational and translation-free polishing of granite: Surface quality and dust particles emission and dispersion. Int. J. Adv. Manuf. Technol. 2018, 98, 289–303. [Google Scholar] [CrossRef]
- Carrieri, M.; Guzzardo, C.; Farcas, D.; Cena, C.G. Characterization of silica exposure during manufacturing of artifcial stone countertops. Int. J. Environ. Res. Public Health 2020, 17, 4489. [Google Scholar] [CrossRef] [PubMed]
- Ramkissoon, C.; Gaskin, S.; Thredgold, L.; Hall, T.; Rowett, S.; Gun, R. Characterisation of dust emissions from machined engineered stones to understand the hazard for accelerated silicosis. Sci. Rep. 2022, 12, 4351. [Google Scholar] [CrossRef]
- Hall, S.; Stacey, P.; Pengelly, I.; Stagg, S.; Saunders, J.; Hambling, S. Characterizing and Comparing Emissions of Dust, Respirable Crystalline Silica, and Volatile Organic Compounds from Natural and Artificial Stones. Ann. Work. Expo. Health 2022, 66, 139–149. [Google Scholar] [CrossRef]
- Kouam, J.; Ait-Ahcene, T.; Plaiasu, A.G.; Abrudeanu, M.; Motoc, A.; Beche, E.; Monty, C. Characterization and properties of ZnO based nanopowders prepared by solar physical vapor deposition (SPVD). J. Sol. Energy 2008, 82, 226–238. [Google Scholar] [CrossRef]
- Bragg, L. The Crystalline State 1; G. Bell: London, UK, 1949. [Google Scholar]
- Haithem, B.; Songmene, V.; Kouam, J.; Samuel, A.M.; Samuel, F.H. CNC edge finishing of granite: Effect of machining conditions on part quality, cutting forces and particle emissions. Materials 2021, 14, 6496. [Google Scholar]


| White granite | Black granite (Canadian anorthosite) |
 |  |
 |  |
Publisher’s Note: MDPI stays neutral with regard to jurisdictional claims in published maps and institutional affiliations. |
© 2022 by the authors. Licensee MDPI, Basel, Switzerland. This article is an open access article distributed under the terms and conditions of the Creative Commons Attribution (CC BY) license (https://creativecommons.org/licenses/by/4.0/).
Share and Cite
Kouam, J.; Songmene, V.; Bahloul, A.; Samuel, A.M. Characterization of Si and SiO2 in Dust Emitted during Granite Polishing as a Function of Cutting Conditions. Materials 2022, 15, 3965. https://doi.org/10.3390/ma15113965
Kouam J, Songmene V, Bahloul A, Samuel AM. Characterization of Si and SiO2 in Dust Emitted during Granite Polishing as a Function of Cutting Conditions. Materials. 2022; 15(11):3965. https://doi.org/10.3390/ma15113965
Chicago/Turabian StyleKouam, Jules, Victor Songmene, Ali Bahloul, and Agnes M. Samuel. 2022. "Characterization of Si and SiO2 in Dust Emitted during Granite Polishing as a Function of Cutting Conditions" Materials 15, no. 11: 3965. https://doi.org/10.3390/ma15113965
APA StyleKouam, J., Songmene, V., Bahloul, A., & Samuel, A. M. (2022). Characterization of Si and SiO2 in Dust Emitted during Granite Polishing as a Function of Cutting Conditions. Materials, 15(11), 3965. https://doi.org/10.3390/ma15113965