1. Introduction
Ferroelectric ceramics were regarded as an important class of functional materials for the capability of transformation between electric and mechanical energy. After decades of difficult exploration, some excellent species of modified lead-based ceramics, with ideal electromechanical coupling properties, were synthesized and are extensively utilized in electromechanical devices nowadays, such as actuators and sensors [
1]. With their commercial market growing briskly, serious environmental issues induced by toxic heavy metal lead gained so much attention that there has been much investigation into lead-free substitutions since the beginning of the 21st century. Under this external demand, the (Bi
0.5Na
0.5)TiO
3 (BNT) ceramic was invented in the 1960s. With high remnant polarization and strong electromechanical coupling effects, BNT-based systems were deemed promising candidates for replacing their lead-based counterparts [
2,
3]. Having experienced a series of systematic modification, BNT-based ceramics overcame many shortcomings, with the exception of one remaining issue; that is, the deficiency of low operation temperature [
4]. Further detailed works reveal that if heated, BNT exhibits the depolarization characteristic, giving rise to domain decomposition [
5]. Hence, there is an upper limit of the working temperature, represented by the depolarization temperature
Td. Typically,
Td of BNT-based ceramics is below 100 °C, which is much lower than their Curie point (often beyond 300 °C) [
6]. To achieve their practical application, an elevation of
Td is needed.
The occurrence of the depolarization phenomenon is related to the characteristic transition from ferroelectric (FE) to ergodic relaxor (ER) state in BNT-based systems [
7]. Generally, without electric or mechanical loading, many polar nanoregions (PNRs) reside in the initial BNT ceramic at room temperature. These PNRs possess enough correlation length and lower dynamic activity to cause stronger coupling interaction among them [
8]. From the view of statistical physics, their spatially-averaged behavior over the finite region of a matrix is deviated from the temporally-averaged over finite time. This state is usually referred to as nonergodic relaxor (NR) state. With an electric field applied, the PNRs cluster and reorient themselves to irreversibly form domains, inducing the transformation from NR to the ferroelectric state (FE) [
9]. Since the activity of PNRs increases during the heating process, the stability of these domains greatly depends on the ambient temperature, bringing on an obvious relaxor phenomenon. BNT-based ceramics turn into the ergodic relaxor state (ER) as long as the threshold, that is, the FE–ER transition temperature
TF-R, is reached [
5,
7]. Due to domain decomposition, the piezoelectricity of the poled ceramics is lost in ER. Although there may be slight distinctions between
Td and
TF-R, they both equally originate from the depolarization behavior [
10].
Although the underlying mechanism is not understood profoundly, modern ferroelectric theory attributes the depolarization behavior to the inhomogeneous random field [
11]. From this point of view, in view of many uncertain factors including the disordered distribution of Bi
3+ and Na
+ in A site of perovskite structure, the defects induced by ion volatilization, etc., the local electric field should vary rapidly so that the BNT ceramic behaves as a ferroelectric relaxor with an inadequate
Td. For the same reason, traditional methods of modification, such as doping or forming solid solutions, fail to increase
Td efficiently, which delays the progress of practical application of BNT-based ceramics. In 2015, by introducing semiconductor ZnO nanoparticles to BNT–BT matrix, Zhang et al. prepared a 0–3 type composite, with no obvious depolarization behavior detected below 120 °C [
12], while the
Td of pure BNT–BT is below 100 °C. To understand the mechanism, a hypothesis that there are bound charges at grain boundaries to compensate for remnant polarization during heating was put forward [
12]. In 2016, Mahajan et al. repeated the investigation of the BNT–BT/ZnO composite, and a huge rise in
Td, of about 40 °C, was observed. Having analyzed the variation of crystal structure, some important impurity phases, such as Bi(Zn
0.5Ti
0.5)O
3, induced by the diffusion of Zn
2+ ions into the lattice, were suggested as the primary cause of the retarded depolarization behavior, from which a model based on ion diffusion was established [
13]. Some related results of BNT–BZT/ZnO composites also support this idea [
14].
Considering that the semiconductor nature of ZnO particles is adverse to holding bound charges, the compensation model seems insufficient to explain the increase in
Td individually. For the ion diffusion model, there is no evidence in published documents that Zn
2+ doping enhances
Td. Hence, there must be another factor causing the deferred depolarization besides these two effects. Inspired by the fact that external uniaxial mechanical stress is capable of inducing ferroelectric order [
11], Riemer et.al focus on the residual thermal stress at boundaries originating from the difference in the thermal expansion coefficient between ZnO and the matrix [
15]. A hypothesis of interface-stress suppressing depolarization was put forward. In site temperature-dependent TEM research demonstrates that the regions where depolarization starts to take place is far from the ZnO/matrix interface [
16], which is also consistent with the expectation of stress impact. Although the stress model is rational in explaining depolarization, the direct interface stress investigation was not reported. In view of the great significance of increasing
Td, some supplements to this study are necessary. Considering that previous studies on the depolarization behavior of BNT–ZnO composites were mainly carried out for the BNT–BT matrix, which is insufficient to demonstrate the universality of the modification method, in this work a multi-component system of 0.85(Bi
0.5Na
0.5)TiO
3-0.11(Bi
0.5K
0.5)TiO
3-0.04BaTiO
3 (BNKT-BT), with superior electric properties and proper
Td [
17,
18], was selected as the experimental matrix. ZnO nanoparticles were incorporated to introduce boundary stress. The impacts of ZnO on electric properties and depolarization behavior were assessed in detail. In view of the lack of direct stress characterization, stress distribution was measured with the aid of the EBSD for the first time.
3. Results and Discussion
The structure of the BNKT-BT-
xZnO composites was investigated by means of X-ray diffraction (XRD), and the results are given in
Figure 1a. For pure BNKT–BT, there is no secondary phase observed, besides a pattern of a typical perovskite structure within the equipment precision. The major phase belongs to the titanate Bi
0.5M
0.5TiO
3 (M = K, Na), implying that the solid solution BNKT–BT was well-formed. Some important details are depicted in
Figure 1b,c. An obvious peak splitting of (003) and (021), located around 40°, indicates a rhombohedral symmetry, while two diffraction peaks (002) and (200), appear around 46.5°, demonstrating a tetragonal symmetry [
19]. Hence, pure BNKT–BT ceramic maintains a rhombohedral–tetragonal morphotropic phase boundary (MPB). With ZnO content increasing, another wurtzite diffraction pattern of ZnO appears, suggesting the existence of an independent ZnO phase. Since the interaction of the matrix and ZnO nanoparticles is inevitable, a small quantity of Zn
2+ ions enters into the matrix lattice during sintering. Considering that Zn
2+ (0.74 Å) and Ti
4+ (0.605 Å) are close in radius [
13], the substitution of Zn
2+ for Ti
4+ occurs easily, shifting the diffraction peaks to a lower angle direction. The maximum value of the shift angle is 0.1°, achieved in the component
x = 0.3. Moreover, the impurity phase of Zn
2TiO
4, the impact of which is often ignored for the non-ferroelectric nature [
12], is also detected.
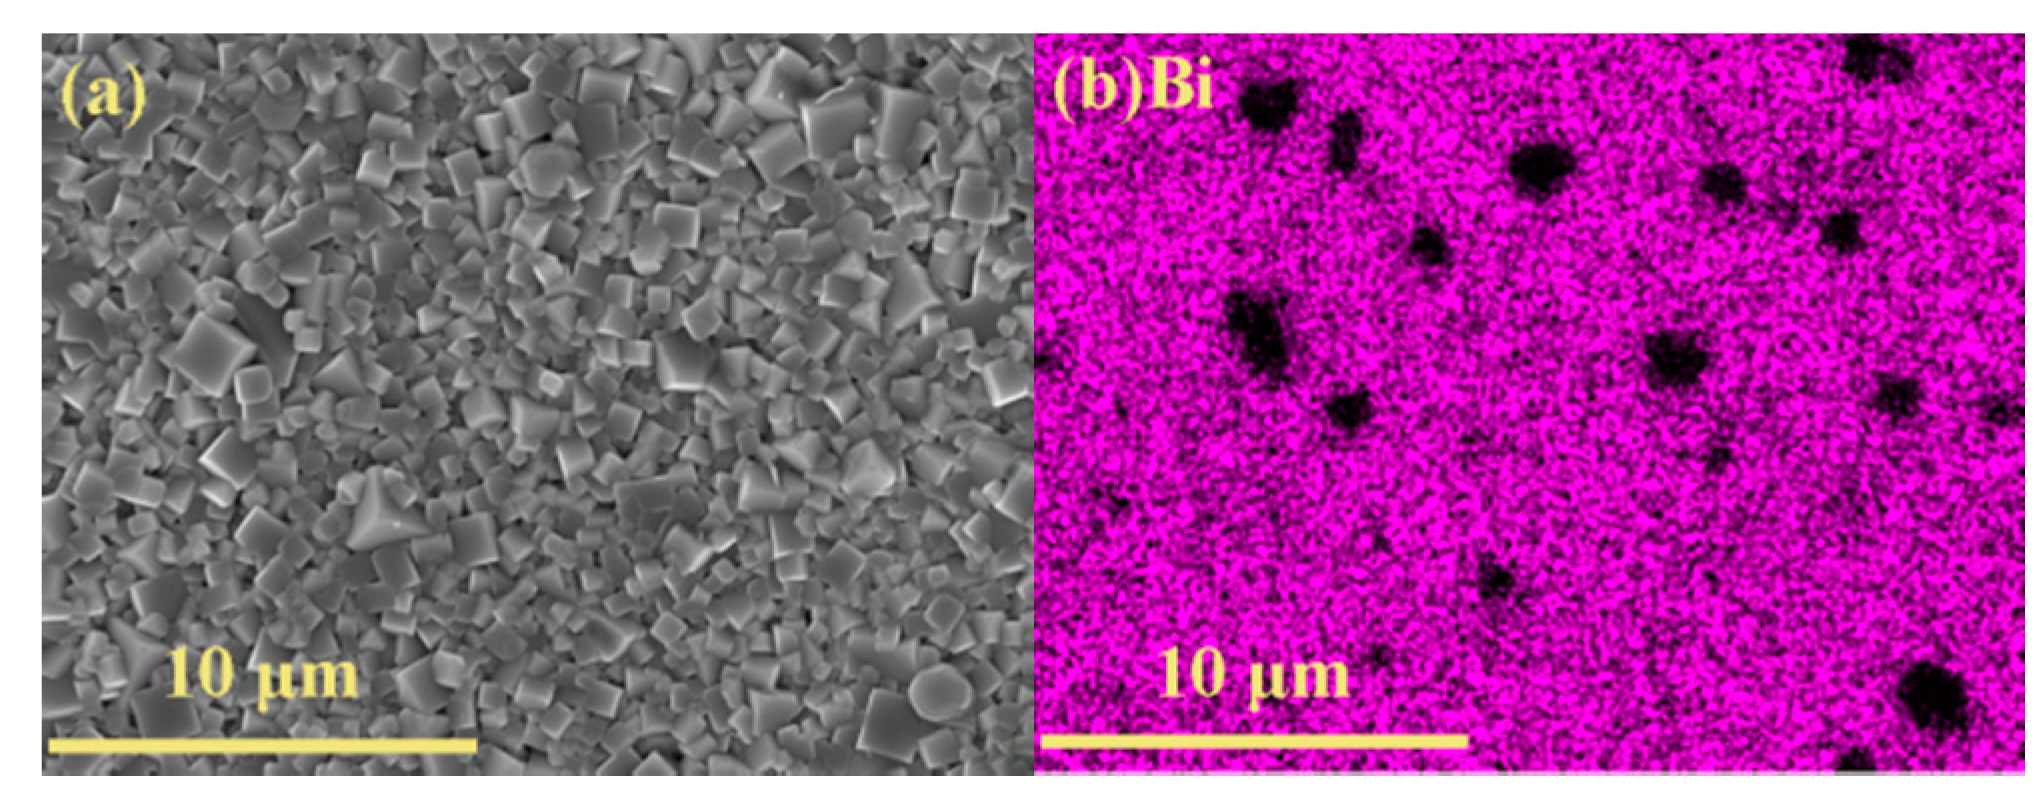
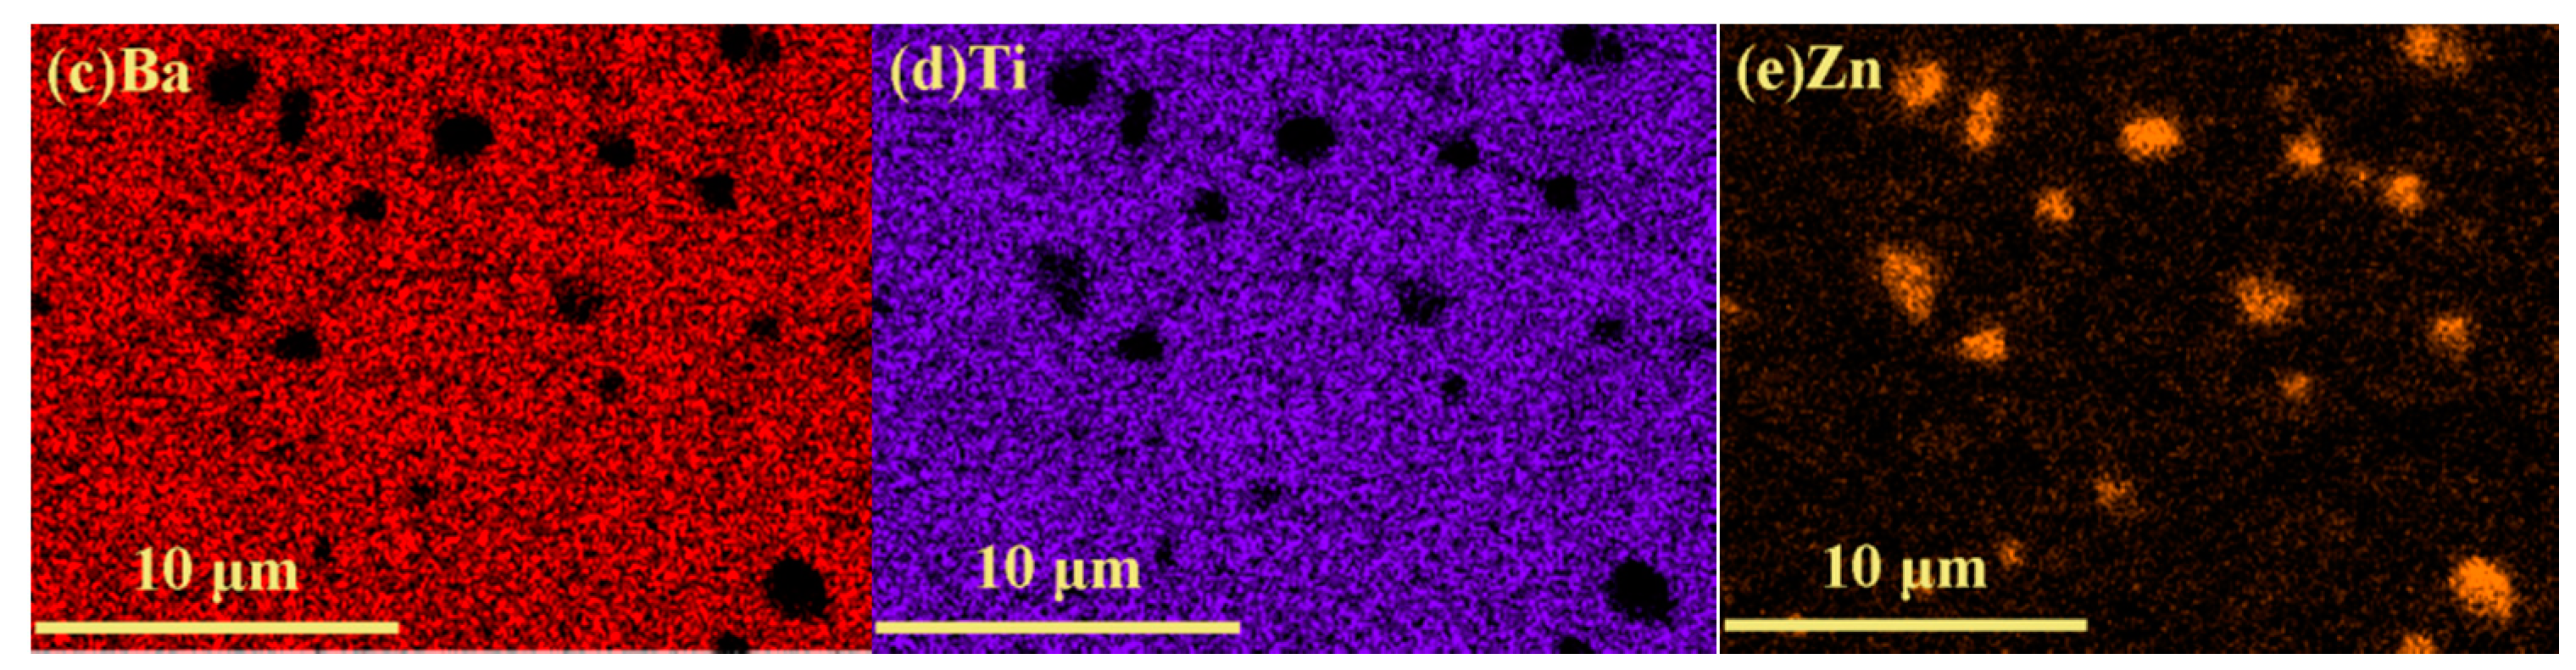
The information about Zn distribution was determined by the energy dispersive spectroscopy (EDS), and the element mapping results of BNKT-BT-0.3ZnO are presented in
Figure 2. As shown in
Figure 2a, under the influence of tetragonal BKT and BT, the grains of the ceramic composites exhibit a cubic shape after sintering. The average grain size reaches 0.91 ± 0.23 μm, demonstrating relatively inadequate growth. According to
Figure 2b, Bi locates on a wide-range connected zone, except for some micron-sized regions, and a similar distribution of Ba and Ti is also verified by
Figure 2c,d, which suggests the matrix fails to occupy the whole space. On the contrary, as shown in
Figure 2e, Zn mainly distributes in these isolated regions. The element mapping results reveal that most ZnO nanoparticles gather to grow into micron-sized enrichment areas, which insert in the matrix to form 0–3 type ceramic composites.
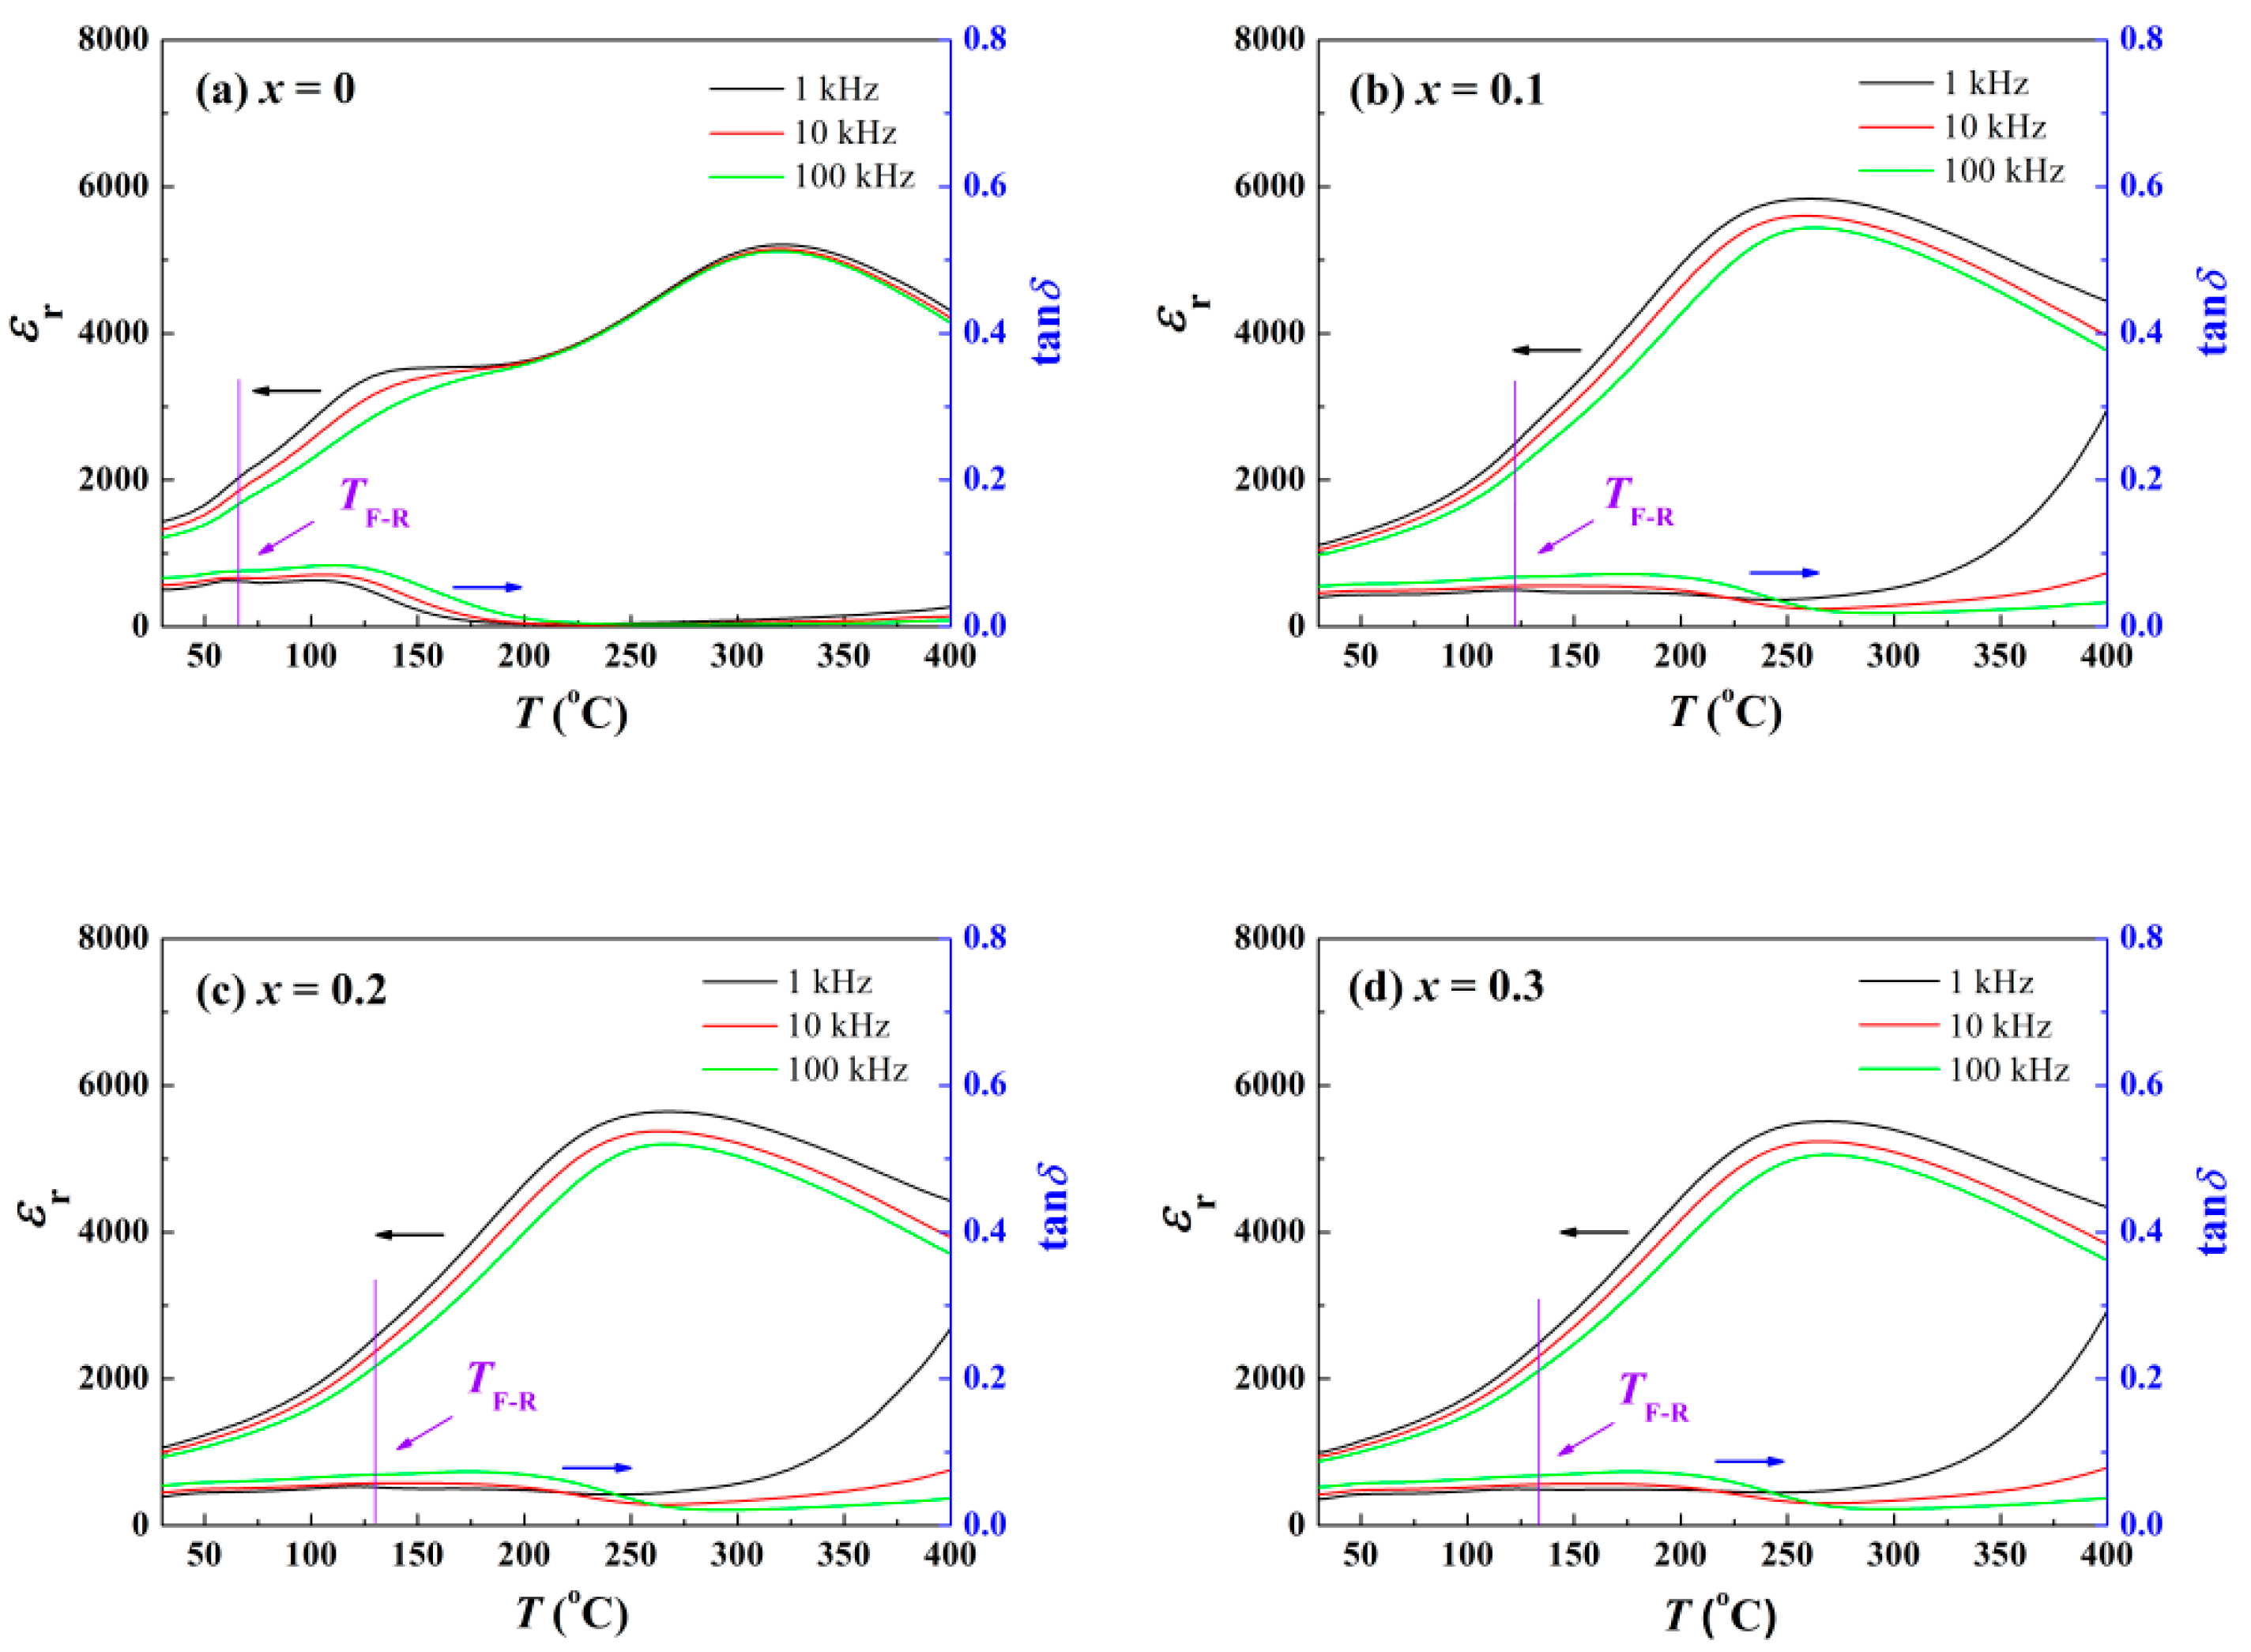
To inspect the variation in depolarization behavior, the temperature dependence of the relative dielectric constant
εr was measured. With temperature increasing, the coupling between electric dipoles decreases, on account of the enhanced dynamic activity of the PNRs. The reorientation of these dipoles better follows the change of high-frequency alternating current (AC) field, giving rise to a frequency-sensitive
εr. Due to the difference in frequency response of the dipoles in the domains and PNRs, there is a peak in the
εr-
T diagram at
TF-R [
20]. With a large number of dynamic PNRs emerging in ER, energy loss enhances, so that another peak appears in the tan
δ-
T curves. As shown in
Figure 3a, pure BNKT–BT ceramic possess an insufficient
TF-R of about 65.9 ± 2.7 °C. Since
TF-R is close to the lower limit of detection, the frequency dependence of
εr is readily noticed. When ZnO is incorporated, electric dipoles in the ZnO enrichment areas exhibit their own response to AC loading, and make a contribution to
εr distinct from those in the matrix. As a consequence, the
εr peak corresponding to
TF-R becomes obscure. According to
Figure 3b–d,
TF-R acquires a noticeable gain above 60 °C after the introduction of ZnO. The results demonstrate that the incorporation of ZnO inhibits the depolarization process efficiently. The comparison of
TF-R in the different BNT-based composite ceramics is shown in
Table 1.
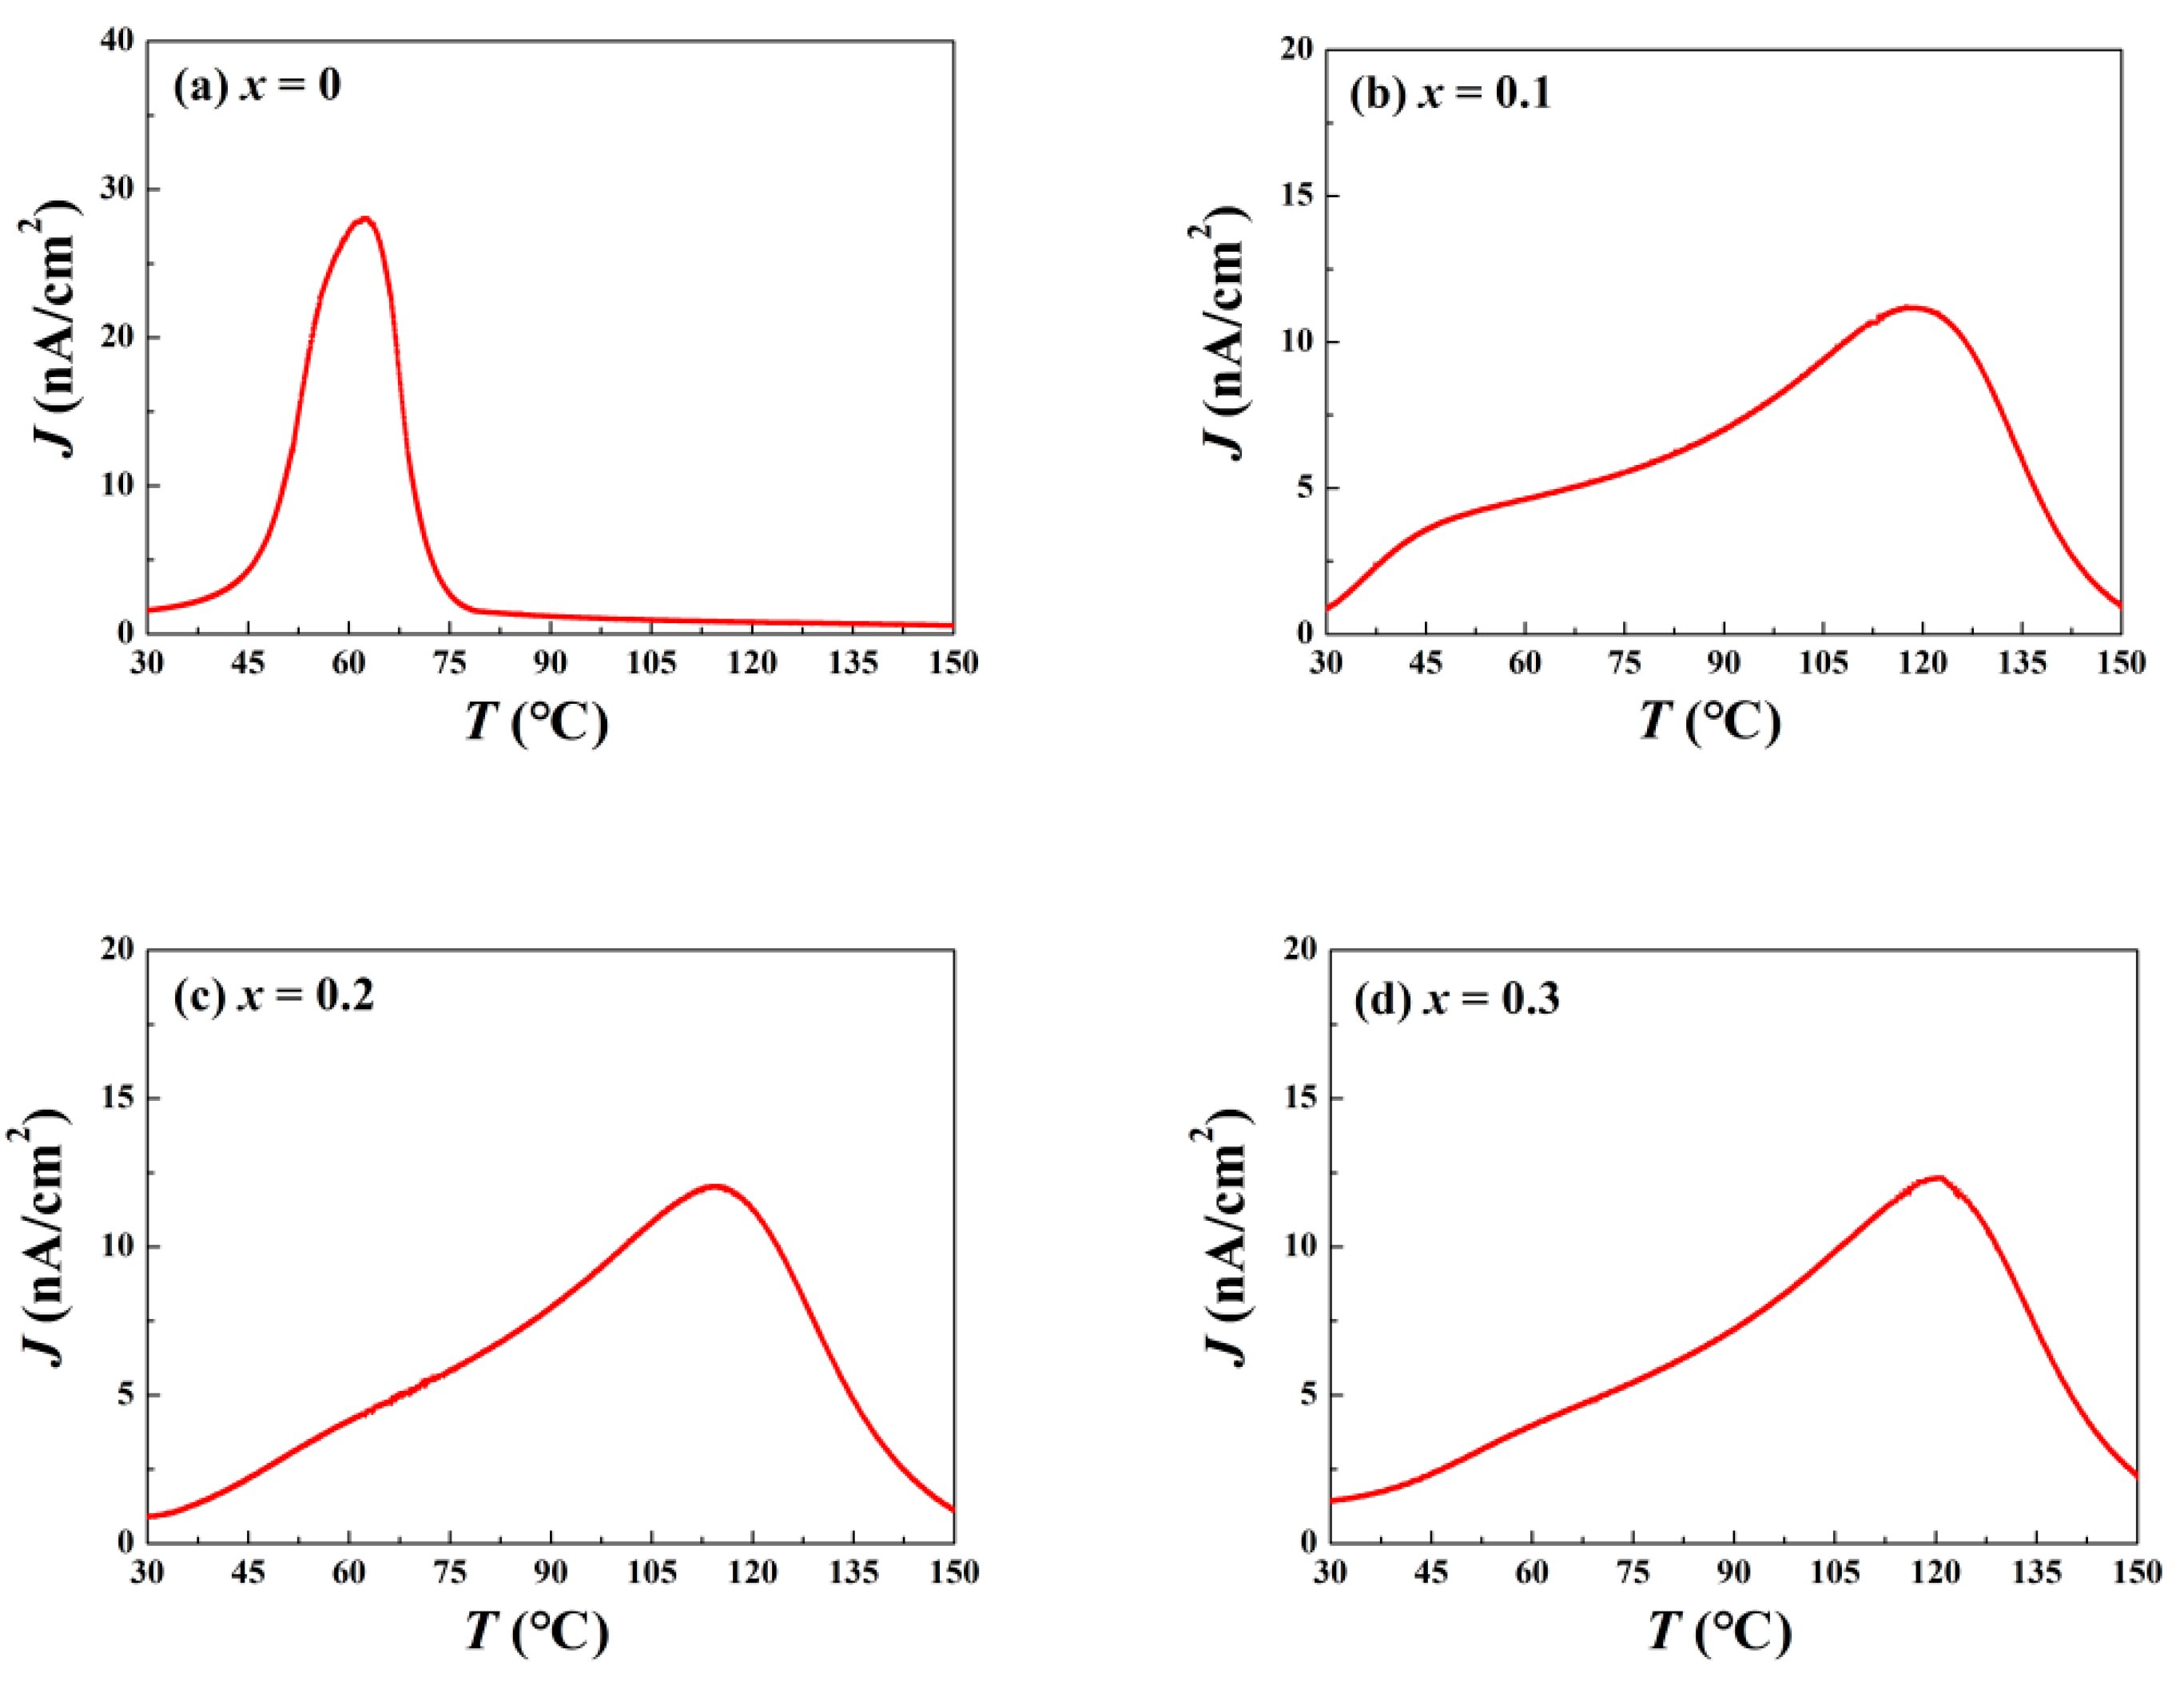
The stability of the domains is a crucial factor for ceramic piezoelectric application. A simple and relevant evaluation for this is the depolarization temperature
Td. Generally,
Td is estimated using a thermally stimulated depolarization current experiment (TSDC). At low temperatures, the energy provided by thermal fluctuation is insufficient to impact correlation length between PNRs. Although the vibration of positive and negative ions near the equilibrium position is reinforced by increasing temperature, they return to the initial sites after heating, so that the domains remain relatively stable overall [
22]. This process produces so-called pyroelectric current in external circuits. However, when the temperature is up to
Td, with a sustained decline in the correlation length of the PNRs, the ion thermal vibration becomes dramatic, and domains decompose into PNRs, which makes the ceramic system enter ER. Once bound charges neutralize inside the ceramics, the free ones attach to the silver electrodes released into the external circuits to yield the depolarization current. Unlike the traditional pyroelectric case, this current, based on domain deterioration, occurs irreversibly [
23]. The current density peak, related to the greatest decomposition rate of the domains, corresponds to
Td. The TSDC results are presented in
Figure 4. A sole peak, which indicates a continuous one-step depolarization process, is detected for all the components.
Figure 4a reveals that the
Td of the pure BNKT–BT is around 62.2 ± 2.5 °C, which is inferior to many other BNT-based ceramics. However, as long as the ZnO concentration increases to 0.1, an obvious delay for depolarization is observed, and
Td rises to 118.0 ± 3.9 °C. With greater ZnO content,
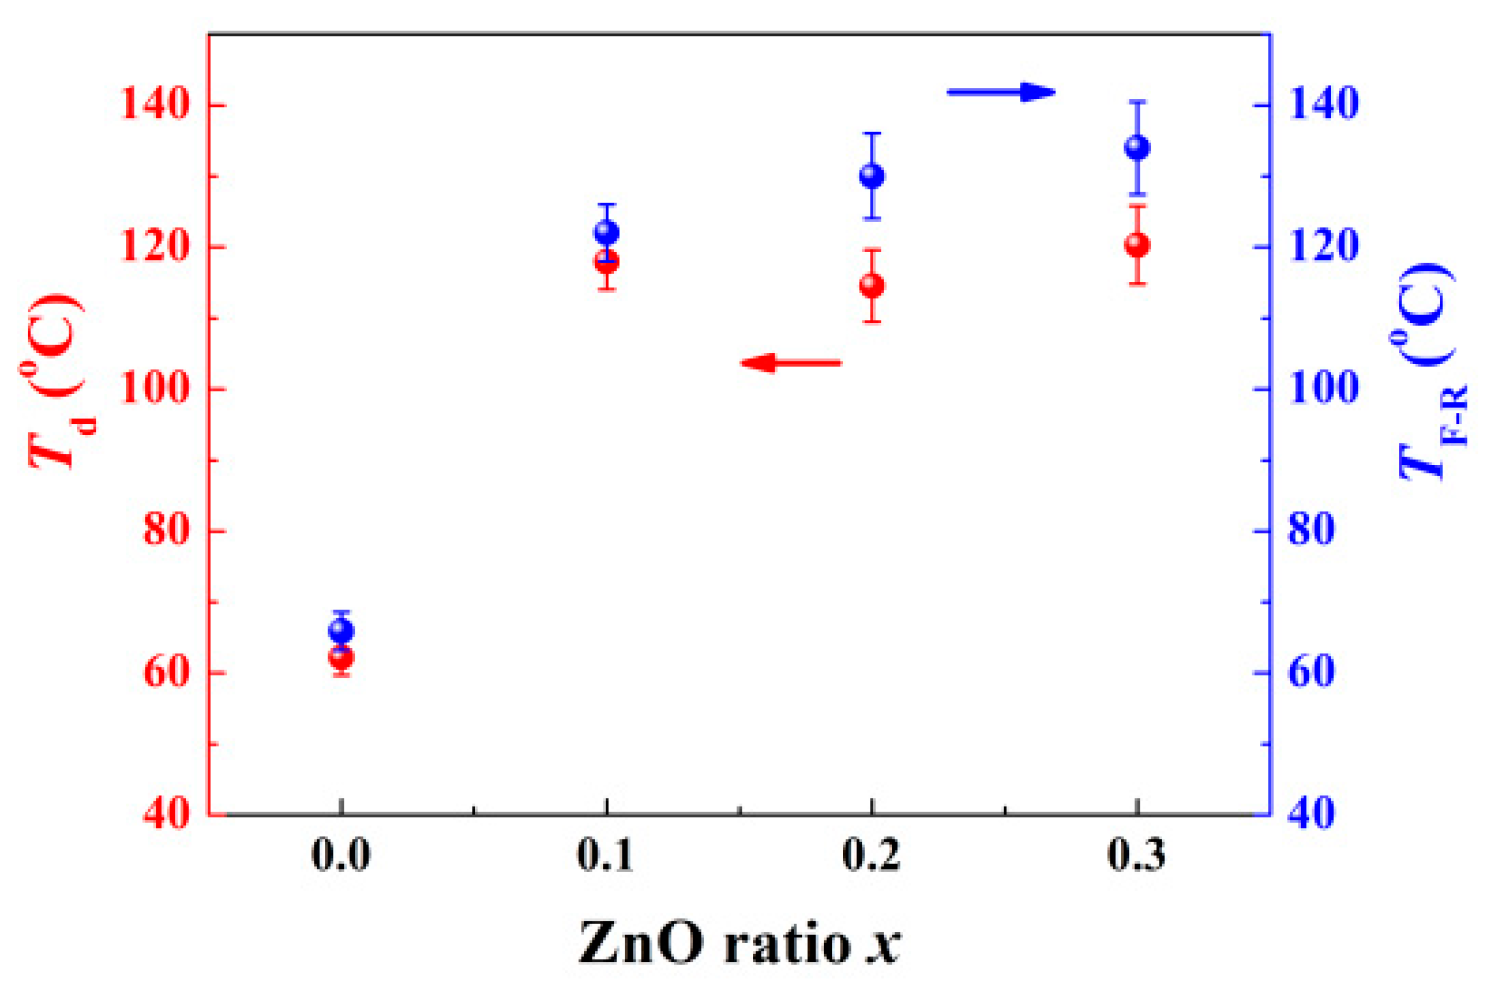
Td increases further. The variation tendency of
Td and
TF-R for all the samples is summarized in
Figure 5. In view of the limited effect of possible stress, this result does not contradict the stress field model.
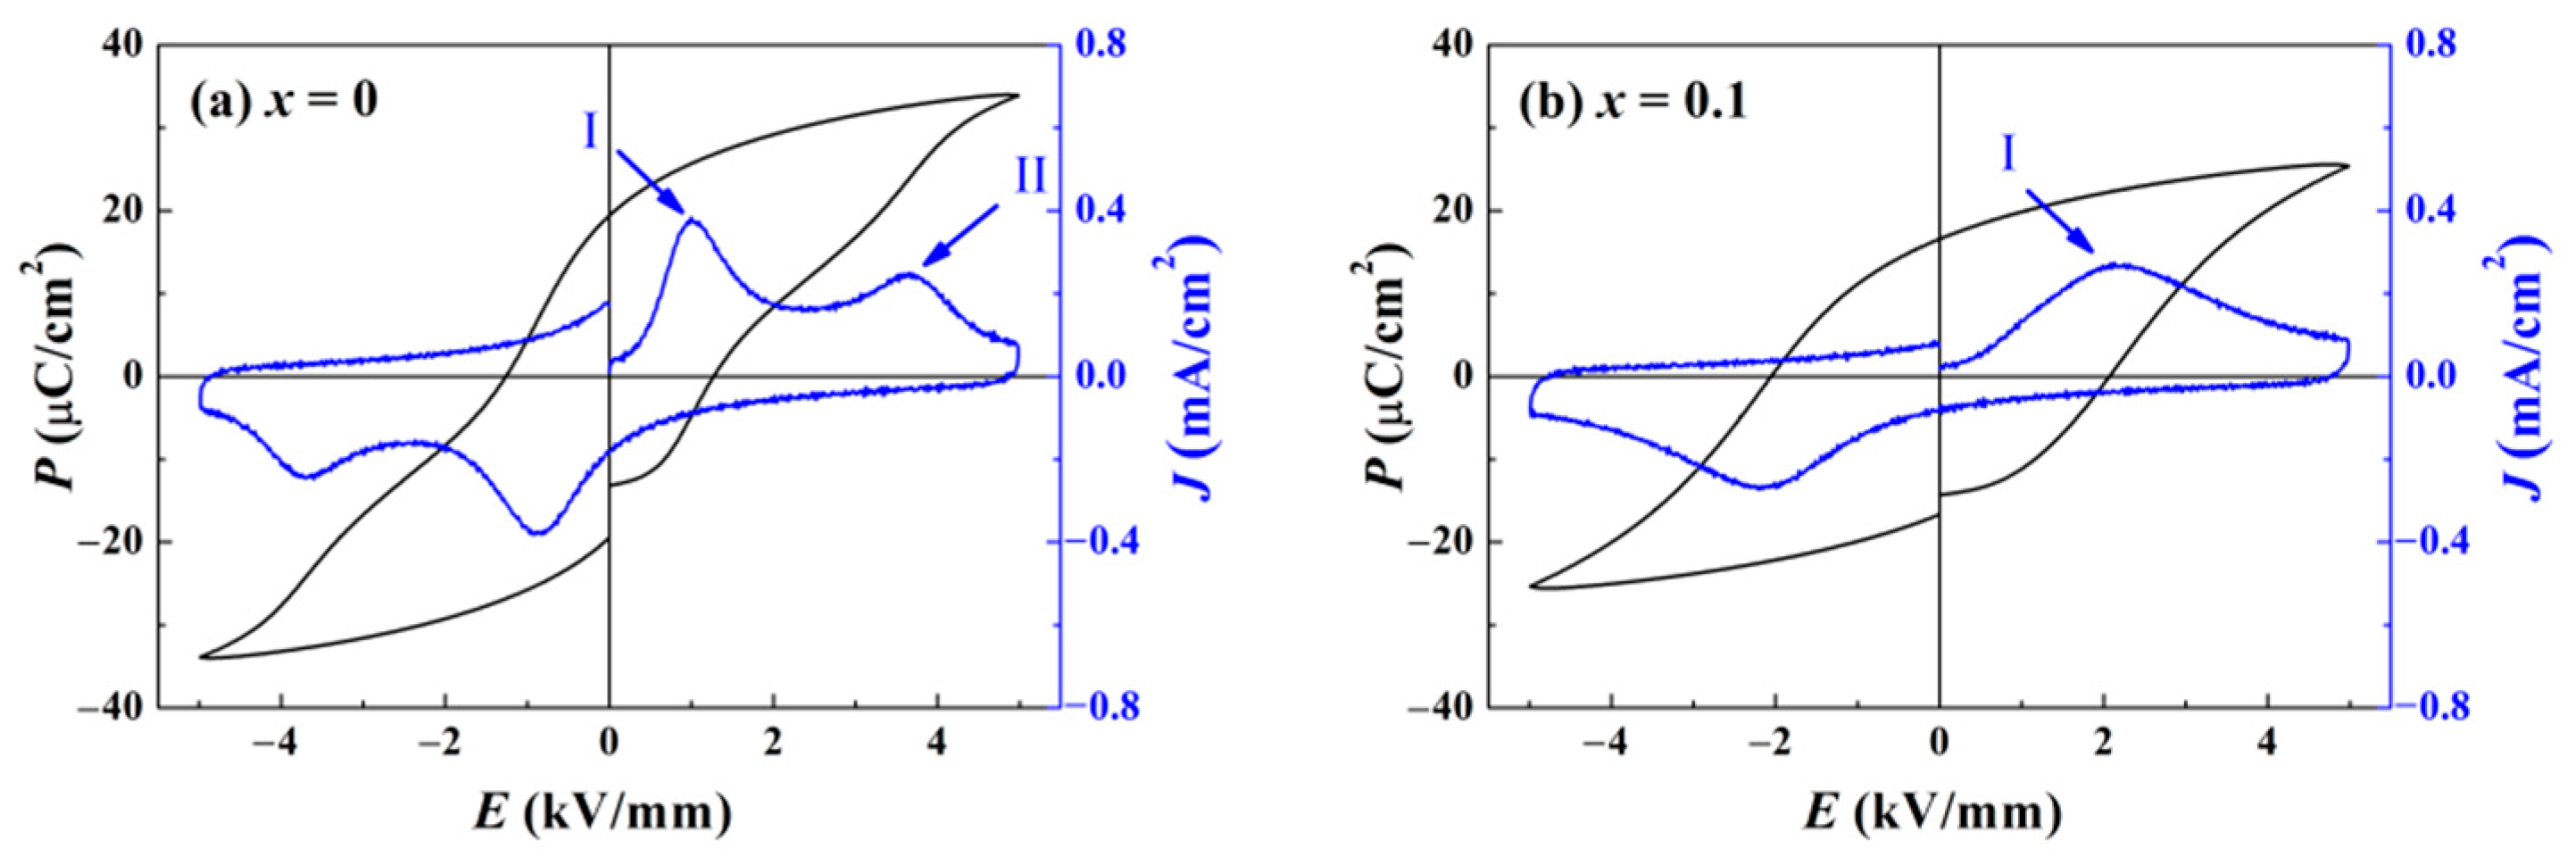
To inspect the influence of ZnO incorporation on domain reorientation and switching, the polarization
P versus electric field
E hysteresis curve (
P–
E loop) was measured for all the components at room temperature (RT). As shown in
Figure 6a, since the
TF-R of the component
x = 0 approaches RT, the
P–
E loop exhibits some ergodic characteristics, including a small coercive field
Ec and a shrinking shape. Through calculating the curve of polarization current density
J versus
E, two local maximums are discovered. The first (peak I) lies near the position of
Ec, for the reason that numerous domains switch dramatically, which implies that peak I arises from the depolarization current [
24]. The other (peak II) lies at the electric field that is about three times as great as
Ec. This phenomenon suggests a portion of the domains nucleate and develop with the assistance of high loading. Combined with the fact the electric field facilitates the growth of PNRs in relaxor ferroelectrics, the origination of peak II is attributed to the PNRs’ reorientation [
25]. With ergodic PNRs transforming into domains,
P acquire a second boost to form a jagged hysteresis loop. For pure BNKT–BT, the impact of the deep ergodic degree overlays the “hard” doping effect of Zn
2+, leading to a low
Ec. When the ratio of ZnO reaches 0.1, as shown in
Figure 6b, the loop shape is remarkably improved as a saturated ferroelectric loop. A maximum only arises around the position of
Ec in the
J–
E curve, while peak II vanishes, which demonstrates a decline in ergodic PNRs. An enhanced coercive field
Ec of 2 kV/mm is much higher than that of the component
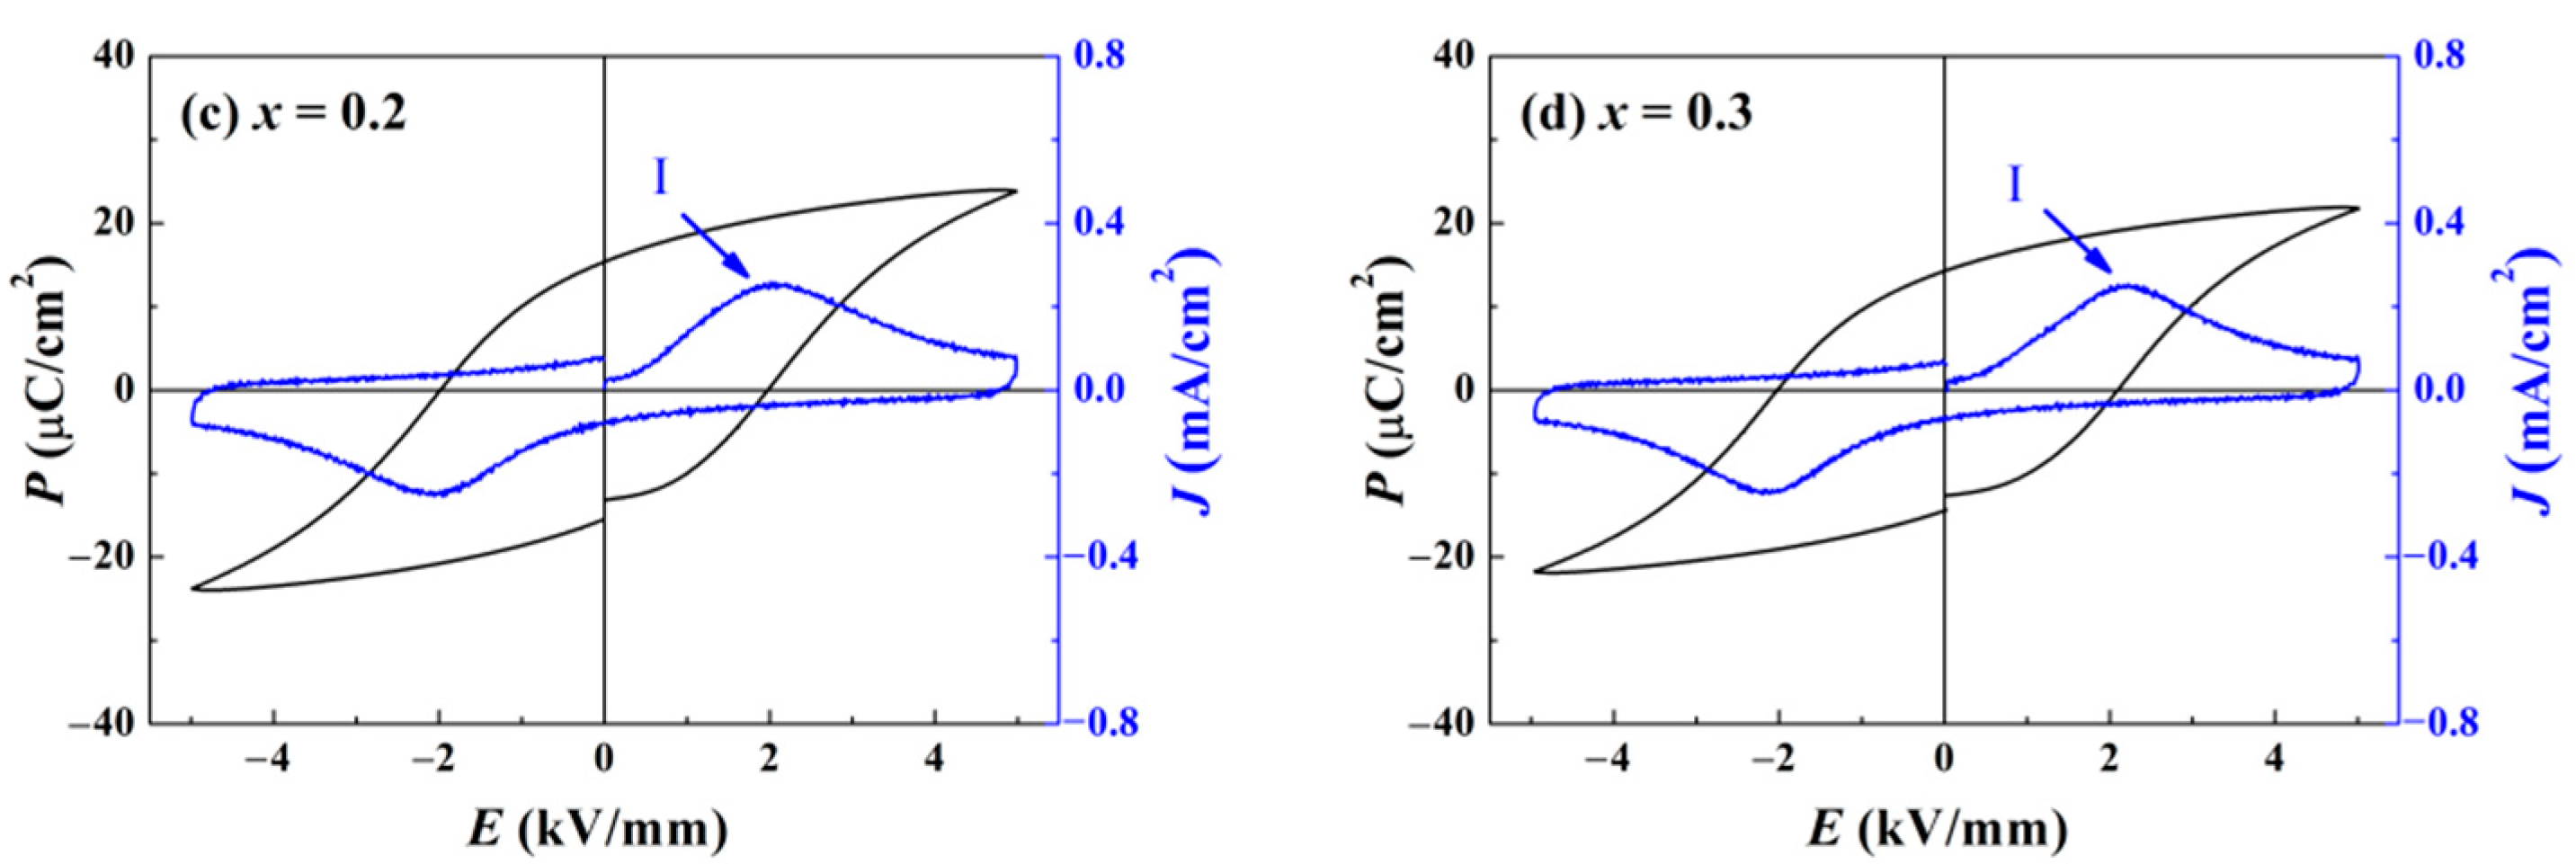
x = 0. All these variations confirm that the ergodic degree is greatly decreased. For more ZnO incorporation, as presented in
Figure 6c,d, the loop shape barely changes. An evoked drawback is simply ascribed to the decrease in
Pr and
P maximum, which is attributed to a reduced ratio of the matrix and semi-conductor characteristics of ZnO.
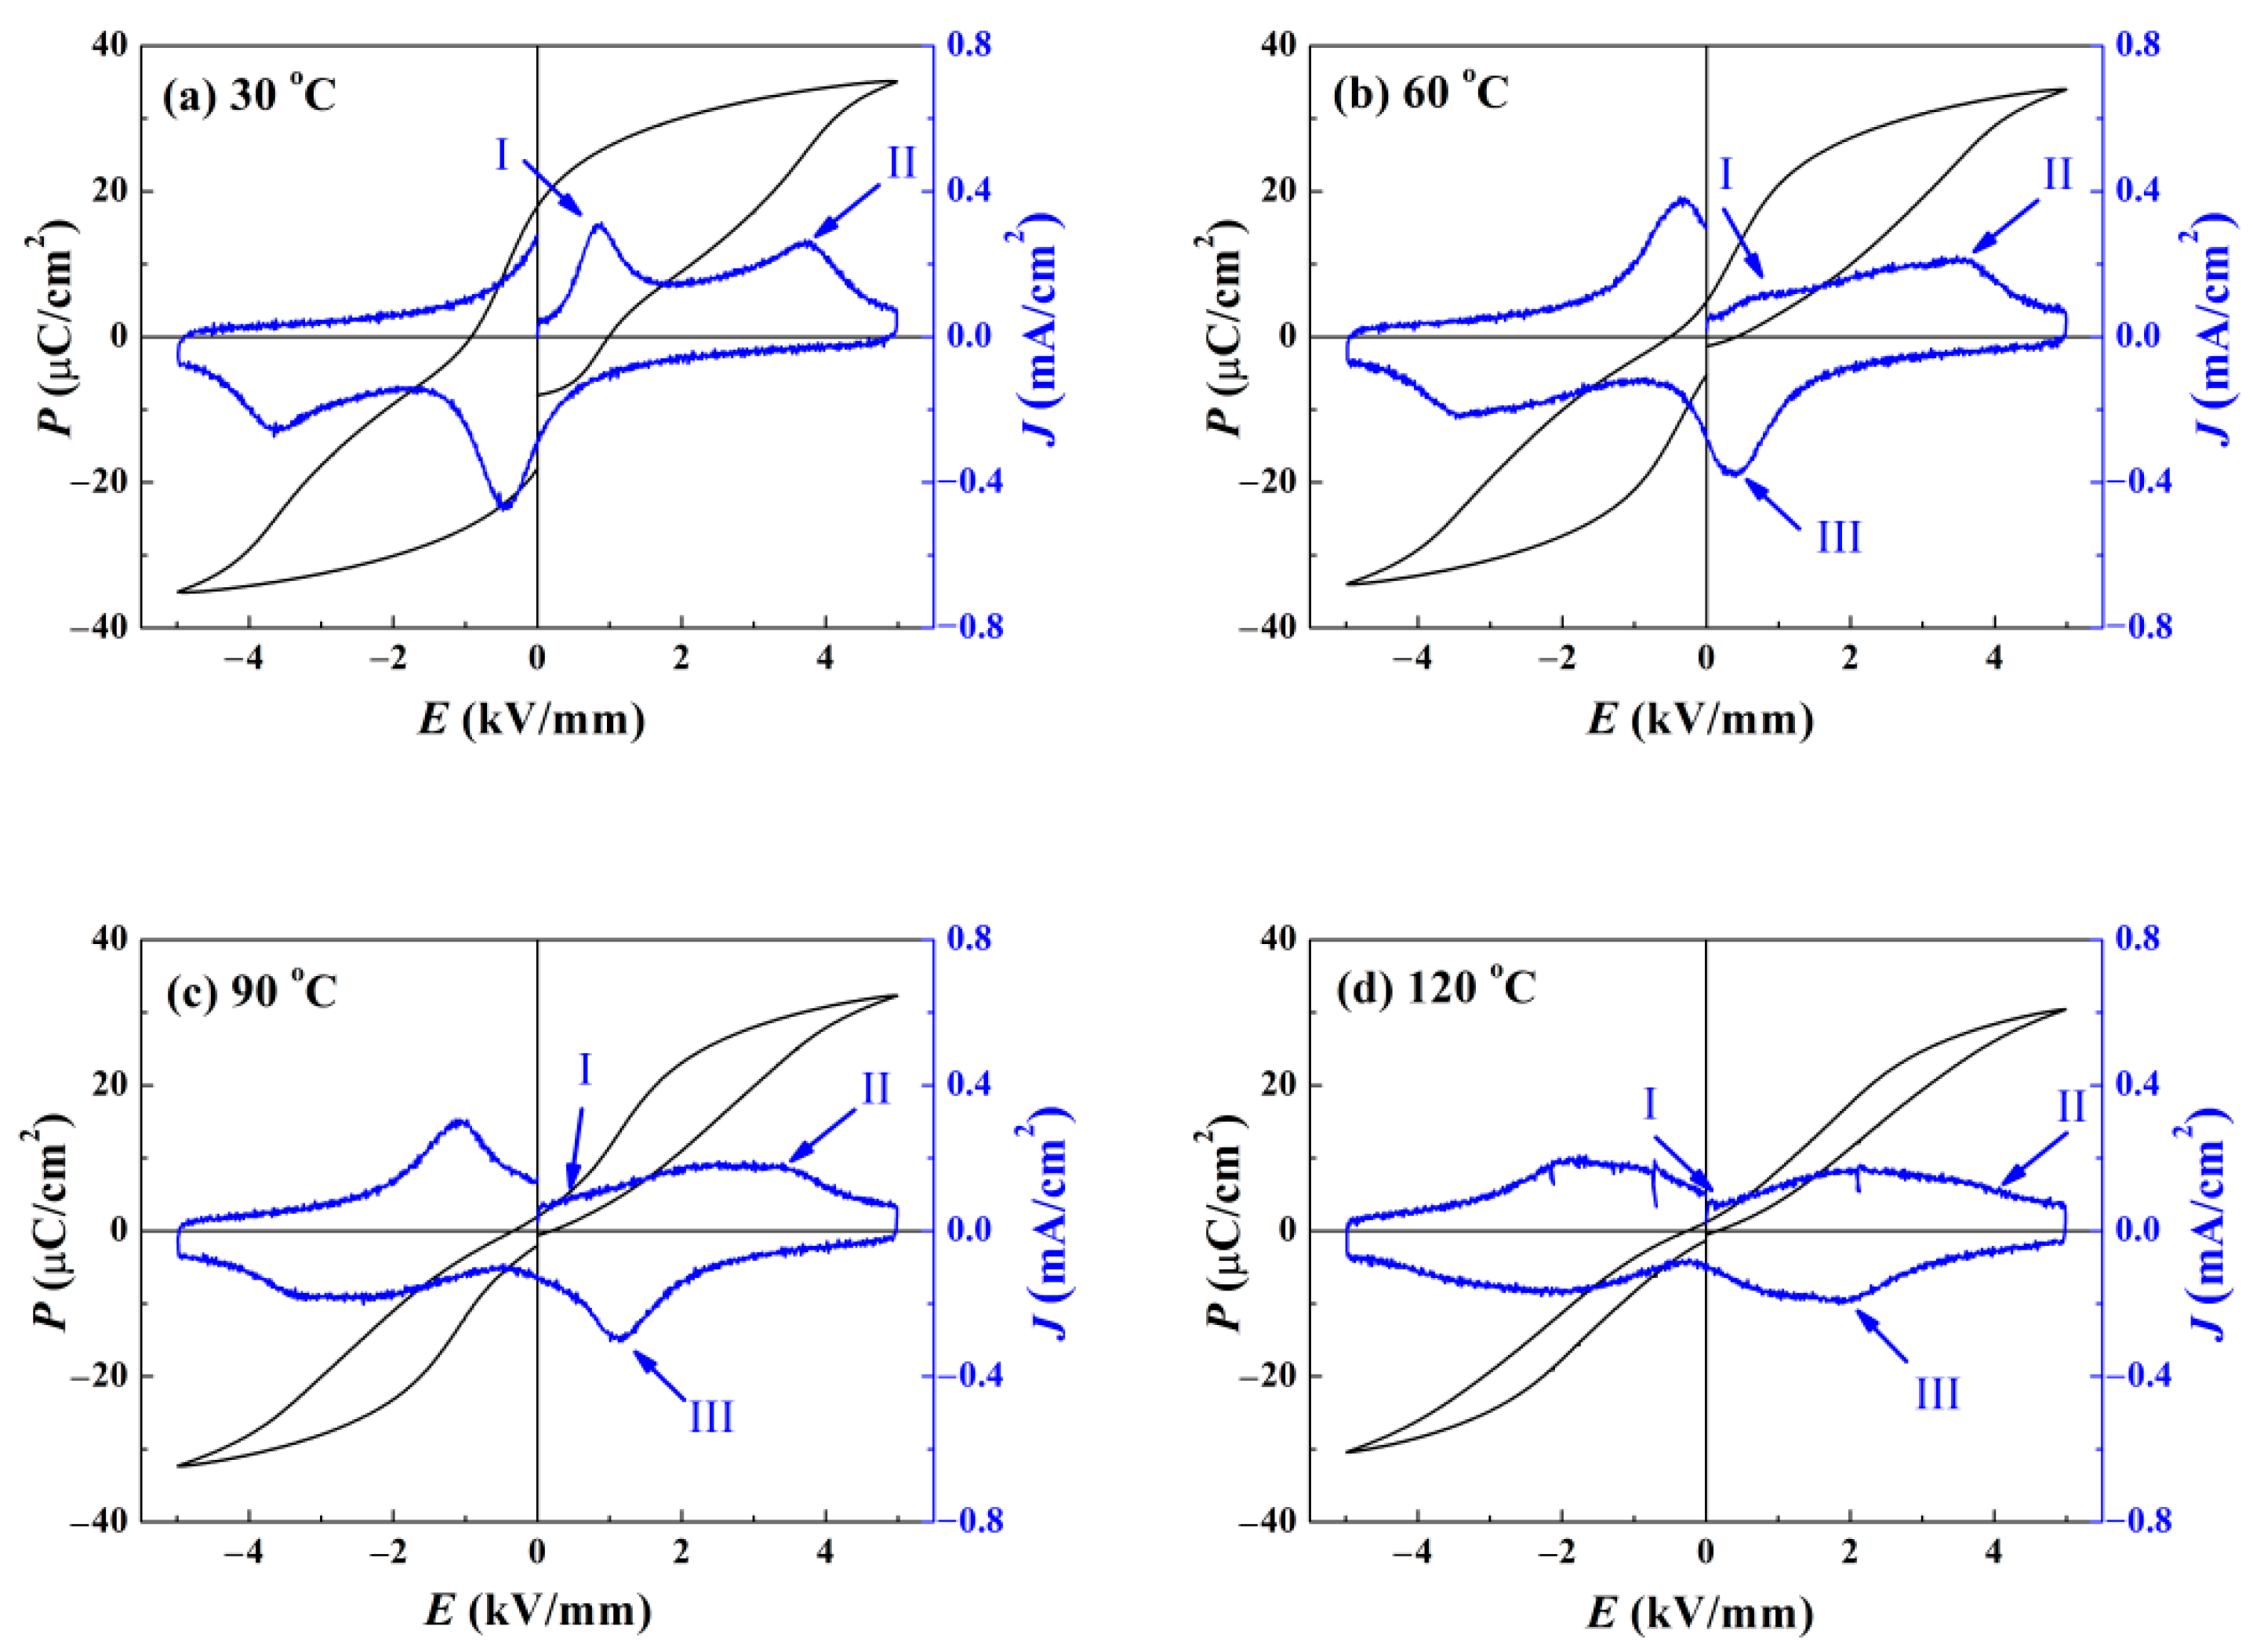
To reveal the variation of the ergodic degree of the matrix at different temperatures, temperature-dependent
P–
E loops were investigated.
Figure 7 provides the data obtained for pure BNKT–BT. As depicted in
Figure 7a, the shape of the
P–
E loop is very similar to that at RT, and only two local maximums arise in the
J–
E curve. When the temperature is increased to 60 °C, the waist of the loop becomes slimmer. A small
Ec and
Pr imply a drastically reduced ferroelectricity. With the ambient temperature approaching
TF-R, obvious ergodic relaxor characteristics come into being. Due to the reinforced dynamic activity of ergodic PNRs, a large quantity of domains formed with the aid of high loading decompose into PNRs again when the electric field falls off. As a consequence, a depolarization current density peak III exists in the
J–
E curve. For a rising temperature of 90 °C, the loop shape becomes more contracted with a negligible
Ec and
Pr. The location of peak III moving in the direction of high electric field suggests that the threshold preventing domains from decomposing is increasing [
26]. For a higher temperature of 120 °C,
Ec and
Pr almost vanish, verifying the total loss of piezoelectricity. The maximum of
P at the electric field of 5 kV/mm starts to drop, due to the stricter condition for inducing domains.
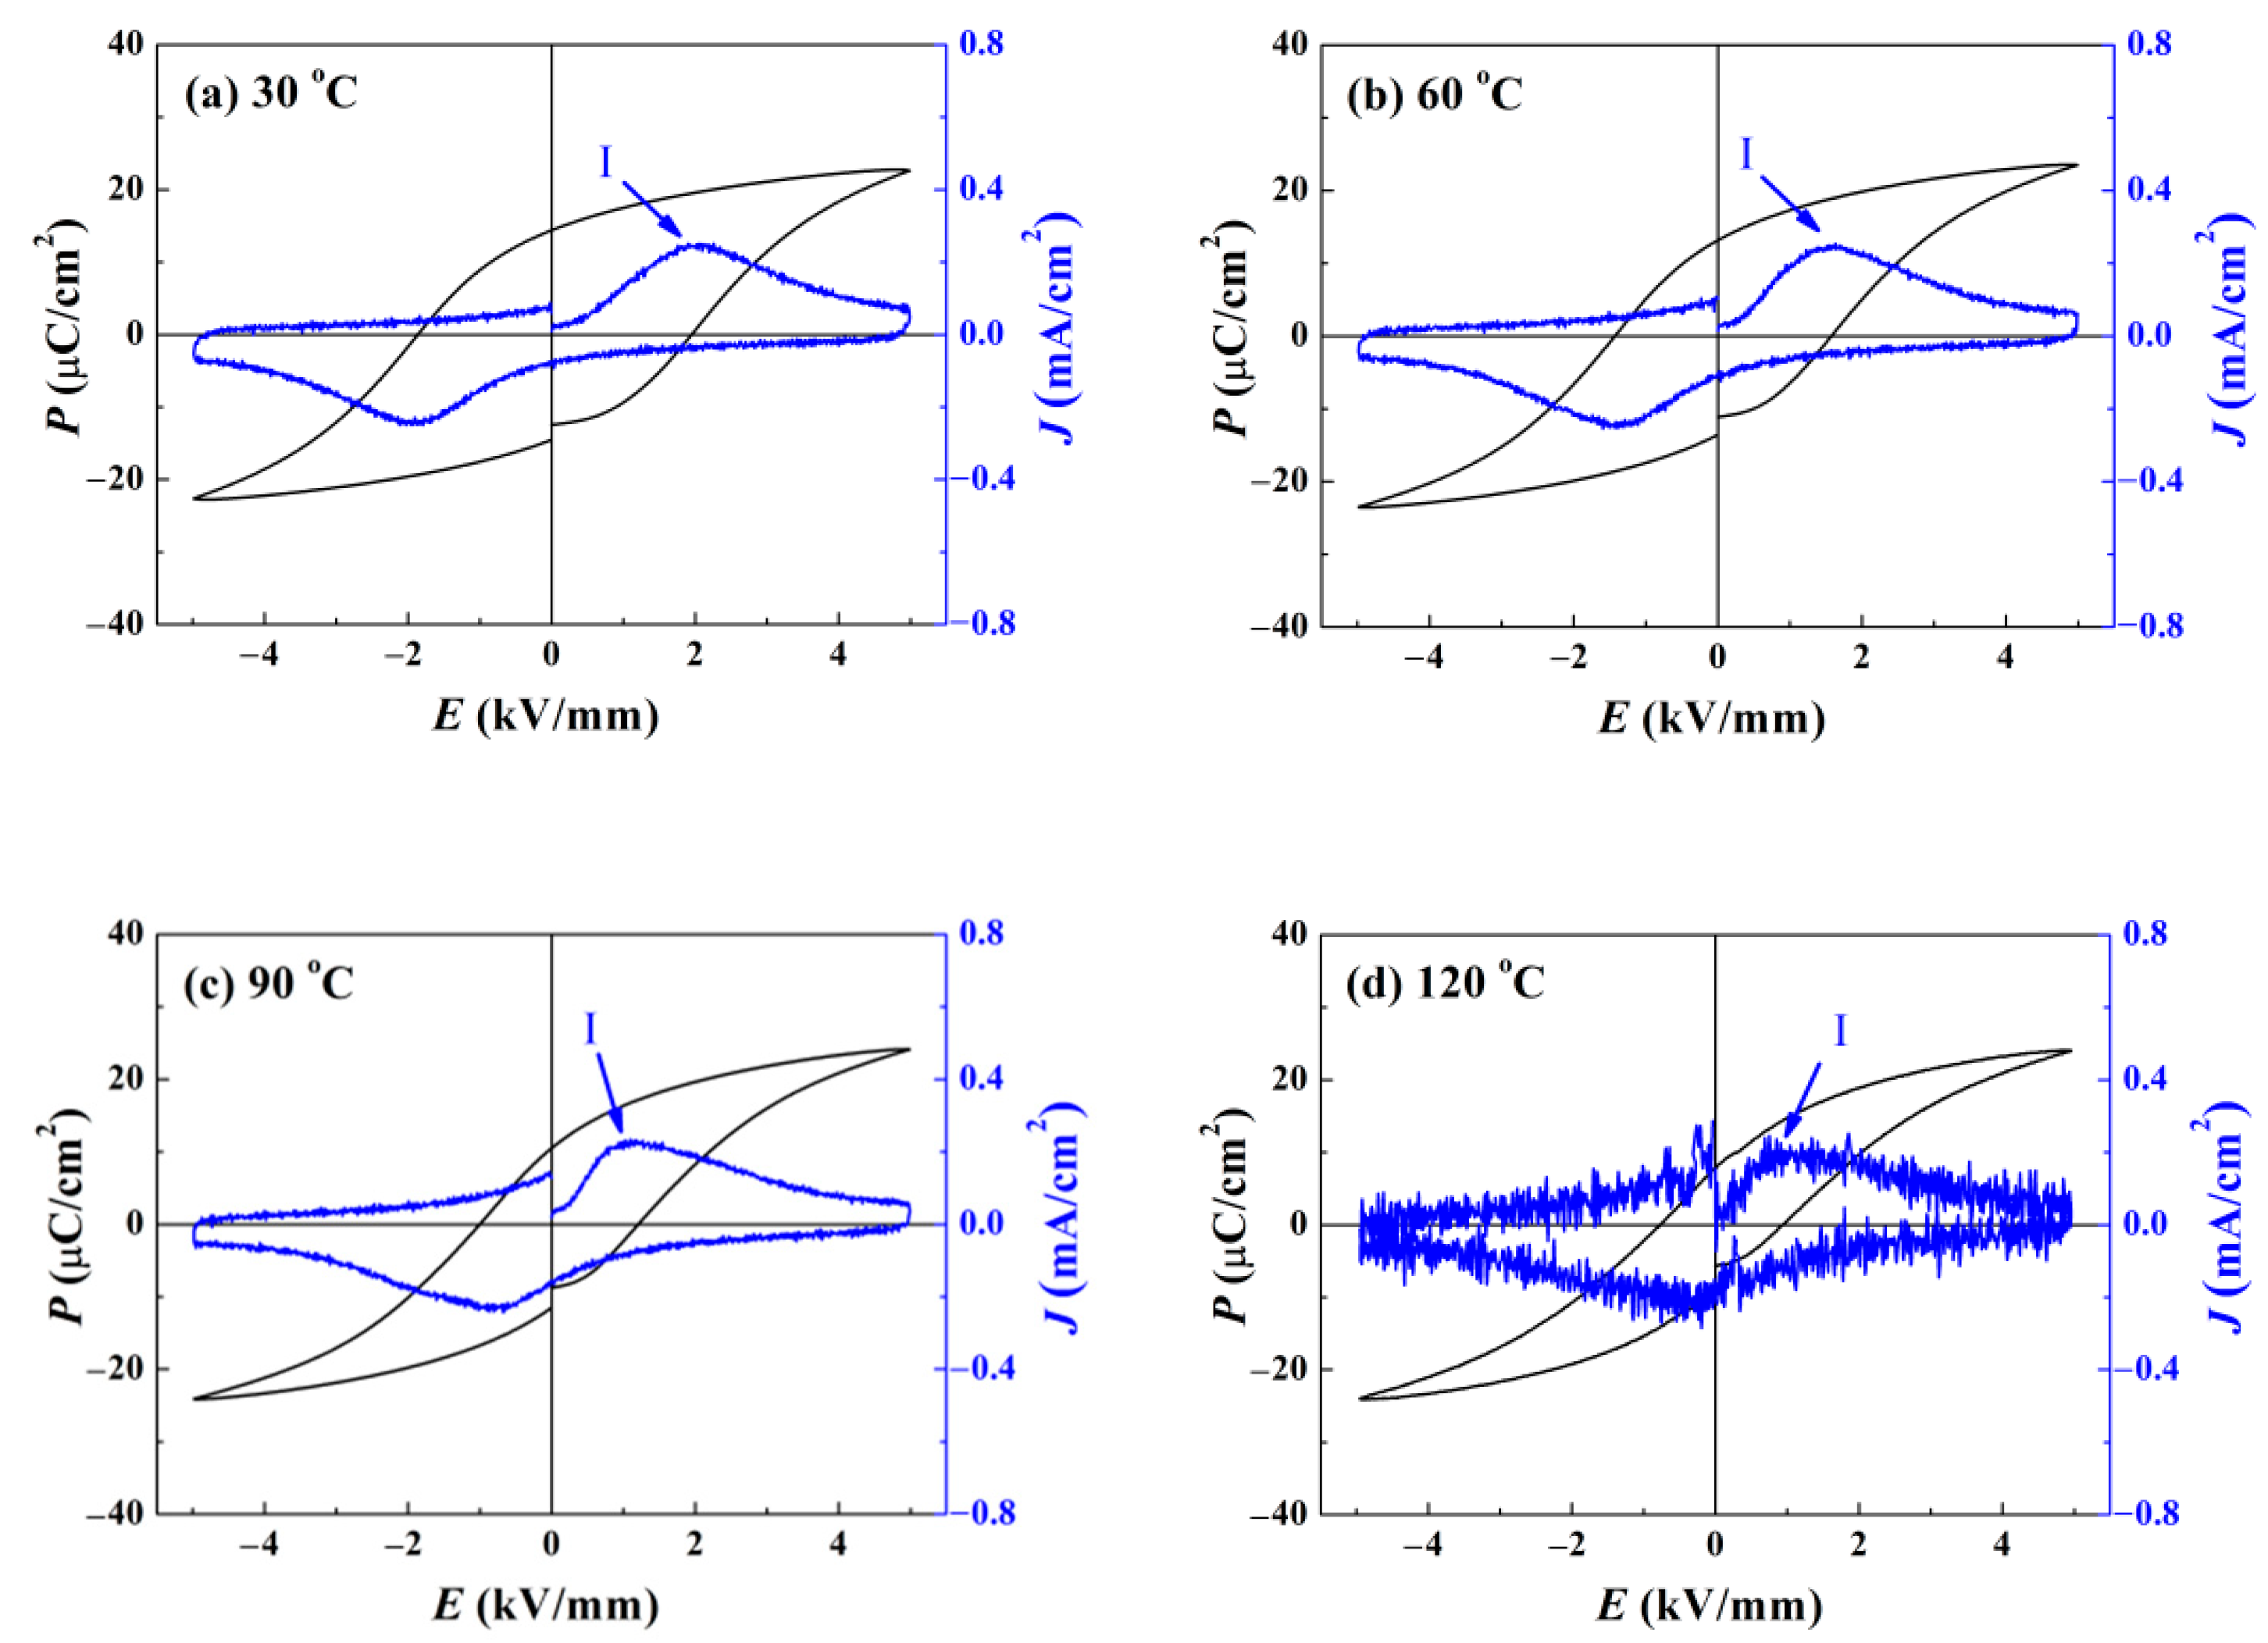
For a comparison, the temperature-dependent
P–
E loops for the component
x = 0.3 are presented in
Figure 8. A typical saturated ferroelectric hysteresis loop appears at 30 °C, and only one maximum in the corresponding
J–
E curve. For the temperatures ranging from 30 °C to 90 °C, peak I slightly shifts towards the low-field direction, for the reason that domains are easier to switch at higher temperatures. No other evidence of the notable changes of the ergodic degree, such as the occurrence of peak II or peak III as in
Figure 7, is detected. Hence, it is rational to predict that piezoelectric performance could be well-sustained over this temperature range. Even if the temperature is increased to 120 °C, the
P–
E loop still holds its shape relatively well, and the non-zero value of the remnant polarization
Pr hints that piezoelectricity is partially preserved. These results demonstrate that the introduction of ZnO enrichment areas is beneficial to inhibit the elevation of the ergodic degree. For the BNKT-BT-
xZnO composite system, the phenomenon that polarization
P declines with applied electric field
E increasing does not emerge, which means the conductivity is well suppressed.
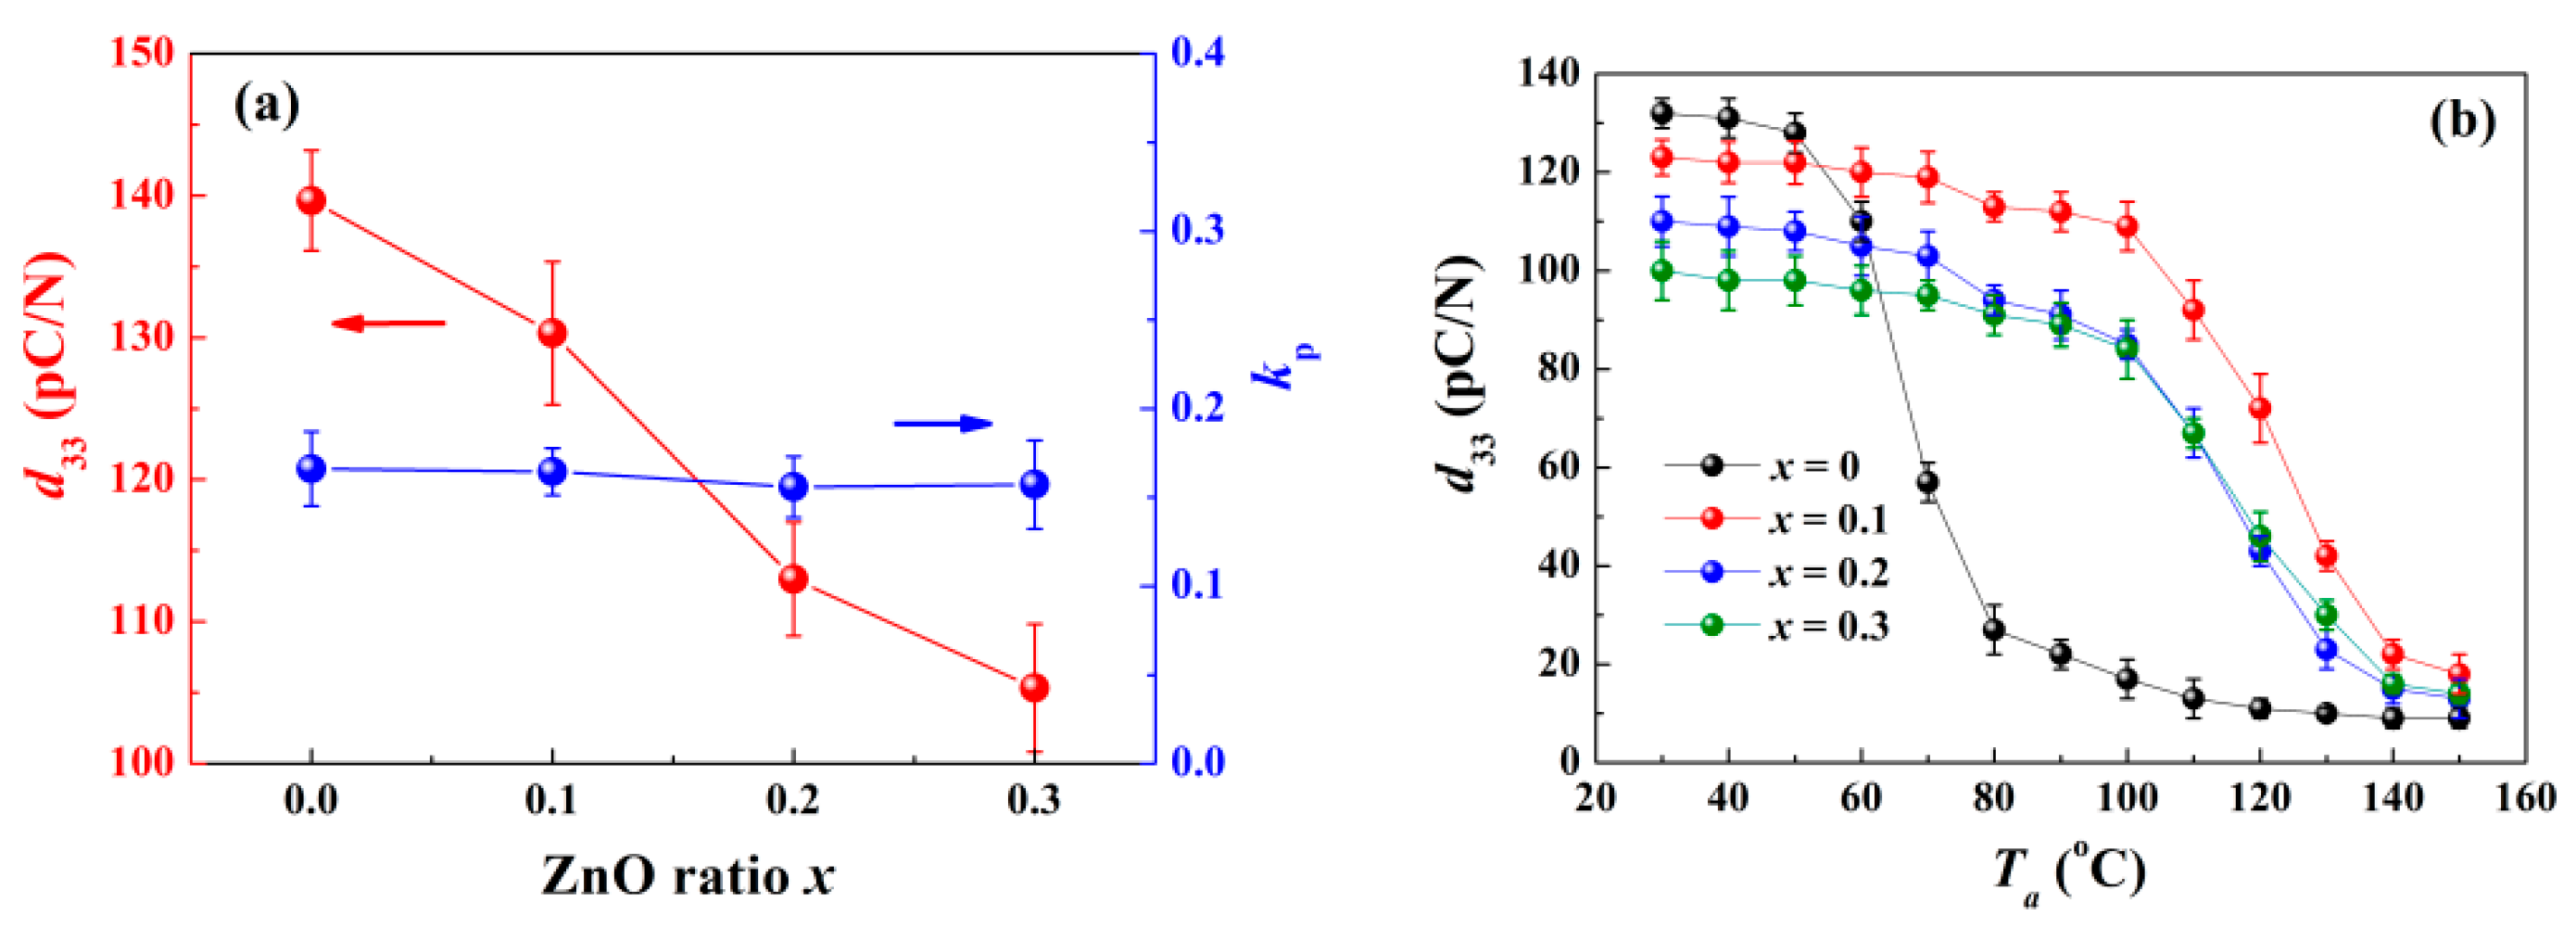
To evaluate the piezoelectric performance of the samples, two indicative parameters, i.e., the piezoelectric constant
d33 and planar electromechanical coupling factor
kp, are measured in
Figure 9a. While the content of ZnO is increasing, both
d33 and
kp decline because of the reduced relative ratio of the ferroelectric matrix, which means partial loss of piezoelectricity [
12].
Figure 9b provides the relationship between the annealing temperature
Ta dependence and the remaining
d33. The remaining
d33 for the pure BNKT–BT ceramic drops rapidly in the temperature range of 60−80 °C. Since the phase transition from FE to ER finishes above 80 °C, only a negligible remaining
d33 is detected. The components with ZnO incorporated show an improved temperature stability, holding the performance at a high level until 110 °C is reached. The following declining phase for the component
x = 0.3 tends to be smoother. In view of superior properties when compared to the other components, the component
x = 0.1 is more suitable for real application.
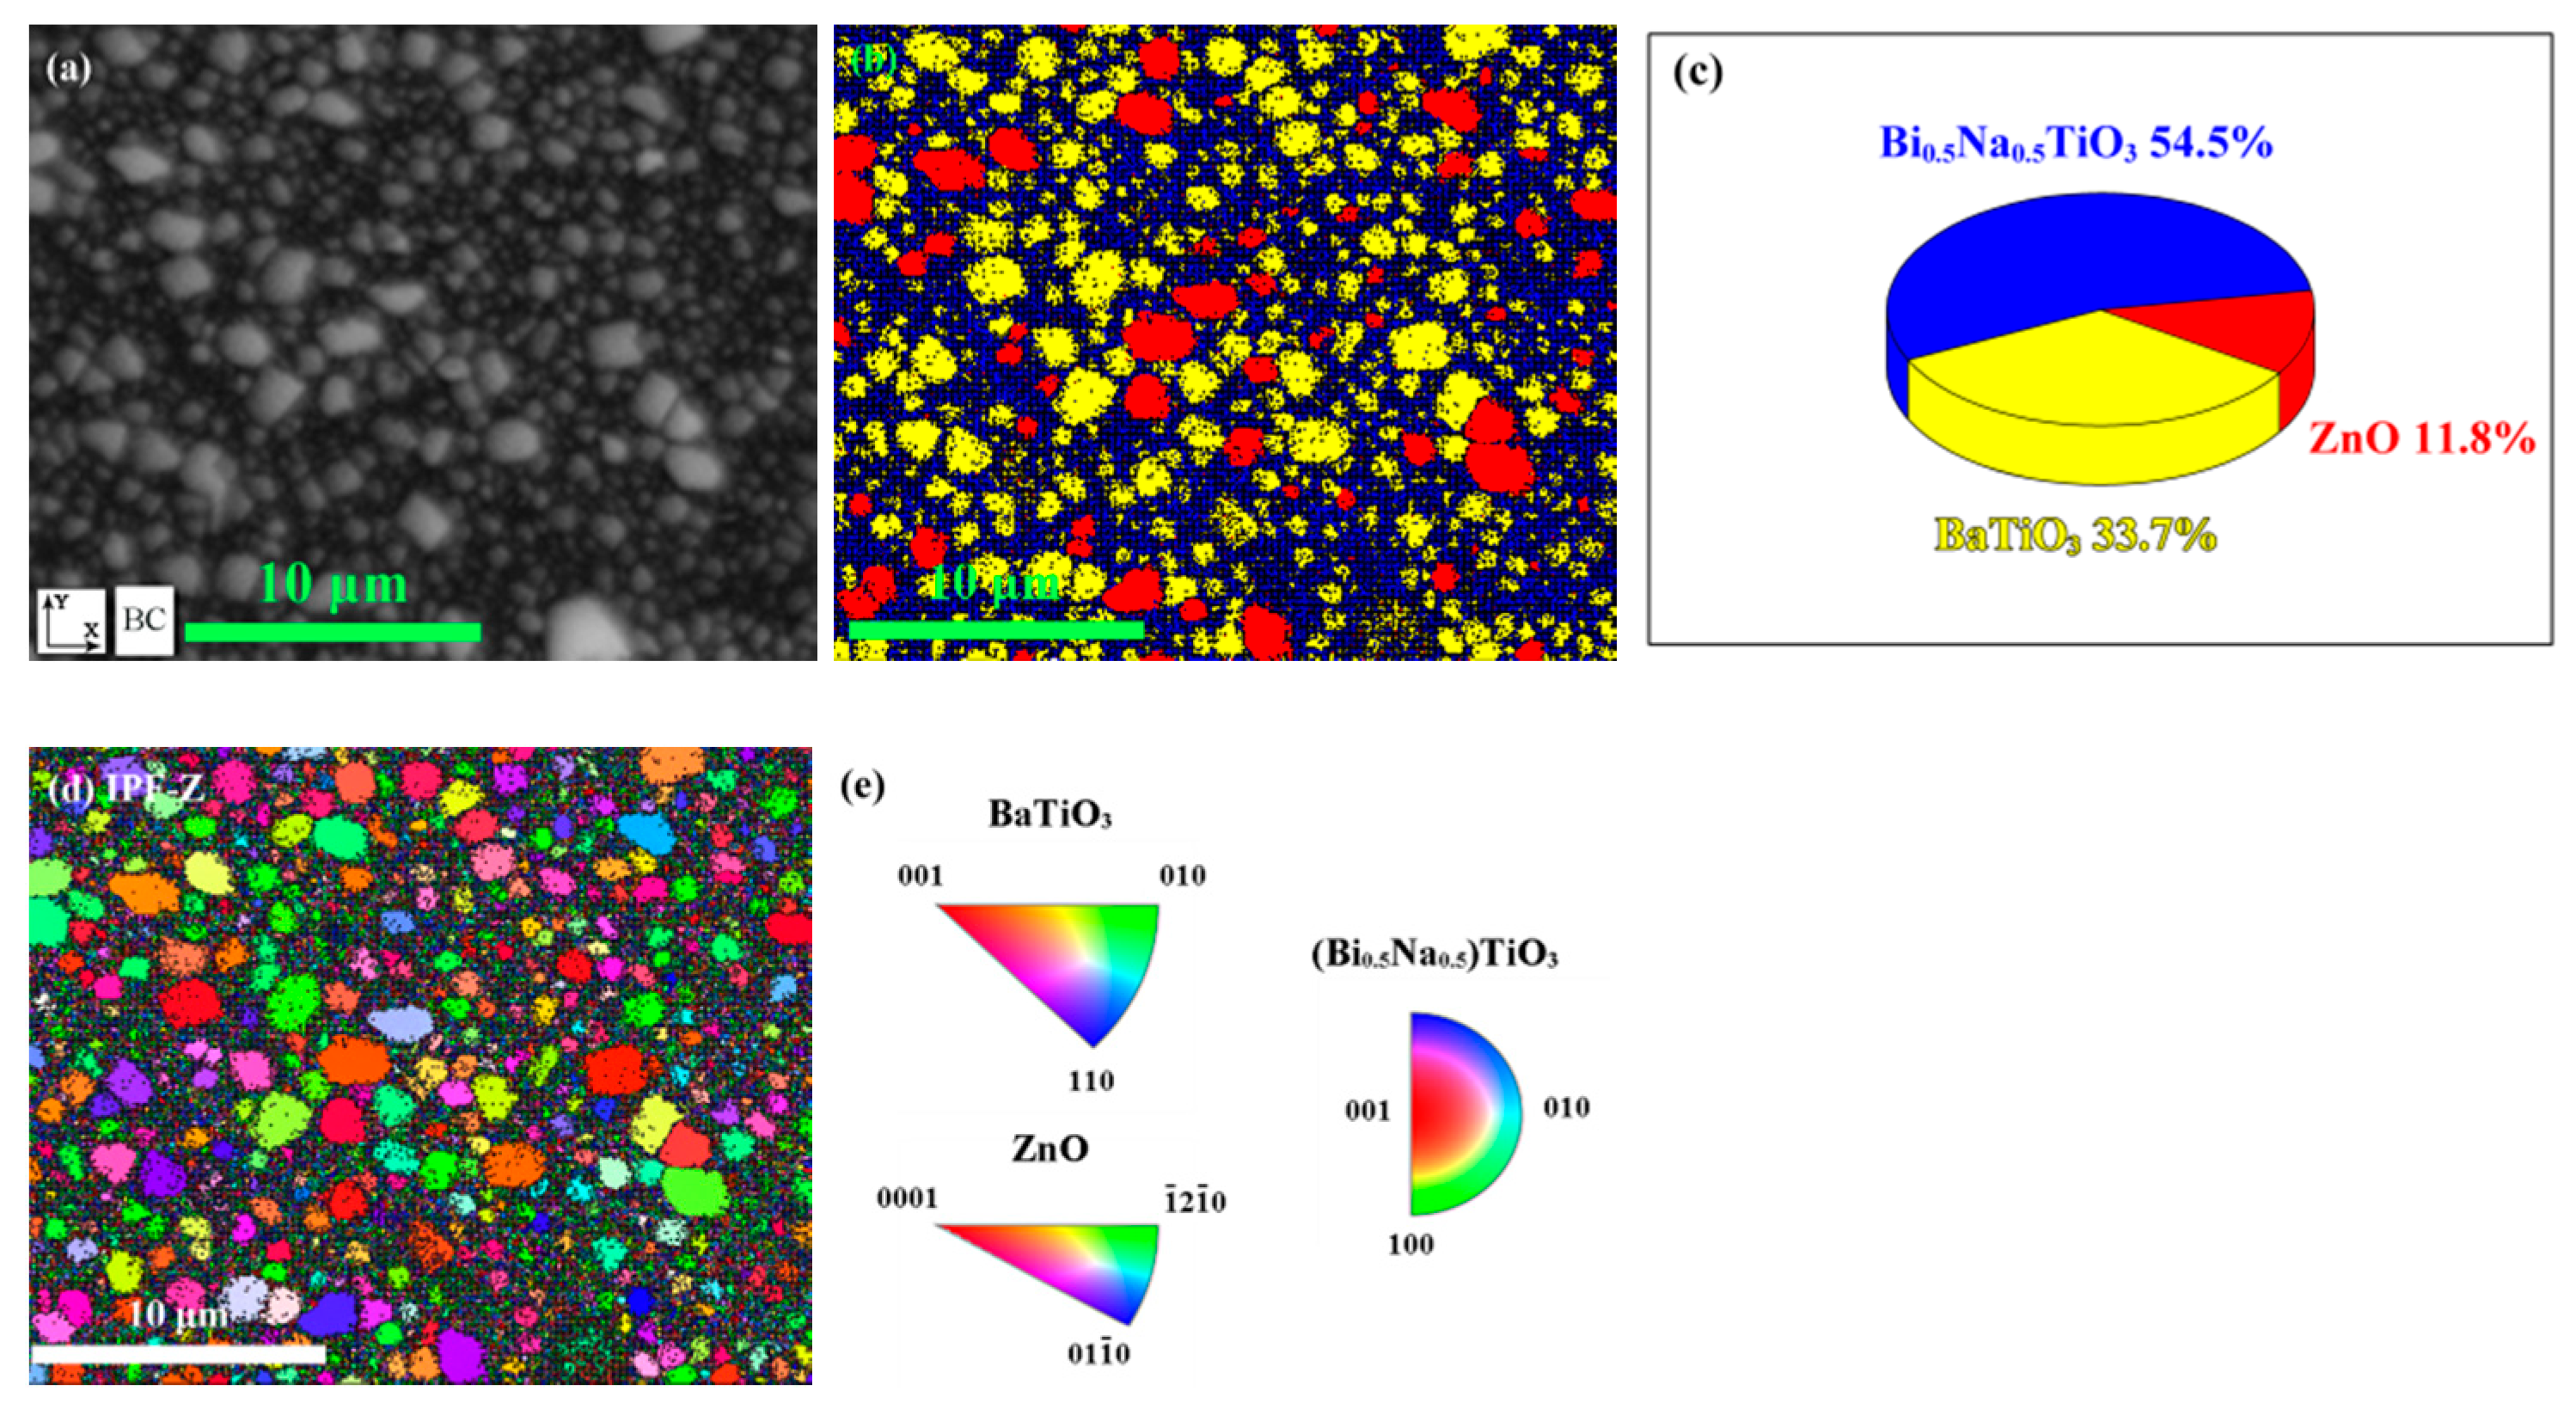
The patterns based on the electron backscatter diffraction (EBSD) were employed to understand the distribution of strain. A scanning area in the component
x = 0.3, shown in
Figure 10a, was selected for the purpose. According to the corresponding phase distribution and percentage offered by
Figure 10b,c, three types of configurations exist in this area. The local regions, marked in blue and yellow, possess crystal structures close to Bi
0.5Na
0.5TiO
3, and BaTiO
3, respectively, which represents the distribution of the matrix; while the other regions, marked in red, have structures similar to ZnO, standing for the ZnO enrichment areas diffused in the matrix. The individual orientations of grains along the
Z-axis of the laboratory coordinate system are provided in
Figure 10d. Comparing the colored grains and the inverse pole figure color key in
Figure 10e, it is revealed that both the grains of ZnO and the matrix orient themselves randomly. Since the potential stress field does not induce texture, the possibility of texture affecting depolarization behavior is excluded.
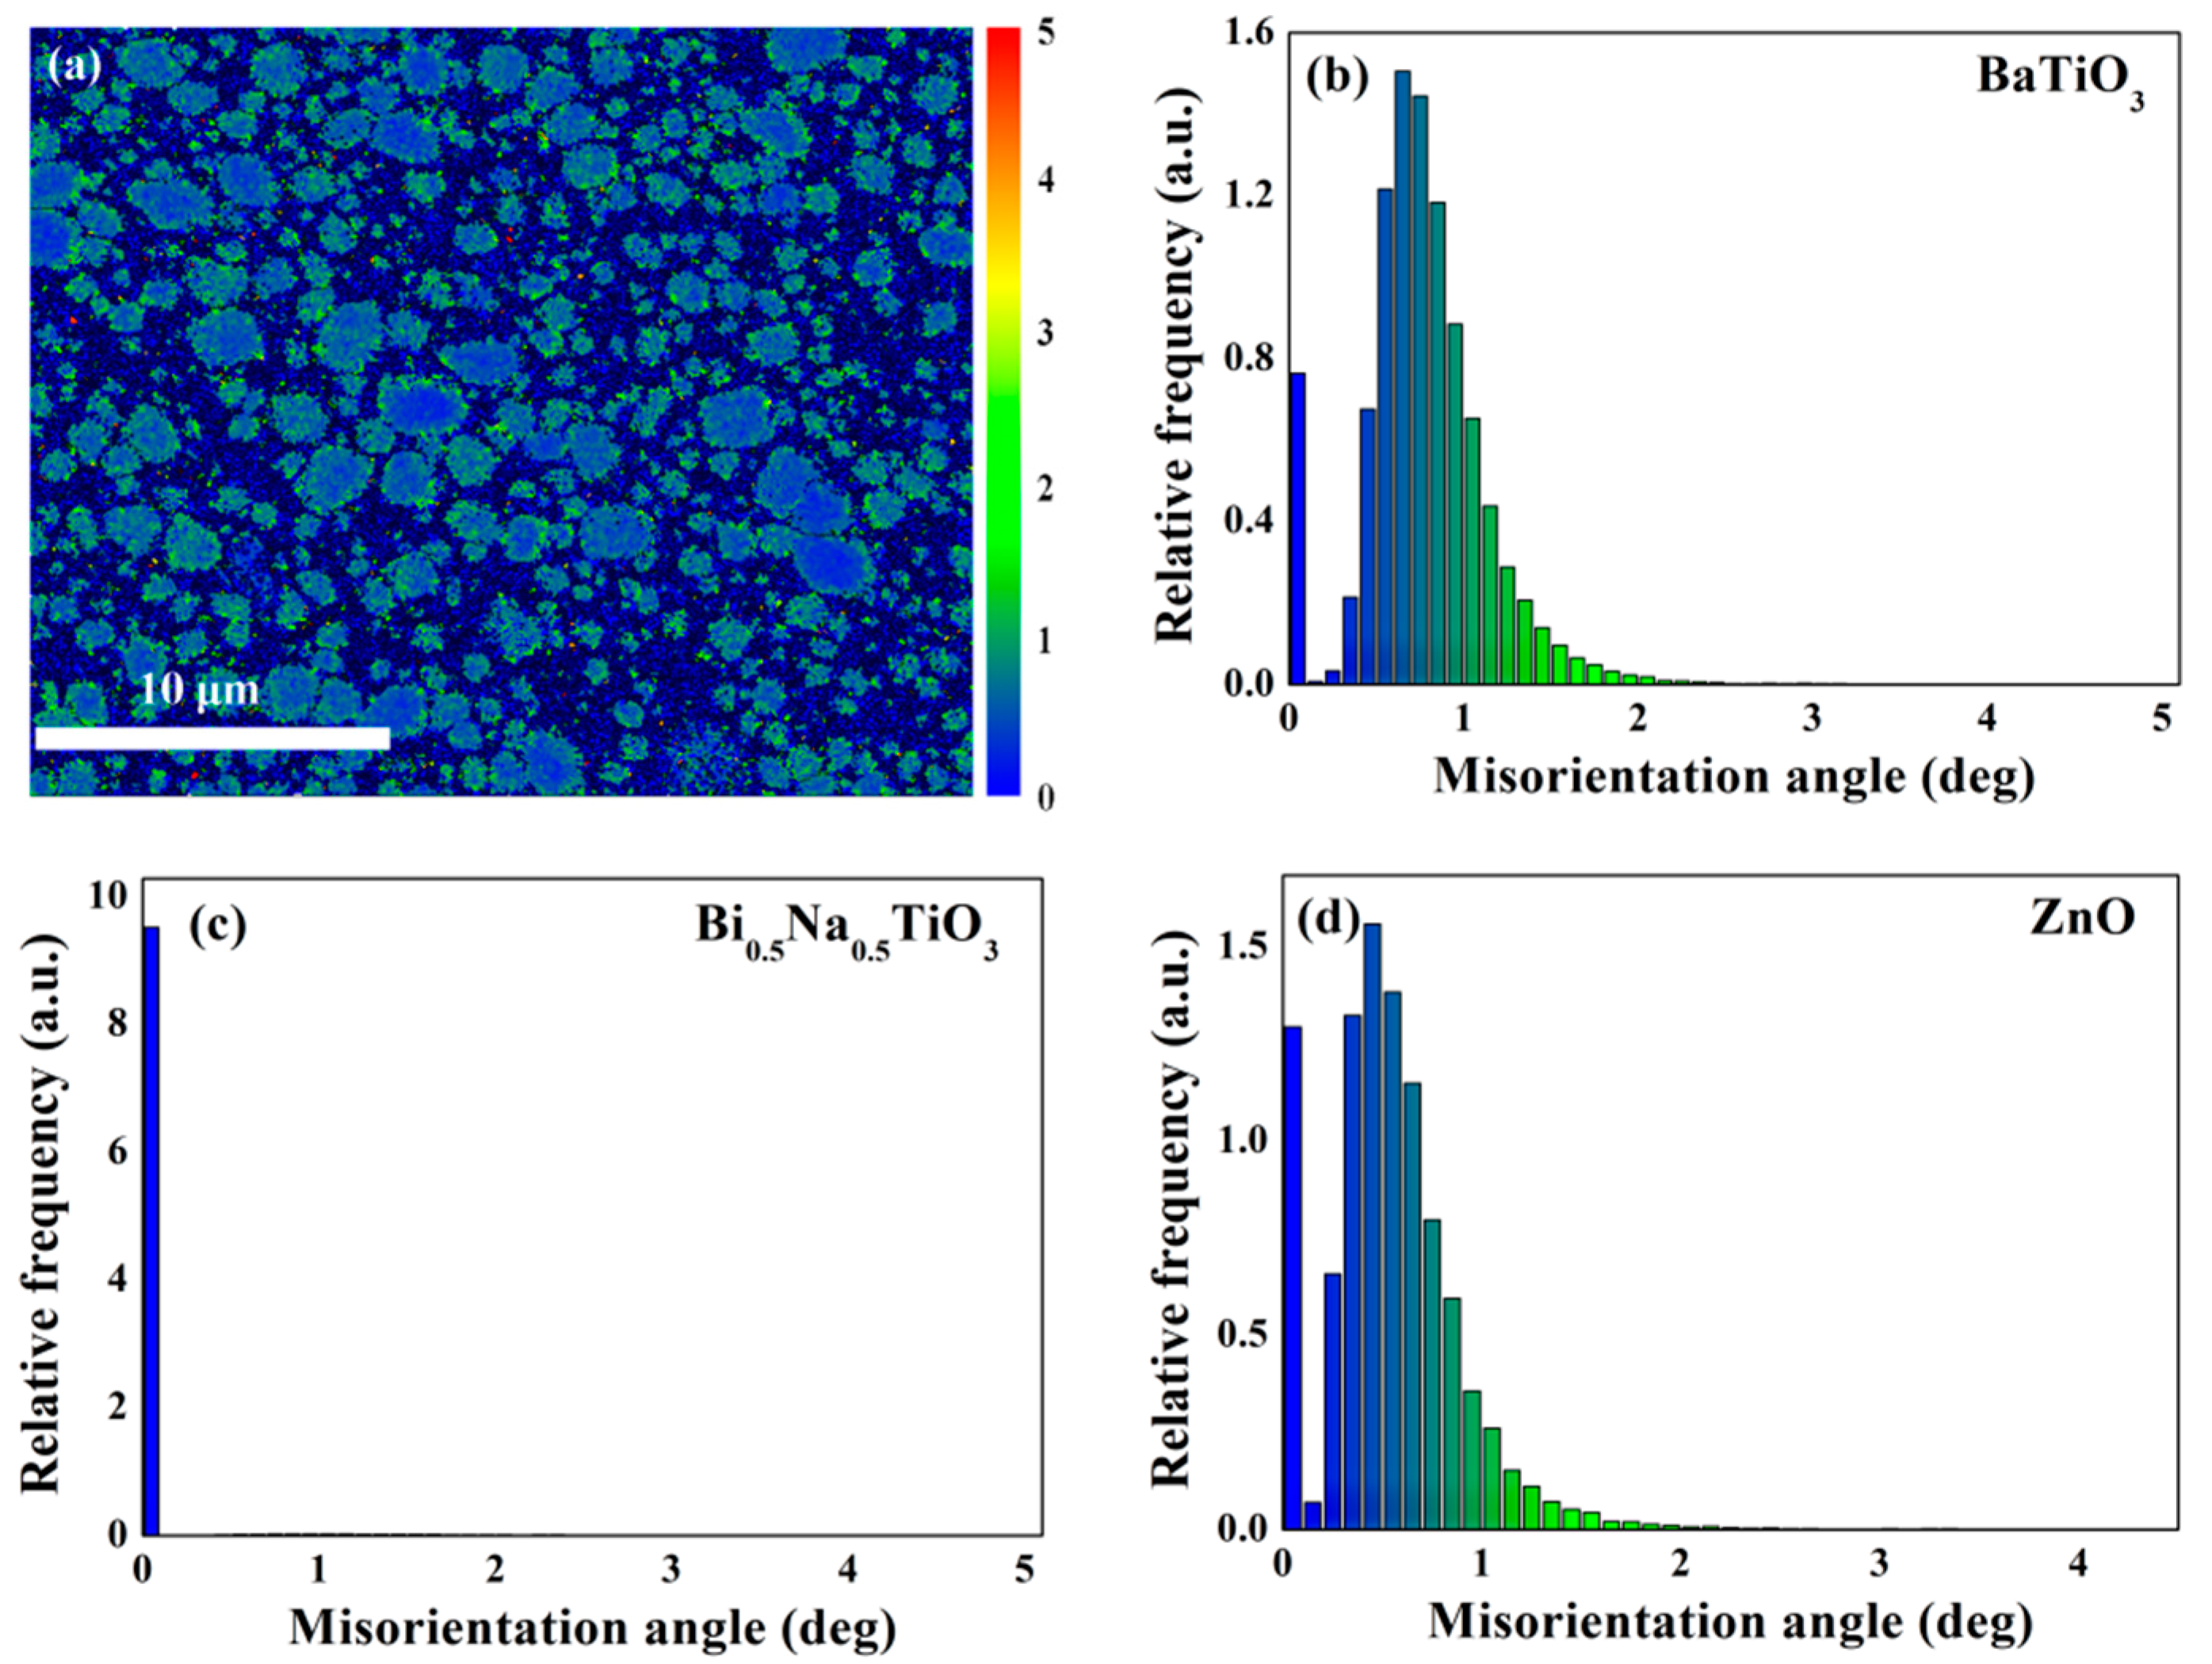
More pronounced strain occurs in the regions of composites where stress is concentrated. By means of calculating the displacements between adjacent sampling sites in the EBSD pattern, a speculation on stress field distribution is built up [
27,
28]. For the purpose,
Figure 11 provides the image of local misorientation and the relative fraction of sampling sites corresponding to different misorientation angles. According to the
Figure 11b–d, the maximum of the misorientation angle approaches 4.5°, which corresponds to the tiny areas marked in red in
Figure 11a. All these areas are immersed in the blue region of the Bi
0.5Na
0.5TiO
3 matrix. In view of the effect of abundant grain boundaries on measurement accuracy, this portion of misorientation can, in fact, be ignored. The majority of sampling sites have misorientation angles in intervals of 0° to 1.5°, which corresponds to the color transition region from blue to green. As shown in
Figure 11a, grain boundaries are prone to exhibiting green, while the inner parts of grains are blue. Since the green area means larger strain, it is confirmed that the stress field prefers to emerge near the boundaries. With the stress effect of pinning domains, the hypothesis that stress field hinders domain decomposition to postpone depolarization is reasonable [
29]. In addition, no particular stress effect is detected around the boundaries of BNKT-BT/ZnO. The result does not support the previous prediction, based on the difference in the thermal expansion coefficient of ZnO and the matrix.


 and
and 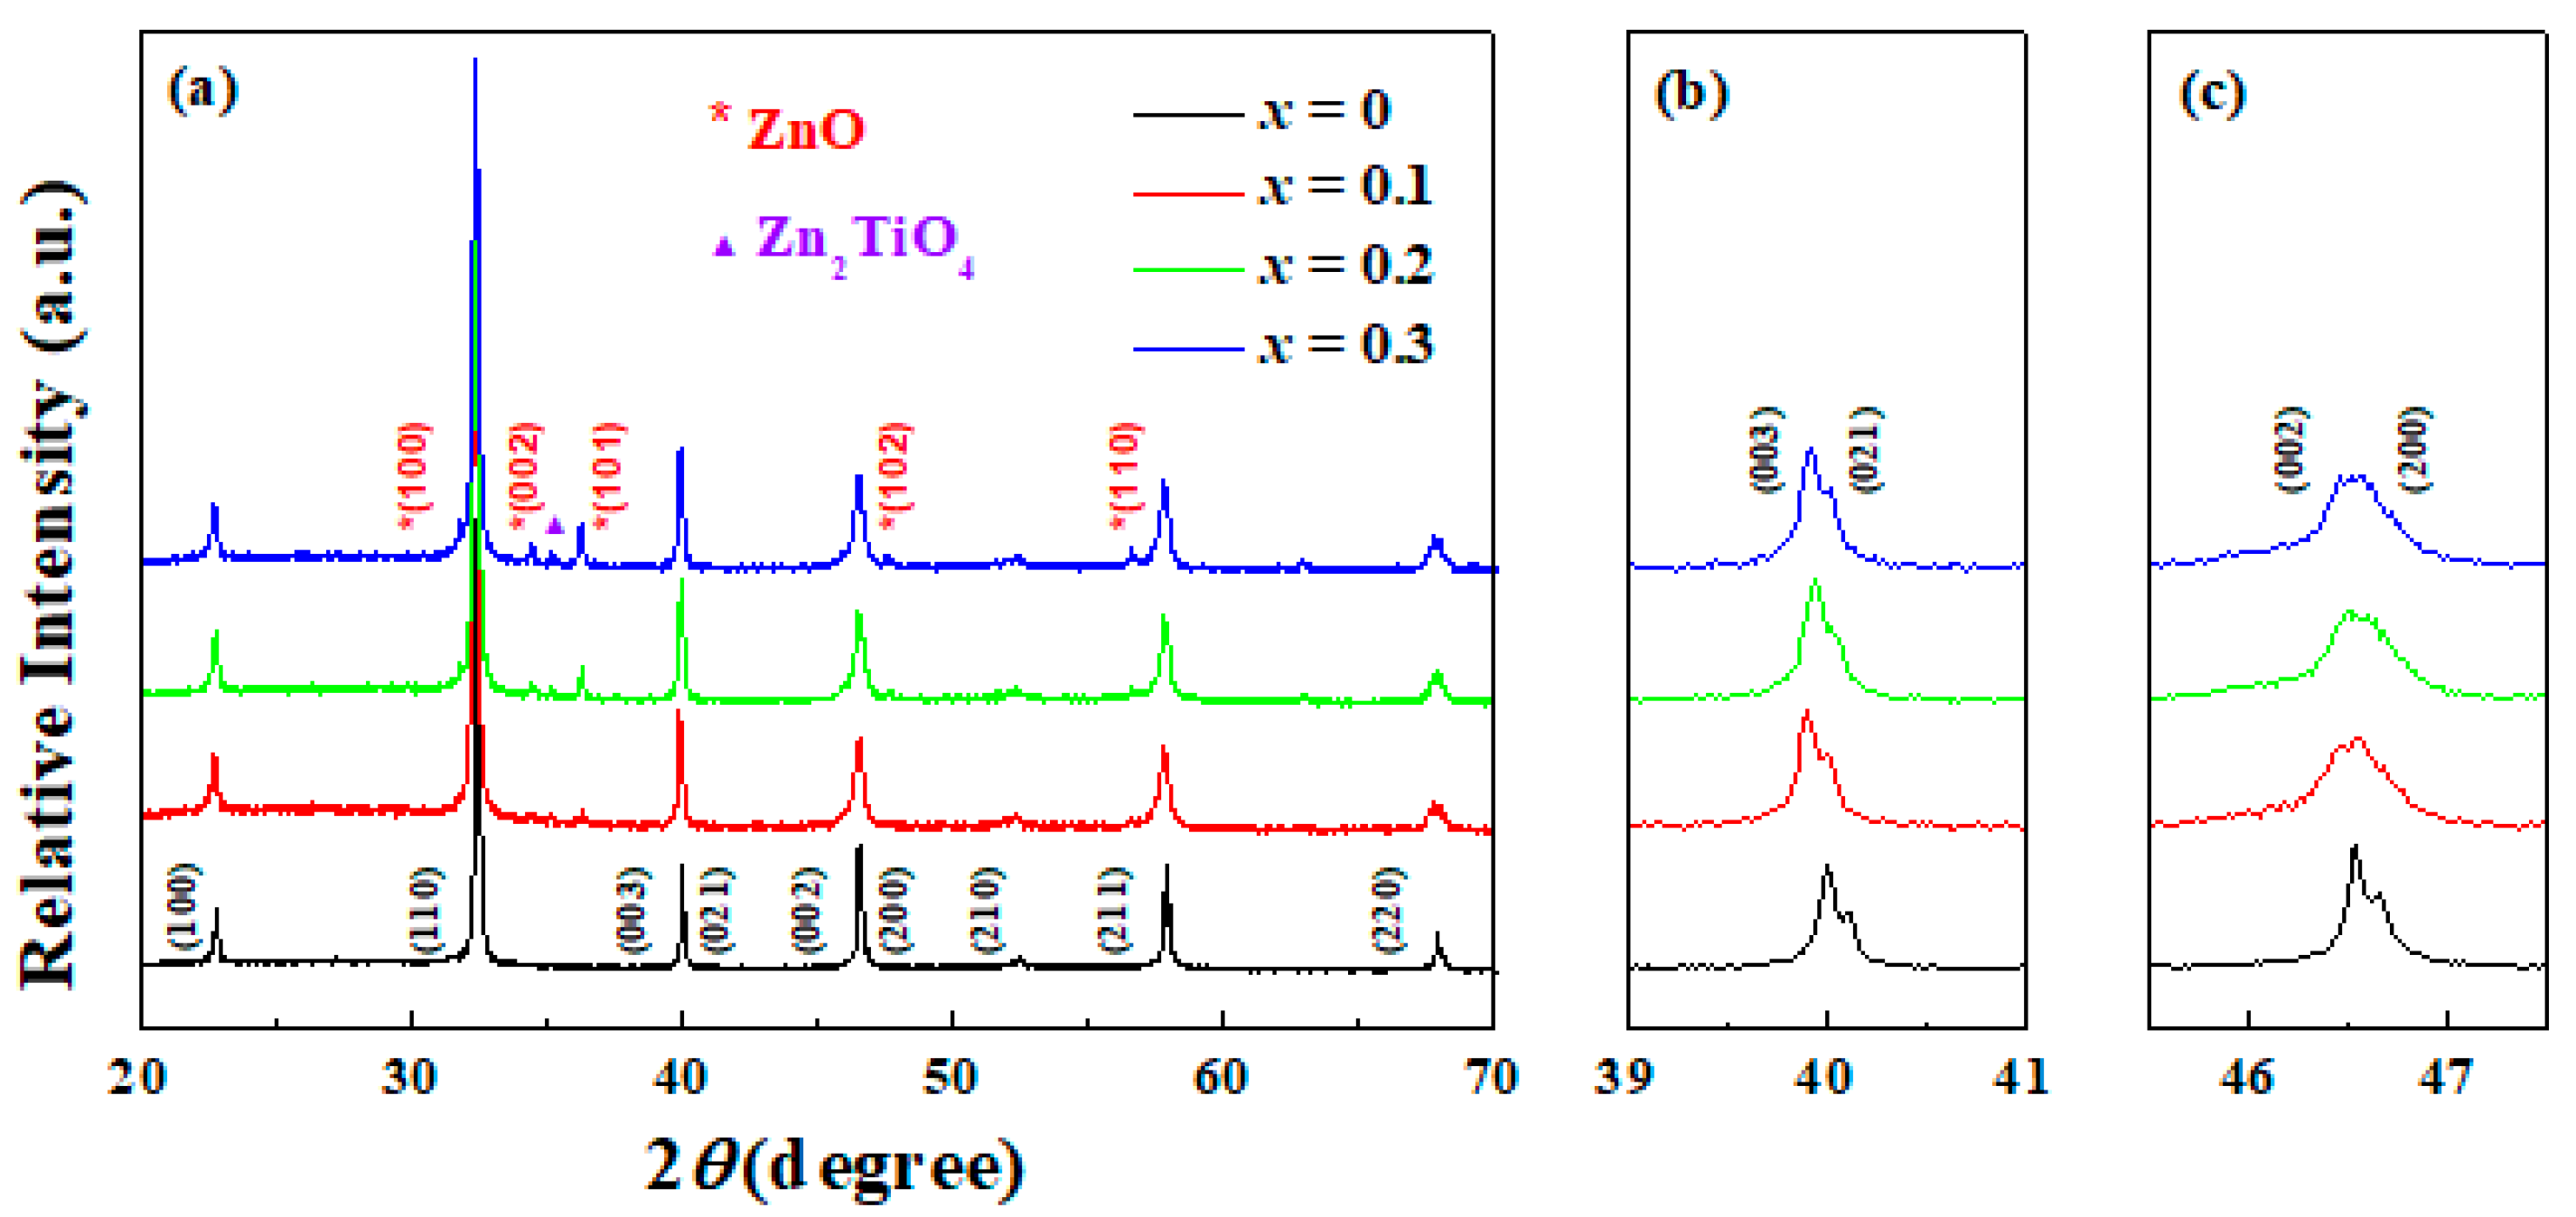
