Article

Optimization of Synchropulsed MIG Welding Process Parameters for Welding of AW 5083 Sheets

Mechanical Engineering Faculty, University of Slavonski Brod, 35000 Slavonski Brod, Croatia
*
Authors to whom correspondence should be addressed.
Materials 2022, 15(9), 3078; https://doi.org/10.3390/ma15093078
Submission received: 24 March 2022 / Revised: 19 April 2022 / Accepted: 21 April 2022 / Published: 23 April 2022
(This article belongs to the Special Issue Manufacturing Technology, Materials and Methods)

Abstract

:
Metal inert gas (MIG) welding is one of the processes most commonly used for joining metals, especially for joining aluminum and its alloys. The application of a pulsed current in an electric arc allows better controllability of the molten droplets and the arc transition, which subsequently leads to welds with characteristic flaky joints of better quality. In this paper, the optimization of parameters for welding aluminum alloys using the synchropulse welding process is investigated. By observing the input variables that have the greatest influence on the change in appearance of the welding current characteristics (delta wire feed from 0.1 to 6.0 m/min, frequency F from 0.5 to 3 Hz, duty cycle from 10% to 90%), it is possible to perform an optimization to achieve the desired output values. The output variables of the experiments are defined as insufficient/excessive throat thickness (mm), depth of penetration (mm), and weld width (mm); and for the desired quality of the welded joint the most acceptable range of its values is selected, the numerical optimization implementation. The experiment has shown that the delta wire feed has the greatest effect on the observed properties, while the influence of frequency F and duty cycle is somewhat smaller, but the factors responsible for the observed output properties are still significant. From all this, it is possible to select specific values of these input variables to define the best possible observed properties and to determine the characteristics of the defined mathematical models.

1. Introduction

A synchropulse is a function in modern MIG/MAG welding that welds first with high-current pulses and then with the same number of low-current pulses. High-current pulses provide a hot arc (longer arc duration), while low-current pulses allow for the cooling of the weld pool. It alternates the current input of high and low levels according to the determined frequency. Such a process enables greater controllability and precision of the electric arc and reduces spattering [1]. The MIG synchro function enables the optimized welding of sheets of different thicknesses. Laser beam welding and TIG and MIG welding processes, which operate with pulsed energy input, are suitable for joining thin and medium-thickness materials, such as stainless steel, aluminum sheets, and aluminum alloys [1,2].
One of the welding processes that has proven to be effective for welding aluminum and aluminum alloys is the CMT welding process, which allows for less force to be applied and, consequently, causes less deformation and stress in the welded joint [3]. In pulse welding, the current alternates between two extreme values. A low level or low current is called the “background current”, and a high current is called the “pulse current”. When influenced by the pulse current, the transfer of metal within the arc is ideal when it is in the shape of one droplet that is approximately the size of a wire diameter, and it is transferred at low current after each pulsation [4]. The choice of welding parameters has a great influence on the quality of the welded Al alloy T-joint, with the average current and current difference having a significant effect on the macromorphology and microstructure of the welded joint [5]. The measurement and analysis of impulse welding process parameters such as arc temperatures and heat transfer phenomena can be used to predict simulated welding processes [6], which also indicates the need to study influential parameters to improve the process. The authors also compare the results of experimental studies with the results of numerical analysis to determine the relationship and define models that support and accelerate the optimization of the process itself [7,8,9]. The justification for the choice of these input variables for the purpose of studying their interaction also emerges from previously published research that went in a similar direction. There, the importance of welding parameters, including the welding current, wire feed rate, workpiece thickness, speed, and welding geometry, was emphasized. This is also confirmed by the novelty of this work [10]. Pulsed MIG welding operates at two phases of heat input into the material. Within the first phase, the electric arc initially heats the workpiece and removes the oxide layer. In the second phase of heat input, high-current precision pulses melt the filler material and join it with the base. This process results in welded pieces of exceptional quality with minimum spatter. The MIG Synchro welding process can achieve welded joints with flaked shapes. 
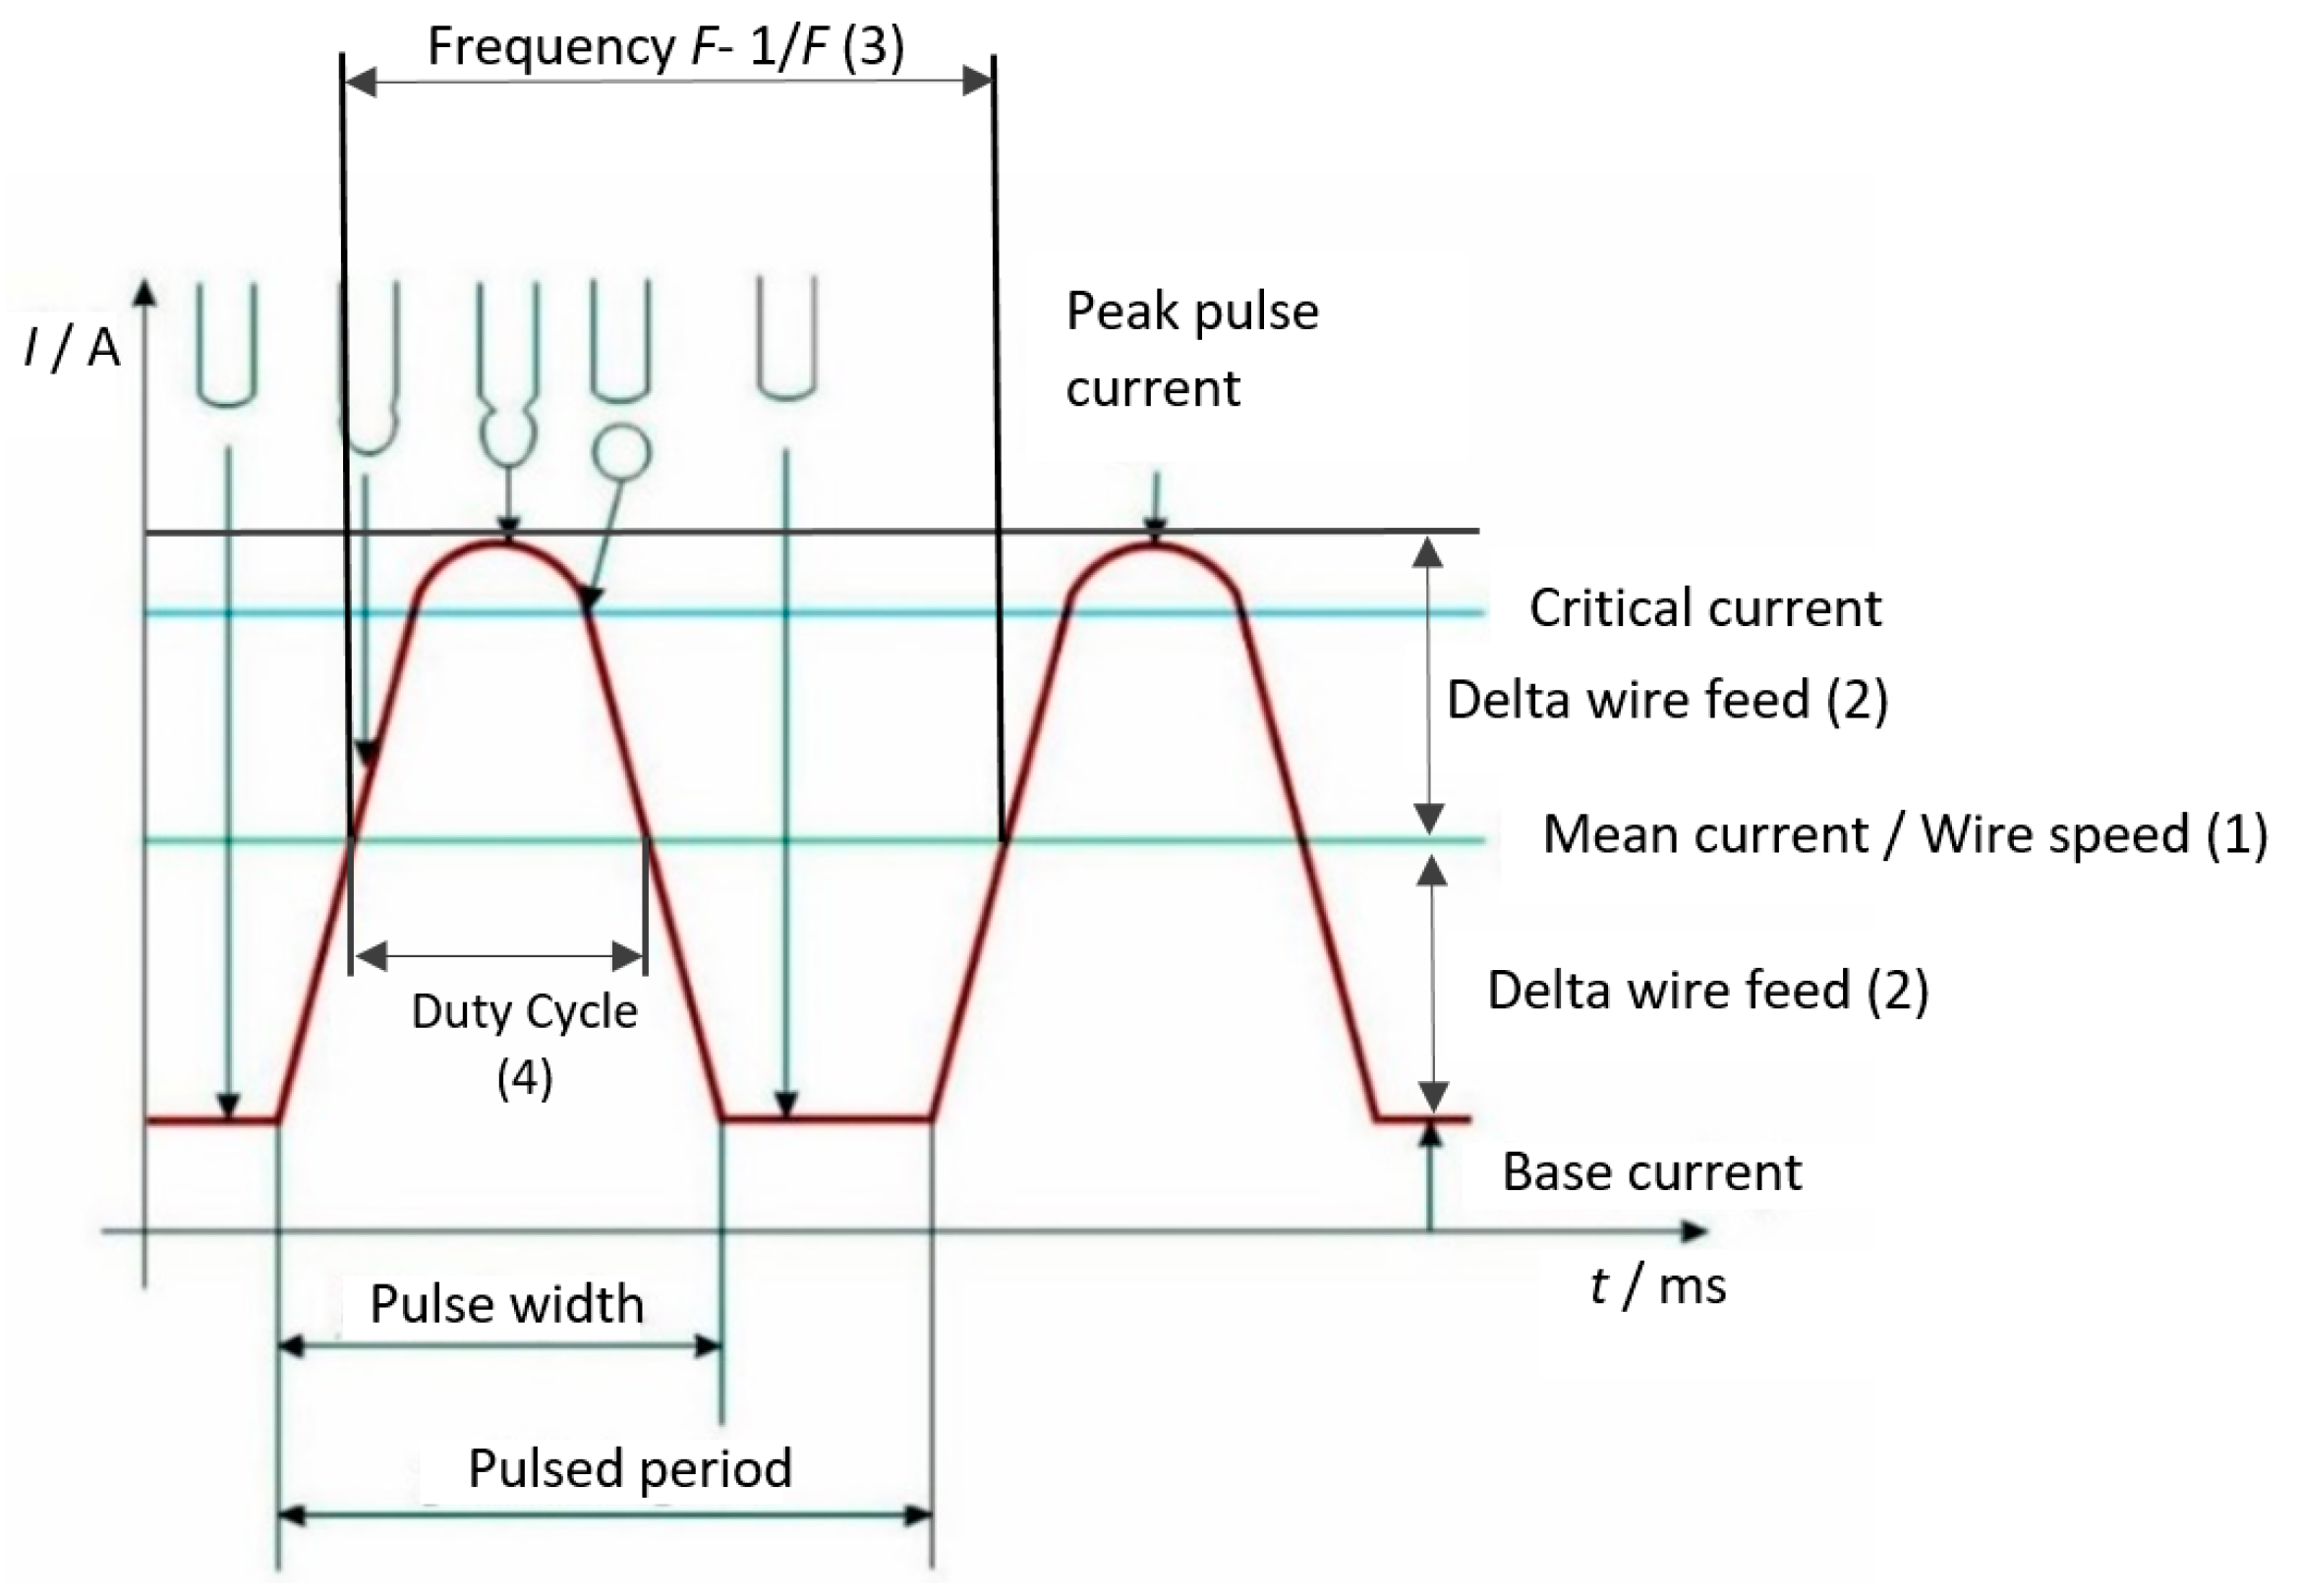
Figure 1 presents the metal transfer in the pulse current by showing the difference between the abovementioned levels of current.
The base current maintains the electric arc, but it does not supply it with enough energy to form a droplet at the tip of the wire electrode. A high current, i.e., pulse current, has a peak amplitude higher than the critical current, which is required to establish the spray arc [12]. Double pulse welding requires precise regulation of the frequency, intermittency, and wire feed speed parameters. Changing these parameters can induce changes in the process characteristics. In particular, the specific wire feed rate can influence the droplet size. By proper adjustment of the frequency parameter, it can be ensured that one droplet is transferred per pulse, and the intermittency affects the final appearance of the welded joint [13]. Double pulse welding changes the intensity of the parameters of the wire feed rate and the current intensity. Moreover, the parameters of low and high current frequencies also change. Therefore, the pulse current is characterized by a double level of parameters referring to the current (base and peak) and the frequency. Along with the parameter of current, there is an increase in voltage, which ultimately results in higher heat input at peak values of current and frequency. Double pulse welding enables a higher energy input than conventional pulse welding. At peak pulse values, the wire and the base material are more melted, while the base pulse levels provide less energy and prevent the burning of the base material [14]. The processes for the optimization of welded joints in the MIG welding process of Al alloys have been shown to be significant for the optimization of parameters (transverse shrinkage, tensile strength, and hardness). Welding current is found to have the greatest influence on these parameters, followed by welding speed and voltage. The Taguchi-based gray relational analysis method was used as the optimization method [15]. The successful application of the response surface method (RMS) in the optimization of the MIG parameters of the welding process, as well as graphical representation of the results and the development of a mathematical model, can be found in other modern studies [16,17,18,19,20].
The article demonstrates the possibility of applying numerical optimization to achieve the best possible properties of the welded joint. Specifically in this example, the geometric characteristics of the weld were used to classify the quality in terms of insufficient/excessive throat thickness, penetration, and weld width. For each of these characteristics, a limit value was set, i.e., the value that is acceptable for the given weld and that is sought to be achieved. Given the above constraints, the values of the input parameters that meet these specifications were determined. The same optimization principle can be applied to other desired numerical quality results of welded joints, which will be the subject of future experimental research.

2. Experimental Procedure

Aluminum and aluminum alloys are widely used materials, so both the technology of their processing and the production of new parts of aluminum and aluminum alloys are constantly developing. Aluminum and aluminum alloys have a high specific strength, high processability, anti-erosion properties, increased conductivity, an eco-friendly nature, and recoverability, and are also characterized by good corrosion resistance [21,22]. Having this in mind, the authors conducted research on the application of the MIG synchropulsed welding process for the welding of AlMg4.5Mn0.7 Al alloys [23,24]. The chemical composition of the AlMg4.5Mn0.7 aluminum alloy used in this experiment is given in Table 1. Such types of alloys are usually used in the production of parts and elements for aircraft, ships and railway vehicles [25,26].
The mechanical and physical properties of the alloy used in this experiment are given in Table 2 and Table 3.
Sources of power for the MIG/MAG welding process with the series TPS320i, TPS 400i, TPS 500i, and TPS 600i are completely digital, as there is a microprocessor that controls inverter power sources. The Fronius TPSi 400 (Wels, Austria) was used in this experimental study. The modular design and flexibility of these devices facilitate their operation in any situation. The filler material used in this experiment was an AlMg4.5Mn0.7 alloy, known by its commercial name, AW 5083. Its melting point is approximately 570 °C, and it has very good anticorrosive properties. Applied wire of 1.2 mm diameter was manufactured by Migal Co GmbH (Landau/Isar, Germany). The shielding gas was argon 4.8 I1 (according to the HRN EN ISO 14175:2008 standard). Shielding gas with argon is used for welding aluminum and its alloys, duplex steels, austenitic CrNi steels, other nonferrous metals, gas-sensitive materials, etc.
Defining of Parameters for the Experiment
Based on the analysis of the results of previous studies on welding AW 5083 plates using the synchropulse welding process MIG, the authors found that it is necessary to analyze the interaction of the above parameters and evaluate their influence on the properties of the welded joint, so they defined them as input variables for this experiment. The delta wire feed, the frequency F, and the duty cycle have some influence on the properties of the weld, and these properties are investigated. In this experiment, the obtained results are analyzed to determine the functional dependence in the form of a mathematical model that can be used to further determine the dependence of the tested properties on the input variables. The response surface method (RSM) was used as the experimental design method, i.e., the Central Composite Design (CCD) was chosen. Table 4 provides an overview of the coded values of the factors, while Table 5 shows all experimental runs with an overview of the research results obtained. Table 5 shows the test plan and the arithmetic mean of the responses. The arithmetic mean was calculated for three repeated measurements. The principle of randomization was followed, and 54 samples (three for each experimental condition) were processed in a random experimental order.
The selection of the parameters of the welding machine is limited in view of the values obtained and presented in Table 5. The values of the delta wire feed on the machine vary by ± 0.1 m/min, so exact values could not be obtained. For example, the reading was 1.29592 m/min, but values of 1.3 m/min, 3.1 m/min, and 4.8 m/min were selected; and the frequency parameter varies by ± 0.1 Hz, so values of 2.5 Hz, 1.00 Hz, and 1.8 Hz were selected. Also, the duty cycle parameter can be selected in the range of ±1%, and the selected parameters were 26% and 74%.
Welding is one of the most common processes of joining metals, yet its definition is complex because it involves several scientific disciplines, such as metallurgy, electrical engineering, technical materials, thermodynamics, etc. The multidisciplinarity of the welding process often requires the application of factorial experimental designs, which provide models for output or dependent variables on the basis of input factors or independent variables. In practice, the obtained mathematical model is useful for process optimization and for assuring the better quality of the welded joint. As an example of a welding parameter analysis, a central composite design can be selected by assuming that the generated model will be obtained by a second-degree polynomial. The central composite design belongs to the group of higher-order factorial experiments. It involves a “2k” factorial design at a high point and a “2k” design at the axes and central point, whereas “k” represents the number of factors. The number of experimental runs required can be obtained by the following equation [27,28,29,30,31]:
N = 2 k + 2 k + n 0
where k is the number of factors and n0 is the number of repetitions at the central point of the design.
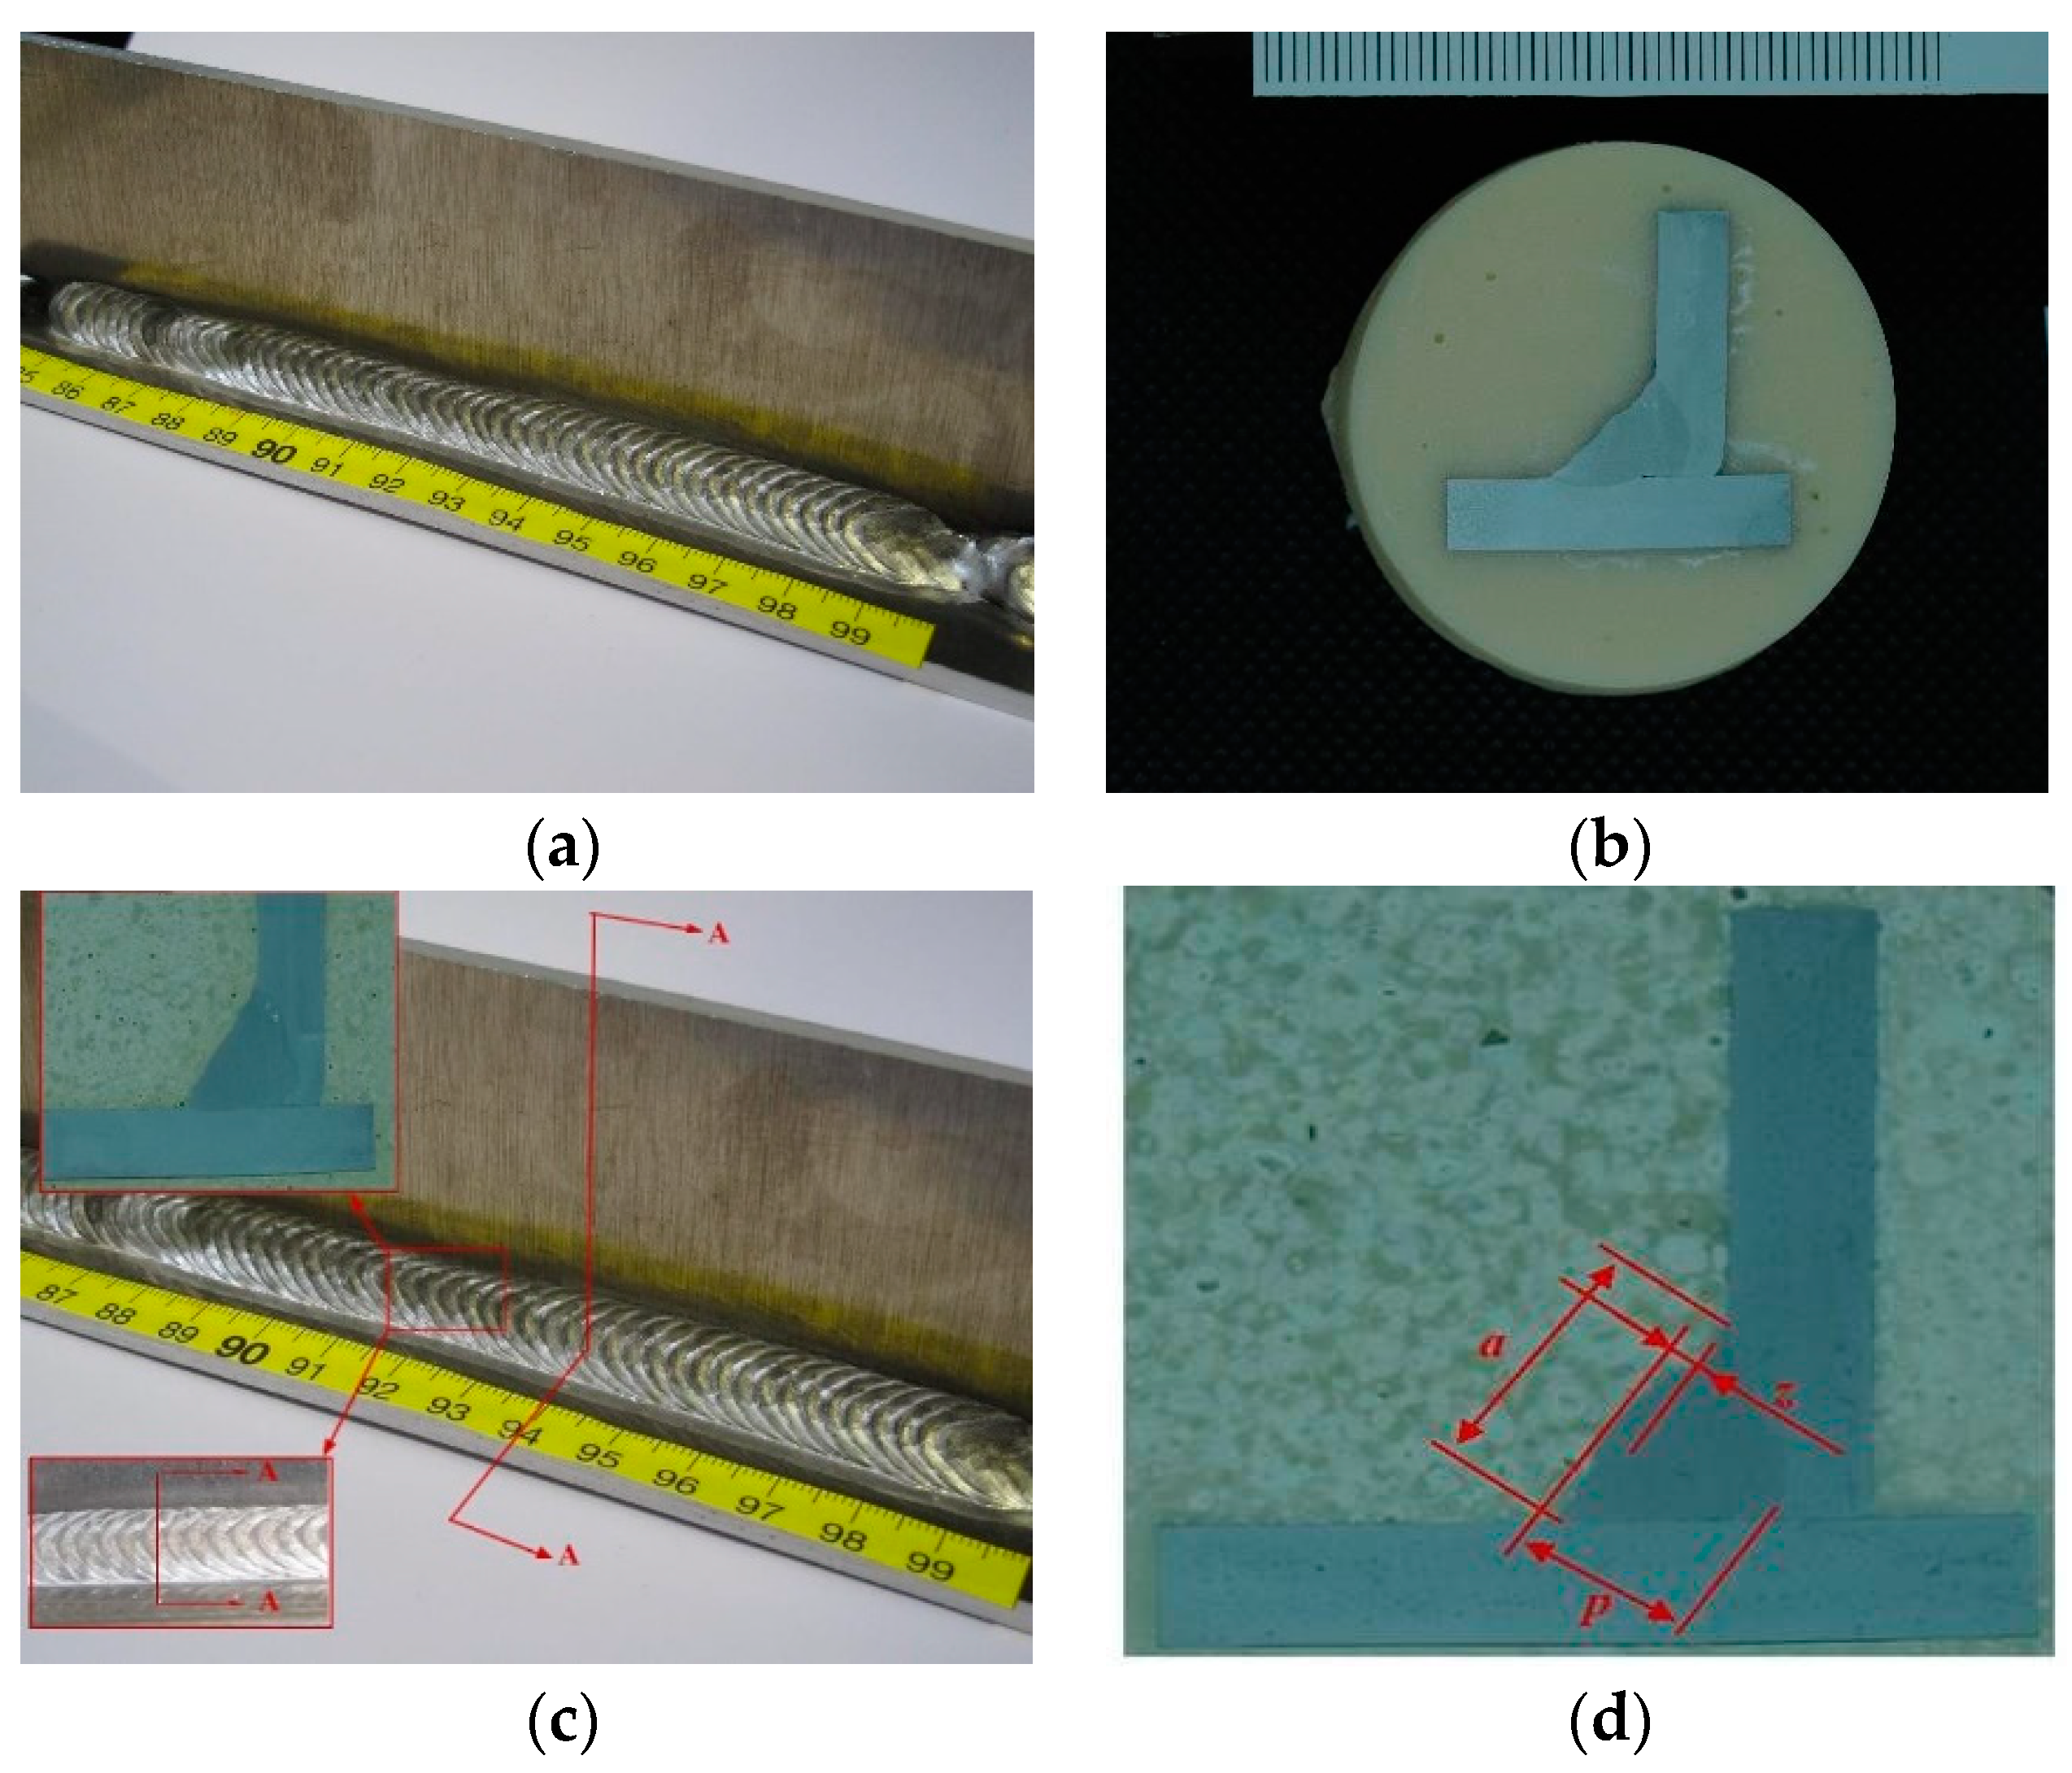
Welding was performed on one side of 18 pairs of plates according to the sequence and parameters specified above. Variable parameters were delta wire feed, frequency, and duty cycle, and constant parameters were welding amperage, welding voltage, welding speed, wire diameter, and arc correction. The angle welds were performed on rectangular specimens with a thickness of 6 mm. Welded specimen No. 17 (see Figure 2a) was taken as a representative specimen since it was welded using nearly ideal parameters. The initial parameters were measured at the cross section of each weld, as shown in Figure 2c. The image obtained by the cross section of the weld was the same for each thin section. Based on the distance measurements on the thin sections, the values of the output variables were obtained, i.e., the values for the insufficient/excessive thickness of the fillet, the penetration, and the weld width, as shown in Figure 2d. The microsection is shown in Figure 2b.

3. Analysis of Research Results

In Table 6, samples are marked according to standards of the central composite design. Table 7 shows the maximum and minimum values of the output variables, the mean value, and the standard deviation of the output variables. There is also an optimization model presented for each output variable.
The principle of randomization was respected, i.e., all 18 samples were processed in random order. Sample No. 3 was welded first, while sample No. 5 was welded last. The random order and statistical data analysis were generated in Design Expert software.

3.1. Output Variable—Insufficient/Excessive Throat Thickness

Experimental data were used to create a mathematical function that expresses the predicted or average dependence between the response or the output variables and the input factors. This regression model indicates statistical or stochastic dependence. It can be applied in the evaluation, management, and, as in this case, optimization of the process. With reference to the obtained experimental data, it was proven that the linear model was best for different indicators (based on testing the linear model, the linear two-factor interaction model (2FI), quadratic model, and cubic model). The models were tested for the mean squared deviation, for the lack of fit, and for the coefficients of determination, and the obtained data are shown in Table 8.
Table 9 presents the report obtained from Design Expert, referring to the analysis of variance of the selected linear regression model and showing the dependence of insufficient/excessive throat thickness on the input variables.
The coefficient of determination R2 refers to the share of explained variability (the extent of deviation of the regression y from the arithmetic mean) in total variability (the extent of deviation of actual y from the arithmetic mean), and is 0.7539 [23]. A higher value of the coefficient of determination does not necessarily mean that the regression model is good. Adding new members to the model will always lead to an increase in R2, regardless of the statistical significance of a particular member. It is possible that models with a high coefficient of determination actually poorly assess new values or the arithmetic mean of the response. Since R2 always increases when new members are added to the model, it is necessary to use the adjusted coefficient of determination R2adj, as that value is adjusted to the number of model members in relation to the number of runs, which was 0.7011 in our experiment [23]. Equation (2) presents the regression model of the insufficient/excessive throat thickness dependence on the delta wire feed (factor A), frequency (factor B), and duty cycle (factor C) with coded values for factor levels, while Equation (3) presents the regression model with actual factor values.
z = 0.2378 0.4689 A + 0.2424 B 0.238 C
z = 0.50701 0.267306   D e l t a   w i r e   f e e d + 0.326124 F 0.010006   D u t y   c y c l e
Figure 3, Figure 4 and Figure 5 are graphic representations of these models.
Figure 3 shows that insufficient/excessive throat thickness in the weld increases when the delta wire feed parameter decreases and the frequency increases when the duty cycle is 26.216%.
Figure 4 shows that the insufficient/excessive throat thickness in the weld increases when the delta wire feed parameter decreases and the frequency increases when the duty cycle is 50.00%.
Figure 5 shows that the insufficient/excessive throat thickness in the weld increases when the delta wire feed parameter decreases and the frequency increases when the duty cycle is 73.78%.

3.2. Output Variable—Weld Penetration

The linear model proved to be the best for the experimental data. The models were tested for the mean squared deviation, lack of fit, and coefficients of determination, and the obtained data are given in Table 10.
Table 11 presents the report obtained from Design Expert referring to the analysis of variance of the selected linear regression model that is used to describe the dependence of weld penetration on the input factors.
The coefficient of determination R2 refers to the share of explained variability in total variability, which in this case is 0.7689. The adjusted coefficient of determination R2adj is adjusted to the number of model members in relation to the number of runs, and is 0.7194. Equation (4) shows the regression model for the dependence of weld penetration on the delta wire feed (factor A), frequency (factor B), and duty cycle (factor C) with coded values for factor levels, while Equation (5) presents the regression model with actual factor values.
p = 6.8 0.6869 A + 0.1066 B + 1.22 C
p = 5.17525 0.391577   D e l t a   w i r e   f e e d + 0.143467 F + 0.051393   D u t y   c y c l e
Figure 6, Figure 7 and Figure 8 refer to the graphic presentations of the models.
Figure 6 shows that the superelevation in the weld increases and the delta wire feed parameter decreases when the duty cycle is 26.216%.
Figure 7 shows that the superelevation in the weld increases and the delta wire feed parameter decreases when the duty cycle is 50.00%.
Figure 8 shows that the superelevation in the weld increases and the delta wire feed parameter decreases when the duty cycle is 73.78%.

3.3. Output Variable—Weld Width

The linear model again proved to be the best for the experimental data. The models were tested for the mean squared deviation, lack of fit, and coefficients of determination, and the obtained data are shown in Table 12.
Table 13 refers to the report obtained from Design Expert, referring to the analysis of variance of the selected linear regression model for presentation of the weld width dependence on the input factors.
The coefficient of determination R2 is 0.7475. The adjusted coefficient of determination R2adj, adjusted to the number of model members in relation to the number of runs, is 0.6932. Equation (6) shows the regression model for the dependence of weld width on the delta wire feed (factor A), frequency (factor B), and duty cycle (factor C) with coded values for factor levels, while Equation (7) presents the regression model with actual factor values.
a = 10.44 + 0.6338 A 0.24 B + 1.17 C
a = 7.45033 0.361312   D e l t a   w i r e   f e e d + 0.322915 F + 0.049053   D u t y   c y c l e
Figure 9, Figure 10 and Figure 11 give graphic representations of these models.
Figure 9 shows that the weld width increases, the delta wire feed parameter increases, and the frequency slightly decreases when the duty cycle is 26.216%.
Figure 10 shows that the weld width increases, the delta wire feed parameter increases, and the frequency slightly decreases when the duty cycle is 50.00%.
Figure 11 shows that the weld width increases, the delta wire feed parameter increases, and the frequency slightly decreases when the duty cycle is 73.78%.
Based on the research results, the parameters could be optimized by selecting the values of the input variables that provided the desired characteristics. Table 14 gives an overview of the limits set for the above optimization. Ranges were given within which the input variables and the desired property to be achieved by the optimization were kept. The goal was to achieve a throat thickness that was too small/excessive with a target value of 0, a weld penetration that was as large as possible, and a weld width with a target value of 10. In selecting the optimal values for the input parameters, an importance factor was added for each service in addition to the constraints listed in Table 14. By degree of importance, penetration was determined to be the most important factor, while insufficient/excessive throat thickness was determined to be the least important factor.
Given the defined constraints, Table 15 shows the solutions for some of the best combinations of input variables.
The optimal parameters (number 1) that resulted in insufficient/excessive neck thickness with a target value of 0, maximum penetration, and weld width with a target value of 10 are shown in Figure 12, Figure 13 and Figure 14. To obtain the desired characteristics, it is best to select the following values for the input parameters: delta wire feed = 1.296 m/min; frequency = 1.546 Hz, and duty cycle = 66.436%, which can also be seen in the following figures.

4. Conclusions

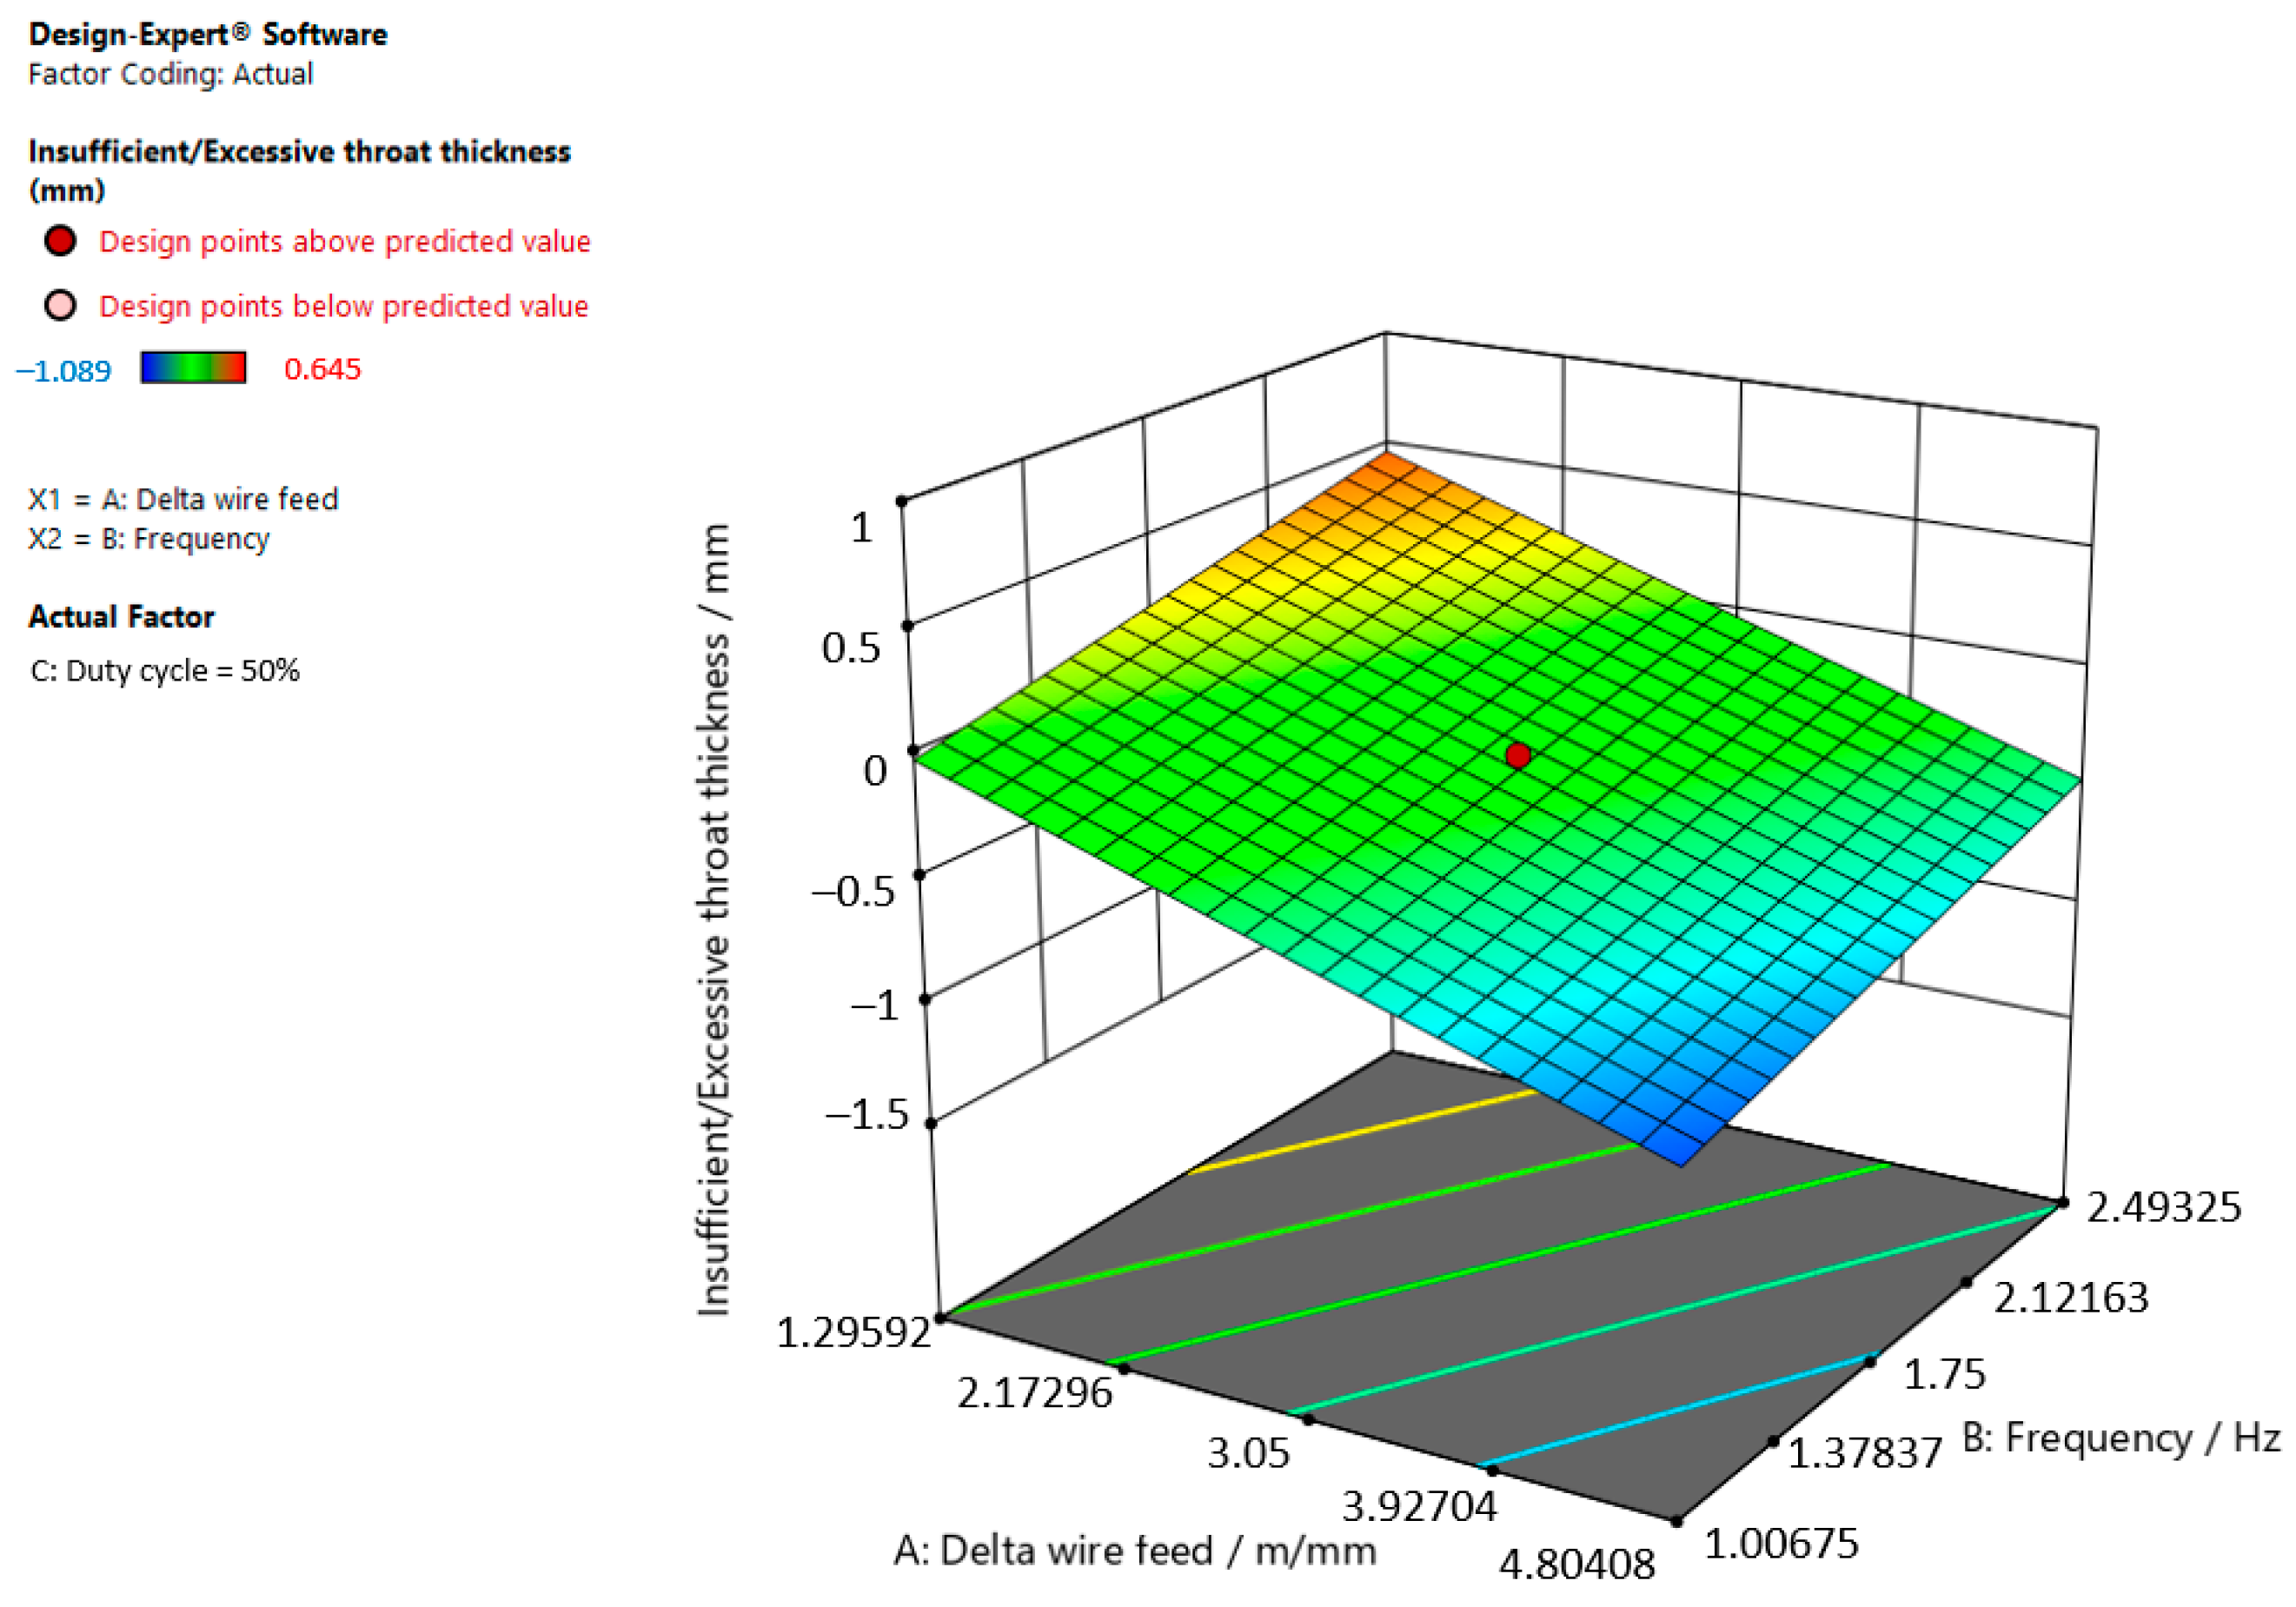
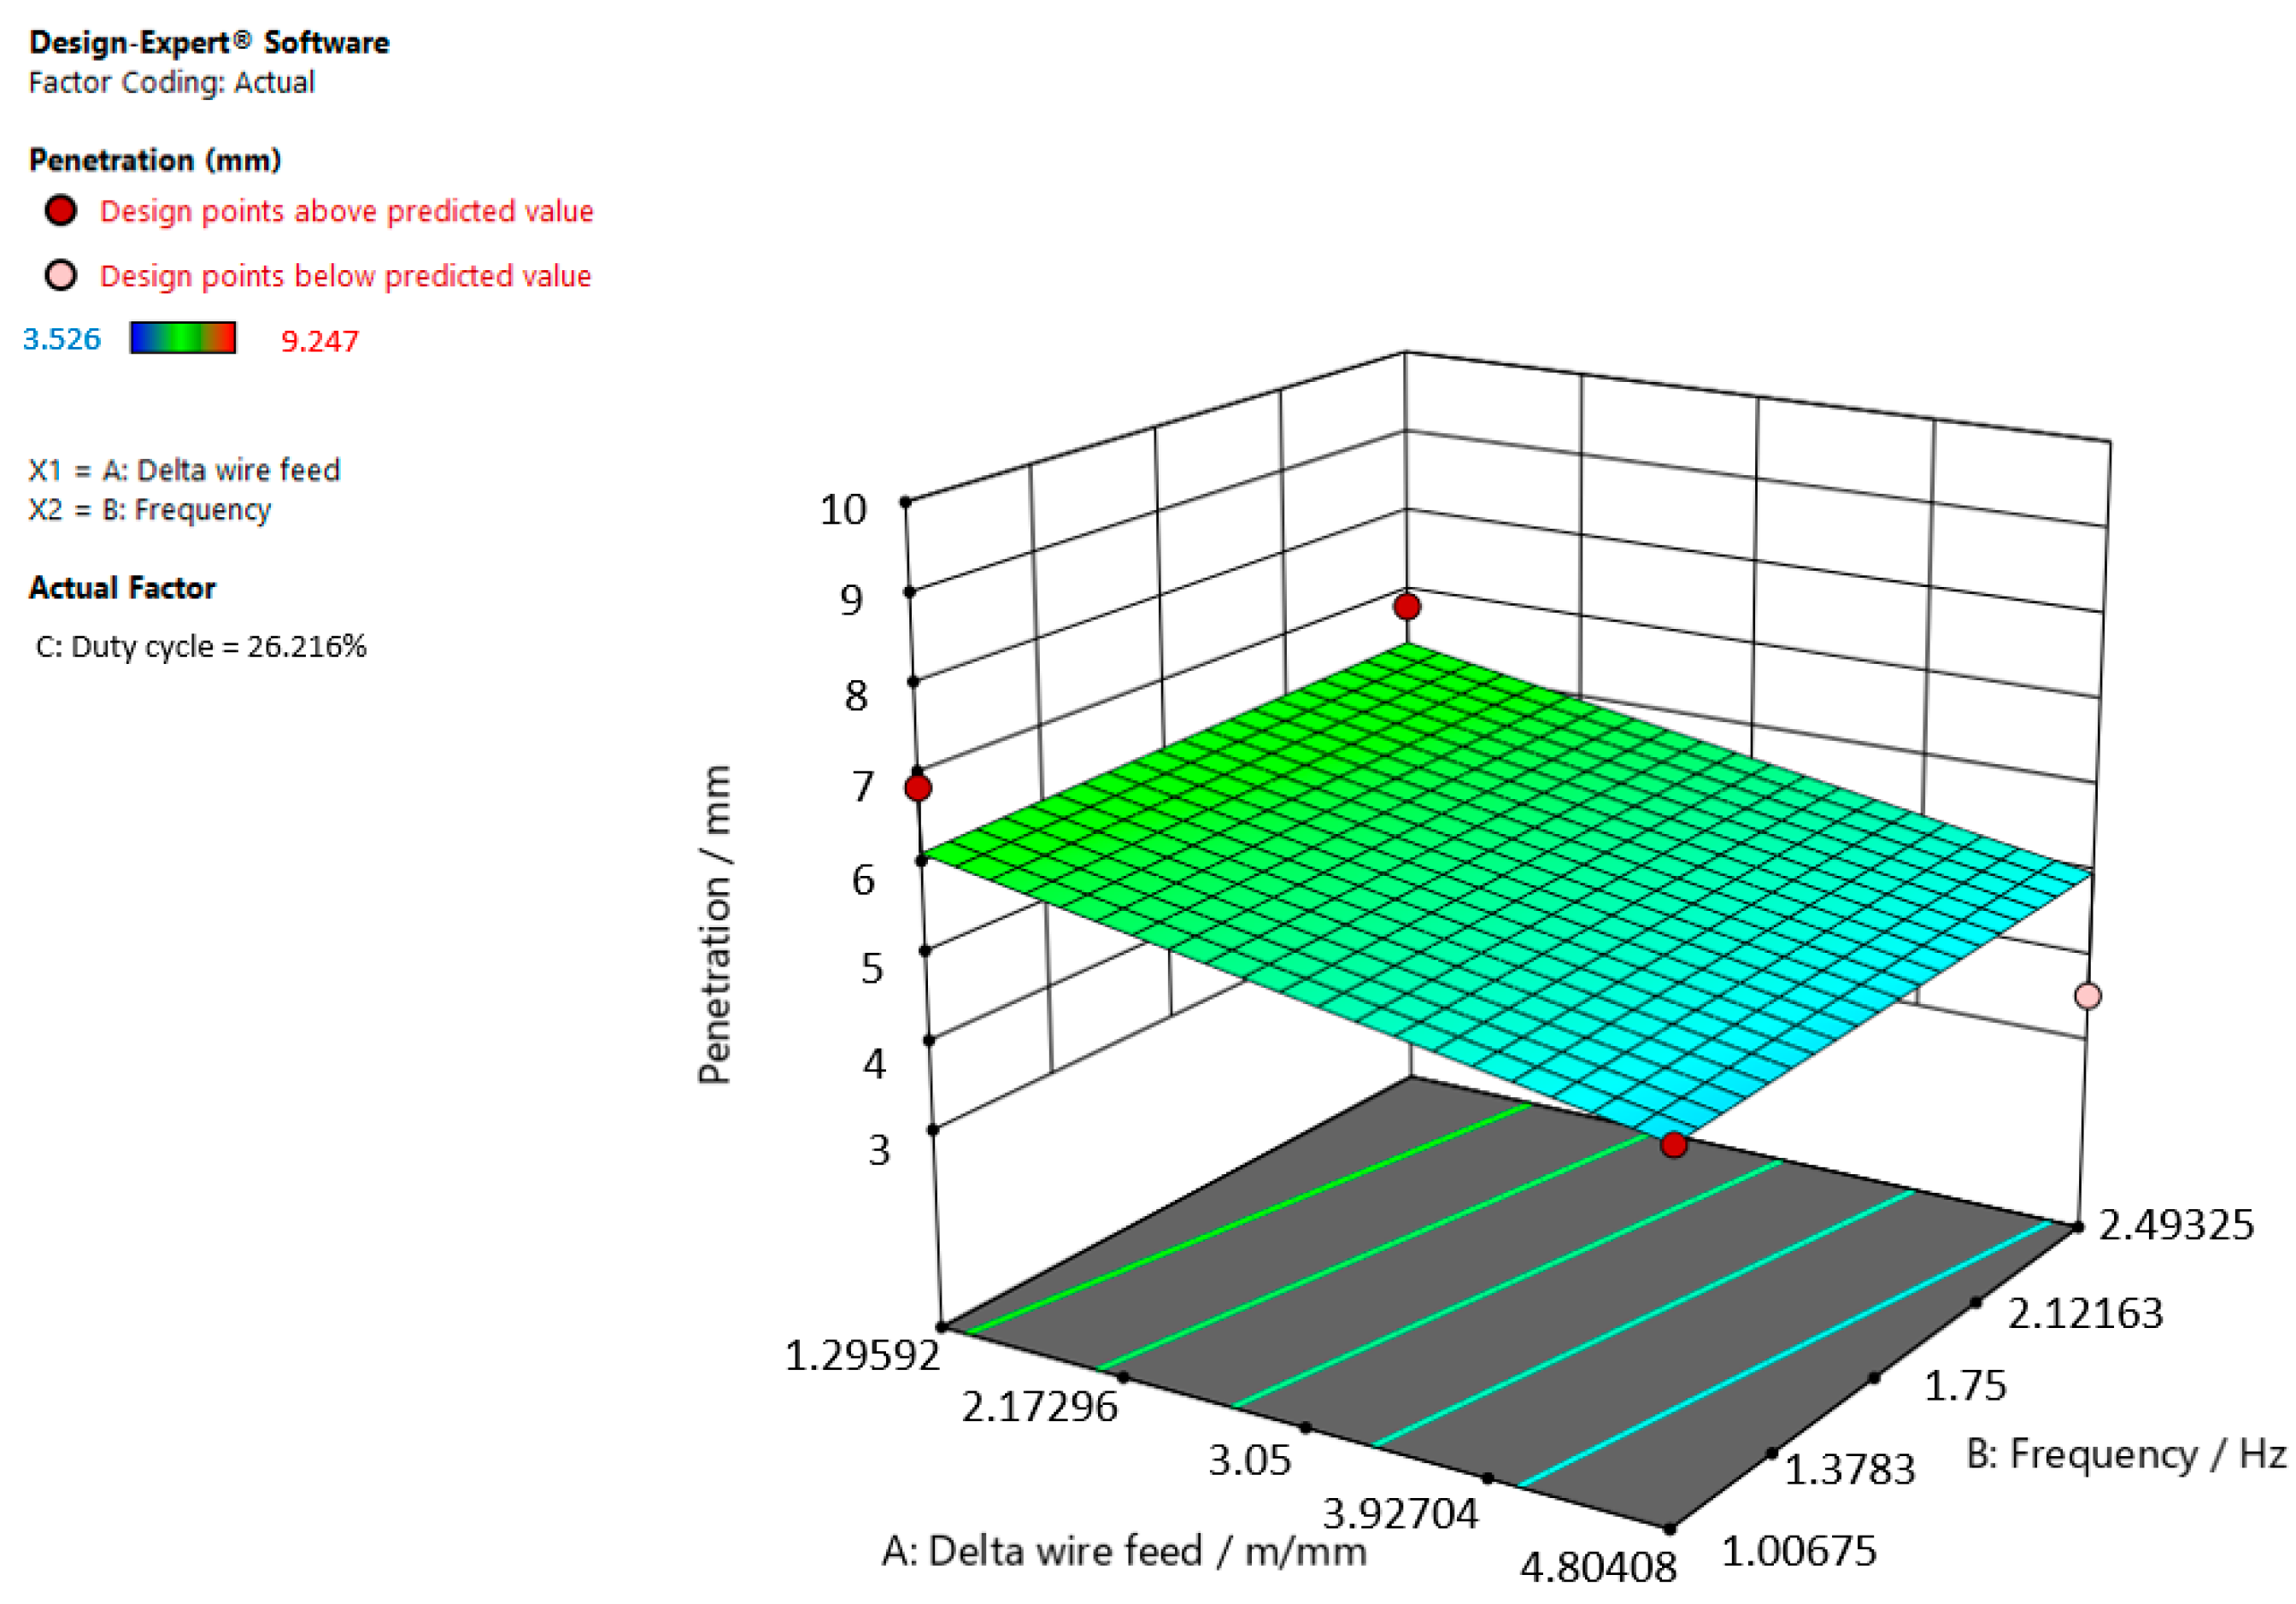
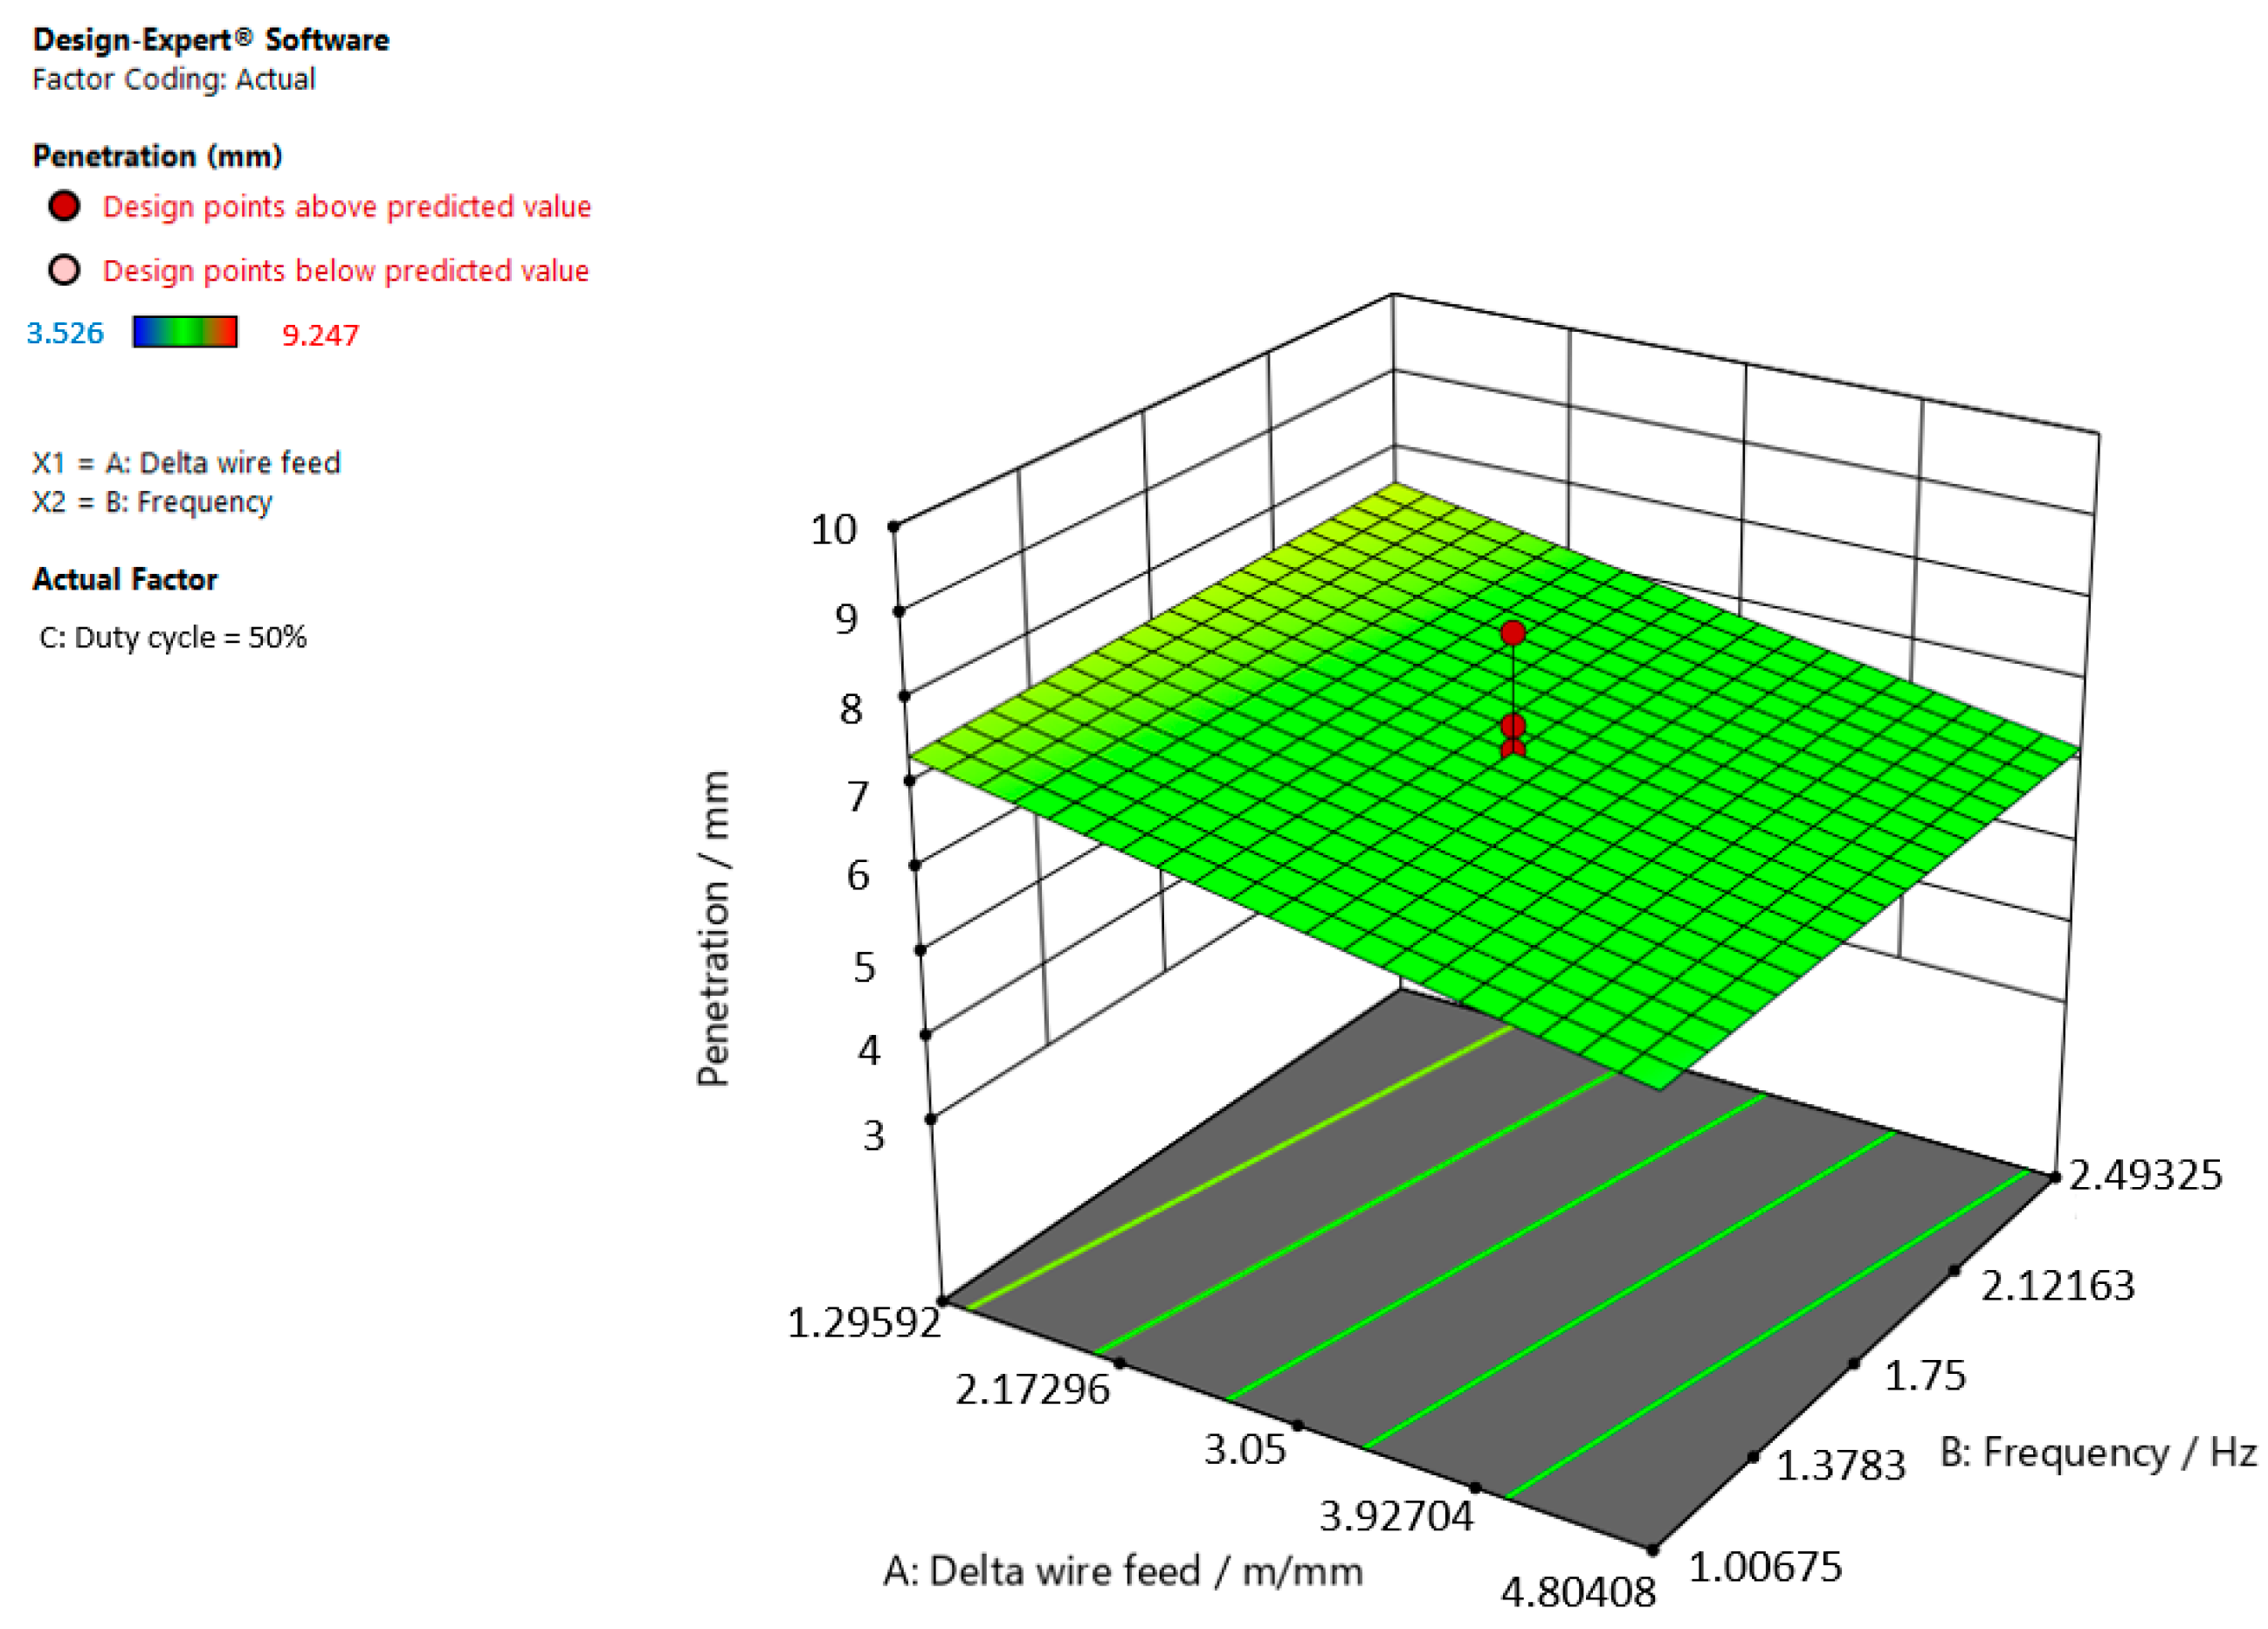
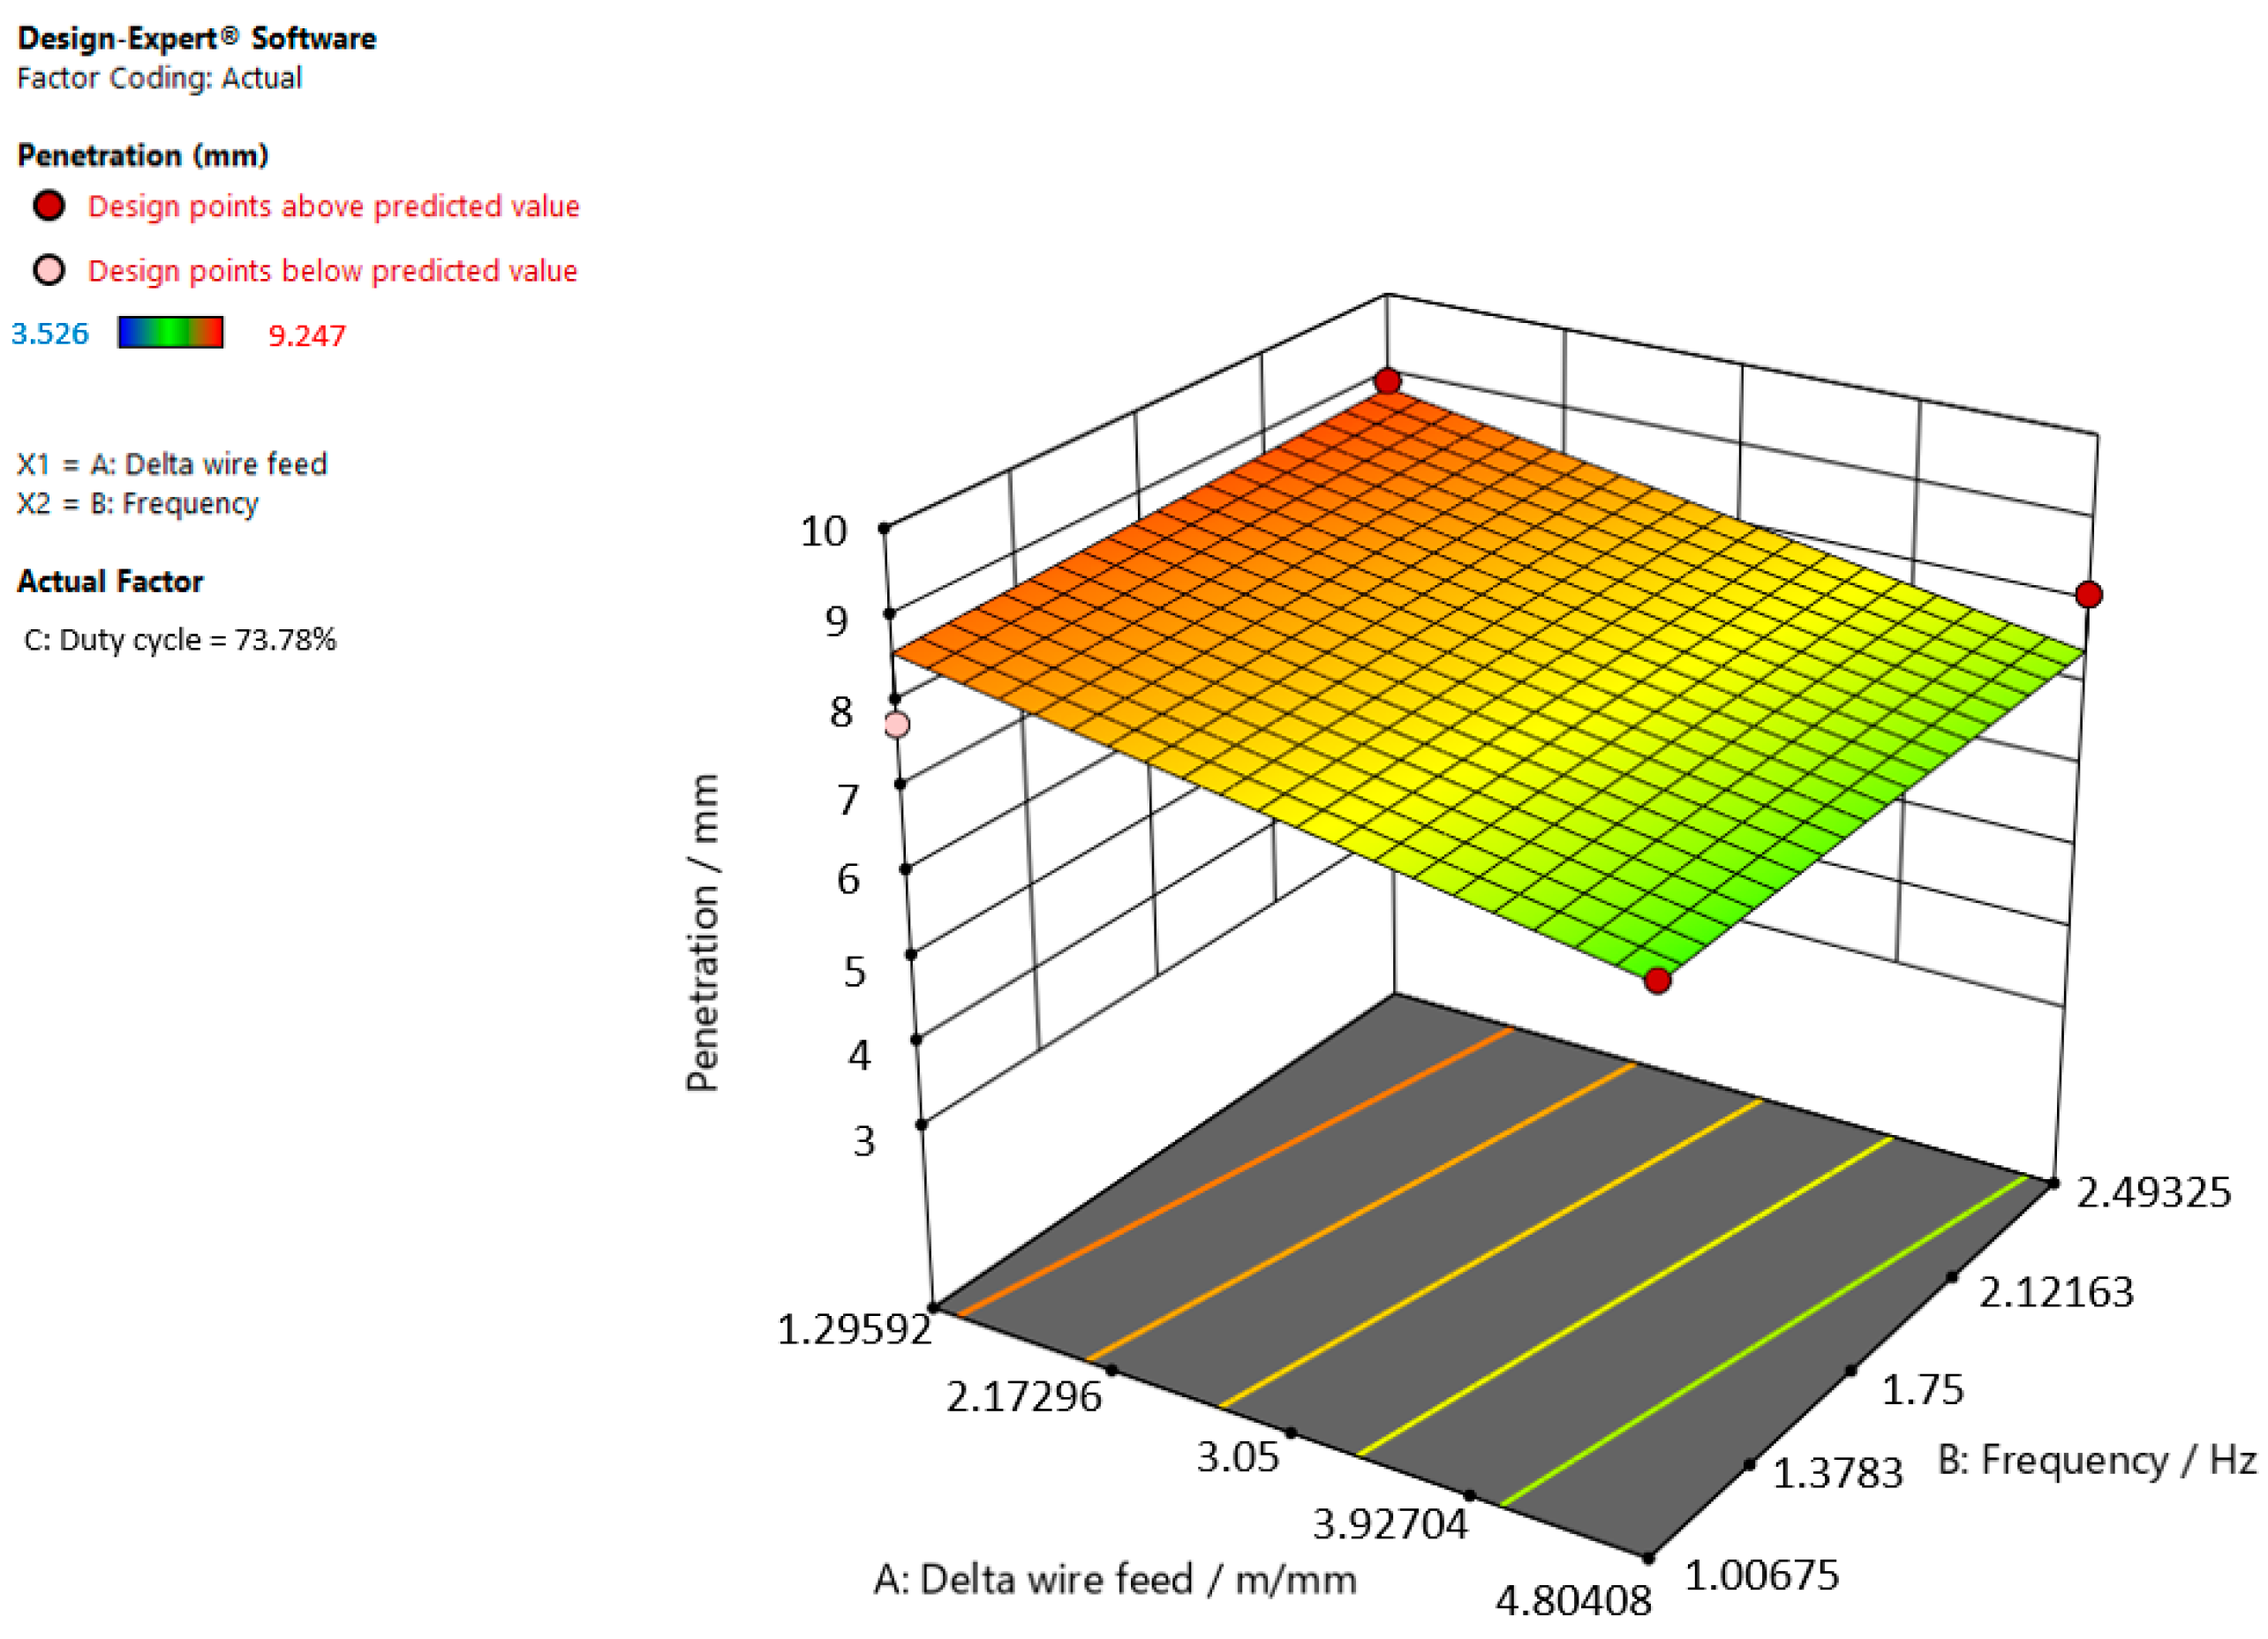
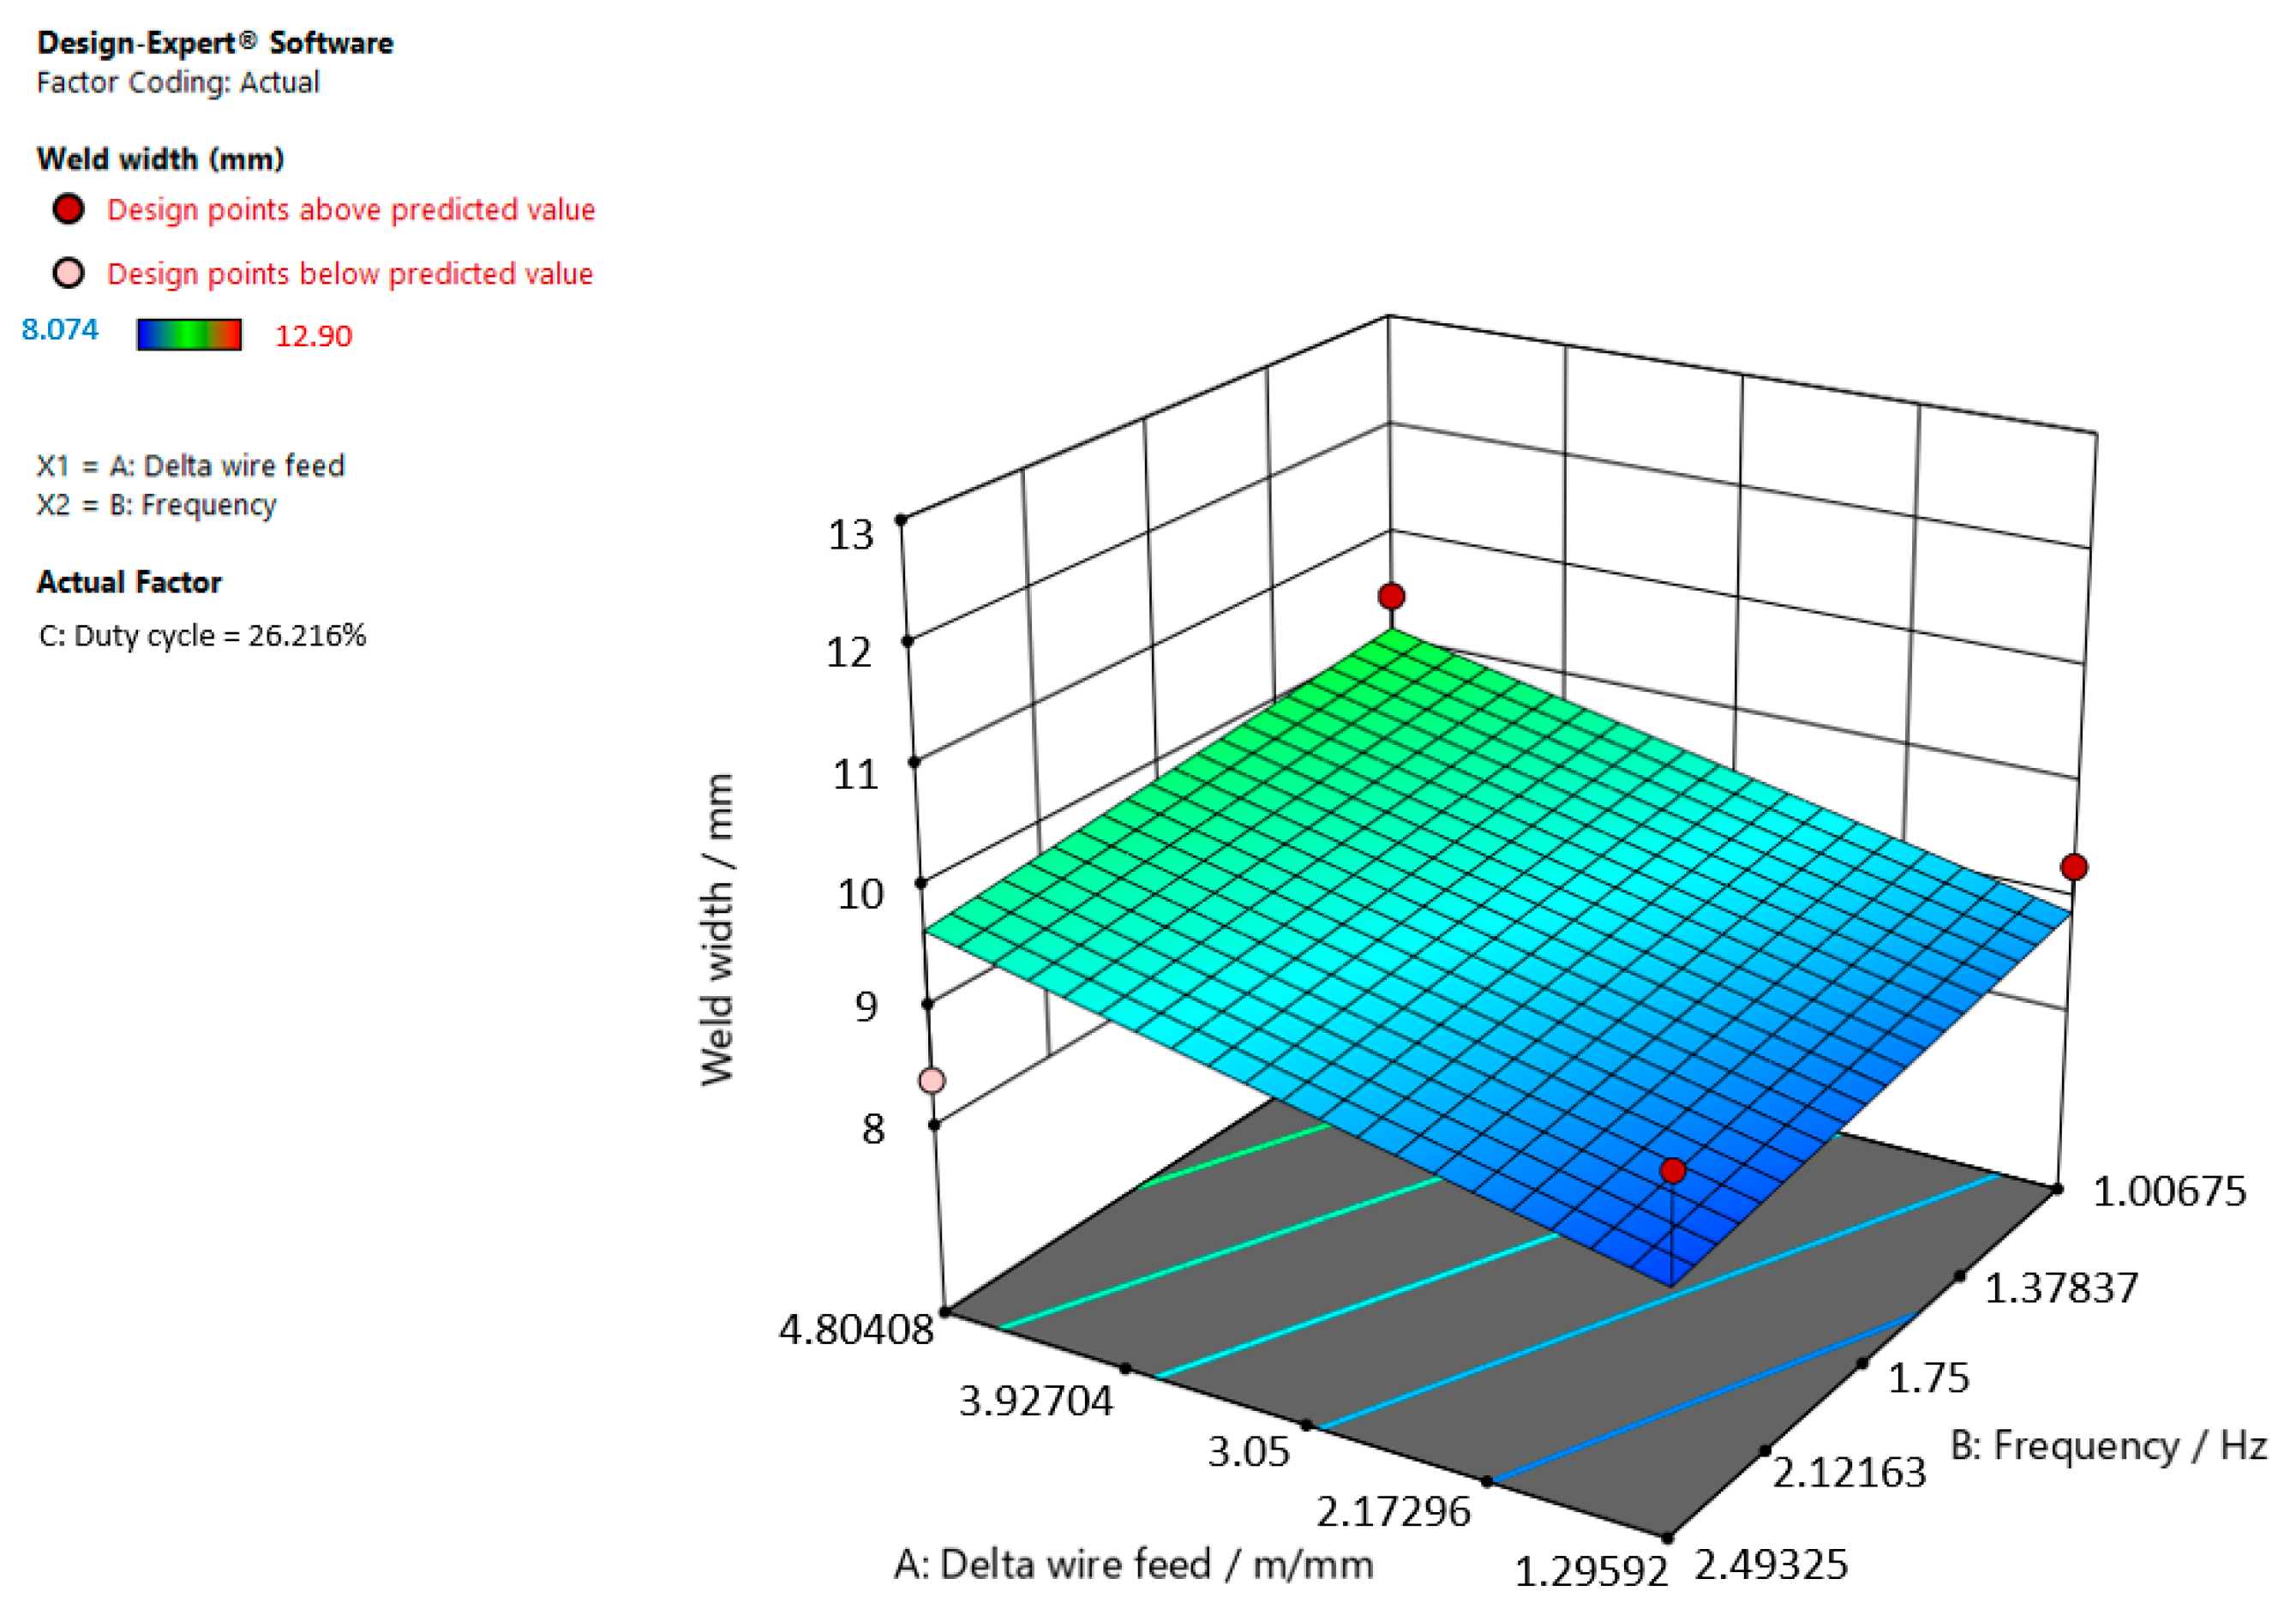
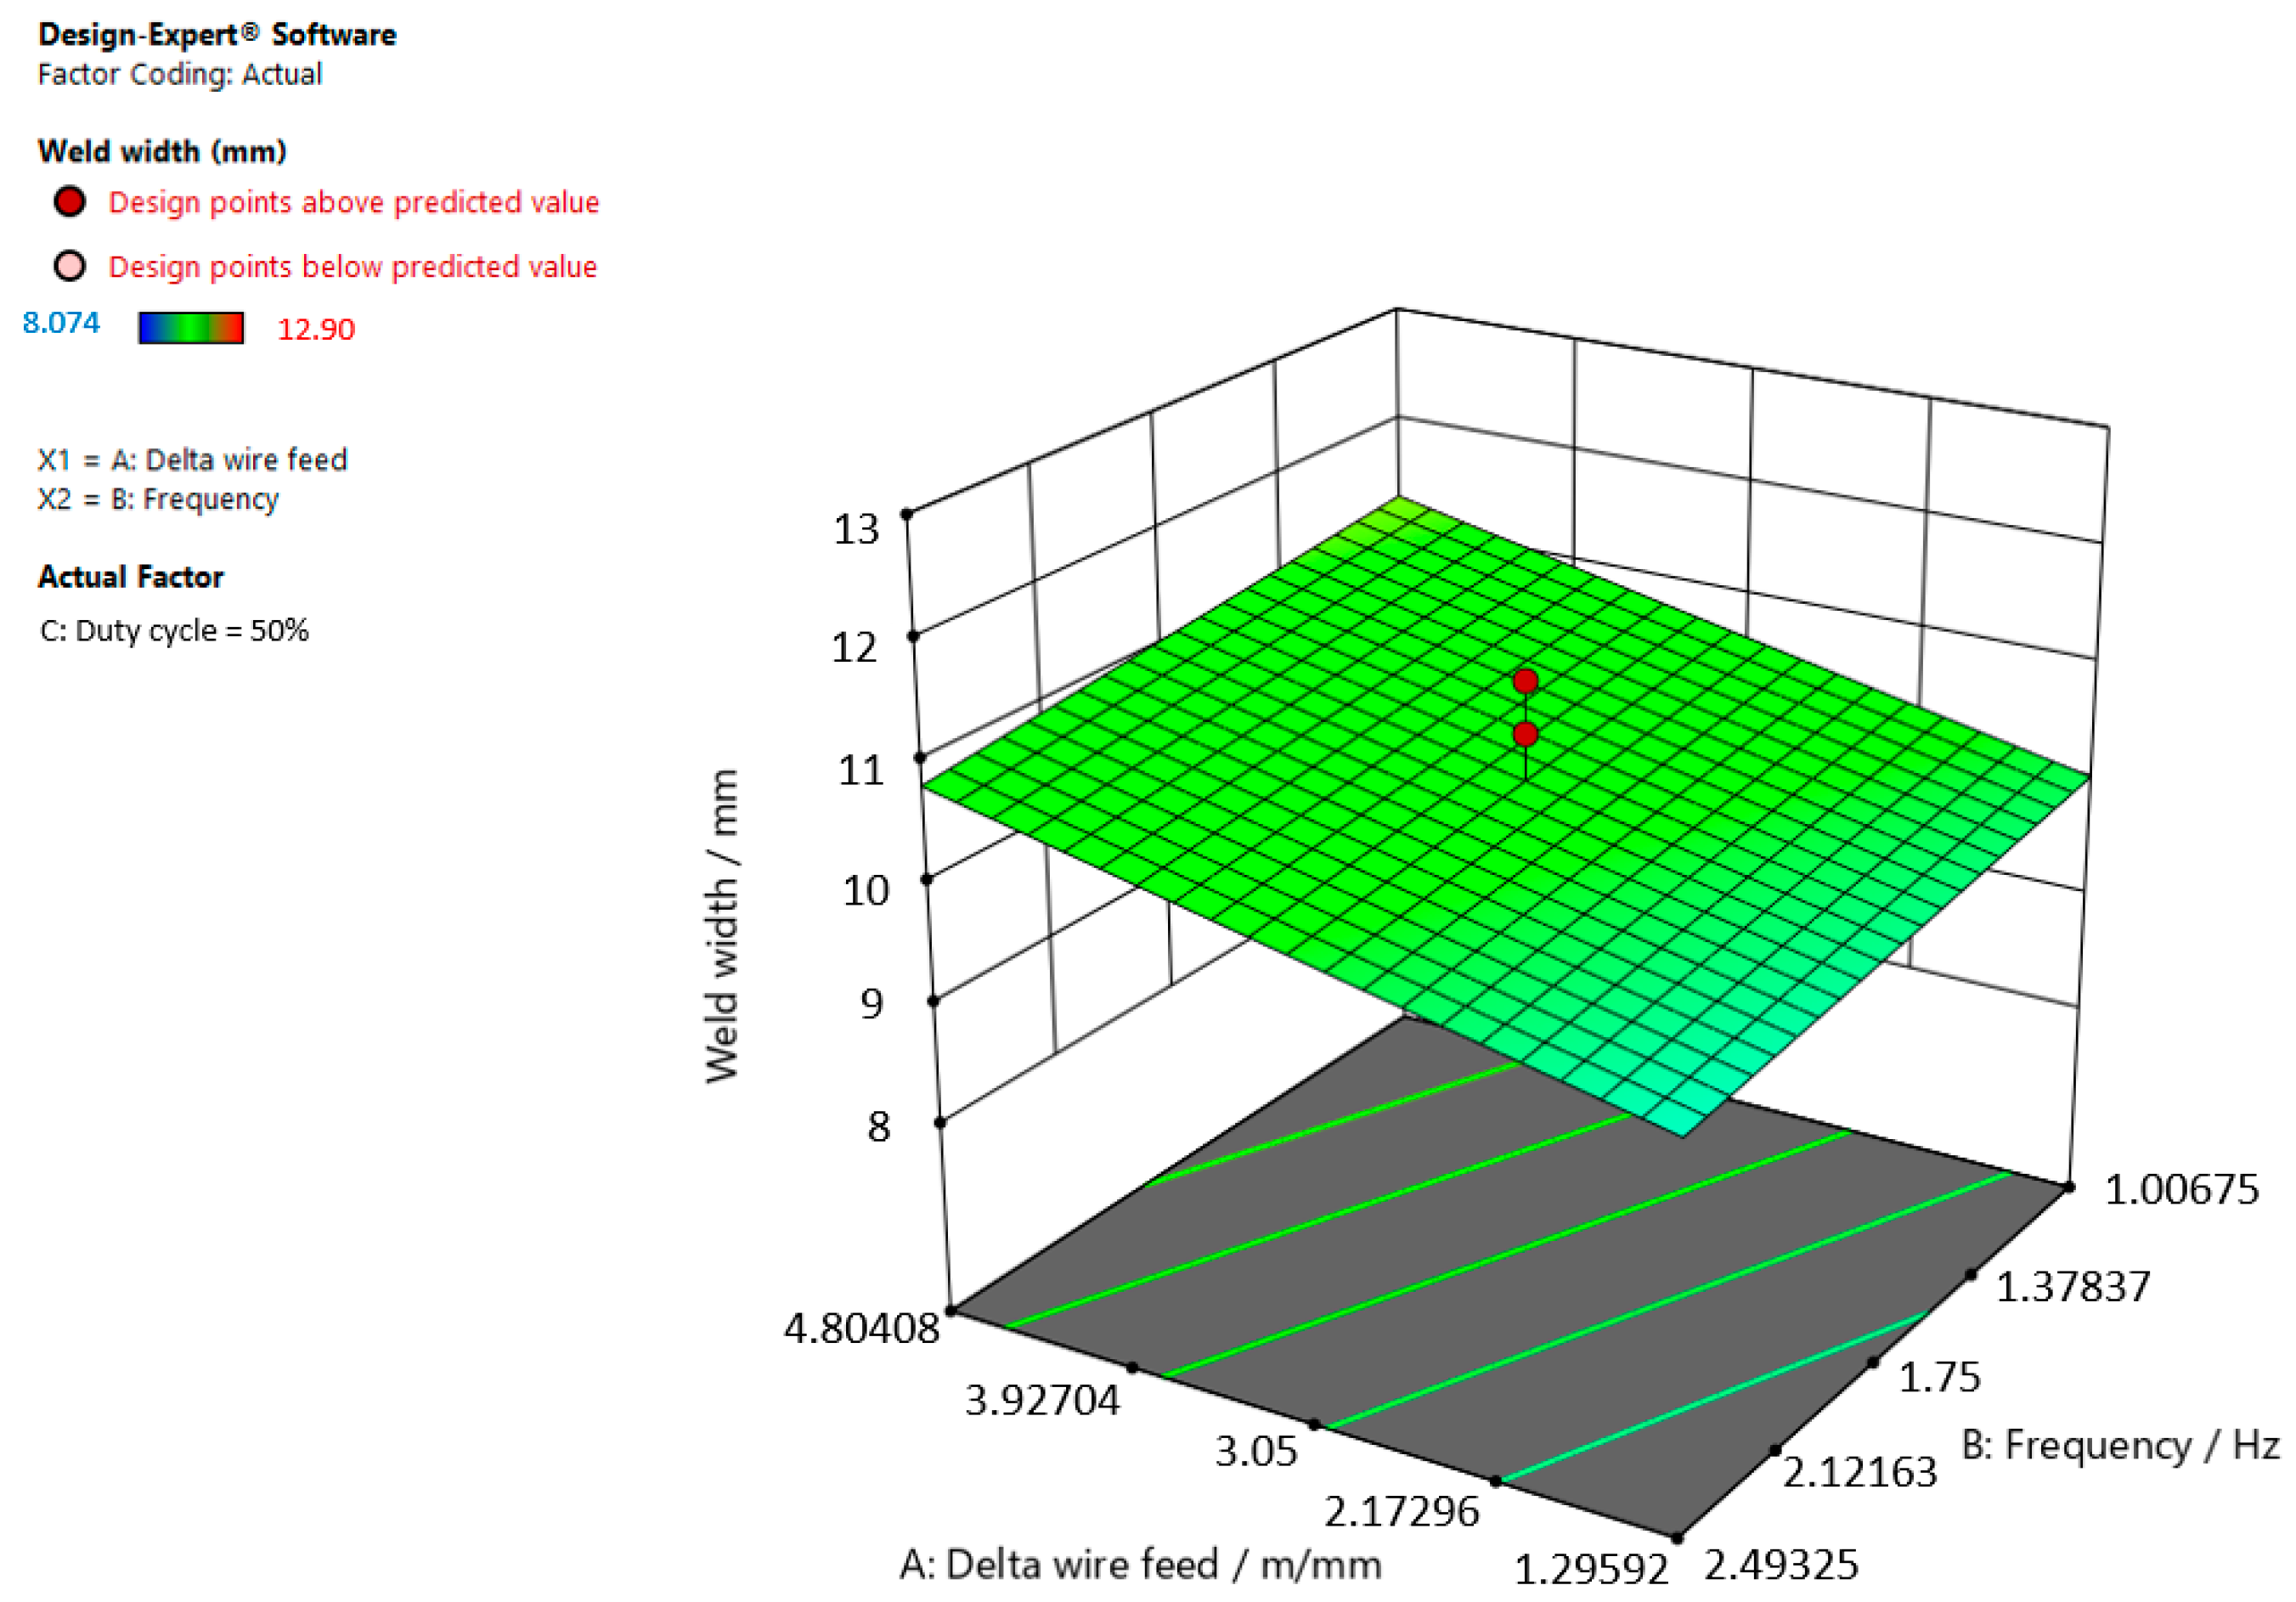
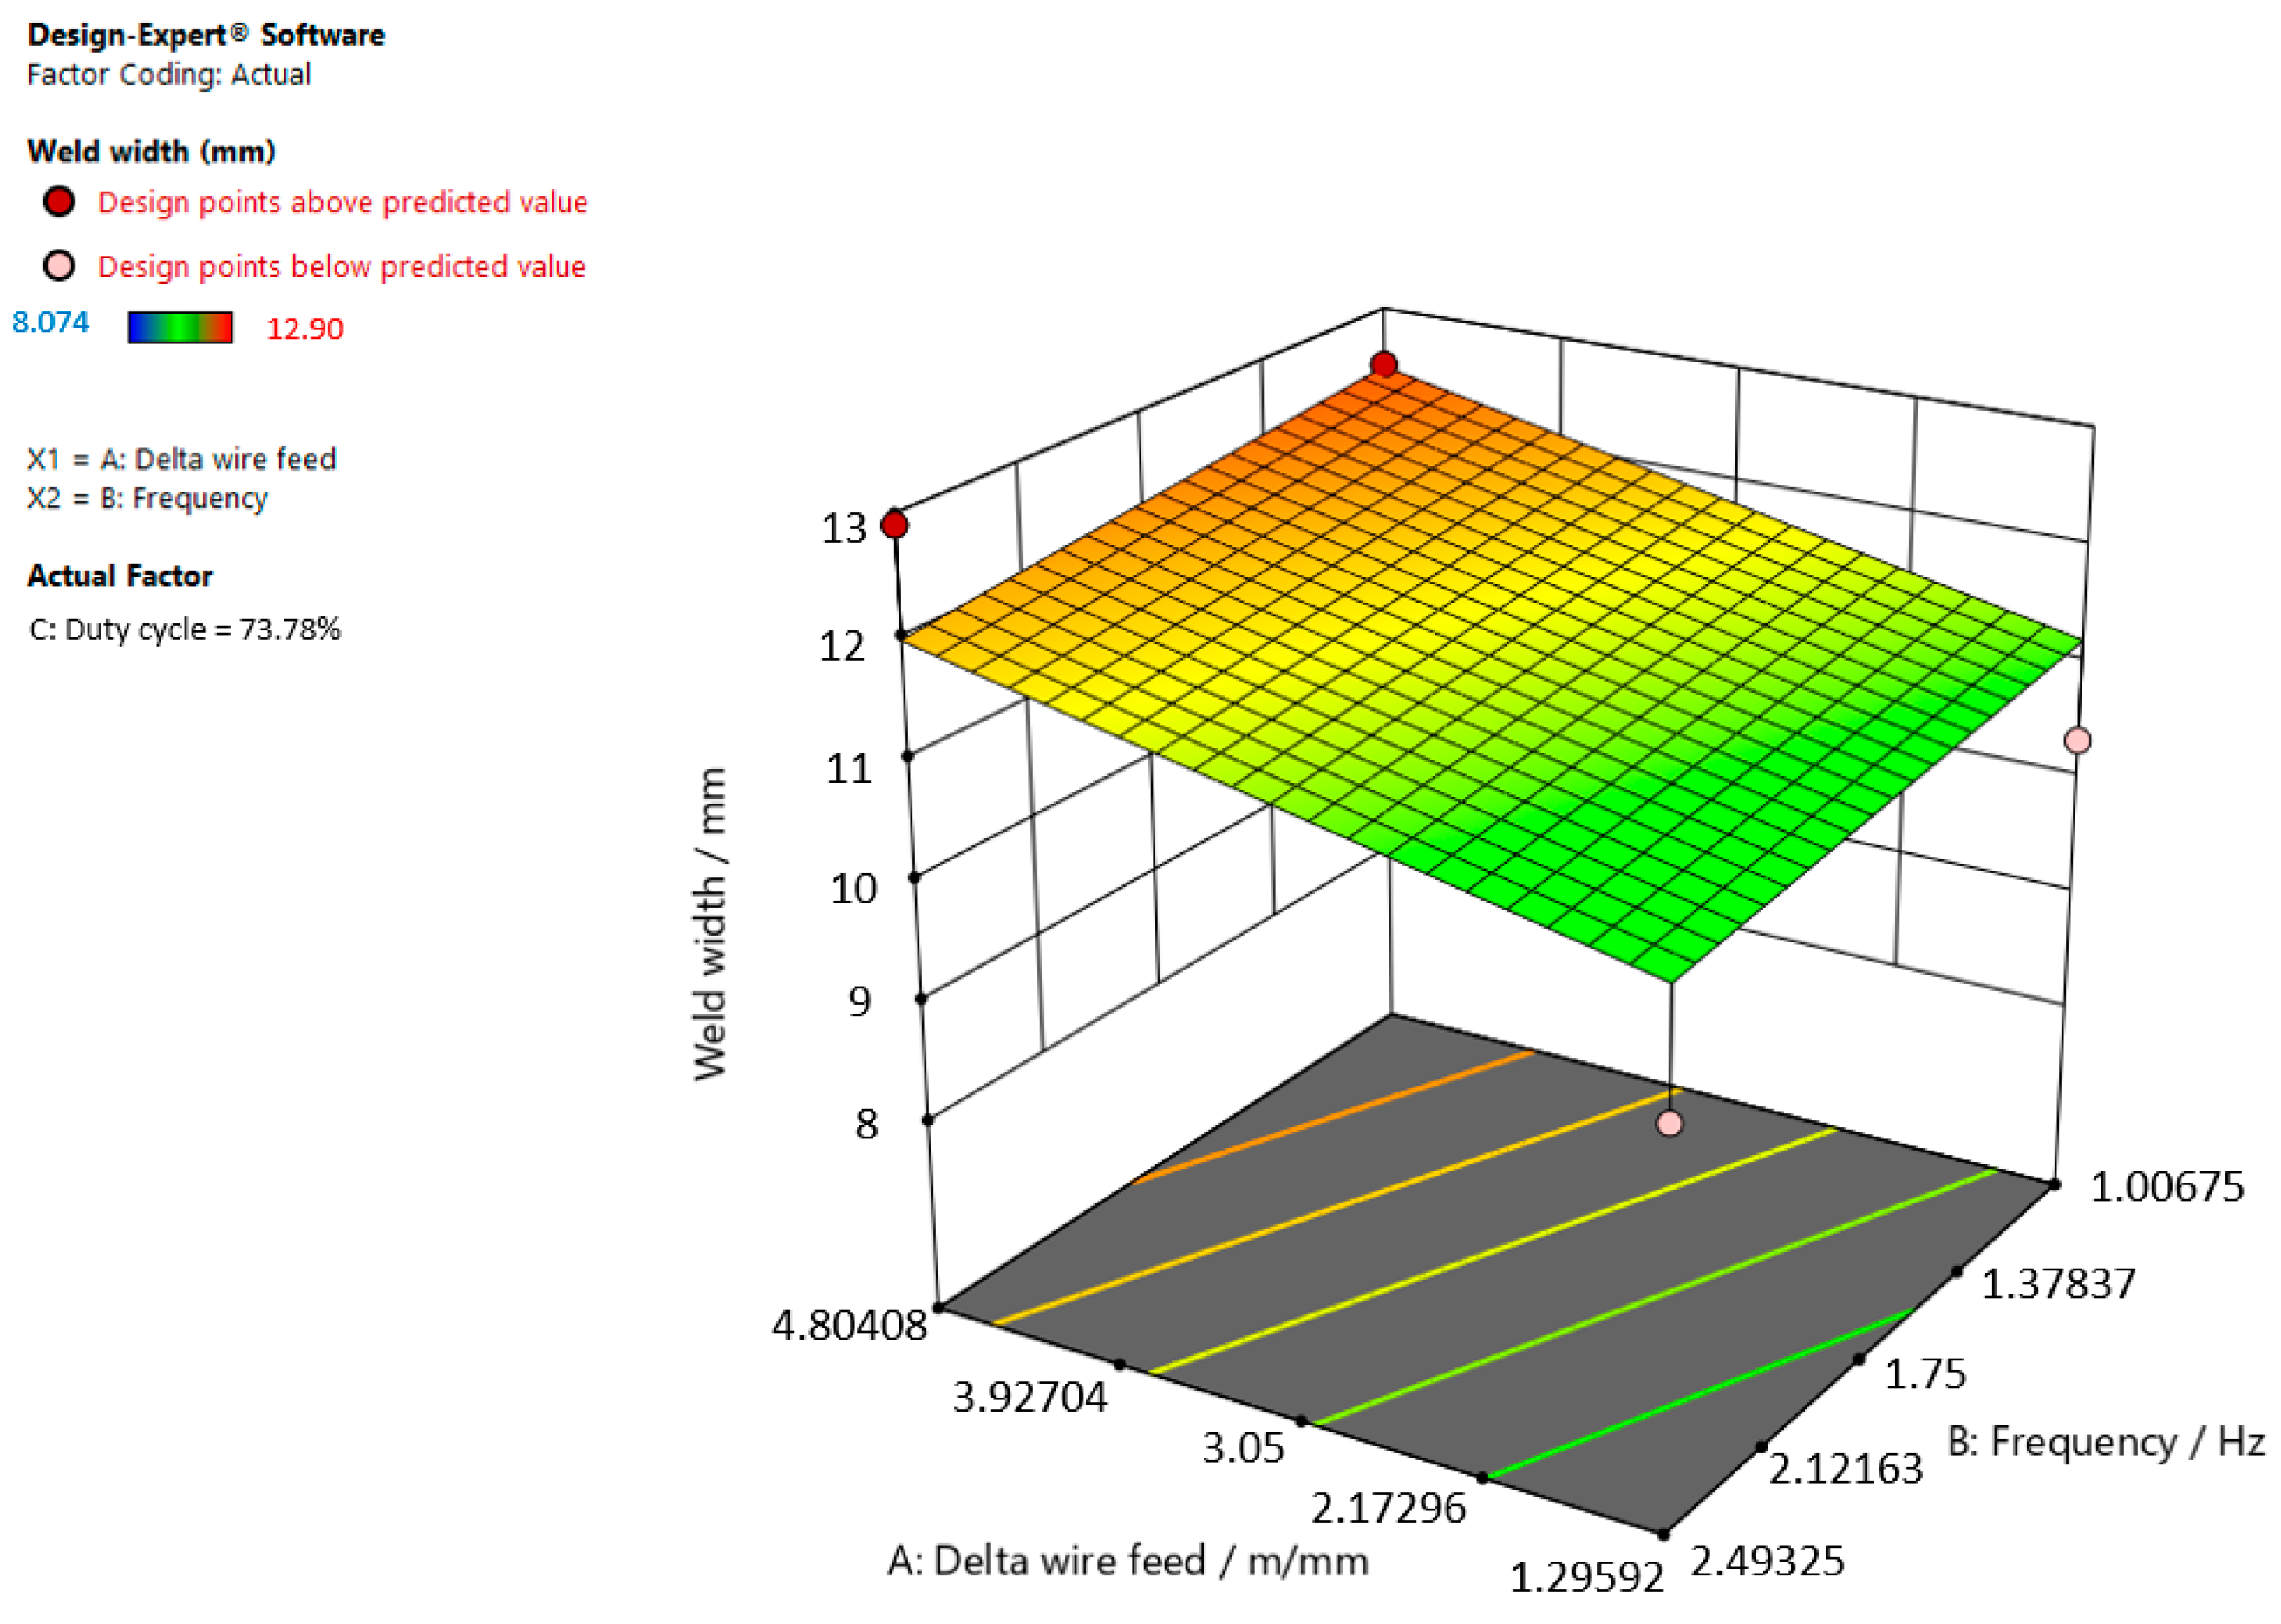
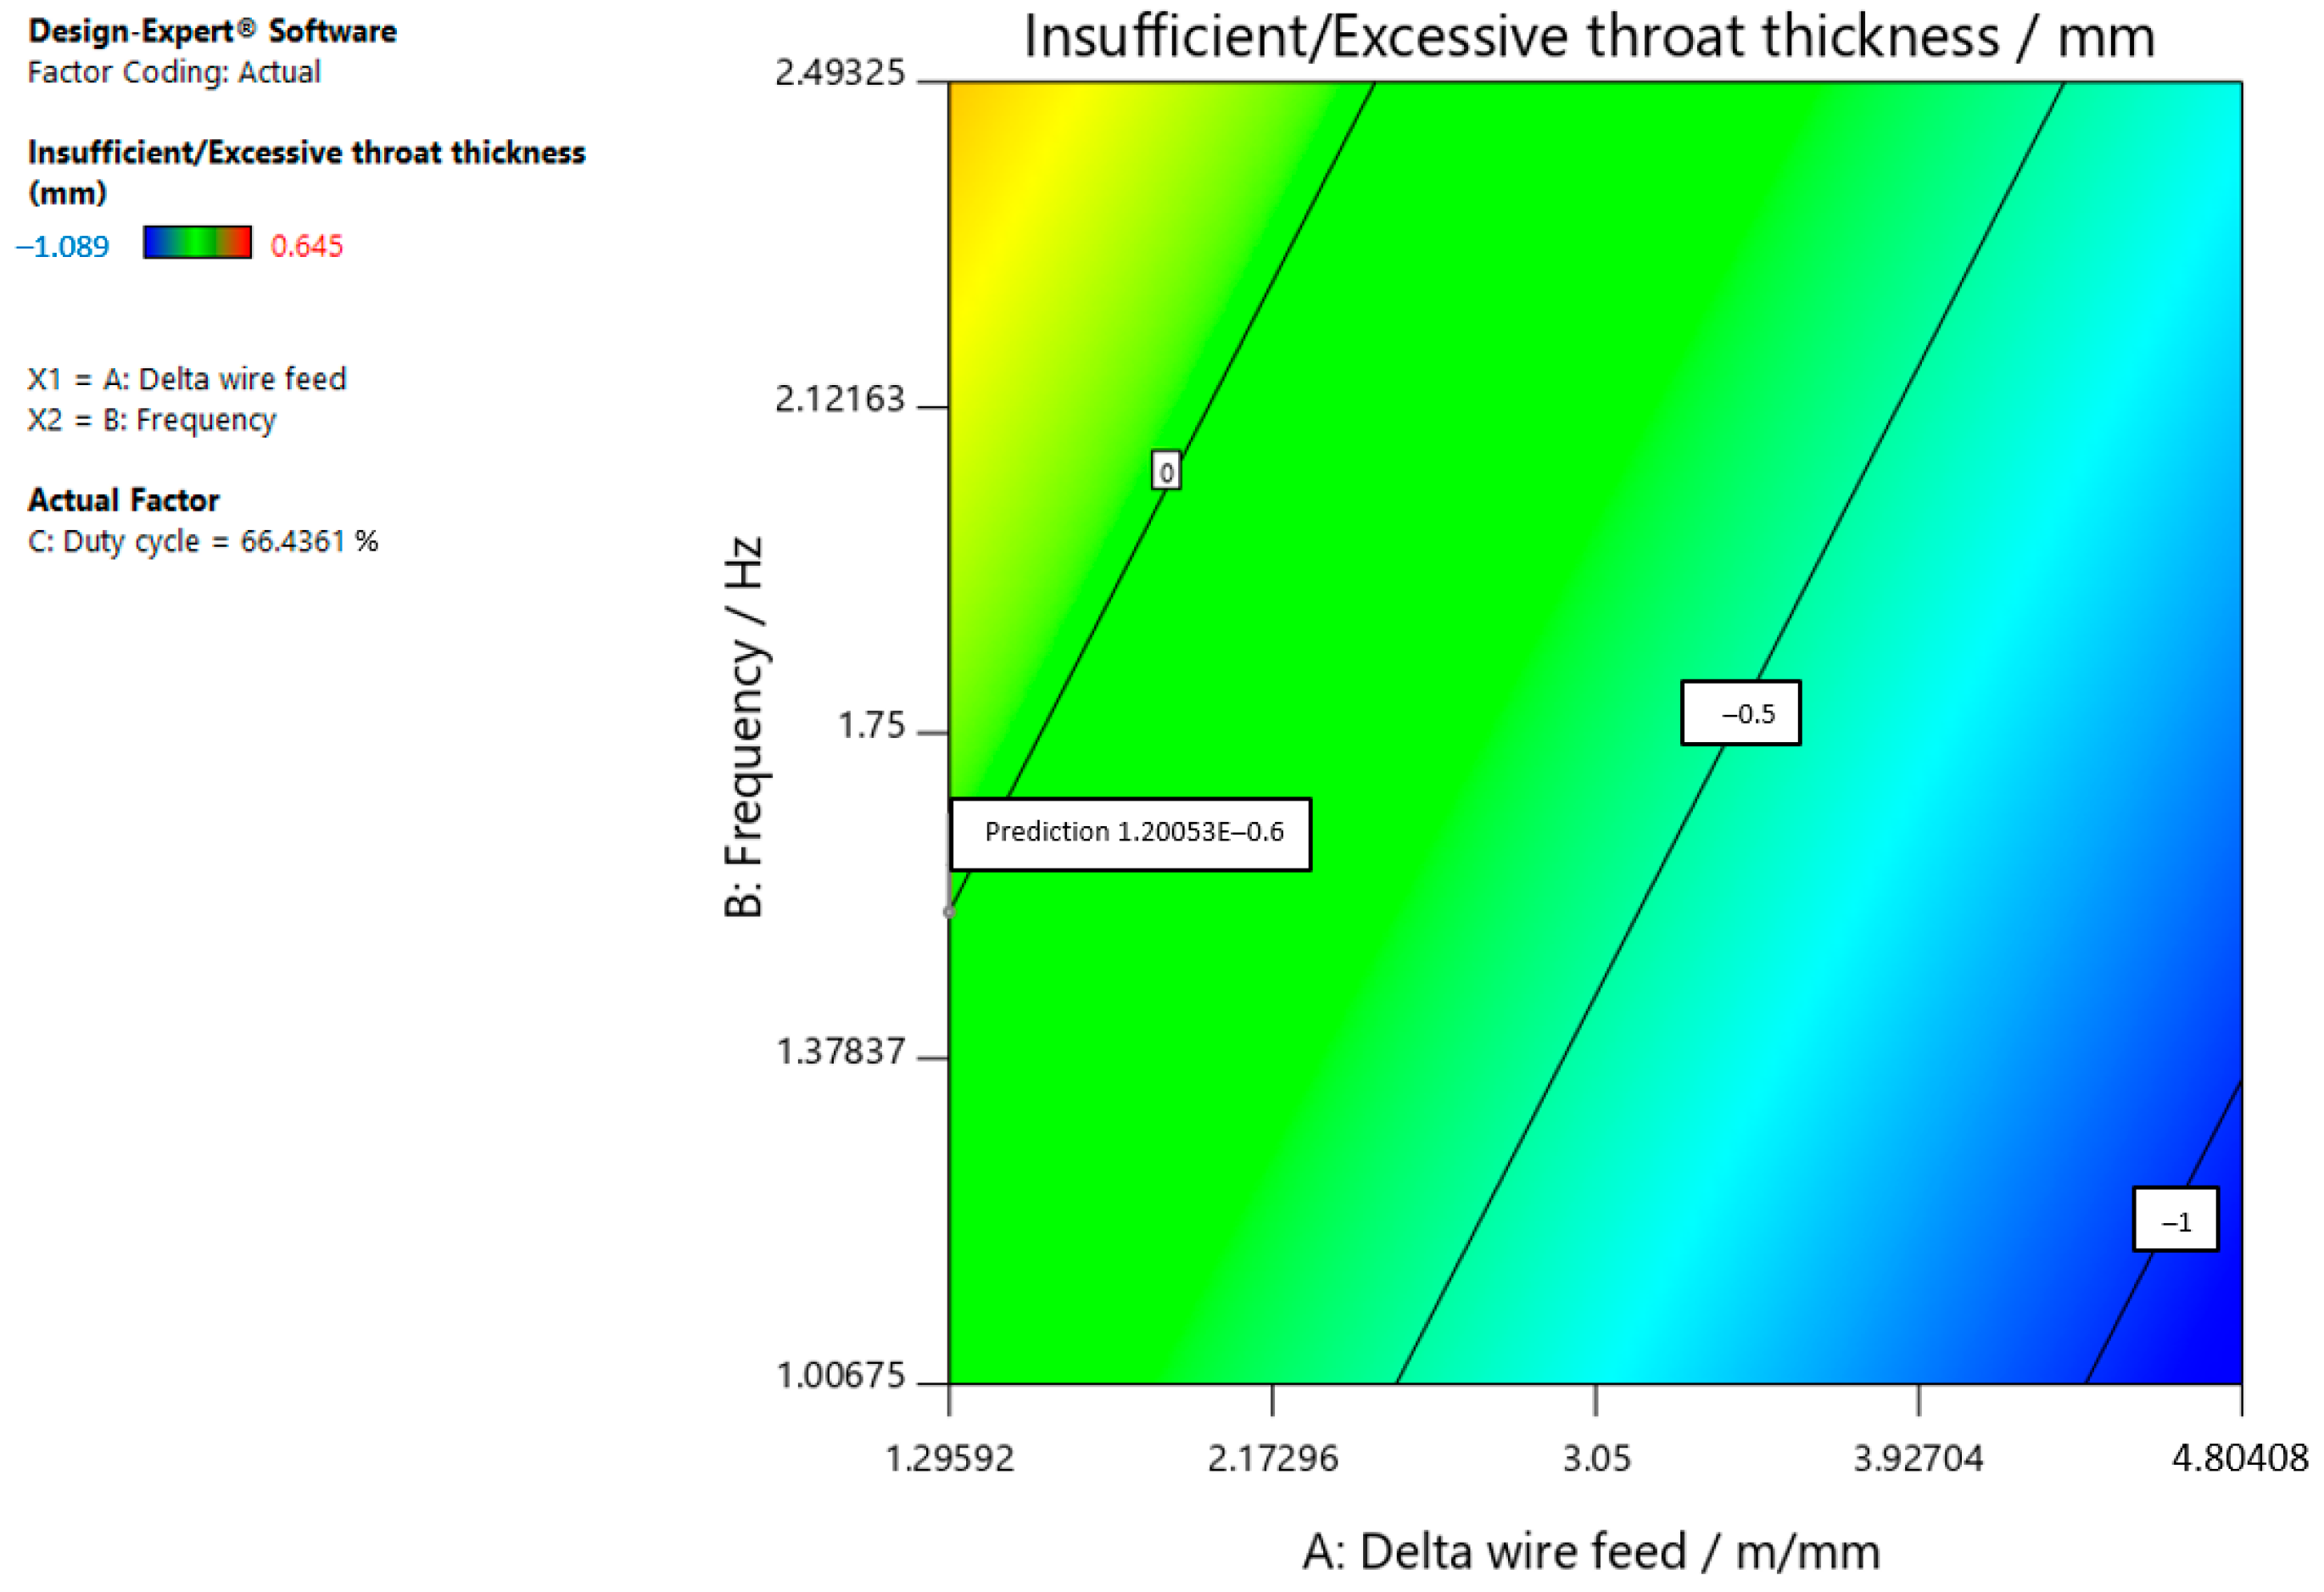
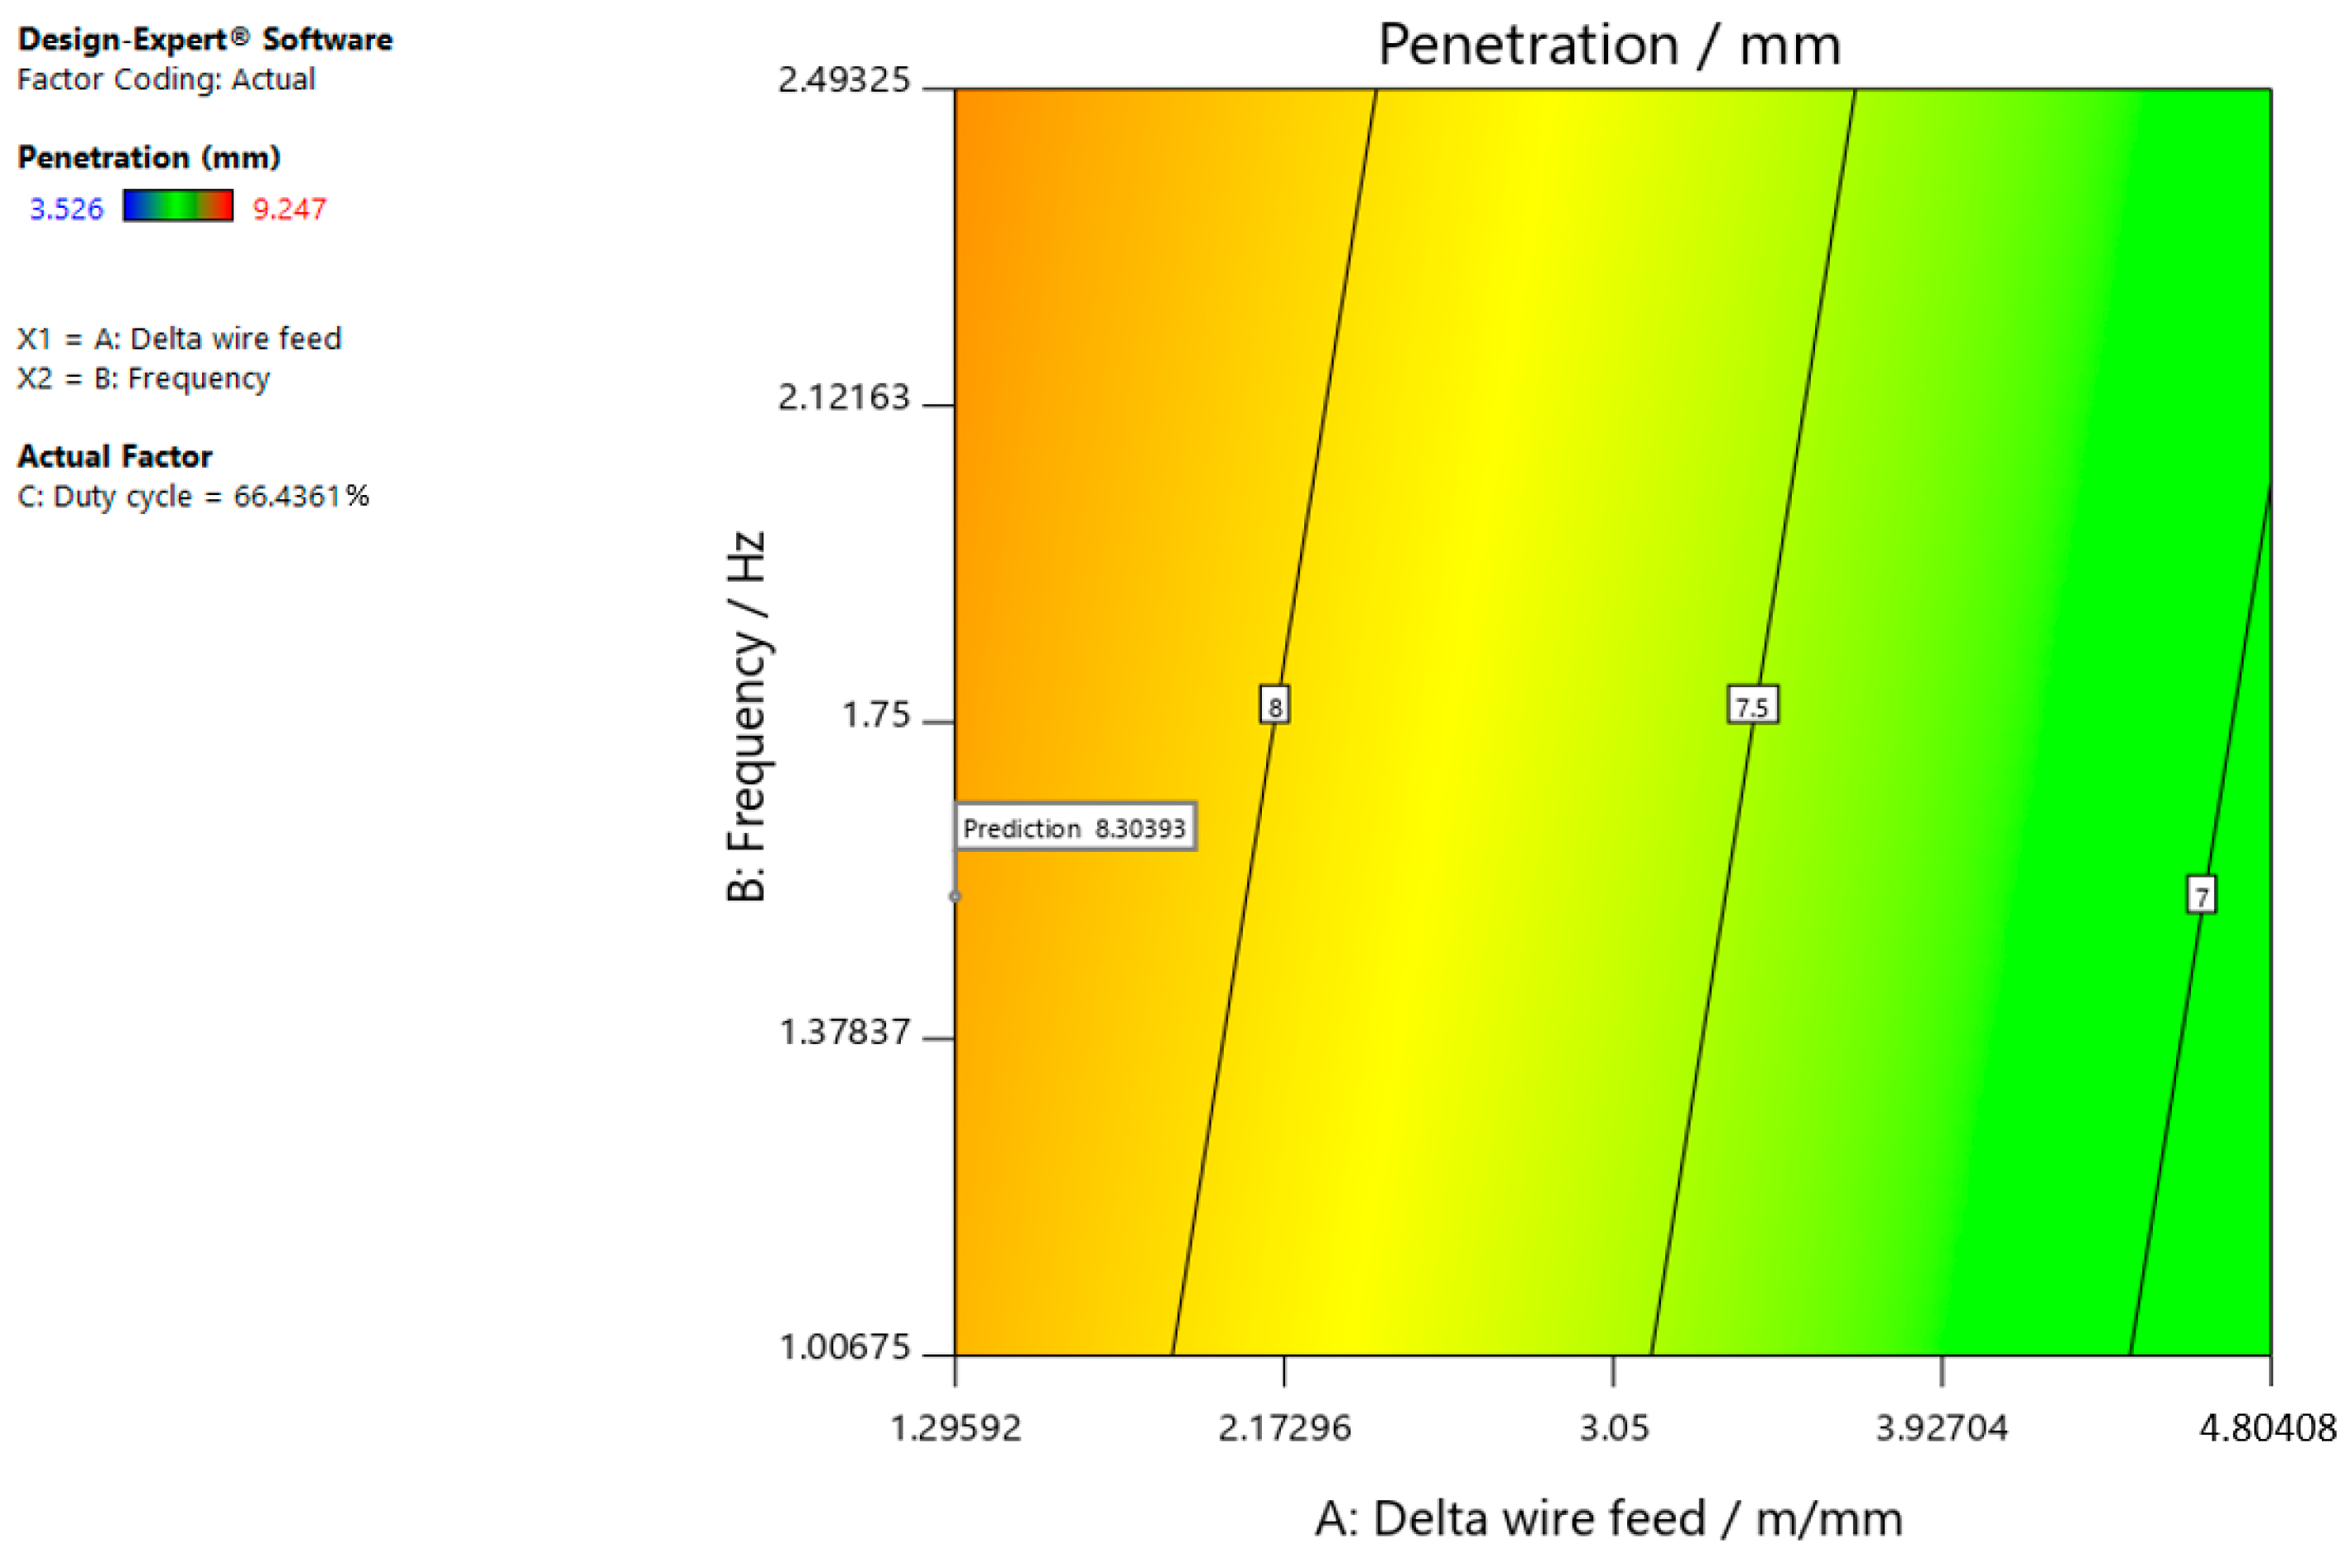
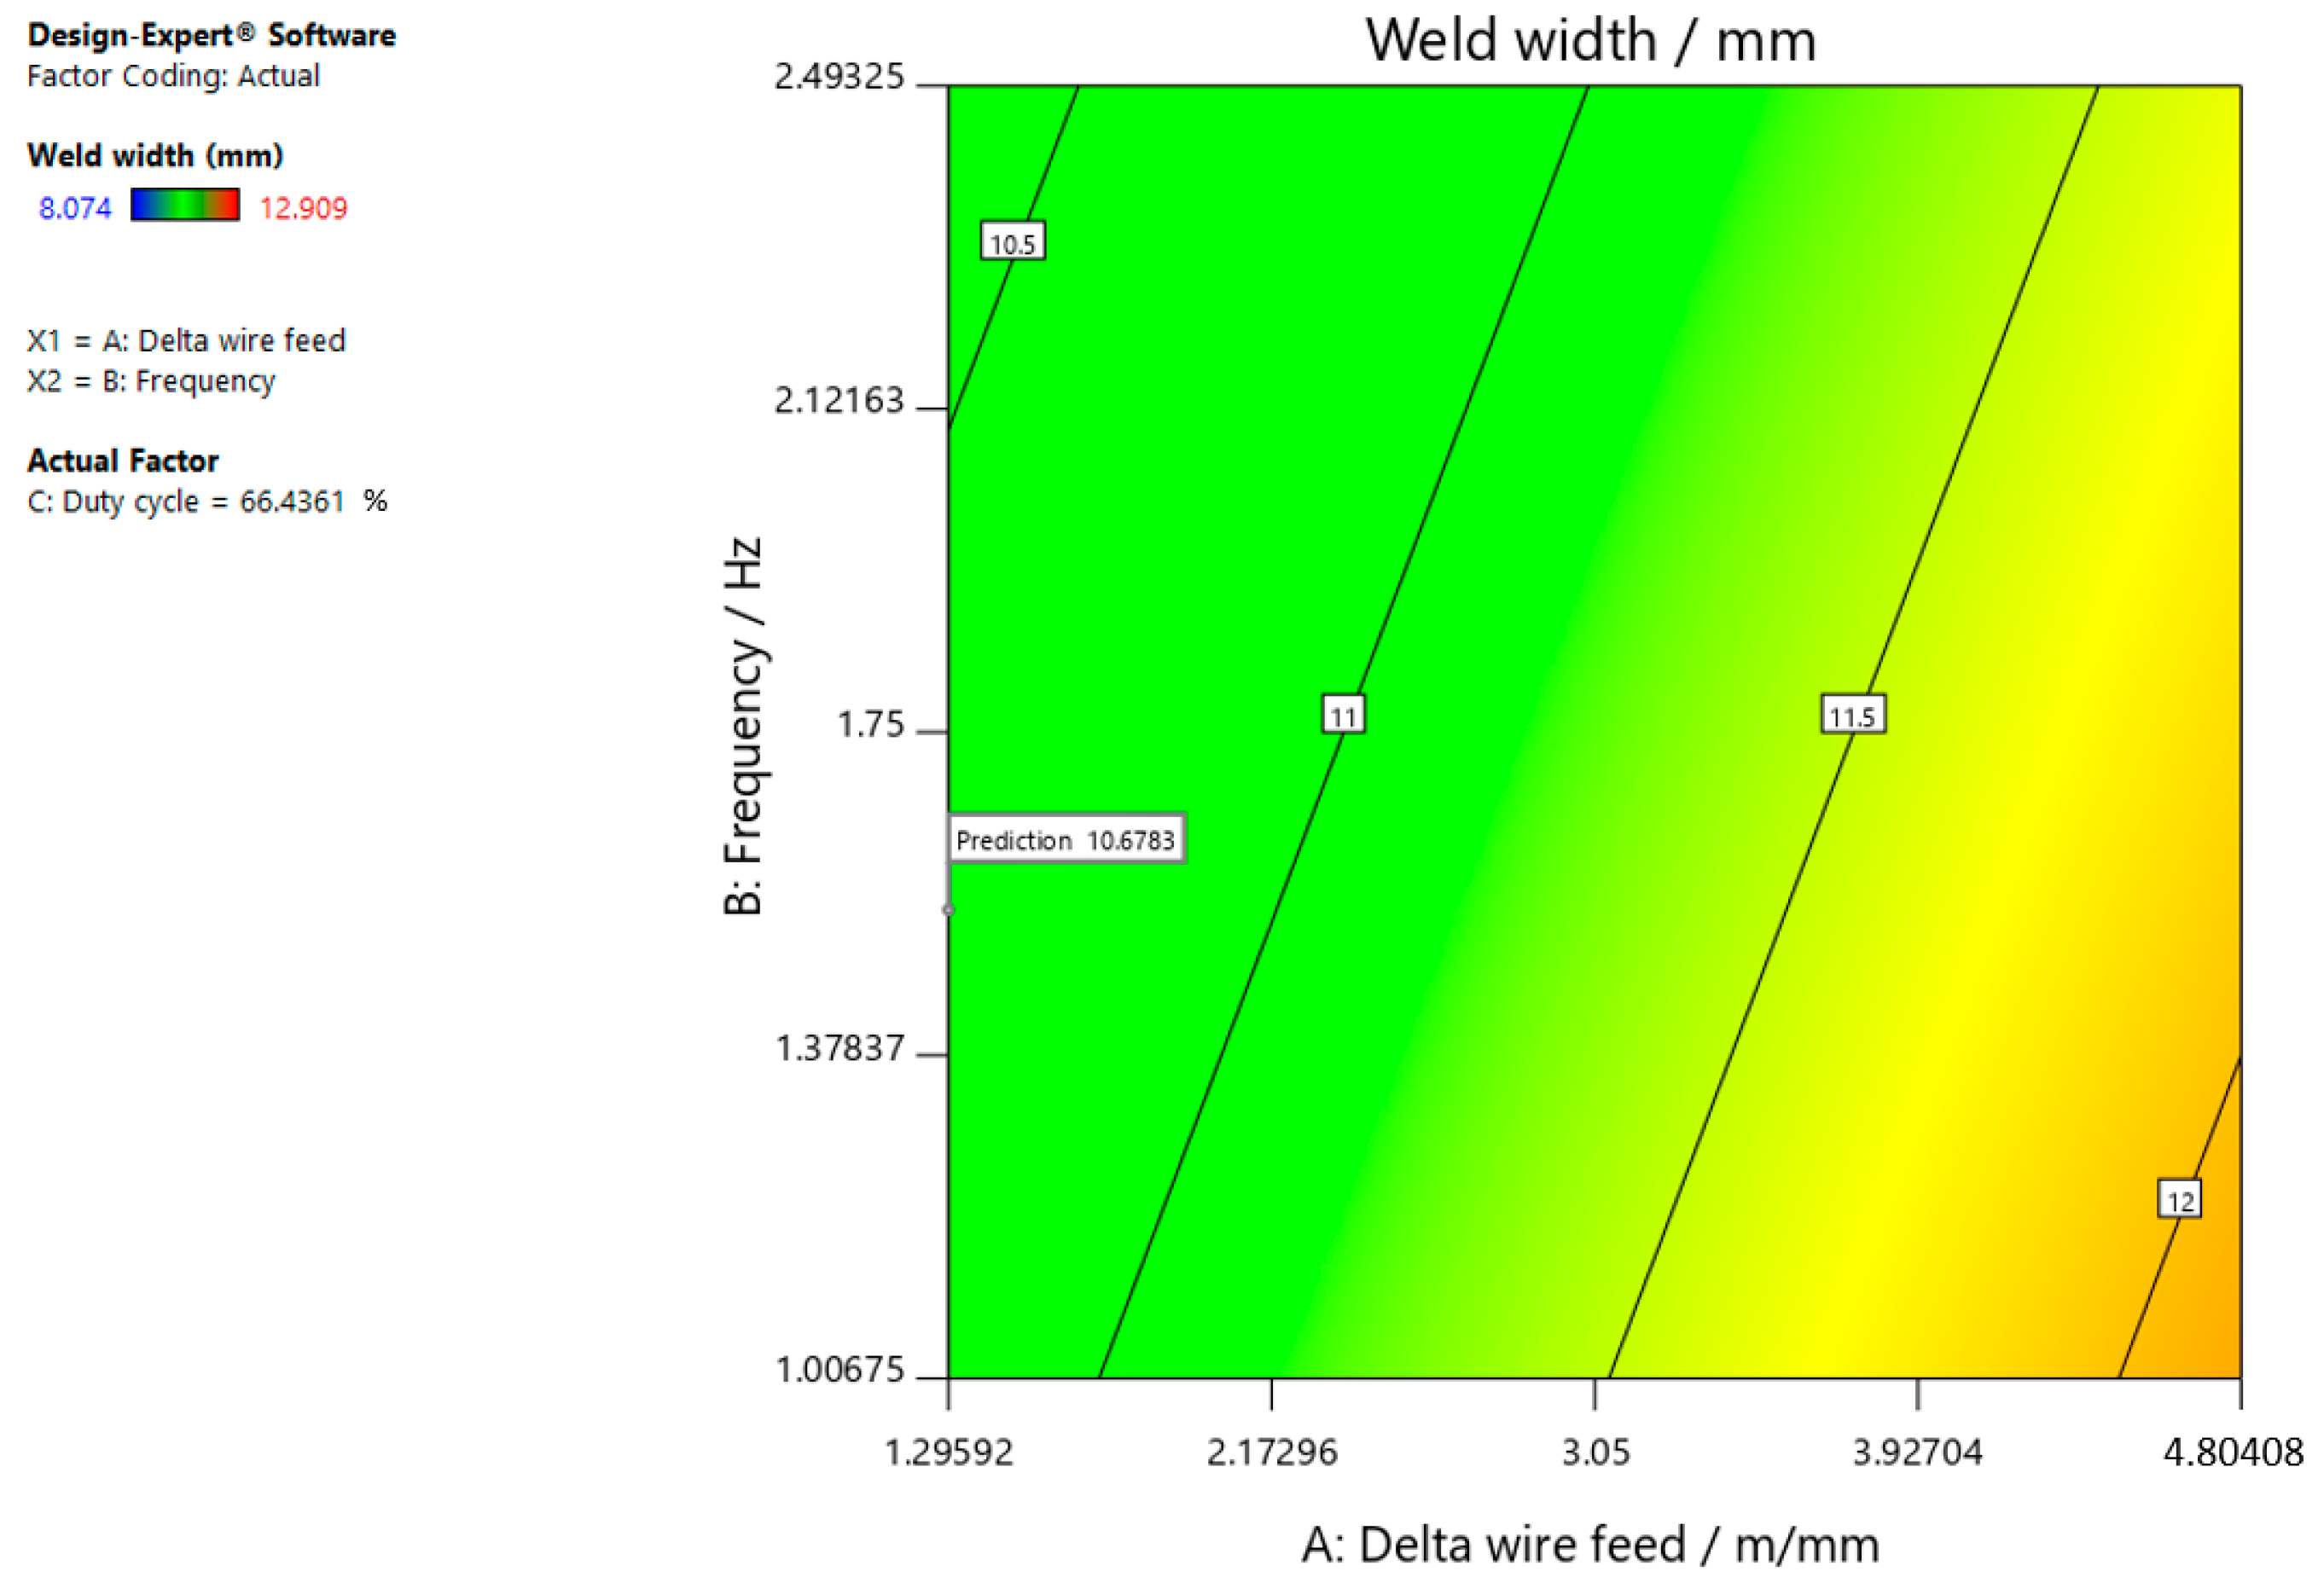
The research objective was to test the influence of the input parameters of the frequency, duty cycle, and change in the welding wire feed rate on the output variables of the insufficient/excessive throat thickness, weld penetration, and weld width to determine the optimal parameters for the welding of steel. The experiment was performed by welding samples of AlMg4.5Mn0.7 aluminum alloy, also known as AW 5083, with argon as the shielding gas. Analysis of the experimental results obtained by testing the output variables showed that sample No. 11 achieved the lowest value of insufficient/excessive throat thickness, with a convexity of 1.089 mm. The highest insufficient/excessive throat thickness of 0.645 mm was measured on the welded joint of sample No. 13. The lowest value of the output variable of weld penetration was on sample No. 4, which was 3.526 mm. In contrast, the highest value of weld penetration was on sample No. 14, which was 9.247 mm. The third observed output variable of weld width achieved the lowest value on sample No. 13 (8.074 mm) and the highest value on sample No. 8 (12.909 mm). It can be concluded that sample No. 13 had the highest value of reinforcement but also the lowest value for the weld width. The values of other outputs for each sample are given in Table 12.
An analysis of the experimental results proved that the AW 5083 aluminum alloy exhibited optimal welding parameters with samples No. 15–18, which was also clearly visible upon a visual inspection of the samples. This paper has elaborated mathematical models to confirm that they can serve as a good basis for prediction and analysis of the influence that input parameters have on the analyzed output variables. Moreover, the mathematical models created can be used for simultaneous optimization of different output variables, i.e., of the response, to ensure better and easier welding process control.

Author Contributions

Conceptualization, L.M. and D.M.; methodology, T.Š.; software, D.M.; validation, L.M. and T.Š.; formal analysis, L.M.; investigation, T.Š.; resources, I.S.; data curation, I.S.; writing—original draft preparation, T.Š. and D.M.; writing—review and editing, D.M.; visualization, L.M.; supervision, I.S.; project administration, I.S. All authors contributed to the critical literature review. All authors contributed to writing and revising the manuscript. All authors have read and agreed to the published version of the manuscript.

Funding

This research received no external funding.

Institutional Review Board Statement

Not applicable.

Informed Consent Statement

Not applicable.

Data Availability Statement

The data presented in this study are available from the corresponding author, upon reasonable request.

Conflicts of Interest

The authors declare no conflict of interest.

References

  1. Gene, M. The Welding of Aluminum and Its Alloys; Woodhead Publishing Limited: Cambridge, UK, 2002. [Google Scholar]
  2. Michaela, L.; Jozef, B.; Milan, M.; Filip, Š.; Michela, K.; Ivan, S.; Dejan, M. The Influence of Surface Roughness on Laser Beam Welding of Aluminum Alloys. Teh. Vjesn. 2021, 28, 934–938. [Google Scholar] [CrossRef]
  3. Wang, Q.T.; Wang, X.N.; Chen, X.M.; Huan, P.C.; Dong, Q.P.; Zhang, Q.Y.; Nagaumi, H. Interactive effects of porosity and microstructure on strength of 6063 aluminum alloy CMT MIX + Synchropulse welded joint. Trans. Nonferrous Met. Soc. China 2022, 32, 801–811. [Google Scholar] [CrossRef]
  4. Subramani, P.; Arivazhagan, N.; Kumaran, S.S.; Simone, M.; Manikandan, M. Influence of hot corrosion on pulsed current gas tungsten arc weldment of aerospace-grade 80A alloy exposed to high temperature aggressive environment. International Journal of Thermofluids 2022, 14, 100148. [Google Scholar] [CrossRef]
  5. Jie, Y.I.; Cao, S.F.; Li, L.X.; Guo, P.C.; Liu, K.Y. Effect of welding current on morphology and microstructure of Al alloy T-joint in double-pulsed MIG welding. Trans. Nonferrous Met. Soc. China 2015, 25, 3204–3211. [Google Scholar]
  6. Sachindra, D.; Jani, D.B.; Gohil, A.V.; Patel, C.M. Progress in the arc plasma temperature measurement and its finite element analysis in pulsed MIG welding process. Mater. Today Proc. 2021, 38, 2745–2750. [Google Scholar]
  7. Nguyen, H.H.; David, M.; Magnus, L. Testing and modelling of butt-welded connections in thin-walled aluminium structures. Thin-Walled Struct. 2020, 171, 108681. [Google Scholar]
  8. Rajesh, P.V.; Pandey, K.N. Multi-response optimization of process parameters of GMA welding of dissimilar AA 6061-T6 and AA 5083-O aluminium alloy for optimal mechanical properties. Mater. Today Proc. 2021, 46, 10204–10210. [Google Scholar]
  9. Wen, Z.; Huanhuan, L.; Qing, W. Simulation of residual stress in aluminum alloy welding seam based on computer numerical simulation. Optik 2022, 258, 168785. [Google Scholar]
  10. Fiona, F.C.; Junting, X.; David, G.T. Anthony, BM. Model-based parameter optimization for arc welding process simulation. Appl. Math. Model. 2020, 81, 386–400. [Google Scholar]
  11. David, H.P. Welding Engineering: An Introduction; Wiley: Hoboken, NJ, USA, 2016. [Google Scholar]
  12. Gojić, M. Tehnike Spajanja I Razdvajanja Materijala; Metalurški Fakultet: Sisak, Croatia, 2008. [Google Scholar]
  13. Murugan, N.; Parmar, R.S.; Sud, S.K. Effect of submerged arc process parameters on dilution and bead geometry in single wire surfacing. J. Mater. Processing Technol. 1993, 37, 767–780. [Google Scholar] [CrossRef]
  14. Jianxiong, L.; Huan, L.; Huiliang, W.; Yanbing, N. Effect of pulse on pulse frequency on welding process and welding quality of pulse on pulse MIG welding-brazing of aluminum alloys to stainless steel. Int. J. Adv. Manuf. Technol. 2016, 87, 51–63. [Google Scholar] [CrossRef]
  15. Arunkumar, S.; Sathiya, P. Multi-Response Optimization of Process Parameters for MIG Welding of AA2219-T87 by Taguchi Grey Relational Analysis. Mater. Today: Proc. 2017, 4, 8892–8900. [Google Scholar]
  16. Devashish, V.; Akshat, S.; Ayush, V.; Pradeep, K. Mathematical Modelling to predict dilution in MIG welded aluminium 8011 plates. Mater. Today Proc. 2022. [Google Scholar] [CrossRef]
  17. Keshav, D.; Pranav, M.; Pradeep, K. Mathematical modelling to predict angular distortion in MIG welding of aluminium 6063 plates. Mater. Today Proc. 2022. [Google Scholar] [CrossRef]
  18. Akshat, S.; Ayush, V.; Devashish, V.; Pradeep, K. Prediction of bead geometry parameters in MIG welded aluminium alloy 8011 plates. Mater. Today Proc. 2022. [Google Scholar] [CrossRef]
  19. Jianing, W.; Xin, C.; Lifei, Y.; Guanchen, Z. Effect of preheat & post-weld heat treatment on the microstructure and mechanical properties of 6061-T6 aluminum alloy welded sheets. Mater. Sci. Eng. A 2022, 841, 143081. [Google Scholar]
  20. Bhanu, P.B.; Sneha, R.; Pradeep, K. Mathematical Modelling to Predict Angular Distortion in Butt-welded Aluminium 1200 Plates. Mater. Today Proc. 2022, 56, 799–804. [Google Scholar] [CrossRef]
  21. Deekshant, V.; Kaushal, K. Application and use of different aluminium alloys with respect to workability, strength and welding parameter optimization. Ain Shams Eng. J. 2021, 12, 1143–1152. [Google Scholar]
  22. Qin, J.; Li, Z.; Ma, M.-Y.; Yi, D.-Q.; Wang, B. Diversity of intergranular corrosion and stress corrosion cracking for 5083 Al alloy with different grain sizes. Trans. Nonferrous Met. Soc. China 2022, 32, 765–777. [Google Scholar] [CrossRef]
  23. Hakan, G.; Şaban, B.; Onur, G. Casting of AA 7075 Aluminum Alloy into Gravity Die and Effect of the Die Preheating Temperature on Microstructure and Mechanical Properties. Teh. Vjesn. 2021, 28, 948–955. [Google Scholar] [CrossRef]
  24. Jae-Hong, K.; Deok-Sang, J.; Byung-Min, K. Hardness prediction of weldment in friction stir welding of AA6061 based on numerical approach. Procedia Eng. 2017, 207, 586–590. [Google Scholar] [CrossRef]
  25. Kumar, A.; Sundarrajan, S. Effect of welding parameters on mechanical properties and optimization of pulsed TIG welding of Al-Mg-Si alloy. Int. J. Adv. Manuf. Technol. 2009, 42, 118–125. [Google Scholar] [CrossRef]
  26. Dariusz, B.; Andrzej, S.; Paweł, M.; Dominka, P. Modeling and analysis of thin-walled Al/steel explosion welded transition joints for shipbuilding applications. Mar. Struct. 2020, 74, 102843. [Google Scholar] [CrossRef]
  27. Marko, H.; Dejan, M.; Miroslav, D.; Ivan, S. Primjena centralno kompozitnih planova pokusa pri optimiranju procesa zavarivanja. Eng. Technol. Manuf. Welded Constr. Prod. SBW 2019, 295–304. [Google Scholar]
  28. Xu, W.H.; Lin, S.B.; Fan, C.L. Prediction and optimization of weld bead geometry in oscillating arc narrow gap all-position GMA welding. Int. J. Adv. Manuf. Technol. 2015, 79, 183–196. [Google Scholar] [CrossRef]
  29. Ghosal, S.; Chaki, S. Estimation and optimization of depth of penetration in hybrid CO2 LASER-MIG welding using ANN-optimization hybrid model. Int. J. Adv. Manuf. Technol. 2010, 47, 1149–1157. [Google Scholar] [CrossRef]
  30. Elangovan, S.; Anand, K.; Prakasan, K. Parametric optimization of ultrasonic metal welding using response surface methodology and genetic algorithm. Int. J. Adv. Manuf. Technol. 2012, 63, 561–572. [Google Scholar] [CrossRef]
  31. Atul, K.S.; Nitin, K.S.; Anoop, K.S.; Mridul, S.R.; Harendra, K.N. Modeling the predictive values of ultimate tensile strength in welded joint by response surface methodology. Mater. Proc. 2021, 44 Pt 2, 3110–3114. [Google Scholar] [CrossRef]
Figure 1. Graphic representation of metal transfer in the pulse current [11].
Materials 15 03078 g001
Figure 2. Sample made by welding with the synchropulse welding process: (a) Welded joint of the sample No. 17, (b) macro sample No. 17, (c) cross section of welded joint used for measuring the output variables, (d) measuring output variables on thin sections; a—weld width (mm); z—insufficient/excessive throat thickness (mm); p—penetration (mm).
Materials 15 03078 g002
Figure 3. Response surface for the regression model of insufficient/excessive throat thickness at a duty cycle of 26.216%.
Materials 15 03078 g003
Figure 4. Response surface for the regression model of insufficient/excessive throat thickness at a duty cycle of 50.00%.
Materials 15 03078 g004
Figure 5. Response surface for the regression model of insufficient/excessive throat thickness at a duty cycle of 73.78%.
Materials 15 03078 g005
Figure 6. Response surface for the regression model of weld penetration at a duty cycle of 26.216%.
Materials 15 03078 g006
Figure 7. Response surface for the regression model of weld penetration at a duty cycle of 50.00%.
Materials 15 03078 g007
Figure 8. Response surface for the regression model of weld penetration at a duty cycle of 73.78%.
Materials 15 03078 g008
Figure 9. Response surface for the regression model of weld width at a duty cycle of 26.216%.
Materials 15 03078 g009
Figure 10. Response surface for the regression model of weld width at a duty cycle of 50.00%.
Materials 15 03078 g010
Figure 11. Response surface for the regression model of weld width at a duty cycle of 73.78%.
Materials 15 03078 g011
Figure 12. Optimal parameters for achieving the insufficient/excessive throat thickness with a target value of 0.
Materials 15 03078 g012
Figure 13. Optimal parameters for achieving as much penetration as possible.
Materials 15 03078 g013
Figure 14. Optimal parameters for achieving the weld width with a target value of 10.
Materials 15 03078 g014
Table 1. Chemical composition of AlMg4.5Mn0.7 alloy.
Chemical ElementContent/%
Mn0.40–1.00
Fe0.40 max
Cu0.10 max
Mg4.00–4.90
Si0.0–0.40
Zn0.0–0.10
Cr0.05–0.25
Ti0.05–0.25
Other alloy elements0.0–0.15
AlBalanced
Table 2. Mechanical properties of AlMg4.5Mn0.7 alloy.
Mechanical PropertyValue
Proof strength Rp0.2 (Mpa)110
Tensile strength Rm (Mpa)270
Elongation A (%)12
Elongation A50 (%)10
Brinell hardness (HB)75
Table 3. Physical properties of AlMg4.5Mn0.7 alloy.
Physical PropertyValue
Density (g/cm3)265
Melting point (°C)570
Thermal dilatation (1/K)25 × 10−6
Modulus of elasticity (E/Gpa)72
Thermal conductivity (W/mK)121
Electrical resistance (Ωm)0.058 × 10⁻⁶
Table 4. Coded values of the experiment design.
Coded ValuesFactor 1—Delta Wire Feed (m/min)Factor 2—Frequency (Hz)Factor 3—Duty Cycle (%)
−1.681790.10.510
−11.295921.0067526.2159
03.051.7550
14.804082.4932573.7841
1.681796390
Table 5. Overview of values referring to input variables as determined by Design Expert software (Minneapolis, MN, USA).
Ordinal Number of the RunSample NumberParameter 1Parameter 2Parameter 3
A: Delta Wire Feed (m/min)B: Frequency (Hz)C: Duty Cycle (%)
311.295922.4932526.2159
1223.05350
634.804081.0067573.7841
244.804081.0067526.2159
1353.051.7510
1163.050.550
1673.051.7550
884.804082.4932573.7841
1893.051.7550
101061.7550
14113.051.7590
17123.051.7550
4134.804082.4932526.2159
7141.295922.4932573.7841
9150.11.7550
15163.051.7550
1171.295921.0067526.2159
5181.295921.0067573.7841
Table 6. Obtained output values.
Sample NumberParameter 1Parameter 2Parameter 3Output 1Output 2Output 3
A: Delta Wire Feed (m/min)B: Frequency (Hz)C: Duty Cycle (%)Insufficient/Excessive Throat Thickness (mm)Penetration (mm)Weld Width (mm)
161.7550−0.9435.49210.957
23.051.7550−0.2586.18810.113
34.804081.0067526.2159−0.7534.78610.443
43.050.550−1.0896.17611.341
54.804082.4932573.7841−0.9578.12612.909
61.295921.0067573.78410.3477.79110.350
74.804082.4932526.2159−0.2443.5268.386
83.051.7550−0.1768.22410.839
91.295922.4932526.21590.5156.8289.324
103.051.7550−0.3726.8219.738
113.051.75100.6455.3018.074
124.804081.0067573.7841−0.827.26712.497
133.053500.4096.65610.762
143.051.7590−0.8739.24712.809
151.295921.0067526.21590.2186.8939.288
161.295922.4932573.78410.4698.9069.655
170.11.75500.2947.0789.151
183.051.7550−0.6937.12411.282
Table 7. Characteristic values of output variables for selected models.
Output VariableThe Lowest ValueThe Highest ValueMean ValueStandard DeviationModel
Insufficient/Excessive throat thickness (mm)−1.0890.645−0.23780.5977Linear
Penetration (mm)3.5269.2476.801.44Linear
Weld width (mm)8.07412.90910.441.40Linear
Table 8. Simulation of four models in the design expert insufficient/excessive throat thickness.
ModelMean Squared Deviation (p-Value)Lack of Fit (p-Value)Adjusted Coefficient of DeterminationPredicted Coefficient of Determination
Linear0.00020.25930.70110.5675
2FI0.69340.21240.66480.1350
Quadratic0.76460.14740.5977−0.2975
Cubic0.07000.49100.8699−0.1901
Table 9. Analysis of variance for the regression model–insufficient/excessive throat thickness.
Source of VarianceSum of SquaresDegrees of FreedomMean Squared DeviationF Valuep-Value
Model4.5831.5314.290.0002
A—Delta wire feed (m/min)3.0013.0028.120.0001
B—Frequency (Hz)0.802410.80247.520.0159
C—Duty cycle (%)0.773410.77347.240.0175
Residual1.49140.1068
Lack of fit1.34110.12182.370.2593
Pure error0.154430.0515
Total6.0717
Table 10. Simulation of the four models in Design Expert penetration.
ModelMean Squared Deviation (p-Value)Lack of Fit (p-Value)Adjusted Coefficient of DeterminationPredicted Coefficient of Determination
Linear<0.00010.68870.71940.6187
2FI0.07030.87710.80700.7636
Quadratic0.29280.95260.82910.7446
Cubic0.88590.79800.73020.5346
Table 11. Analysis of variance for the regression model–weld penetration.
Source of VarianceSum of SquaresDegrees of FreedomMean Squared DeviationF Valuep-Value
Model27.0039.0015.53<0.0001
A—Delta wire feed (m/min)6.4416.4411.110.0049
B—Frequency (Hz)0.155310.15530.26790.6128
C—Duty cycle (%)20.40120.4035.20<0.0001
Residual8.12140.5797
Lack of fit5.94110.54030.74580.6887
Pure error2.1730.7244
Total35.1217
Table 12. Simulation of four models in the design expert weld width.
ModelMean Squared Deviation (p-Value)Lack of Fit (p-Value)Adjusted Coefficient of DeterminationPredicted Coefficient of Determination
Linear0.00020.46490.69320.5564
2FI0.07060.64790.78880.4711
Quadratic0.53660.59450.77550.3917
Cubic0.40720.70830.80340.3768
Table 13. Analysis of variance for the regression model–weld width.
Source of VarianceSum of SquaresDegrees of FreedomMean Squared DeviationF Valuep-Value
Model24.8638.2913.810.0002
A—Delta wire feed (m/min)5.4915.499.140.0091
B—Frequency (Hz)0.786710.78671.310.2715
C—Duty cycle (%)18.59118.5930.97<0.0001
Residual8.40140.6003
Lack of fit6.95110.63161.300.4649
Pure error1.4630.4856
Total33.2717
Table 14. Defined limitations for optimization of parameters.
NameGoalLower LimitUpper LimitImportance
A: Delta wire feedis in range1.295924.804083
B: Frequencyis in range1.006752.493253
C: Duty cycleis in range26.215973.78413
Insufficient/Excessive throat thicknessis target = 0−1.0890.6451
Penetrationmaximize3.5269.2473
Weld widthis target = 108.07412.9092
Table 15. Solution for five combinations of input variables.
NumberDelta Wire FeedFrequencyDuty CycleInsufficient/Excessive Throat Thickness (mm)Penetration (mm)Weld Width (mm)
11.2961.54666.4360.0008.30410.678
21.2961.54066.2400.0008.29310.671
31.2961.55466.6920.0008.31810.688
41.2961.53366.0260.0008.28110.662
51.2961.55866.8170.0008.32510.693
61.2961.52765.8060.0008.26910.654
71.2961.56667.0930.0008.34110.704
81.2961.57467.3410.0008.35410.714
91.2961.51365.3610.0008.24410.636
101.2961.58067.5540.0008.36610.722
111.2961.50365.0420.0008.22610.624
121.2961.49564.7820.0008.21210.614
131.2991.50965.1590.0008.23210.629
141.3021.55266.4770.0008.30510.680
151.2961.61468.6650.0008.42810.766
161.2961.62368.9470.0008.44410.777
171.2961.61467.9620.0078.39210.731
181.2961.67370.5950.0008.53610.841
191.3321.54965.5560.0008.24510.647
201.2961.74272.8150.0008.66010.928
211.2961.31458.8710.0007.88210.382
221.2961.97173.7840.0658.74310.901
231.2961.24457.3740.0087.79510.331
241.2962.02472.2960.0978.67410.811
251.2962.02873.7800.0848.75110.883
261.2961.16153.8850.0007.60410.187
271.2961.87564.3400.1288.24310.469
281.2961.07851.2050.0007.45410.082
291.2961.05051.1960.0097.45010.091
301.2961.02849.5580.0007.36210.018
311.6702.25873.7840.0598.63710.944
Publisher’s Note: MDPI stays neutral with regard to jurisdictional claims in published maps and institutional affiliations.

