
Deep Cryogenic Treatment Characteristics of a Deformation-Processed Cu-Ni-Co-Si Alloy


Abstract
:1. Introduction
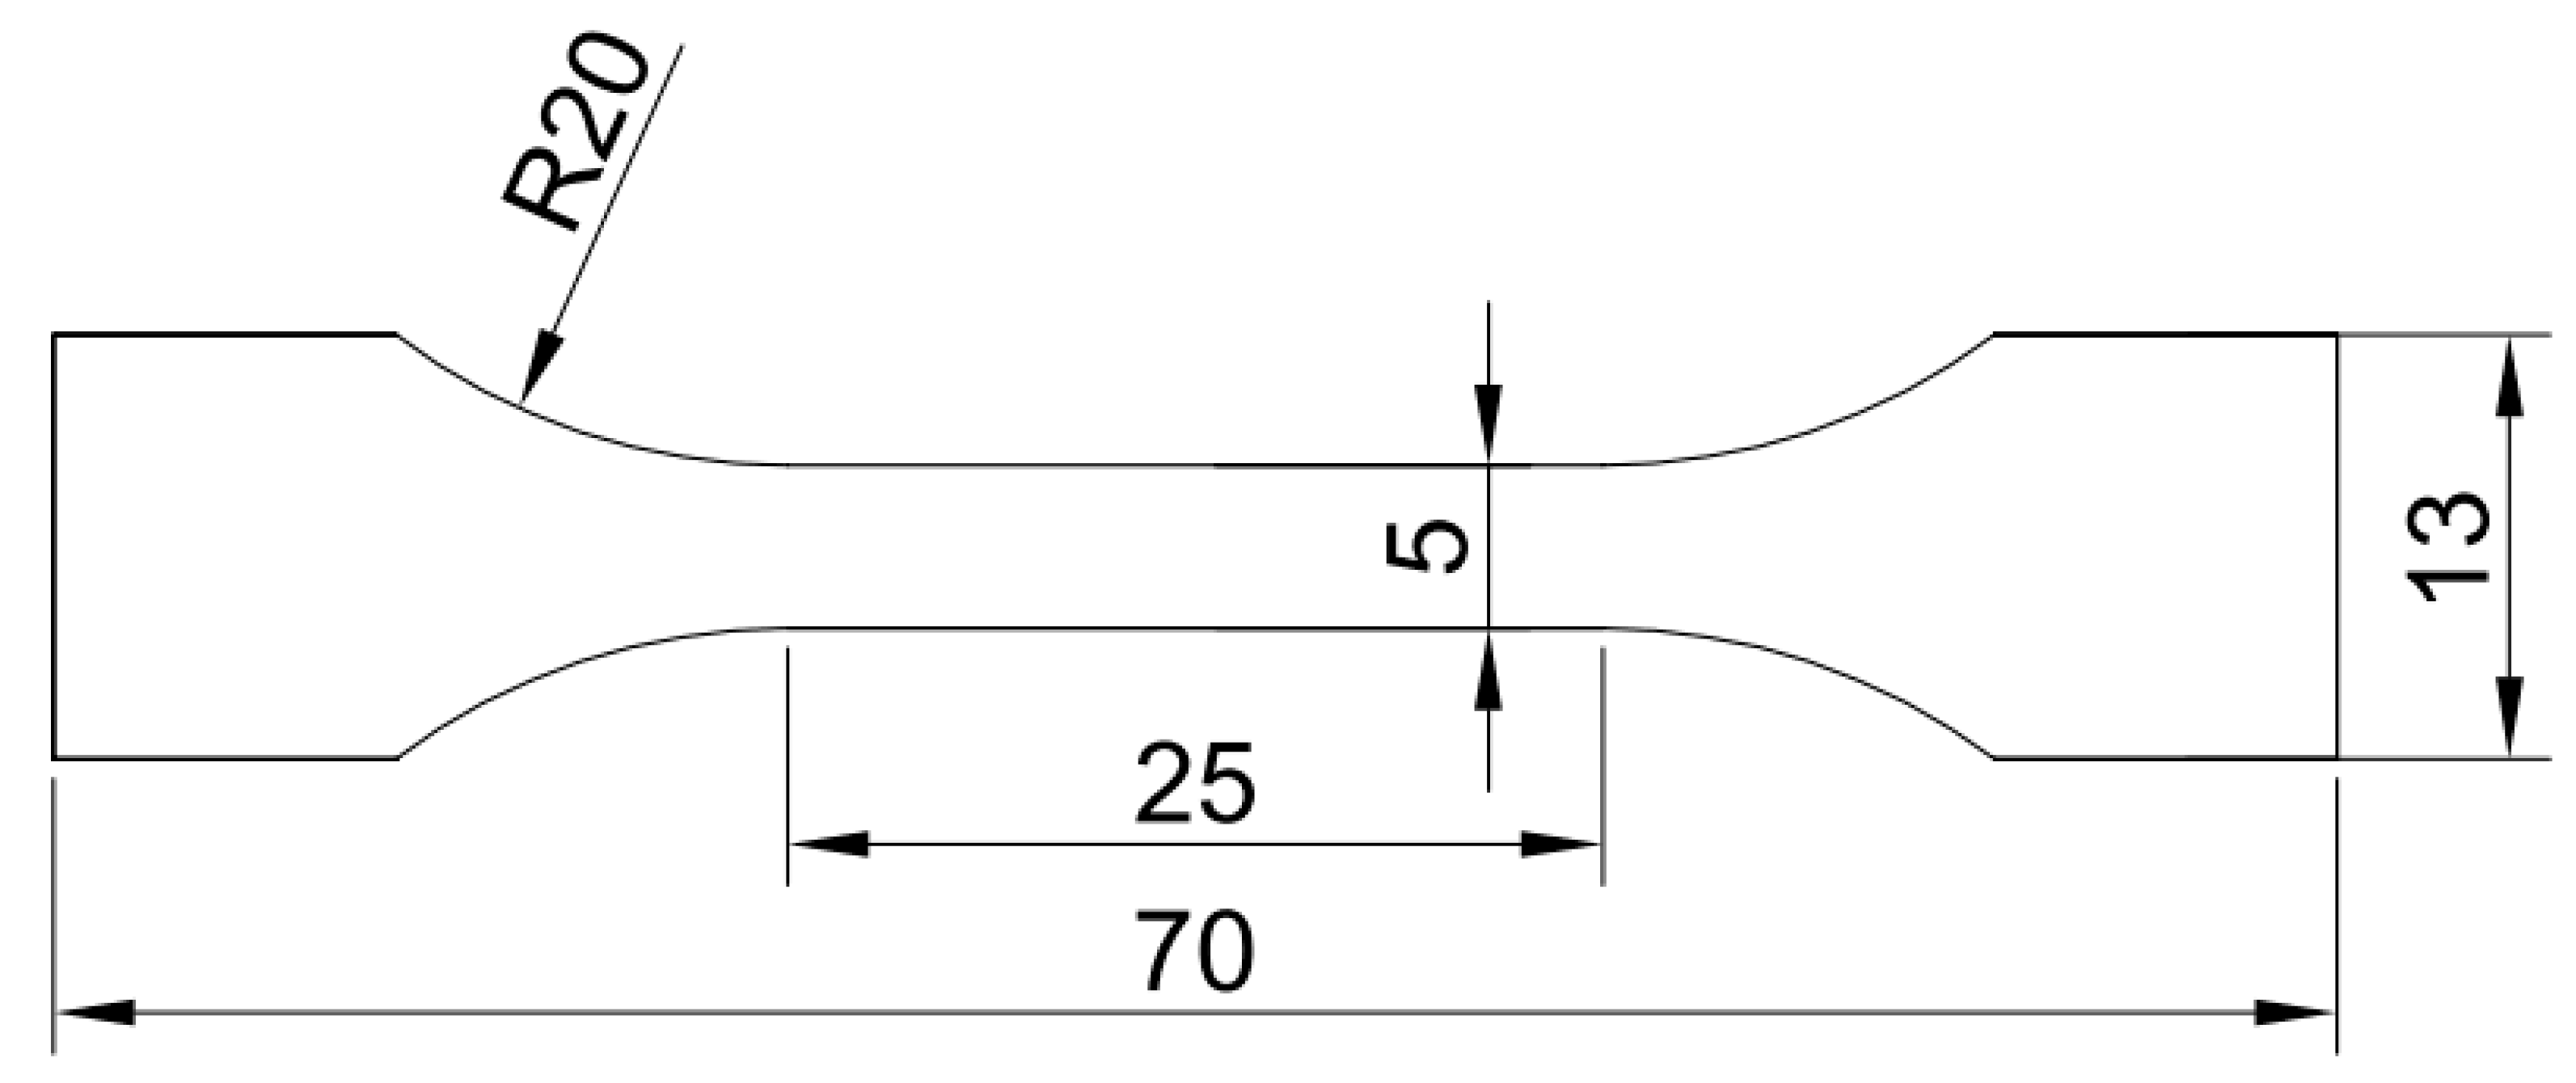
2. Experimental Procedures
3. Results
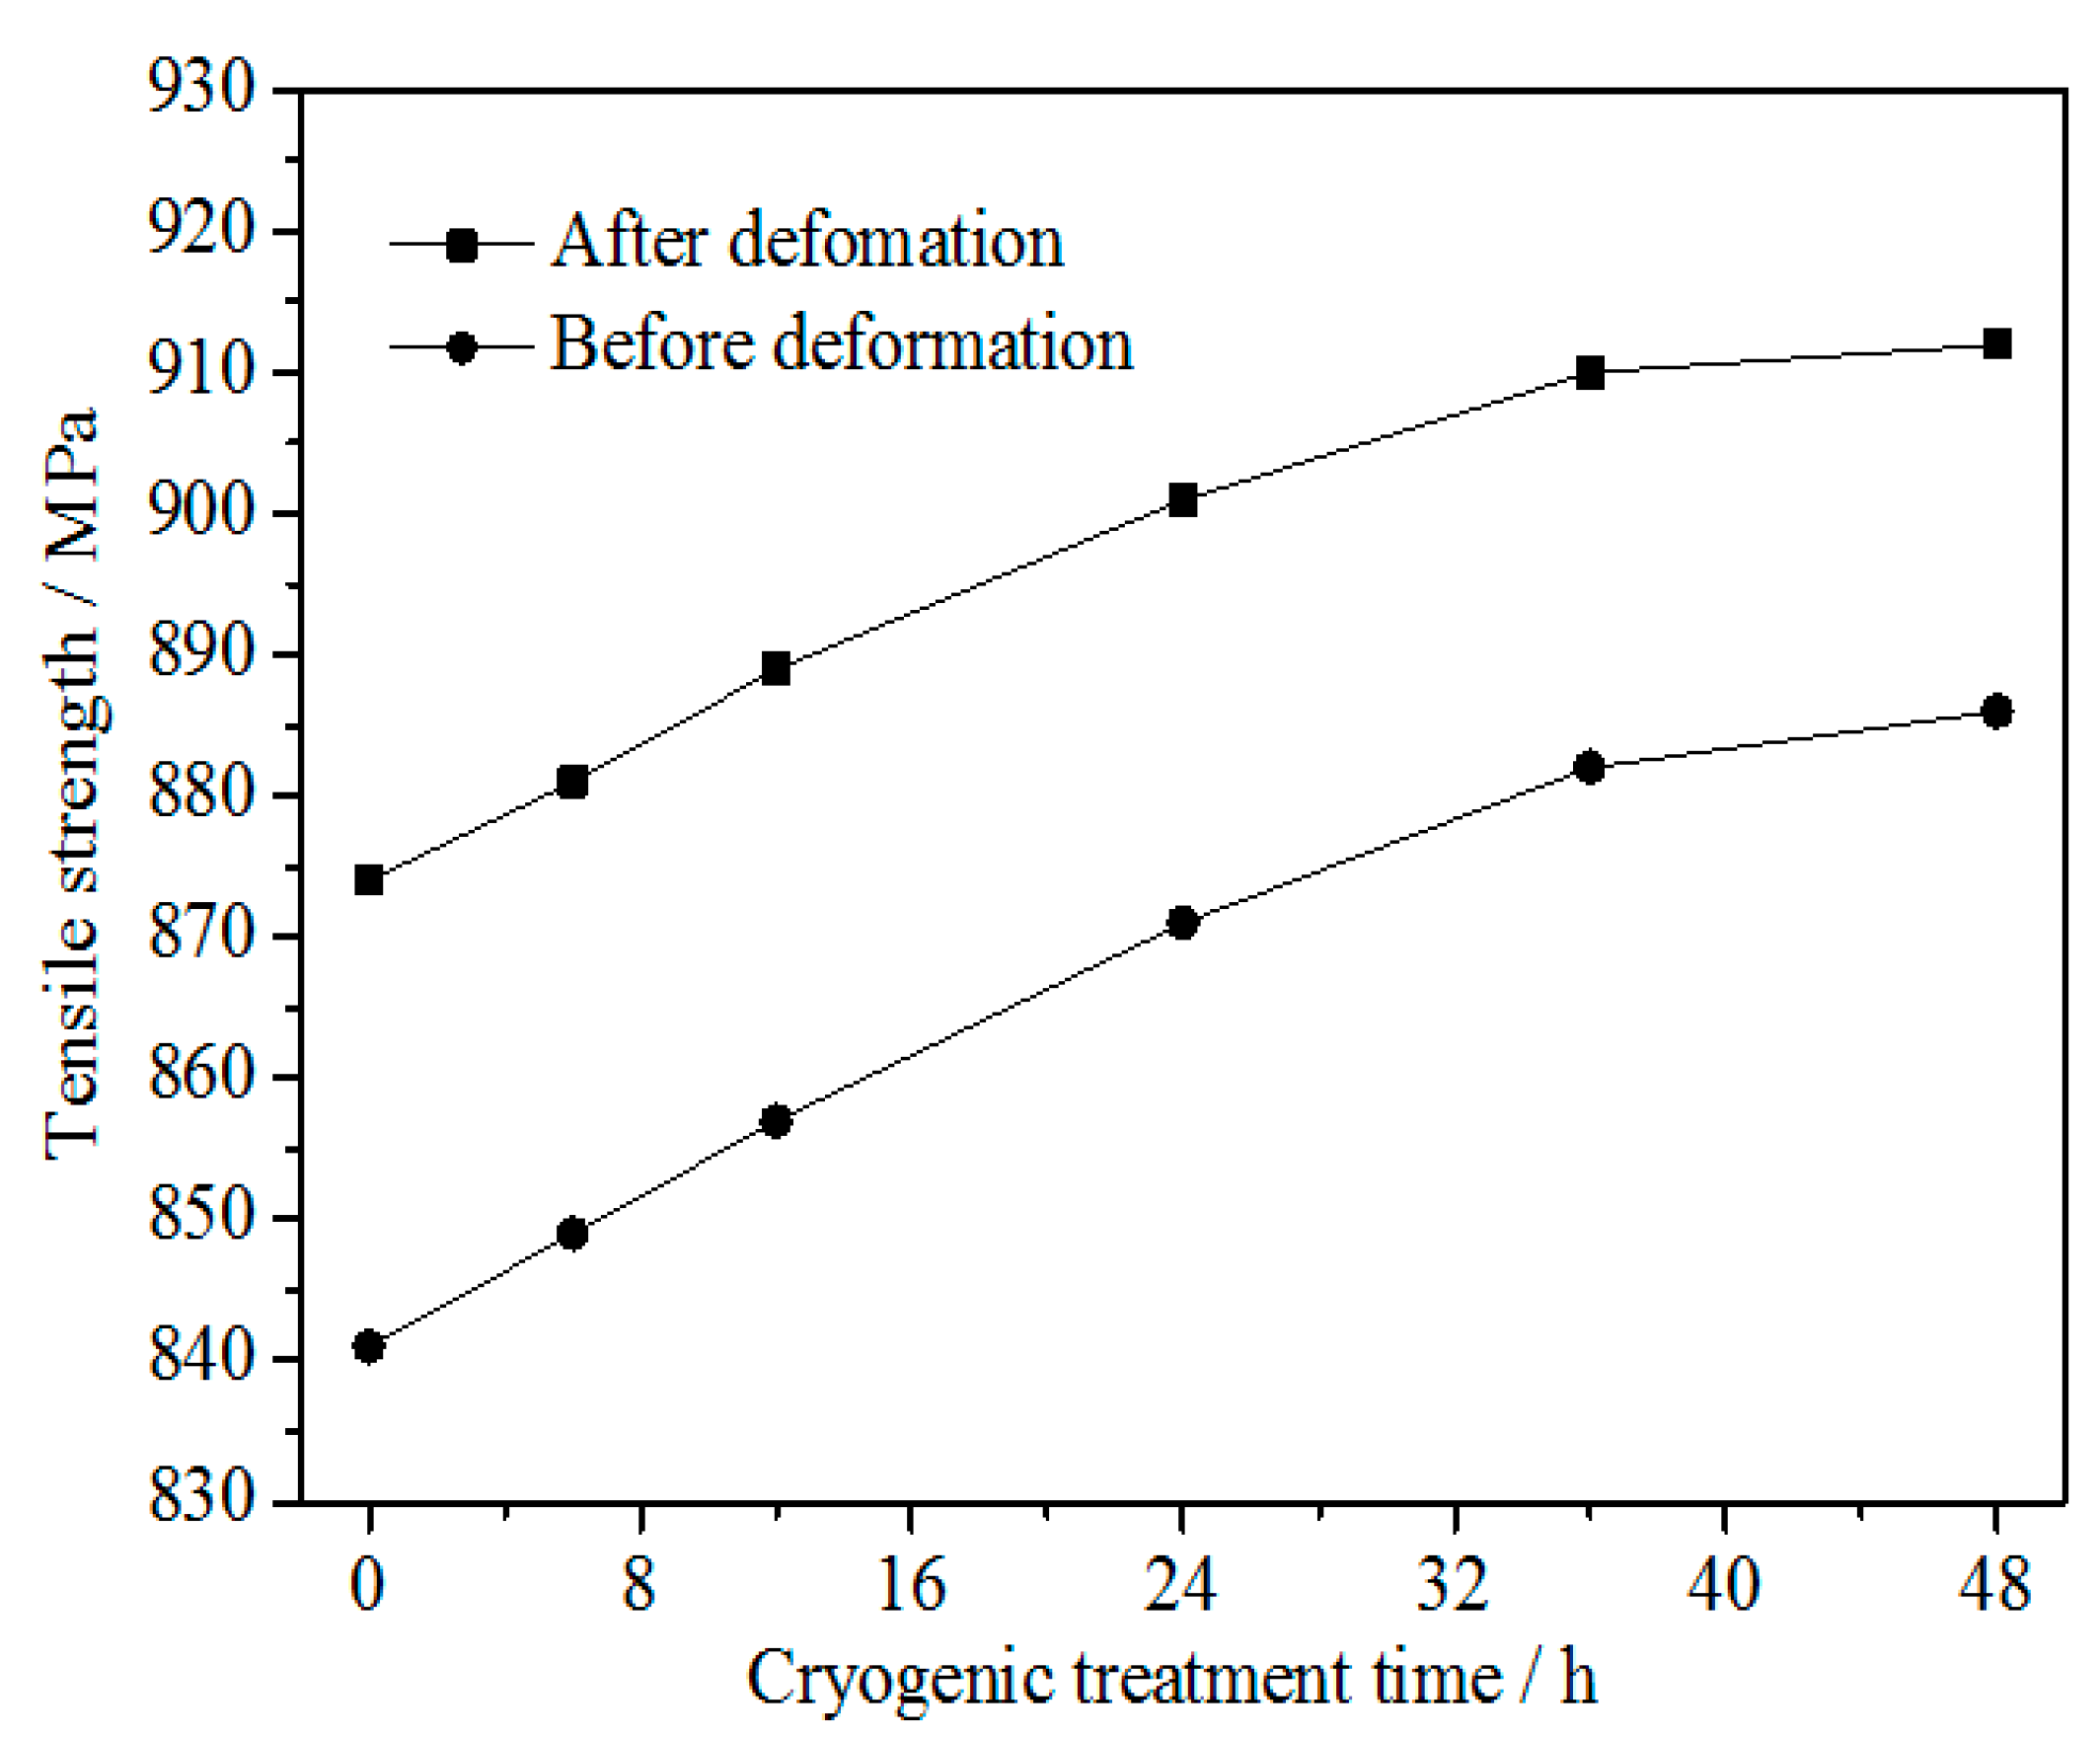
3.1. Tensile Strength
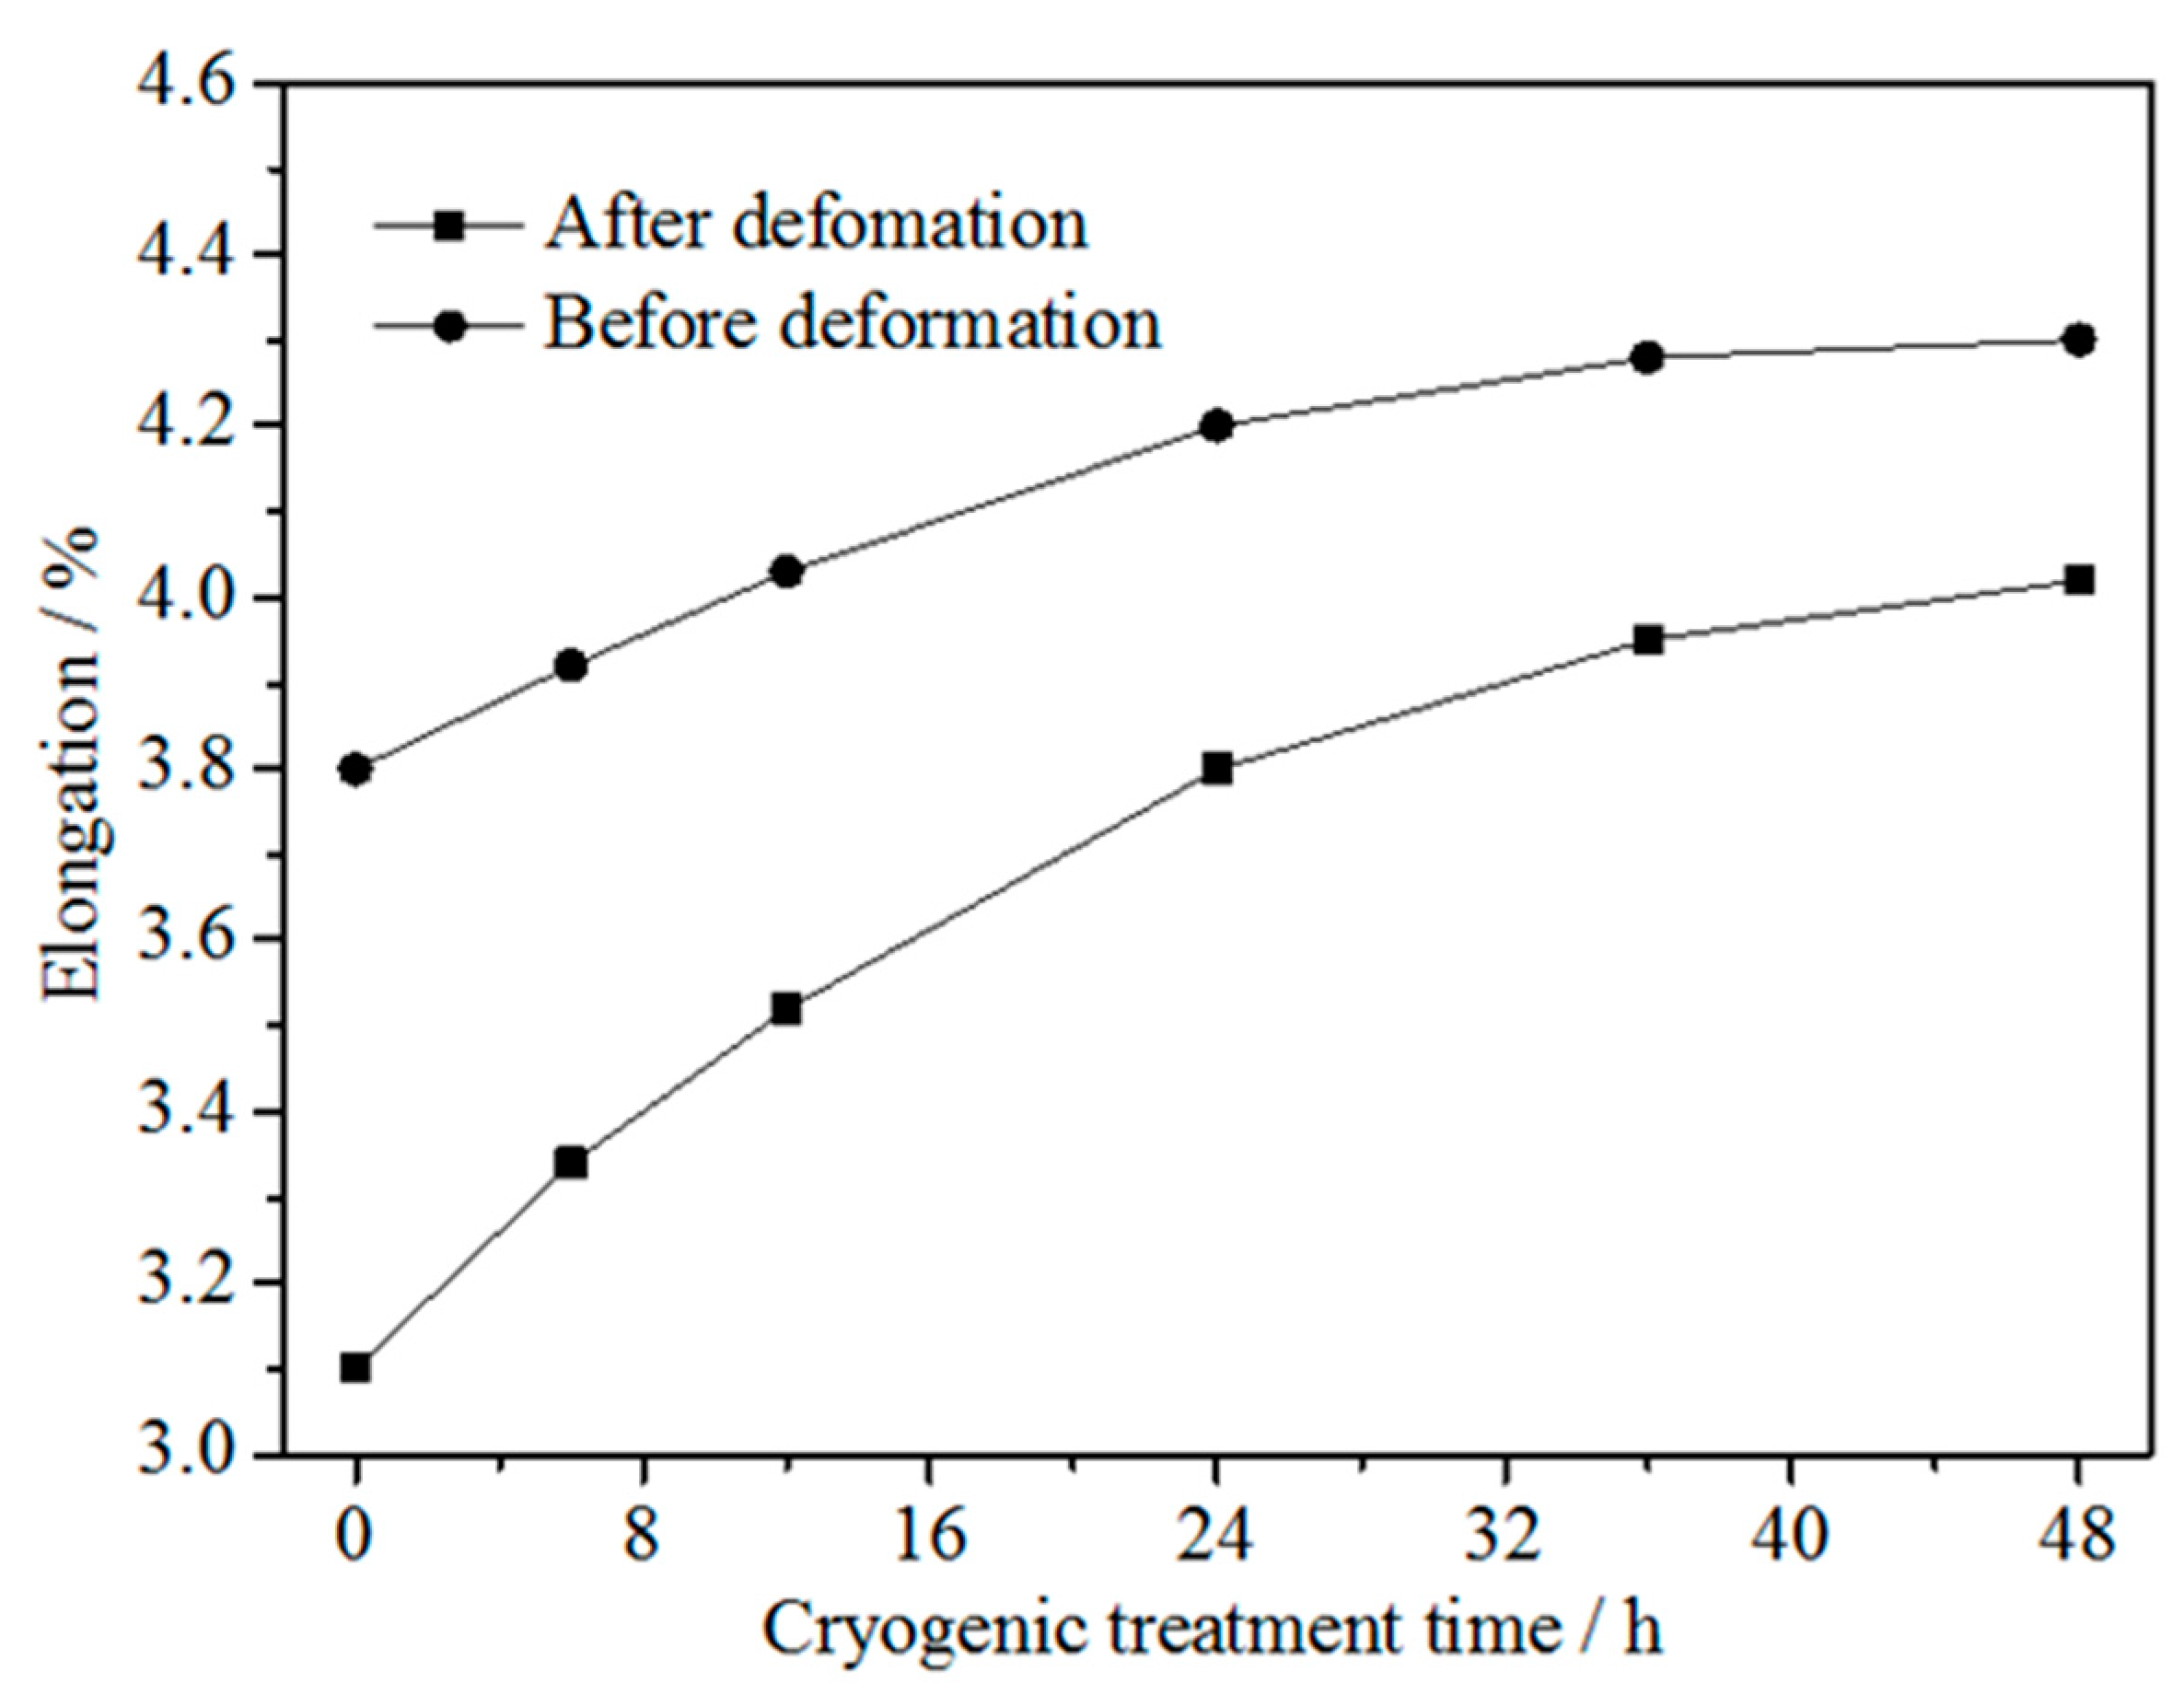
3.2. Elongation
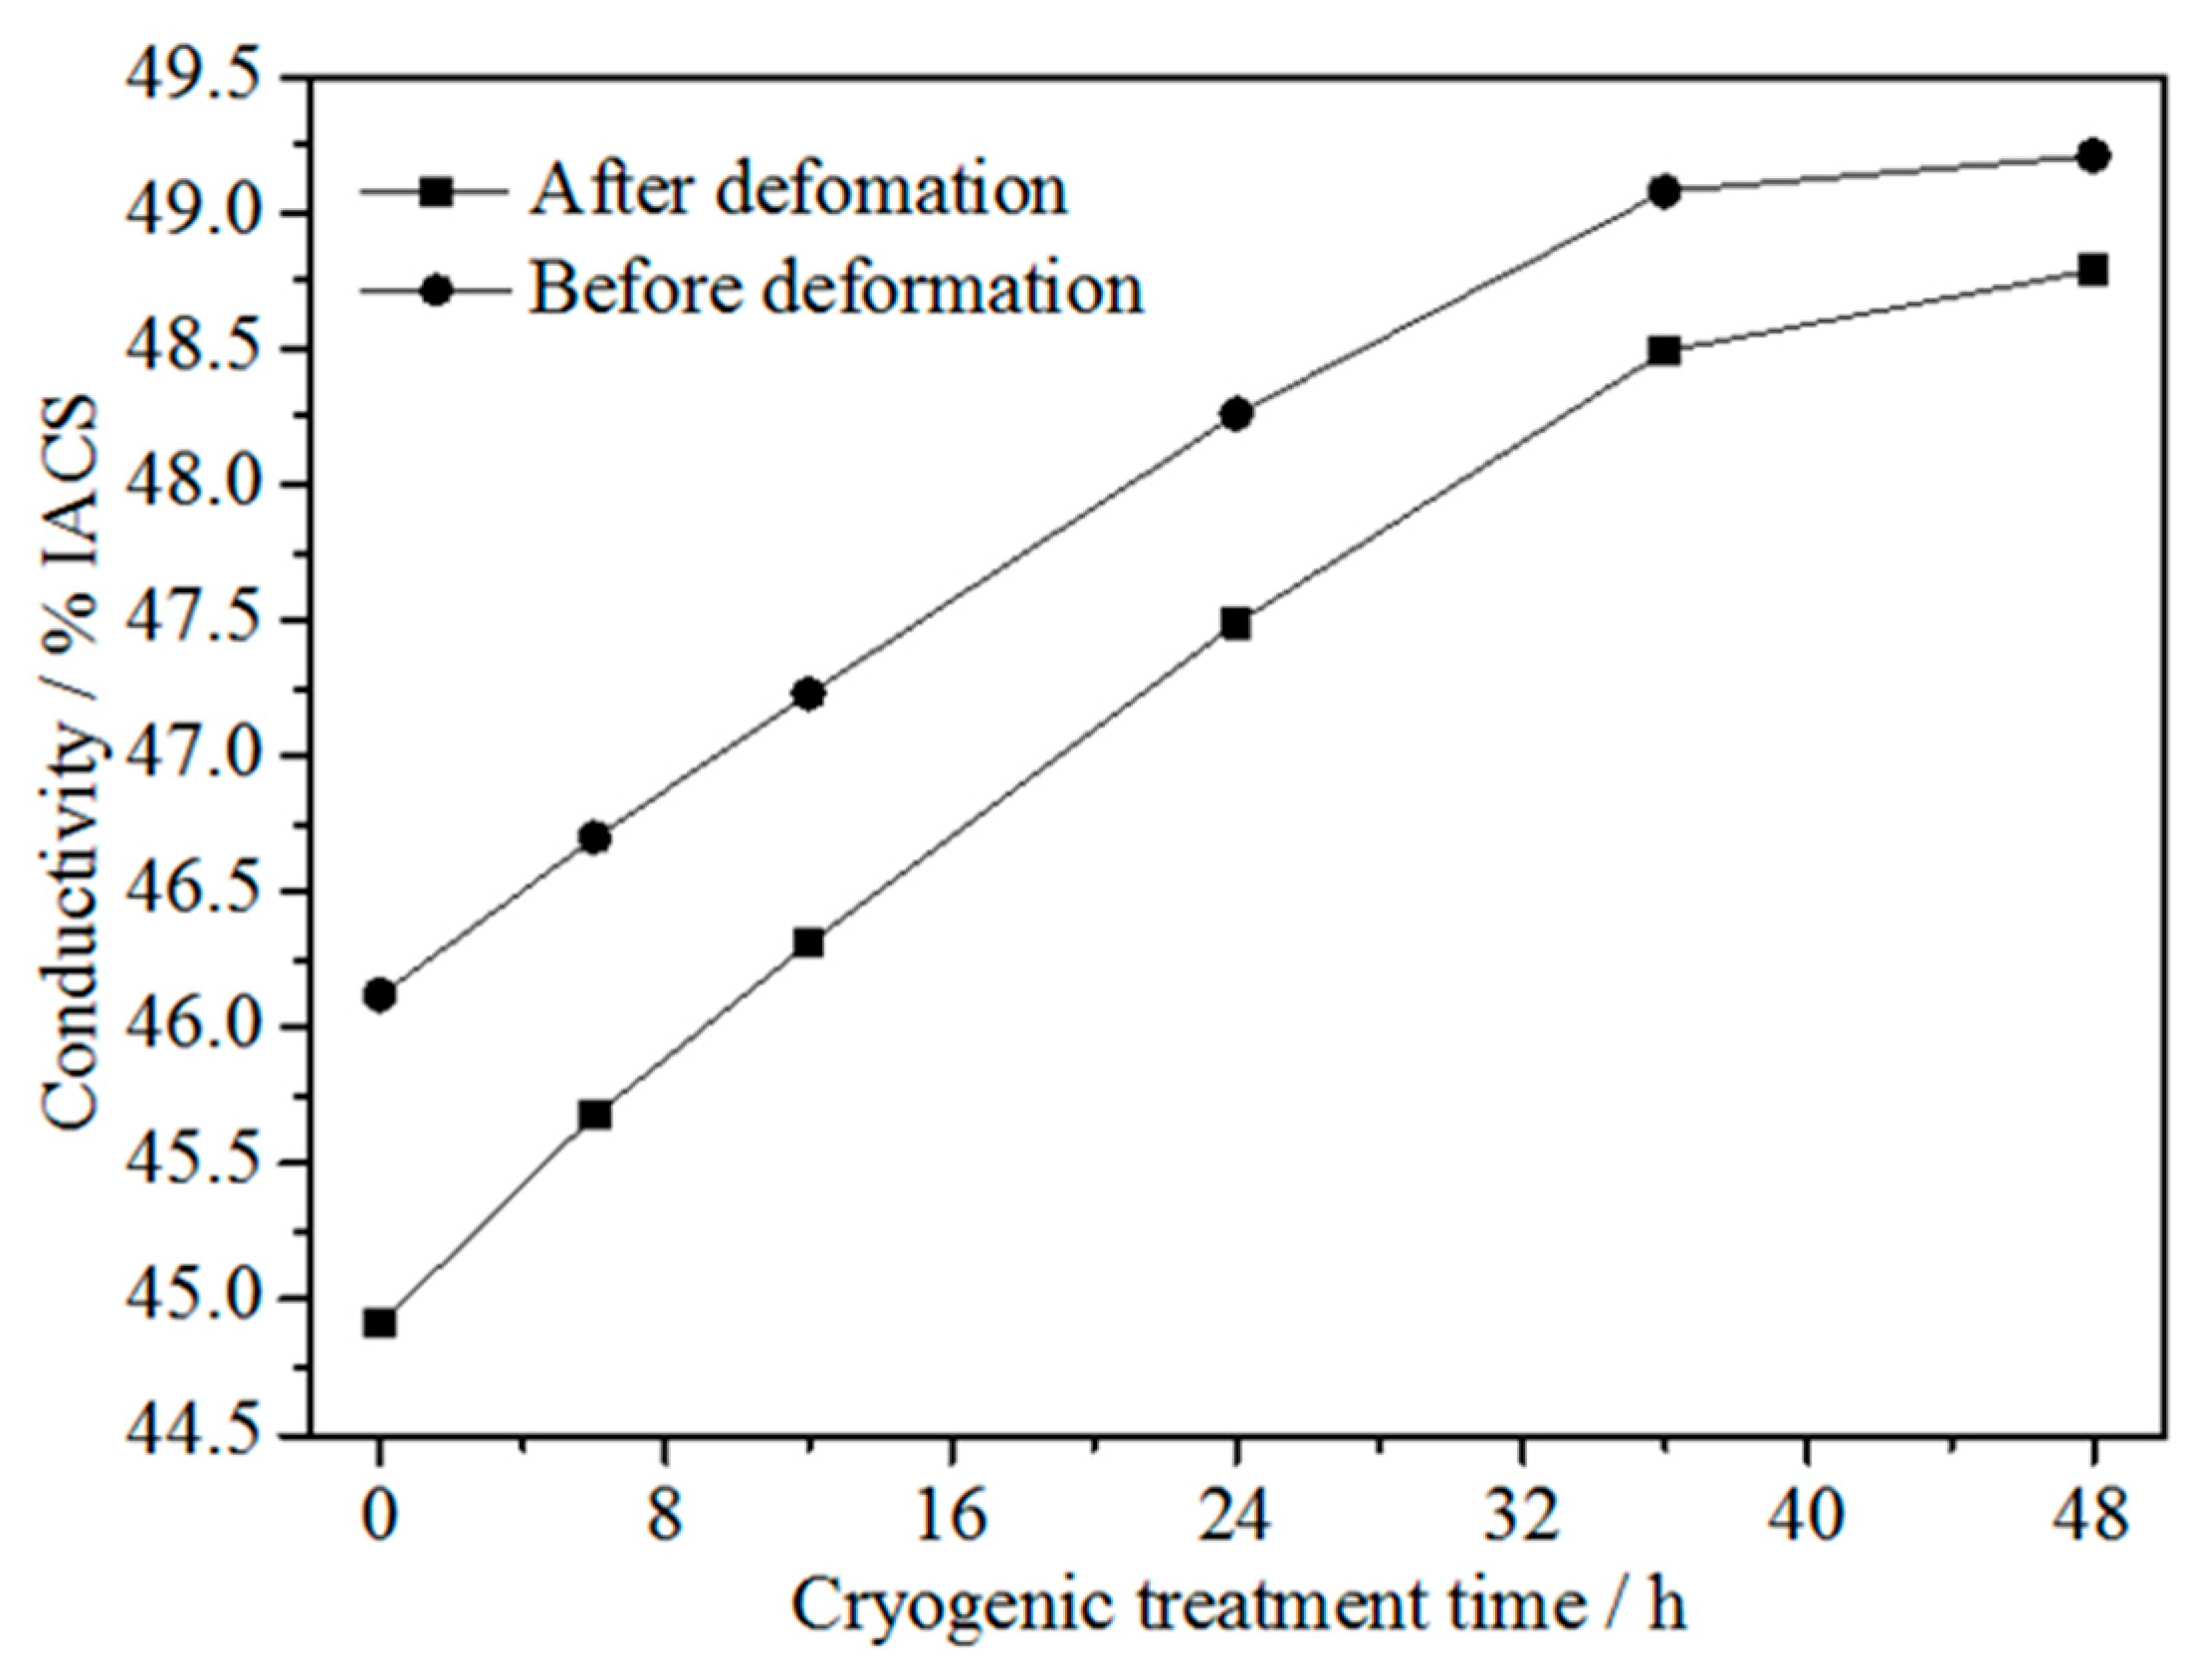
3.3. Conductivity
4. Discussion
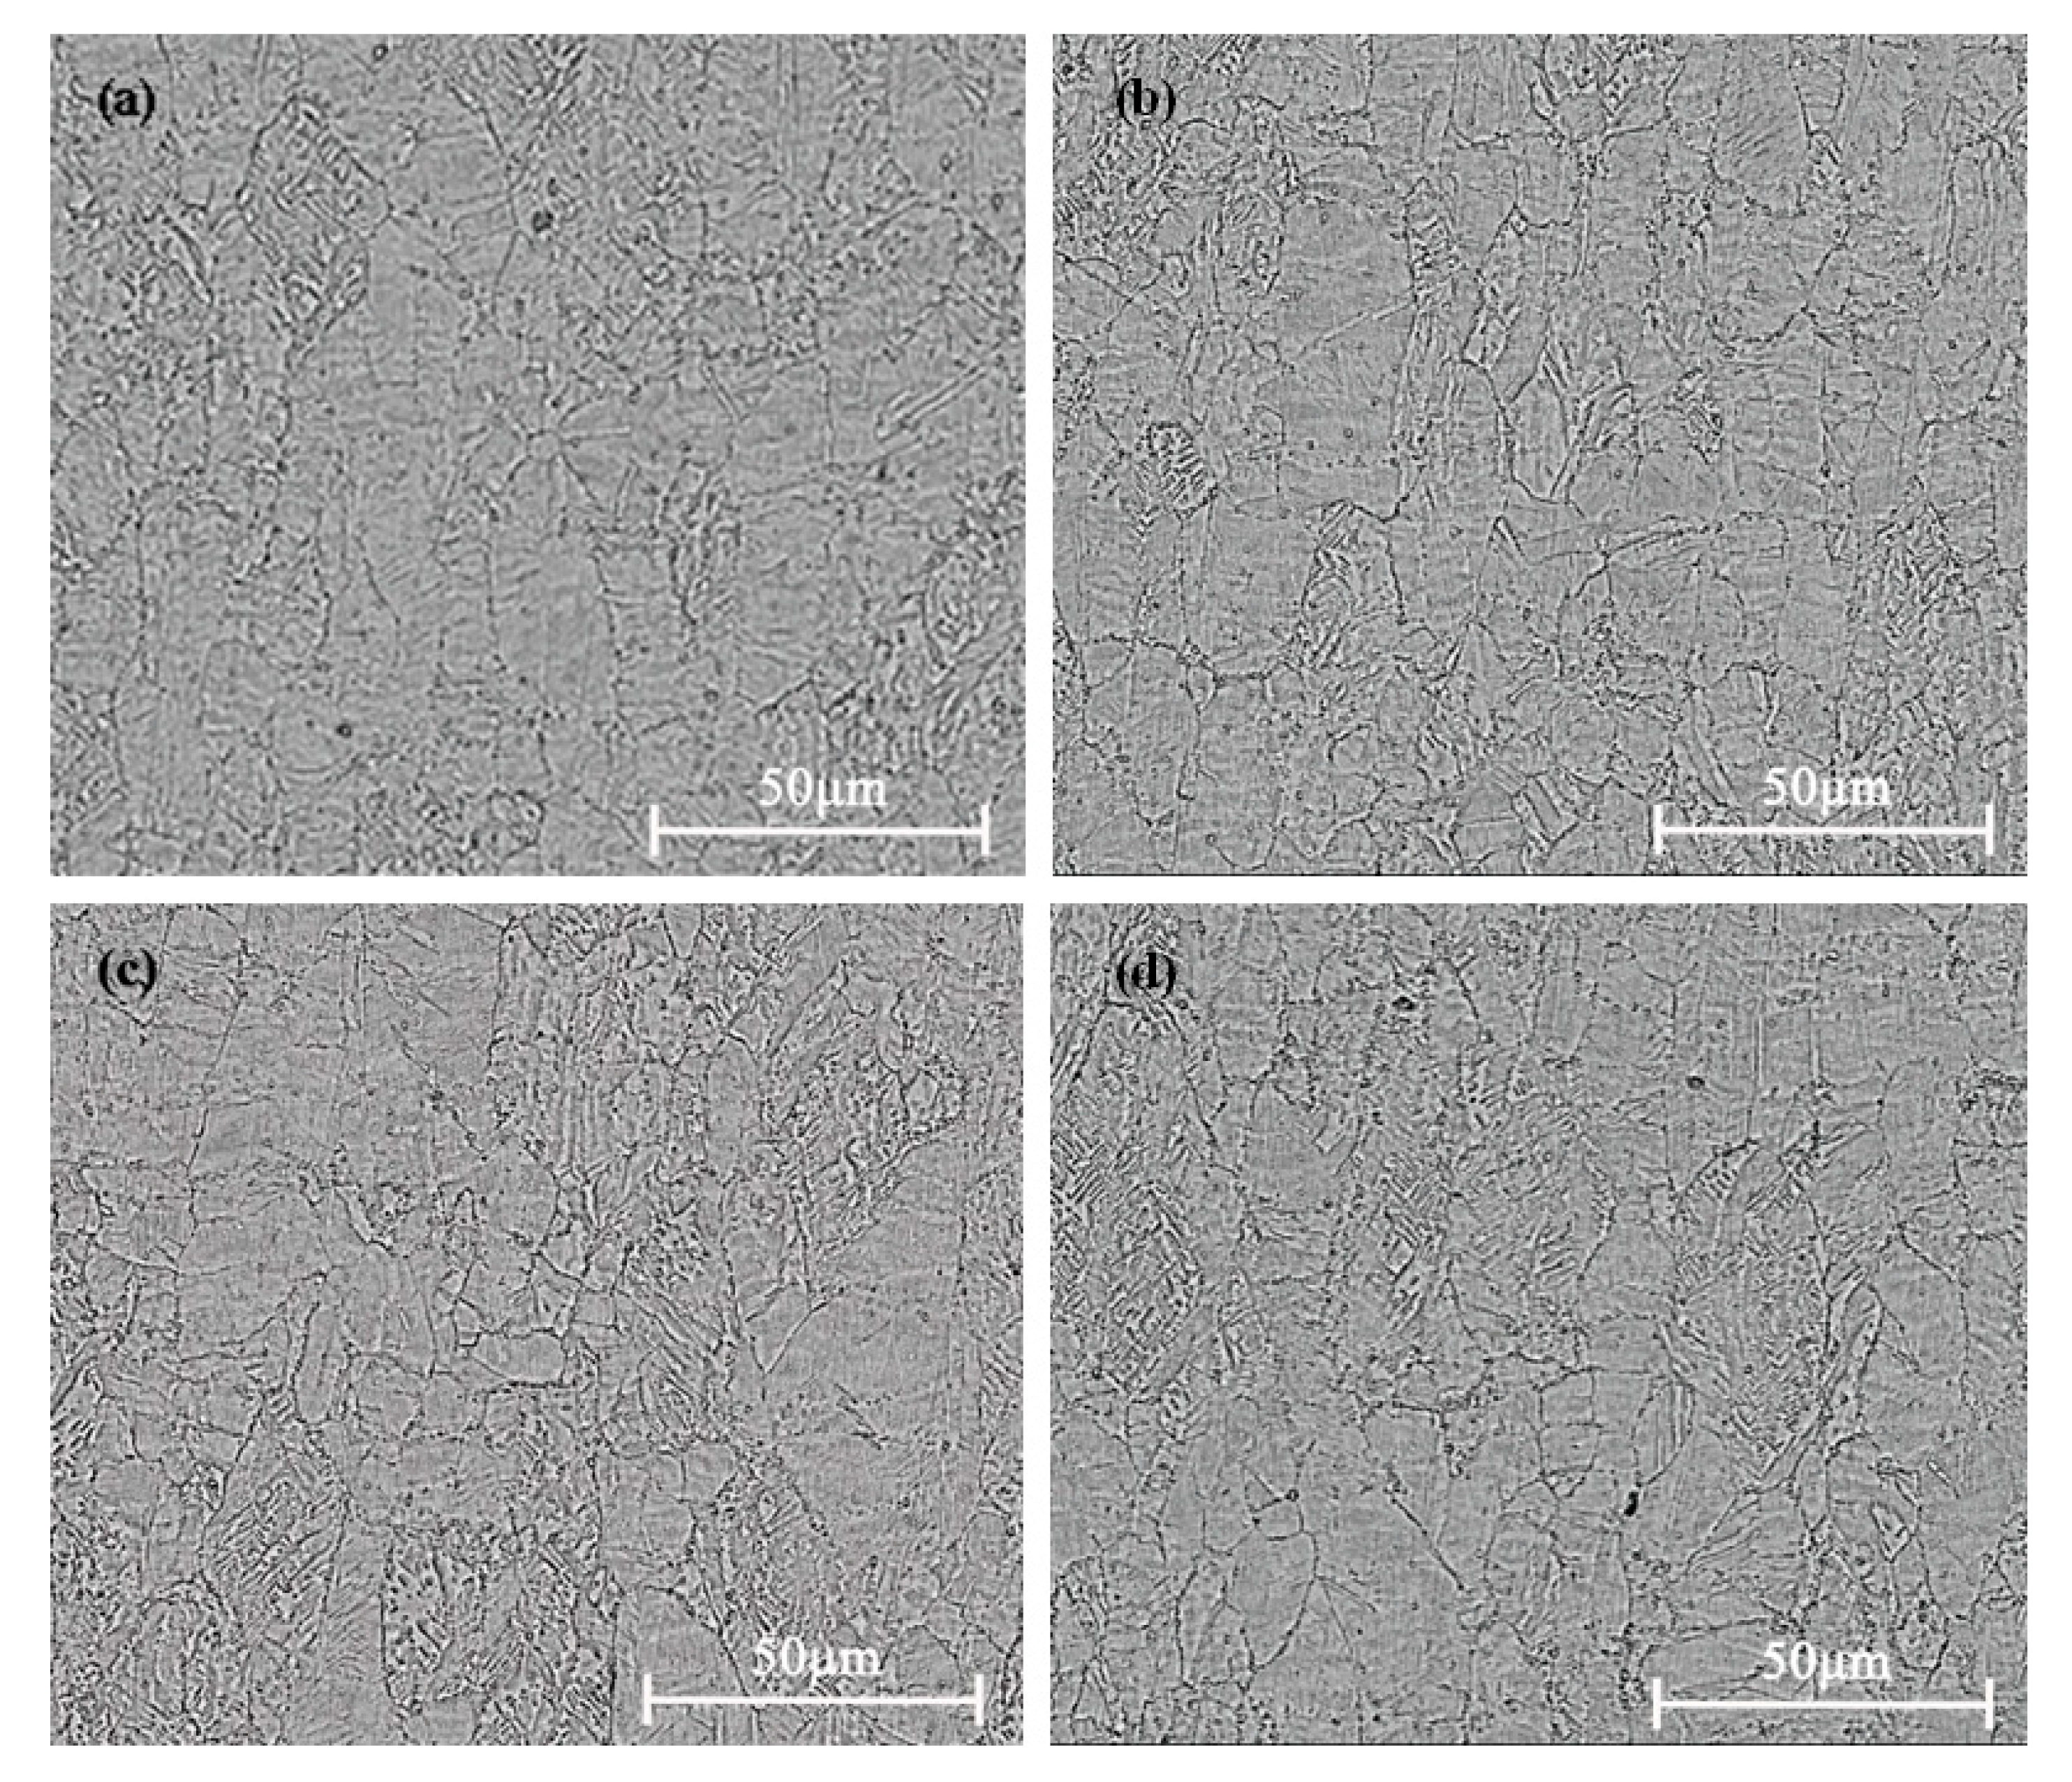
4.1. Microstructure
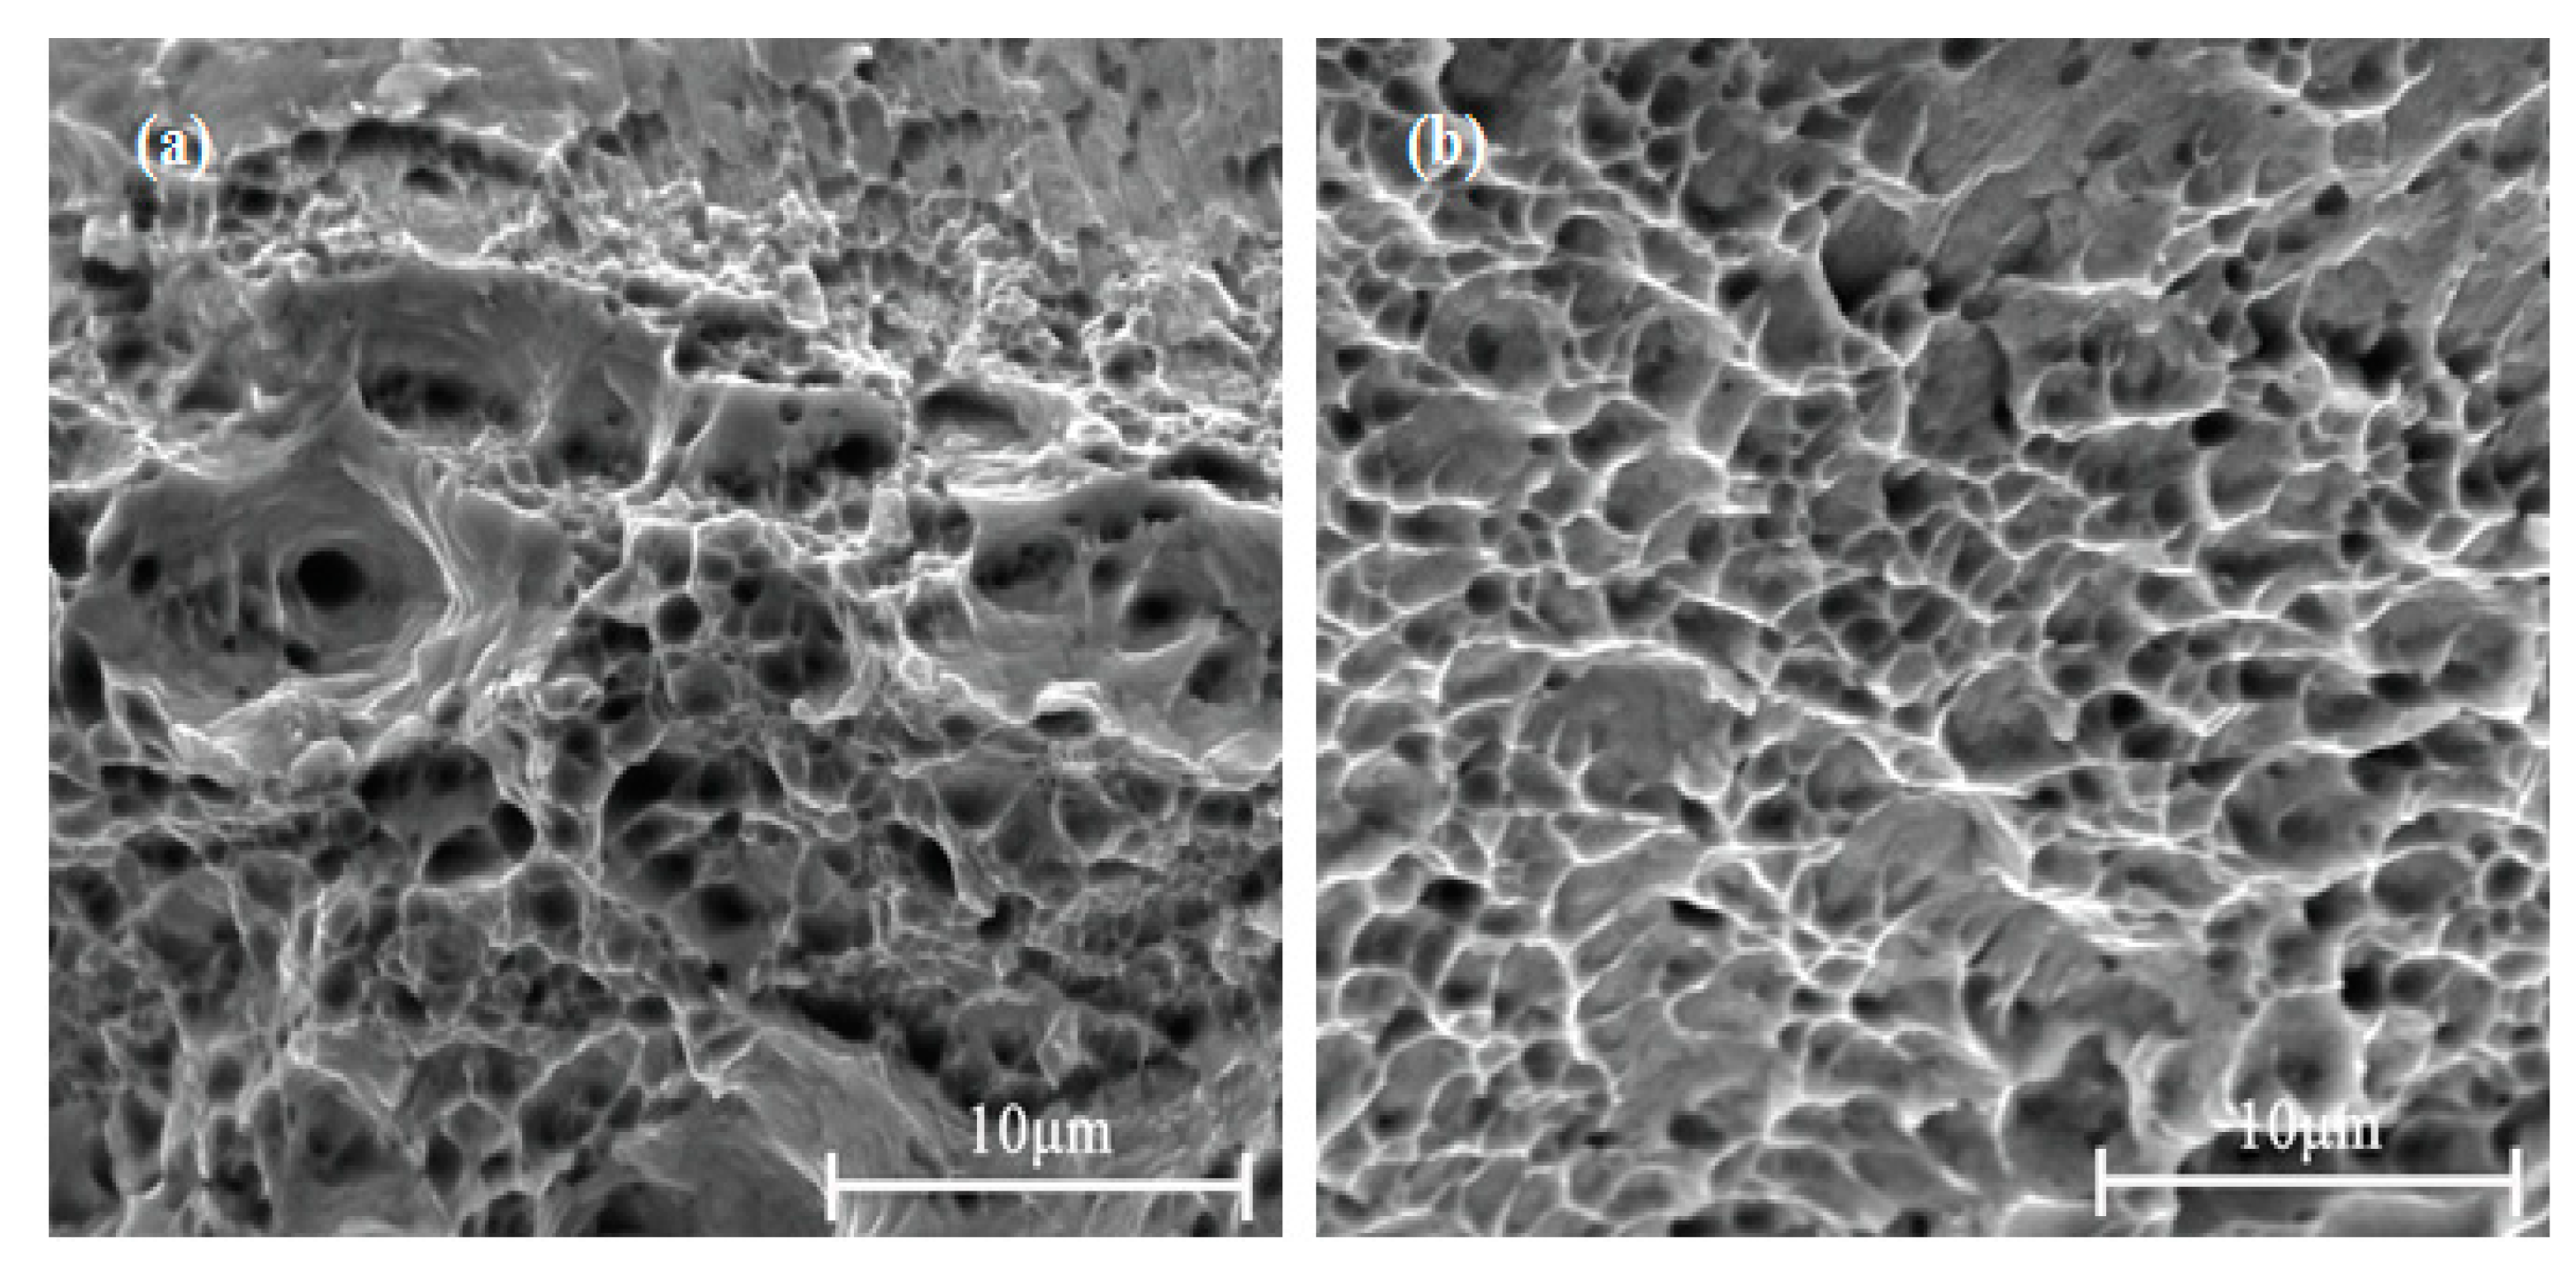
4.2. Fracture
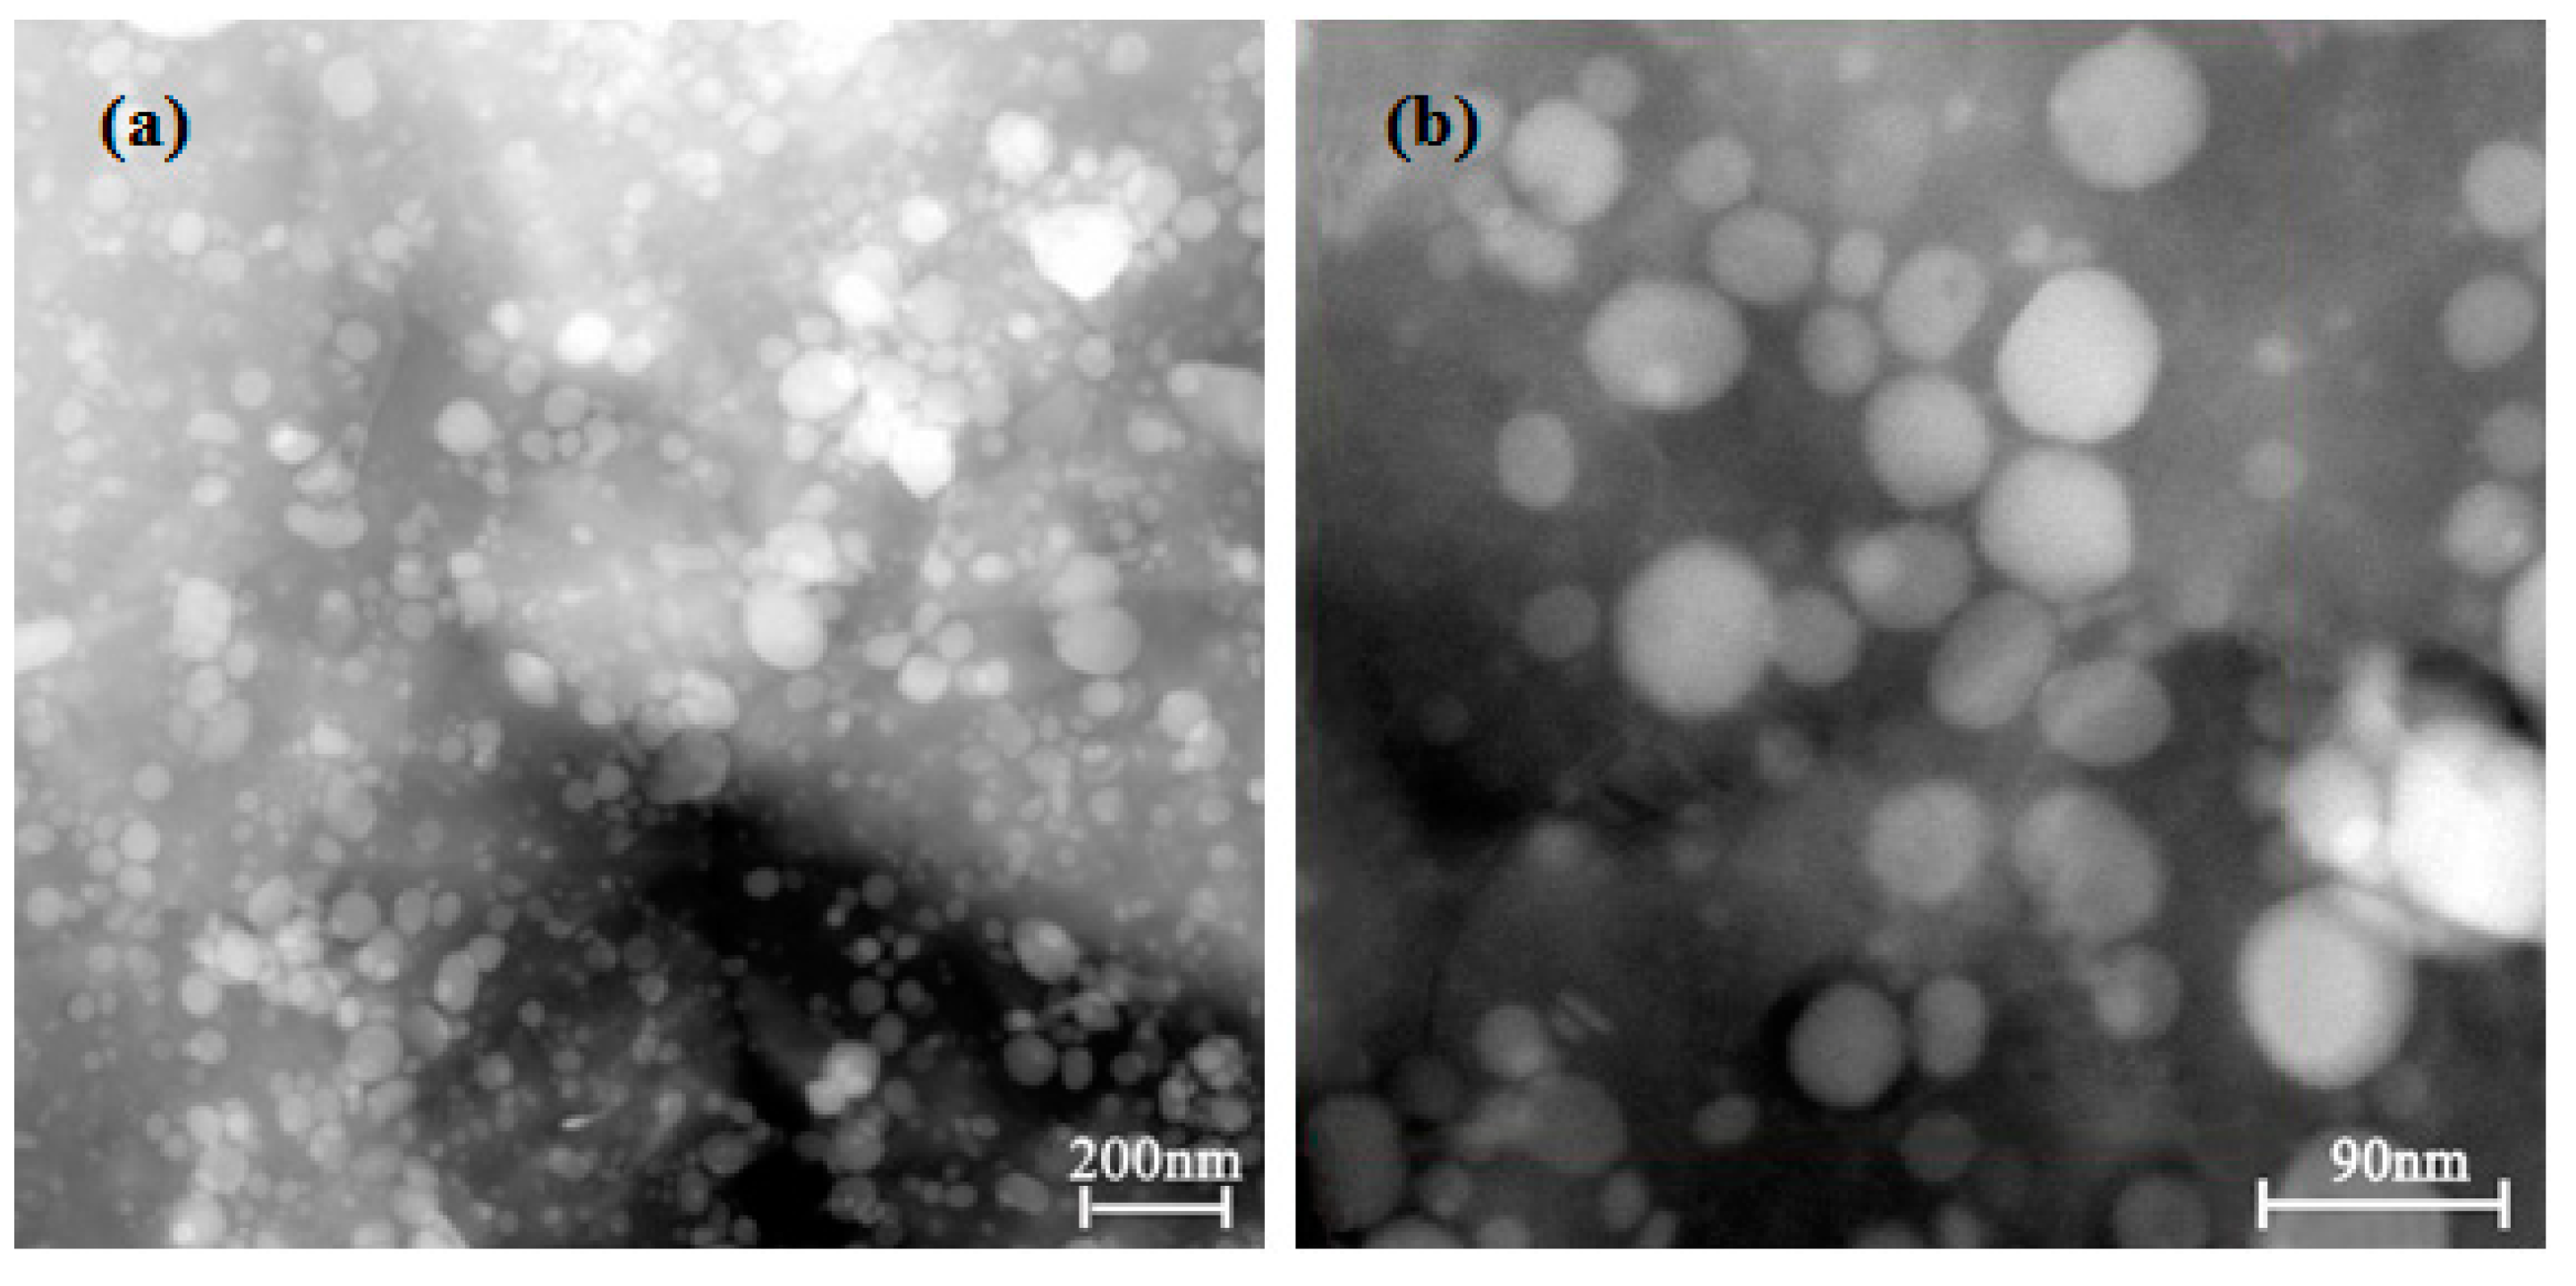
4.3. Precipitation
5. Conclusions
- (1)
- The tensile strength of the alloy before and after cold rolling at 47% reduction increased with increasing DCT time and tended to be stable at about 36 h. These were due to the fact that the DCT promoted the fine and evenly distributed second-phase precipitates, decreased the concentration of defects such as vacancies and increased the density of the alloy, and these changes tended to be stable after a certain time. The tensile strength of the alloy after cold rolling at 47% reduction was higher than that before cold rolling.
- (2)
- The elongation to fracture of the alloy before and after cold rolling at 47% reduction increased with increasing DCT time and tended to be stable at about 36 h. The dimple quantity of the alloy with DCT was larger than without DCT, and the distribution was more uniform.
- (3)
- The conductivity of the alloy before and after cold rolling at 47% reduction increased with increasing DCT time and tended to be stable at about 36 h. These were due to the fact that the DCT promoted the precipitation of the solid solution elements Ni, Co and Si from the Cu matrix, and the precipitation and solid solution tended to balance after a certain time. The conductivity of the alloy before cold rolling was higher than that after cold rolling. However, the difference in conductivity decreased considerably with increasing DCT time.
- (4)
- The grain size of the Cu-1.34Ni-1.02Co-0.61Si alloy was refined, the microstructure distribution became more uniform after the DCT, and the average grain size of the alloy with the DCT for 48 h was the smallest.
- (5)
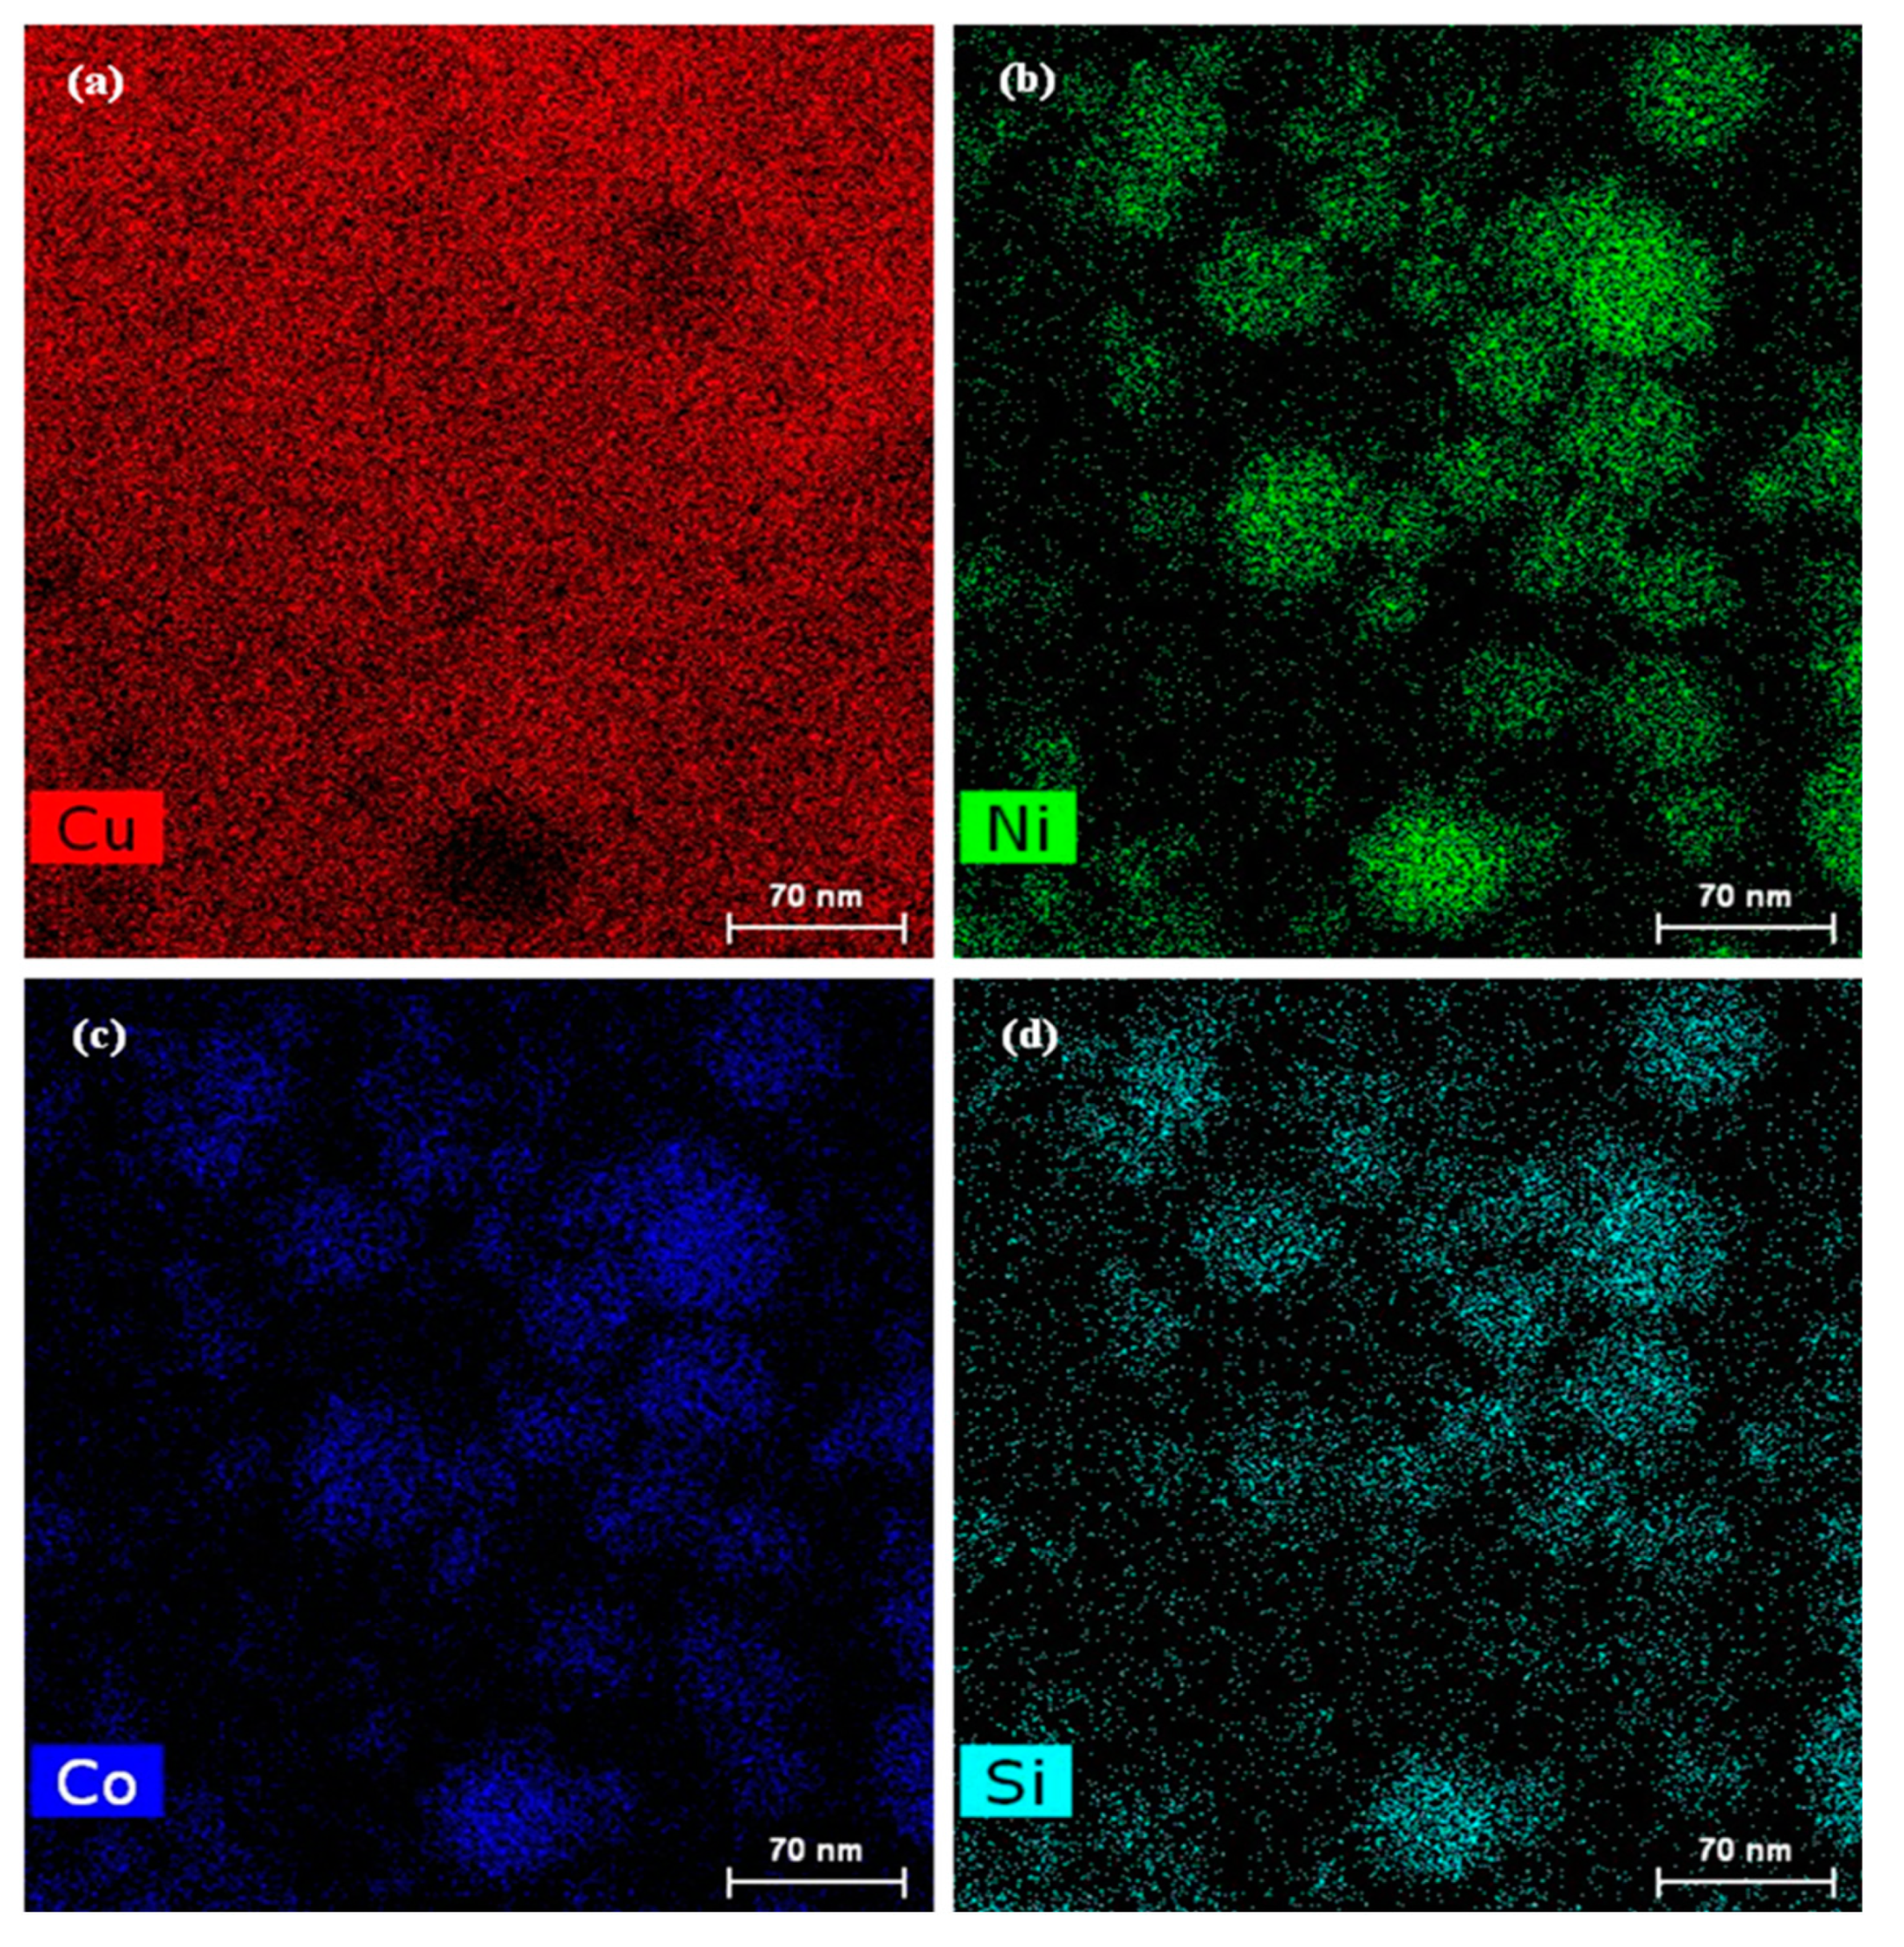
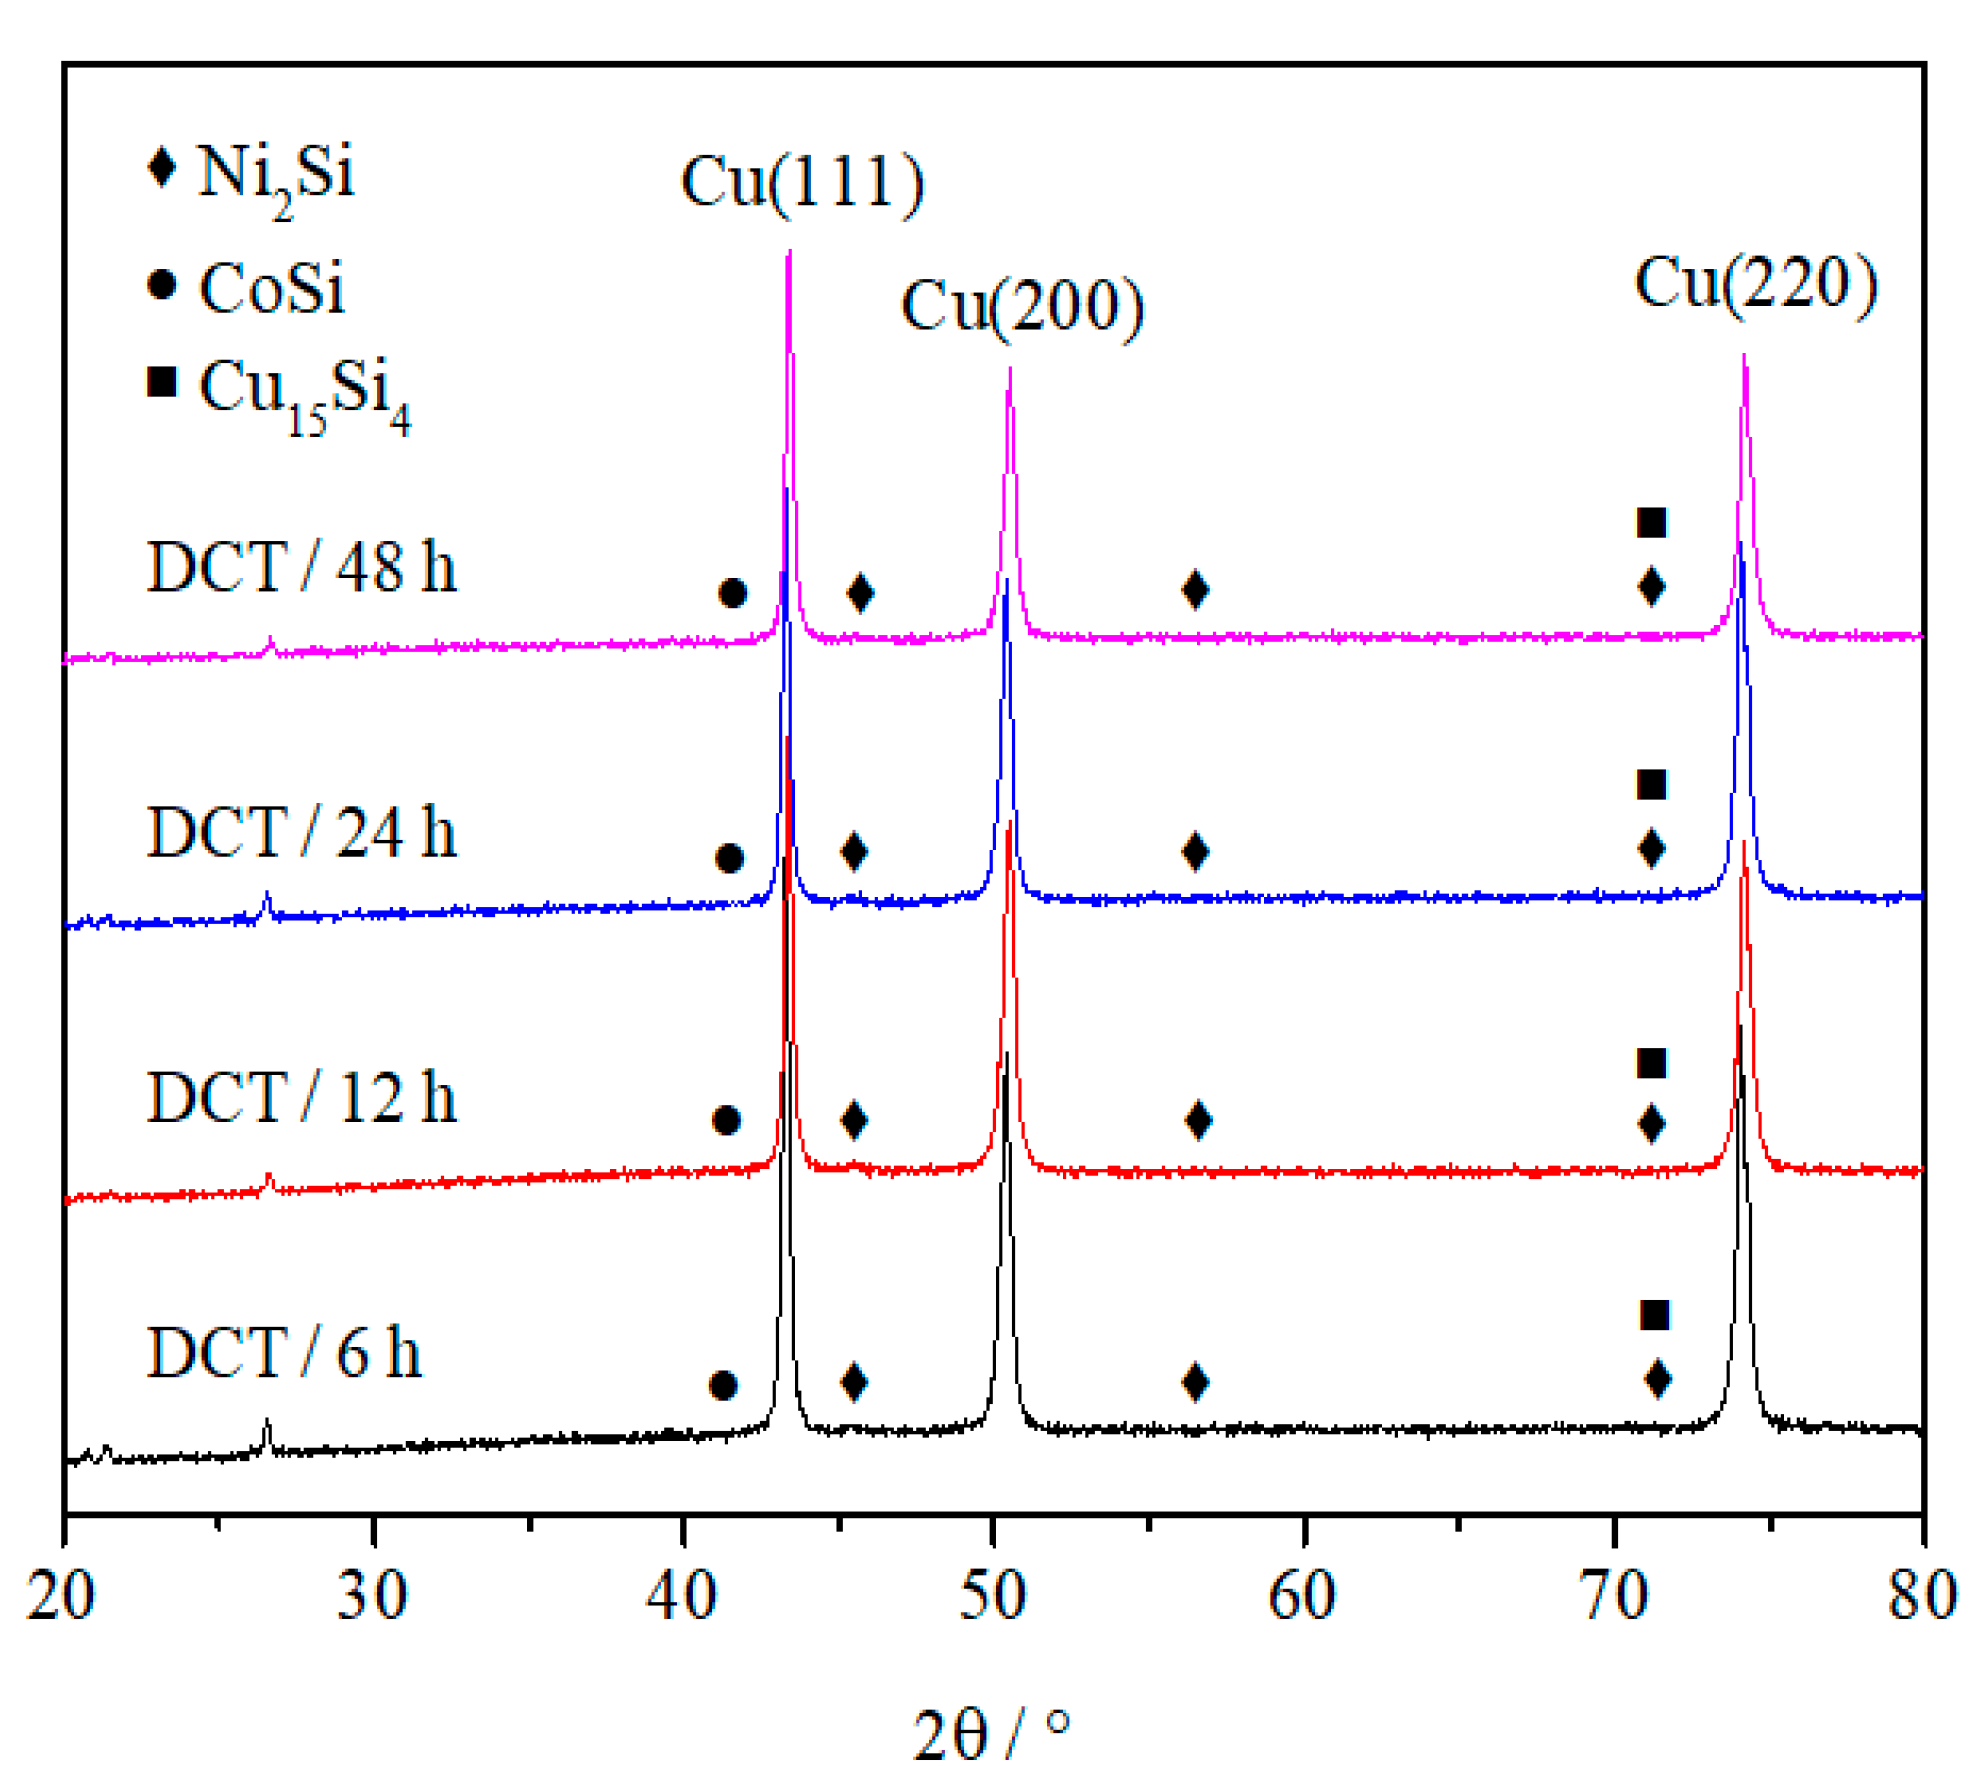
- The DCT promoted the precipitation of the solid solution elements Ni, Co and Si from the Cu matrix to form many fine and evenly distributed 20–70 nm spherical second-phase particles in the grain and grain boundary. The XRD and EDS analysis results indicated that the precipitated second-phase particles at all DCT times were Ni2Si, CoSi and Cu15Si4.
- (6)
- In the future, DCT will be widely used in the field of high-strength high-conductivity copper alloys because DCT plays an important role in increasing the comprehensive properties of these alloys, which is of great significance to broaden the application range of copper alloys in high-tech fields.
Author Contributions
Funding
Conflicts of Interest
References
- Meng, A.; Nie, J.F.; Wei, K.; Kang, H.J.; Liu, Z.J.; Zhao, Y.H. Optimization of strength, ductility and electrical conductivity of a Cu–Cr–Zr alloy by cold rolling and aging treatment. Vacuum 2019, 167, 329–335. [Google Scholar] [CrossRef]
- Liu, K.M.; Sheng, X.C.; Li, Q.P.; Zhang, M.C.; Han, N.L.; He, G.Y.; Zou, J.; Chen, W.; Atrens, A. Microstructure and strengthening model of Cu–Fe in-situ composites. Materials 2020, 13, 3464. [Google Scholar] [CrossRef] [PubMed]
- Zhang, Y.; Liu, P.; Tian, B.H.; Liu, Y.; Li, R.Q.; Xu, Q.Q. Hot deformation behavior and processing map of Cu−Ni−Si−P alloy. Trans. Nonferrous Met. Soc. China 2013, 23, 2341–2347. [Google Scholar] [CrossRef]
- Liu, K.M.; Huang, Z.K.; Zhang, X.W.; Lu, D.P.; Atrens, A.; Zhou, H.T.; Yin, Y.; Yu, J.M.; Guo, W. Influence of ag micro-alloying on the thermal stability and ageing characteristics of a Cu–14Fe in-situ composite. Mater. Sci. Eng. A 2016, 673, 1–7. [Google Scholar] [CrossRef] [Green Version]
- An, B.L.; Xin, Y.; Niu, R.M.; Lu, J.; Wang, E.; Han, K. Hardening Cu–Ag composite by doping with Sc. Mater. Lett. 2019, 252, 207–210. [Google Scholar] [CrossRef]
- Liu, K.M.; Jiang, Z.Y.; Zhao, J.W.; Zou, J.; Chen, Z.B.; Lu, D.P. Effect of directional solidification rate on the microstructure and properties of deformation-processed Cu–7Cr–0.1Ag in situ composites. J. Alloys Compd. 2014, 612, 221–226. [Google Scholar] [CrossRef] [Green Version]
- Goto, M.; Yamamoto, T.; Han, S.Z.; Utsunomiya, T.; Kim, S.; Kitamura, J.; Ahn, J.H.; Lim, S.H.; Lee, J. Simultaneous increase in electrical conductivity and fatigue strength of Cu–Ni–Si alloy by utilizing discontinuous precipitates. Mater. Lett. 2021, 288, 129353. [Google Scholar] [CrossRef]
- Zhang, R.; Li, Z.; Sheng, X.F.; Gao, Y.; Lei, Q. Grain refinement and mechanical properties improvements in a high strength Cu–Ni–Si alloy during multidirectional forging. Fusion Eng. Des. 2020, 159, 111766. [Google Scholar] [CrossRef]
- Liao, W.N.; Liu, X.F.; Yang, Y.H. Relationship and mechanism between double cold rolling-aging process, microstructure and properties of Cu–Ni–Si alloy prepared by two-phase zone continuous casting. Mater. Sci. Eng. A 2020, 797, 140148. [Google Scholar] [CrossRef]
- Lee, S.; Matsunaga, H.; Sauvage, X.; Horita, Z. Strengthening of Cu–Ni–Si alloy using high-pressure torsion and aging. Mater. Charact 2014, 90, 62–70. [Google Scholar] [CrossRef]
- Liu, F.; Li, J.; Peng, L.J.; Huang, G.J.; Xie, H.F.; Ma, J.M.; Mi, X.J. Simultaneously enhanced hardness and electrical conductivity in a Cu–Ni–Si alloy by addition of cobalt. J. Alloys Compd. 2021, 862, 158667. [Google Scholar] [CrossRef]
- Pan, S.B.; Wang, Y.J.; Yu, J.X.; Yang, M.J.; Zhang, Y.Q.; Chen, Y.C.; Wu, J.M.; Han, J.J.; Wang, C.P.; Liu, X.J. Accelerated discovery of high-performance Cu–Ni–Co–Si alloys through machine learning. Mater. Des. 2021, 209, 109929. [Google Scholar] [CrossRef]
- Ban, Y.J.; Zhang, Y.; Tian, B.H.; Song, K.X.; Zhou, M.; Zhang, X.H.; Jia, Y.L.; Li, X.; Geng, Y.F.; Volinsky, A.A. EBSD analysis of hot deformation behavior of Cu–Ni–Co–Si–Cr alloy. Mater. Charact 2020, 169, 110656. [Google Scholar] [CrossRef]
- Zhao, Z.; Zhang, Y.; Tian, B.-H.; Jia, Y.-L.; Liu, Y.; Song, K.-X.; Volinsky, A.-A. Co effects on Cu–Ni–Si alloys microstructure and physical properties. J. Alloys Compd. 2019, 797, 1327–1337. [Google Scholar] [CrossRef]
- Liao, W.N.; Liu, X.F.; Yang, Y.H.; Wang, S.Q.; Du, M. Effect of cold rolling reduction rate on mechanical properties and electrical conductivity of Cu–Ni–Si alloy prepared by temperature controlled mold continuous casting. Mater. Sci. Eng. A 2019, 763, 138068. [Google Scholar] [CrossRef]
- Suzuki, S.; Shibutani, N.; Mimura, K.; Isshiki, M.; Waseda, Y. Improvement in strength and electrical conductivity of Cu–Ni–Si alloys by aging and cold rolling. J. Alloys Compd. 2006, 417, 116–120. [Google Scholar] [CrossRef]
- Huang, J.Z.; Xiao, Z.; Dai, J.; Li, Z.; Jiang, H.Y.; Wang, W.; Zhang, X.X. Microstructure and properties of a novel Cu–Ni–Co–Si–Mg alloy with super-high strength and conductivity. Mater. Sci. Eng. A 2019, 744, 754–763. [Google Scholar] [CrossRef]
- Huang, J.Z.; Xiao, Z.; Dai, J.; Li, Z.; Jiang, H.Y.; Wang, W.; Zhang, X.X. Microstructure and properties of a Cu–Ni–Si–Co–Cr alloy with high strength and high conductivity. Mater. Sci. Eng. A 2019, 759, 396–403. [Google Scholar]
- Ban, Y.Y.; Geng, Y.F.; Hou, J.R.; Zhang, Y.; Zhou, M.; Jia, Y.L.; Tian, B.H.; Liu, Y.; Li, X.; Volinsky, A.-A. Properties and precipitates of the high strength and electrical conductivity Cu–Ni–Co–Si–Cr alloy. J. Mater. Sci. Technol. 2021, 93, 1–6. [Google Scholar] [CrossRef]
- Jovičević-klug, M.; Jovičević-klug, P.; Kranjec, T.; Podgornik, B. Cross-effect of surface finishing and deep cryogenic treatment on corrosion resistance of AISI M35 steel. J. Mater. Res. Technol. 2021, 14, 2365–2381. [Google Scholar] [CrossRef]
- Shinde, T.; Pruncu, C.; Dhokey, N.B.; Parau, A.C.; Vladescu, A. Effect of deep cryogenic treatment on corrosion behavior of AISI H13 die steel. Materials 2021, 4, 7863. [Google Scholar] [CrossRef] [PubMed]
- Chen, Y.L.; Li, Y.H.; Zhou, X.J.; Tan, F.; Jiang, Y.Y. Effects of cryogenic treatment on mechanical properties and crystal orientation of 0.25C–0.80Si–1.6Mn steel with extraordinary strength-toughness. Mater. Res. Express. 2021, 8, 036517. [Google Scholar] [CrossRef]
- Liu, W.; Cheng, W.J.; Yuan, S.J. Analyses on formability and flow stress of an Al–Cu–Mn alloy sheet under biaxial stress at cryogenic temperatures. Int. J. Mech. Sci. 2021, 195, 106266. [Google Scholar] [CrossRef]
- Jia, J.J.; Meng, M.; Zhang, Z.M.; Yang, X.; Lei, G.X.; Zhang, H.L. Effect of deep cryogenic treatment on the microstructure and tensile property of Mg–9Gd–4Y–2Zn–0.5 Zr alloy. J. Mater. Res. Technol. 2022, 16, 74–87. [Google Scholar] [CrossRef]
- Guan, H.M.; Li, M.C. Enhancement of plasticity by cryogenic thermal cycling on Fe80P13C7 bulk amorphous alloy. Mater. Lett. 2021, 300, 130195. [Google Scholar] [CrossRef]
- Deshmukh, A.A.; Bhatt, J.G.; Gade, P.M.; Pal, S. Investigation of structural evolution in the Cu–Zr metallic glass at cryogenic temperatures by using molecular dynamics simulations. J. Mol. Model. 2021, 27, 286. [Google Scholar] [CrossRef]
- Xue, P.; Huang, Y.J.; Pauly, S.; Guo, F.M.; Yang, R.; Jiang, S.S.; Guo, F.Y.; Guo, S.; Fan, H.B.; Ning, Z.l.; et al. Structural evolution of a CuZr–based bulk metallic glass composite during cryogenic treatment observed by in-situ high-energy X-ray diffraction. J. Alloys Compd. 2021, 871, 159570. [Google Scholar] [CrossRef]
- Jovičević-klug, P.; Jovičević-klug, M.; Sever, T.; Feizpour, D.; Podgornik, B. Impact of steel type, composition and heat treatment parameters on effectiveness of deep cryogenic treatment. J. Mater. Res. Technol. 2021, 14, 1007–1020. [Google Scholar] [CrossRef]
- Barylski, A.; Aniolek, K.; Dercz, G.; Kupka, M.; Kaptacz, S. The effect of deep cryogenic treatment and precipitation hardening on the structure, micromechanical properties and wear of the Mg–Y–Nd–Zr alloy. Wear 2021, 468, 203587. [Google Scholar] [CrossRef]
- Su, R.M.; Ma, S.Y.; Wang, K.N.; Li, G.L.; Qu, Y.D.; Li, R.D. Effect of cyclic deep cryogenic treatment on corrosion resistance of 7075 alloy. Met. Mater. Int. 2021, 28, 862–870. [Google Scholar] [CrossRef]
- Yan, Y.M.; Liu, K.; Luo, Z.X.; Wang, M.Q.; Wang, X.M. Effect of cryogenic treatment on microstructure, mechanical properties and distortion of carburized gear steels. Metals 2021, 11, 1940. [Google Scholar] [CrossRef]
- Funk, P.A.; Kanaan, A.; Shank, C.; Cooke, P.; Sevostianow, I.; Thomas, J.W.; Pate, M.O. Quantifying deep cryogenic treatment extent and its effect on steel properties. Int. J. Eng. Sci 2021, 167, 103521. [Google Scholar] [CrossRef]
- Liu, K.M.; Jiang, Z.Y.; Zhao, J.W.; Zou, J.; Lu, L.; Lu, D.P. Thermal stability and properties of deformation-processed Cu–Fe in situ composites. Metall. Mater. Trans. A 2015, 46, 2255–2261. [Google Scholar] [CrossRef]
- Cheng, J.Y.; Tang, B.B.; Yu, F.X.; Shen, B. Evaluation of nanoscaled precipitates in a Cu–Ni–Si–Cr alloy during aging. J. Alloys Compd. 2014, 614, 189–195. [Google Scholar] [CrossRef]
- Liu, K.M.; Lu, D.P.; Zhou, H.T.; Chen, Z.B.; Atrens, A.; Lu, L. Influence of a high magnetic field on the microstructure and properties of a Cu–Fe–Ag in situ composite. Mater. Sci. Eng. A 2013, 584, 114–120. [Google Scholar] [CrossRef]
- Wu, Y.K.; Li, Y.; Lu, J.Y.; Tan, S.; Jiang, F.; Sun, J. Correlations between microstructures and properties of Cu–Ni–Si–Cr alloy. Mater. Sci. Eng. A 2018, 731, 403–412. [Google Scholar] [CrossRef]


| Component | Ni | Co | Si | Cu |
|---|---|---|---|---|
| Content | 1.34 | 1.02 | 0.61 | Balance |
Publisher’s Note: MDPI stays neutral with regard to jurisdictional claims in published maps and institutional affiliations. |
© 2022 by the authors. Licensee MDPI, Basel, Switzerland. This article is an open access article distributed under the terms and conditions of the Creative Commons Attribution (CC BY) license (https://creativecommons.org/licenses/by/4.0/).
Share and Cite
Liu, K.; Sheng, X.; Li, X.; Li, M.; Shen, Z.; Fu, K.; Zhou, H.; Atrens, A. Deep Cryogenic Treatment Characteristics of a Deformation-Processed Cu-Ni-Co-Si Alloy. Materials 2022, 15, 3051. https://doi.org/10.3390/ma15093051
Liu K, Sheng X, Li X, Li M, Shen Z, Fu K, Zhou H, Atrens A. Deep Cryogenic Treatment Characteristics of a Deformation-Processed Cu-Ni-Co-Si Alloy. Materials. 2022; 15(9):3051. https://doi.org/10.3390/ma15093051
Chicago/Turabian StyleLiu, Keming, Xiaochun Sheng, Xiaolong Li, Mulin Li, Zhi Shen, Kai Fu, Haitao Zhou, and Andrej Atrens. 2022. "Deep Cryogenic Treatment Characteristics of a Deformation-Processed Cu-Ni-Co-Si Alloy" Materials 15, no. 9: 3051. https://doi.org/10.3390/ma15093051
APA StyleLiu, K., Sheng, X., Li, X., Li, M., Shen, Z., Fu, K., Zhou, H., & Atrens, A. (2022). Deep Cryogenic Treatment Characteristics of a Deformation-Processed Cu-Ni-Co-Si Alloy. Materials, 15(9), 3051. https://doi.org/10.3390/ma15093051