
Seismic Performance of Steel-Reinforced Concrete Columns with Q690 High-Strength Steel

Abstract
:1. Introduction
2. Experimental Investigation
2.1. Test Specimens
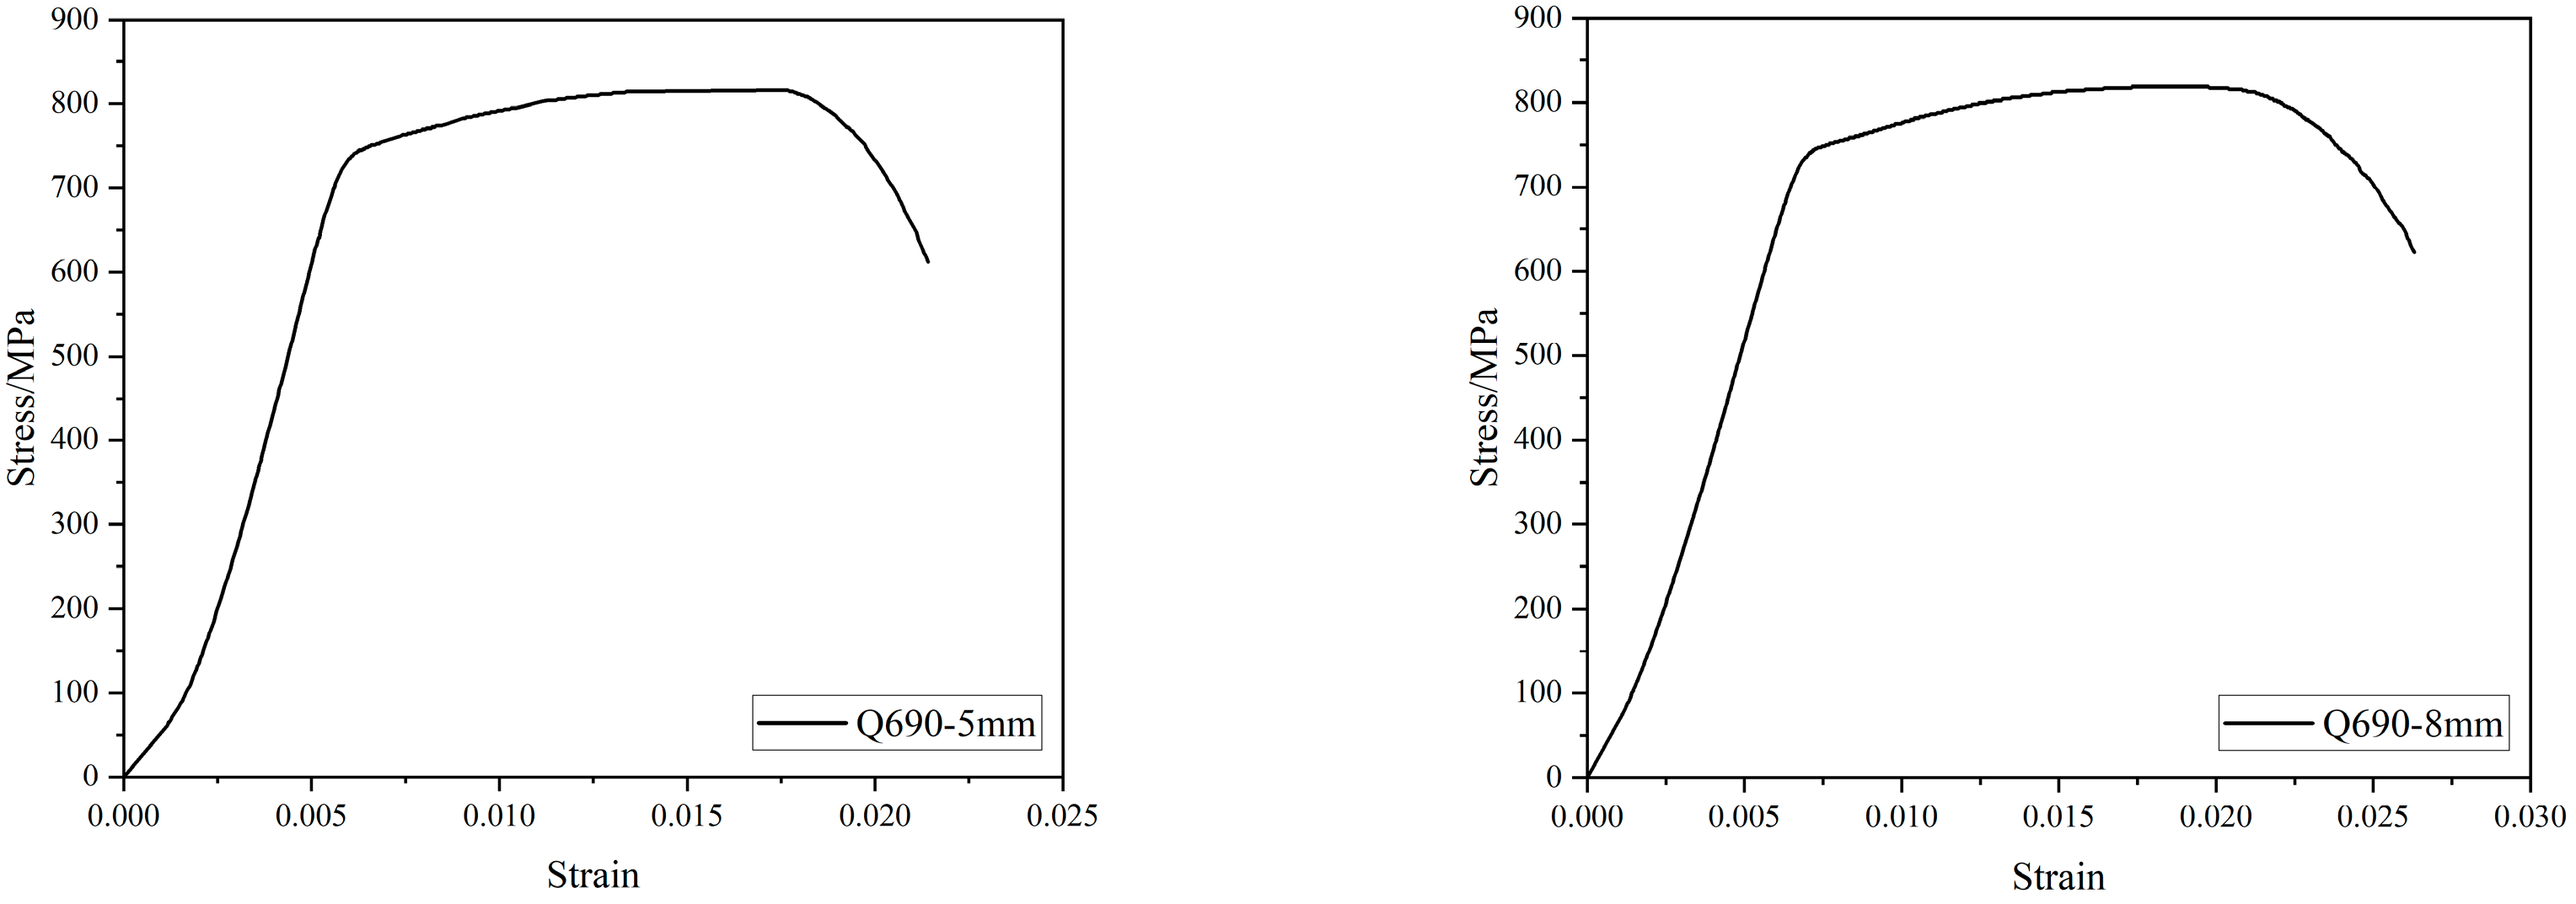
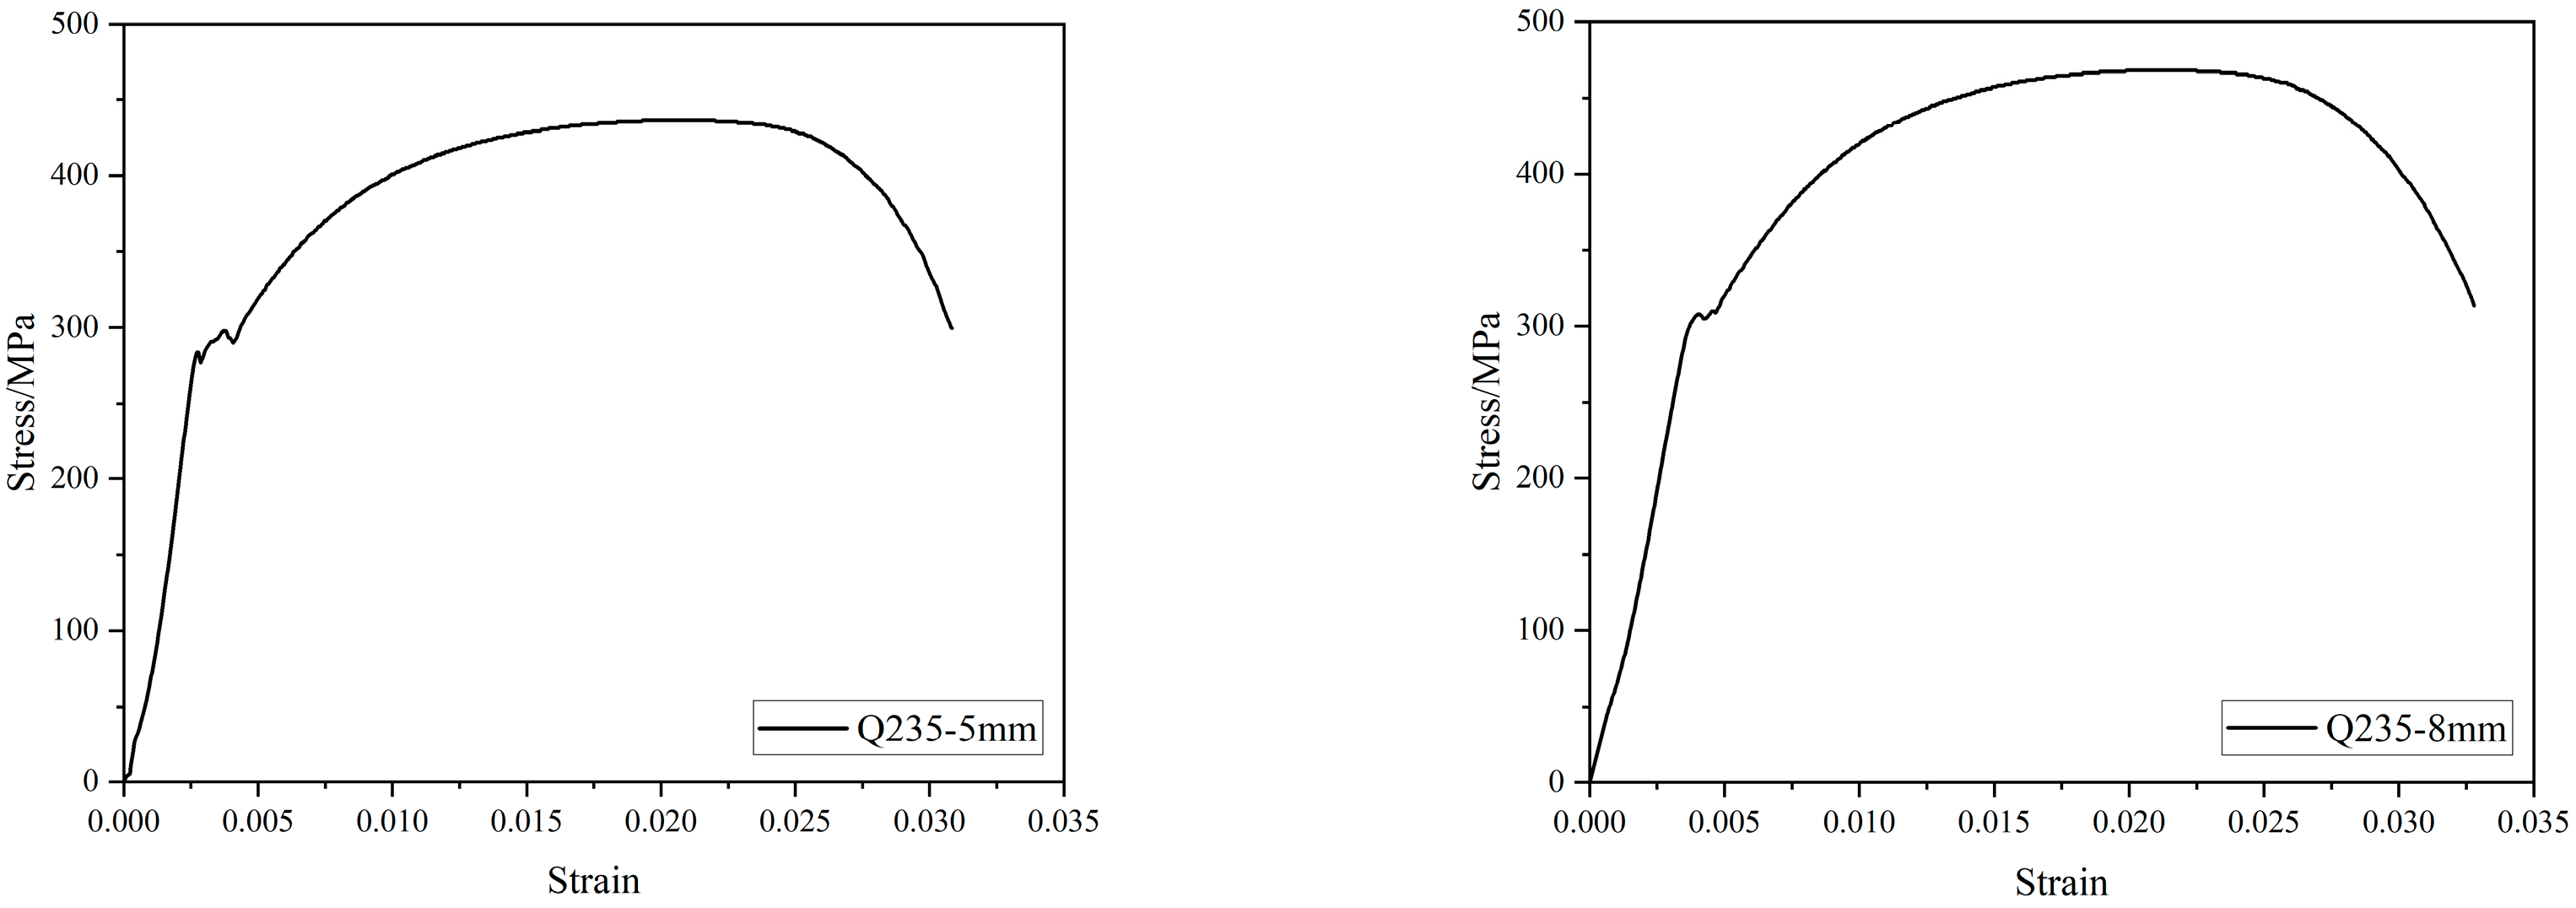
2.2. Material Properties
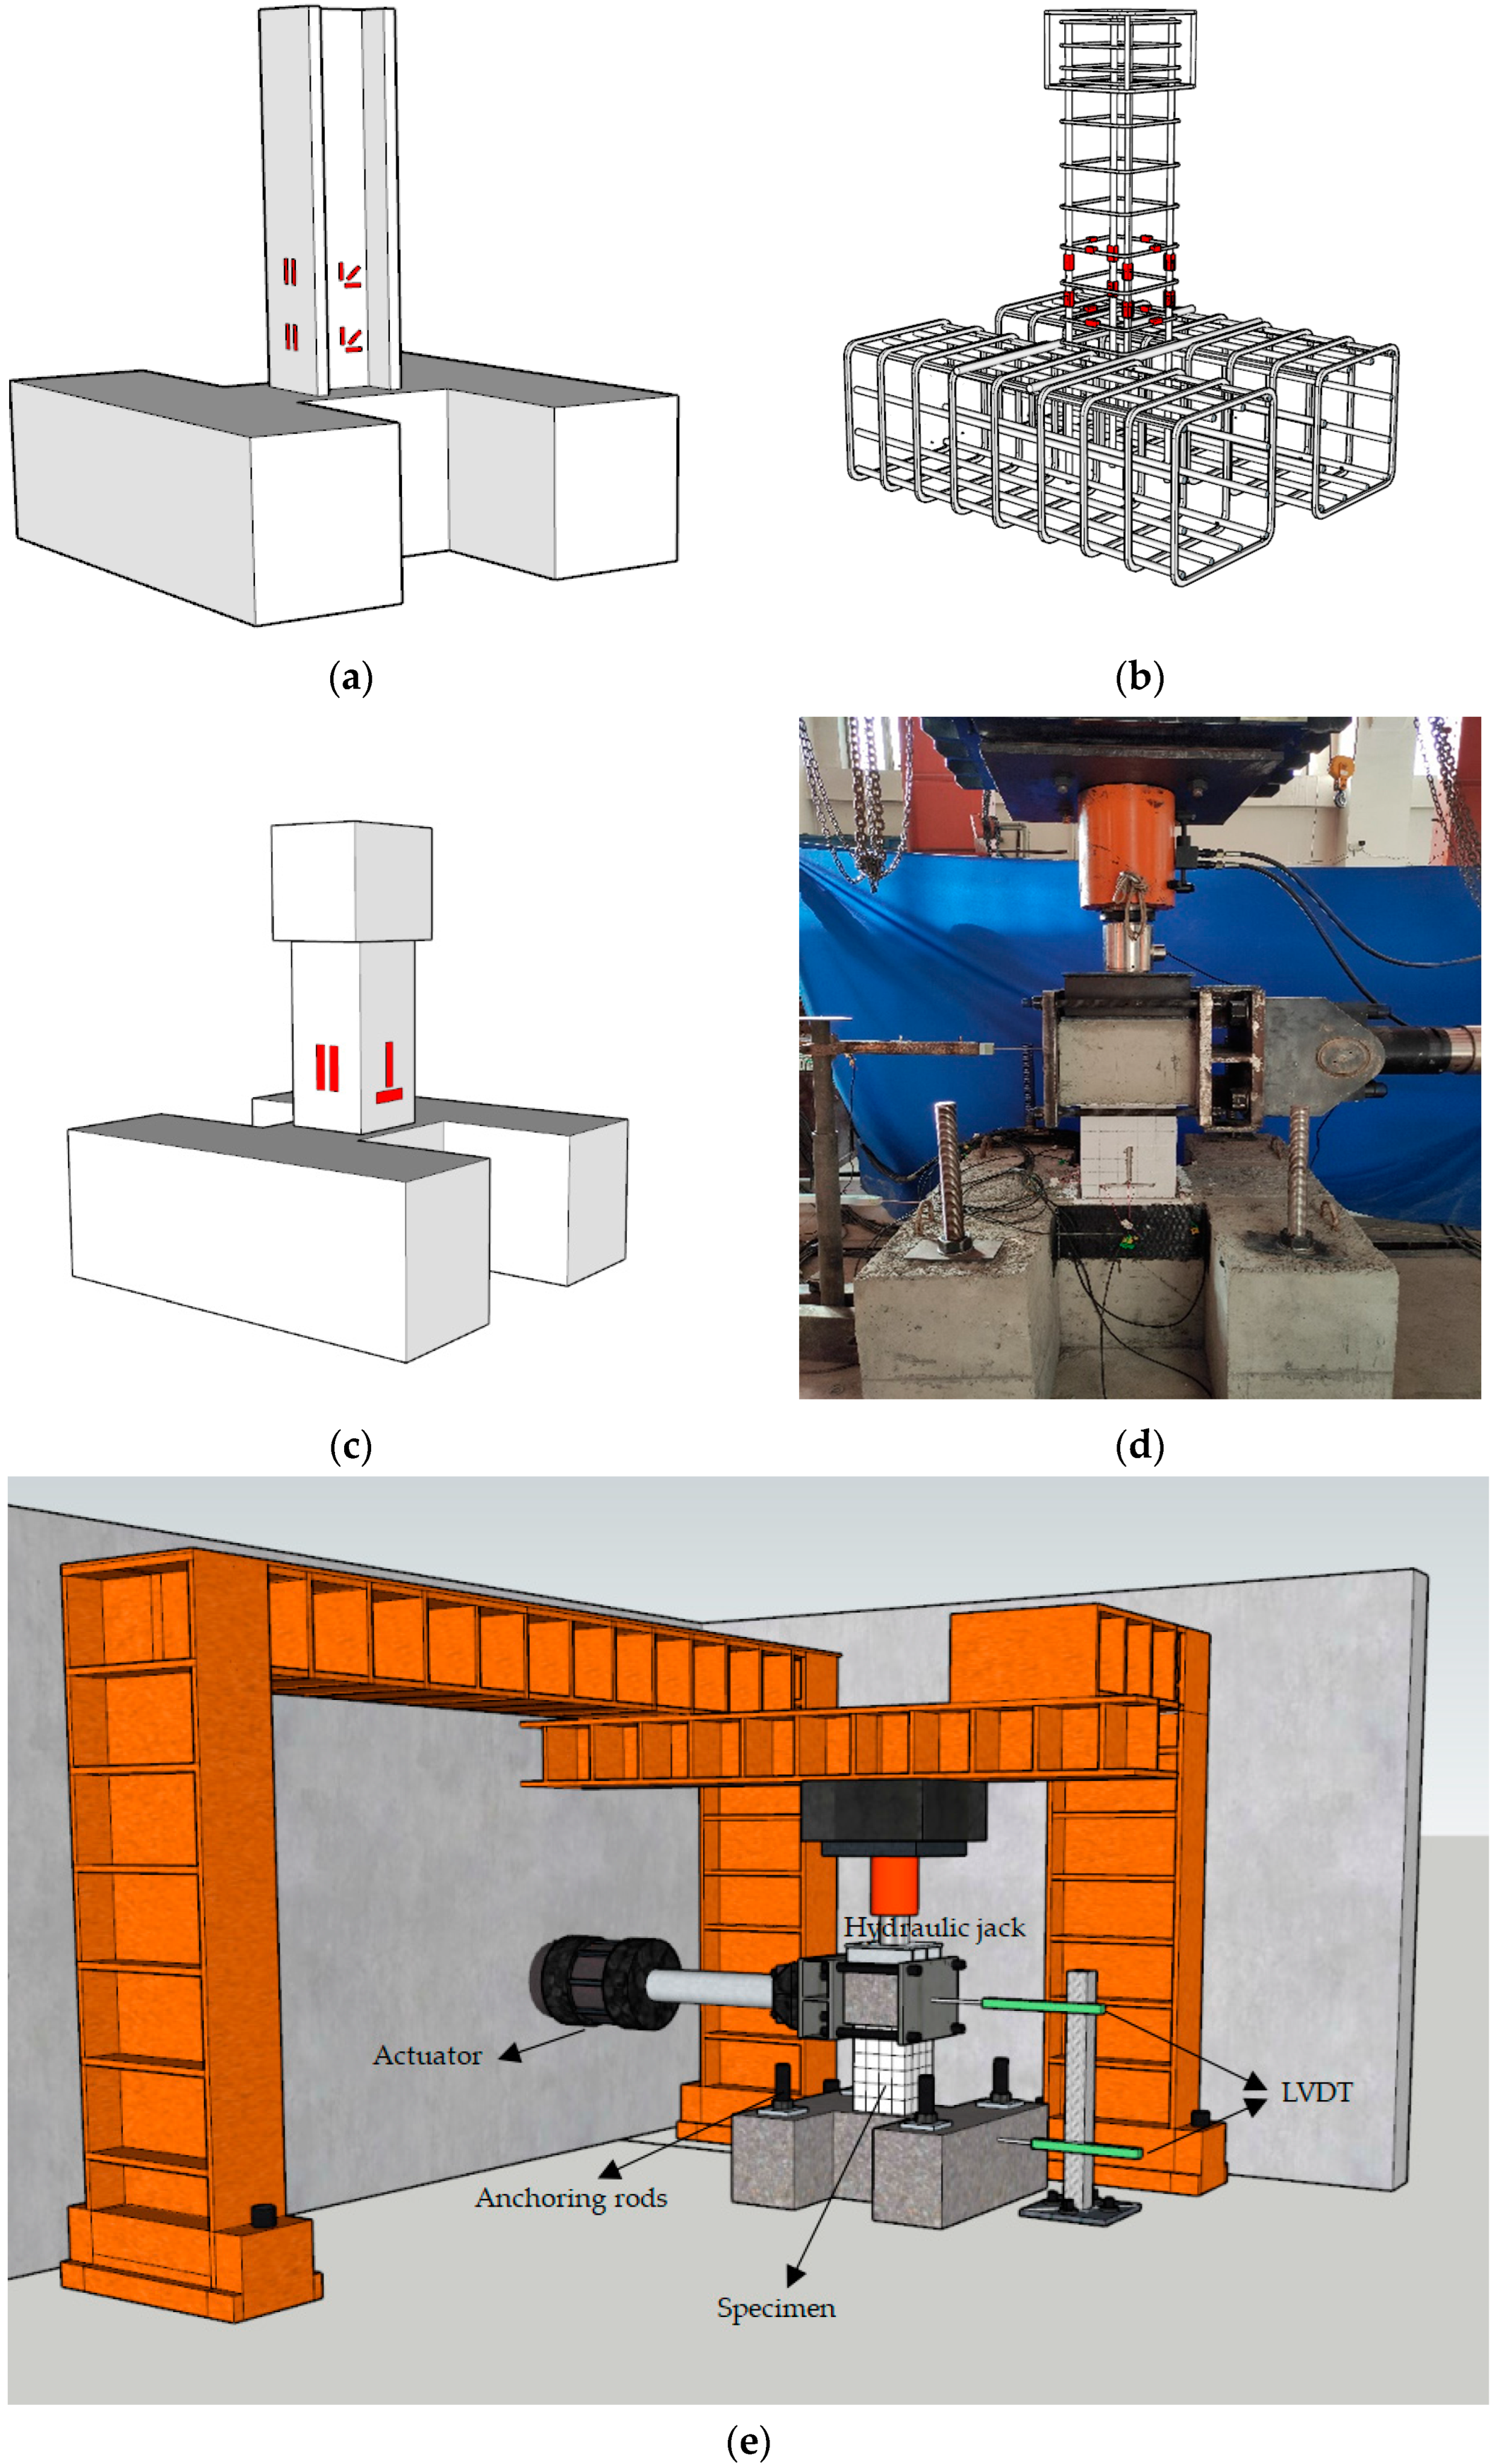
2.3. Test Setup and Procedure
2.4. Data Acquisition
3. Specimen Failure Characteristics
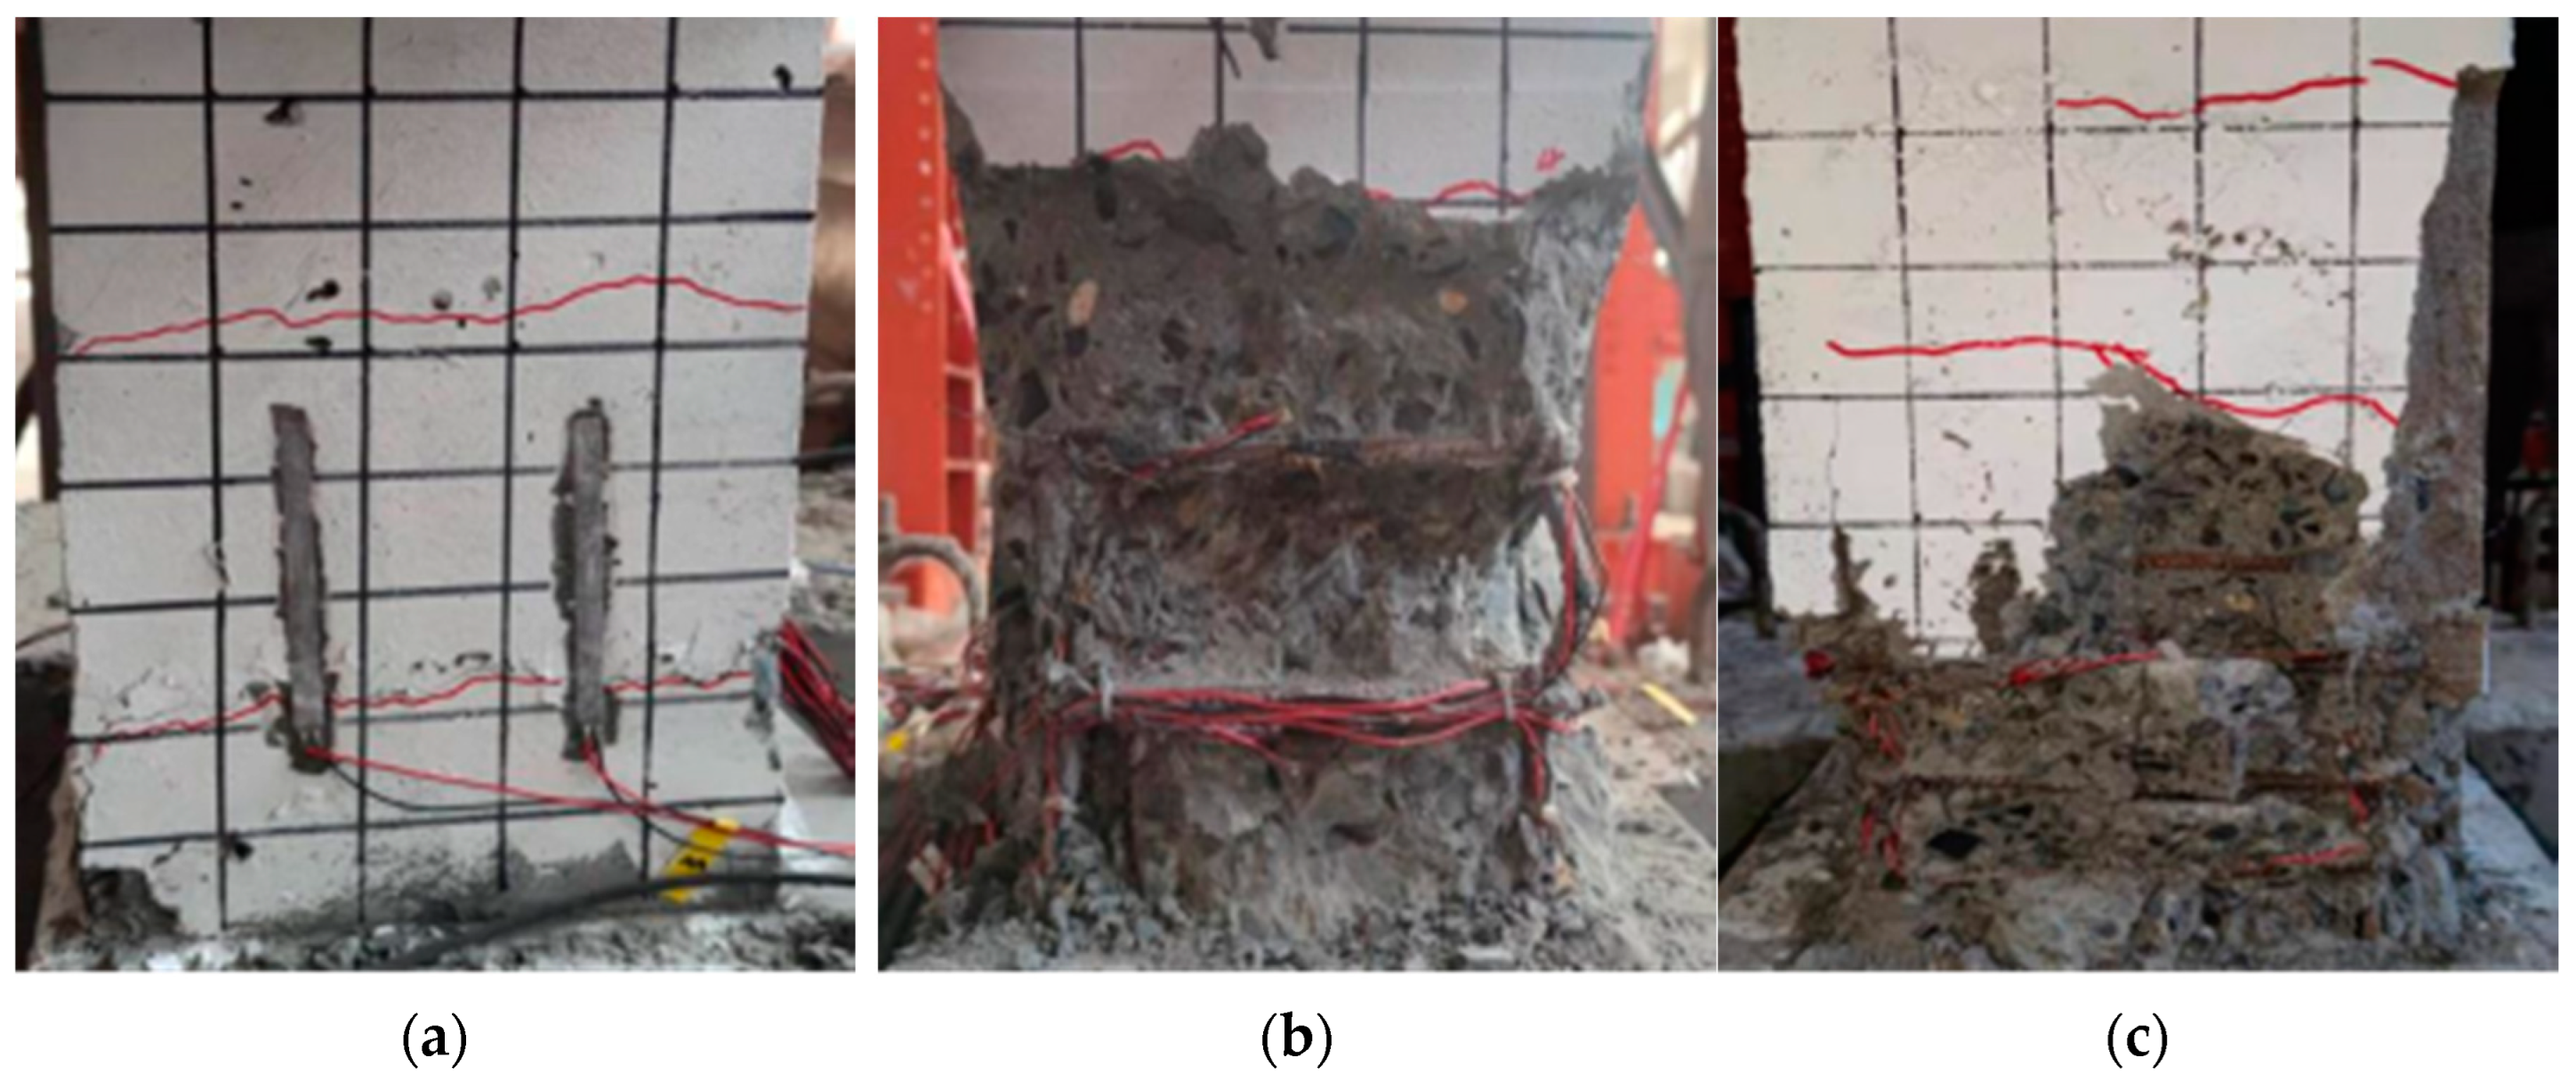
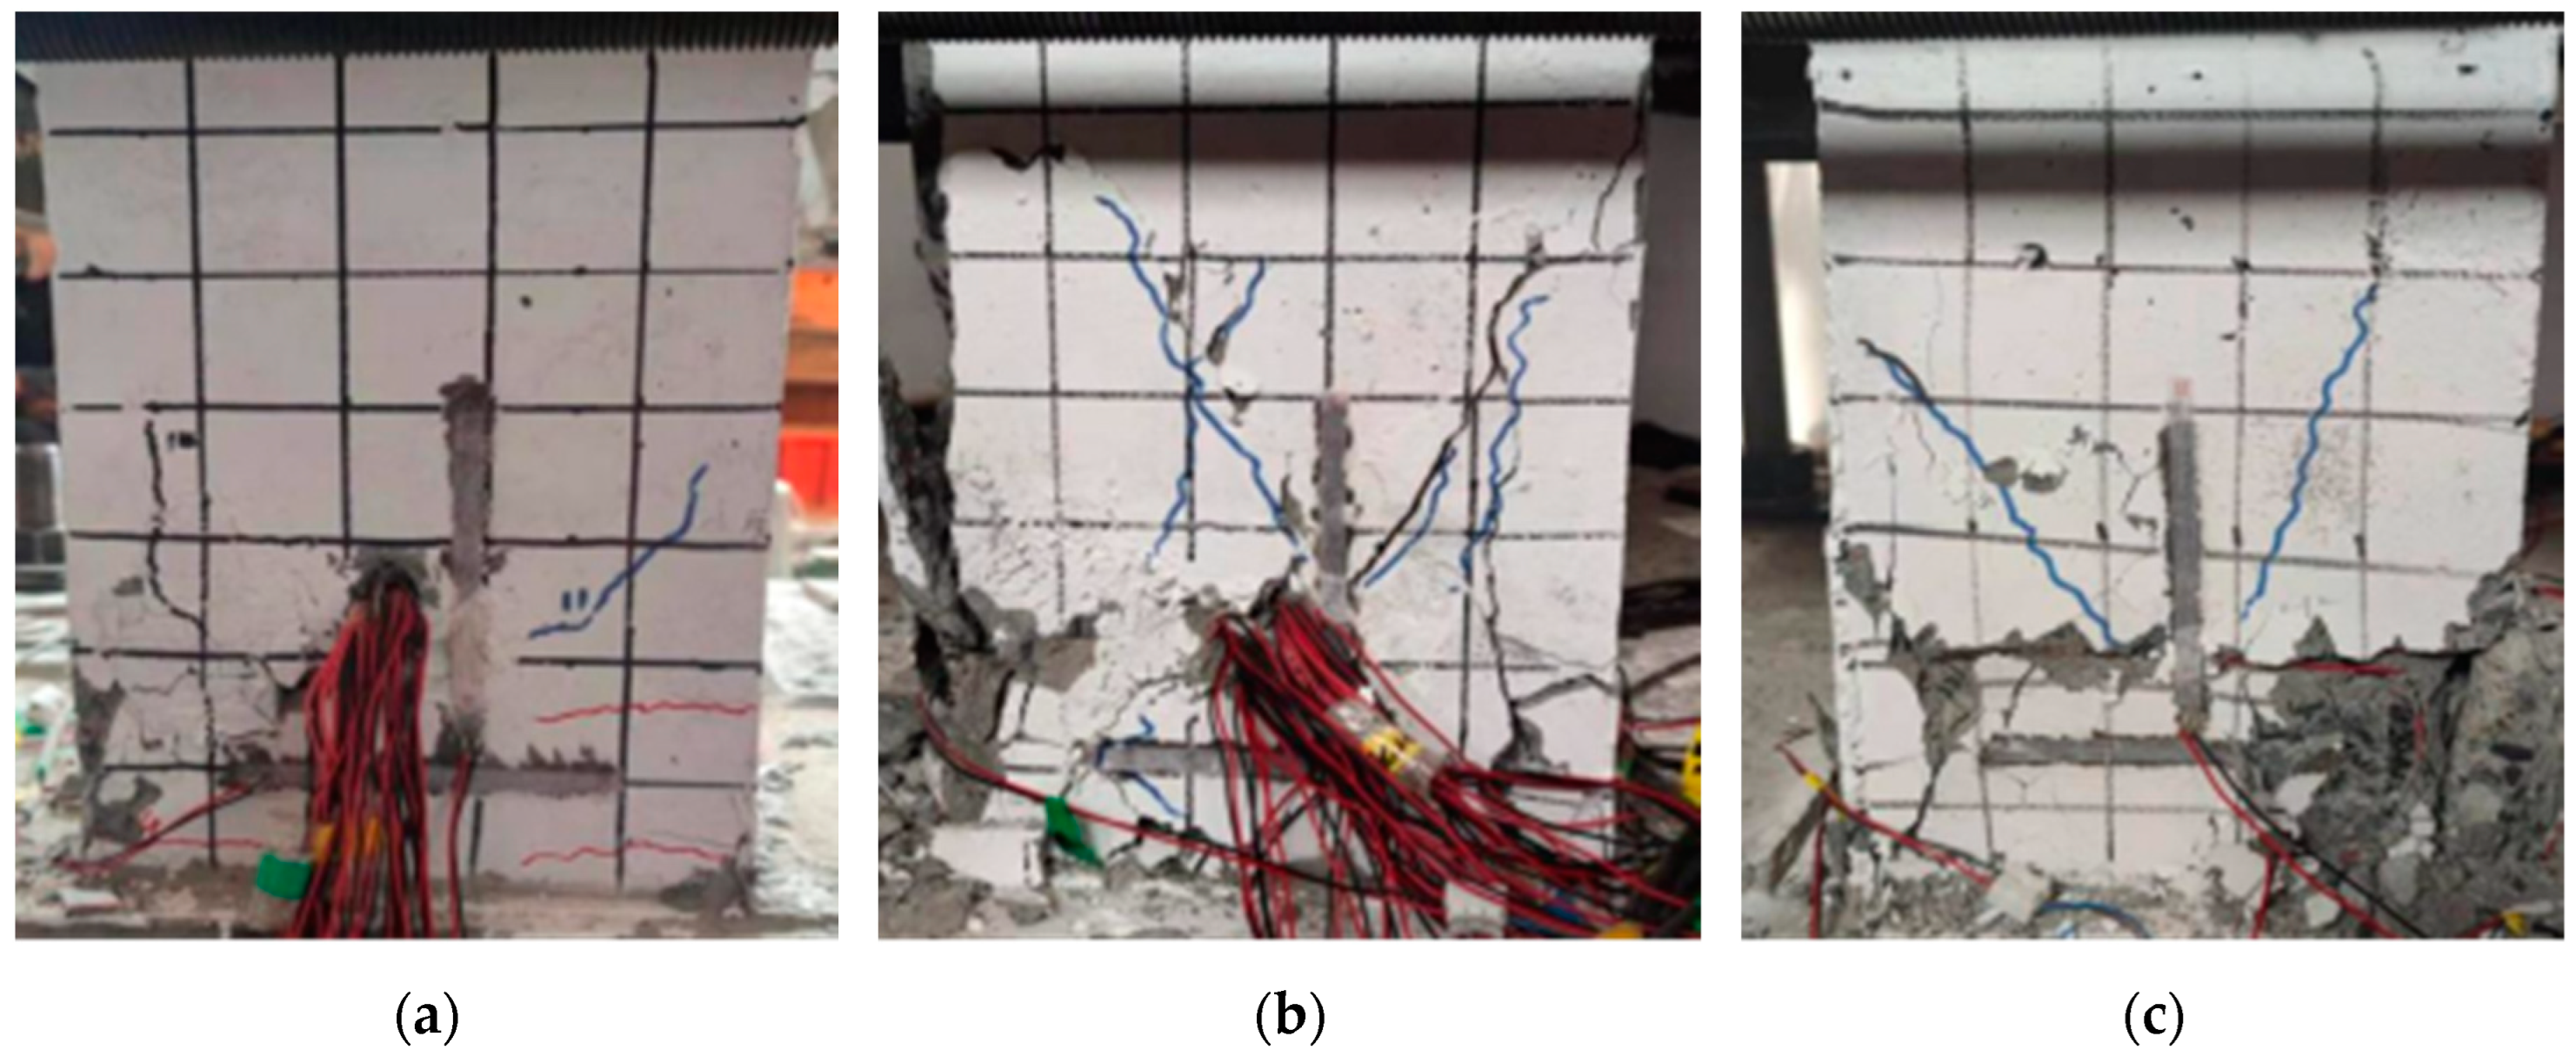
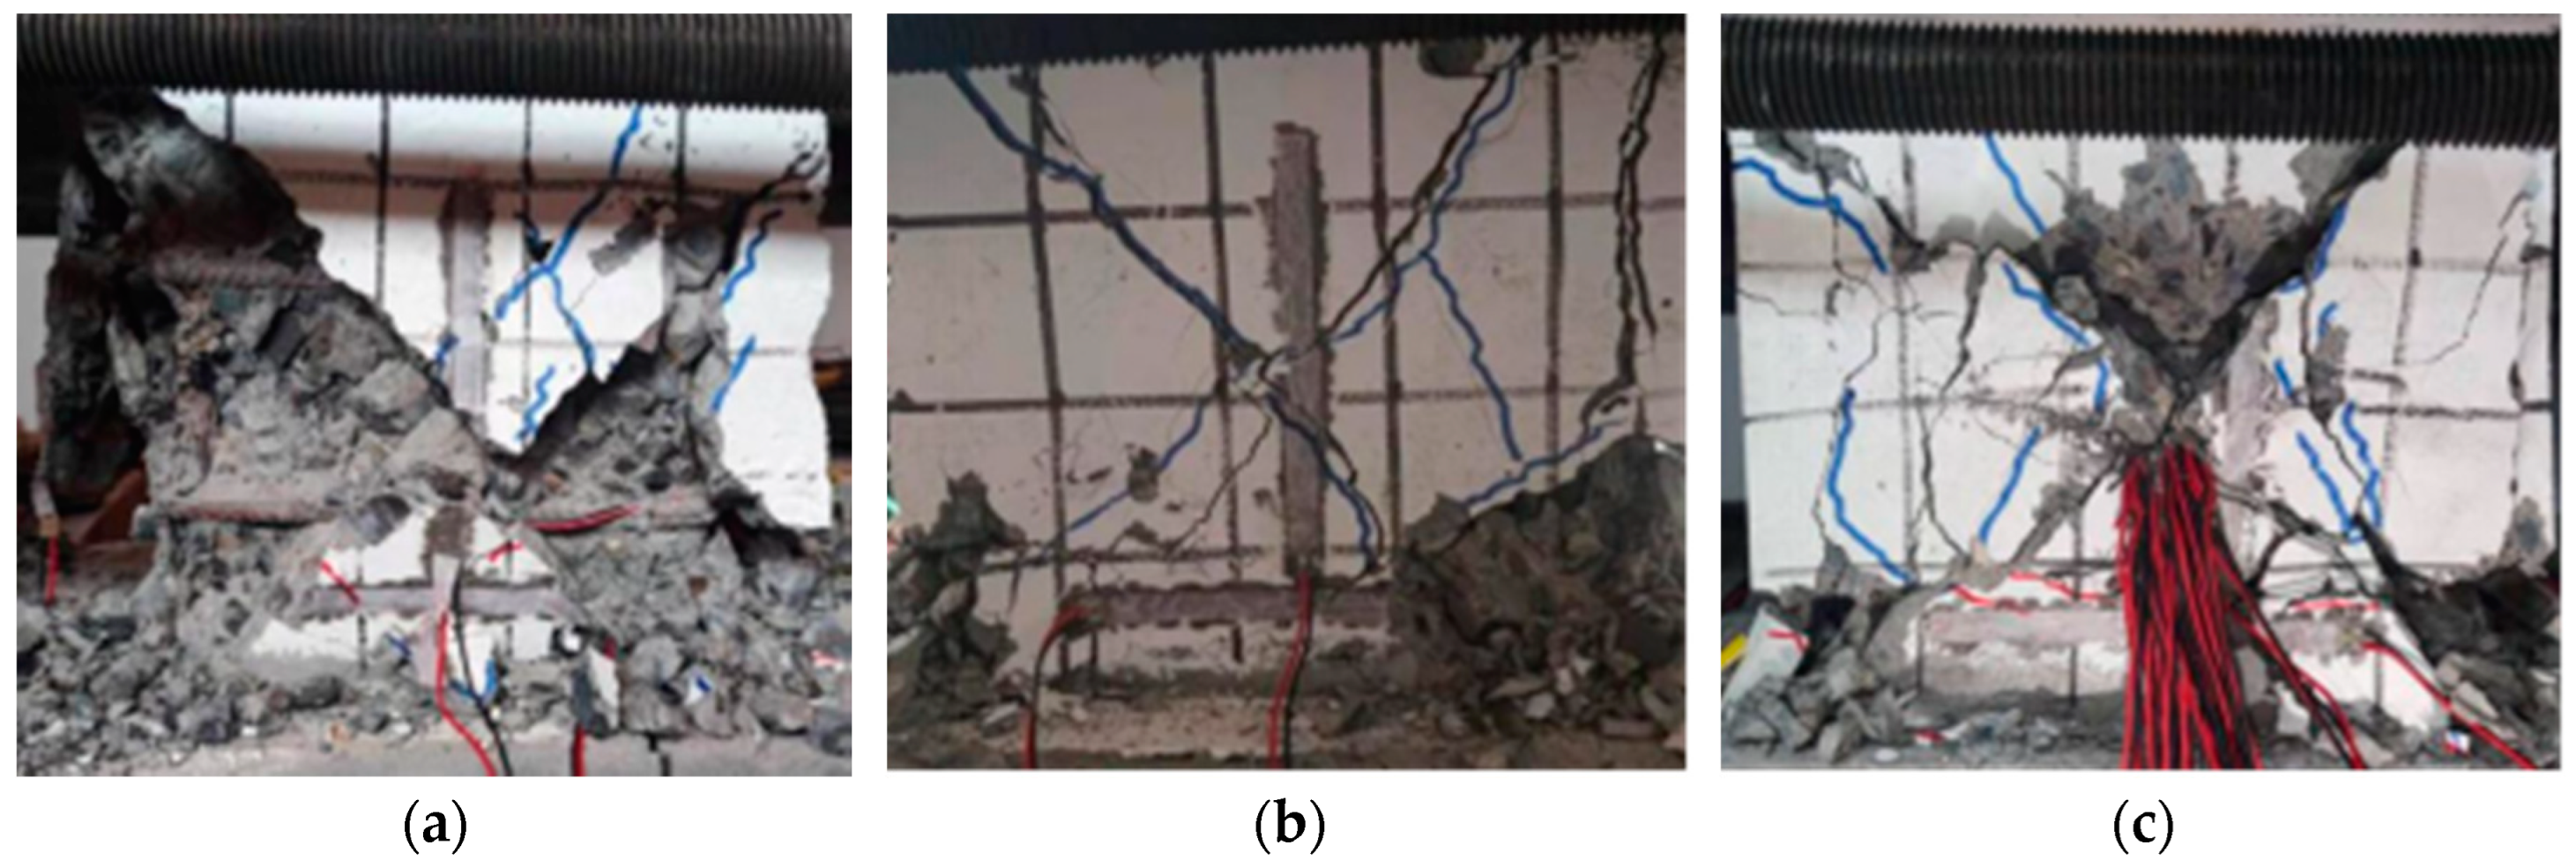
3.1. Bending Failure
3.2. Shear Bond Failure
3.3. Shear Baroclinal Failure
4. Test Results and Analysis
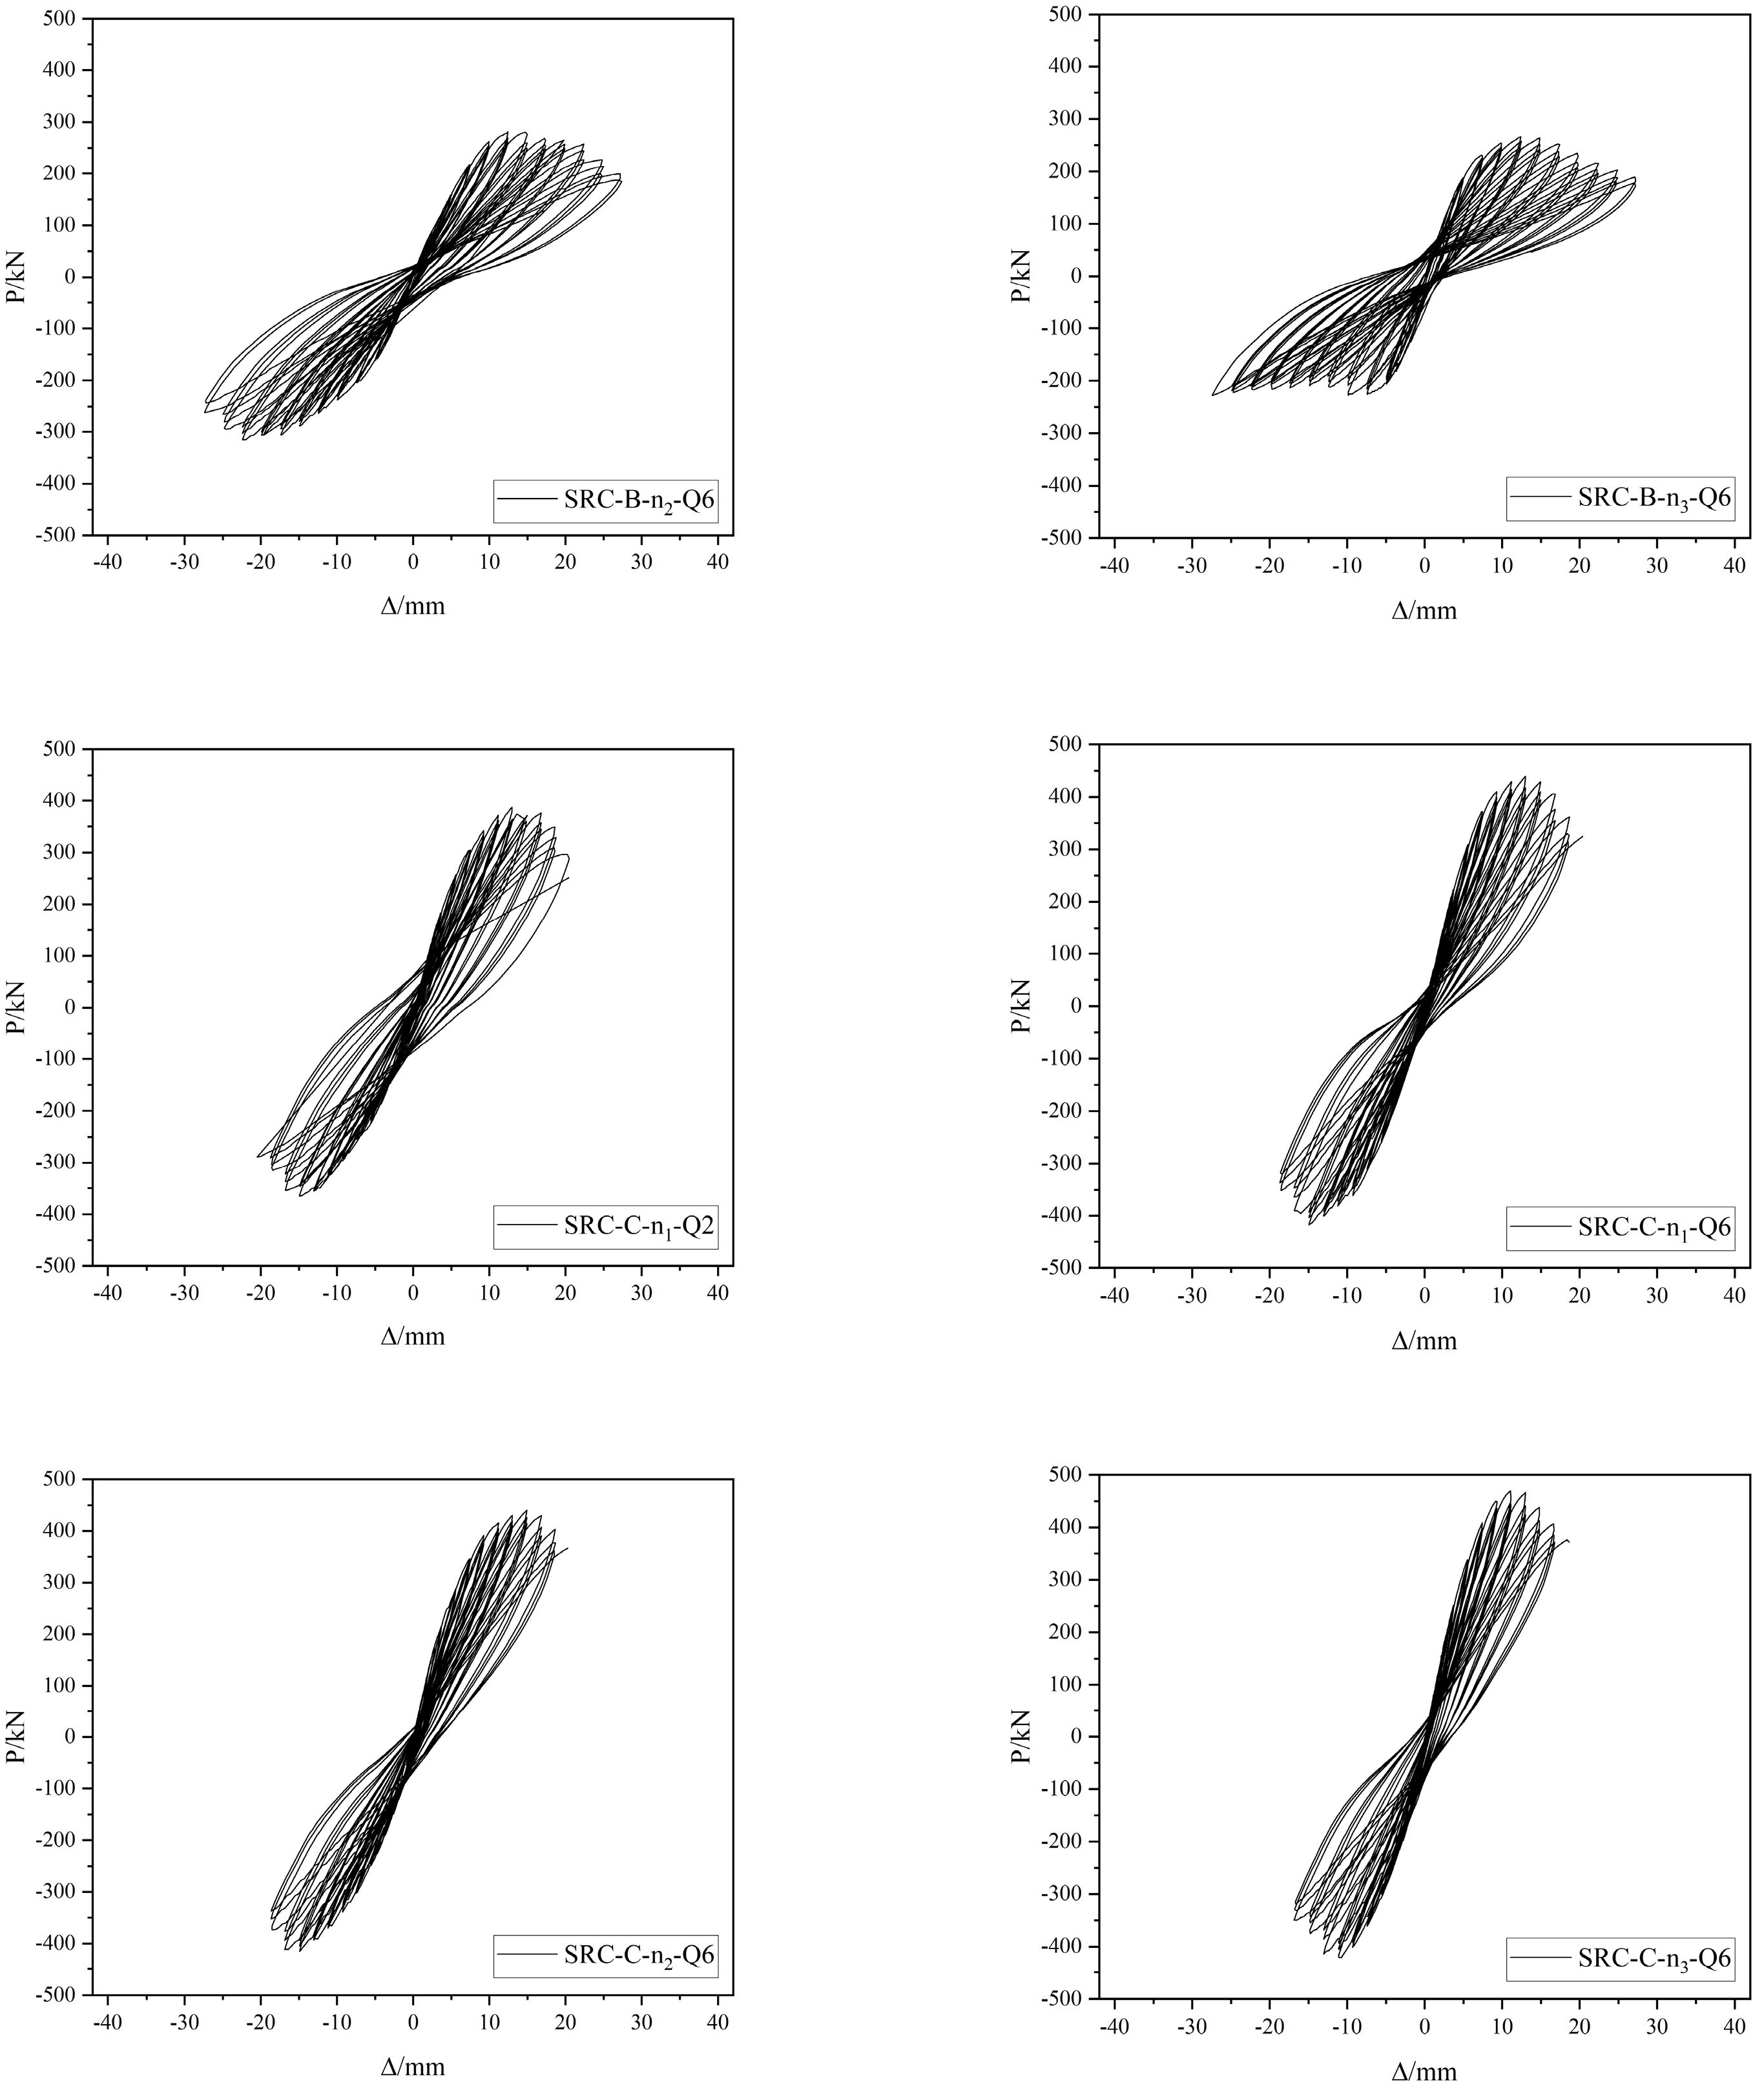
4.1. Hysteresis Curves
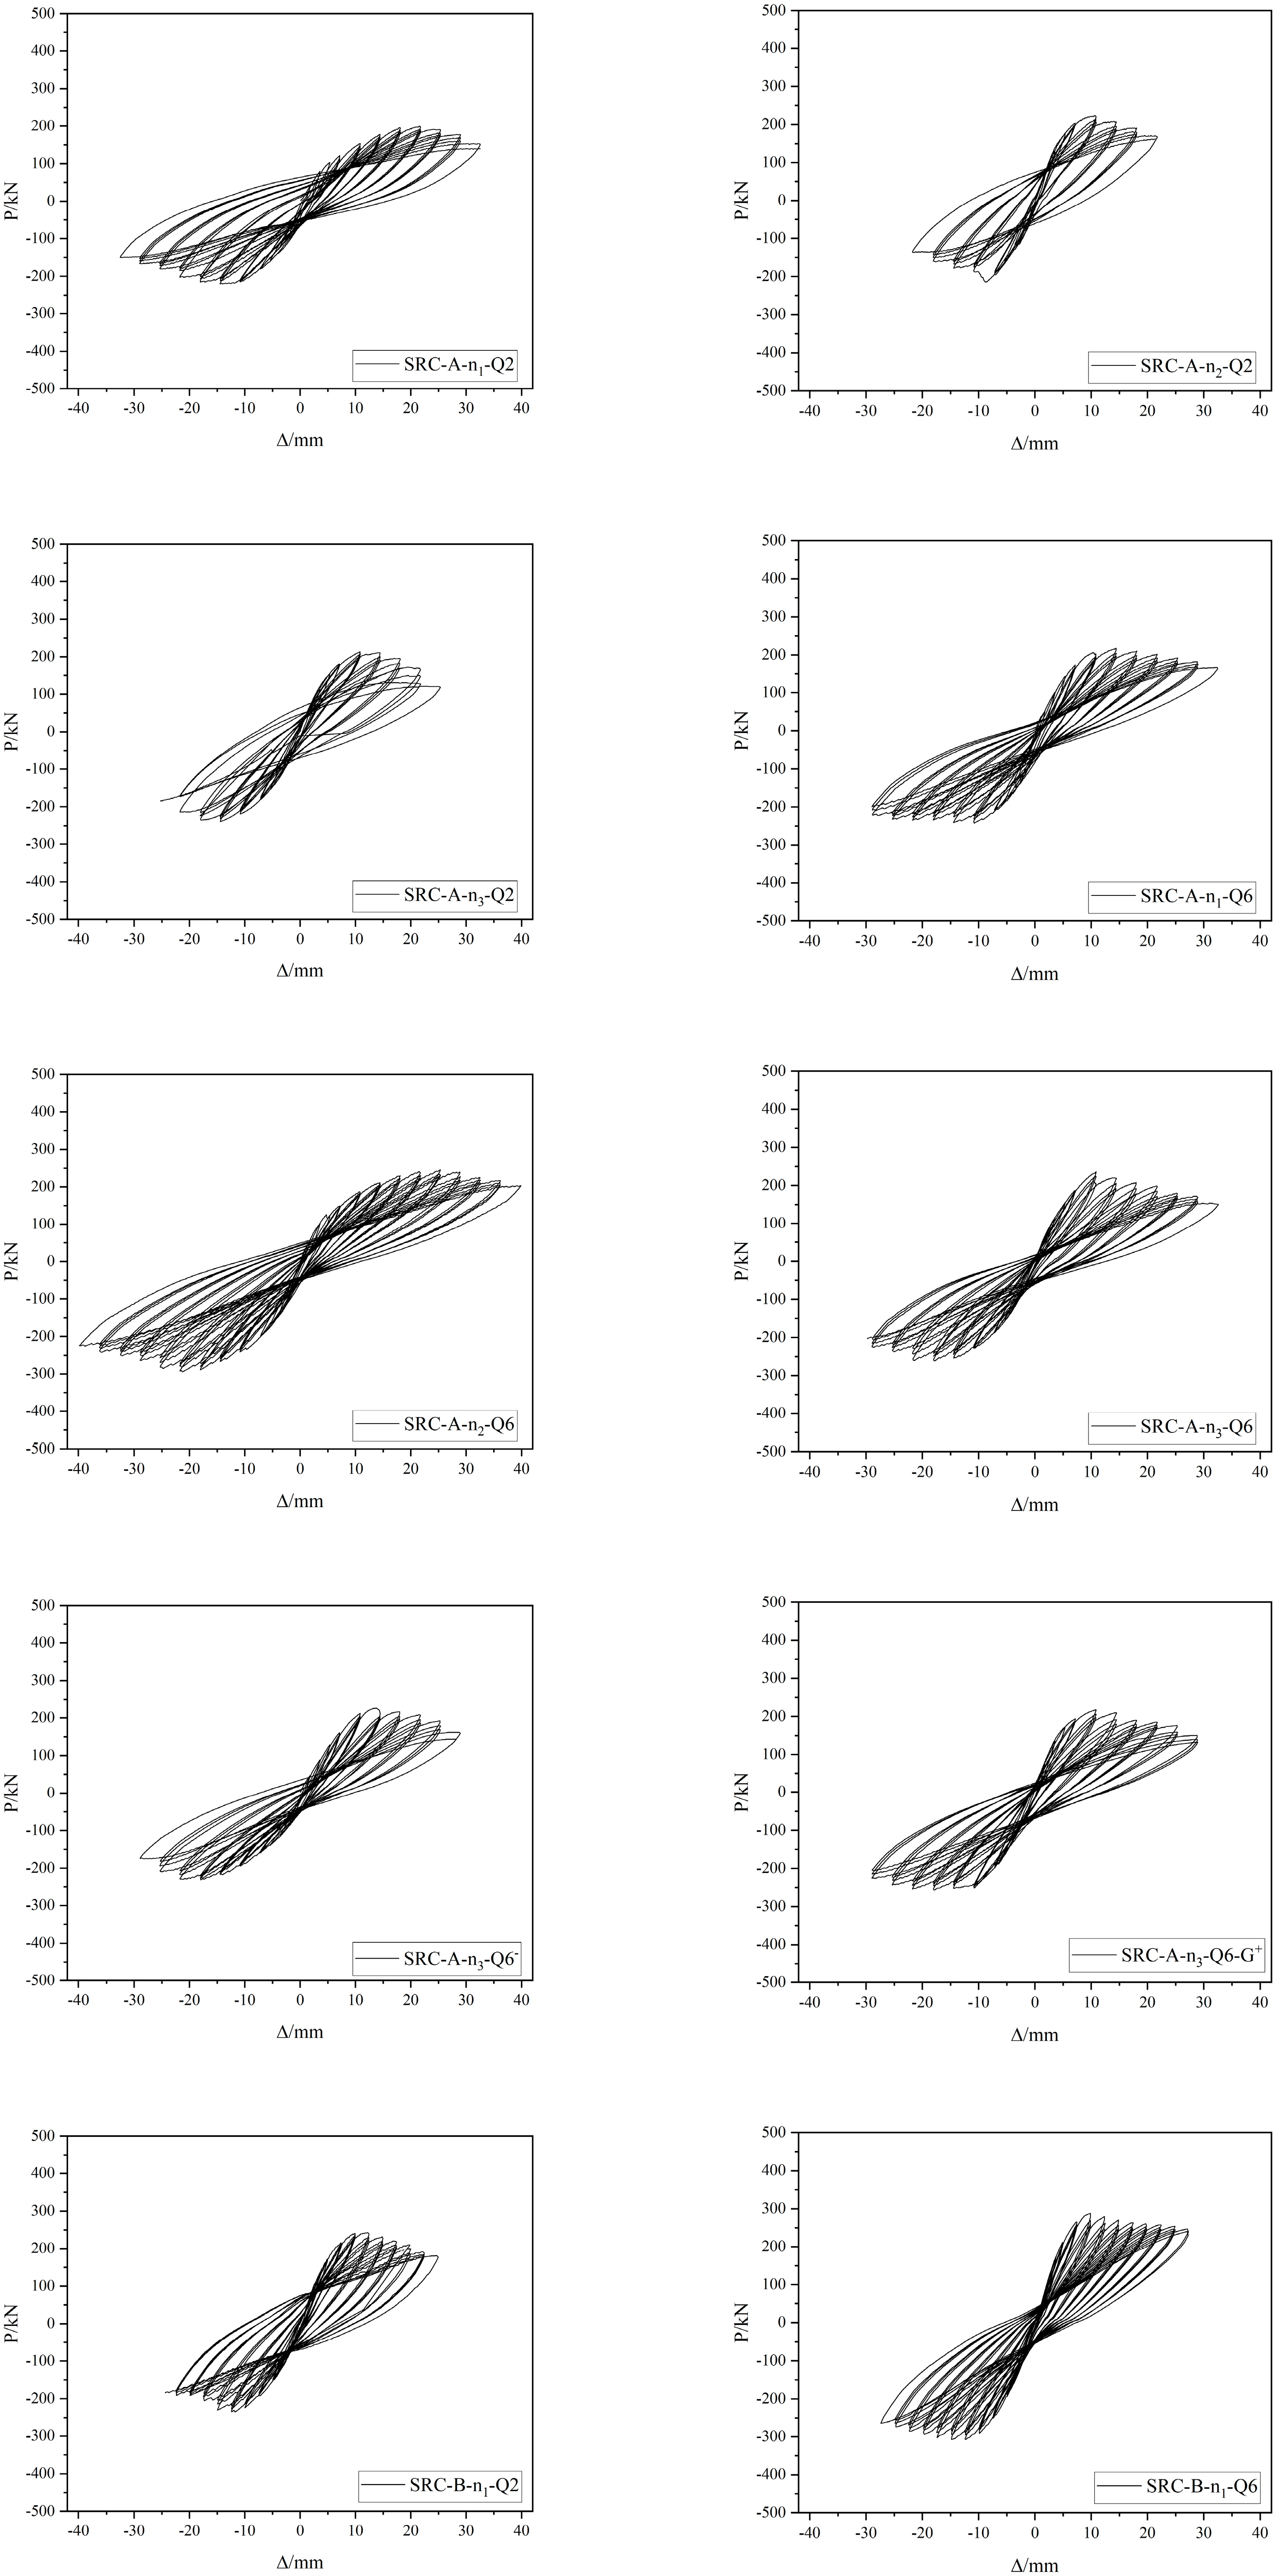
- When the horizontal load is less than the cracking load, the P–Δ curve is straight, and the specimen is basically in the elastic stage; as the load increases, the P–Δ curve gradually deviates from the straight line, the deformation accelerates, residual deformation occurs when unloading, and the specimen enters the elastic–plastic stage. When the load reaches the yield load, the slope of the loading curve decreases with increasing displacement, and the magnitude of the decrease gradually accelerates. In the three cycles of the same displacement control loading stage, the slope and maximum load of the latter loading curve are smaller than those of the previous one, and with an increasing number of cycles, the stiffness and bearing capacity attenuate significantly. After reaching the ultimate load, the unloading curve is steep, the deformation recovery is small, and the displacement lags significantly.
- Under the same conditions for the other parameters, the specimens with a large shear span ratio bear a less ultimate horizontal load, the horizontal load decays slowly, the hysteresis loop is relatively full, the number of cycles experienced during a failure is large, and the horizontal displacement is large. As the shear span ratio decreases, the hysteresis curve of the specimen shrinks, and the specimen should be strengthened with structural measures to achieve better performance.
- When the built-in Q690 steel is damaged, compared with the built-in Q235 steel, the ultimate horizontal bearing capacity is greater and the hysteresis loop is slightly narrower, but the section steel bears most of the horizontal shear and vertical loads in the later stage of loading. Therefore, the stability and ultimate deformation of the built-in Q690 steel specimen are relatively large.
- The ultimate load of the specimen with the larger axial pressure is larger, but after reaching the ultimate load, the load decays faster and the overall damage is faster. However, when the specimen with the built-in Q690 steel is damaged, it will bear more cyclic loads, and the load decays more slowly.
- The specimens with a larger steel content and hoop ratio have fuller hysteresis loops, more loading cycles, stronger deformation capacity at failure, larger limit displacement, and stronger energy dissipation capacity.
4.2. Skeleton Curves
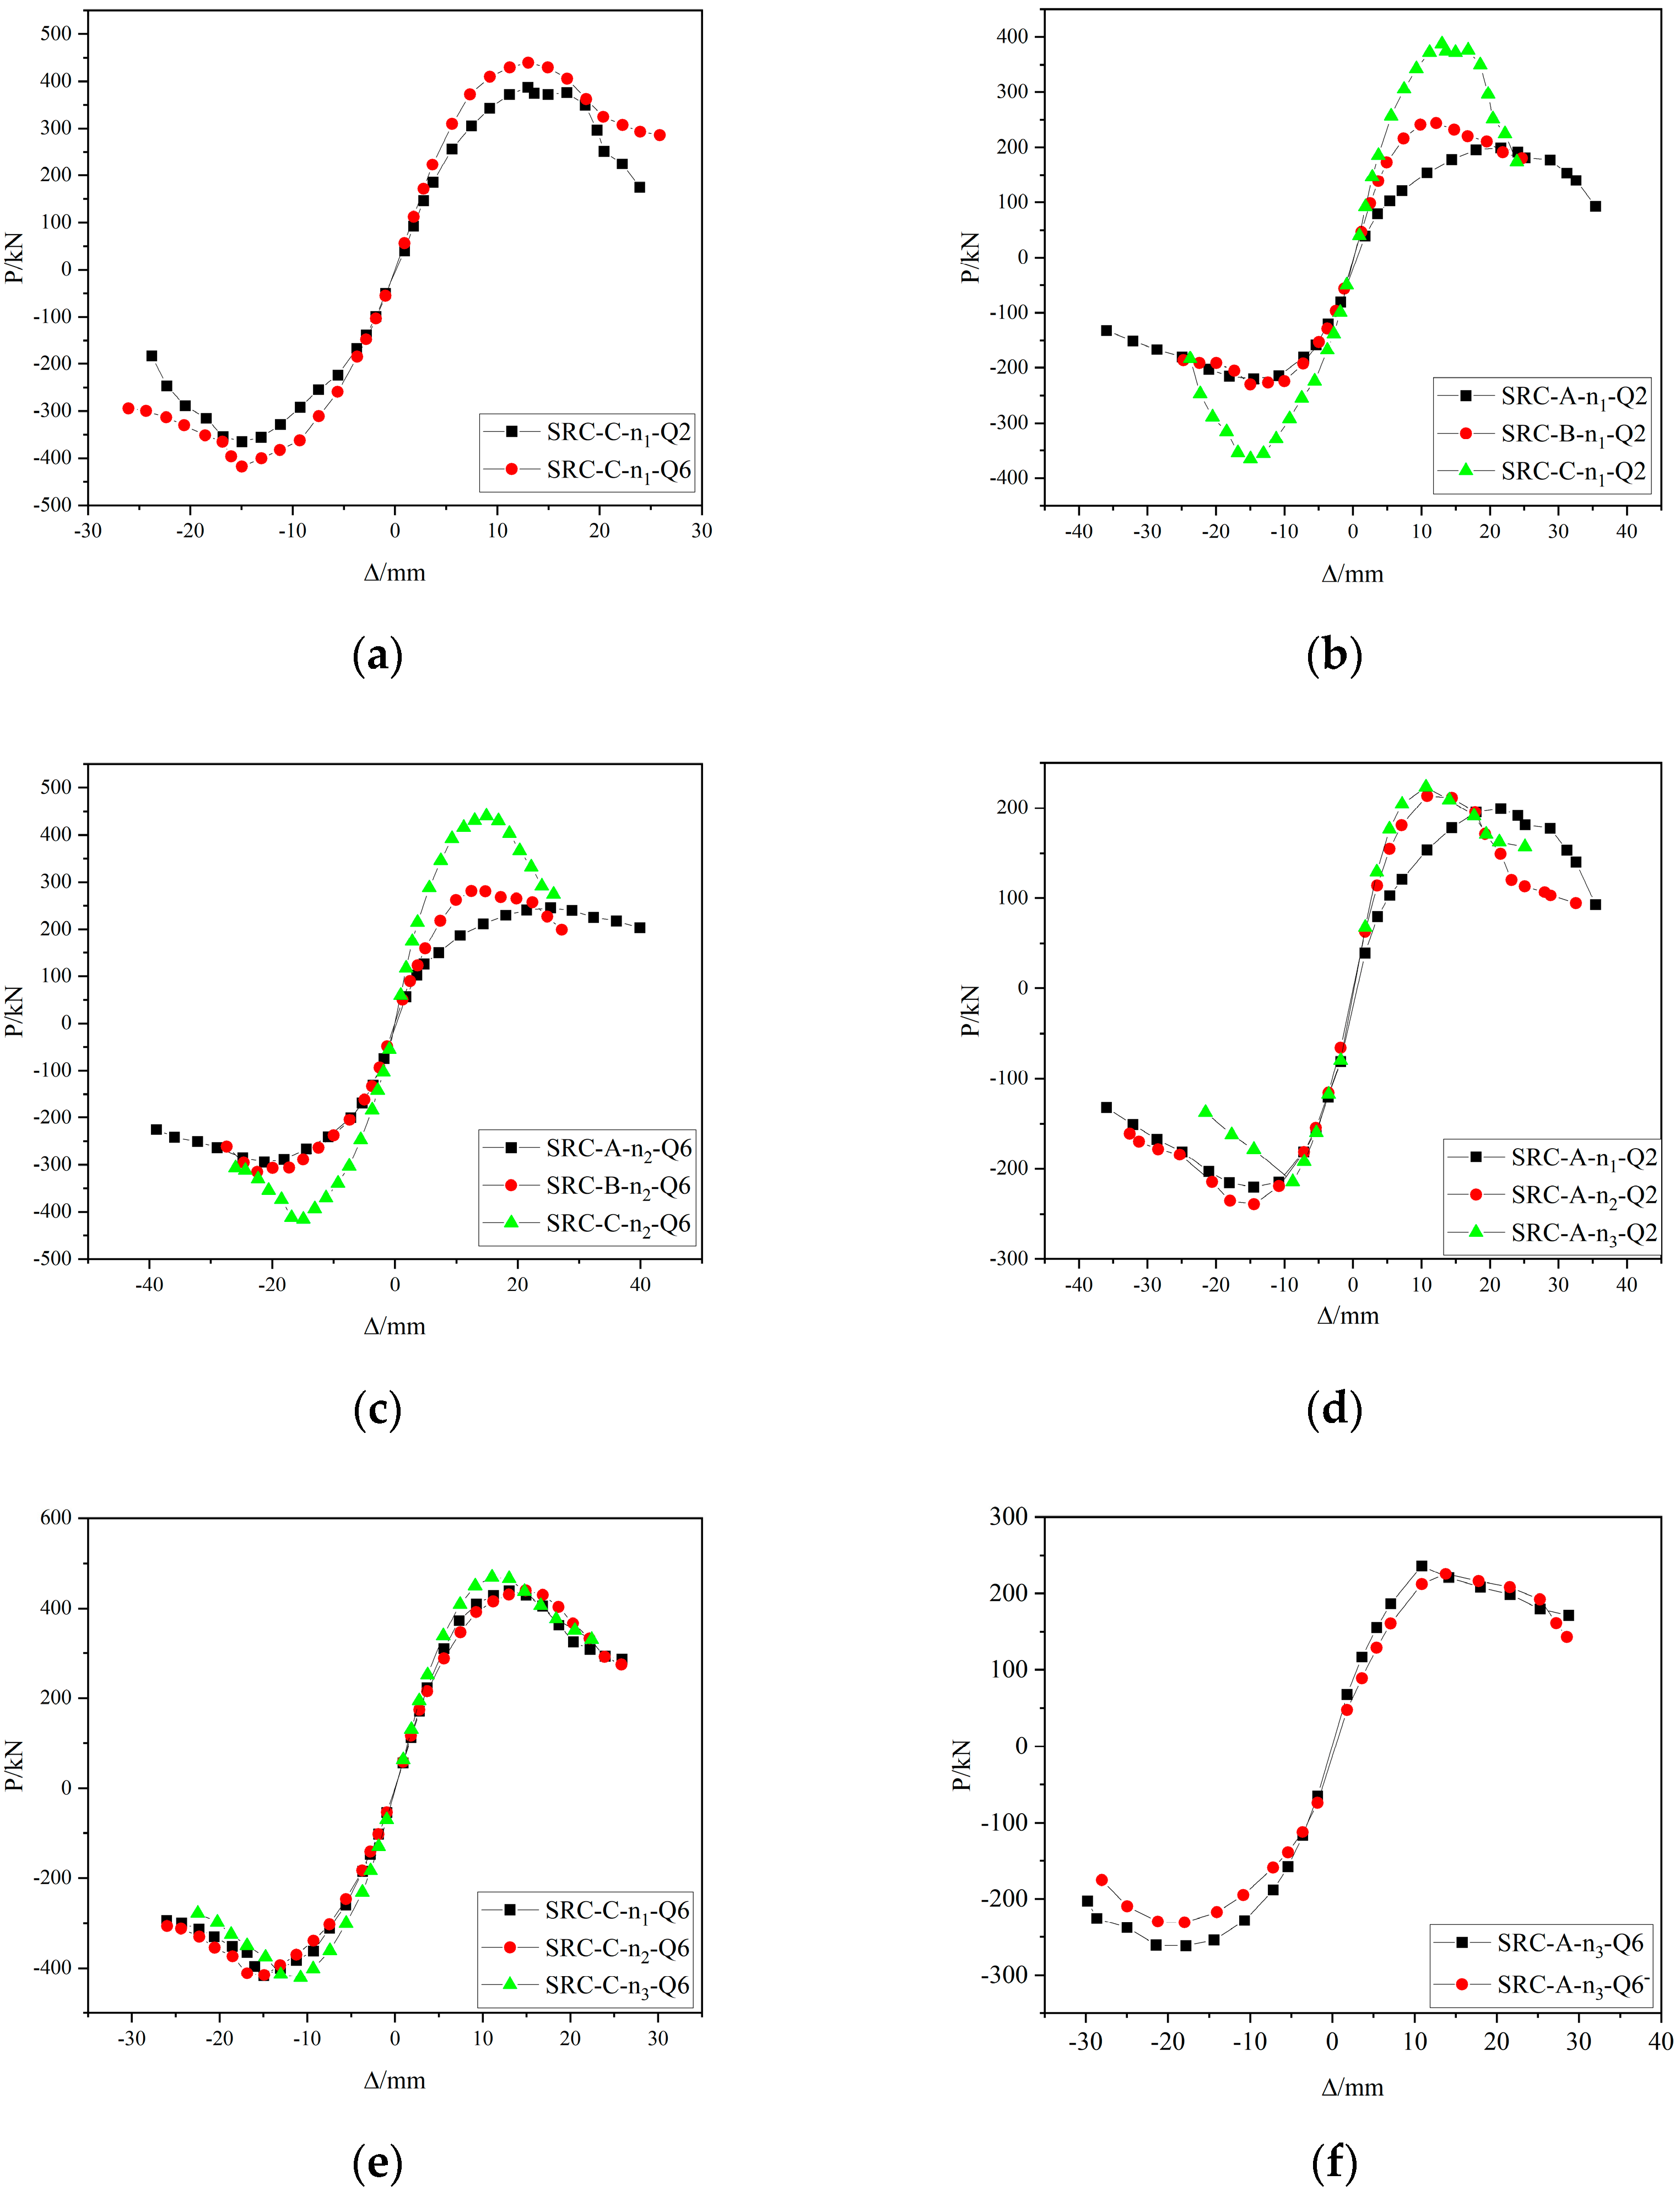
- The stress process of each specimen can be divided into four stages: elasticity, concrete cracking elastoplasticity, section-steel yielding, and failure. Compared to ordinary SRC frame columns, due to the built-in high-strength steel, the ultimate load of the specimen is increased, and it provides better ductility and deformation capacity. The descending section of the skeleton curve is relatively gentle, the load decays slowly, and the plastic deformation ability is strong. The influence of steel strength on the skeleton curve is shown in Figure 9a.
- The influence of the shear span ratio of the specimen on its stress is mainly reflected in the failure form and the ultimate bearing capacity. Both ordinary SRC frame columns and HSRC frame columns show the following: With an increasing shear span ratio, the specimens successively suffered a shear oblique failure, shear bond failure, and bending failure, and the bearing capacity in turn decreased. The ascending and descending sections of the skeleton curve tend to be gentle, the limit displacement increases gradually, and the ductility increases. The effect of the shear span ratio on the skeleton curve is shown in Figure 9b,c.
- With an increasing axial compression ratio, the ultimate bearing capacity of the specimen increases, and the decay speed becomes faster after reaching the ultimate load, resulting in a steeper descending section of the skeleton curve of the specimen, poor plasticity, and reduced ductility. However, the decay rate of the HSRC frame column is slower than that of the ordinary SRC frame column after reaching the ultimate load for different axial compression ratios, which reflects better plastic deformation capacity. The effect of the axial compression ratio on the skeleton curve is shown in Figure 9d,e.
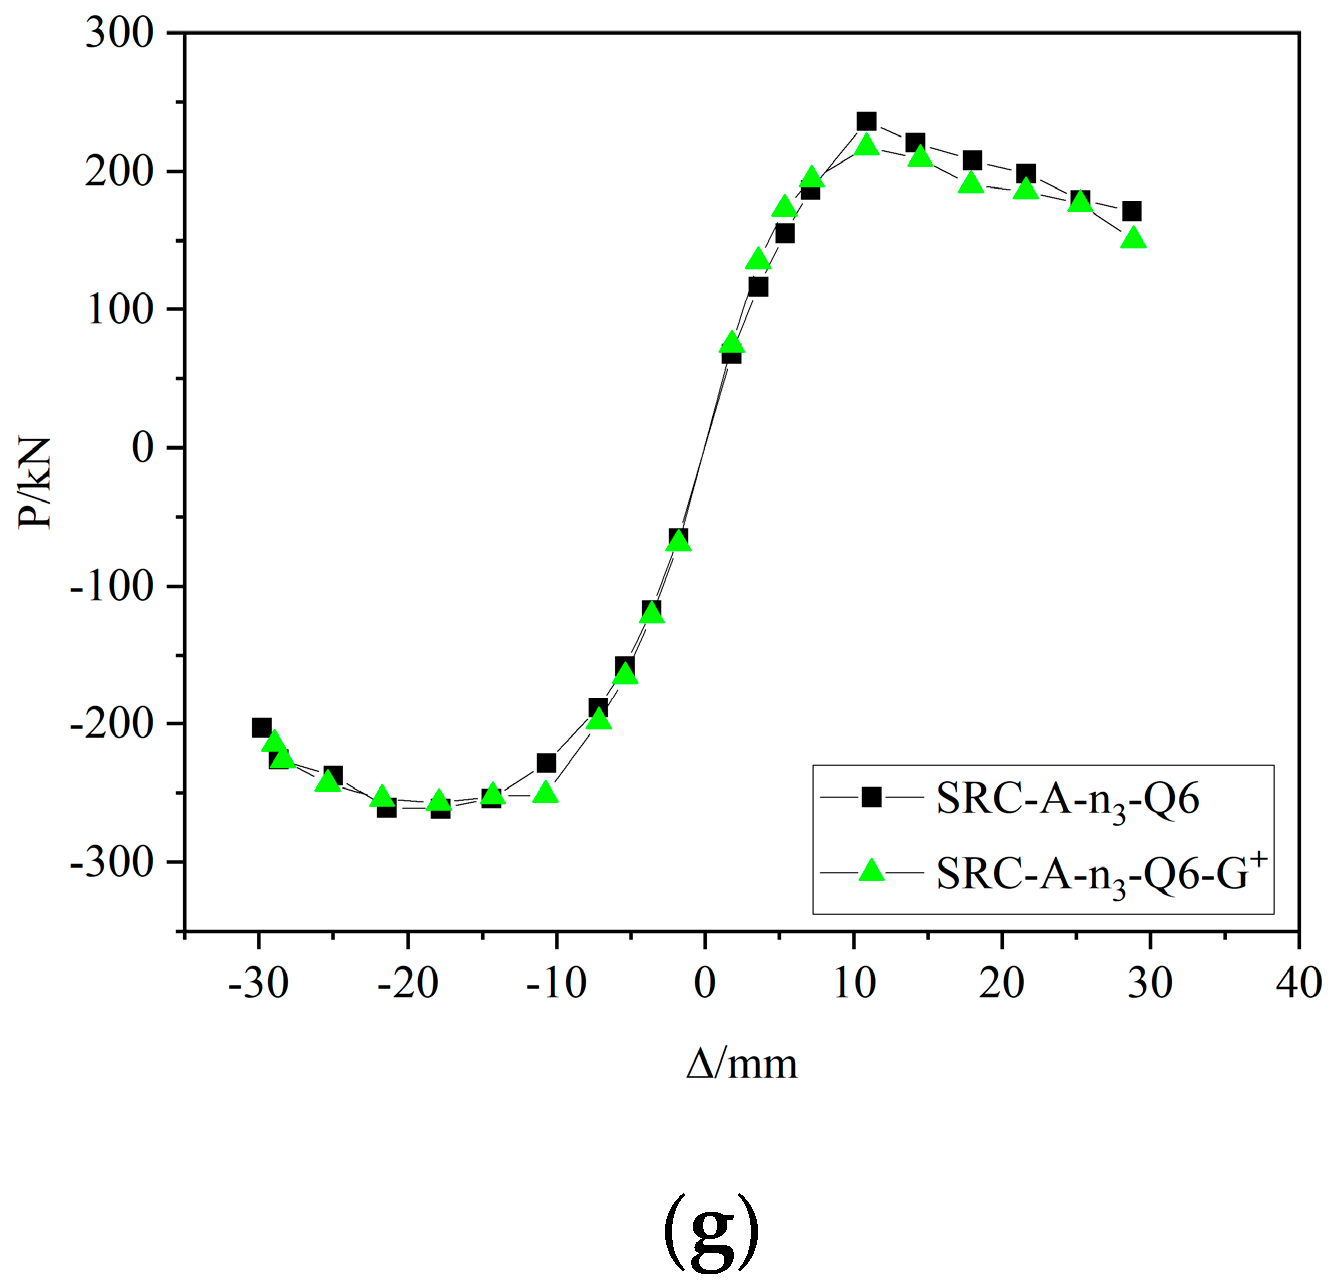
- The influence of SRC-A-n3-Q6− with a small steel content and SRC-A-n3-Q6-G+ with a larger hoop ratio on the skeleton curves of the specimens is shown in Figure 9f,g. With increasing hoop ratio and steel content, the ultimate deformation capacity of the specimen increases, and the descending section of the skeleton curve tends to be gentle.
4.3. Displacement Ductility
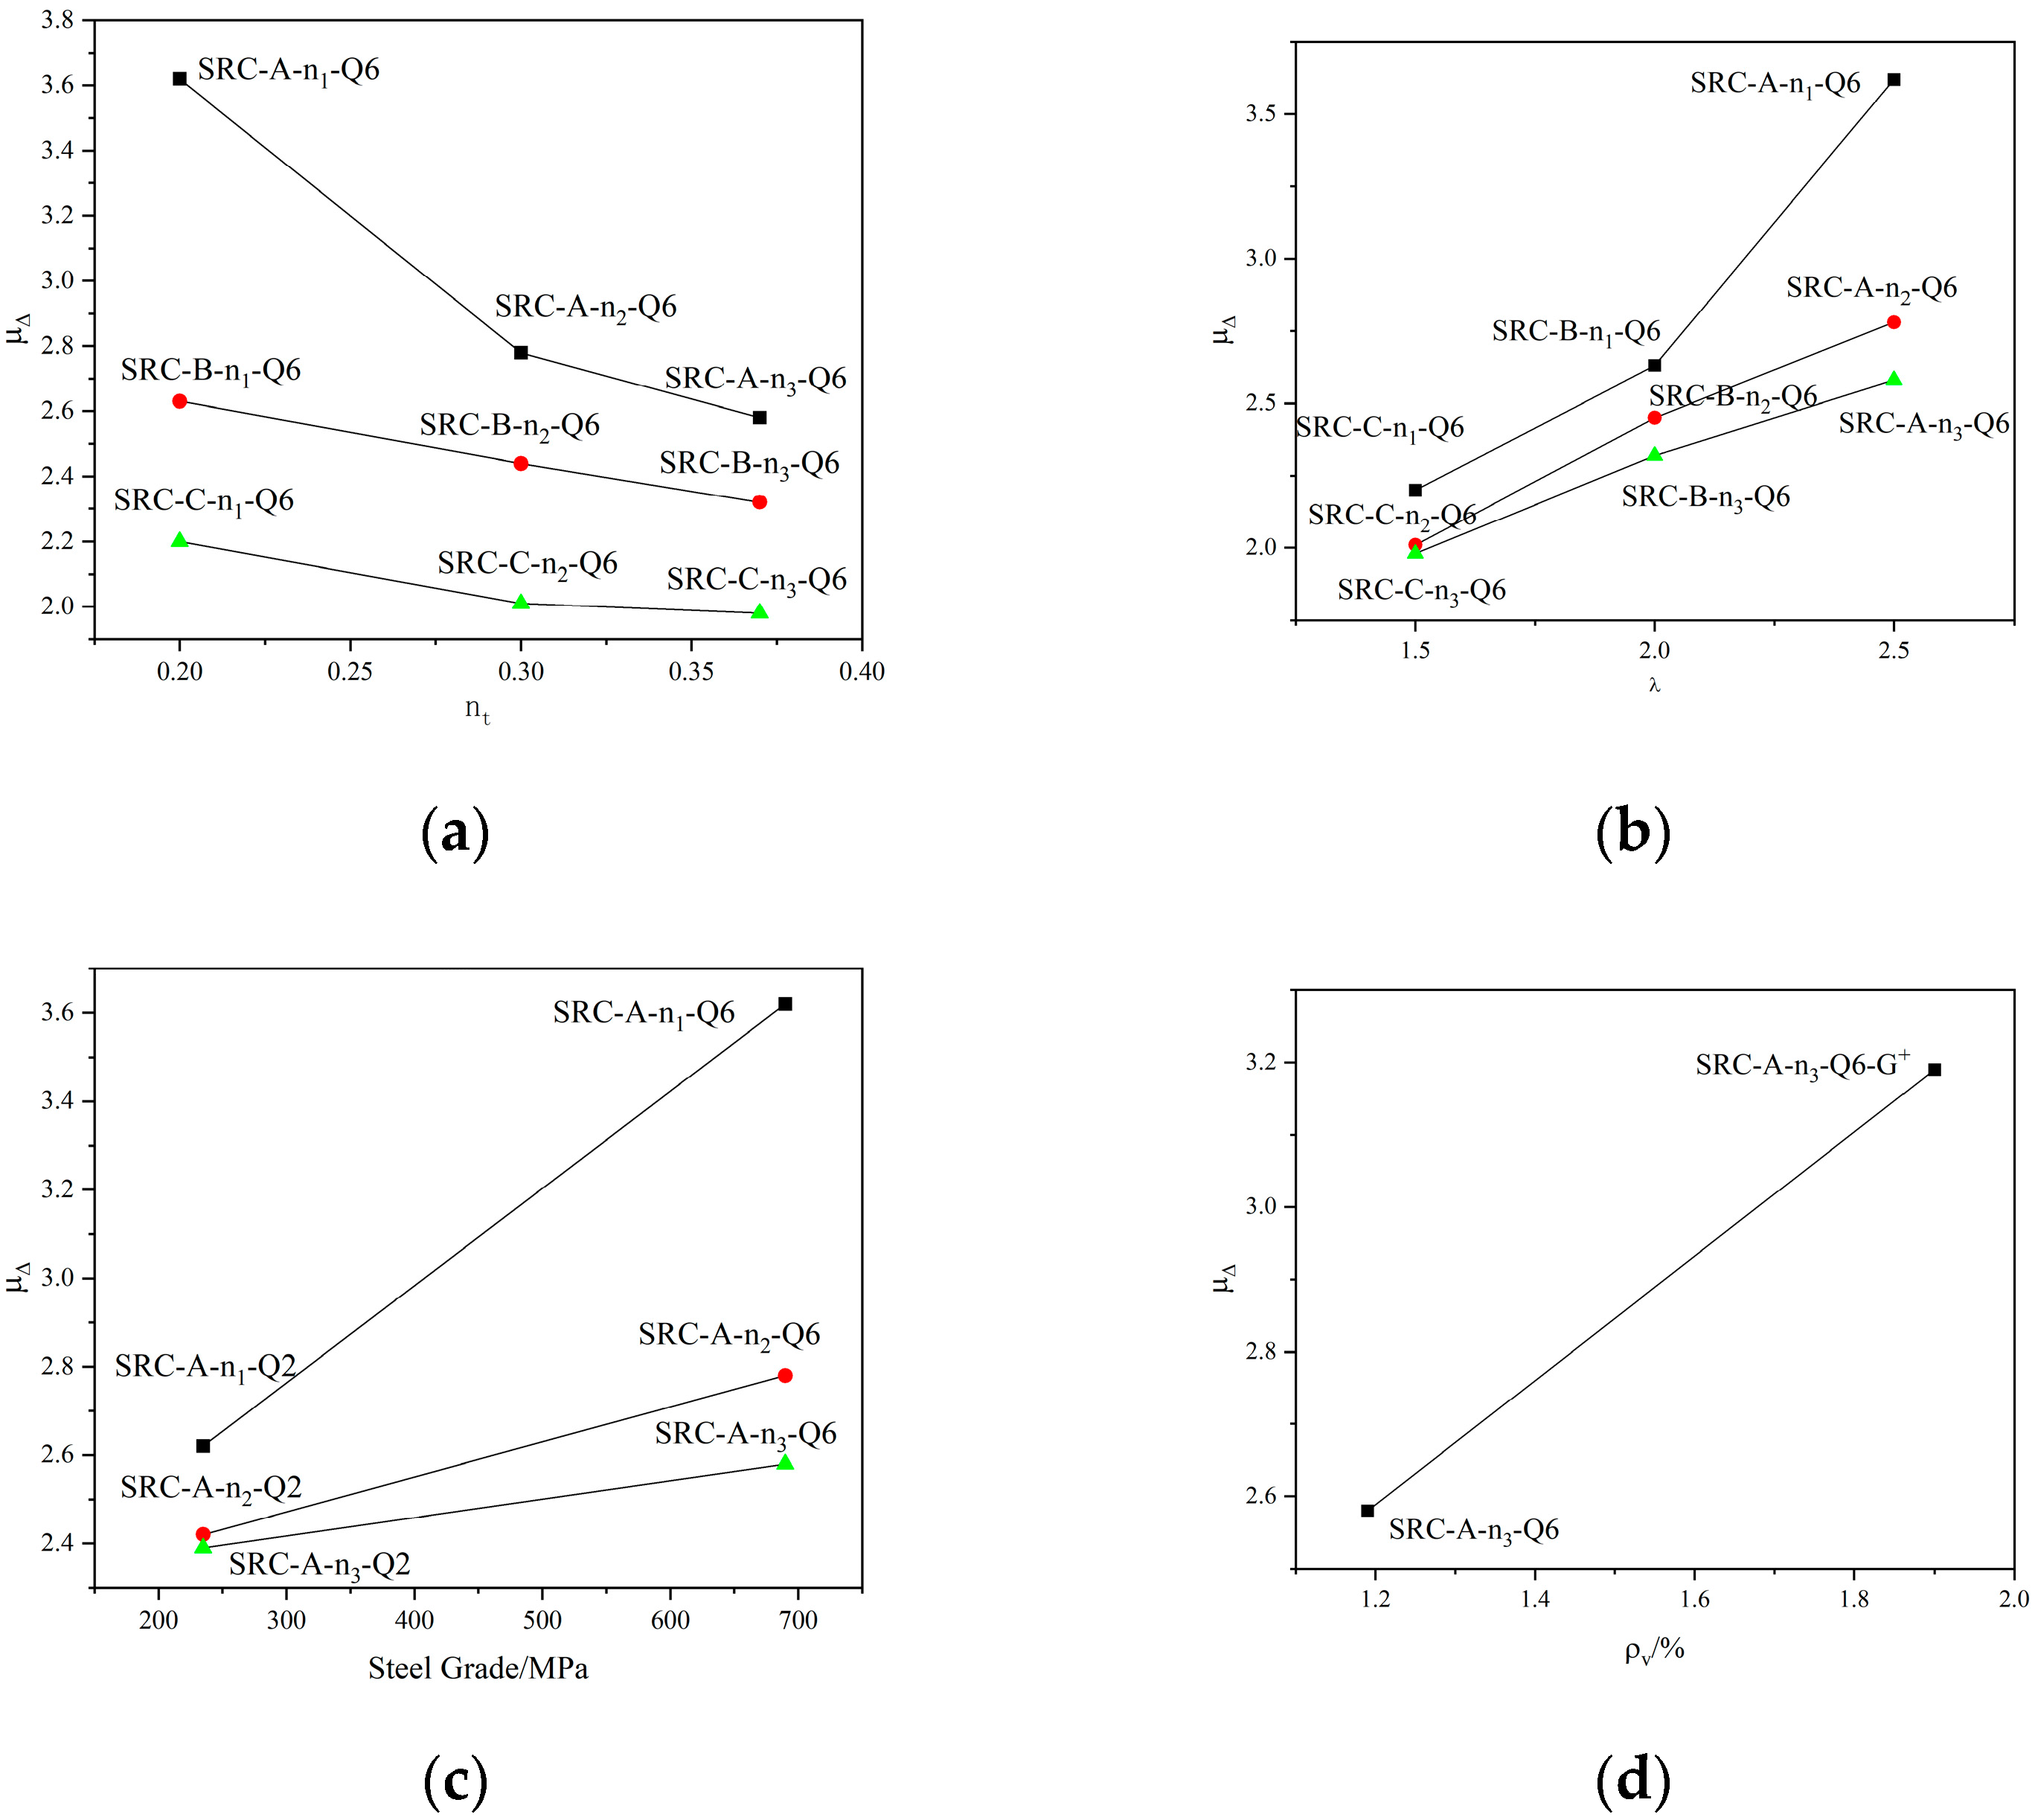
- The displacement ductility coefficient of the specimen decreases with an increasing axial compression ratio. For specimens SRC-A-n1-Q6, SRC-A-n2-Q6, and SRC-A-n3-Q6, the displacement ductility coefficients are 3.62, 2.78, and 2.58. The displacement ductility coefficient decreases sequentially; as the axial pressure ratio increases from 0.2 to 0.37, the displacement ductility coefficient of the specimen decreases by 28.73%. The increase in the axial compression ratio increases the principal compressive stress and principal compressive strain of the specimen, which weakens the ultimate deformation capacity of the concrete and reduces the ductility of the specimen. Moreover, the increase in the axial pressure increases the p–Δ effect of the specimen, resulting in an increase in the secondary additional bending moment and deformation, and the ductility of the specimen is weakened. The influence of the axial compression ratio on the displacement ductility coefficients of the specimens is shown in Figure 10a.
- The displacement ductility coefficient of the specimens increases with an increasing shear span ratio; for the specimens SRC-A-n1-Q6 and SRC-A-n1-Q2 with a larger shear span ratio, the displacement ductility coefficients are 3.62 and 2.62, respectively. For the specimens with a small shear span ratio, SRC-C-n1-Q6 and SRC-C-n1-Q2, the displacement ductility coefficients are 2.20 and 1.89, respectively. For specimens SRC-A-n1-Q6 and SRC-C-n1-Q6, the shear span ratio is reduced from 2.5 to 1.5. The displacement ductility coefficients of the specimens decreased by 39.23%. It can be seen that the effect of the shear span ratio on the displacement ductility coefficients of the specimens follows a positive correlation. Moreover, specimens with small shear span ratios often suffer from brittle shear–oblique failures, so it is advisable to avoid designing small shear-span-ratio specimens in engineering design. The effect of the shear span ratio on the displacement ductility coefficients of the specimens is shown in Figure 10b.
- The displacement ductility coefficient of the specimens increases with increasing steel strength grade. For specimen SRC-A-n1-Q6 with built-in Q690 steel and specimen SRC-A-n1-Q2 with built-in Q235 steel, the displacement ductility coefficients are 3.62 and 2.62, respectively. From the built-in Q235 steel to the built-in Q690 steel, the displacement ductility coefficient increases by 38.17%. It can be seen that the built-in high-strength steel can provide a relatively good improvement in the displacement ductility coefficient of the specimens. The influence of steel strength on the displacement ductility coefficient is mainly reflected in the fact that the steel strength can bear the horizontal shear force well and provide good deformation ability, which causes the displacement ductility coefficient of the specimen to increase. The influence of steel strength on the displacement ductility coefficients of the specimens is shown in Figure 10c.
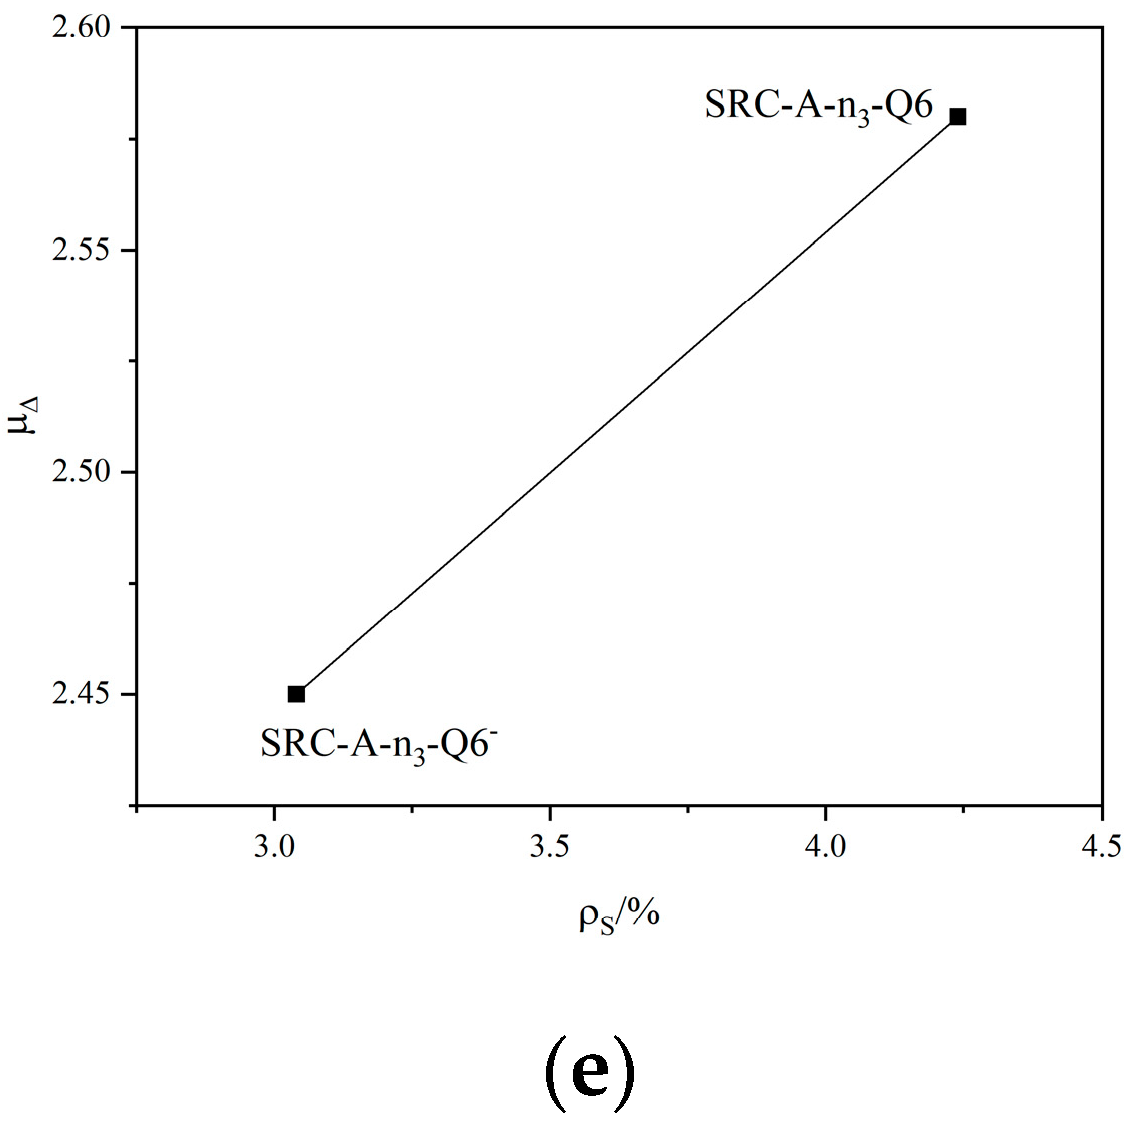
- With increasing hoop ratio and steel content, the displacement ductility coefficients of the specimens increase. The hoop ratio of specimens SRC-A-n3-Q6 (pv = 1.19%) and SRC-A-n3-Q6-G+ (pv = 1.90%) increased. The corresponding displacement ductility coefficients are 2.58 and 3.19, respectively. It can be seen that as the hoop ratio increases, the displacement ductility coefficient increases. The displacement ductility coefficients of specimen SRC-A-n3-Q6− (ps = 3.04%) with a small steel content and specimen SRC-A-n3-Q6 (ps = 4.24%) with a large steel content are 2.45 and 2.58, respectively. It can be seen that the displacement ductility coefficient of the specimen increases with increasing steel content. The increase in the hoop ratio and the steel content can effectively restrain the deformation of the concrete, bring the concrete to a state of multi-directional compression, effectively improve the ultimate deformation capacity of the concrete, and have a positive impact on the displacement ductility coefficient of the specimen. The influence of the hoop ratio and steel content on the displacement ductility coefficients of the specimens is shown in Figure 10d,e.
4.4. Energy Dissipation Capacity
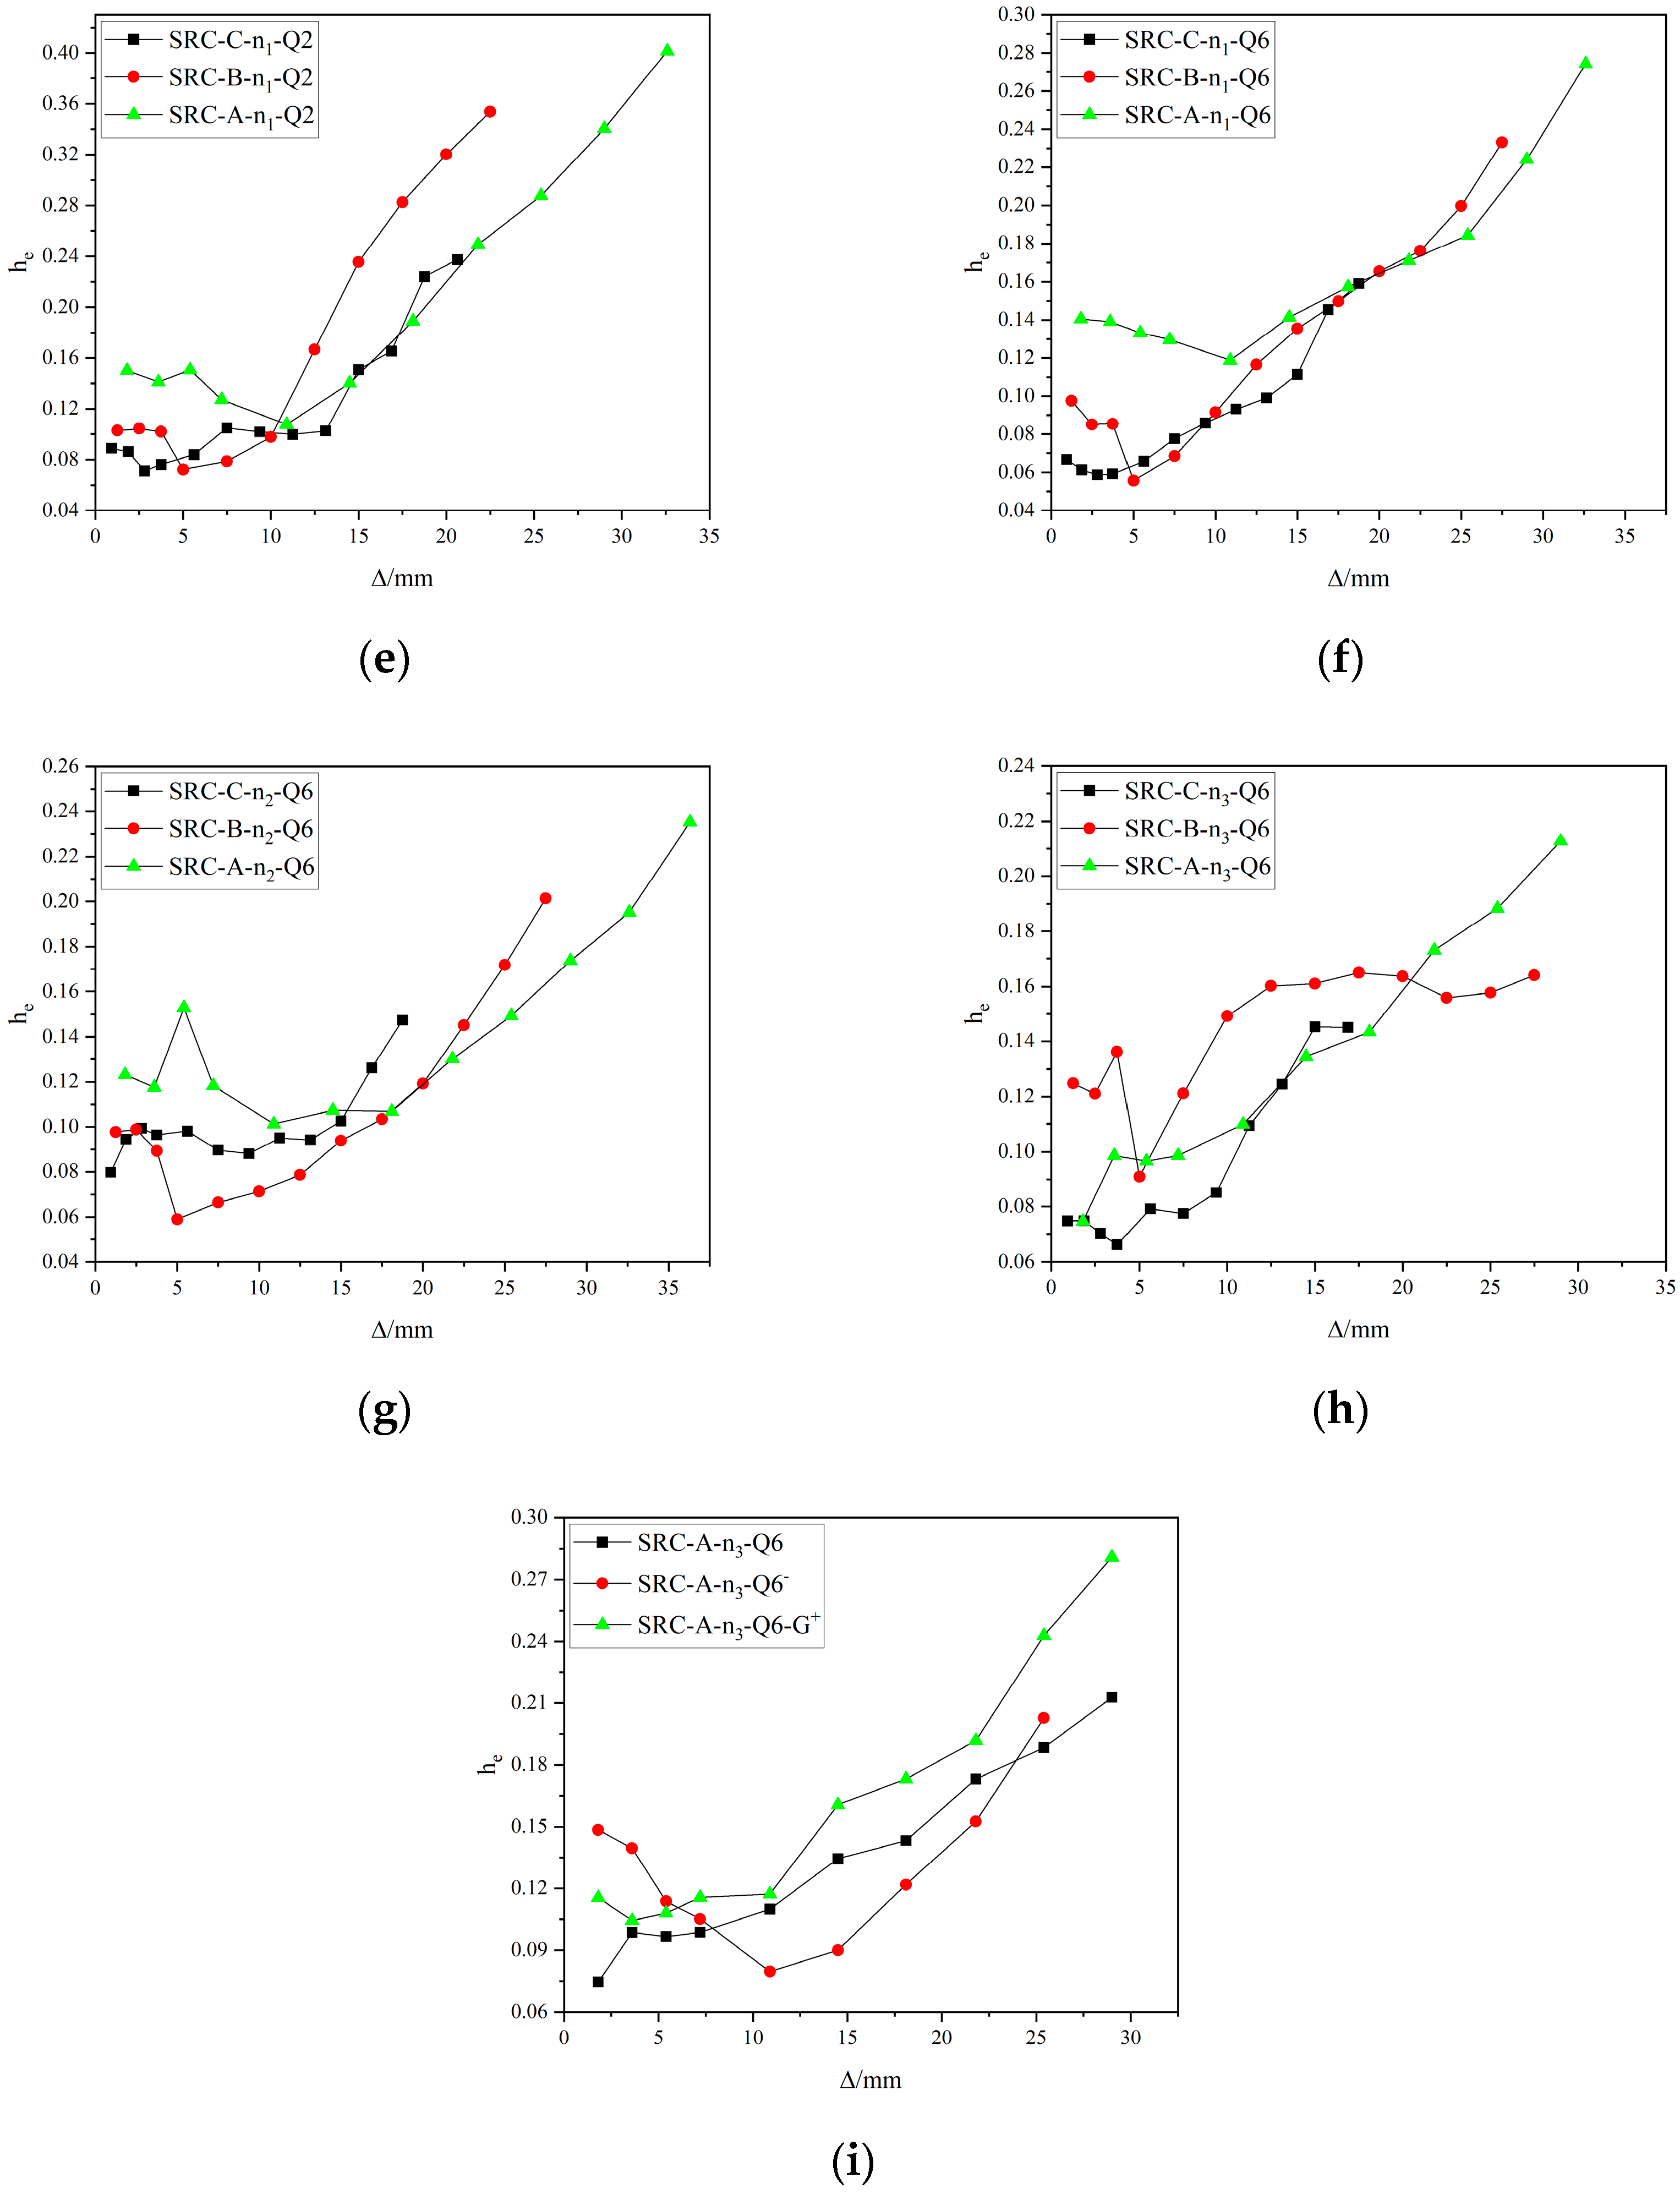
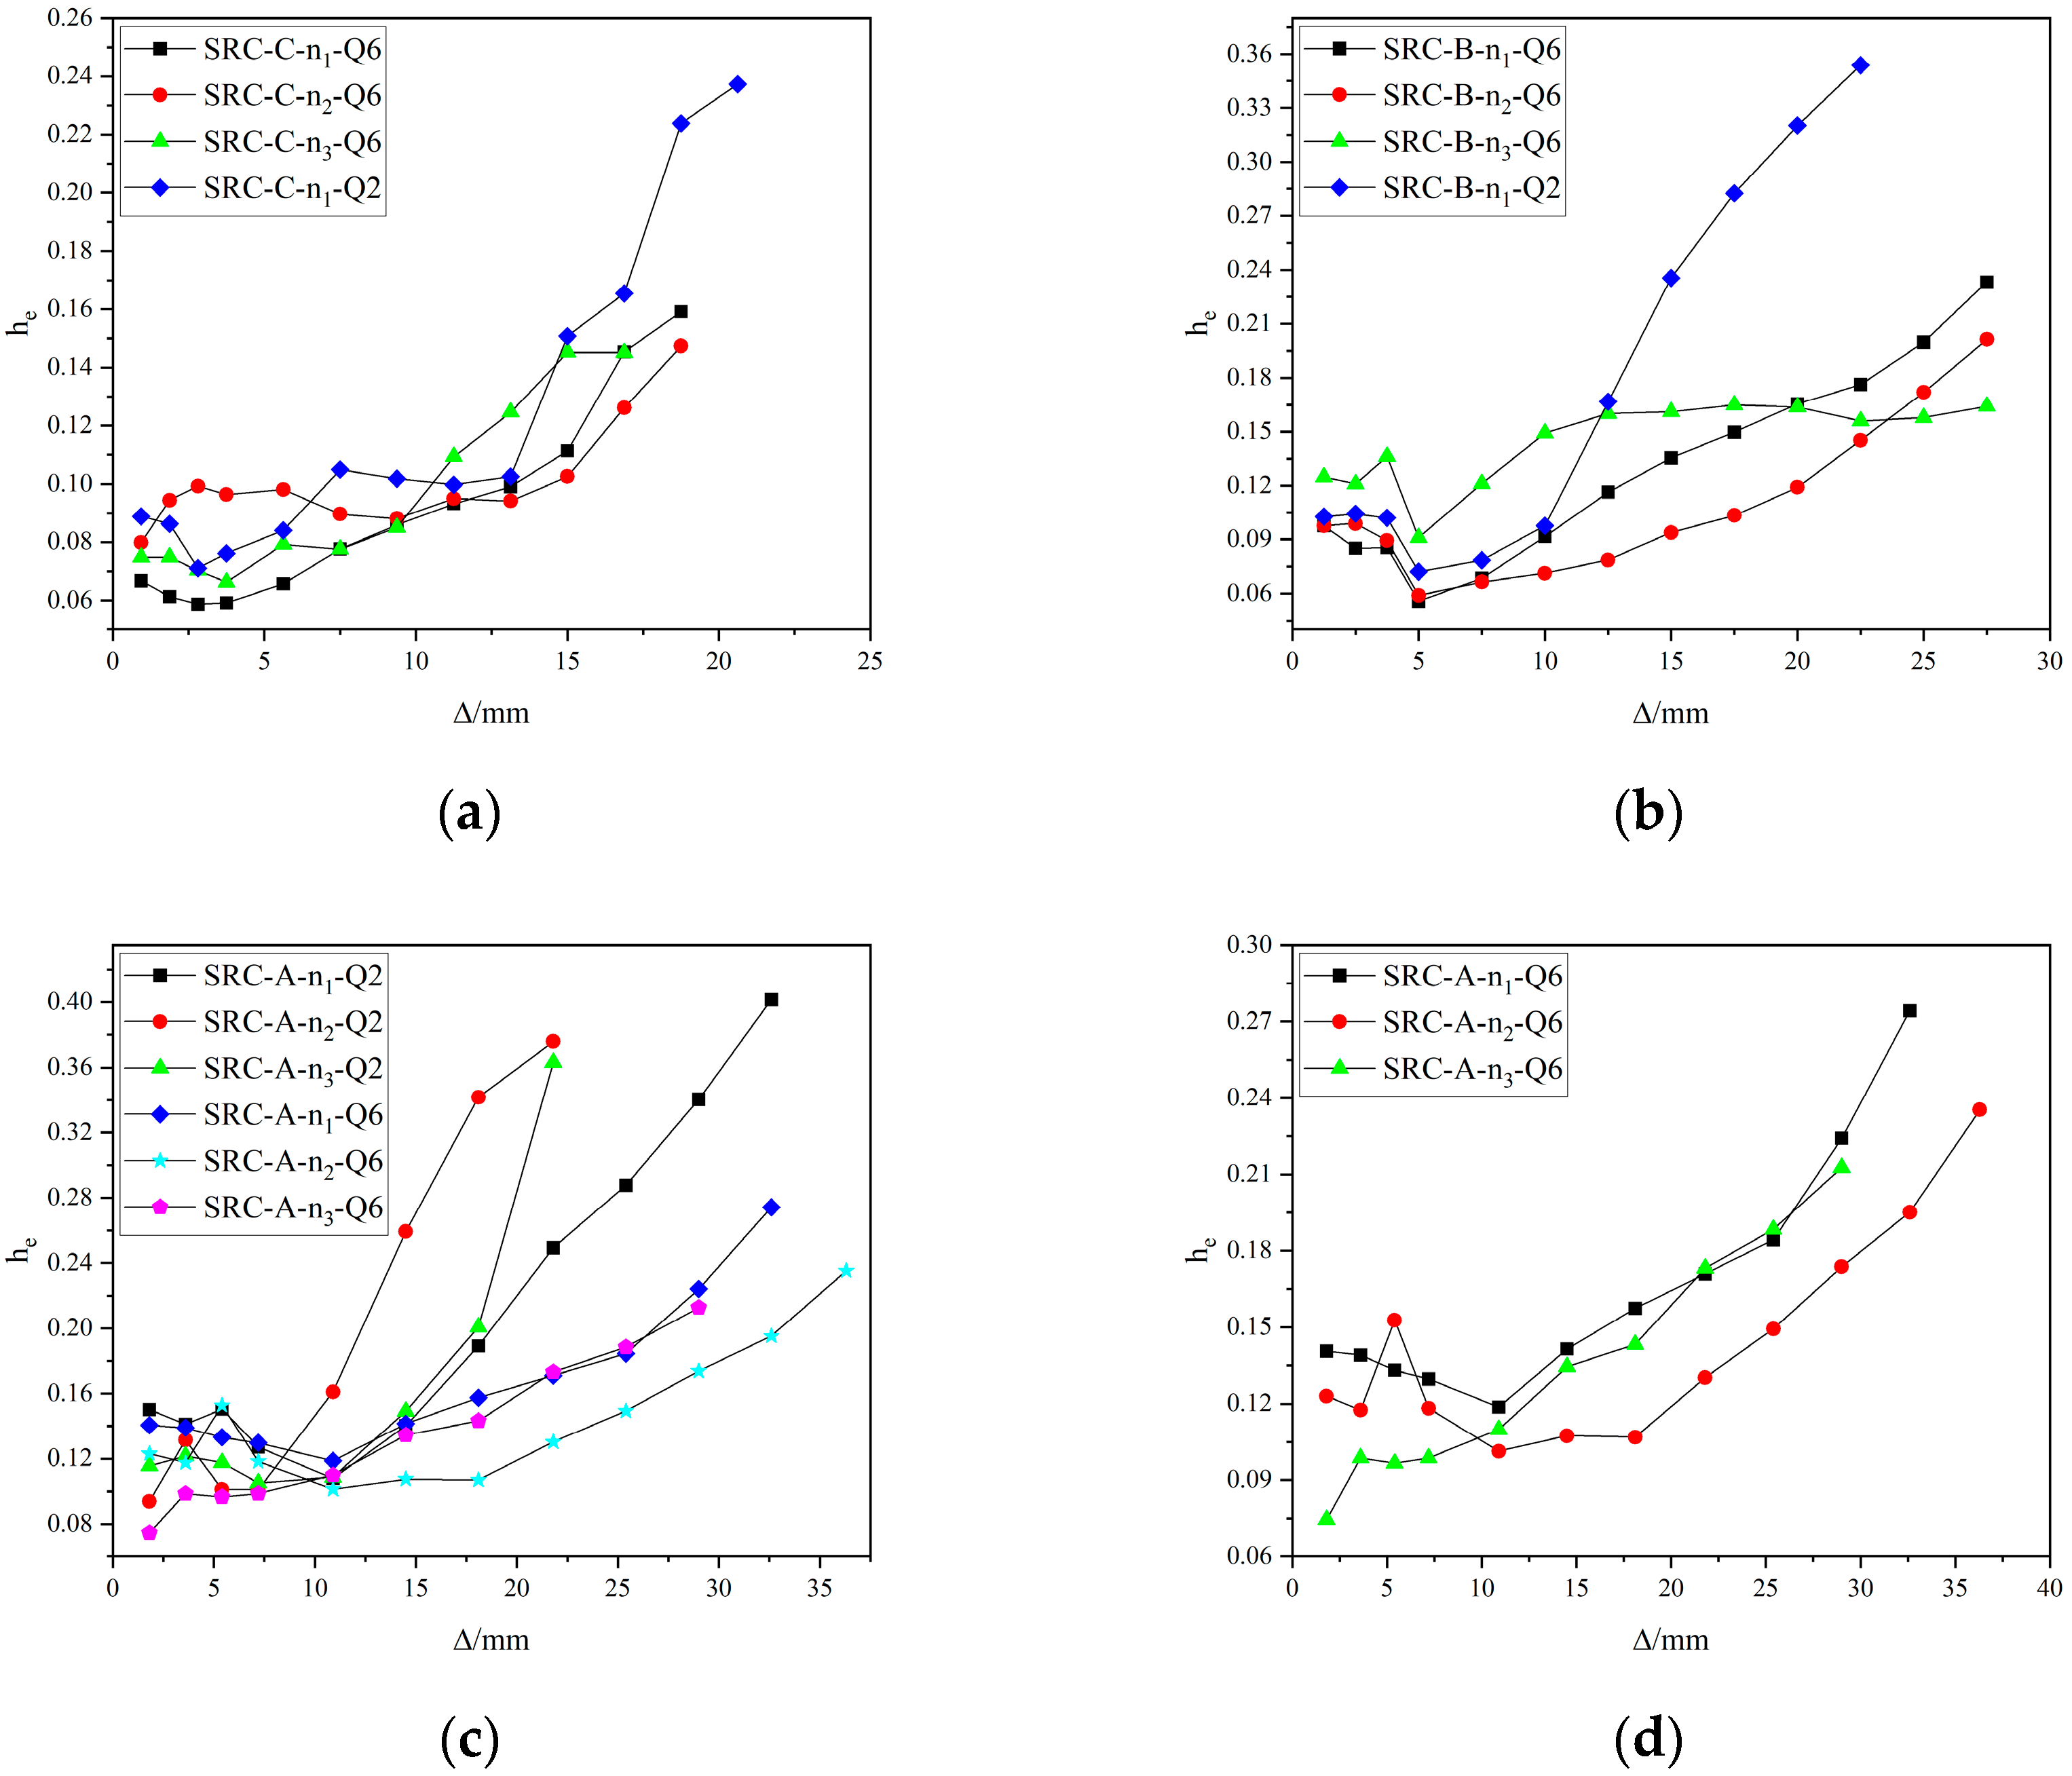
- The equivalent viscous damping coefficients of the specimens increase with increasing displacement, and the specimens’ he values show a sudden change under the same displacement cycle with different cycles. In the later stage of loading, the he values of the specimens can maintain a certain growth, but the growth rate is reduced. This shows that in the later stage of loading, although the concrete protective layer is continuously crushed and peeled off, the steel and stirrup-constrained concrete in the core area can still bear the horizontal load and dissipate the seismic energy well. It has a good energy dissipation capacity, and it is also beneficial for resisting secondary aftershocks after major earthquakes.
- With an increasing axial compression ratio of the specimens, their equivalent viscous damping coefficients gradually decrease, indicating that an increase in the axial compression ratio is not good for the seismic performance of the specimens. The ultimate energy consumption index of specimen SRC-C-n1-Q6 (he = 0.16) is greater than that of specimen SRC-C-n3-Q6 (he = 0.14). The limit energy consumption index of specimen SRC-A-n1-Q6 (he = 0.27) is greater than that of specimen SRC-A-n3-Q6 (he = 0.21). The influence of the axial compression ratio on the equivalent viscous damping coefficients of the specimens is shown in Figure 11a–d.
- With an increasing shear span ratio of the specimens, the equivalent viscous damping coefficients of the specimens increase gradually, indicating that an increase in the shear span ratio can improve the seismic performance of the specimens. The limit energy consumption index of specimen SRC-C-n2-Q6 (he = 0.15) is less than that of specimen SRC-A-n2-Q6 (he = 0.24). The limit energy consumption index of specimen SRC-C-n1-Q2 (he = 0.24) is less than that of specimen SRC-A-n1-Q2 (he = 0.43). The effect of the shear span ratio on the equivalent viscous damping coefficients of the specimens is shown in Figure 11e–h.
- With increasing steel strength grade from Q235 to Q690, the equivalent viscous damping coefficient of the specimen gradually decreases. The limit energy consumption index of specimen SRC-A-n2-Q6 (he = 0.24) is less than that of specimen SRC-A-n2-Q2 (he = 0.40). The limit energy consumption index of specimen SRC-B-n1-Q6 (he = 0.23) is less than that of specimen SRC-B-n1-Q2 (he = 0.35). The effect of steel strength on the equivalent viscous damping coefficients of the specimens is shown in Figure 11a–c.
- An increase in the hoop ratio and steel content can effectively constrain the concrete in the core area, improve the plastic deformation ability of the specimen, and improve the seismic performance of the specimen. The limit energy consumption index of specimen SRC-A-n3-Q6 (he = 0.21) is greater than that of specimen SRC-A-n3-Q6− (he = 0.20). The limit energy consumption index of specimen SRC-A-n3-Q6 (he = 0.21) is less than that of specimen SRC-A-n3-Q6-G+ (he = 0.28). The effect of hoop ratio and steel content on the equivalent viscous damping coefficients of the specimens is shown in Figure 11i.
5. Conclusions
- The SRC frame columns with built-in high-strength steel performed well with regard to the various seismic performance indicators; the SRC columns equipped with Q690 steel have obvious advantages in terms of bearing capacity and displacement ductility, and their energy dissipation capacity is lower than that of ordinary SRC frame columns.
- Under the action of low-cycle repeated loads, with an increasing axial compression ratio, the horizontal bearing capacity of the SRC frame column increases, and the energy dissipation and displacement ductility performance decrease, but the decrease for the SRC column configured with Q690 steel is slightly slower.
- With an increasing shear span ratio, the horizontal bearing capacity of the SRC frame column decreases, the load decays rapidly, and the energy dissipation and displacement ductility gradually increase. High-strength steel behaves in the same way as ordinary steel.
- With increasing hoop ratio and steel content, the horizontal bearing capacity of the built-in Q690 steel frame column is improved, the load decay rate slows down, and the displacement ductility performance and energy dissipation capacity are improved.
Author Contributions
Funding
Institutional Review Board Statement
Informed Consent Statement
Data Availability Statement
Conflicts of Interest
Nomenclature
| SRC | steel reinforced concrete |
| SRHC | steel reinforced high strength concrete |
| n | axial compression ratio |
| λ | shear span ratio |
| pv | stirrup ratio |
| ps | steel content |
| fy | yield strength of steel and rebar |
| fu | ultimate strength of steel and rebar |
| p, Δ | lateral load and corresponding displacement, respectively |
| pcr, Δcr | crack load and corresponding displacement, respectively |
| py, Δy | yield load and corresponding displacement, respectively |
| pm, Δm | maximum load and corresponding displacement, respectively |
| pu, Δu | ultimate load and corresponding displacement, respectively |
| μΔ | ductility factor |
| he | equivalent viscous damping coefficient |
References
- Gang, S.; Huiyong, B.; Yuanqing, W. Overview of research progress for high strength steel structures. Eng. Plast. Appl. 2013, 30, 1–13. [Google Scholar]
- Zhao, J.; Ding, W. Tests and design method on overall buckling behaviours of welded I-section two-span continuous beams for Q460 high strength steel. Eng. Struct. 2022, 253, 113789. [Google Scholar] [CrossRef]
- Wang, M.; Li, Y.; Li, G.; Wang, W.; Jiang, B. Comparative experimental studies of high-temperature mechanical properties of HSSs Q460D and Q690D. J. Constr. Steel Res. 2022, 189, 107065. [Google Scholar] [CrossRef]
- Jiang, J.; Peng, Z.Y.; Ye, Z.J.; Ye, M. Behaviour of 690 MPa high strength steel built-up H-section columns under eccentric load scenarios. Eng. Struct. 2020, 213, 110550. [Google Scholar] [CrossRef]
- Gao, L.; Zheng, Y.-Z.; Bai, L.-Y.; He, X.-H.; Ni, M. Research on overall stability of BS700 high-strength steel columns with box section. J. Constr. Steel Res. 2022, 189, 107090. [Google Scholar] [CrossRef]
- Ilawe, N.V.; Zimmerman, J.A.; Wong, B.M. Breaking badly: DFT-D2 gives sizeable errors for tensile strengths in Palladium-Hydride solids. J. Chem. Theory Comput. 2015, 11, 5426–5435. [Google Scholar] [CrossRef]
- Ji, H.; Lee Jong, H.; Park, A.S. Assessing the Influence of van der Waals Corrected Exchange-Correlation Functionals on the Anisotropic Mechanical Properties of Coinage Metals. Phys. Rev. B 2016, 94, 024108. [Google Scholar]
- ANSI/AISC360-2016; Specification for Structural Steel Buildings. AISC Committee on Specifications: Chicago, IL, USA, 2016.
- EN 1994-1-1:2004; Eurocode 4: Design of Composite Steel and Concrete Structures Part 1-1: General Rules for Buildings. European Committee for Standardization: Brussels, Belgium, 2004.
- JGJ138-2016; Code for Design of Composite Structures. Architecture and Building Press: Beijing, China, 2016.
- Wang, J.; Di, J.; Zhang, Q.; Qin, F. Overall buckling behaviour of Q420–Q960 steel welded H-section axial compression members. Eng. Struct. 2021, 249, 113340. [Google Scholar] [CrossRef]
- Chou, C.-C.; Wu, S.-C. Cyclic lateral load test and finite element analysis of high-strength concrete-filled steel box columns under high axial compression. Eng. Struct. 2019, 189, 89–99. [Google Scholar] [CrossRef]
- Aboukifa, M.; Moustafa, M.A. Experimental seismic behavior of ultra-high performance concrete columns with high strength steel reinforcement. Eng. Struct. 2021, 232, 111885. [Google Scholar] [CrossRef]
- Shi, Q.; Ma, L.; Wang, Q.; Wang, B.; Yang, K. Seismic performance of square concrete columns reinforced with grade 600 MPa longitudinal and transverse reinforcement steel under high axial load. Structures 2021, 32, 1955–1970. [Google Scholar] [CrossRef]
- Zhu, W.; Jia, J.; Gao, J.; Zhang, F. Experimental study on steel reinforced high-strength concrete columns under cyclic lateral force and constant axial load. Eng. Struct. 2016, 125, 191–204. [Google Scholar] [CrossRef]
- Zhou, X.; Liu, J. Seismic behavior and strength of tubed steel reinforced concrete (SRC) short columns. J. Constr. Steel Res. 2010, 66, 885–896. [Google Scholar] [CrossRef]
- Xue, J.; Zhang, X.; Ke, X.; Ma, L. Seismic resistance capacity of steel reinforced high-strength concrete columns with rectangular spiral stirrups. Constr. Build. Mater. 2019, 229, 116880. [Google Scholar] [CrossRef]
- Ma, H.; Xue, J.; Zhang, X.; Luo, D. Seismic performance of steel-reinforced recycled concrete columns under low cyclic loads. Constr. Build. Mater. 2013, 48, 229–237. [Google Scholar] [CrossRef]
- Yin, F.; Wang, R.-W.; Cao, W.-L.; Zhao, Y.; Song, Y. Experimental and analytical research on steel reinforced high-strength concrete columns with different steel sections. Structures 2021, 34, 4350–4363. [Google Scholar] [CrossRef]
- Gautham, A.; Sahoo, D.R. Behavior of steel-reinforced composite concrete columns under combined axial and lateral cyclic loading. J. Build. Eng. 2021, 39, 102305. [Google Scholar] [CrossRef]
- Elbably, A.; Ramadan, O.; Akl, A.; Zenhom, N. Behavior of encased steel-high strength concrete columns against axial and cyclic loading. J. Constr. Steel Res. 2022, 191, 107161. [Google Scholar] [CrossRef]
- Wang, J.; Wang, X.; Duan, Y.; Su, Y.; Yi, X. The Investigation on Mechanical Performances of High-Strength Steel Reinforced Concrete Composite Short Columns under Axial Load. Materials 2022, 15, 329. [Google Scholar] [CrossRef]
- Wang, J.; Duan, Y.; Wang, Y.; Wang, X.; Liu, Q. Analysis and Modification of Methods for Calculating Axial Load Capacity of High-Strength Steel-Reinforced Concrete Composite Columns. Materials 2021, 14, 6860. [Google Scholar] [CrossRef]
- Wang, J.; Duan, Y.; Sun, W.; Yi, X. An Investigation of Bearing Capacity of High-Strength SRC Columns under Eccentric Axial Load. Buildings 2021, 11, 639. [Google Scholar] [CrossRef]
- GB/T228-2010; Chinese Standard for Metallic Materials-Tensile Testing at Ambient Temperature. Architecture and Building Press: Beijing, China, 2010.
- GB/T50152-2012; Standard for Test Methods of Concrete Structures. Architecture and Building Press: Beijing, China, 2012.
- JGJ/T-2015; Specification for Seismic Test of Buildings. Architecture and Building Press: Beijing, China, 2015.


| Specimen Designation | λ | n | ps (%) | pv (%) | Steel Grade |
|---|---|---|---|---|---|
| SRC-A-n1-Q6 | 2.6 | 0.2 | 4.24 | 1.19 | Q690 |
| SRC-A-n2-Q6 | 2.6 | 0.3 | 4.24 | 1.19 | Q690 |
| SRC-A-n3-Q6 | 2.6 | 0.37 | 4.24 | 1.19 | Q690 |
| SRC-B-n1-Q6 | 2 | 0.2 | 4.24 | 1.19 | Q690 |
| SRC-B-n2-Q6 | 2 | 0.3 | 4.24 | 1.19 | Q690 |
| SRC-B-n3-Q6 | 2 | 0.37 | 4.24 | 1.19 | Q690 |
| SRC-C-n1-Q6 | 1.5 | 0.2 | 4.24 | 1.19 | Q690 |
| SRC-C-n2-Q6 | 1.5 | 0.3 | 4.24 | 1.19 | Q690 |
| SRC-C-n3-Q6 | 1.5 | 0.37 | 4.24 | 1.19 | Q690 |
| SRC-A-n1-Q2 | 2.6 | 0.2 | 4.24 | 1.19 | Q235 |
| SRC-A-n2-Q2 | 2.6 | 0.3 | 4.24 | 1.19 | Q235 |
| SRC-A-n3-Q2 | 2.6 | 0.37 | 4.24 | 1.19 | Q235 |
| SRC-B-n1-Q2 | 2 | 0.2 | 4.24 | 1.19 | Q235 |
| SRC-C-n1-Q2 | 1.5 | 0.2 | 4.24 | 1.19 | Q235 |
| SRC-A-n3-Q6− | 2.6 | 0.37 | 3.04 | 1.19 | Q690 |
| SRC-A-n3-Q6-G+ | 2.6 | 0.37 | 4.24 | 1.90 | Q690 |
| Grade | Specification | fy/MPa | fu/MPa | Elongation Ratio/% |
|---|---|---|---|---|
| Q235 | 5 mm | 277.15 | 437.28 | 32.1 |
| Q235 | 8 mm | 304.84 | 468.73 | 30.4 |
| Q690 | 5 mm | 696.83 | 819.80 | 19.6 |
| Q690 | 8 mm | 695.48 | 818.22 | 21.4 |
| HRB400 | 8 mm | 457.6 | 611.2 | 26.8 |
| HRB400 | 12 mm | 428.7 | 578.6 | 28.7 |
| Specimen Designation | pcr/kN | Δcr/mm | py/kN | Δy/mm | Pm/kN | Δm/mm | pu/kN | Δu/mm | Destruction Form |
|---|---|---|---|---|---|---|---|---|---|
| SRC-A-n1-Q6 | 108.55 | 4.29 | 193.08 | 9.01 | 217.58 | 14.42 | 182.25 | 28.89 | Bending failure |
| SRC-A-n2-Q6 | 123.69 | 5.33 | 206.95 | 13.69 | 245.82 | 25.35 | 203.54 | 39.89 | Bending failure |
| SRC-A-n3-Q6 | 142.44 | 5.45 | 226.09 | 10.49 | 261.35 | 21.44 | 225.75 | 28.65 | Bending failure |
| SRC-B-n1-Q6 | 125.85 | 2.59 | 272.59 | 8.12 | 288.27 | 9.89 | 247.12 | 27.06 | Shear Bond failure |
| SRC-B-n2-Q6 | 122.43 | 2.44 | 253.04 | 9.42 | 281.09 | 12.44 | 227.47 | 24.80 | Shear Bond failure |
| SRC-B-n3-Q6 | 131.09 | 3.12 | 235.37 | 7.81 | 266.34 | 12.38 | 215.43 | 22.01 | Shear Bond failure |
| SRC-C-n1-Q6 | 112.16 | 1.83 | 392.62 | 8.39 | 417.60 | 14.95 | 351.44 | 18.54 | Shear Baroclinic failure |
| SRC-C-n2-Q6 | 116.81 | 1.73 | 390.68 | 9.22 | 440.04 | 14.92 | 366.38 | 20.31 | Shear Baroclinic failure |
| SRC-C-n3-Q6 | 130.47 | 1.86 | 419.68 | 7.87 | 469.34 | 11.06 | 406.69 | 16.62 | Shear Baroclinic failure |
| SRC-A-n1-Q2 | 98.10 | 5.66 | 169.92 | 7.87 | 199.21 | 21.58 | 153.12 | 31.23 | Bending failure |
| SRC-A-n2-Q2 | 154.57 | 4.24 | 187.87 | 6.90 | 223.29 | 10.64 | 170.79 | 19.46 | Bending failure |
| SRC-A-n3-Q2 | 154.58 | 5.36 | 186.79 | 7.76 | 213.59 | 10.83 | 171.10 | 19.31 | Bending failure |
| SRC-B-n1-Q2 | 121.84 | 3.12 | 216.59 | 7.46 | 243.42 | 12.17 | 210.53 | 19.54 | Shear Bond failure |
| SRC-C-n1-Q2 | 81.42 | 1.62 | 342.44 | 9.24 | 372.11 | 11.19 | 310.19 | 18.45 | Shear Baroclinic failure |
| SRC-A-n3-Q6− | 132.44 | 5.71 | 204.07 | 10.27 | 225.69 | 13.81 | 192.27 | 25.26 | Bending failure |
| SRC-A-n3-Q6-G+ | 184.24 | 6.18 | 227.19 | 9.11 | 257.17 | 17.93 | 214.51 | 28.94 | Bending failure |
| Specimen Designation | he | μΔ | Specimen Designation | he | μΔ |
|---|---|---|---|---|---|
| SRC-A-n1-Q6 | 0.27 | 3.62 | SRC-C-n3-Q6 | 0.14 | 1.98 |
| SRC-A-n2-Q6 | 0.24 | 2.78 | SRC-A-n1-Q2 | 0.43 | 2.62 |
| SRC-A-n3-Q6 | 0.21 | 2.58 | SRC-A-n2-Q2 | 0.40 | 2.42 |
| SRC-B-n1-Q6 | 0.23 | 2.63 | SRC-A-n3-Q2 | 0.37 | 2.39 |
| SRC-B-n2-Q6 | 0.20 | 2.45 | SRC-B-n1-Q2 | 0.35 | 2.55 |
| SRC-B-n3-Q6 | 0.16 | 2.32 | SRC-C-n1-Q2 | 0.24 | 1.89 |
| SRC-C-n1-Q6 | 0.16 | 2.20 | SRC-A-n3-Q6− | 0.20 | 2.45 |
| SRC-C-n2-Q6 | 0.15 | 2.01 | SRC-A-n3-Q6-G+ | 0.28 | 3.19 |
Publisher’s Note: MDPI stays neutral with regard to jurisdictional claims in published maps and institutional affiliations. |
© 2022 by the authors. Licensee MDPI, Basel, Switzerland. This article is an open access article distributed under the terms and conditions of the Creative Commons Attribution (CC BY) license (https://creativecommons.org/licenses/by/4.0/).
Share and Cite
Wang, J.; Yi, X.; Liu, Q.; Fang, X. Seismic Performance of Steel-Reinforced Concrete Columns with Q690 High-Strength Steel. Materials 2022, 15, 2979. https://doi.org/10.3390/ma15092979
Wang J, Yi X, Liu Q, Fang X. Seismic Performance of Steel-Reinforced Concrete Columns with Q690 High-Strength Steel. Materials. 2022; 15(9):2979. https://doi.org/10.3390/ma15092979
Chicago/Turabian StyleWang, Jun, Xinyu Yi, Qi Liu, and Xueqi Fang. 2022. "Seismic Performance of Steel-Reinforced Concrete Columns with Q690 High-Strength Steel" Materials 15, no. 9: 2979. https://doi.org/10.3390/ma15092979
APA StyleWang, J., Yi, X., Liu, Q., & Fang, X. (2022). Seismic Performance of Steel-Reinforced Concrete Columns with Q690 High-Strength Steel. Materials, 15(9), 2979. https://doi.org/10.3390/ma15092979