
Hardening and Softening Behavior of Caliber-Rolled Wire


Abstract
1. Introduction
2. Experimental Procedures and FE Analysis
2.1. Experimental Procedures
2.1.1. Material Preparation
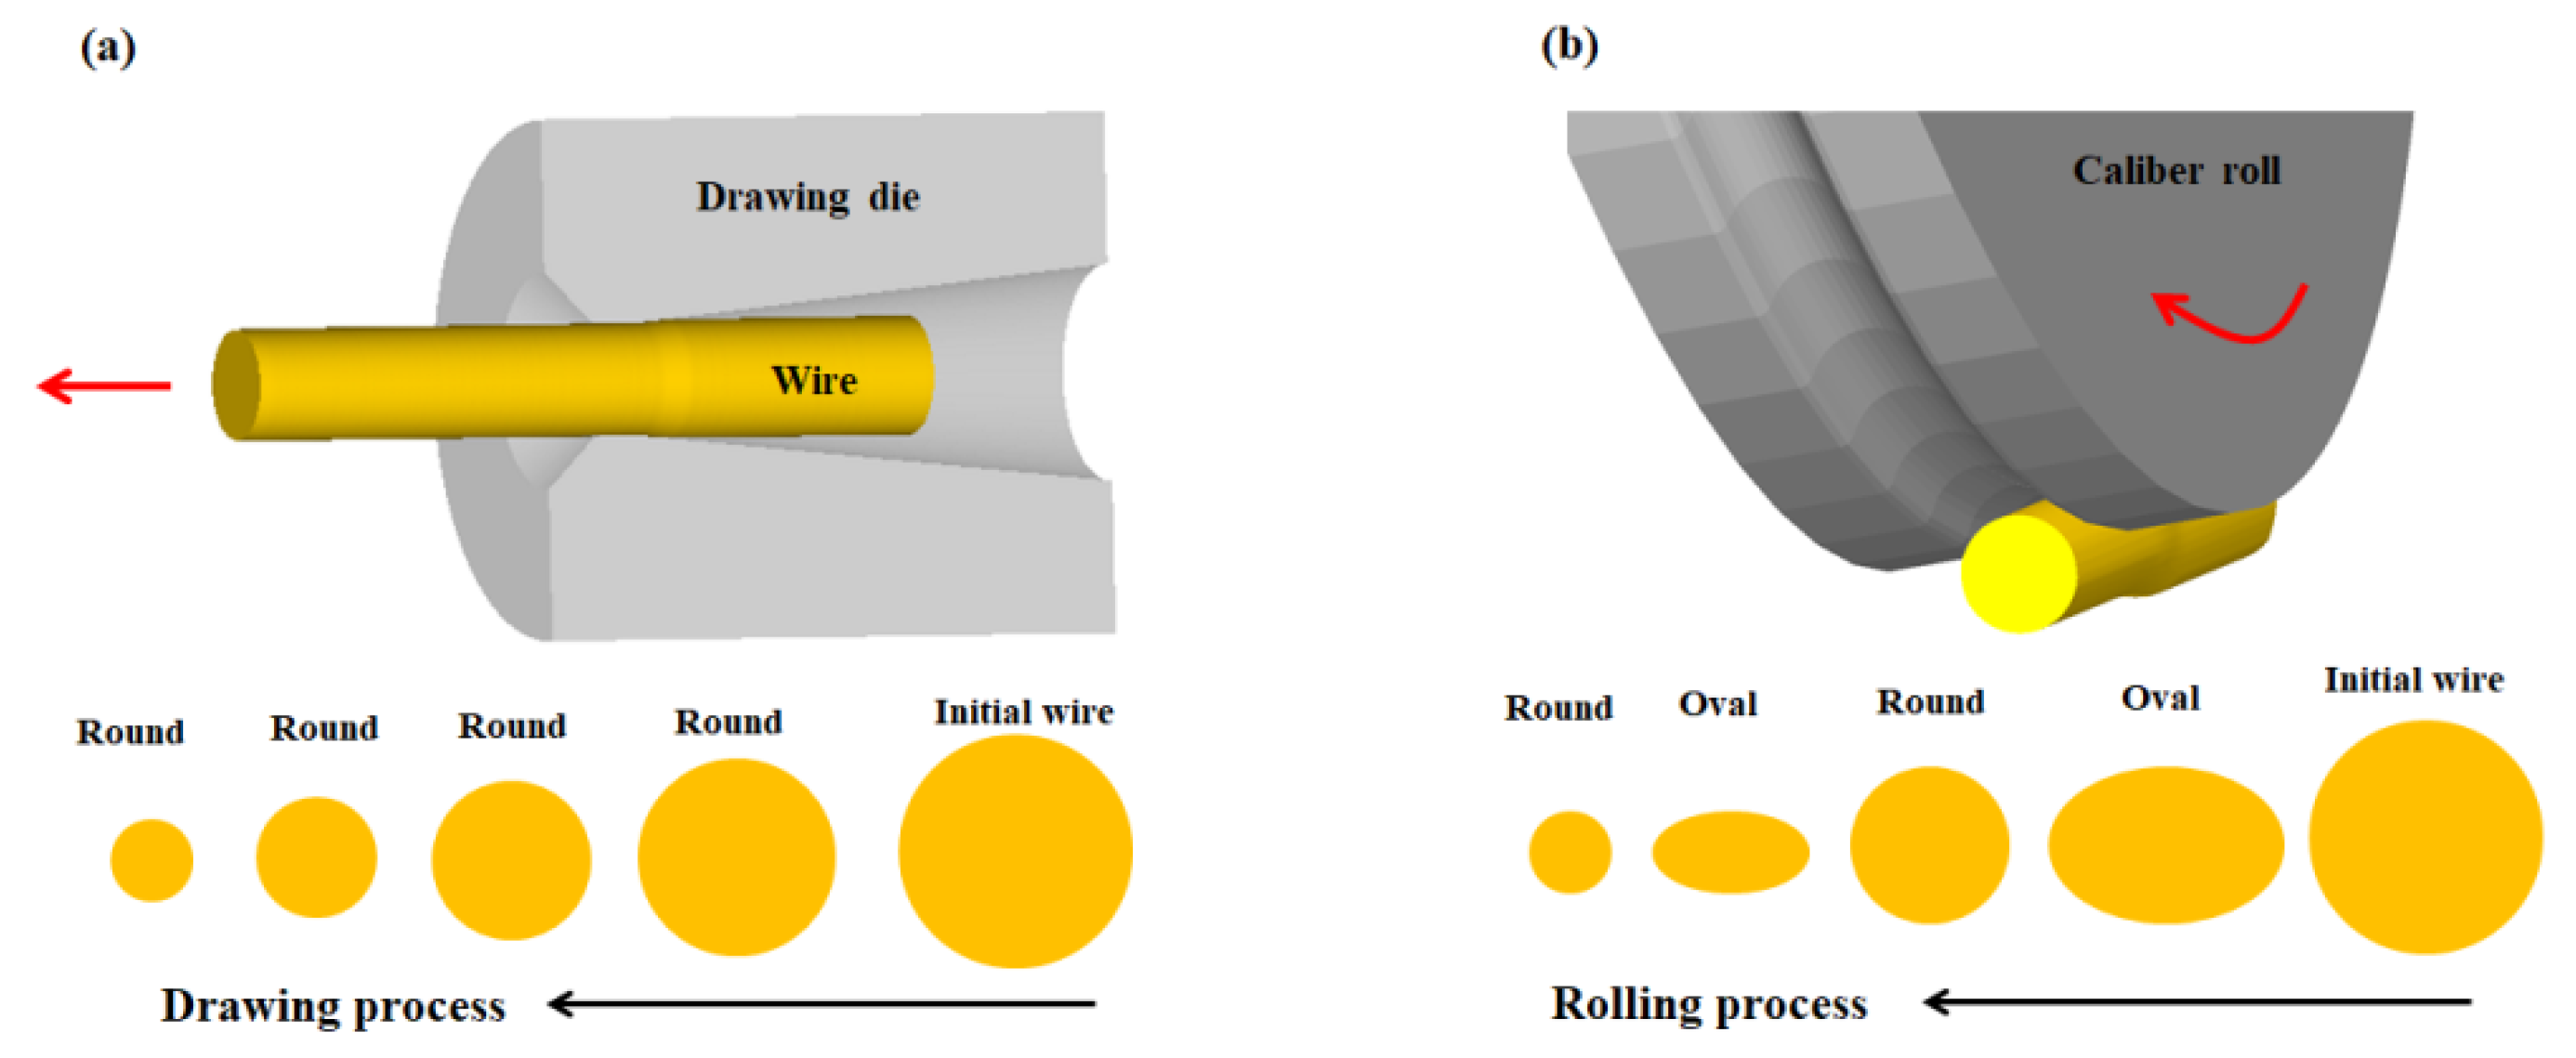
2.1.2. Wire Drawing and Caliber Rolling Tests
2.1.3. Materials Characterizations
2.2. FE Analysis
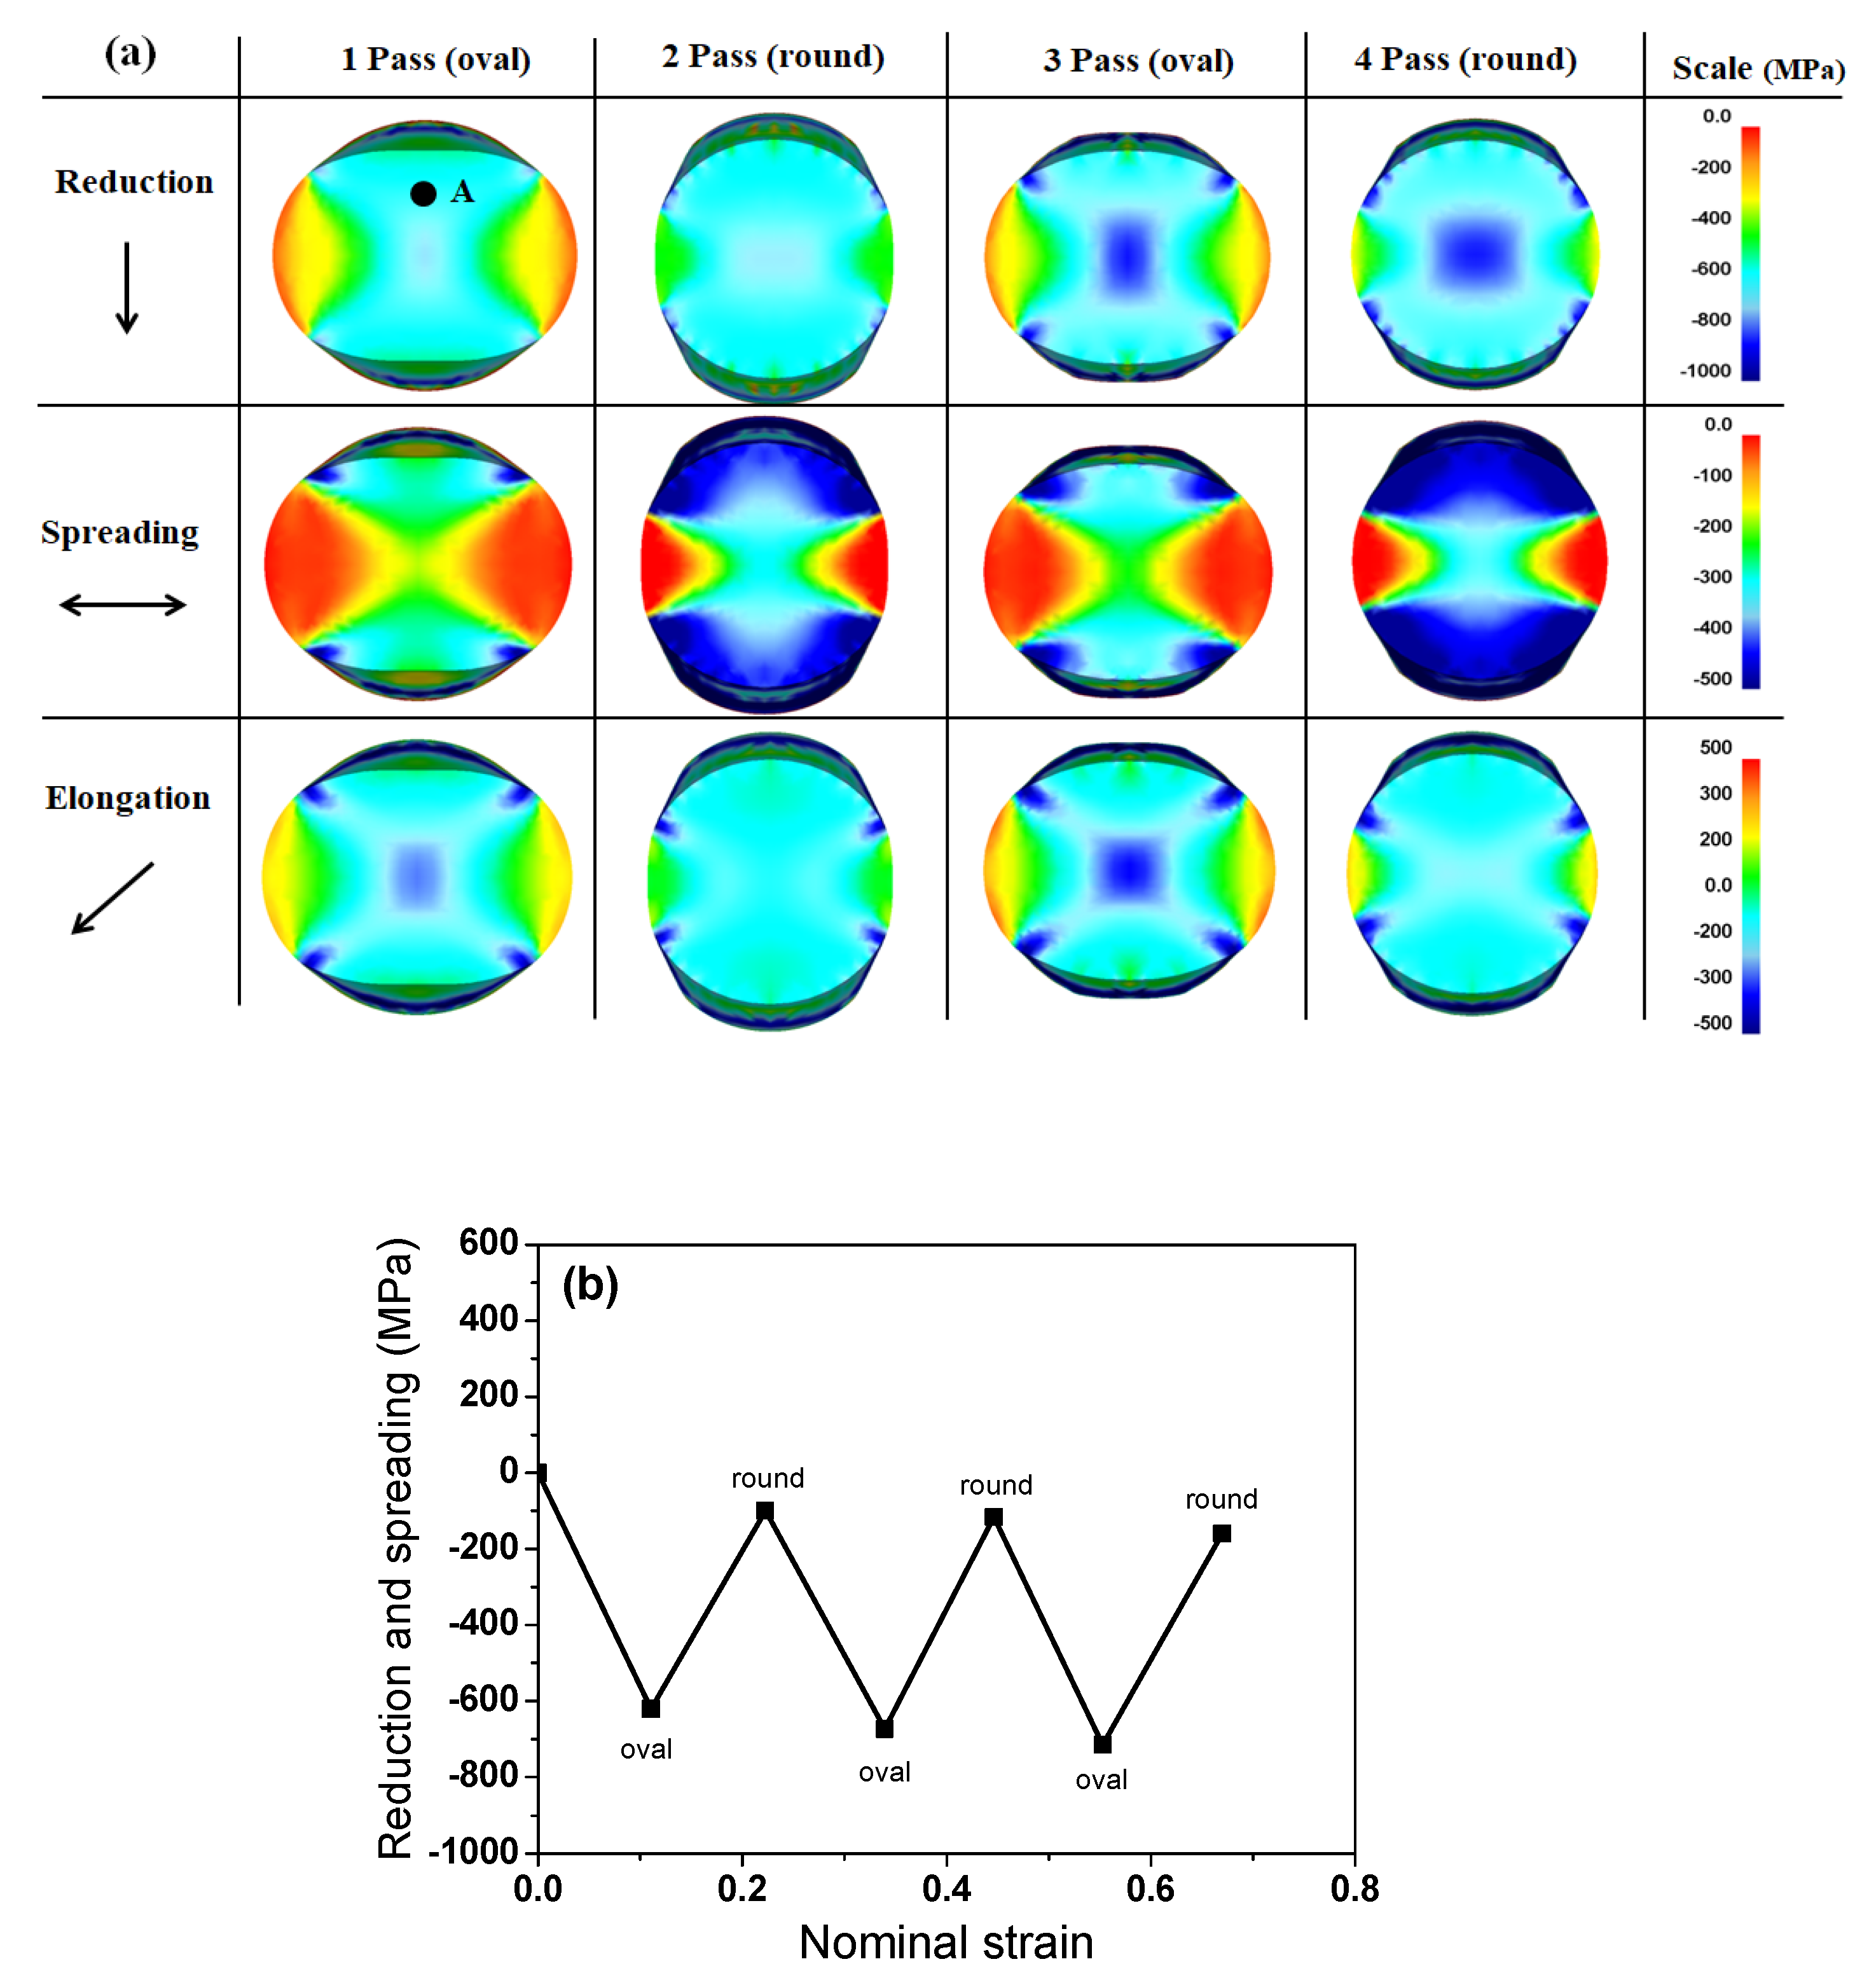
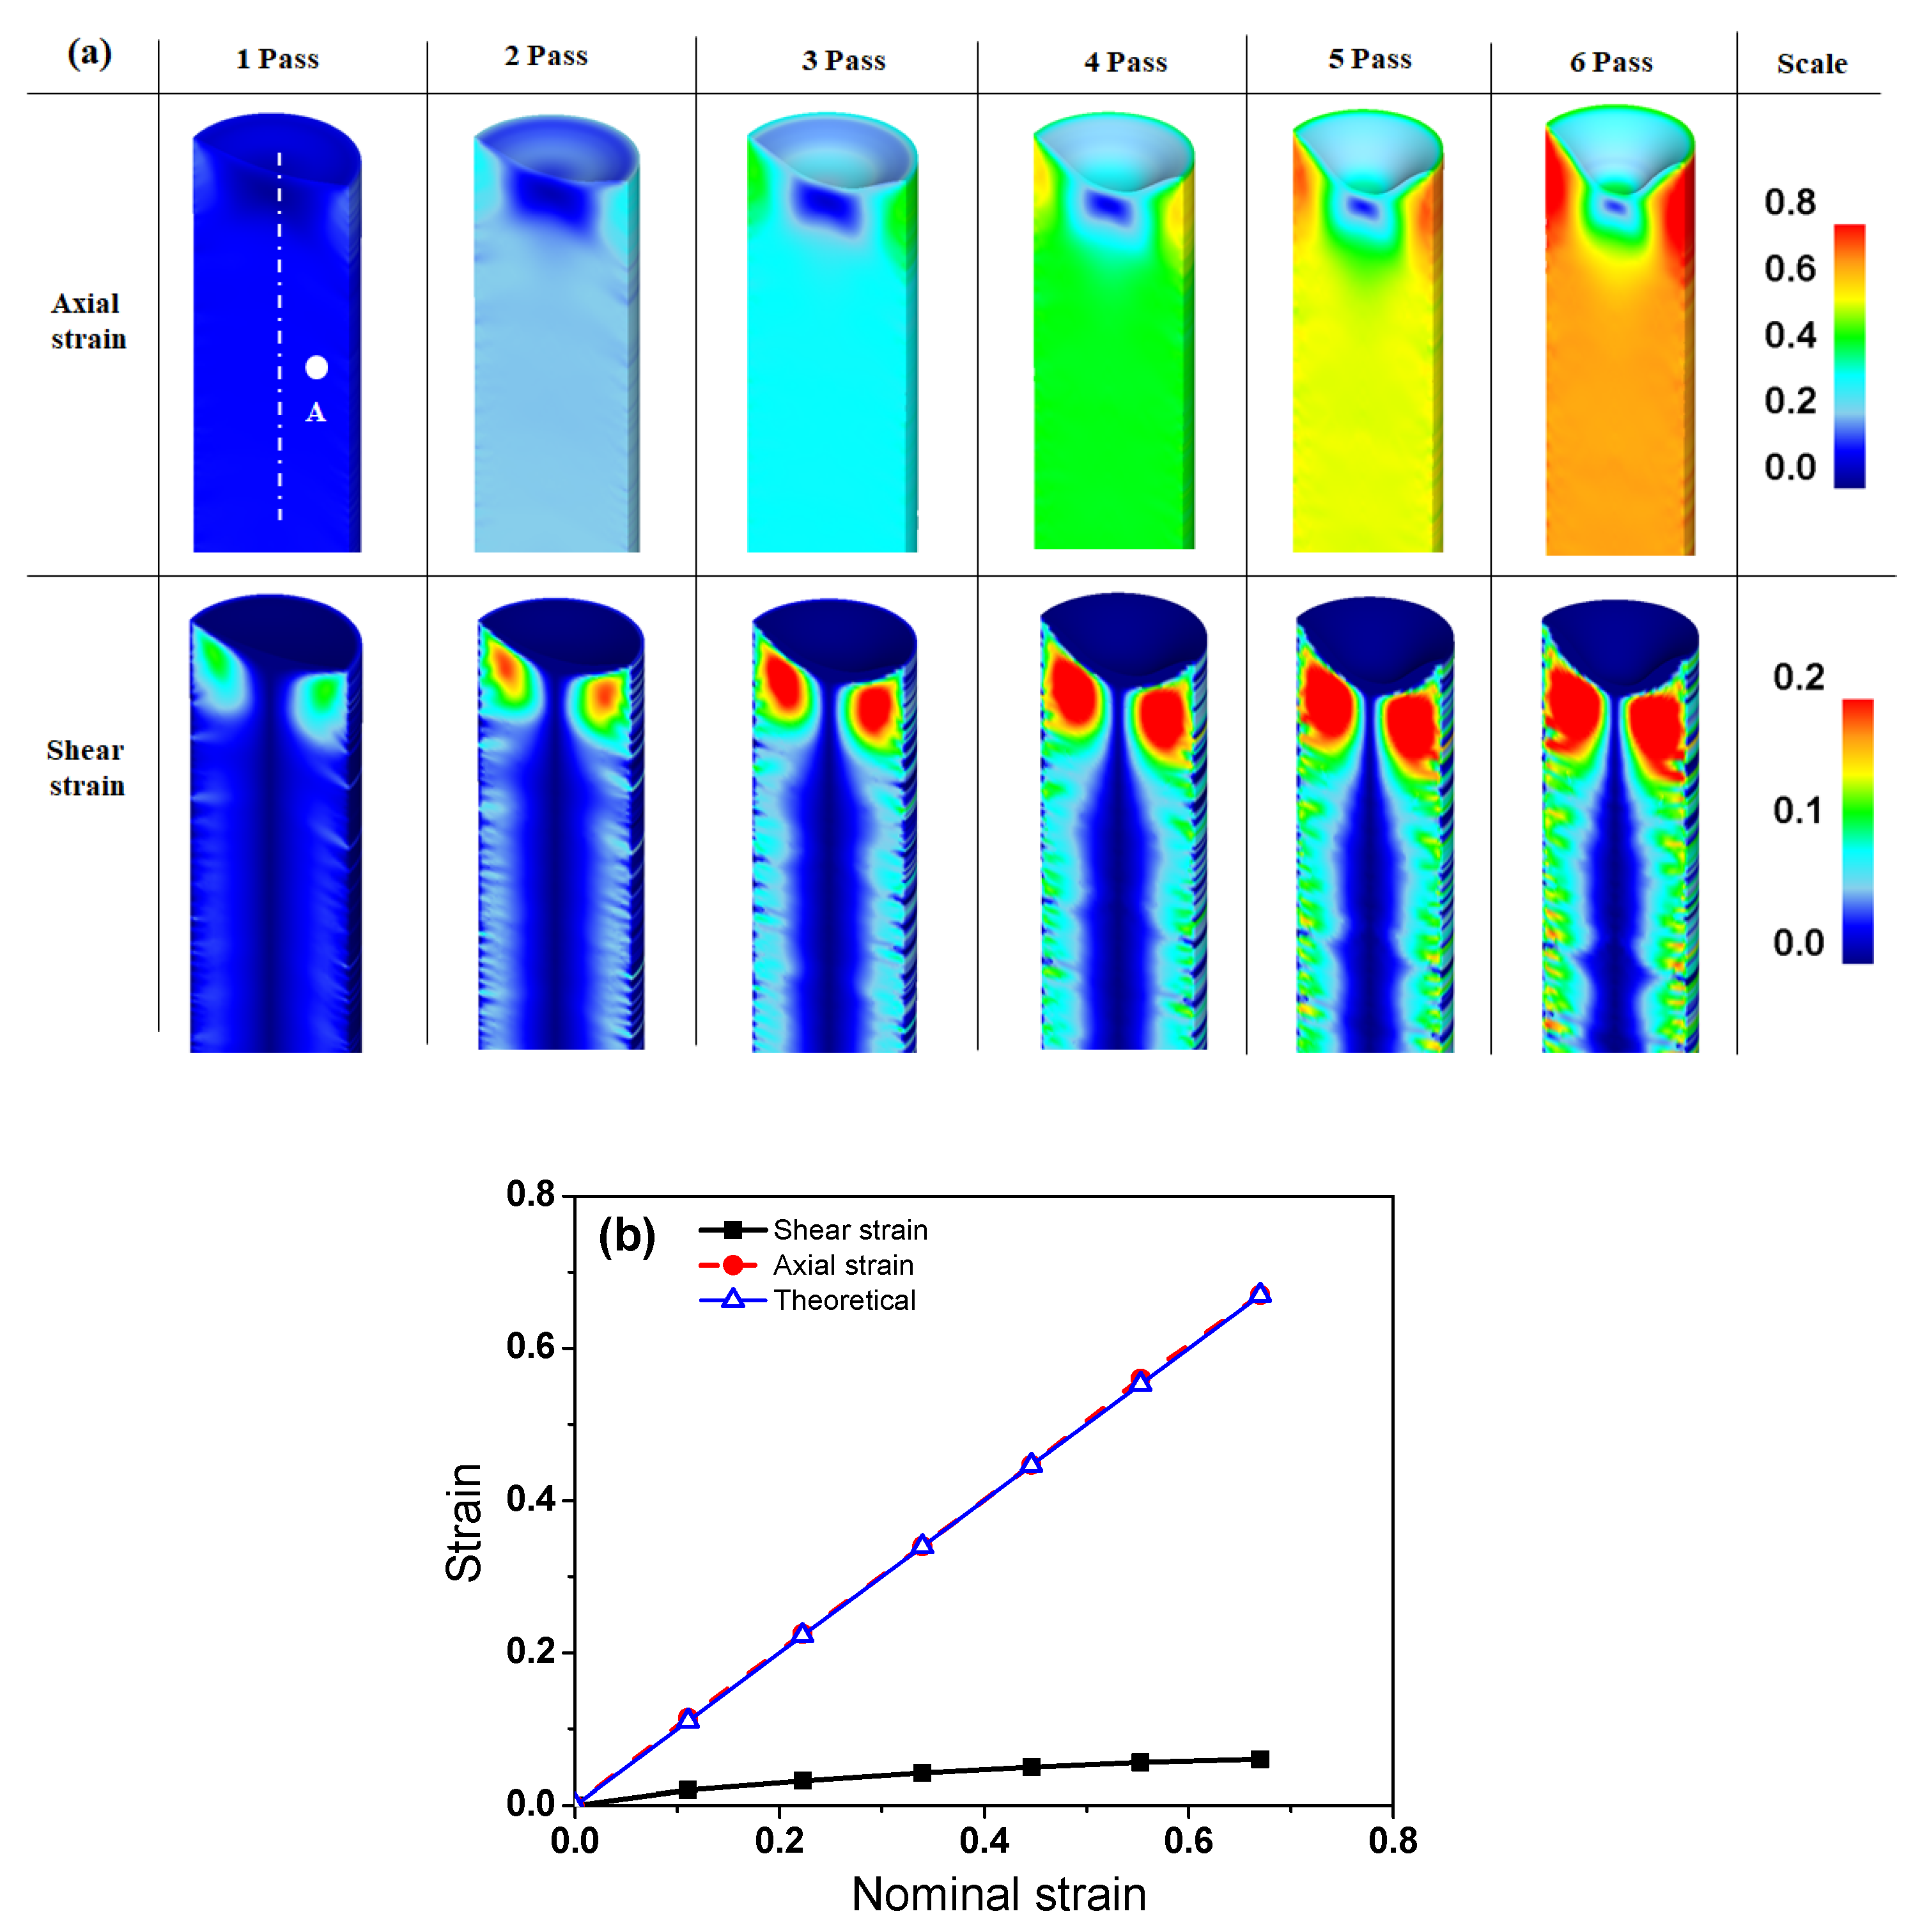
3. Results
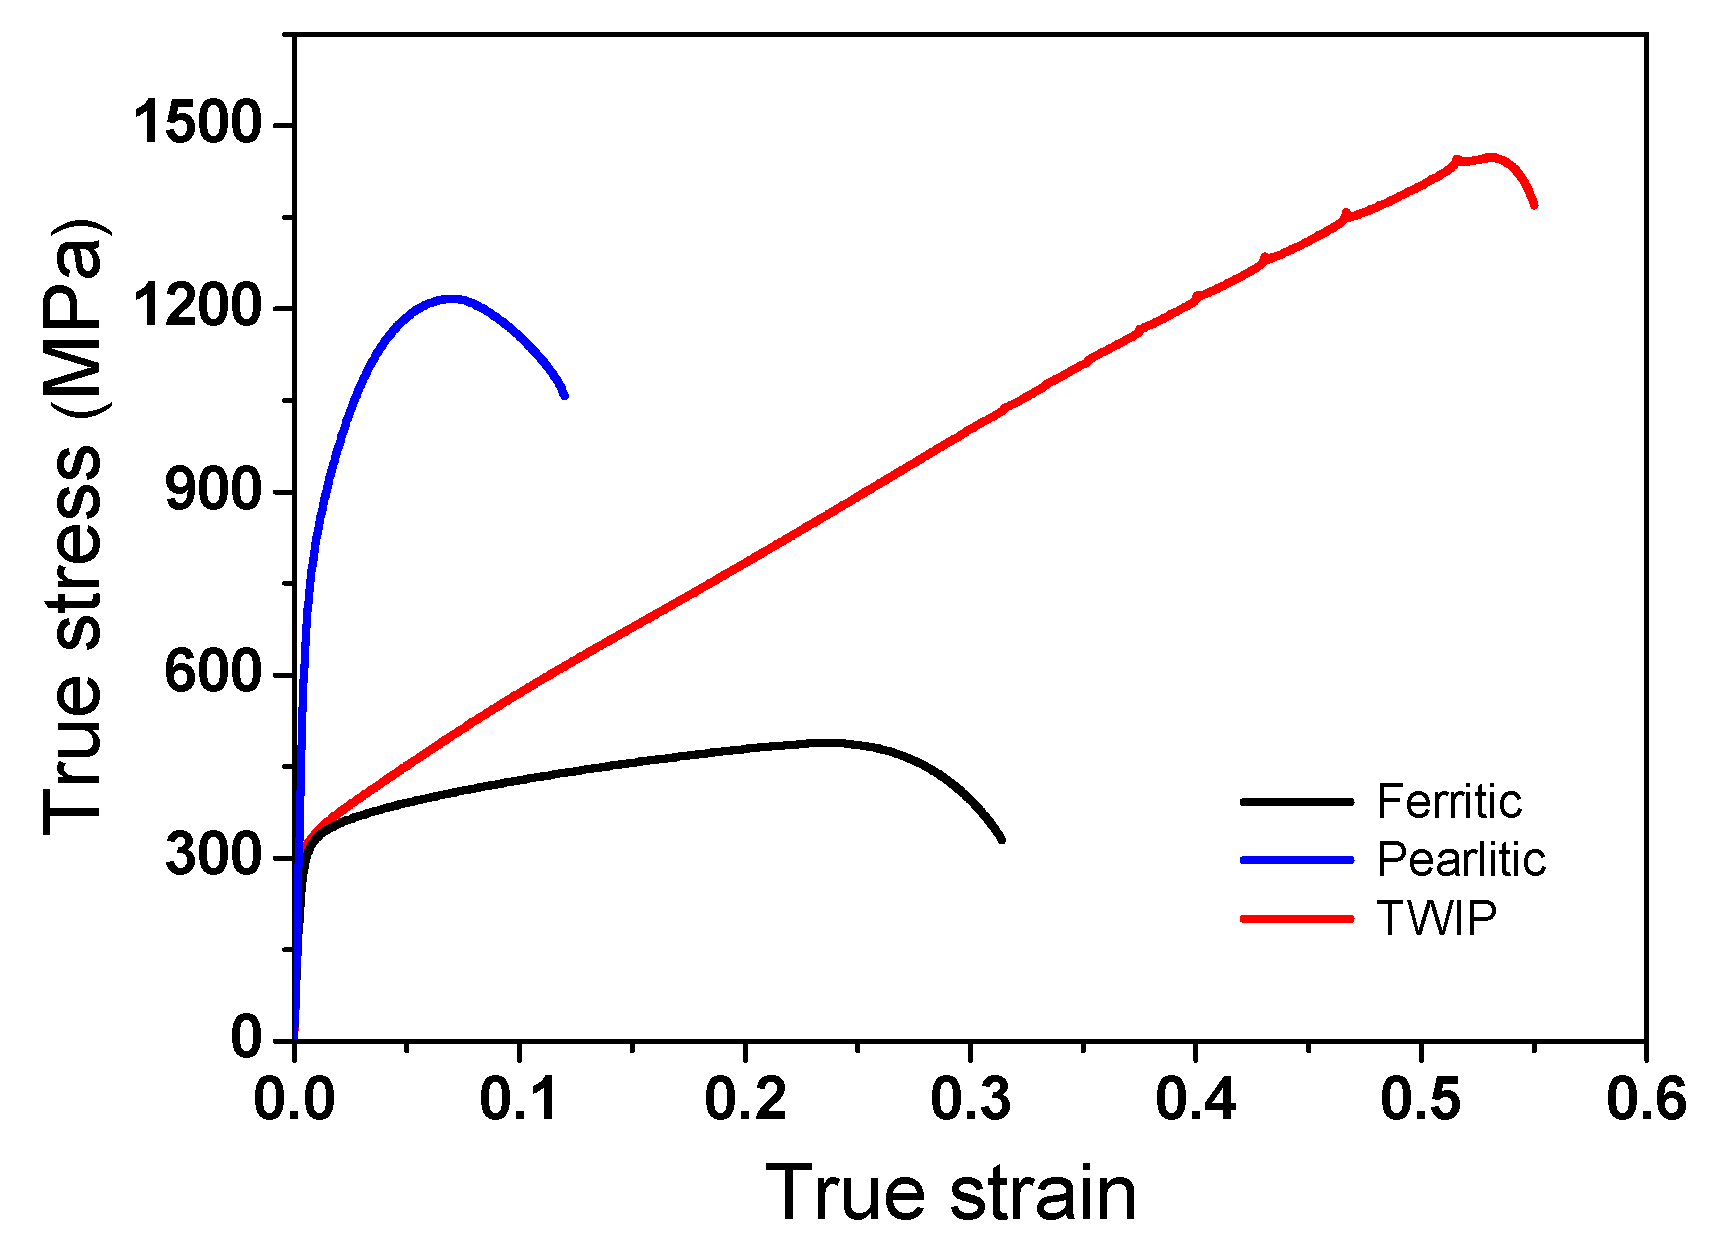
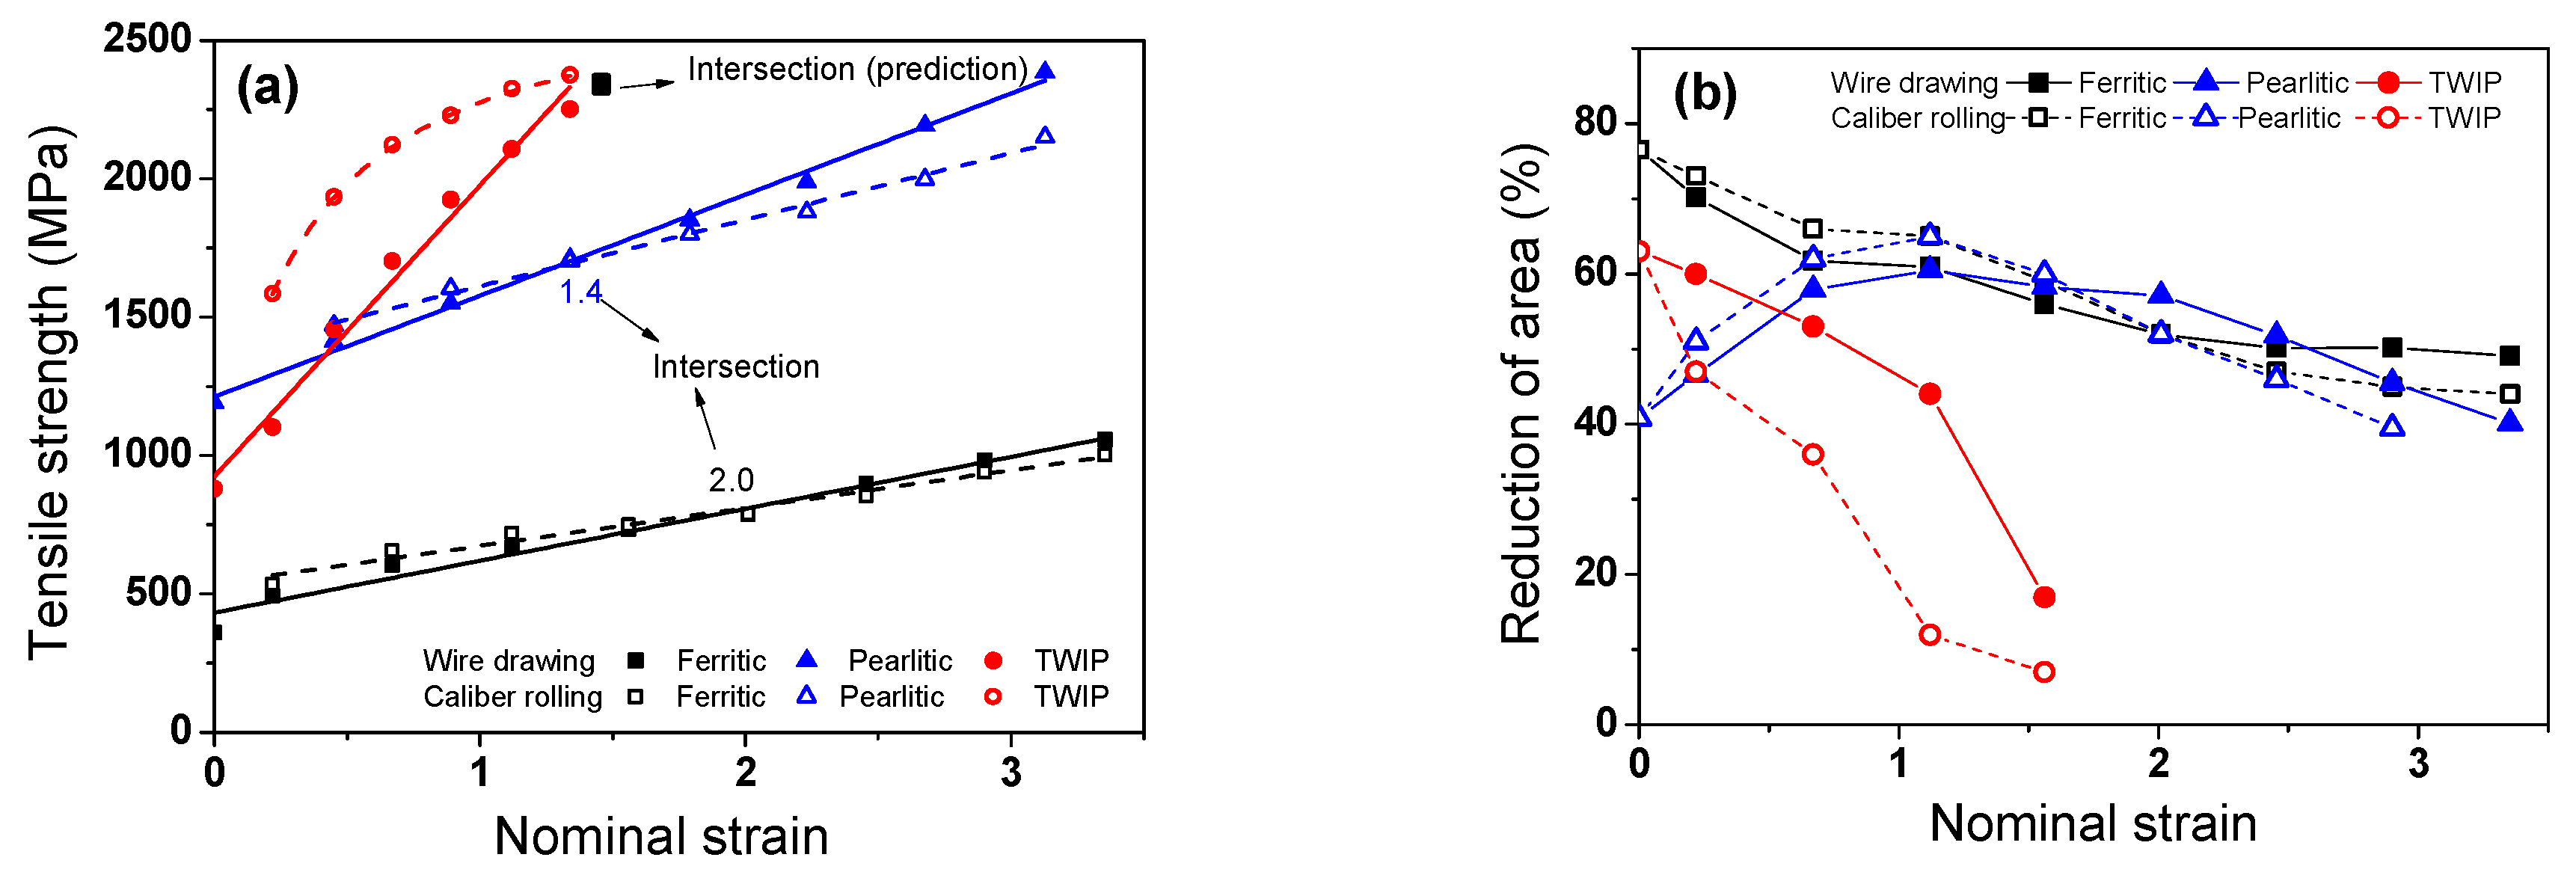
3.1. Mechanical Properties
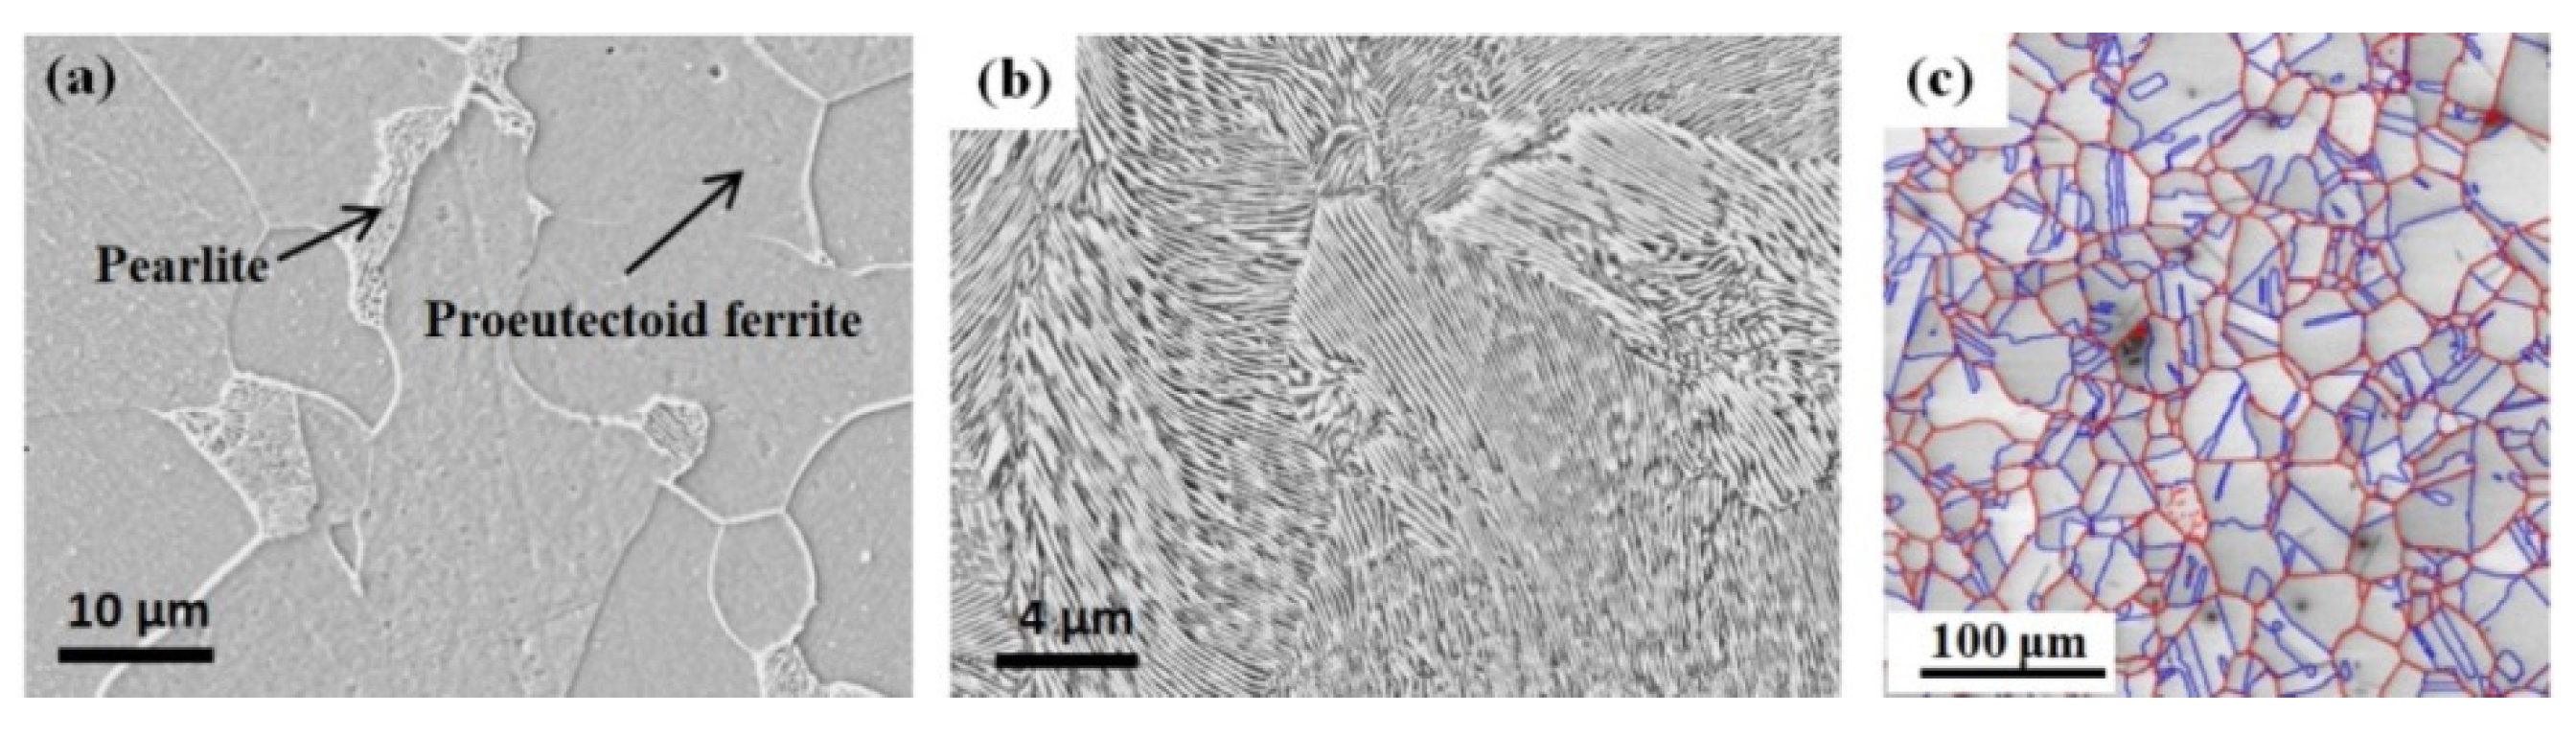
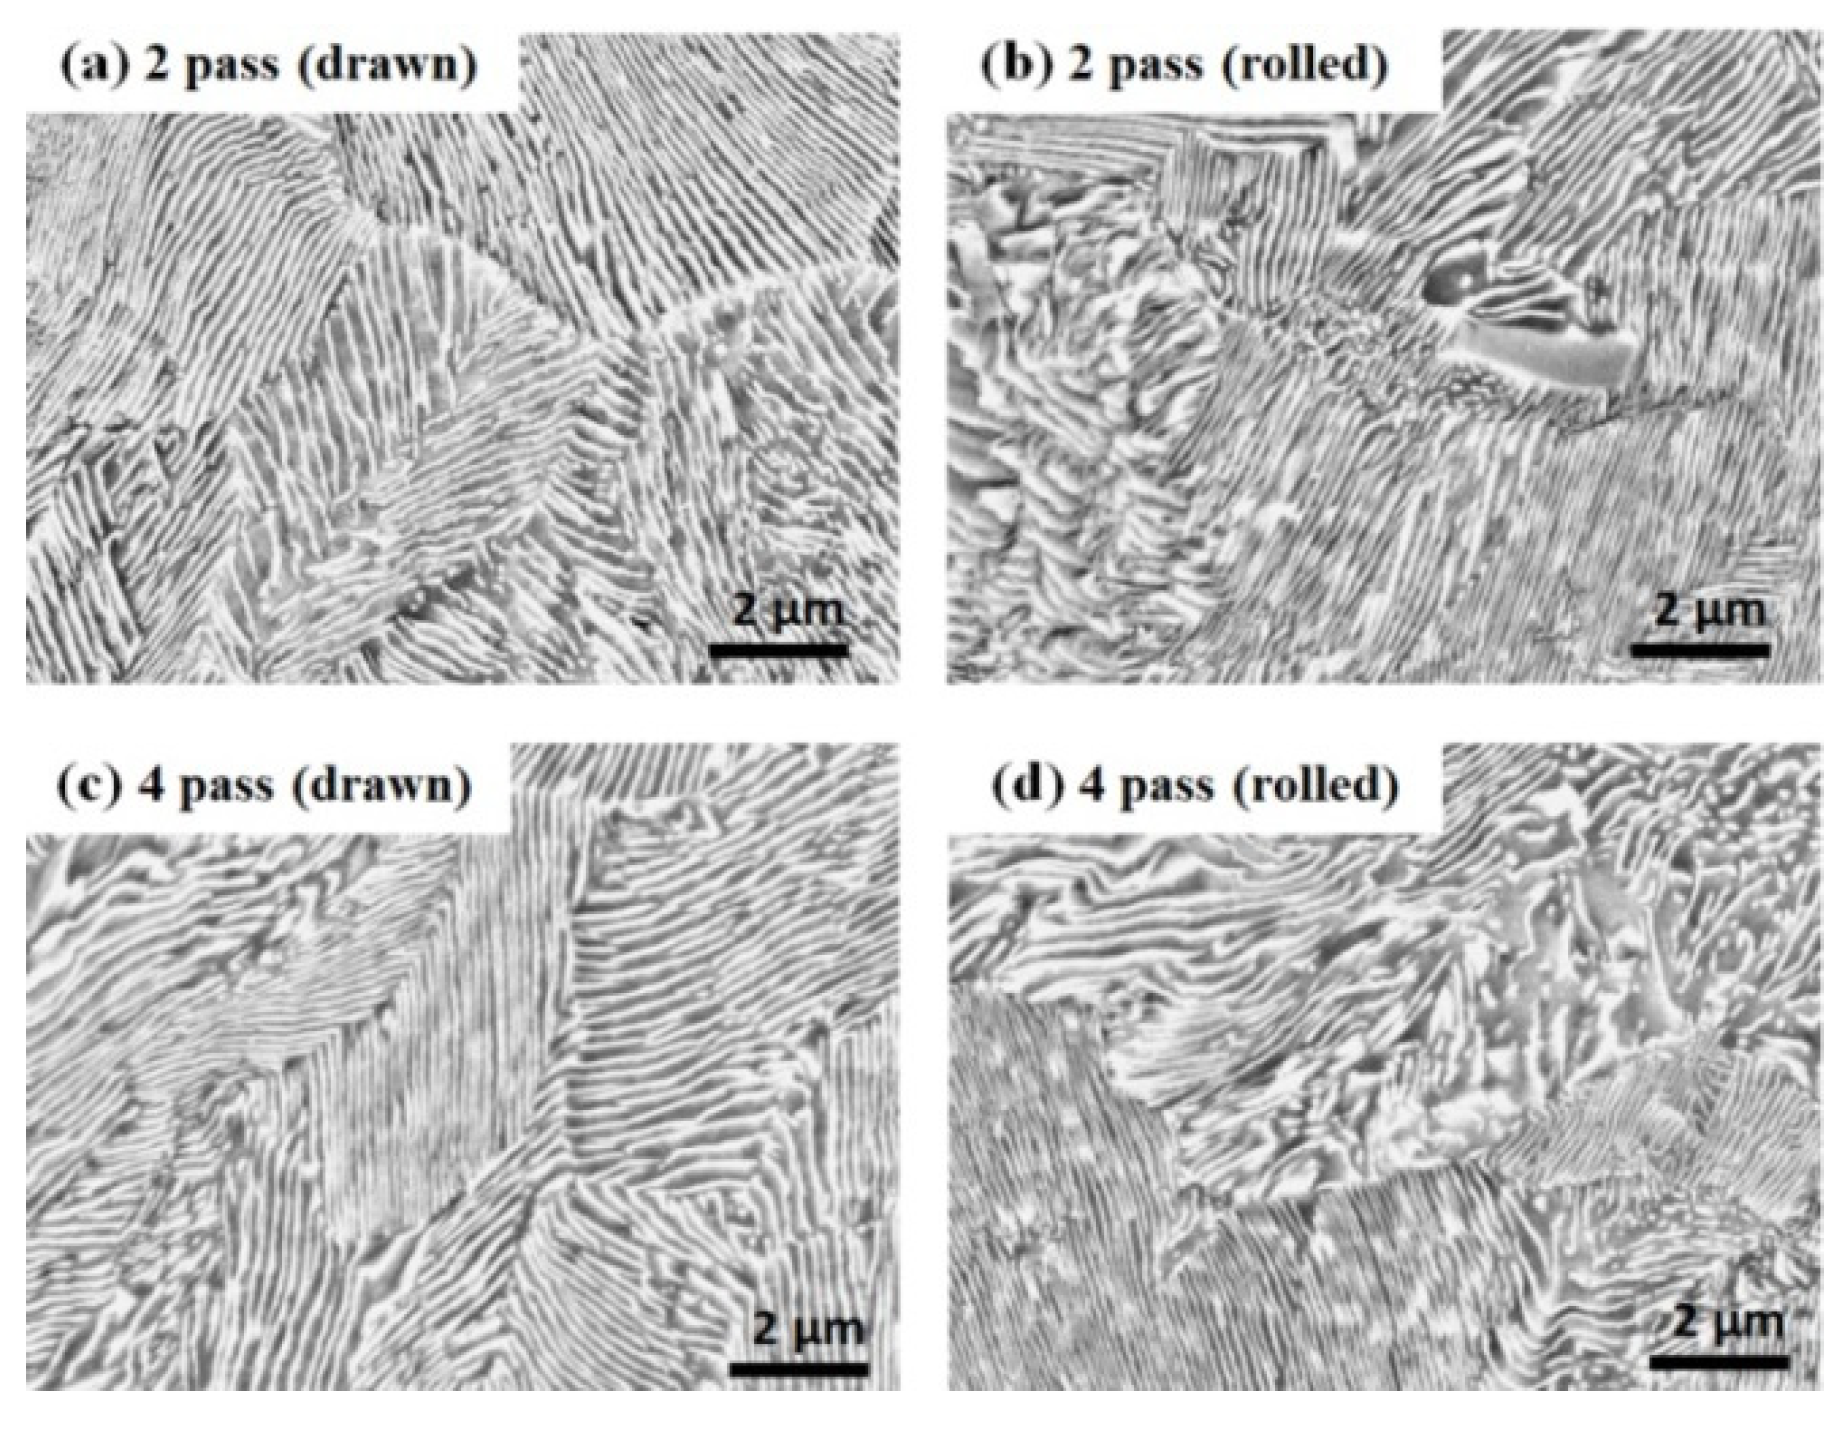
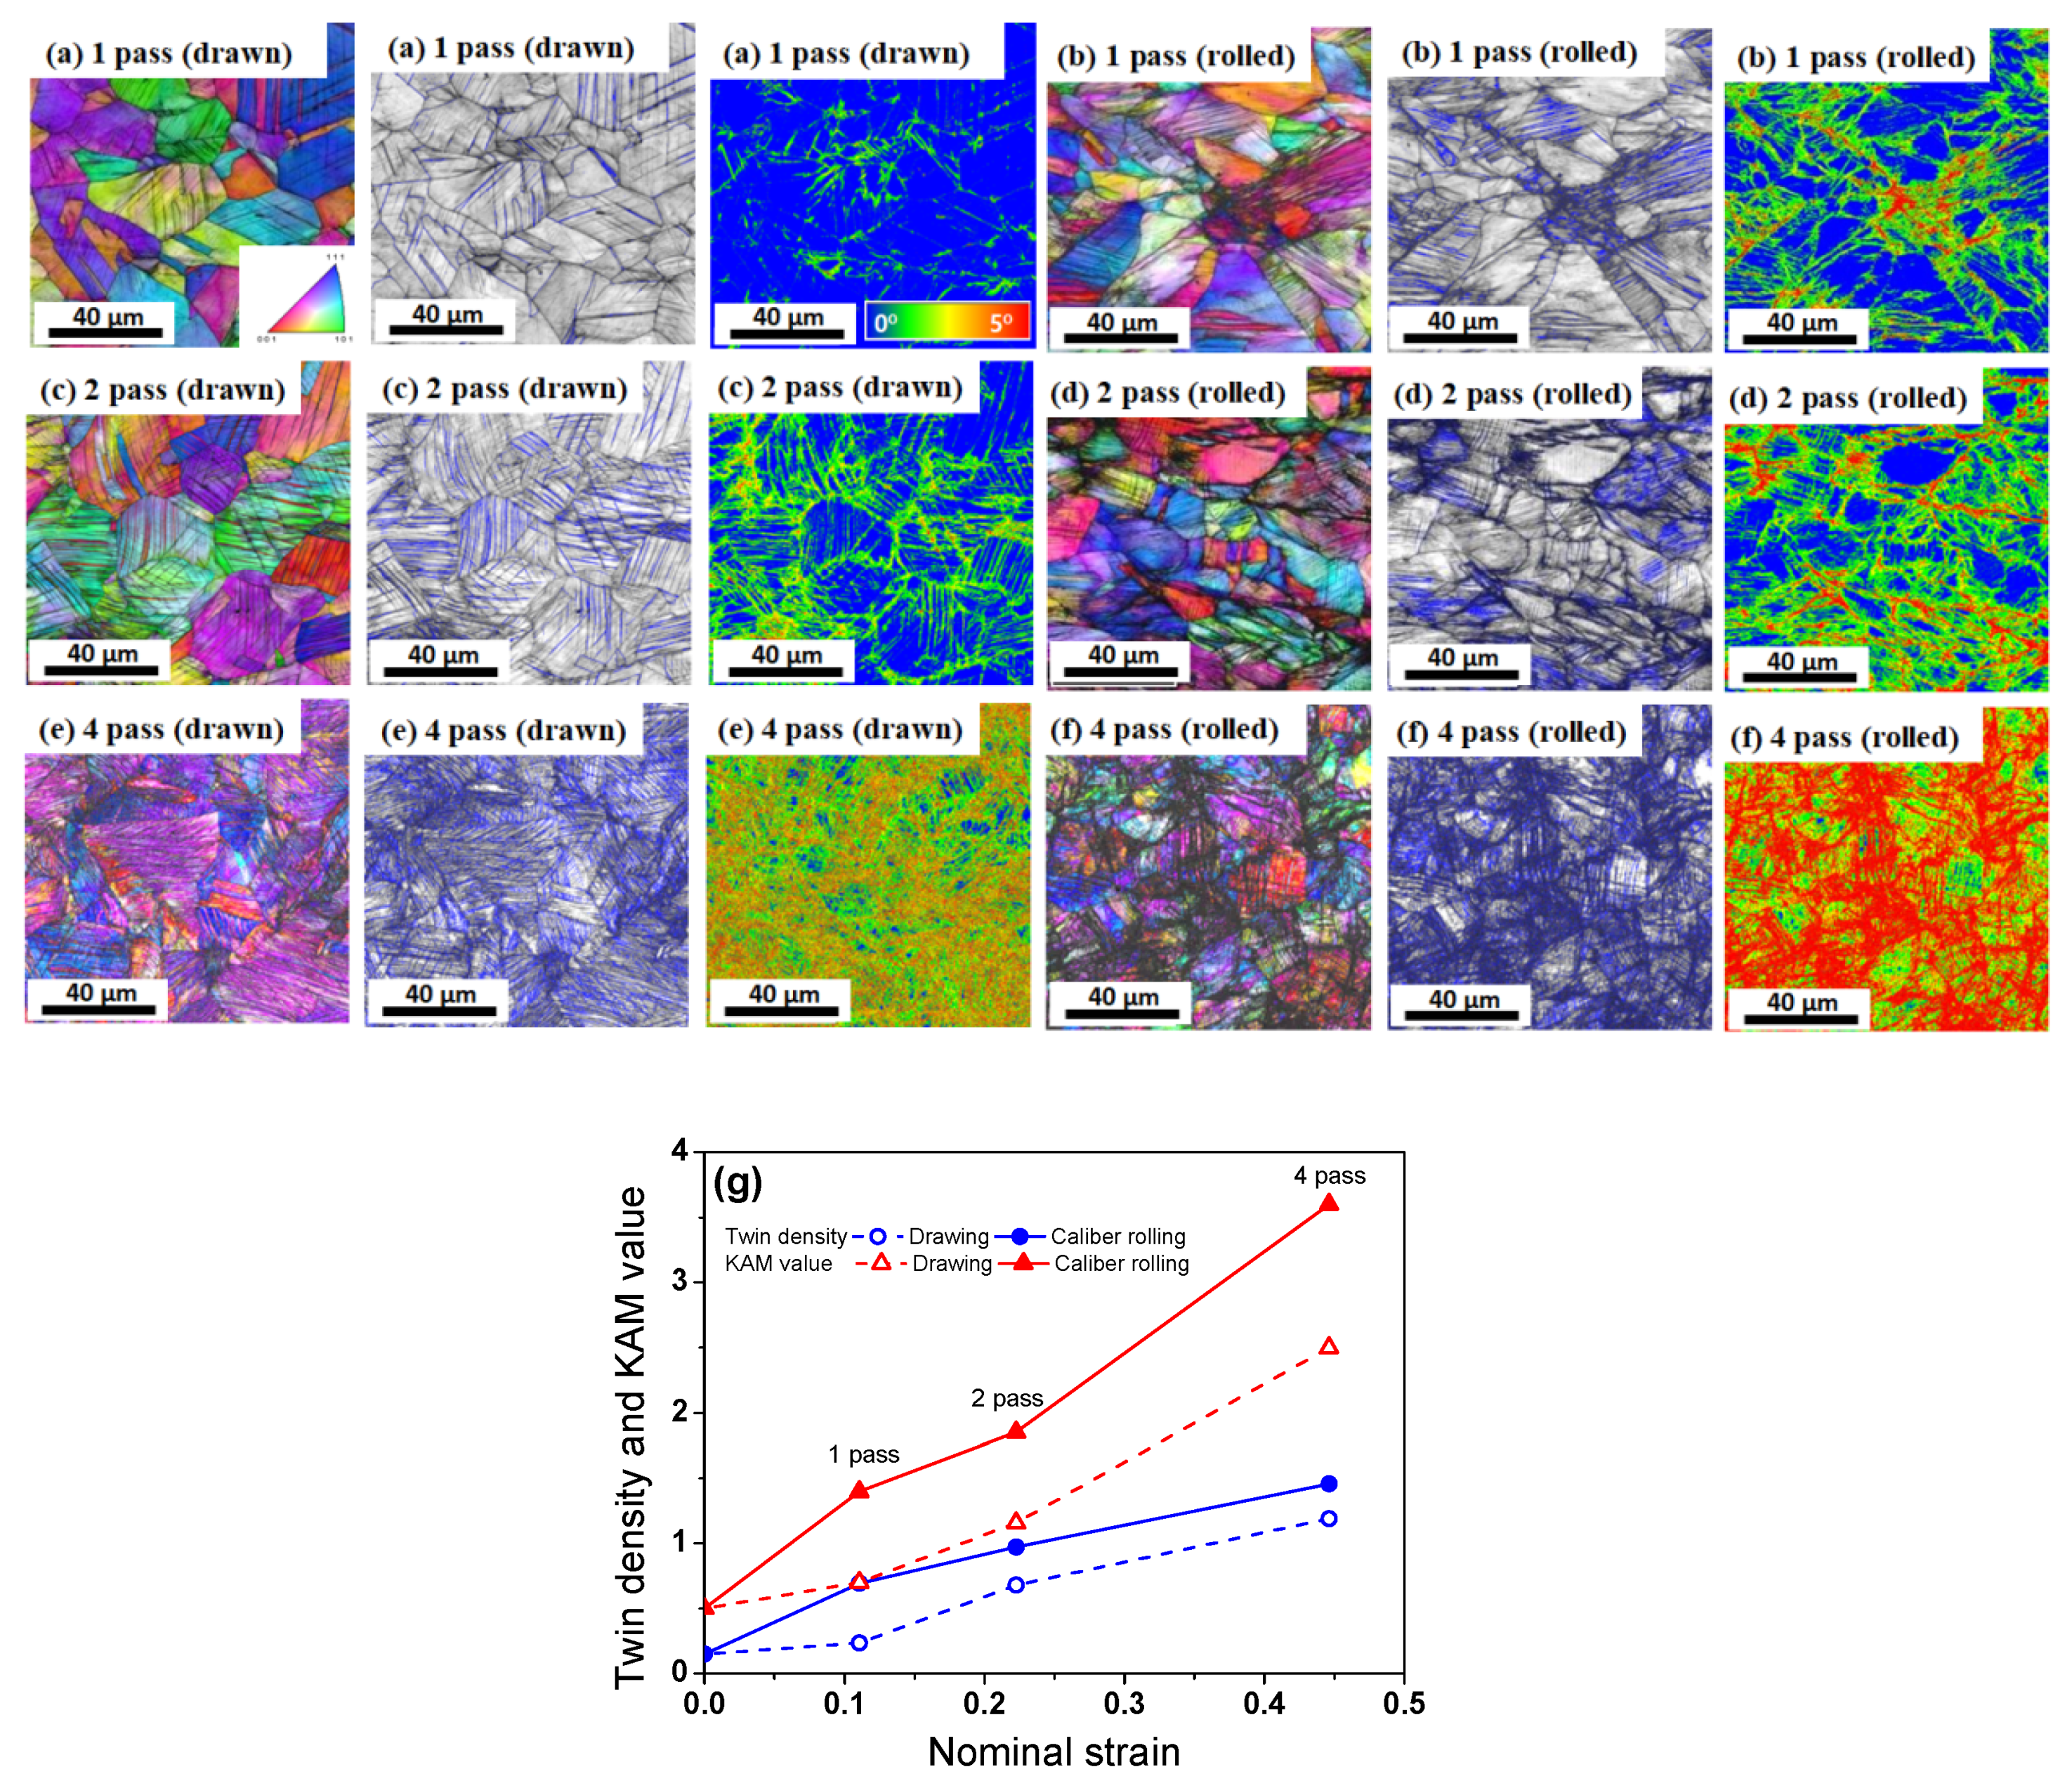
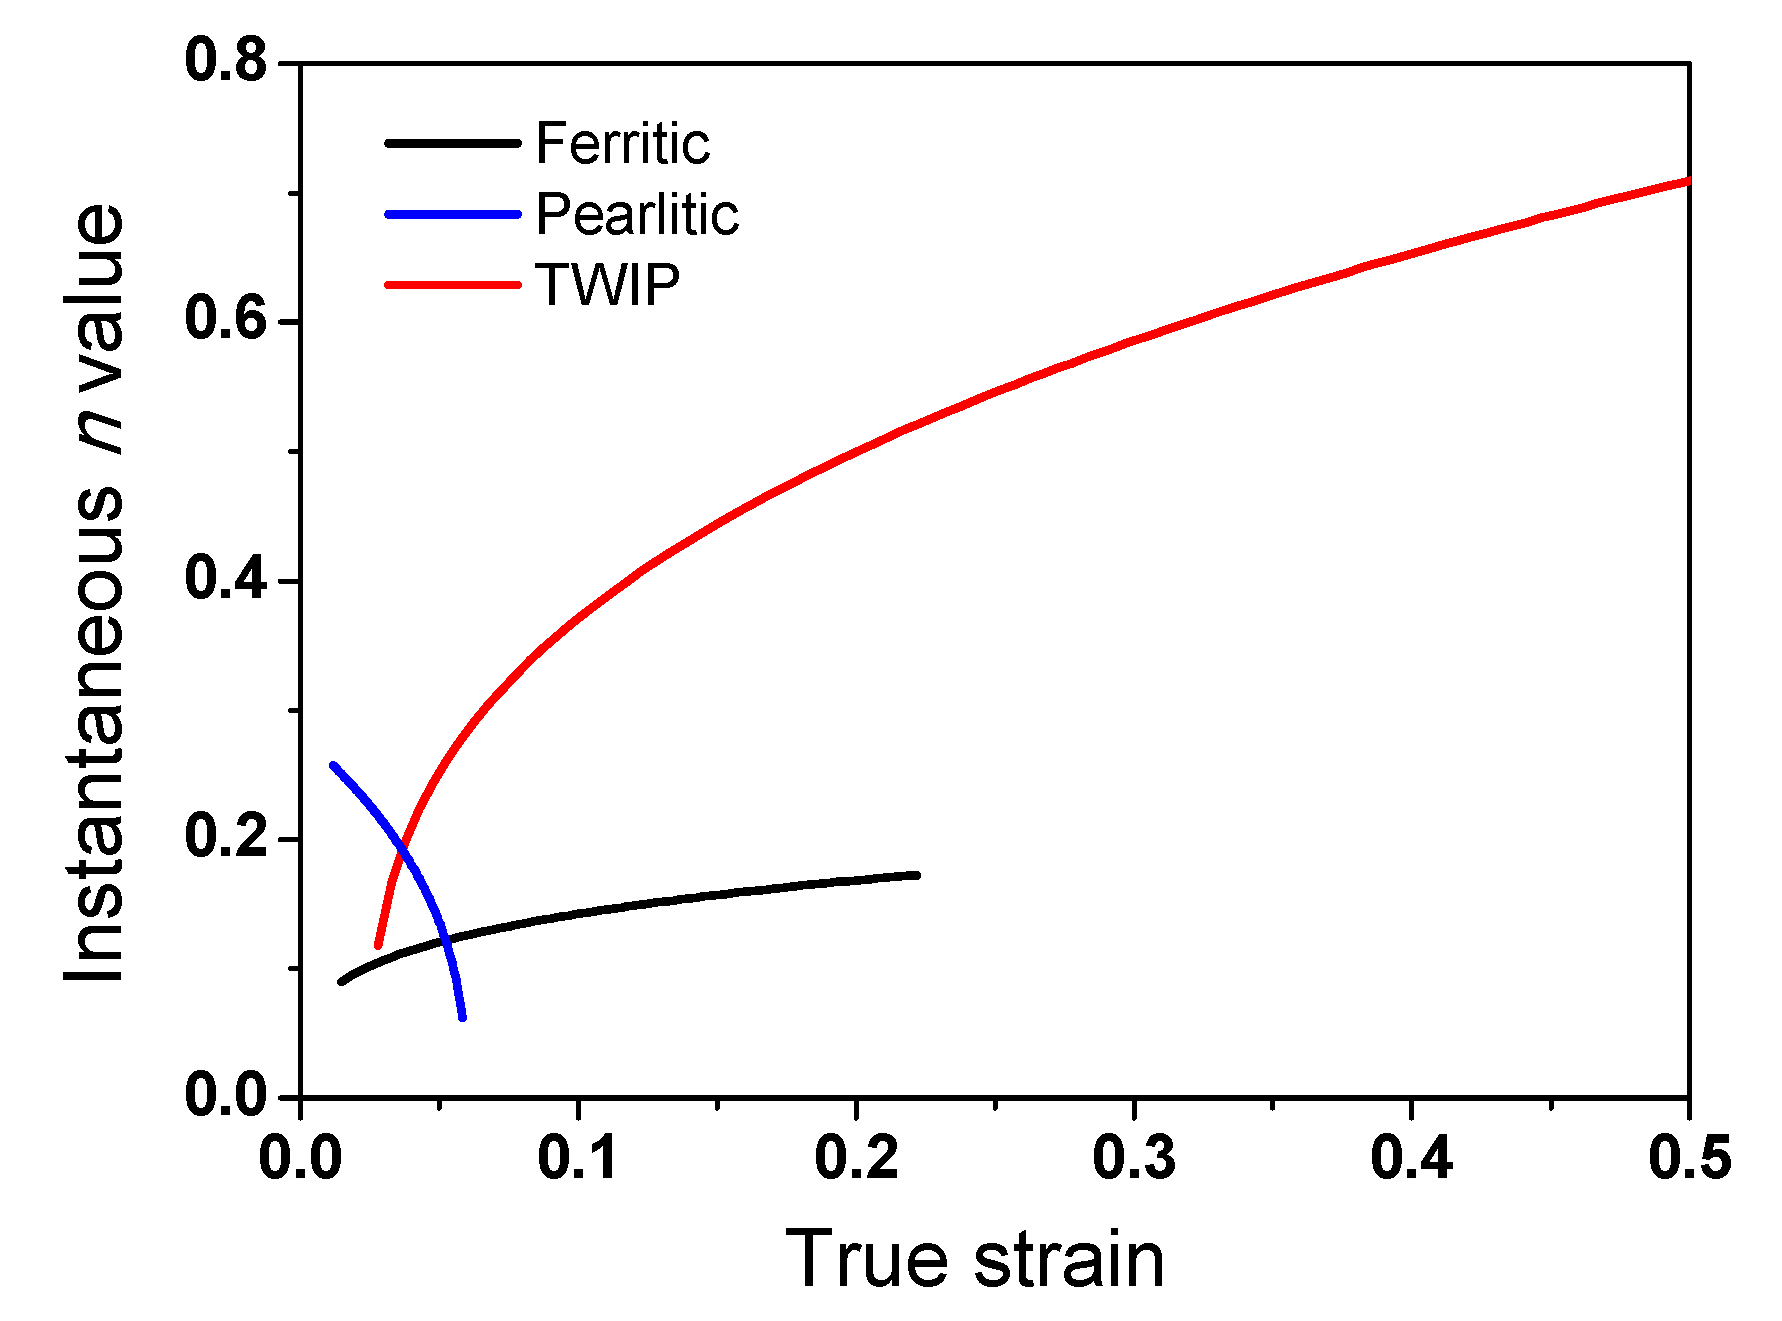
3.2. Microstructural Evolution
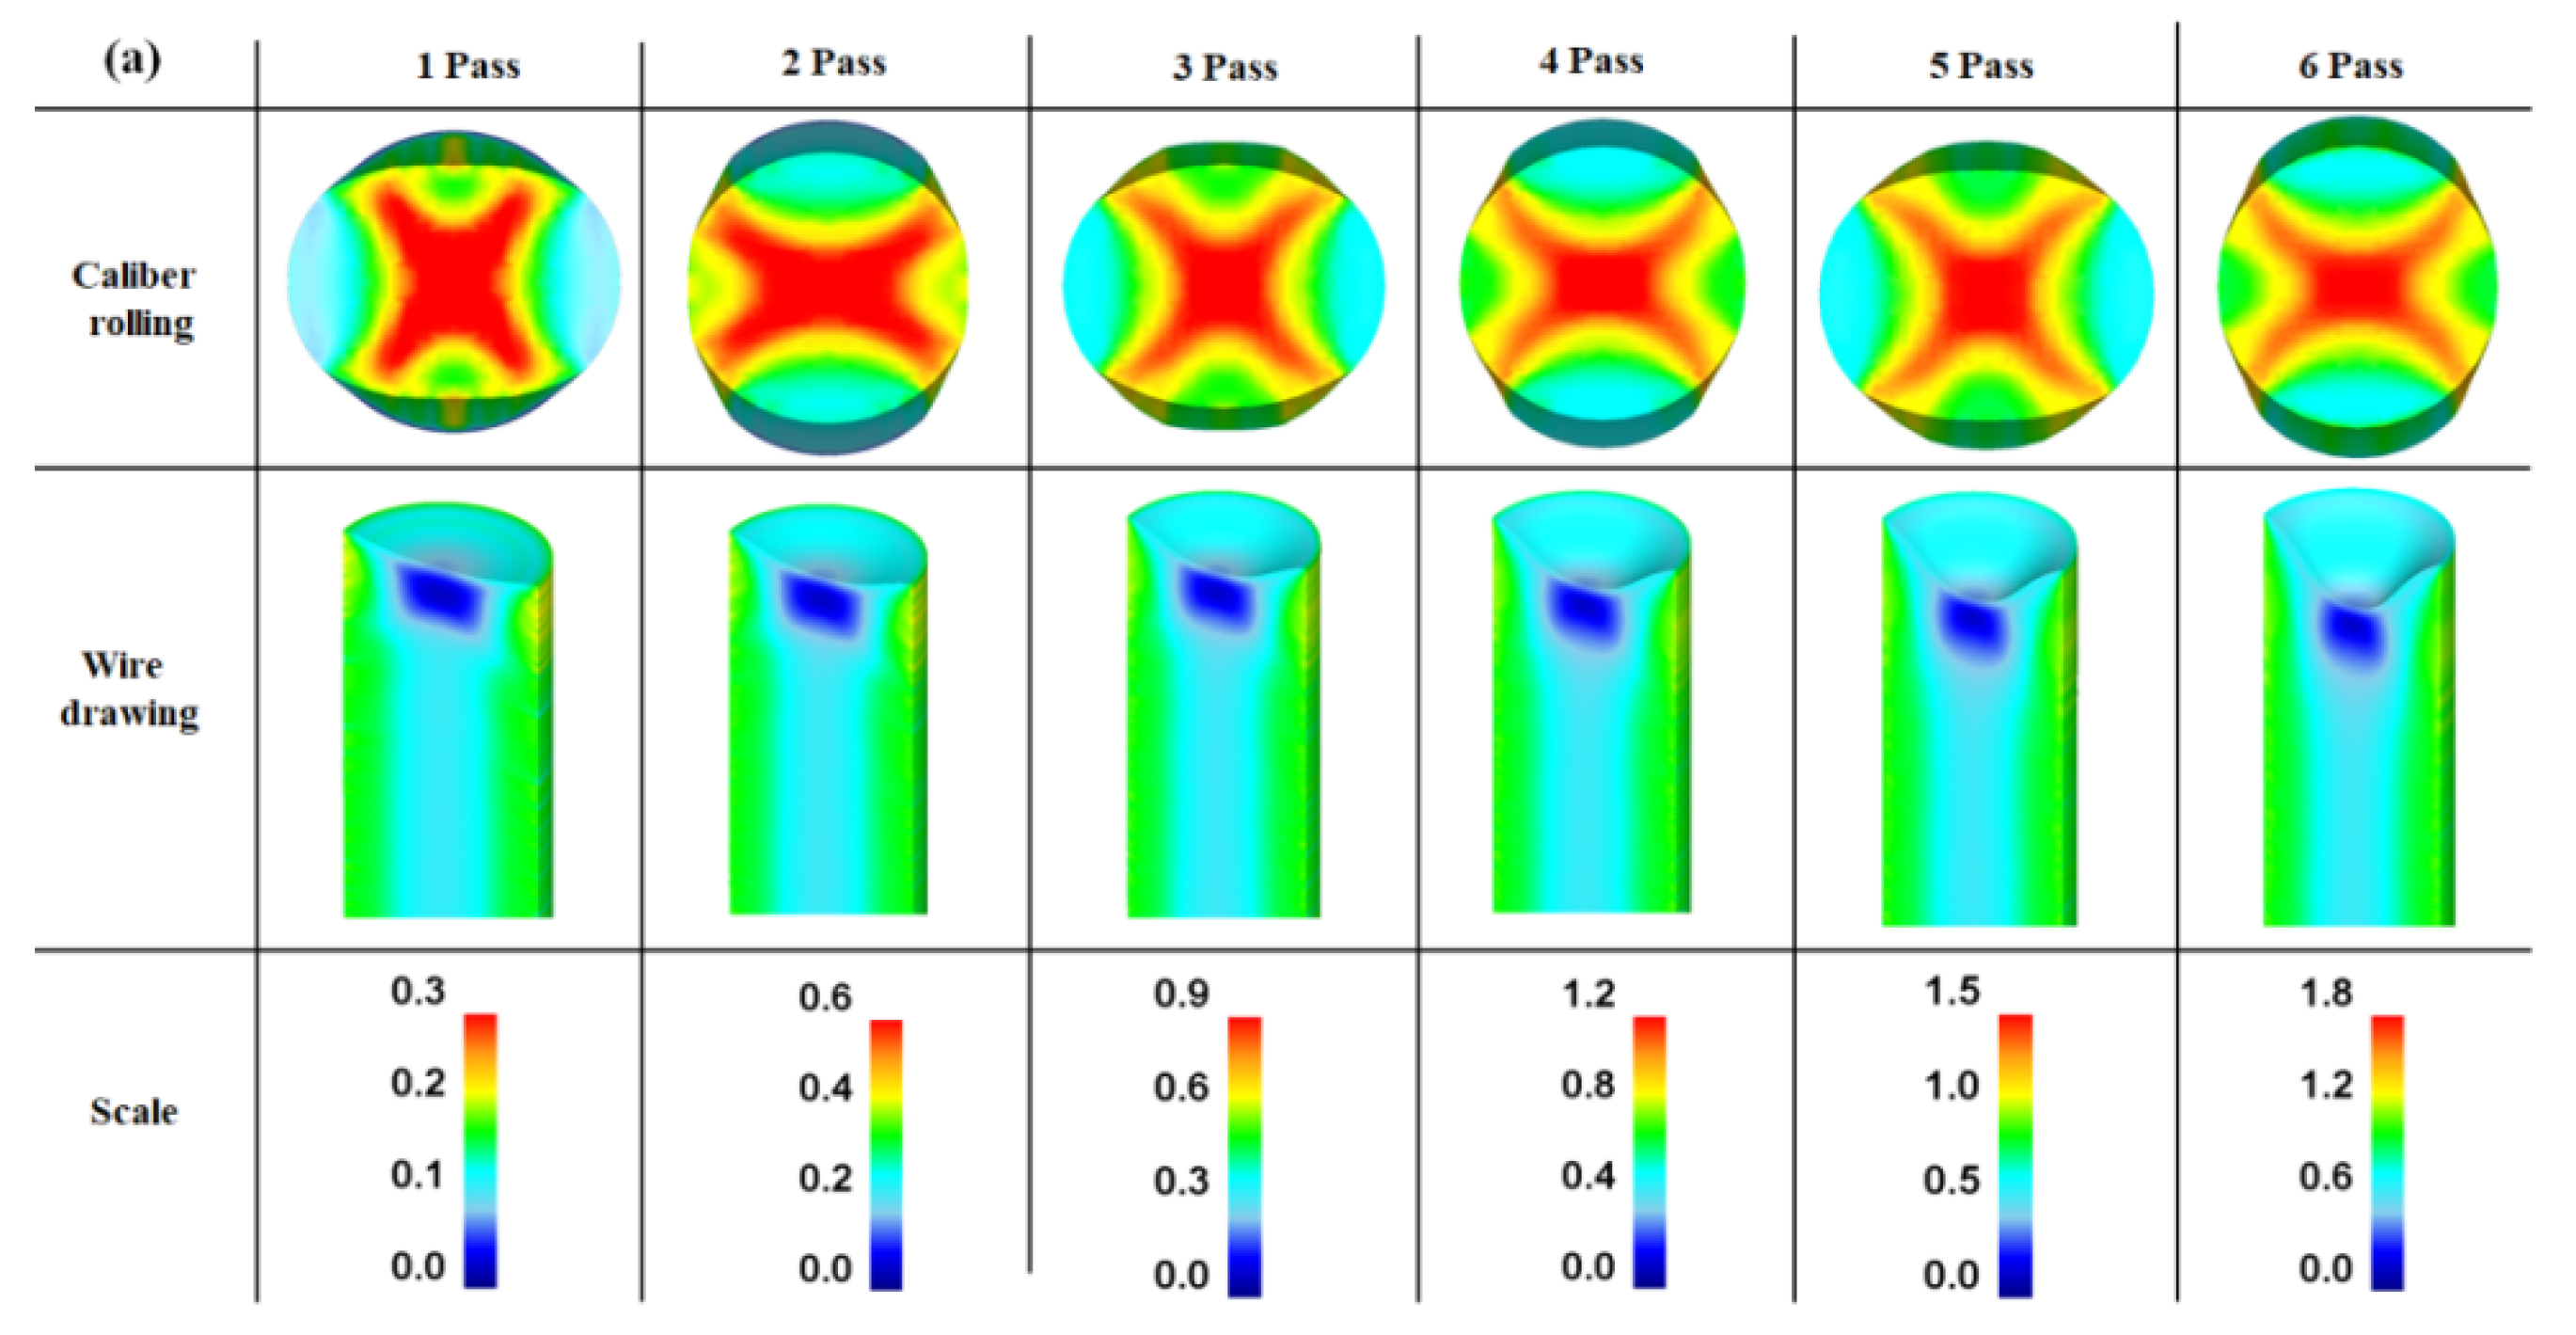
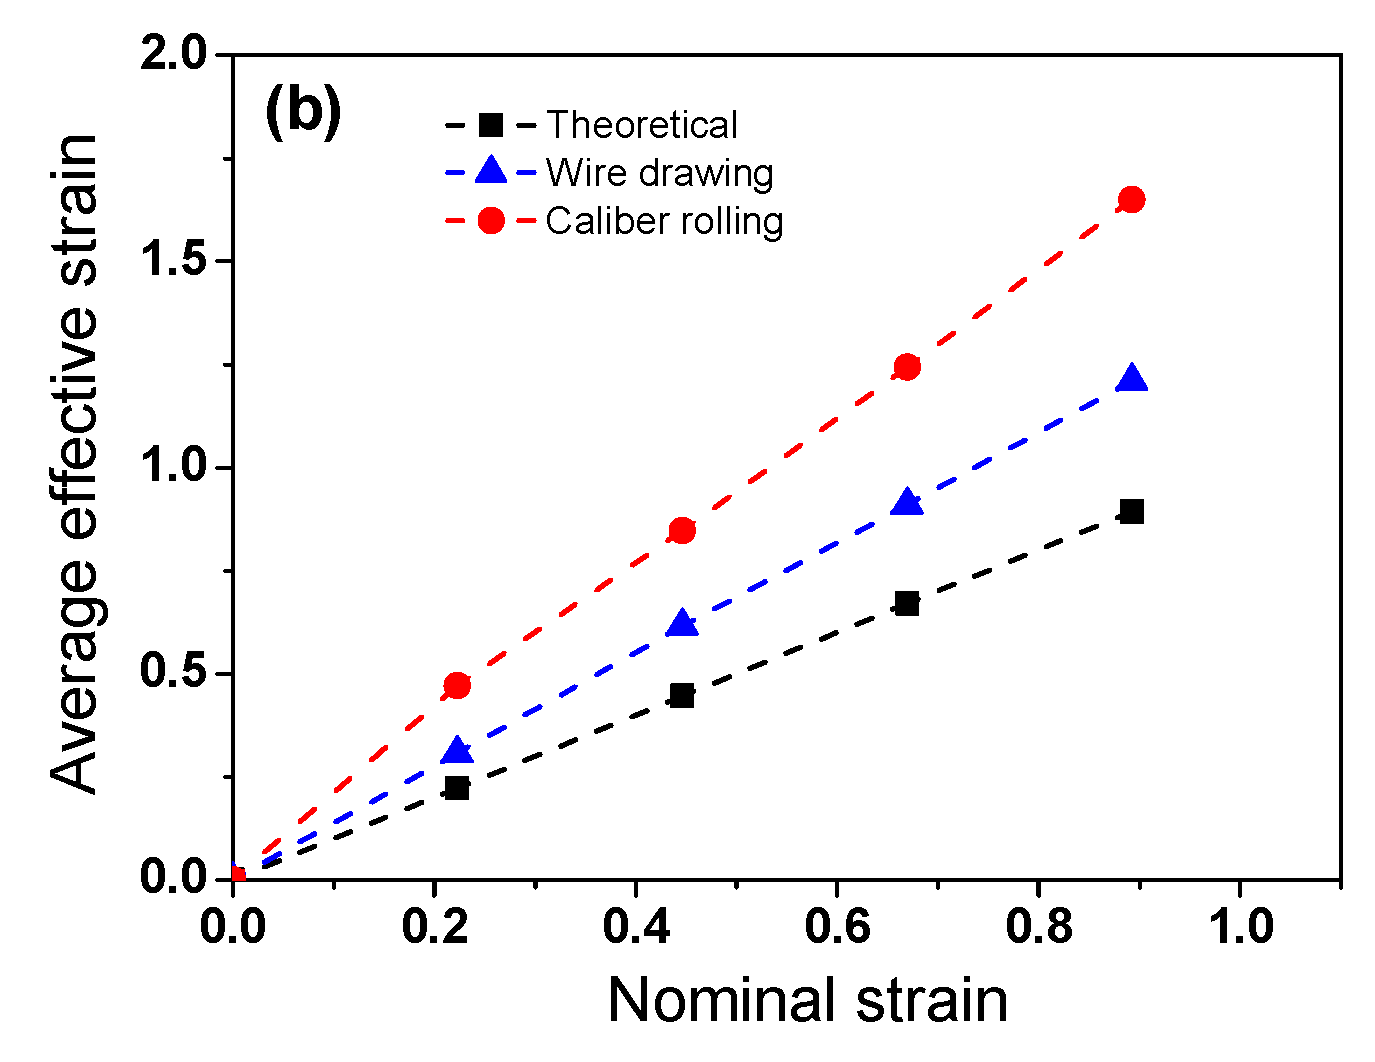
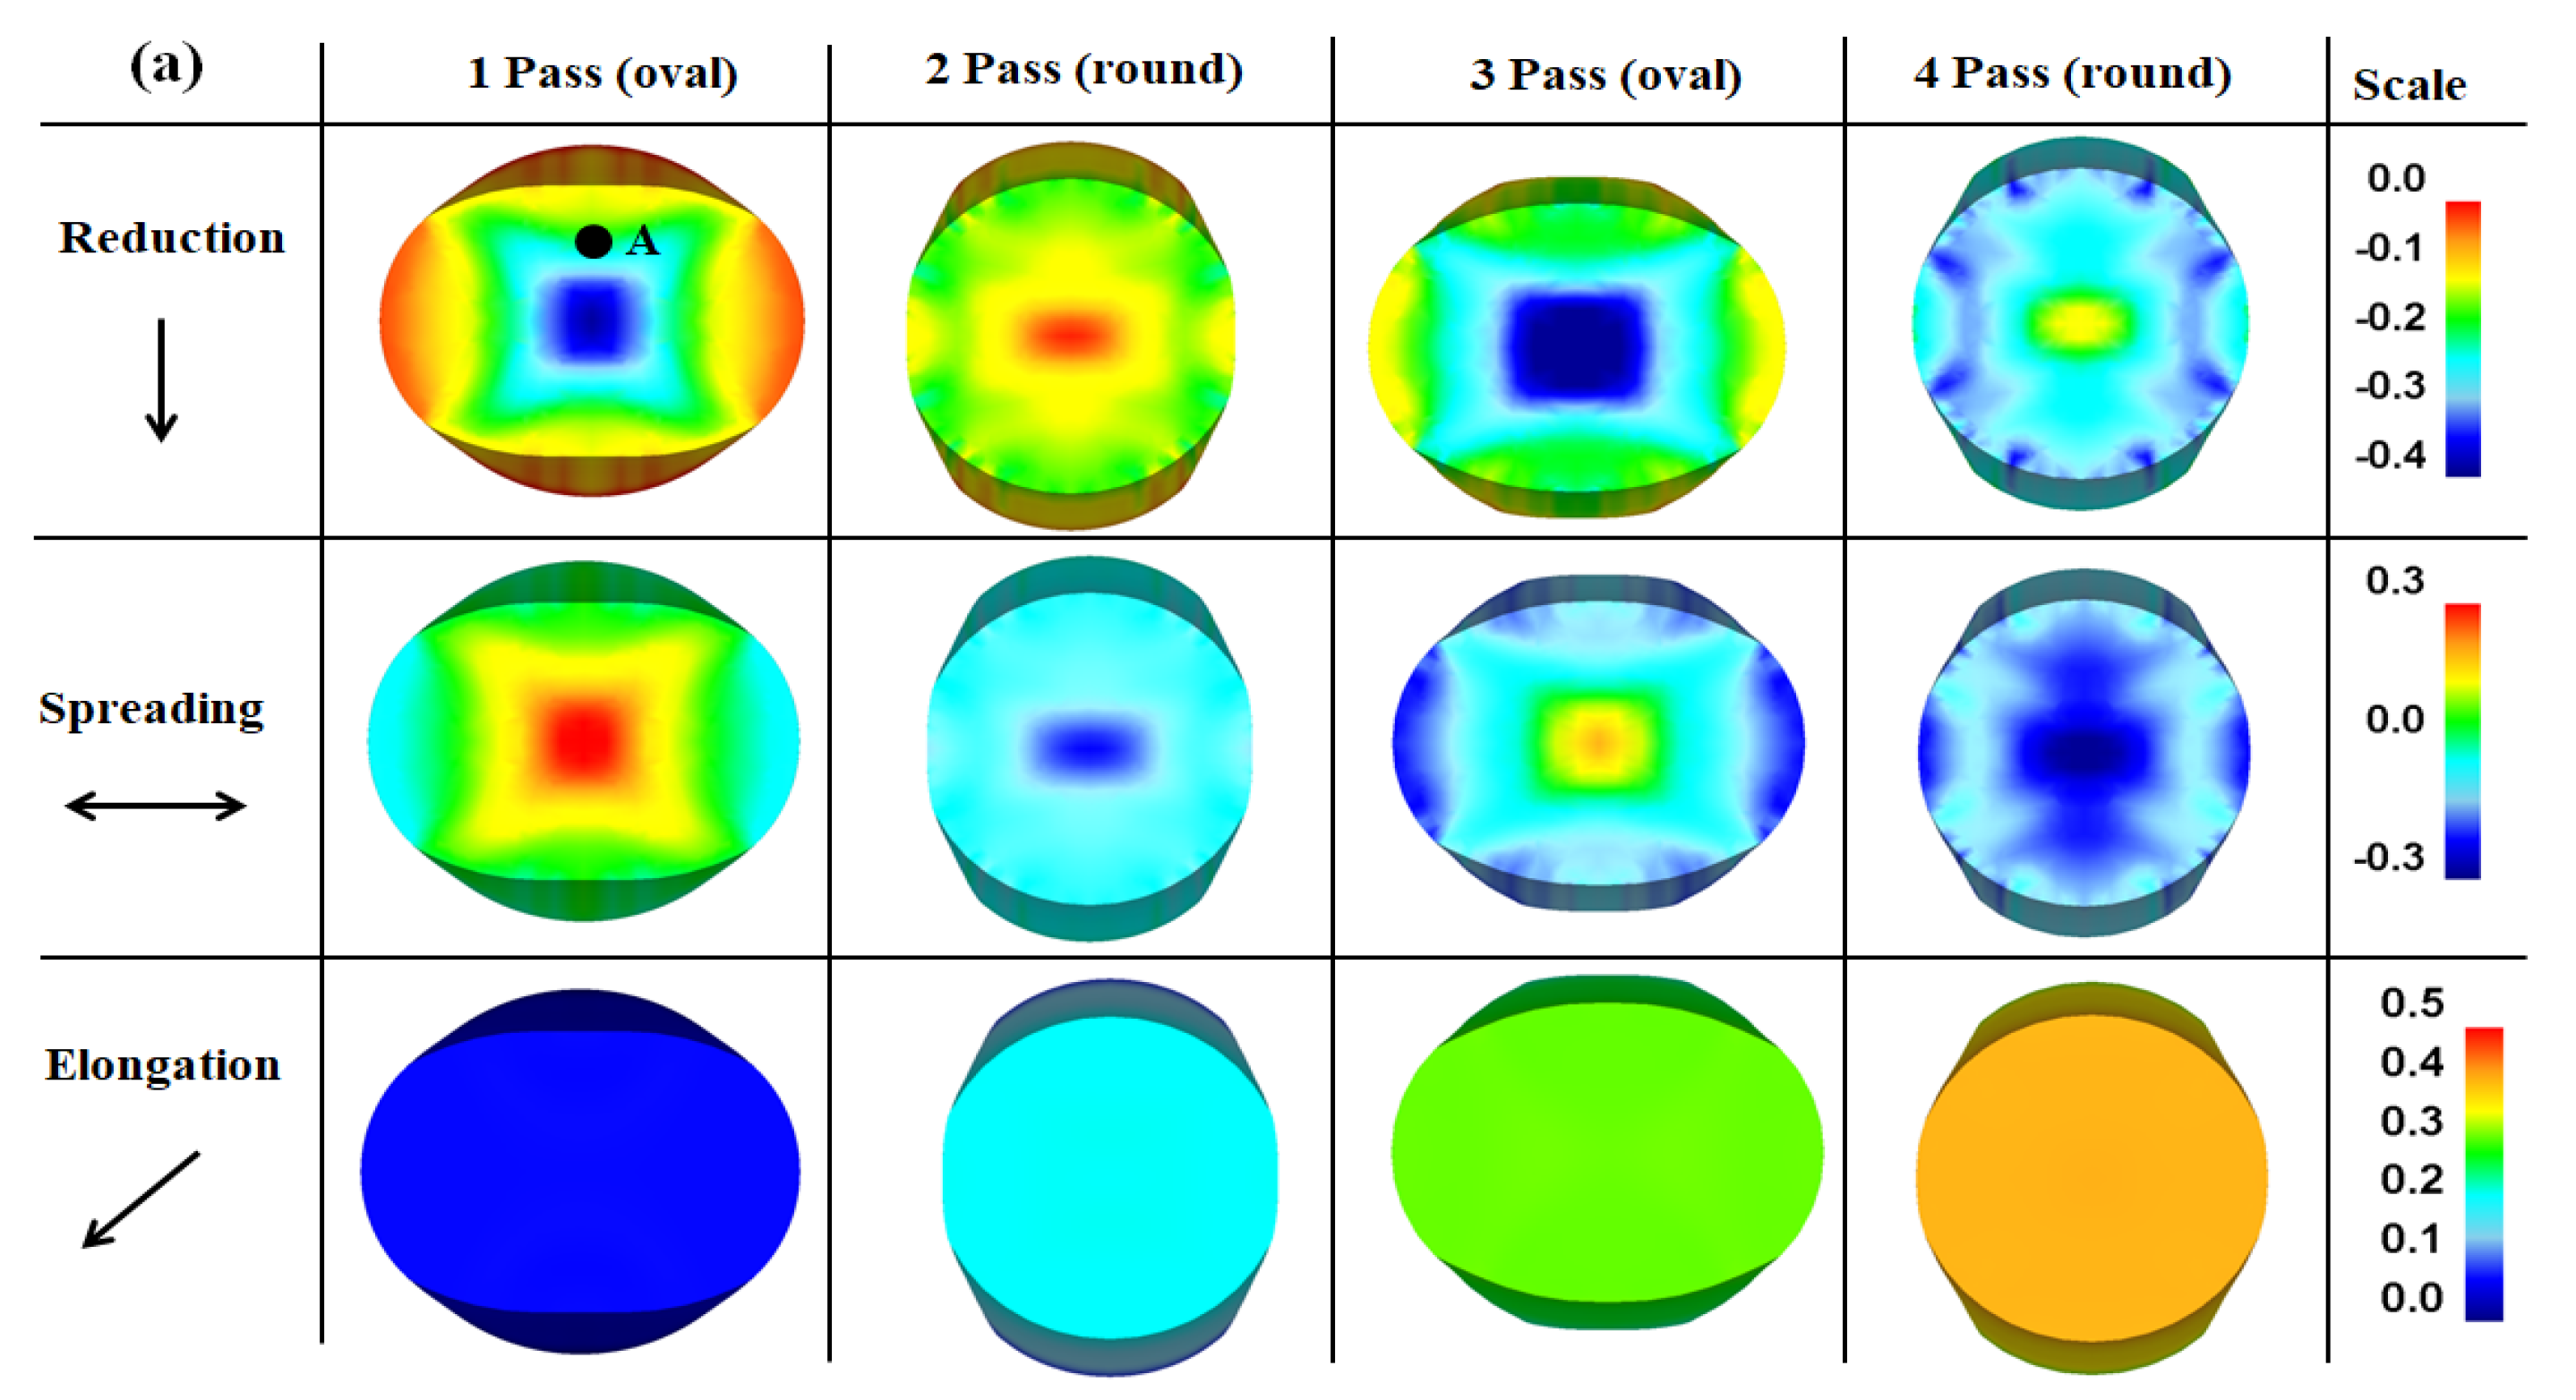
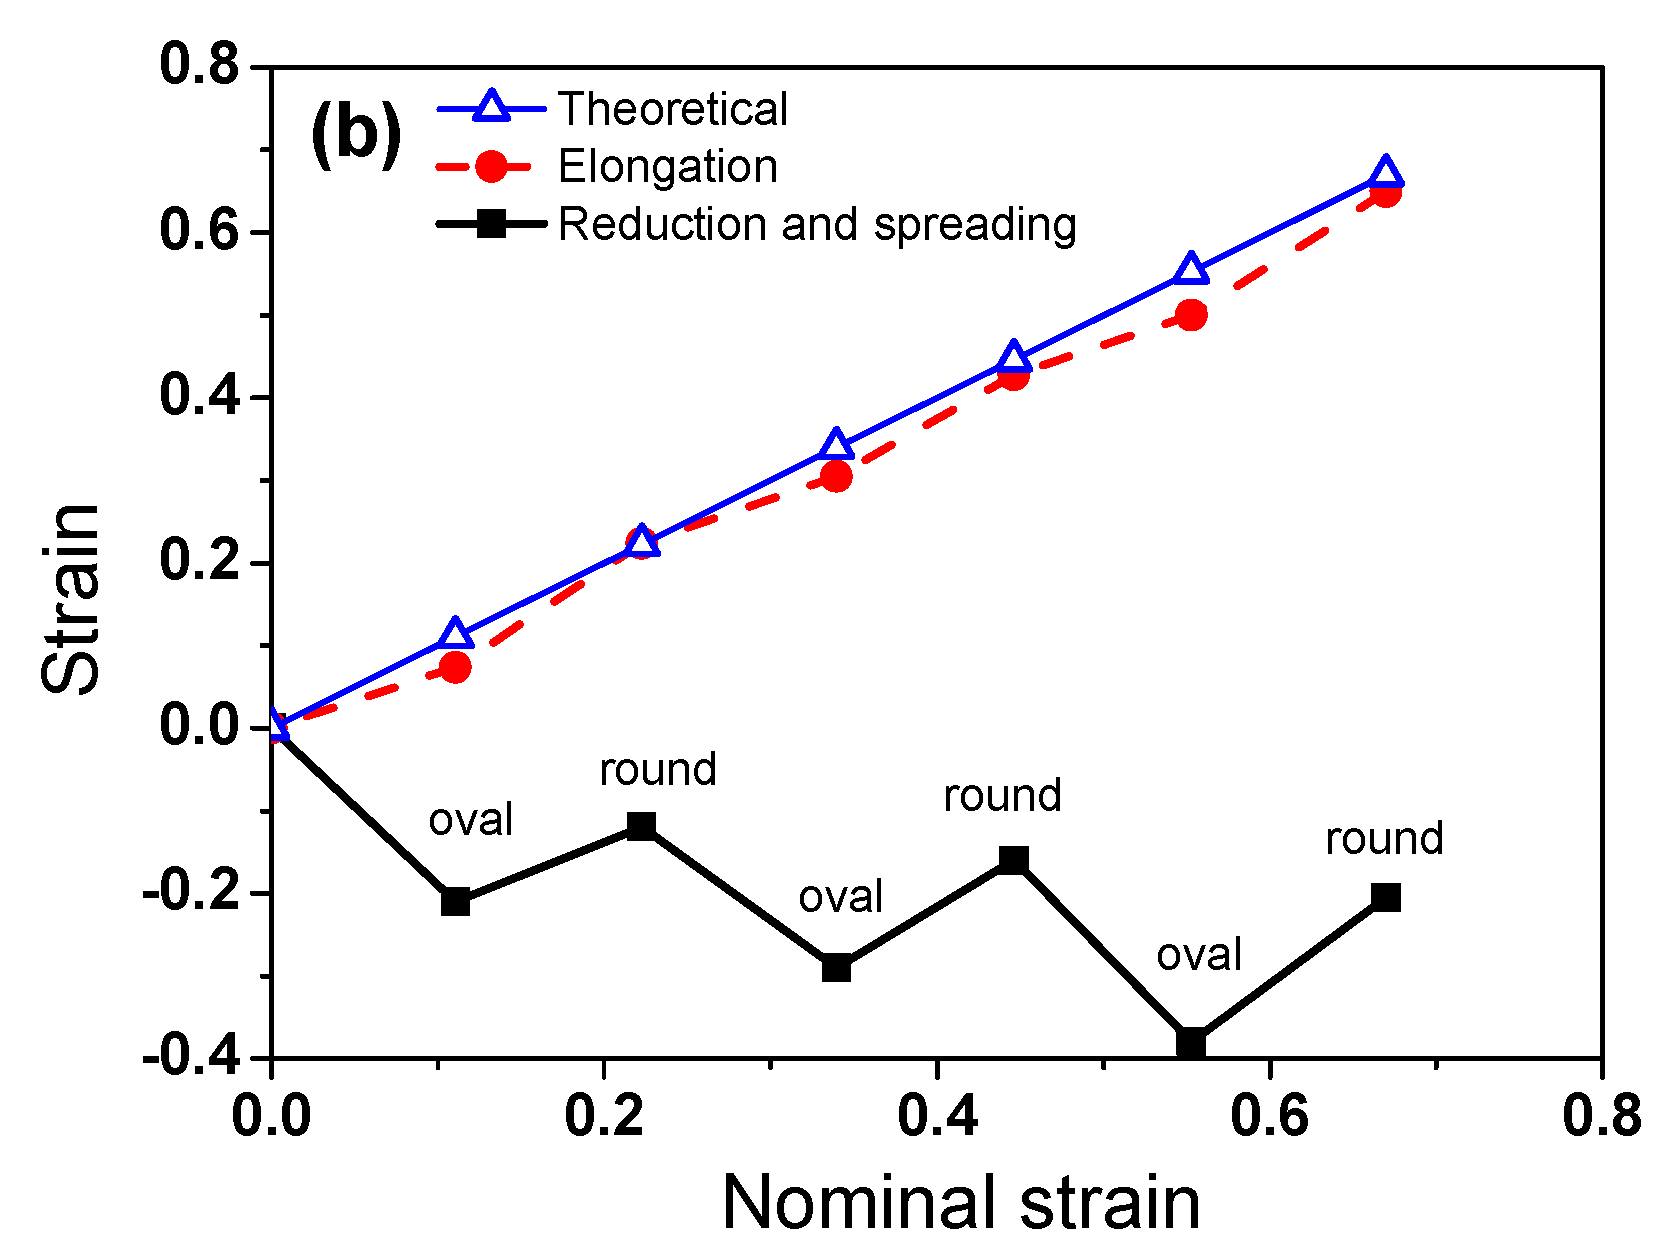
3.3. Comparison of Strain
4. Discussion
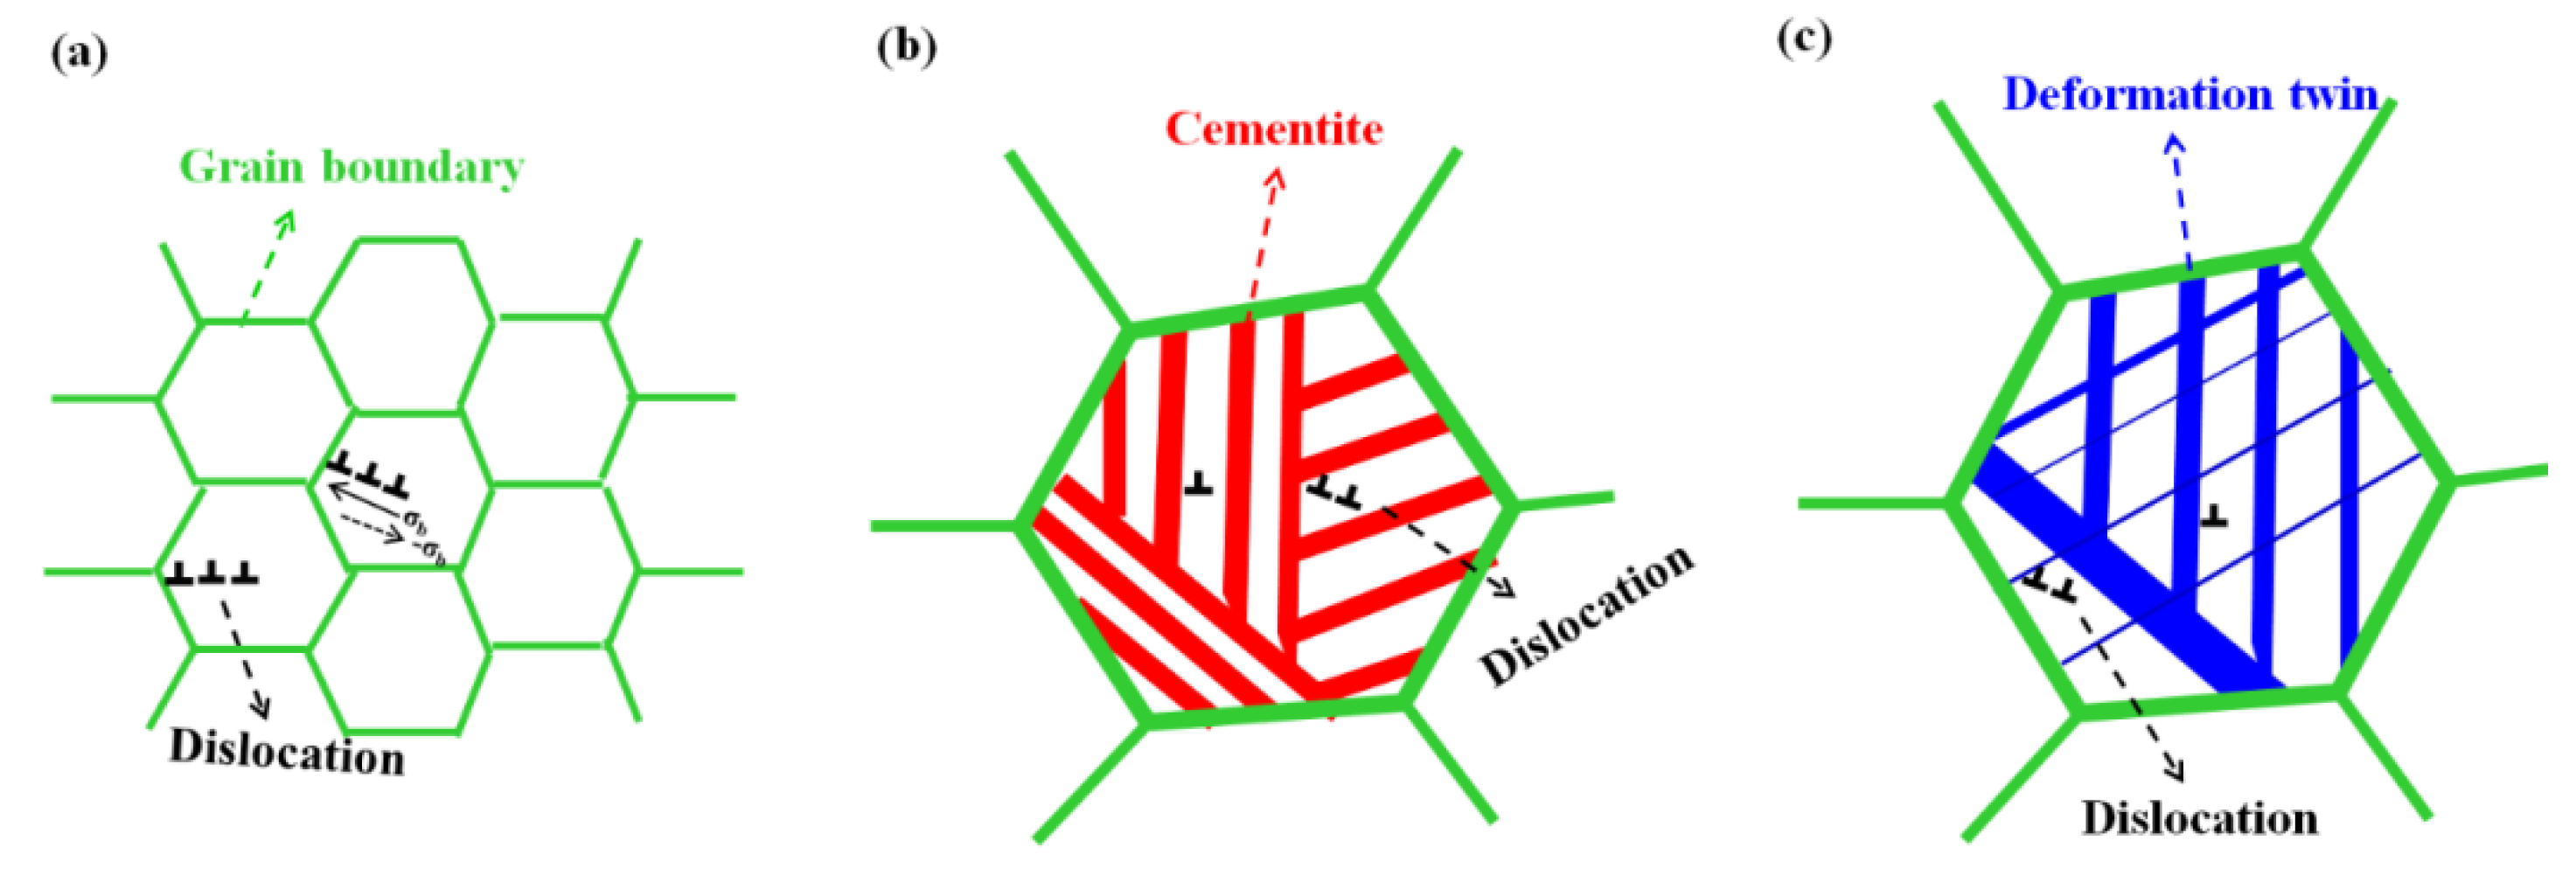
4.1. Hardening Mechanism of the Caliber-Rolled Wire
4.2. Softening Mechanism of the Caliber-Rolled Wire
4.3. Selection of Caliber Rolling or Wire Drawing Process
5. Conclusions
- Caliber-rolled ferritic, pearlitic, and TWIP steel wires exhibited both hardening and softening behaviors compared with the drawn wires. The hardening behavior was observed in the early deformation stage and the softening behavior appeared in the later deformation stage during caliber rolling regardless of the steel or microstructure;
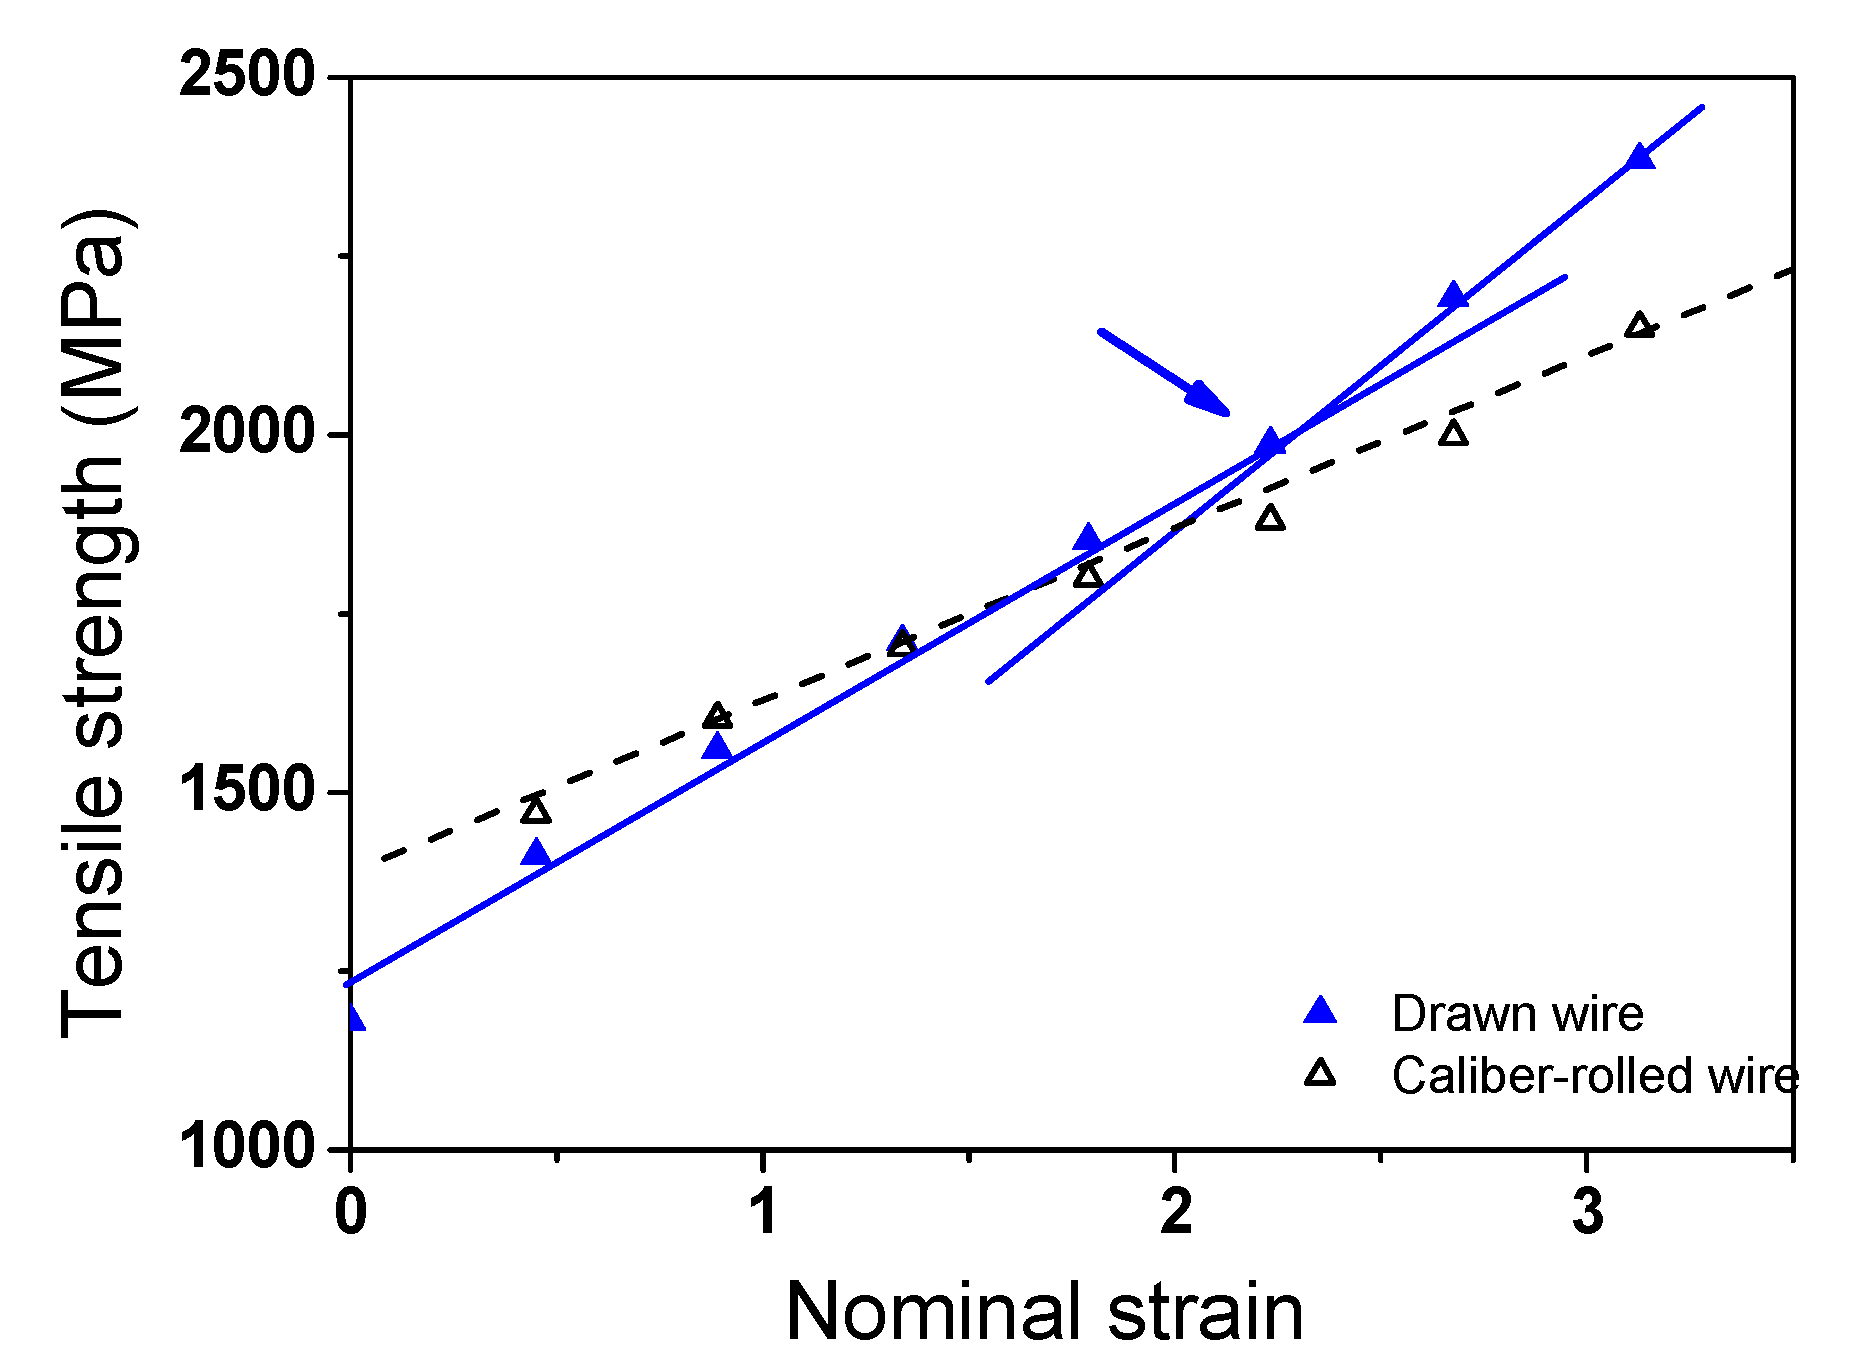
- In the early deformation stage, the differences of TS in ferrite, pearlite, and TWIP steels between drawn and caliber-rolled wires were approximately 8.1%, 4.6%, and 15.7%, respectively. The higher strengthening behavior in the early deformation stage of the caliber-rolled wire can be explained by the higher strain induced by caliber rolling compared with wire drawing, especially the higher redundant work in caliber-rolled wire. The caliber-rolled wire had approximately 36% higher strain than the drawn wire and approximately 85% higher strain than the nominal strain;
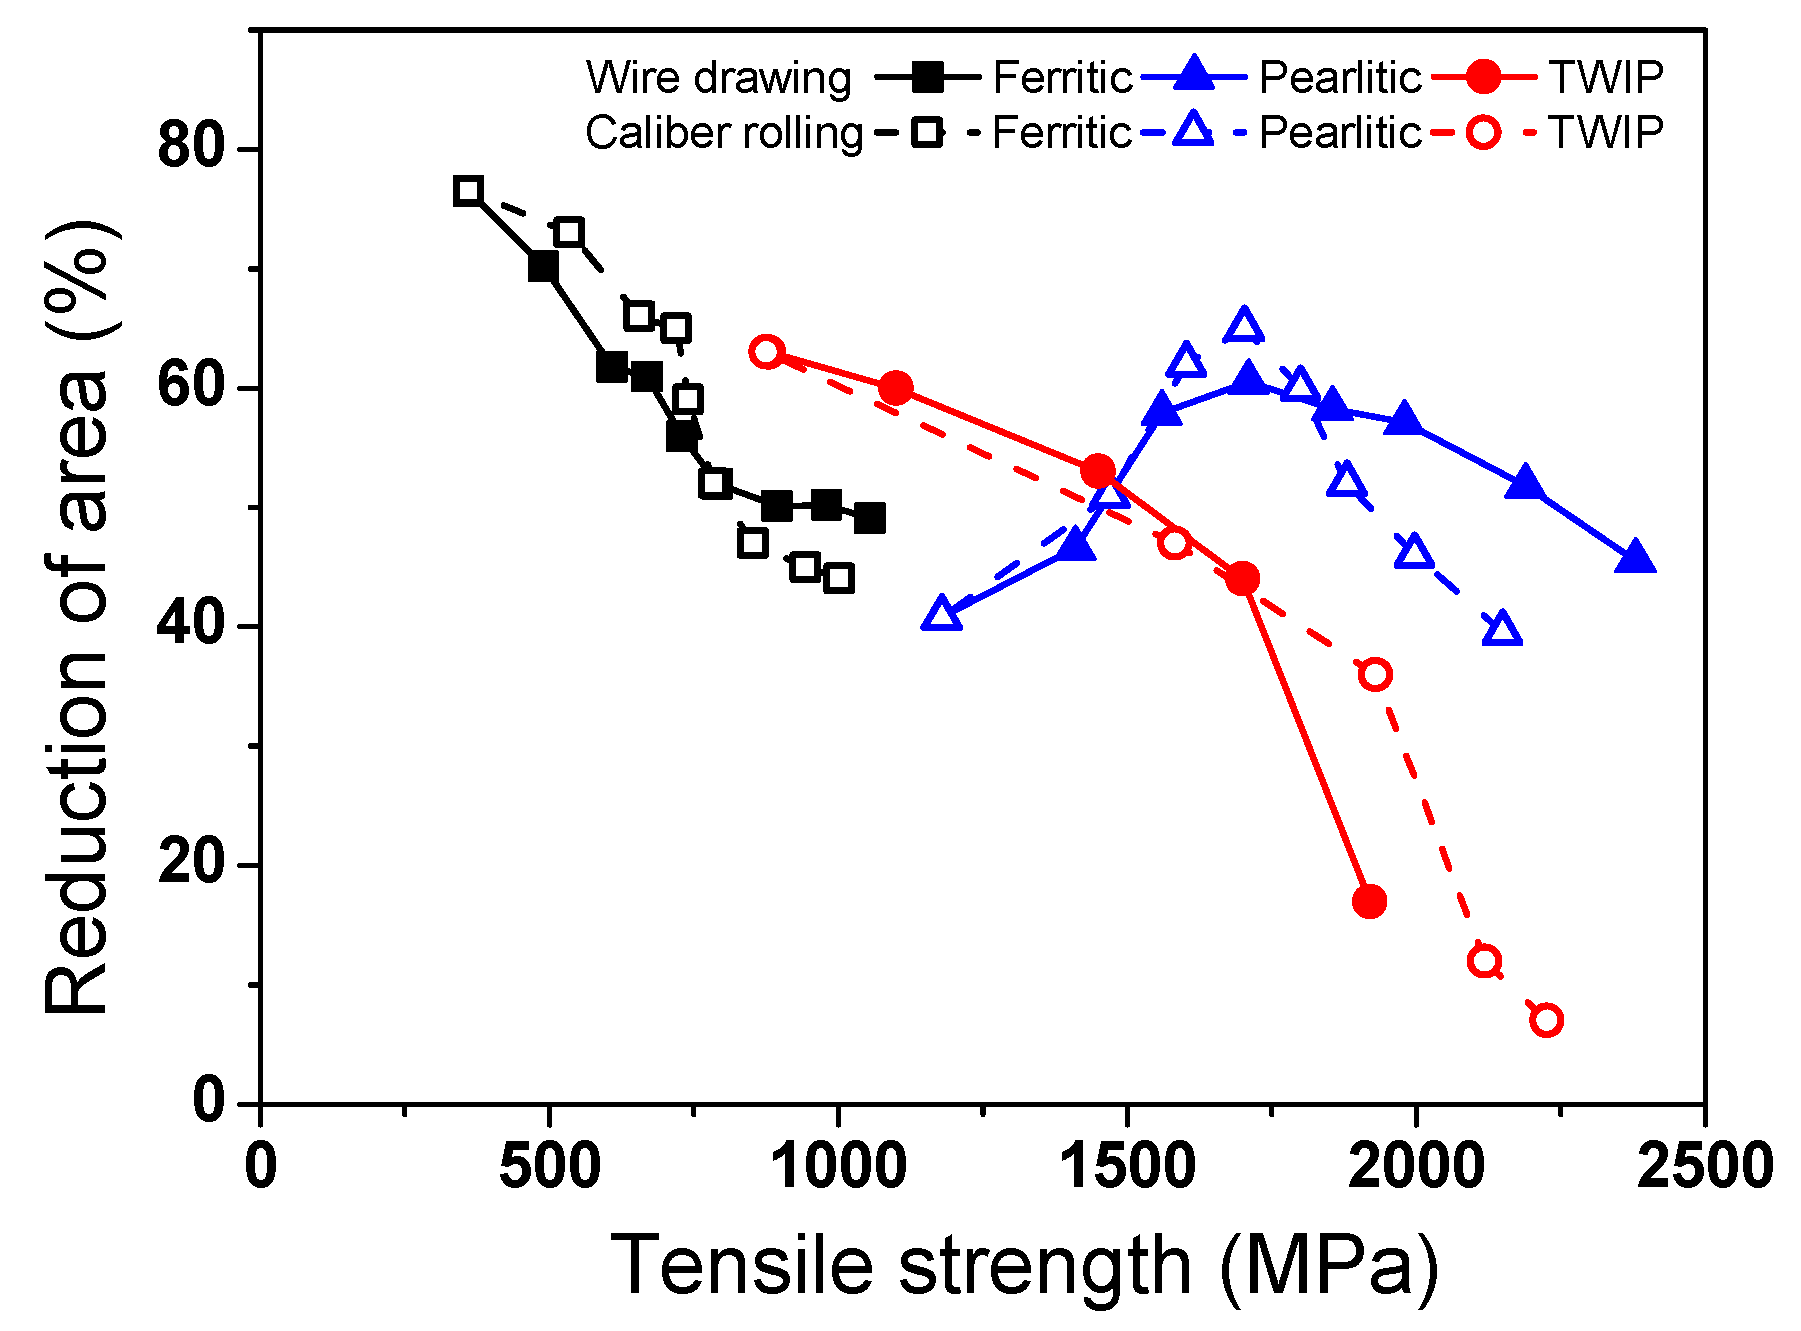
- The softening behavior of the caliber-rolled wire in the later deformation stages is related to the BE and/or low-cycle fatigue effect originating from the roll geometry and loading conditions during caliber rolling. The different intersection points of the tensile strength between the drawn and caliber-rolled wires with the steels or microstructures can be attributed to the different strain hardening rates of each steel;
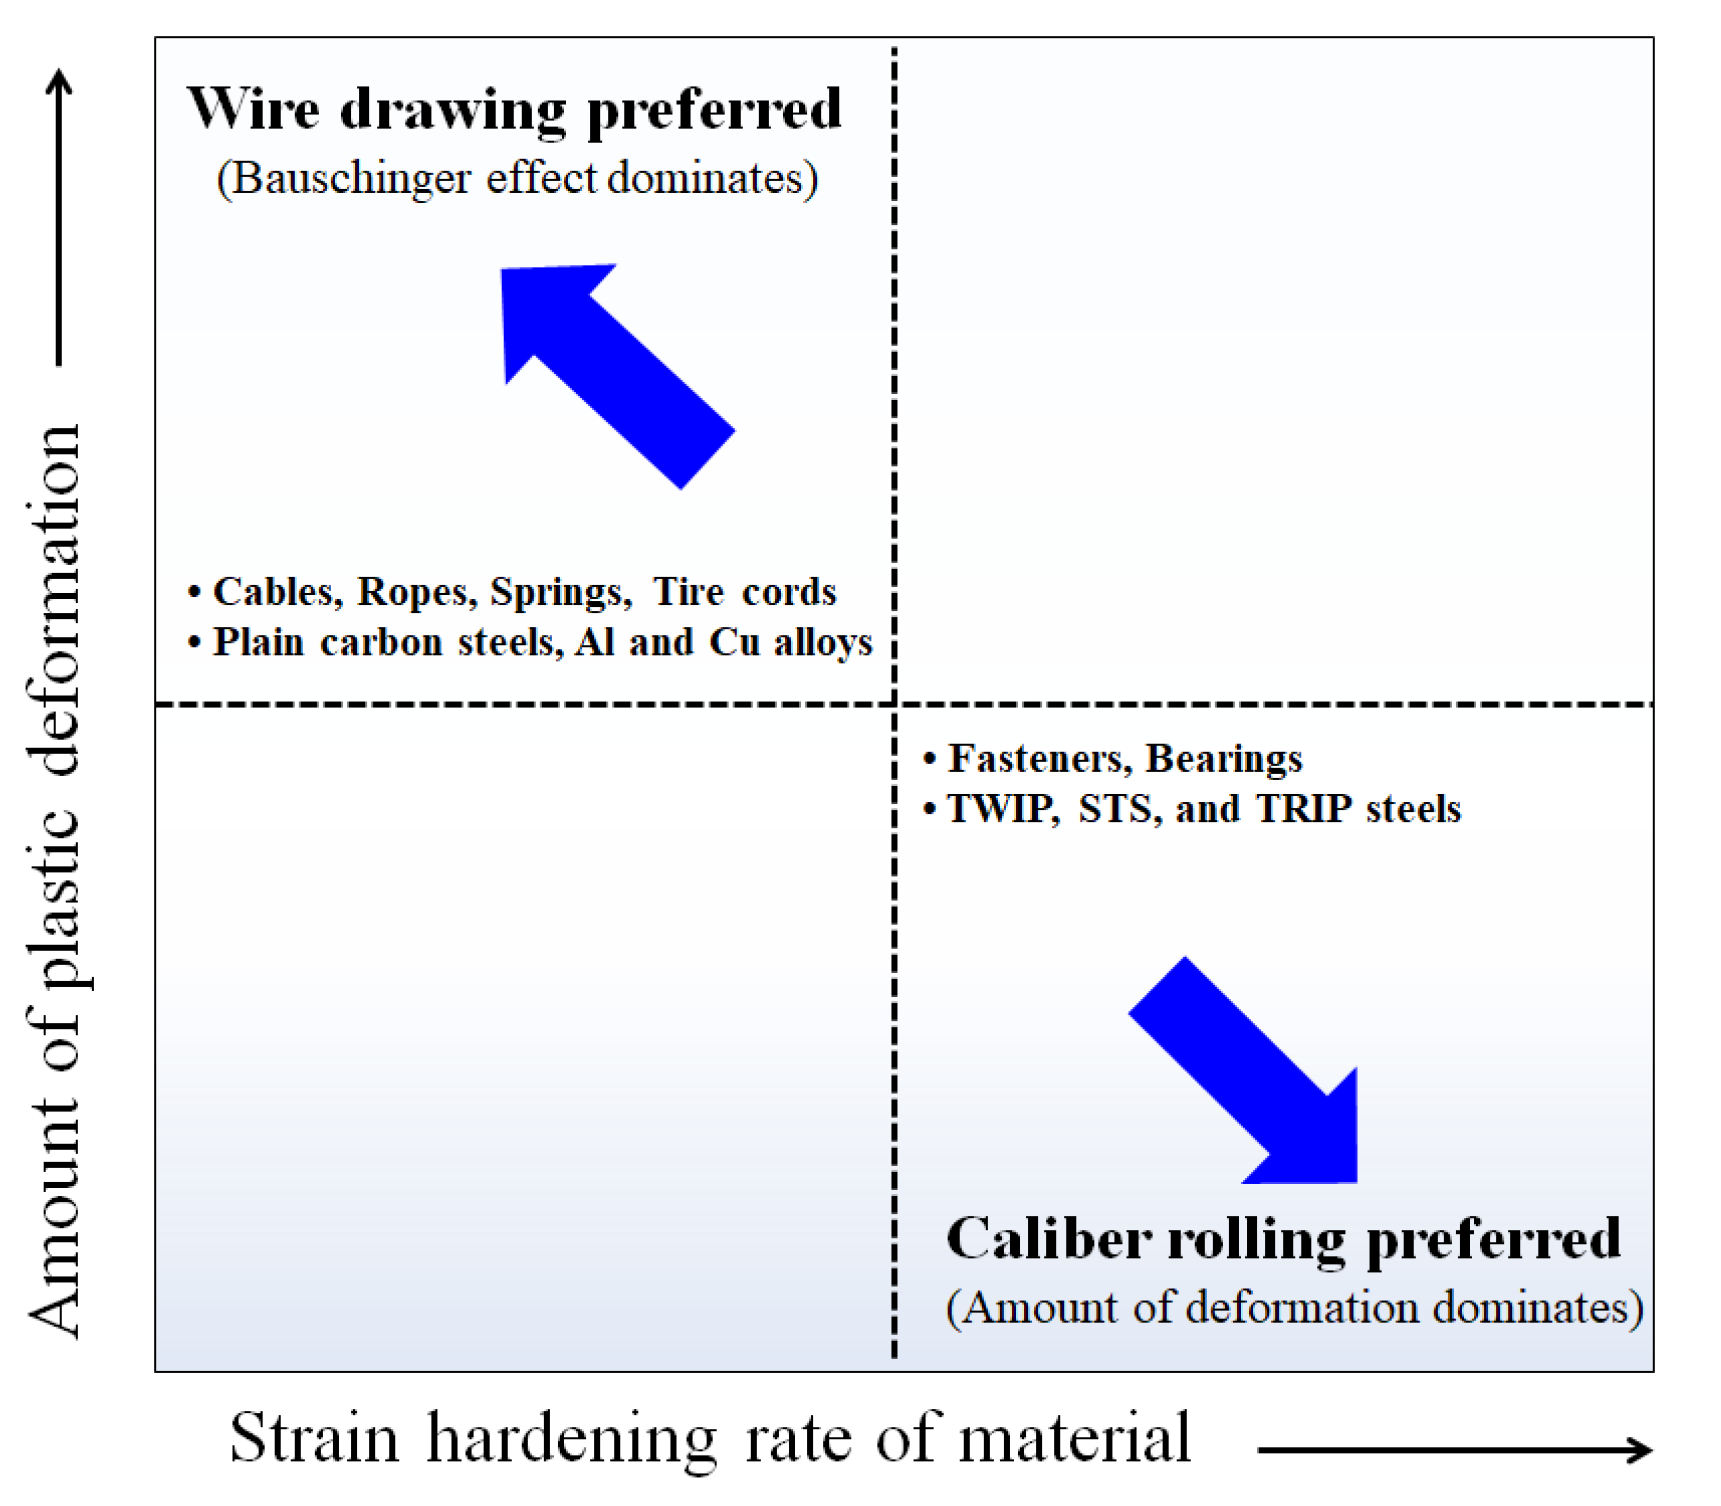
- Between the options of caliber rolling and wire drawing processes, the appropriate process should be selected by considering the strain hardening rate of the material and the amount of plastic deformation. When the plastic deformation is small during the forming processes, such as for fasteners and bearings, caliber rolling is the better process owing to the higher strength and ductility. In contrast, when the wires need to deform at high levels, such as for cables, ropes, springs, and tire cords, wire drawing is the better process owing to the appearance of the BE in caliber-rolled wire.
Funding
Informed Consent Statement
Data Availability Statement
Conflicts of Interest
References
- Wusatowski, Z. Fundamentals of Rolling; Pergamon Press: London, UK; New York, NY, USA, 1969; pp. 1–19. [Google Scholar]
- Hwang, J.K. Effects of caliber rolling on microstructure and mechanical properties in twinning-induced plasticity (TWIP) steel. Mater. Sci. Eng. A 2018, 711, 156–164. [Google Scholar] [CrossRef]
- Yin, F.; Hanamura, T.; Inoue, T.; Nagai, K. Fiber texture and substructural features in the caliber rolled low carbon steels. Metall. Mater. Trans. A 2004, 35A, 665–677. [Google Scholar] [CrossRef]
- Inoue, T.; Yin, F.; Kimura, Y. Strain distribution and microstructural evolution in multi-pass warm caliber rolling. Mater. Sci. Eng. A 2007, 466, 114–122. [Google Scholar] [CrossRef]
- Reuter, R.C.; Tranier, J. Cold rolling versus die drawing: A revolution in technology and economics. Proc. Dev. Roll. Met. 1983, 30–33. [Google Scholar]
- Cao, T.S.; Vachey, C.; Montmitonnet, P.; Bouchard, P.O. Comparison of reduction ability between multi-stage cold drawing and rolling of stainless steel wire-Experimental and numerical investigations of damage. J. Mater. Process. Technol. 2015, 217, 30–47. [Google Scholar] [CrossRef]
- Li, X.; Cao, L.; Wang, M.; Du, F. Groove design and microstructure research of ultra-fine grain bar rolling. Modeling Numer. Simul. Mater. Sci. 2012, 2, 67–75. [Google Scholar] [CrossRef]
- Krallics, G.; Gubicza, J.; Bezi, Z.; Barkai, I. Manufacturing of ultrafine-grained titanium by caliber rolling in the laboratory and in industry. J. Mater. Process. Technol. 2014, 214, 1307–1315. [Google Scholar] [CrossRef]
- Chun, Y.S.; Lee, J.; Bae, C.M.; Prak, K.T.; Lee, C.S. Caliber-rolled TWIP steel for high-strength wire rods with enhanced hydrogen-delayed fracture resistance. Scr. Mater. 2012, 67, 681–684. [Google Scholar] [CrossRef]
- Hwang, J.K.; Kim, S.J. Effect of reduction of area per pass on strain distribution and microstructure during caliber rolling in twinning-induced plasticity steel. J. Iron Steel Res. Int. 2020, 27, 62–74. [Google Scholar] [CrossRef]
- Liu, B.X.; Fan, K.Y.; Yin, F.X.; Feng, J.H.; Ji, P.G. Effect of caliber rolling reduction ratios on the microstructure and mechanical properties of 45 medium carbon steel. Mater. Sci. Eng. A 2020, 774, 138954. [Google Scholar] [CrossRef]
- Kim, K.S.; Kim, Y.K.; Kim, H.J.; Kim, J.H.; Lee, K.A. Influence of warm caliber rolling on tensile response and high cycle fatigue behavior of hypereutectoid steel. J. Mater. Res. Technol. 2021, 10, 205–215. [Google Scholar] [CrossRef]
- Shi, Z.Z.; Li, H.Y.; Xu, J.Y.; Gao, X.X.; Liu, X.F. Microstructure evolution of a high-strength low-alloy Zn–Mn–Ca alloy through casting, hot extrusion and warm caliber rolling. Mater. Sci. Eng. A 2020, 771, 138626. [Google Scholar] [CrossRef]
- Lee, J.H.; Kwak, B.J.; Kong, T.; Park, S.H.; Lee, T. Improved tensile properties of AZ31 Mg alloy subjected to various caliber-rolling strains. J. Magnes. Alloys 2019, 7, 381–387. [Google Scholar] [CrossRef]
- Lee, T.; Shih, D.S.; Lee, Y.; Lee, C.S. Manufacturing ultrafine-grained Ti-6Al-4V bulk rod using multi-pass caliber-rolling. Metals 2015, 5, 777–789. [Google Scholar] [CrossRef]
- Jung, J.M.; Kim, J.G.; Latypov, M.I.; Kim, H.S. Effect of the interfacial condition on the microtexture near the interface of Al/Cu composites during multi-pass caliber rolling. Mater. Des. 2015, 82, 28–36. [Google Scholar] [CrossRef]
- Lee, J.; Park, J.; Jeong, H. Effect of strain on mechanical and microstructural properties of Al/Cu claddings during caliber-rolling. Mater. Lett. 2018, 222, 122–125. [Google Scholar] [CrossRef]
- Kostryzhev, A.G.; Strangwood, M.; Davis, C.L. Bauschinger effect in microalloyed steels: Part II. Influence of work softening on strength development during UOE line-pipe forming. Metall. Mater. Trans. A 2011, 42, 3170–3177. [Google Scholar] [CrossRef][Green Version]
- Ren, Q.; Zou, T.; Li, D.; Tang, D.; Peng, Y. Numerical study on the X80 UOE pipe forming process. J. Mater. Process. Technol. 2015, 215, 264–277. [Google Scholar] [CrossRef]
- Zhang, W.; Ding, D.; Gu, M. A model for predicting the yield strength difference between pipe and plate of low-carbon microalloyed steel. Metall. Mater. Trans. A 2012, 43, 5308–5315. [Google Scholar] [CrossRef]
- Sohn, S.S.; Han, S.Y.; Bae, J.; Kim, H.S.; Lee, S. Effects of microstructure and pipe forming strain on yield strength before and after spiral pipe forming of API X70 and X80 linepipe steel sheets. Mater. Sci. Eng. A 2013, 573, 18–26. [Google Scholar] [CrossRef]
- Wiskel, J.B.; Rieder, M.; Henein, H. Kinematic behaviour of microalloyed steels under complex forming conditions. Can. Metall. Q. 2004, 43, 125–136. [Google Scholar] [CrossRef]
- Lodej, B.; Niang, K.; Montmitonnet, P.; Aubin, J.L. Accelerated 3D FEM computation of the mechanical history of the metal deformation in cold pilgering of tubes. J. Mater. Process. Technol. 2006, 177, 188–191. [Google Scholar] [CrossRef]
- Dyja, H.; Kawałek, A.; Ozhmegov, K. Experimental studies on Zr-1% Nb alloy properties in technological conditions of cold pilger tube rolling process. Arch. Civ. Mech. Eng. 2019, 19, 268–273. [Google Scholar] [CrossRef]
- Mutrux, A.; Berisha, B.; Hora, P. Prediction of cyclic softening in a medium carbon steel during cross roll straightening. J. Mater. Process. Technol. 2011, 211, 1448–1456. [Google Scholar] [CrossRef]
- Lee, J.W.; Baek, H.M.; Hwang, S.K.; Son, I.H.; Bae, C.M.; Im, Y.T. The effect of the multi-pass non-circular drawing sequence on mechanical properties and microstructure evolution of low-carbon steel. Mater. Des. 2014, 55, 898–904. [Google Scholar] [CrossRef]
- Kumar, S.; Krishnaswamy, H.; Digavalli, R.K.; Paul, S.K. Accounting Bauschinger effect in the numerical simulation of constrained groove pressing process. J. Manuf. Process 2019, 38, 49–62. [Google Scholar] [CrossRef]
- Narita, S.; Hayakawa, K.; Uemori, T.; Kubota, Y. Evaluation of strength of stainless steel bolt without heat treatment considering Bauschinger effect during manufacturing process. J. Mater. Process. Technol. 2020, 278, 116481. [Google Scholar] [CrossRef]
- Saeed-Akbari, A.; Imlau, J.; Prahl, U.; Bleck, W. Derivation and variation in composition-dependent stacking fault energy maps based on subregular solution model in high-manganese steels. Metall. Mater. Trans. A 2009, 40, 3076–3090. [Google Scholar] [CrossRef]
- Hwang, J.K. Deformation behaviors of various Fe–Mn–C twinning-induced plasticity steels: Effect of stacking fault energy and chemical composition. J. Mater. Sci. 2020, 55, 1779–1795. [Google Scholar] [CrossRef]
- Nam, W.J.; Song, H.R.; Bae, C.M. Effect of microstructural features on ductility of drawn pearlitic carbon steels. ISIJ Int. 2005, 45, 1205–1210. [Google Scholar] [CrossRef]
- Yoshie, A.; Sugimaru, S.; Nishida, S.; Kawana, A.; Banno, T.; Shinbo, Y.; Seki, R.; Banno, K. New wire rods produced by in-line heat treatment. Nippon Steel Tech. Rep. 1999, 80, 26–31. [Google Scholar]
- An, K.S.; Jeong, S.W.; Bea, H.J.; Nam, W.J. Formation of abnormal structures and their effects on the ductility of eutectoid steel. Mat. Mater. Int. 2016, 22, 995–1002. [Google Scholar] [CrossRef]
- Hwang, J.K. Low formability and reduction of area in twinning-induced plasticity steels despite their excellent tensile elongation. Mater. Sci. Eng. A 2020, 779, 139123. [Google Scholar] [CrossRef]
- Chin, R.K.; Stelf, P.S. A computational study of strain inhomogeneity in wire drawing. Int. J. Mach. Tools Manuf. 1995, 35, 1087–1098. [Google Scholar] [CrossRef]
- Hwang, S.K.; Baek, H.M.; Lee, J.W.; Son, I.H.; Im, Y.T.; Bae, C.M. The effect of microstructure and texture evolution on mechanical properties of low carbon steel in a non-circular drawing sequence. J. Mater. Process. Technol. 2014, 214, 318–325. [Google Scholar] [CrossRef]
- Baek, H.M.; Hwang, S.K.; Joo, H.S.; Im, Y.T.; Son, I.H.; Bae, C.M. The effect of a non-circular drawing sequence on delamination characteristics of pearlitic steel wire. Mater. Des. 2014, 62, 137–148. [Google Scholar] [CrossRef]
- Grassel, O.; Kruger, L.; Frommeyer, G.; Meyer, L.W. High strength Fe-Mn-(Al, Si) TRIP/TWIP steels development-properties-application. Int. J. Plast. 2000, 16, 1391–1409. [Google Scholar] [CrossRef]
- De Cooman, B.C.; Estrin, Y.; Kim, S.K. Twinning-induced plasticity (TWIP) steels. Acta Mater. 2018, 142, 283–362. [Google Scholar] [CrossRef]
- Bouaziz, O.; Allain, S.; Scott, C.P.; Cugy, P.; Barbier, D. High manganese austenitic twinning induced plasticity steels: A review of the microstructure properties relationships. Curr. Opin. Solid State Mater. Sci. 2011, 15, 141–168. [Google Scholar] [CrossRef]
- Jin, J.E.; Lee, Y.K. Effect of Al on microstructure and tensile properties of C-bearing high Mn TWIP steel. Acta Mater. 2012, 60, 1680–1688. [Google Scholar] [CrossRef]
- Zambrano, O.A. A general perspective of Fe–Mn–Al–C steels. J. Mater. Sci. 2018, 53, 14003–14062. [Google Scholar] [CrossRef]
- Song, H.R.; Kang, E.G.; Nam, W.J. Effect of alloying elements on work hardening behavior in cold drawn hyper-eutectoid steel wires. Mater. Sci. Eng. A 2007, 449–451, 1147–1150. [Google Scholar] [CrossRef]
- Park, D.B.; Kang, E.G.; Nam, W.J. The prediction of the occurrence of the delamination in cold drawn hyper-eutectoid steel wires. J. Mater. Process. Technol. 2007, 187–188, 178–181. [Google Scholar] [CrossRef]
- Zelin, M. Microstructure evolution in pearlitic steels during wire drawing. Acta Mater. 2002, 50, 4431–4447. [Google Scholar] [CrossRef]
- Taylor, G.I. The mechanism of plastic deformation of crystals. Part I.—Theoretical. Proc. R. Soc. A 1934, 145, 362–387. [Google Scholar]
- Mecking, H.; Kocks, U.F. Kinetics of flow and strain-hardening. Acta Metall. 1981, 29, 1865–1875. [Google Scholar] [CrossRef]
- Embury, J.D.; Fisher, R.M. The structure and properties of drawn pearlite. Acta Metall. 1966, 14, 147–159. [Google Scholar] [CrossRef]
- Zhang, X.; Godfrey, A.; Hansen, N.; Huang, X. Hierarchical structures in cold-drawn pearlitic steel wire. Acta Mater. 2013, 61, 4898–4909. [Google Scholar] [CrossRef]
- Idrissi, H.; Renard, K.; Schryvers, D.; Jacques, P.J. On the relationship between the twin internal structure and the work hardening rate of TWIP steels. Scr. Mater. 2010, 63, 961–964. [Google Scholar] [CrossRef]
- Dastur, Y.N.; Leslie, W.C. Mechanism of work hardening in Hadfield manga-nese steel. Metall. Trans. A 1981, 12, 749–759. [Google Scholar] [CrossRef]
- Luo, Z.C.; Huang, M.X. Revisit the role of deformation twins on the work-hardening behaviour of twinning-induced plasticity steels. Scripta Mater. 2018, 142, 28–31. [Google Scholar] [CrossRef]
- Liang, Z.Y.; Li, Y.Z.; Huang, M.X. The respective hardening contributions of dislocations and twins to the flow stress of a twinning-induced plasticity steel. Scr. Mater. 2016, 112, 28–31. [Google Scholar] [CrossRef]
- Luo, Z.C.; Huang, M.X. The role of interstitial carbon atoms on the strain-hardening rate of twinning-induced plasticity steels. Scr. Mater. 2020, 178, 264–268. [Google Scholar] [CrossRef]
- Renard, K.; Jacques, P.J. On the relationship between work hardening and twinning rate inTWIP steels. Mater. Sci. Eng. A 2012, 542, 8–14. [Google Scholar] [CrossRef]
- Soulami, A.; Choi, K.S.; Shen, Y.F.; Liu, W.N.; Sun, X.; Khaleel, M.A. On deformation twinning in a 17.5% Mn-TWIP steel: A physically based phenomenological model. Mater. Sci. Eng. A 2011, 528, 1402–1408. [Google Scholar] [CrossRef]
- Jeong, K.; Jin, J.E.; Jung, Y.S.; Kang, S.; Lee, Y.K. The effects of Si on the mechanical twinning and strain hardening of Fe-18Mn-0.6C twinning-induced plasticity steel. Acta Mater. 2013, 61, 3399–3410. [Google Scholar] [CrossRef]
- Hwang, J.K.; Yi, I.C.; Son, I.H.; Yoo, J.Y.; Kim, B.; Zargaran, A.; Kim, N.J. Microstructural evolution and deformation behavior of twinning-induced plasticity (TWIP) steel during wire drawing. Mater. Sci. Eng. A 2015, 644, 41–52. [Google Scholar] [CrossRef]
- Hwang, J.K. The microstructure dependence of drawability in ferritic, pearlitic and TWIP steels during wire drawing. J. Mater. Sci. 2019, 54, 8743–8759. [Google Scholar] [CrossRef]
- Bouaziz, O.; Guelton, N. Modeling of TWIP effect on work hardening. Mater. Sci. Eng. A 2001, 319–321, 246–249. [Google Scholar] [CrossRef]
- Kocks, U.F.; Mecking, H. Physics and phenomenology of strain hardening: The FCC case. Prog. Mater. Sci. 2003, 48, 171–273. [Google Scholar] [CrossRef]
- Zhi, H.; Zhang, C.; Antonov, S.; Yu, H.; Guo, T.; Su, Y. Investigations of dislocation-type evolution and strain hardening during mechanical twinning in Fe-22Mn-0.6 C twinning-induced plasticity steel. Acta Mater. 2020, 195, 371–382. [Google Scholar] [CrossRef]
- Park, J.; Kang, M.; Sohn, S.S.; Kim, S.H.; Kim, K.S.; Kim, N.J.; Lee, S. Quasi-static and dynamic deformation mechanisms interpreted by microstructural evolution in TWinning Induced Plasticity (TWIP) steel. Mater. Sci. Eng. A 2017, 684, 54–63. [Google Scholar] [CrossRef]
- Badji, R.; Chauveau, T.; Bacroix, B. Texture, misorientation and mechanical anisotropy in a deformed dual phase stainless steel weld joint. Mater. Sci. Eng. A 2013, 575, 94–103. [Google Scholar] [CrossRef]
- Hosford, W.F.; Caddell, R.M. Metal Forming: Mechanics and Metallurgy, 3rd ed.; Cambridge University Press: Cambridge, UK, 2007. [Google Scholar]
- Muszka, K.; Madej, L.; Majta, J. The effects of deformation and microstructure inhomogeneities in the Accumulative Angular Drawing (AAD). Mater. Sci. Eng. A 2013, 574, 68–74. [Google Scholar] [CrossRef]
- Hwang, S.K.; Baek, H.M.; Son, I.H.; Im, Y.T.; Bae, C.M. The effect of microstructure and texture evolution on mechanical properties of low-carbon steel processed by the continuous hybrid process. Mater. Sci. Eng. A 2013, 579, 118–125. [Google Scholar] [CrossRef]
- Han, K.; Van Tyne, C.J.; Levy, B.S. Effect of strain and strain rate on the Bauschinger effect response of three different steels. Metall. Mater. Trans. A 2005, 36A, 2379–2384. [Google Scholar] [CrossRef]
- Zhonghua, L.; Haicheng, G. Bauschinger effect and residual phase stresses in two ductile-phase steels: Part I. The influence of phase stresses on the Bauschinger effect. Metall. Mater. Trans. A 1990, 21A, 717–724. [Google Scholar] [CrossRef]
- Wang, Y.; Tomota, Y.; Harjo, S.; Gong, W.; Ohmura, T. In-situ neutron diffraction during tension-compression cyclic deformation of a pearlite steel. Mater. Sci. Eng. A 2016, 676, 522–530. [Google Scholar] [CrossRef]
- Stobbs, W.M.; Paetke, S. The Bauschinger effect in cold drawn patented wire. Acta Metall. 1985, 33, 777–783. [Google Scholar] [CrossRef]
- Toribio, J.; Kharin, V.; Ayaso, F.J.; Lorenzo, M.; González, B.; Matos, J.; Aguado, L. Analysis of the Bauschinger Effect in Cold Drawn Pearlitic Steels. Metals 2020, 10, 114. [Google Scholar] [CrossRef]
- Karaman, I.; Sehitoglu, H.; Chumlyakov, Y.I.; Maier, H.J.; Kireeva, I.V. The effect of twinning and slip on the Bauschinger effect of Hadfield steel single crystals. Metall. Mater. Trans. A 2001, 32A, 695–706. [Google Scholar] [CrossRef]
- Gutierrez-Urrutia, I.; Del Valle, J.A.; Zaefferer, S.; Raabe, D. Study of internal stresses in a TWIP steel analyzing transient and permanent softening during reverse shear tests. J. Mater. Sci. 2010, 45, 6604–6610. [Google Scholar] [CrossRef]
- Del Valle, J.A.; Romero, R.; Picasso, A.C. Bauschinger effect in age-hardened Inconel X-750 alloy. Mater. Sci. Eng. A 2001, 311, 100–107. [Google Scholar] [CrossRef]
- Haouaoui, M.; Karaman, I.; Maier, H.J. Flow stress anisotropy and Bauschinger effect in ultrafine grained copper. Acta Mater. 2006, 54, 5477–5488. [Google Scholar] [CrossRef]
- Pedersen, O.B.; Brown, L.M.; Stobbs, W.M. The Bauschinger effect in copper. Acta Metall. 1981, 29, 1843–1850. [Google Scholar] [CrossRef]
- Terada, K.; Matsui, K.; Akiyama, M.; Kuboki, T. Numerical re-examination of the micro-scale mechanism of the Bauschinger effect in carbon steels. Comput. Mater. Sci. 2004, 31, 67–83. [Google Scholar] [CrossRef]
- Weiss, M.; Kupke, A.; Manach, P.Y.; Galdos, L.; Hodgson, P.D. On the Bauschinger effect in dual phase steel at high levels of strain. Mater. Sci. Eng. A 2015, 643, 127–136. [Google Scholar] [CrossRef]
- Benito, J.A.; Cobo, R.; Lei, W.; Calvo, J.; Cabrera, J.M. Stress–strain response and microstructural evolution of a FeMnCAl TWIP steel during tension–compression tests. Mater. Sci. Eng. A 2016, 655, 310–320. [Google Scholar] [CrossRef]
- Hanazaki, K.; Tokutomi, J.; Yanagimoto, J.; Tsuji, N. Significant change in mechanical properties of deep drawn ultrafine grained copper wire by additional deformation. Mater. Sci. Eng. A 2012, 534, 720–723. [Google Scholar] [CrossRef]
- Sohn, S.S.; Han, S.Y.; Shin, S.Y.; Bae, J.; Lee, S. Effects of microstructure and pre-strain on Bauschinger effect in API X70 and X80 linepipe steels. Mat. Mater. Int. 2013, 19, 423–431. [Google Scholar] [CrossRef]
- Bouaziz, O.; Allain, S.; Scott, C. Effect of grain and twin boundaries on the hardening mechanisms of twinning-induced plasticity steels. Scr. Mater. 2008, 58, 484–487. [Google Scholar] [CrossRef]
- Han, S.Y.; Sohn, S.S.; Shin, S.Y.; Bae, J.; Kim, H.S.; Lee, S. Effects of microstructure and yield ratio on strain hardening and Bauschinger effect in two API X80 linepipe steels. Mater. Sci. Eng. A 2012, 551, 192–199. [Google Scholar] [CrossRef]
- Kim, D.W.; Kim, W.K.; Bae, J.; Choi, W.D.; Kim, H.S.; Lee, S. Yield-strength prediction of flattened steel pipes by competing Bauschinger effect and strain hardening during pipe-forming. Sci. Rep. 2019, 9, 14002. [Google Scholar] [CrossRef] [PubMed]
- Zhang, X.; Godfrey, A.; Huang, X.; Hansen, N.; Liu, Q. Microstructure and strengthening mechanisms in cold-drawn pearlitic steel wire. Acta Mater. 2011, 59, 3422–3430. [Google Scholar] [CrossRef]
- Hou, J.P.; Wang, Q.; Yang, H.J.; Wu, X.M.; Li, C.H.; Li, X.W.; Zhang, Z.F. Microstructure evolution and strengthening mechanisms of cold-drawn commercially pure aluminum wire. Mater. Sci. Eng. A 2015, 639, 103–106. [Google Scholar] [CrossRef]
- Zhu, Y.K.; Chen, Q.Y.; Wang, Q.; Yu, H.Y.; Li, R.; Hou, J.P.; Zhang, Z.J.; Zhang, G.P.; Zhang, Z.F. Effect of stress profile on microstructure evolution of cold-drawn commercially pure aluminum wire analyzed by finite element simulation. J. Mater. Sci. Technol. 2018, 34, 1214–1221. [Google Scholar] [CrossRef]
- Yoshida, K.; Doi, K. Improvement of ductility of aluminum wire for automotive wiring hardness by alternate drawing. Procedia Eng. 2014, 81, 706–711. [Google Scholar] [CrossRef]
- Hwang, J.K. Correlation of Strain Path, Texture, Twinning, and Mechanical Properties in Twinning-Induced Plasticity Steel during Wire Drawing. Materials 2020, 13, 2250. [Google Scholar] [CrossRef]
- Chen, J.; Yan, W.; Liu, C.X.; Ding, R.G.; Fan, X.H. Dependence of texture evolution on initial orientation in drawn single crystal copper. Mater. Charact. 2011, 62, 237–242. [Google Scholar] [CrossRef]


| Steel Grade | Chemical Compositions in Weight Perecnt | Homogenization Conditions | ||||||||
|---|---|---|---|---|---|---|---|---|---|---|
| C | Mn | Si | Cr | Al | P | S | Fe | Temp. (°C) | Time (h) | |
| Ferrite | 0.10 | 0.40 | 0.10 | - | - | <0.01 | <0.01 | Bal. | - | - |
| Pearlite | 0.82 | 0.78 | 0.23 | 0.18 | <0.01 | <0.01 | Bal. | 950 | 0.2 | |
| TWIP | 0.60 | 19.94 | - | 1.03 | <0.01 | <0.01 | Bal. | 1200 | 12 | |
| Pass Number | Wire Drawing | Caliber Rolling | Parameters | ||||
|---|---|---|---|---|---|---|---|
| Wire Diameter (mm) | R Per Pass (%) | Roll Shape | Wire Diameter (mm) | Total R (%) | Nominal Strain | ||
| Major Axis | Minor Axis | ||||||
| Initial | 13.00 | 0.00 | - | 13.00 | 13.00 | 0.00 | 0.00 |
| 1 | 12.30 | 10.48 | Oval | 15.60 | 9.70 | ||
| 2 | 11.63 | 10.60 | Round | 11.63 | 11.63 | 19.97 | 0.22 |
| 3 | 10.97 | 11.03 | Oval | 14.40 | 9.30 | ||
| 4 | 10.40 | 10.12 | Round | 10.40 | 10.40 | 36.00 | 0.45 |
| 5 | 9.86 | 10.12 | Oval | 12.80 | 8.20 | ||
| 6 | 9.30 | 11.04 | Round | 9.30 | 9.30 | 48.82 | 0.67 |
| 7 | 8.80 | 10.46 | Oval | 12.20 | 7.30 | ||
| 8 | 8.32 | 10.61 | Round | 8.32 | 8.32 | 59.04 | 0.89 |
| * | ↓ | ↓ | ↓ | ↓ | ↓ | ↓ | ↓ |
Publisher’s Note: MDPI stays neutral with regard to jurisdictional claims in published maps and institutional affiliations. |
© 2022 by the author. Licensee MDPI, Basel, Switzerland. This article is an open access article distributed under the terms and conditions of the Creative Commons Attribution (CC BY) license (https://creativecommons.org/licenses/by/4.0/).
Share and Cite
Hwang, J.-K. Hardening and Softening Behavior of Caliber-Rolled Wire. Materials 2022, 15, 2939. https://doi.org/10.3390/ma15082939
Hwang J-K. Hardening and Softening Behavior of Caliber-Rolled Wire. Materials. 2022; 15(8):2939. https://doi.org/10.3390/ma15082939
Chicago/Turabian StyleHwang, Joong-Ki. 2022. "Hardening and Softening Behavior of Caliber-Rolled Wire" Materials 15, no. 8: 2939. https://doi.org/10.3390/ma15082939
APA StyleHwang, J.-K. (2022). Hardening and Softening Behavior of Caliber-Rolled Wire. Materials, 15(8), 2939. https://doi.org/10.3390/ma15082939