
Seismic Performance of F3D Free-Form Structures Using Small-Scale Shaking Table Tests


Abstract
1. Introduction
2. F3D Free-From Structures
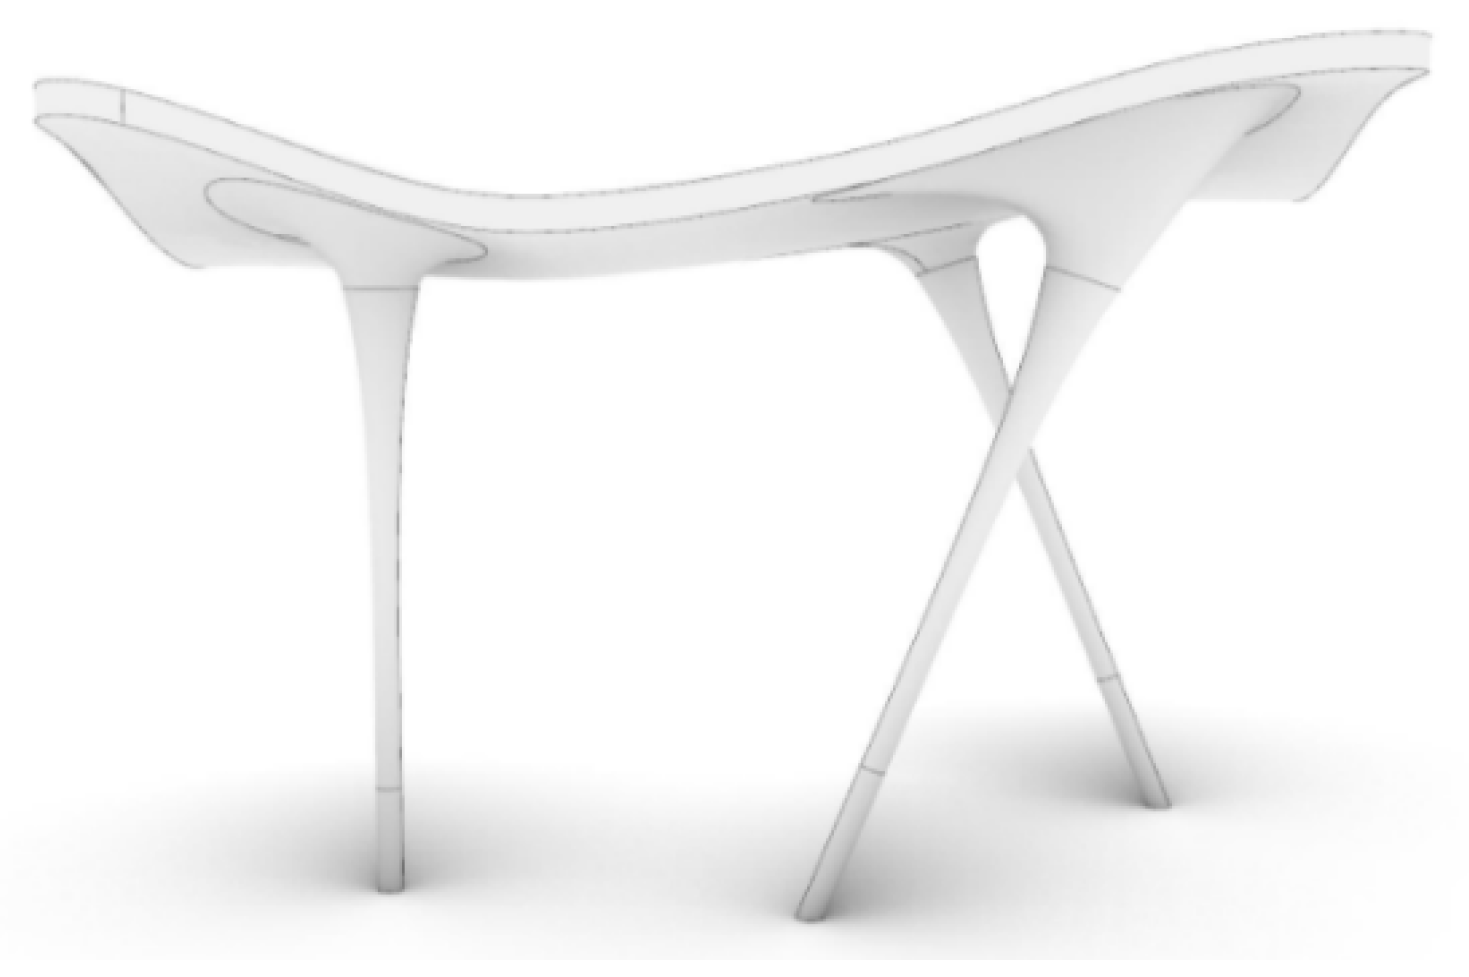
2.1. Overview
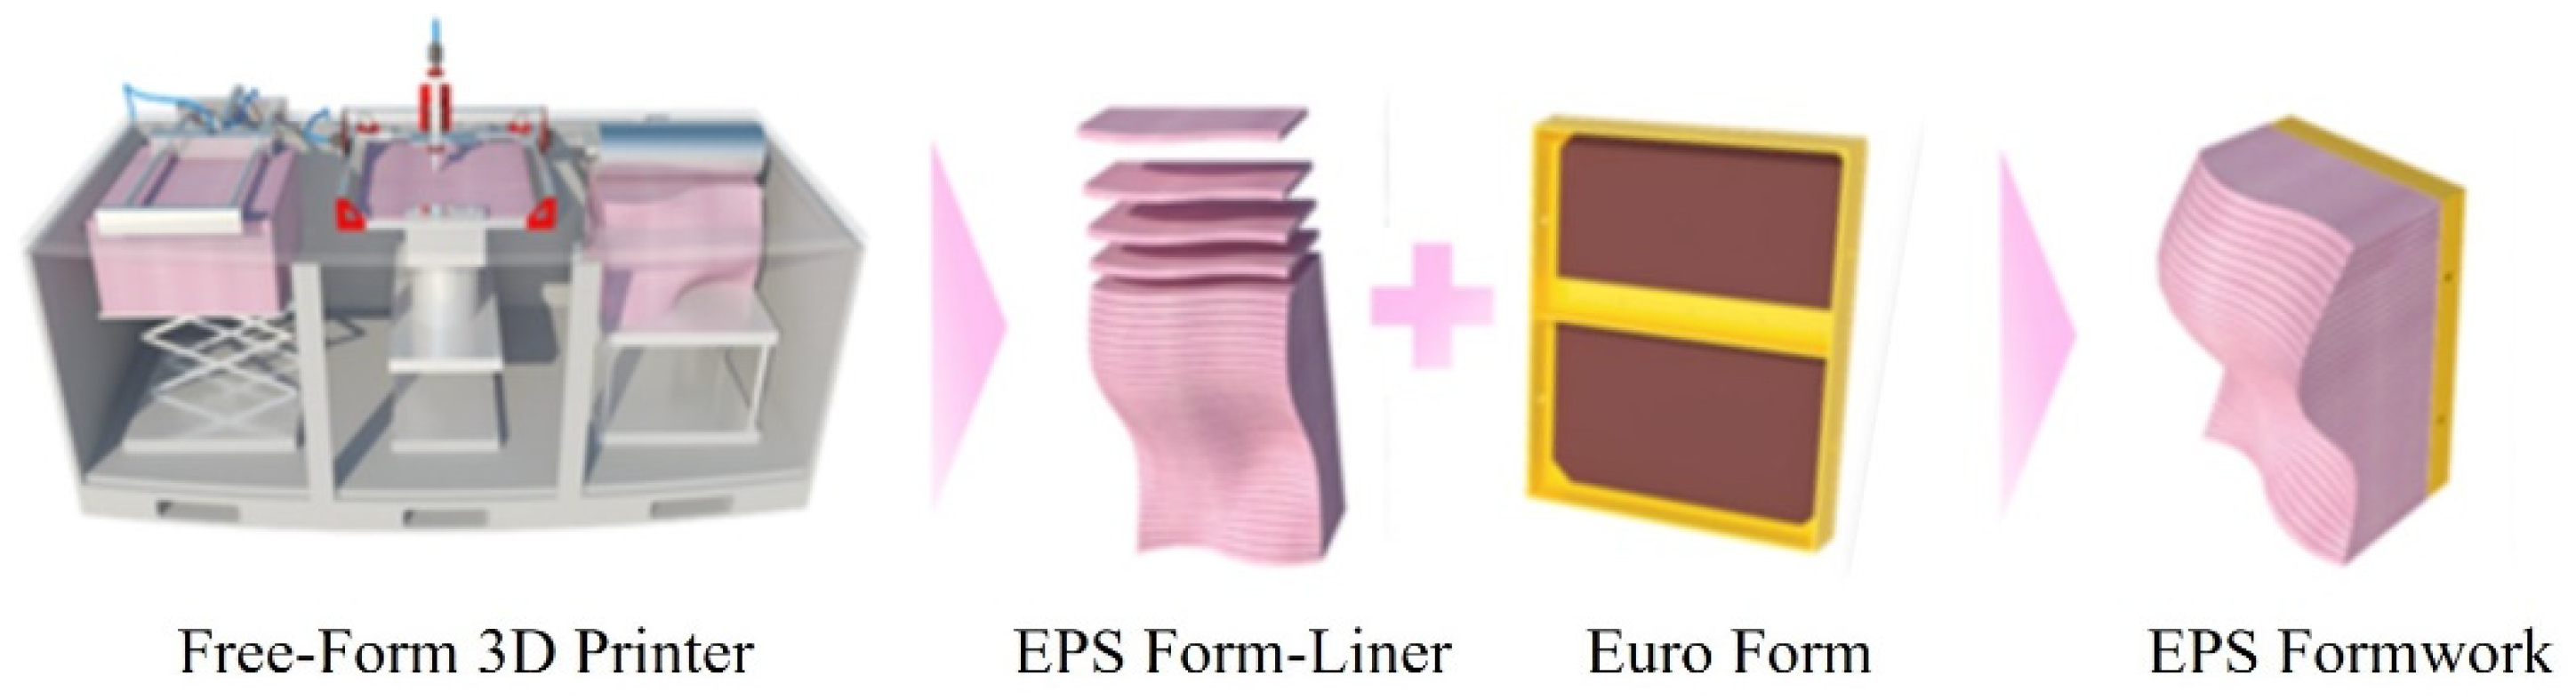
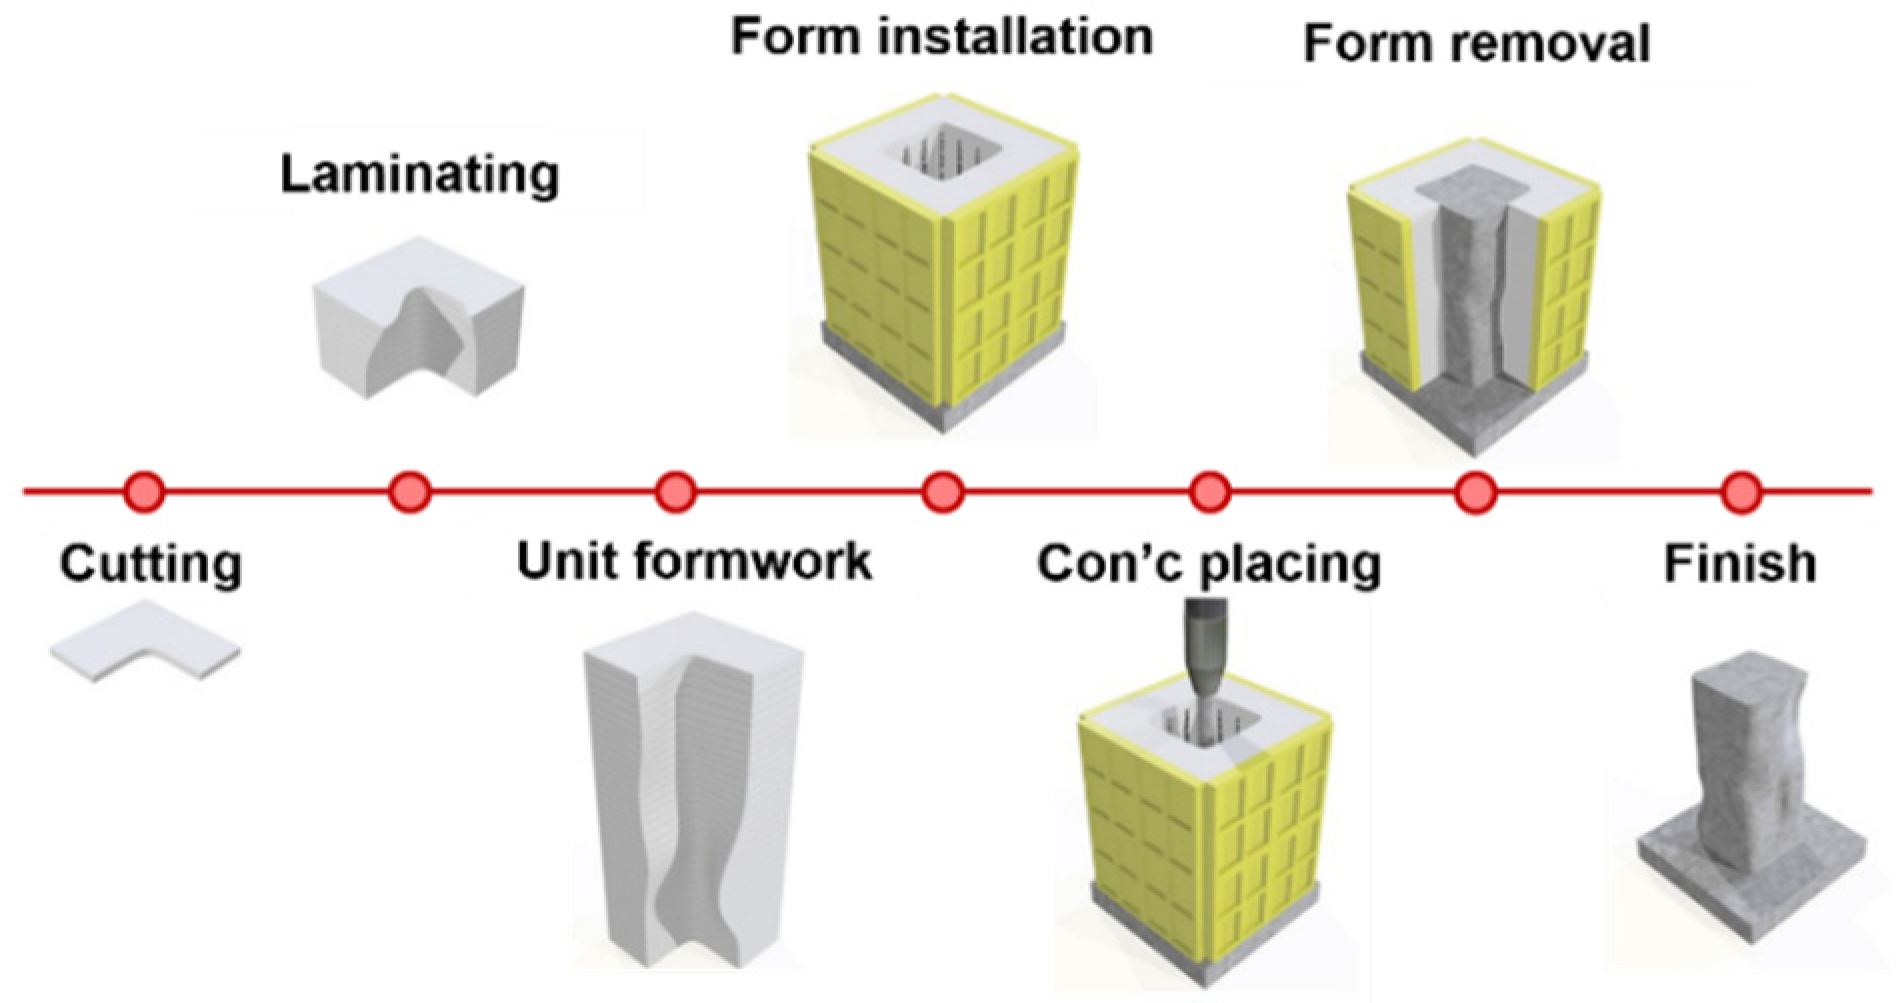
2.2. Manufacturing Process
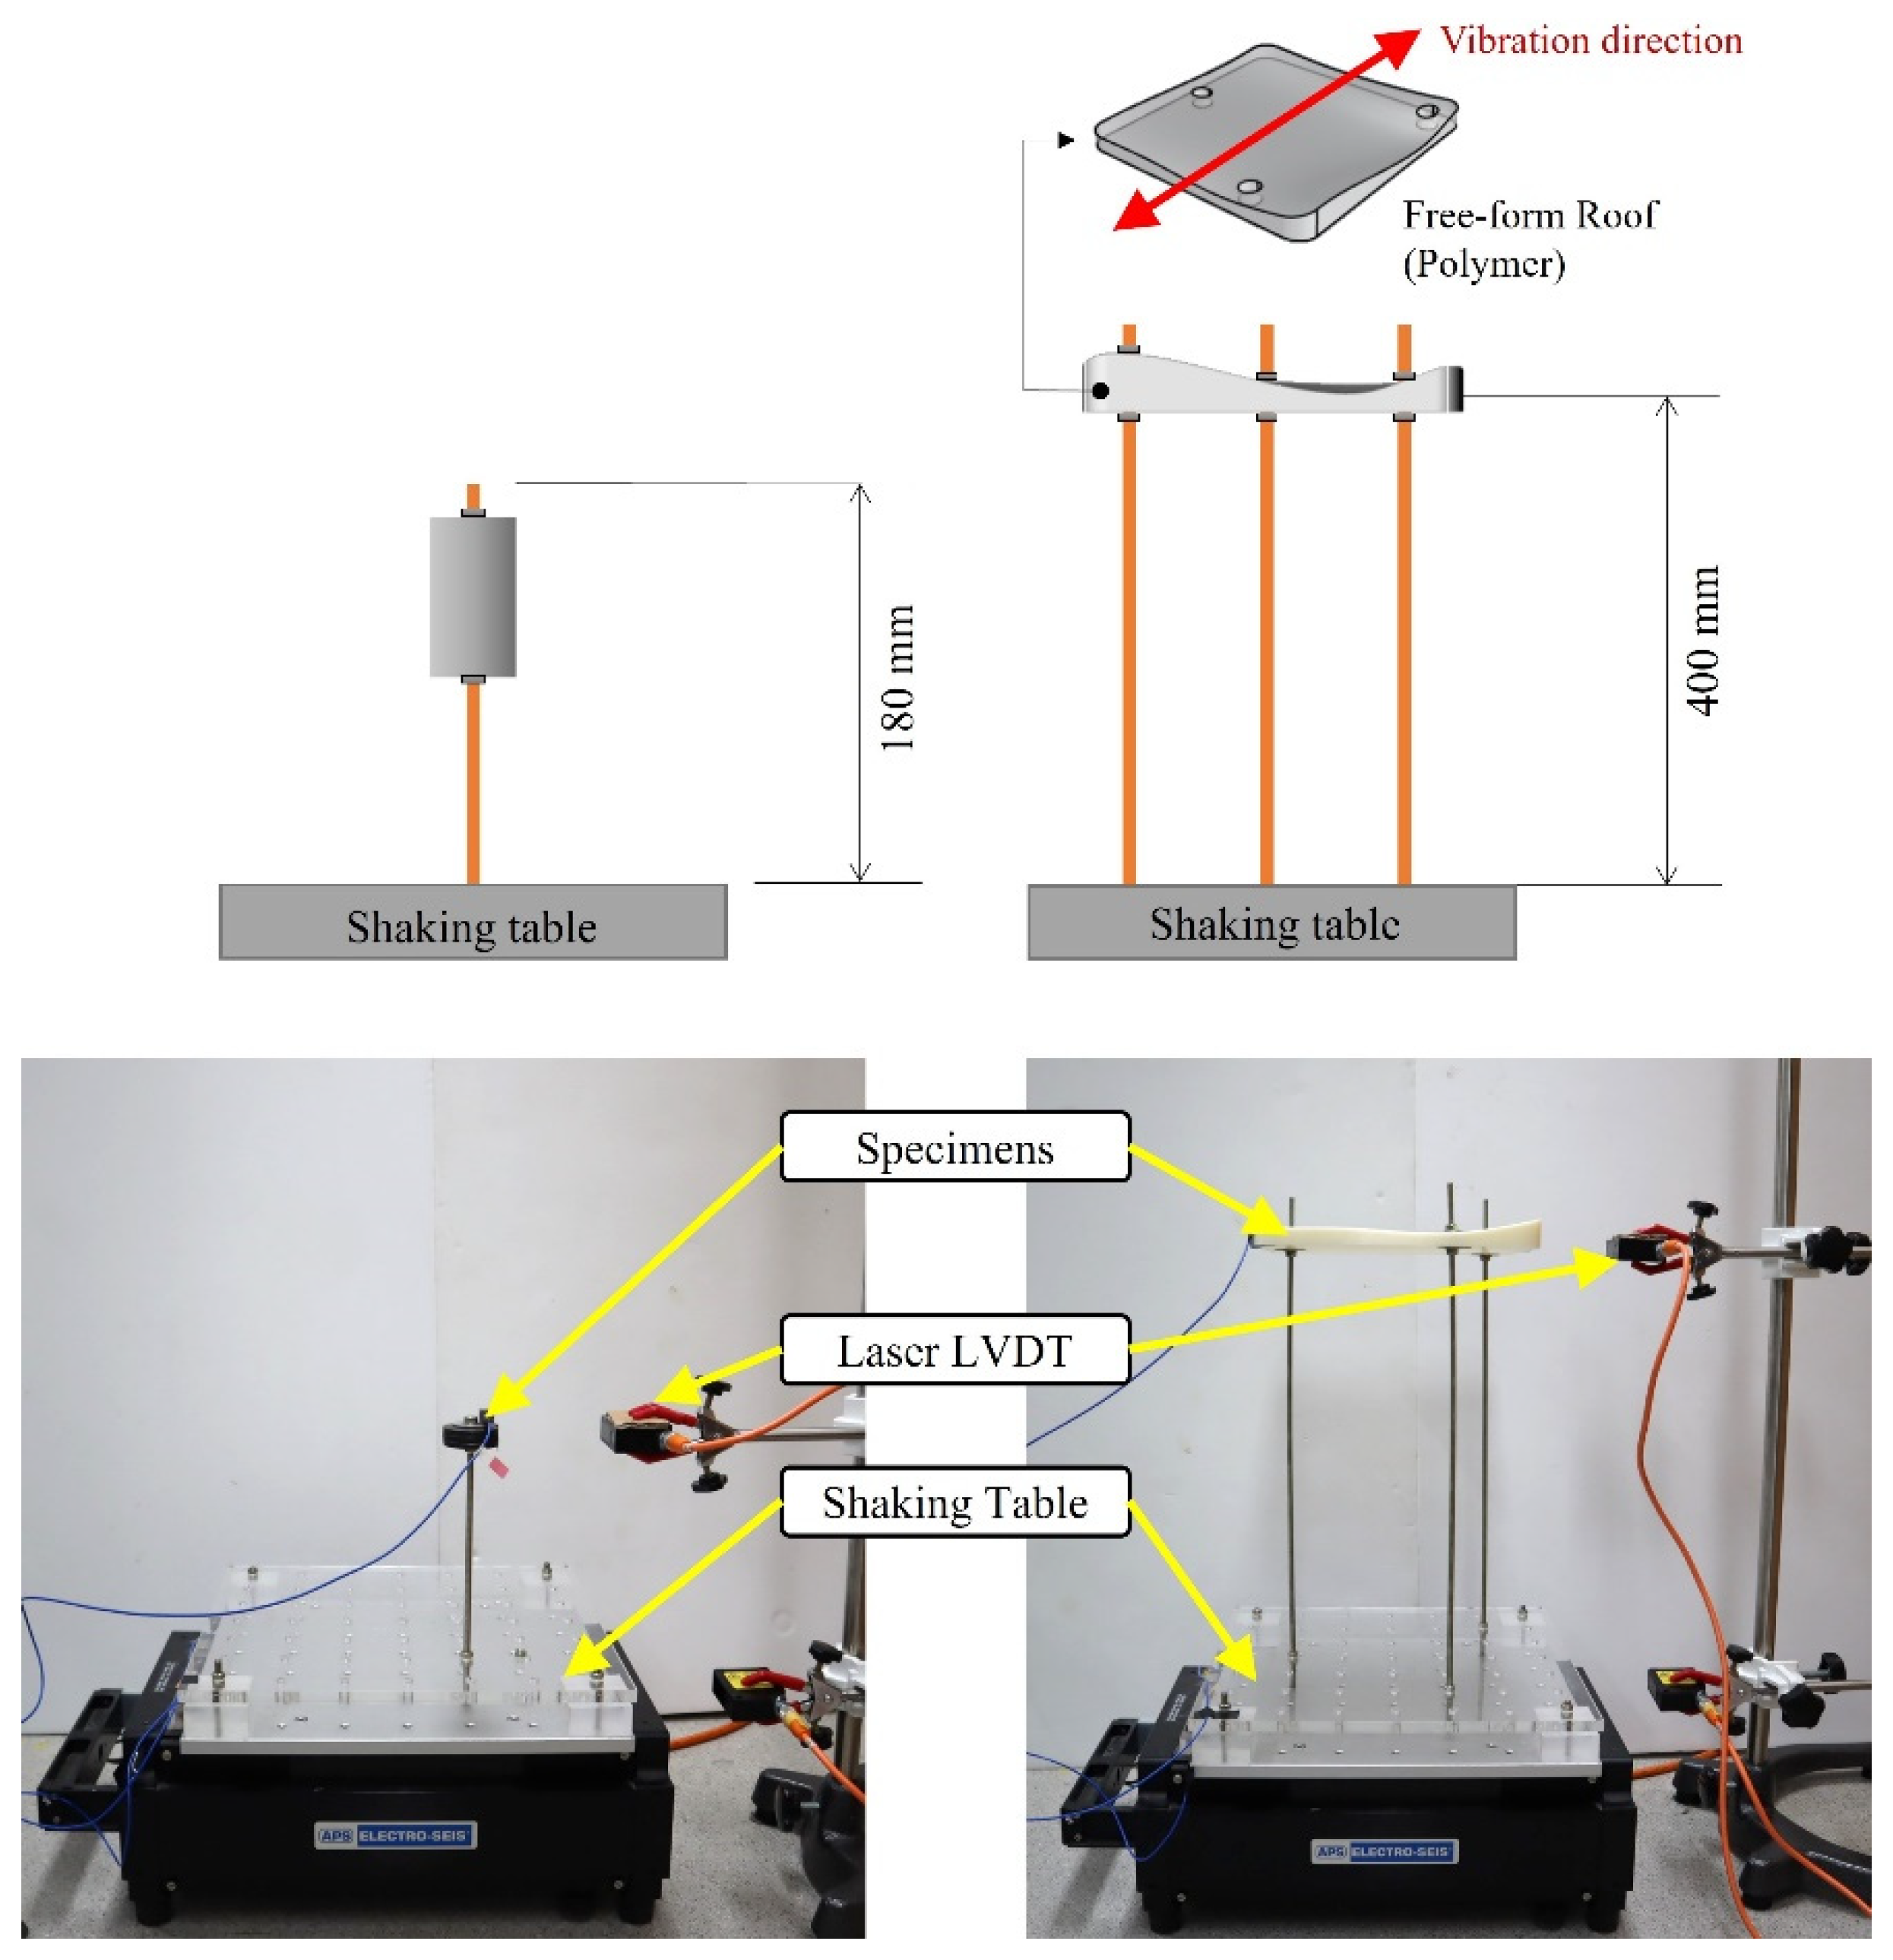
3. Small-Scale Shaking Table Tests
3.1. Overview
3.2. Similitude Law
3.3. Test Specimens
3.4. Applied Vibration Plan
3.5. Test Results
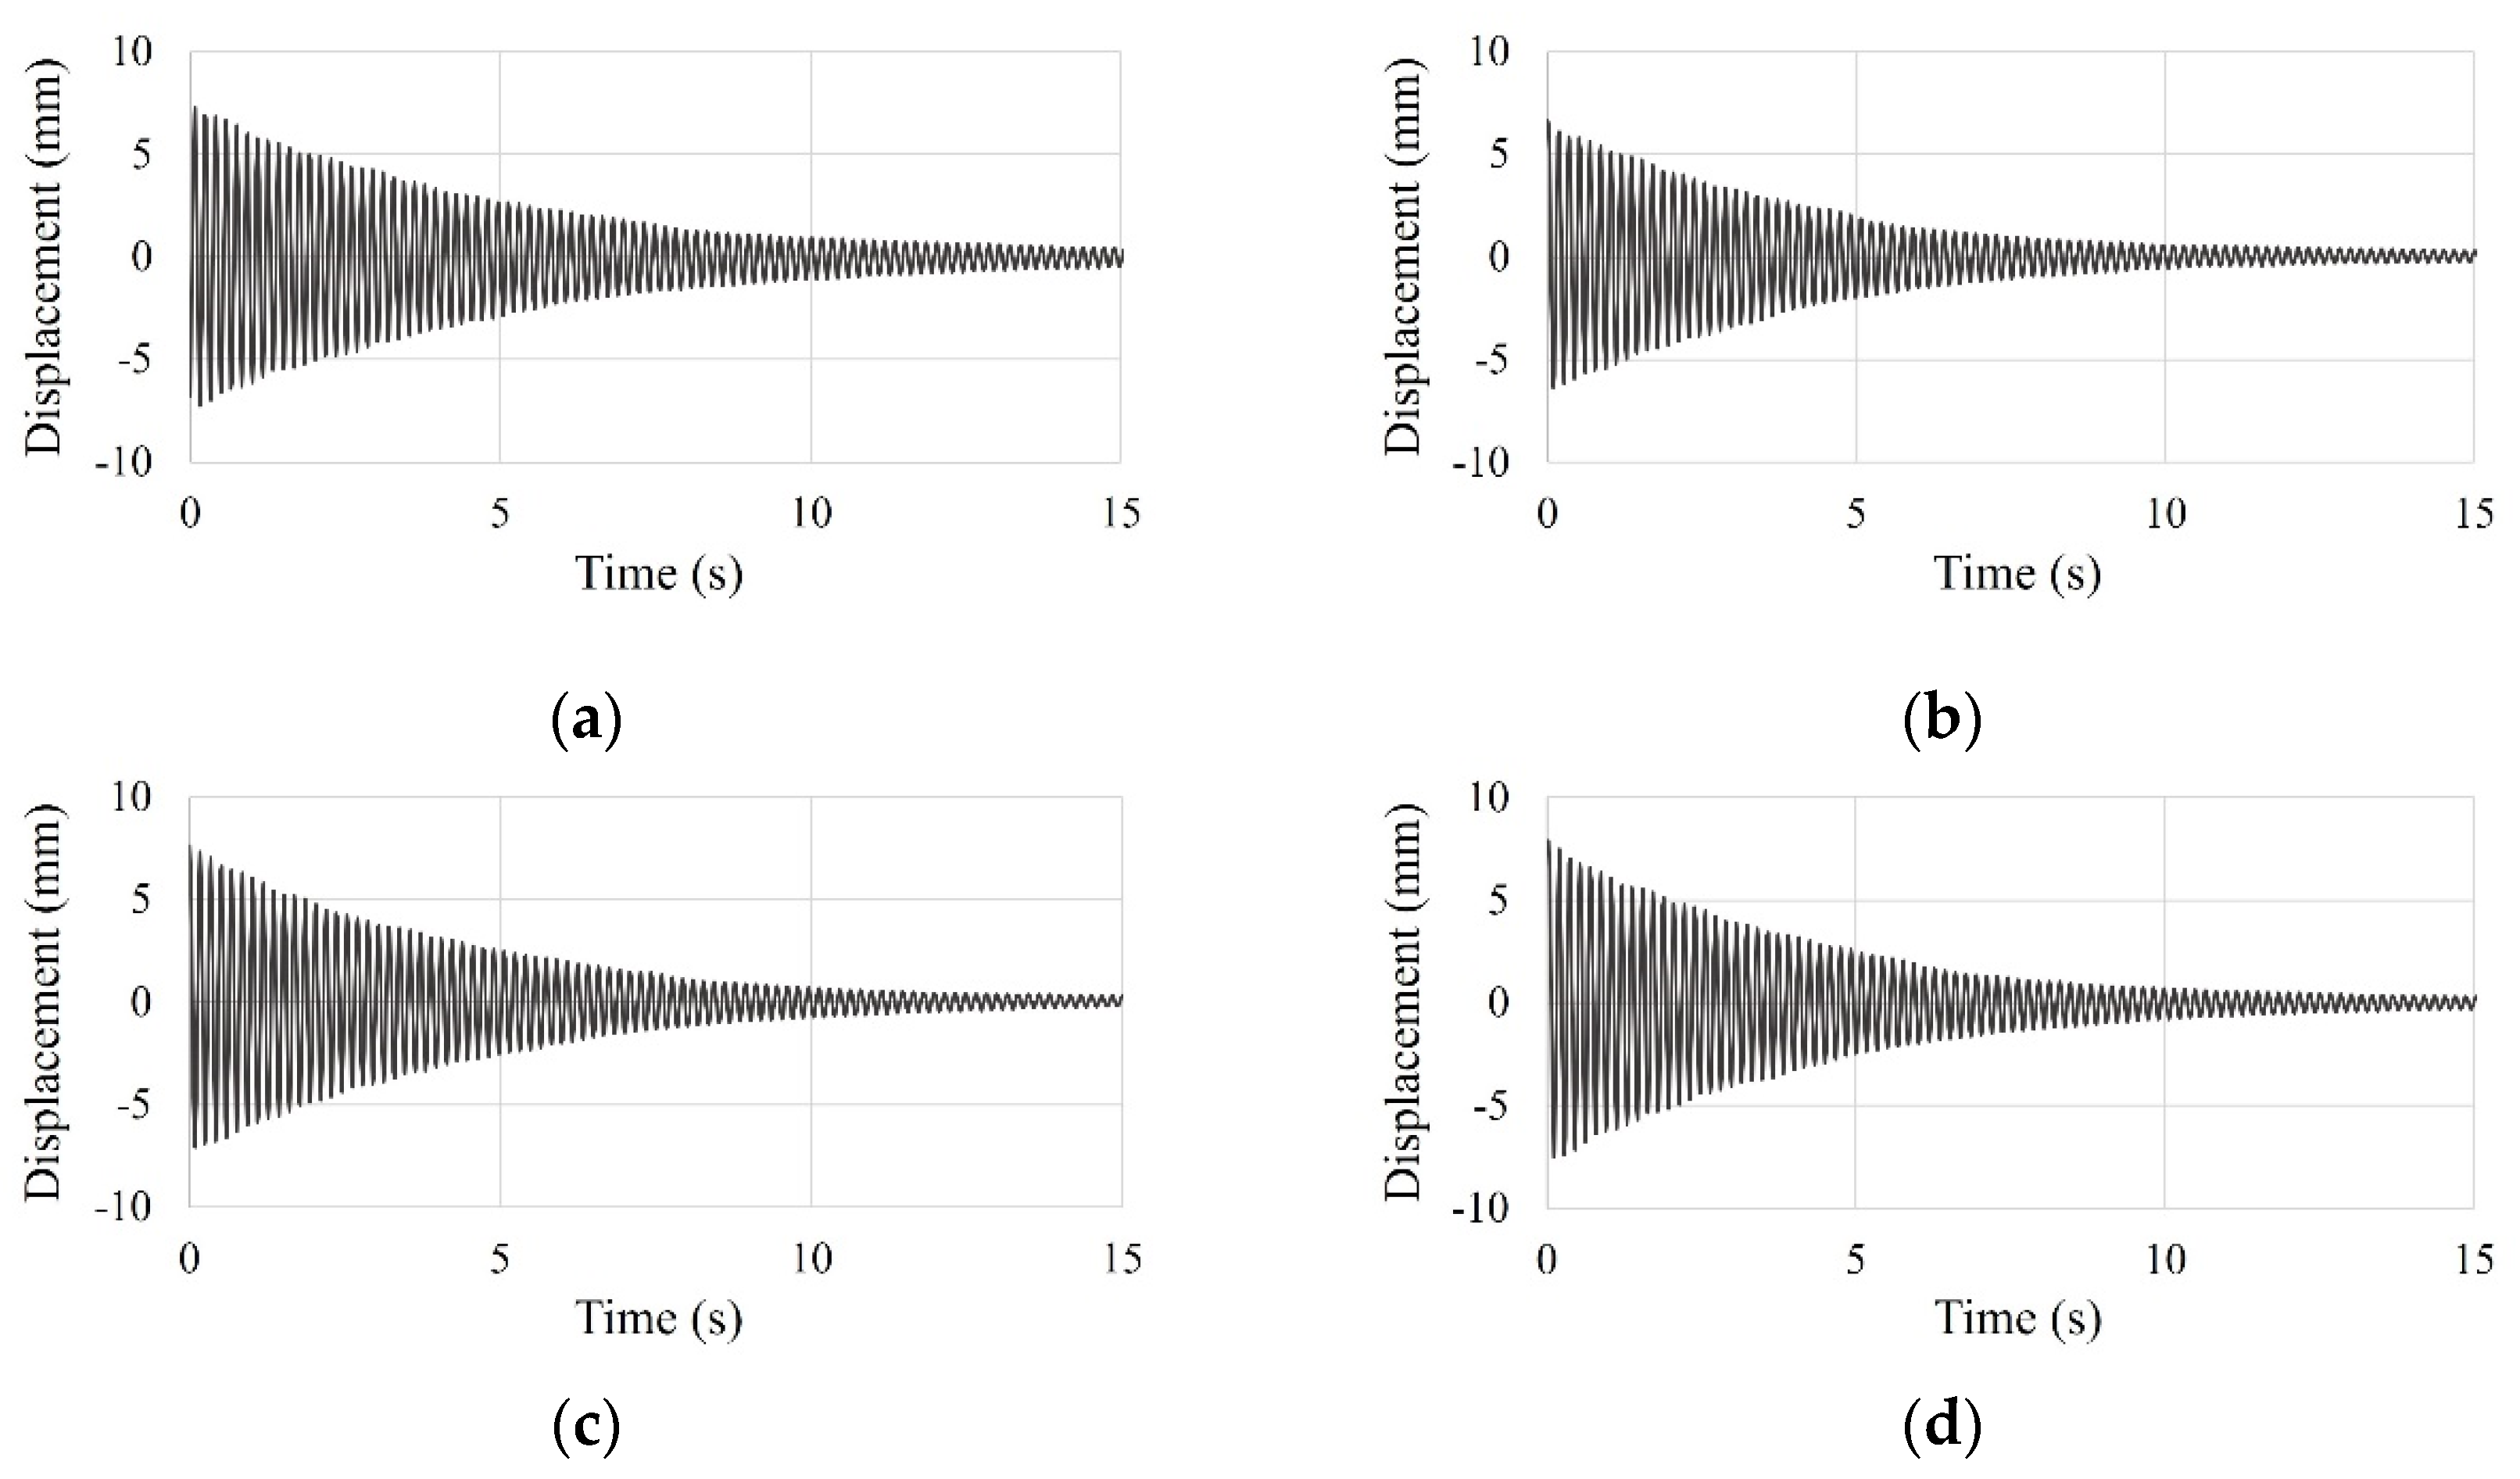
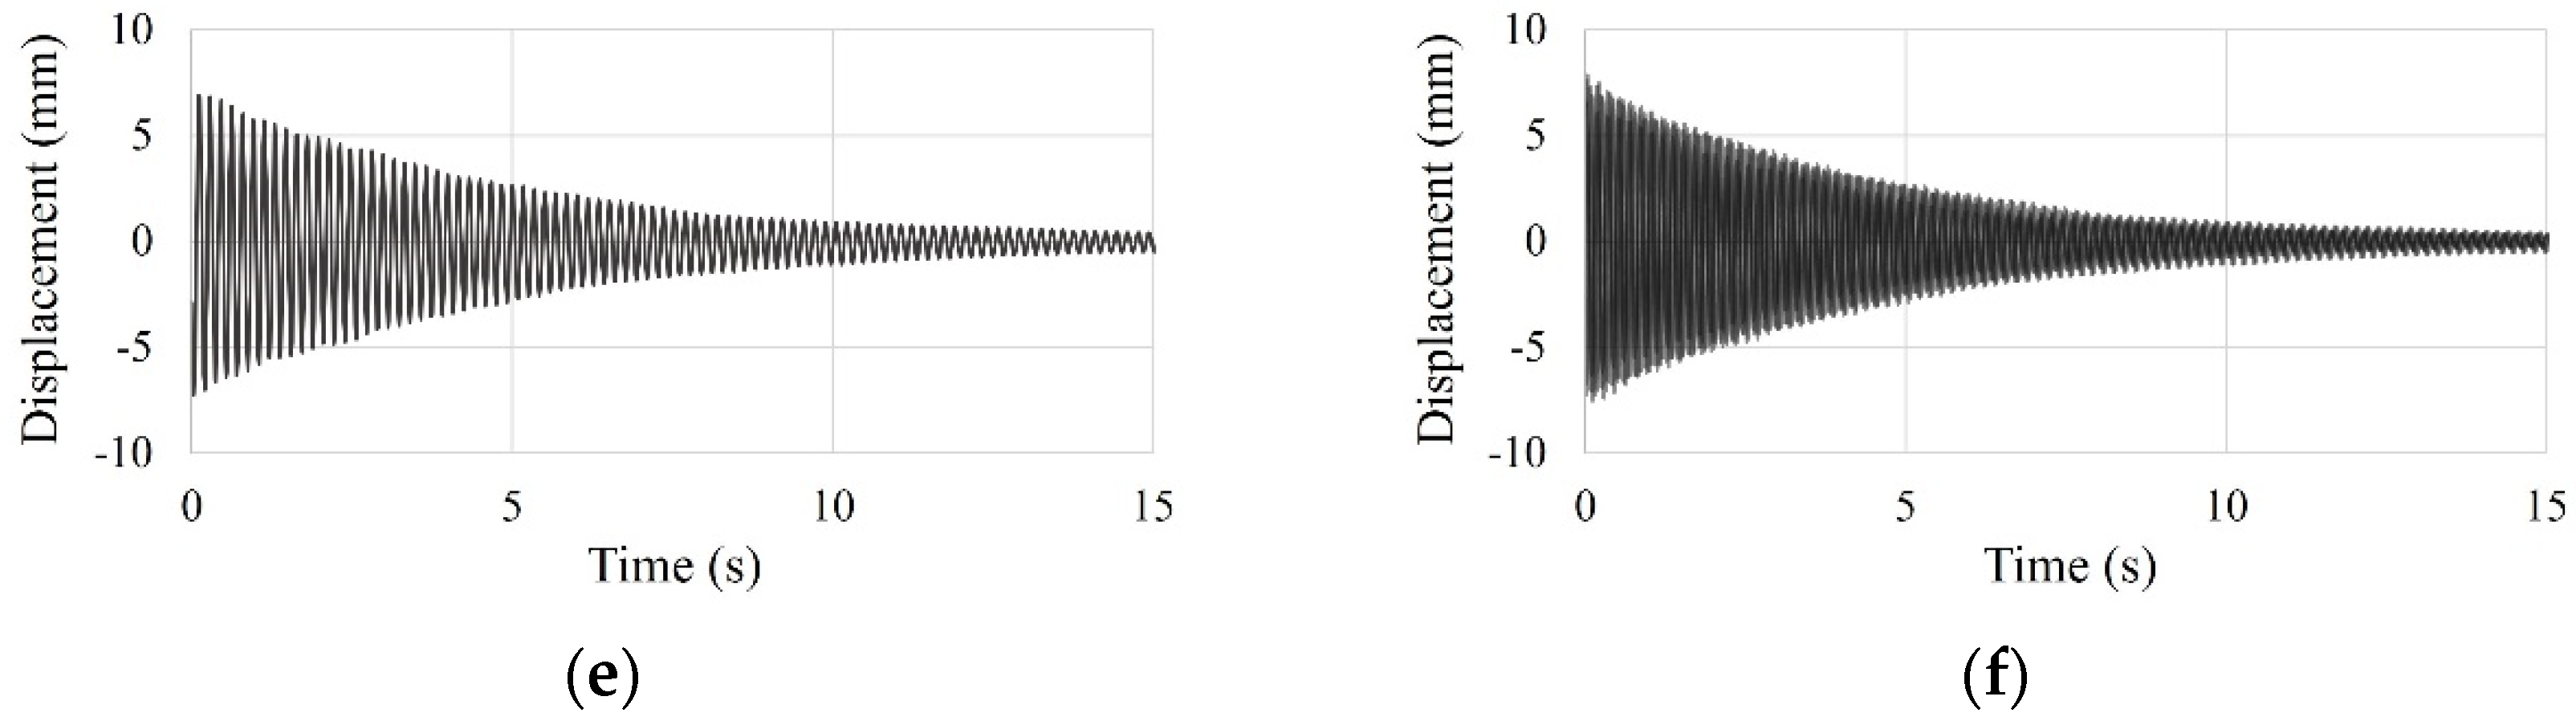
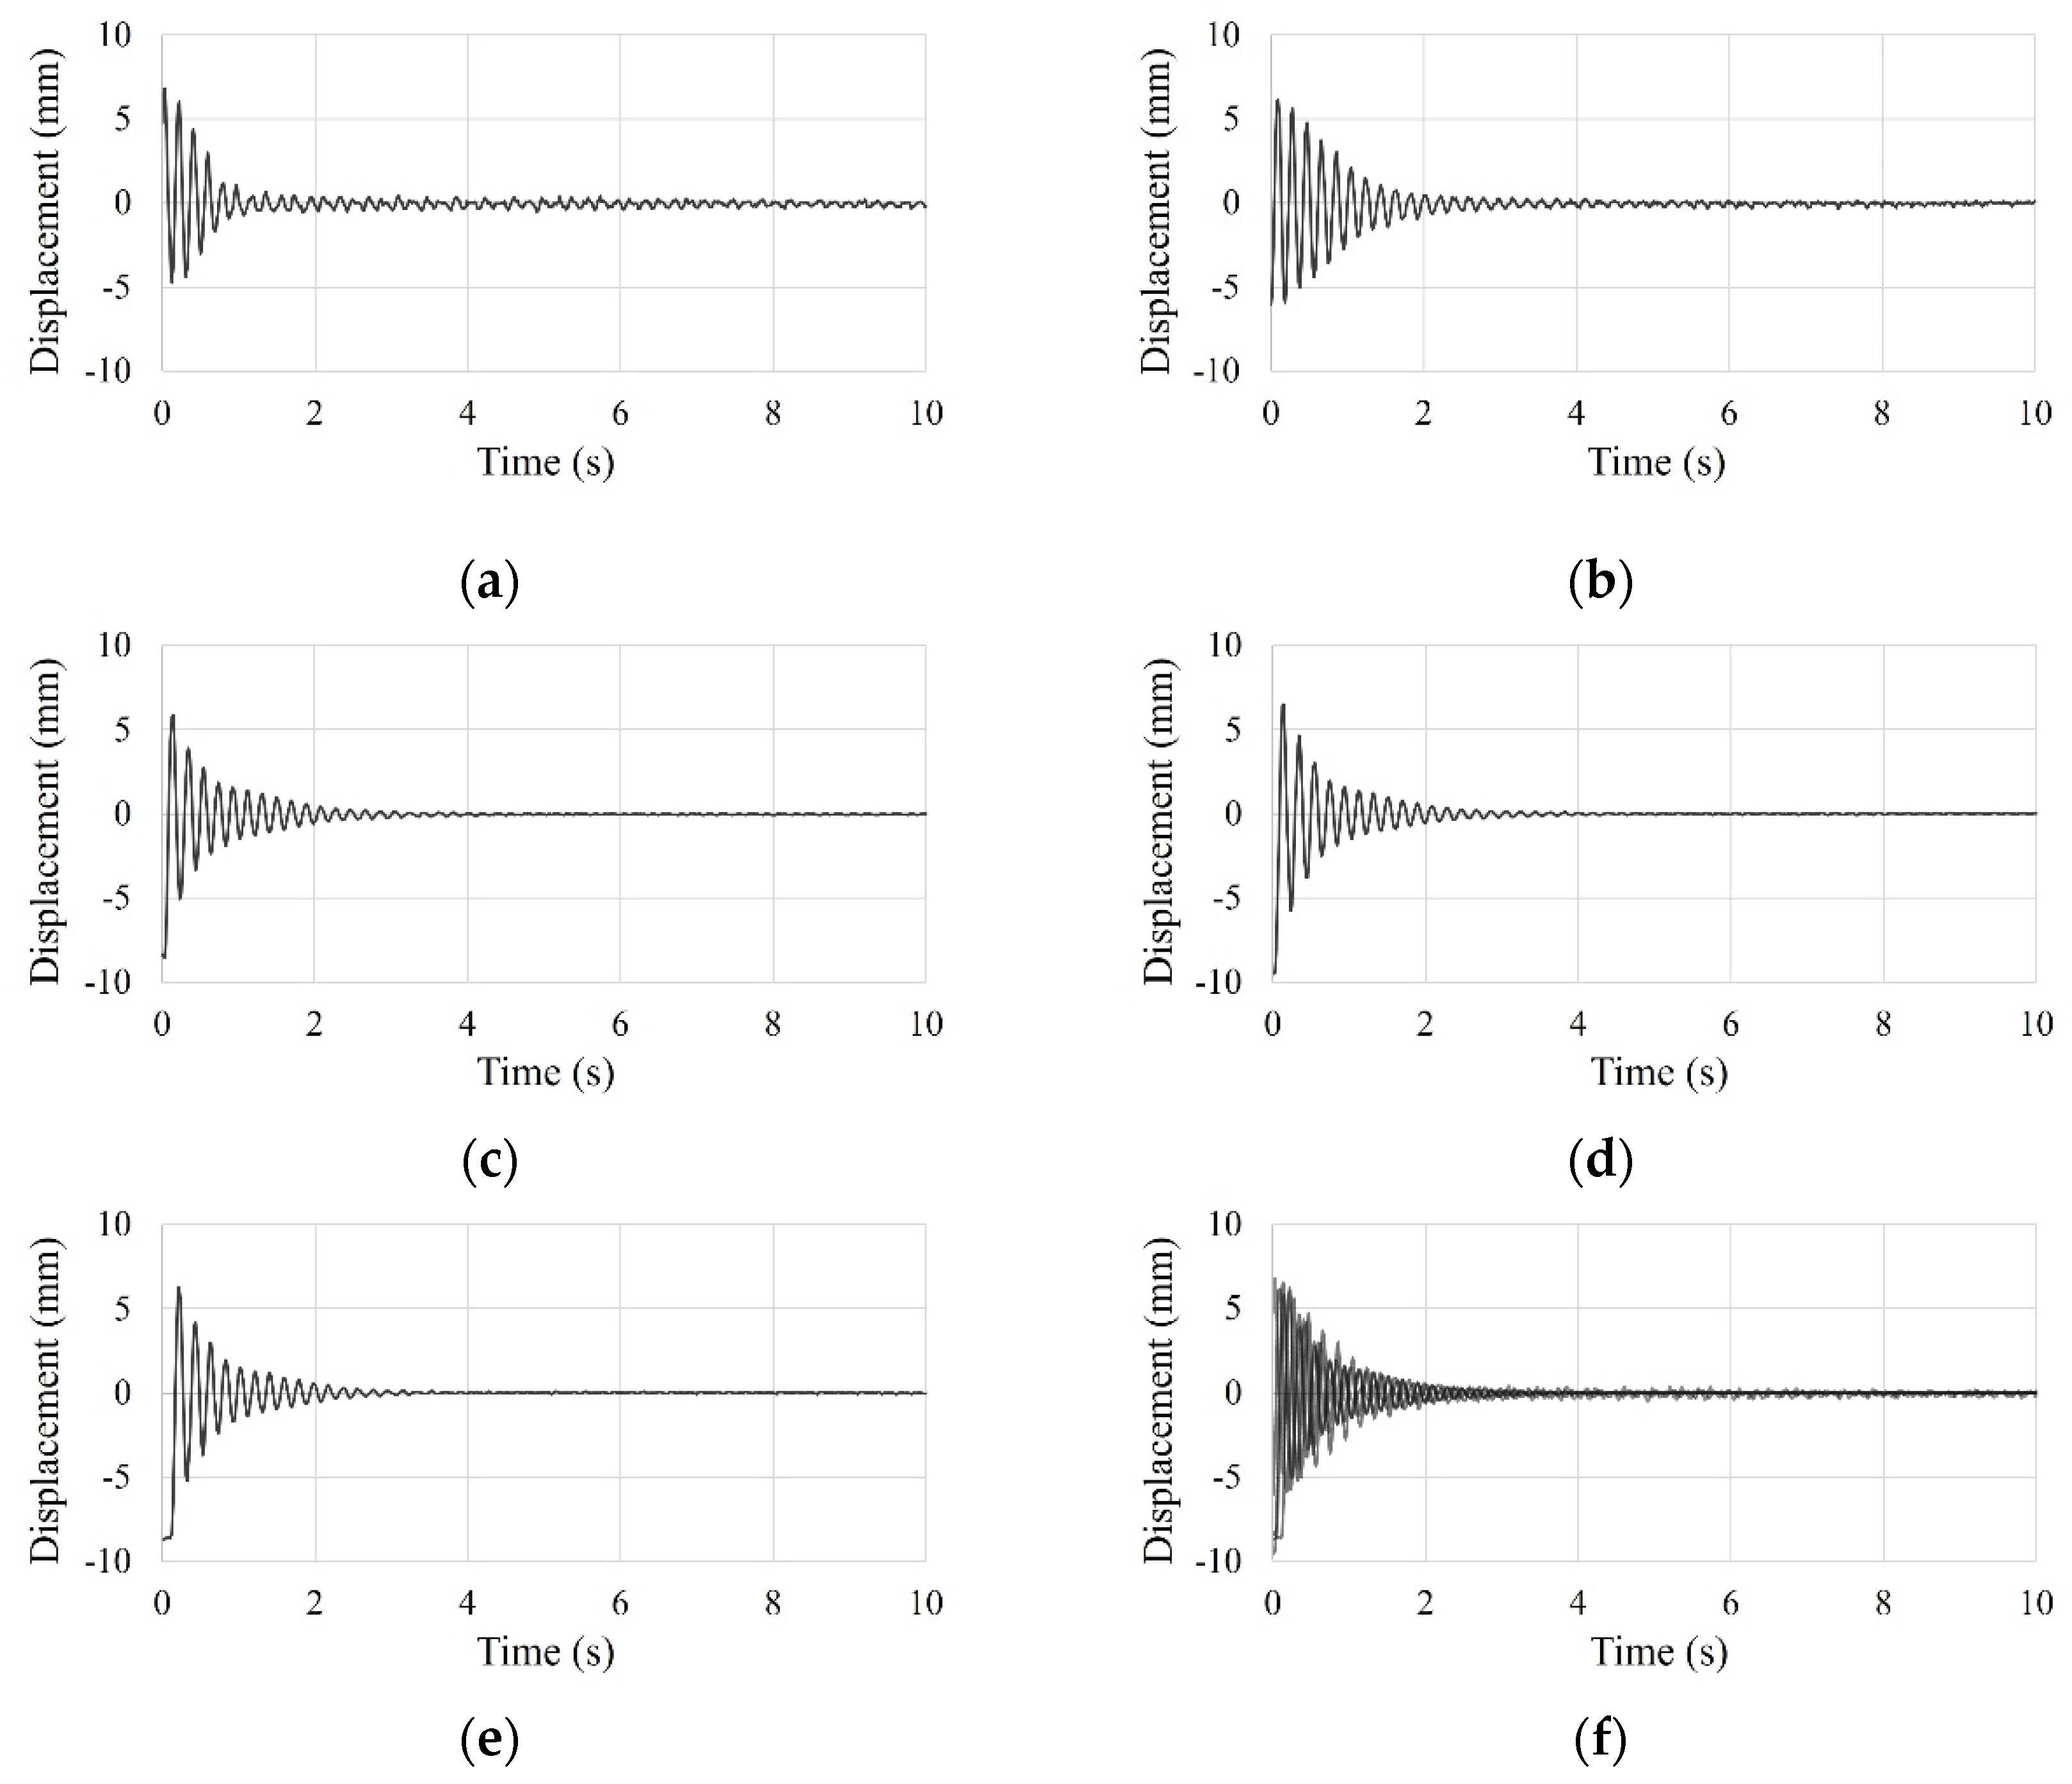
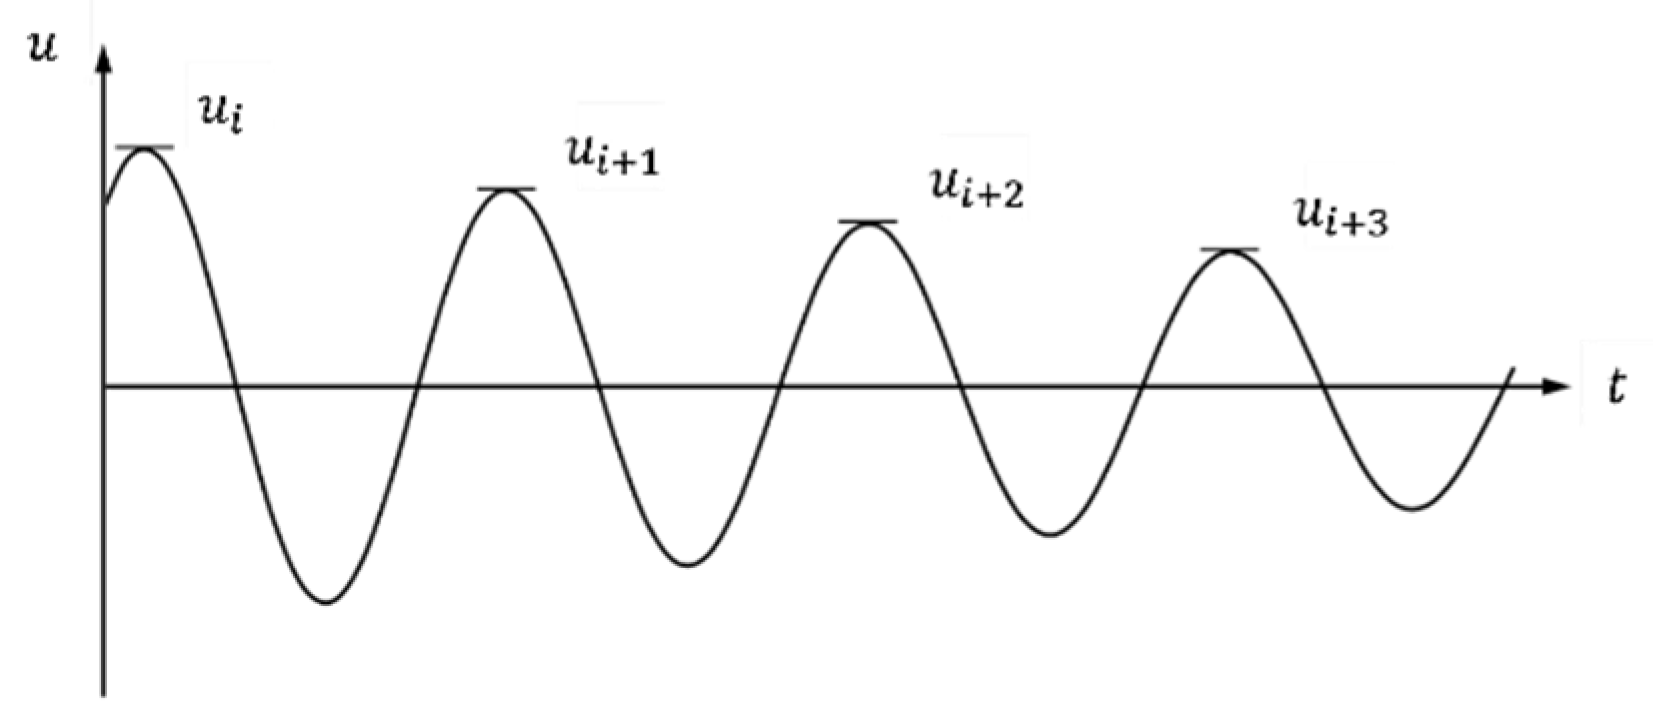
3.5.1. Free Vibration
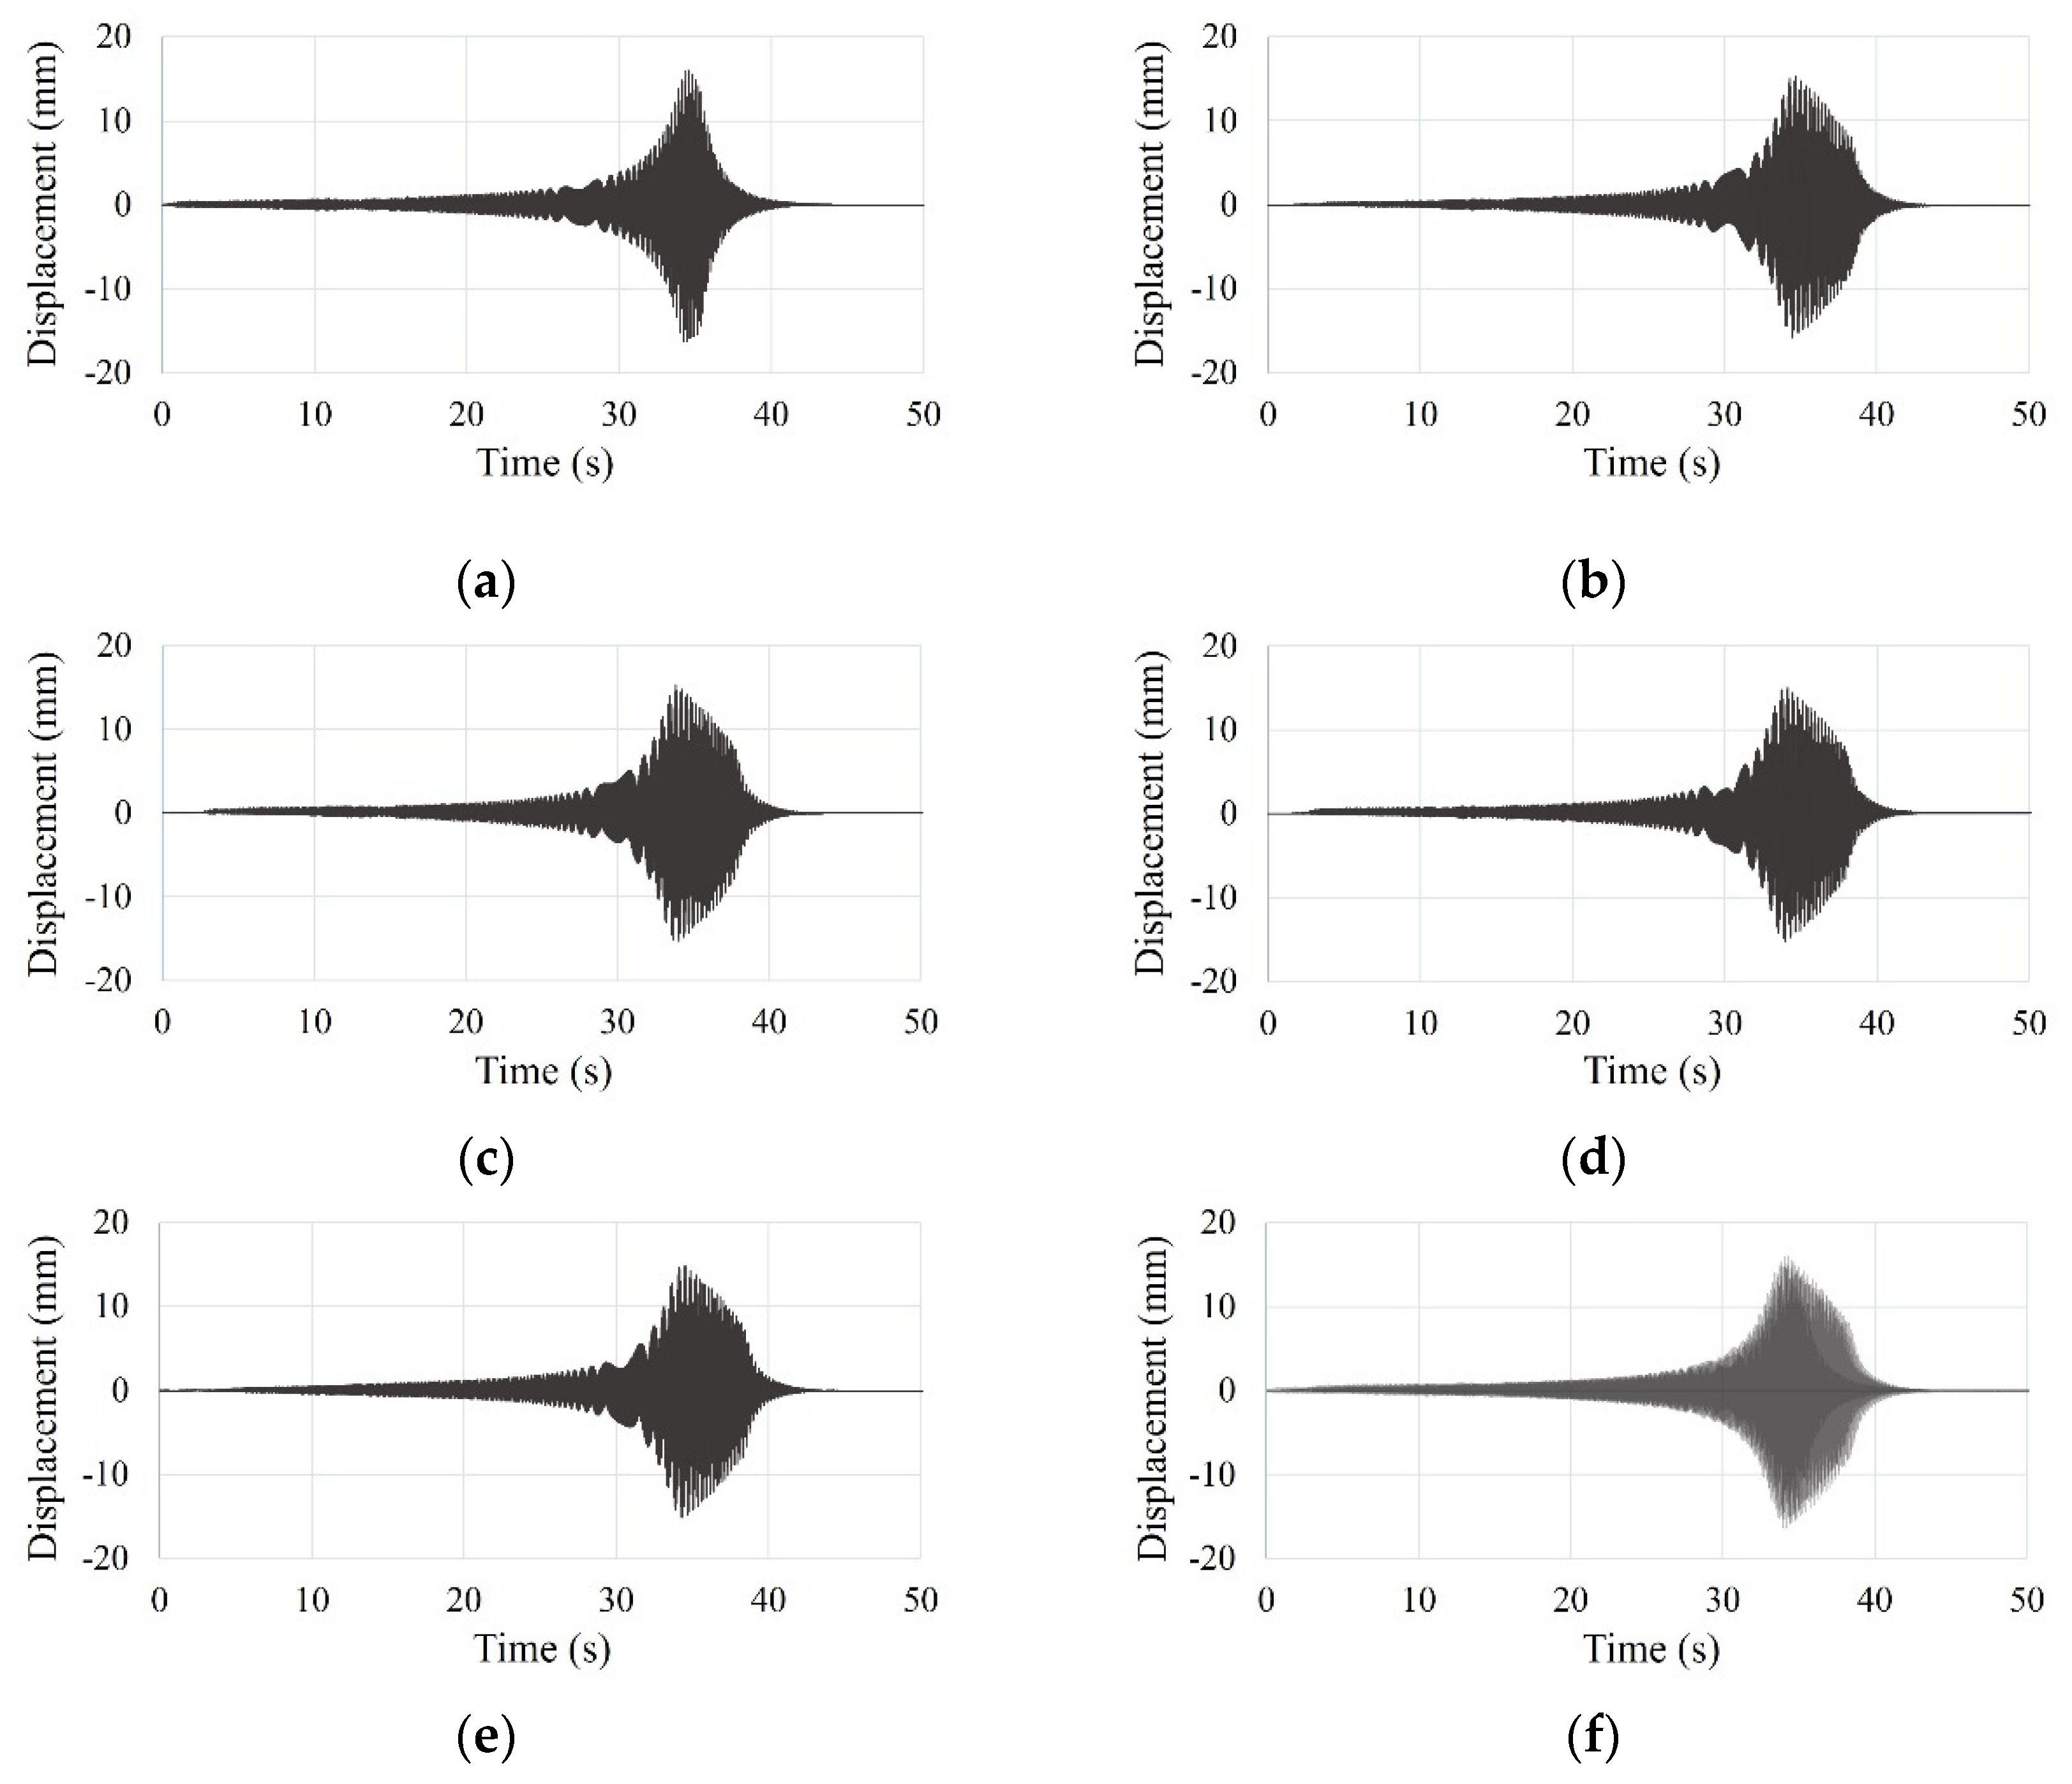
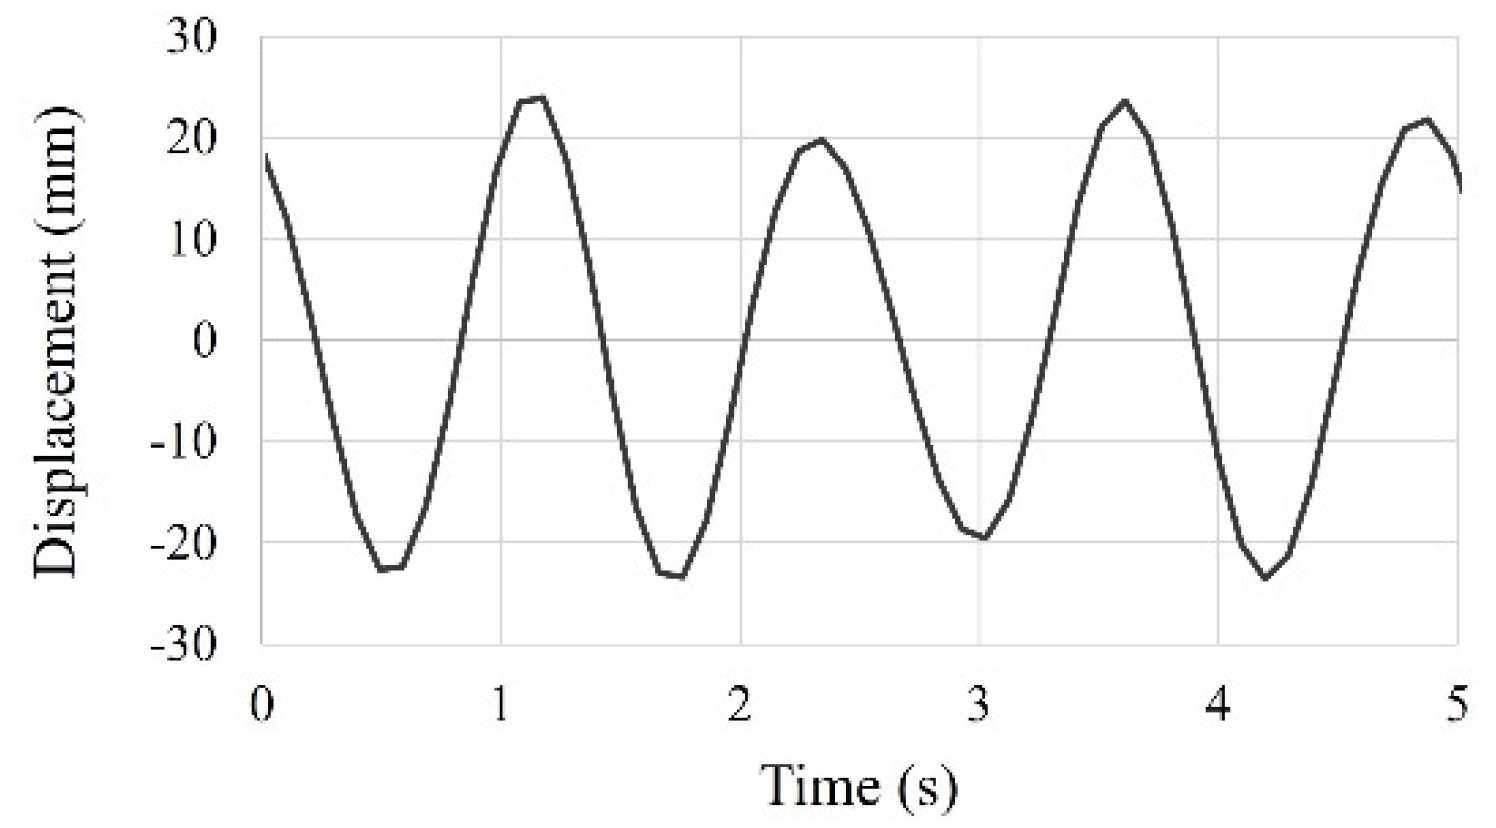
3.5.2. Sinusoidal Forced Vibration
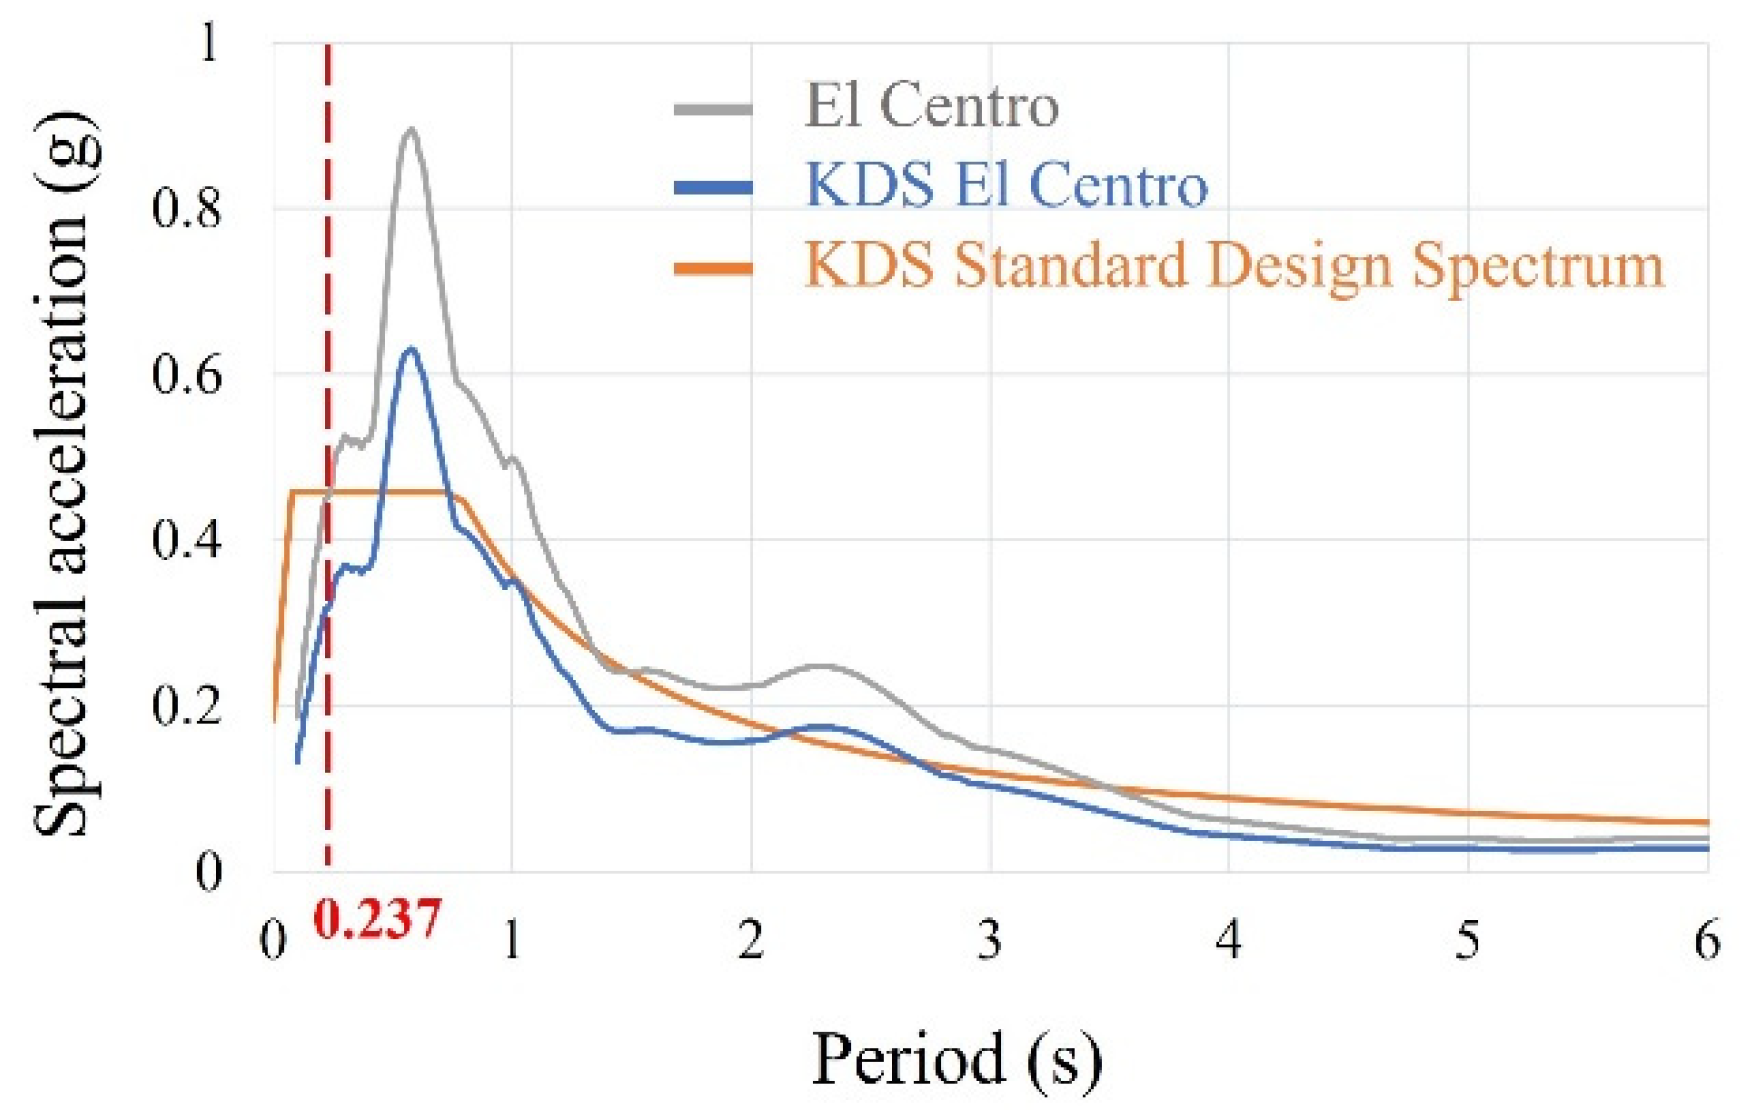
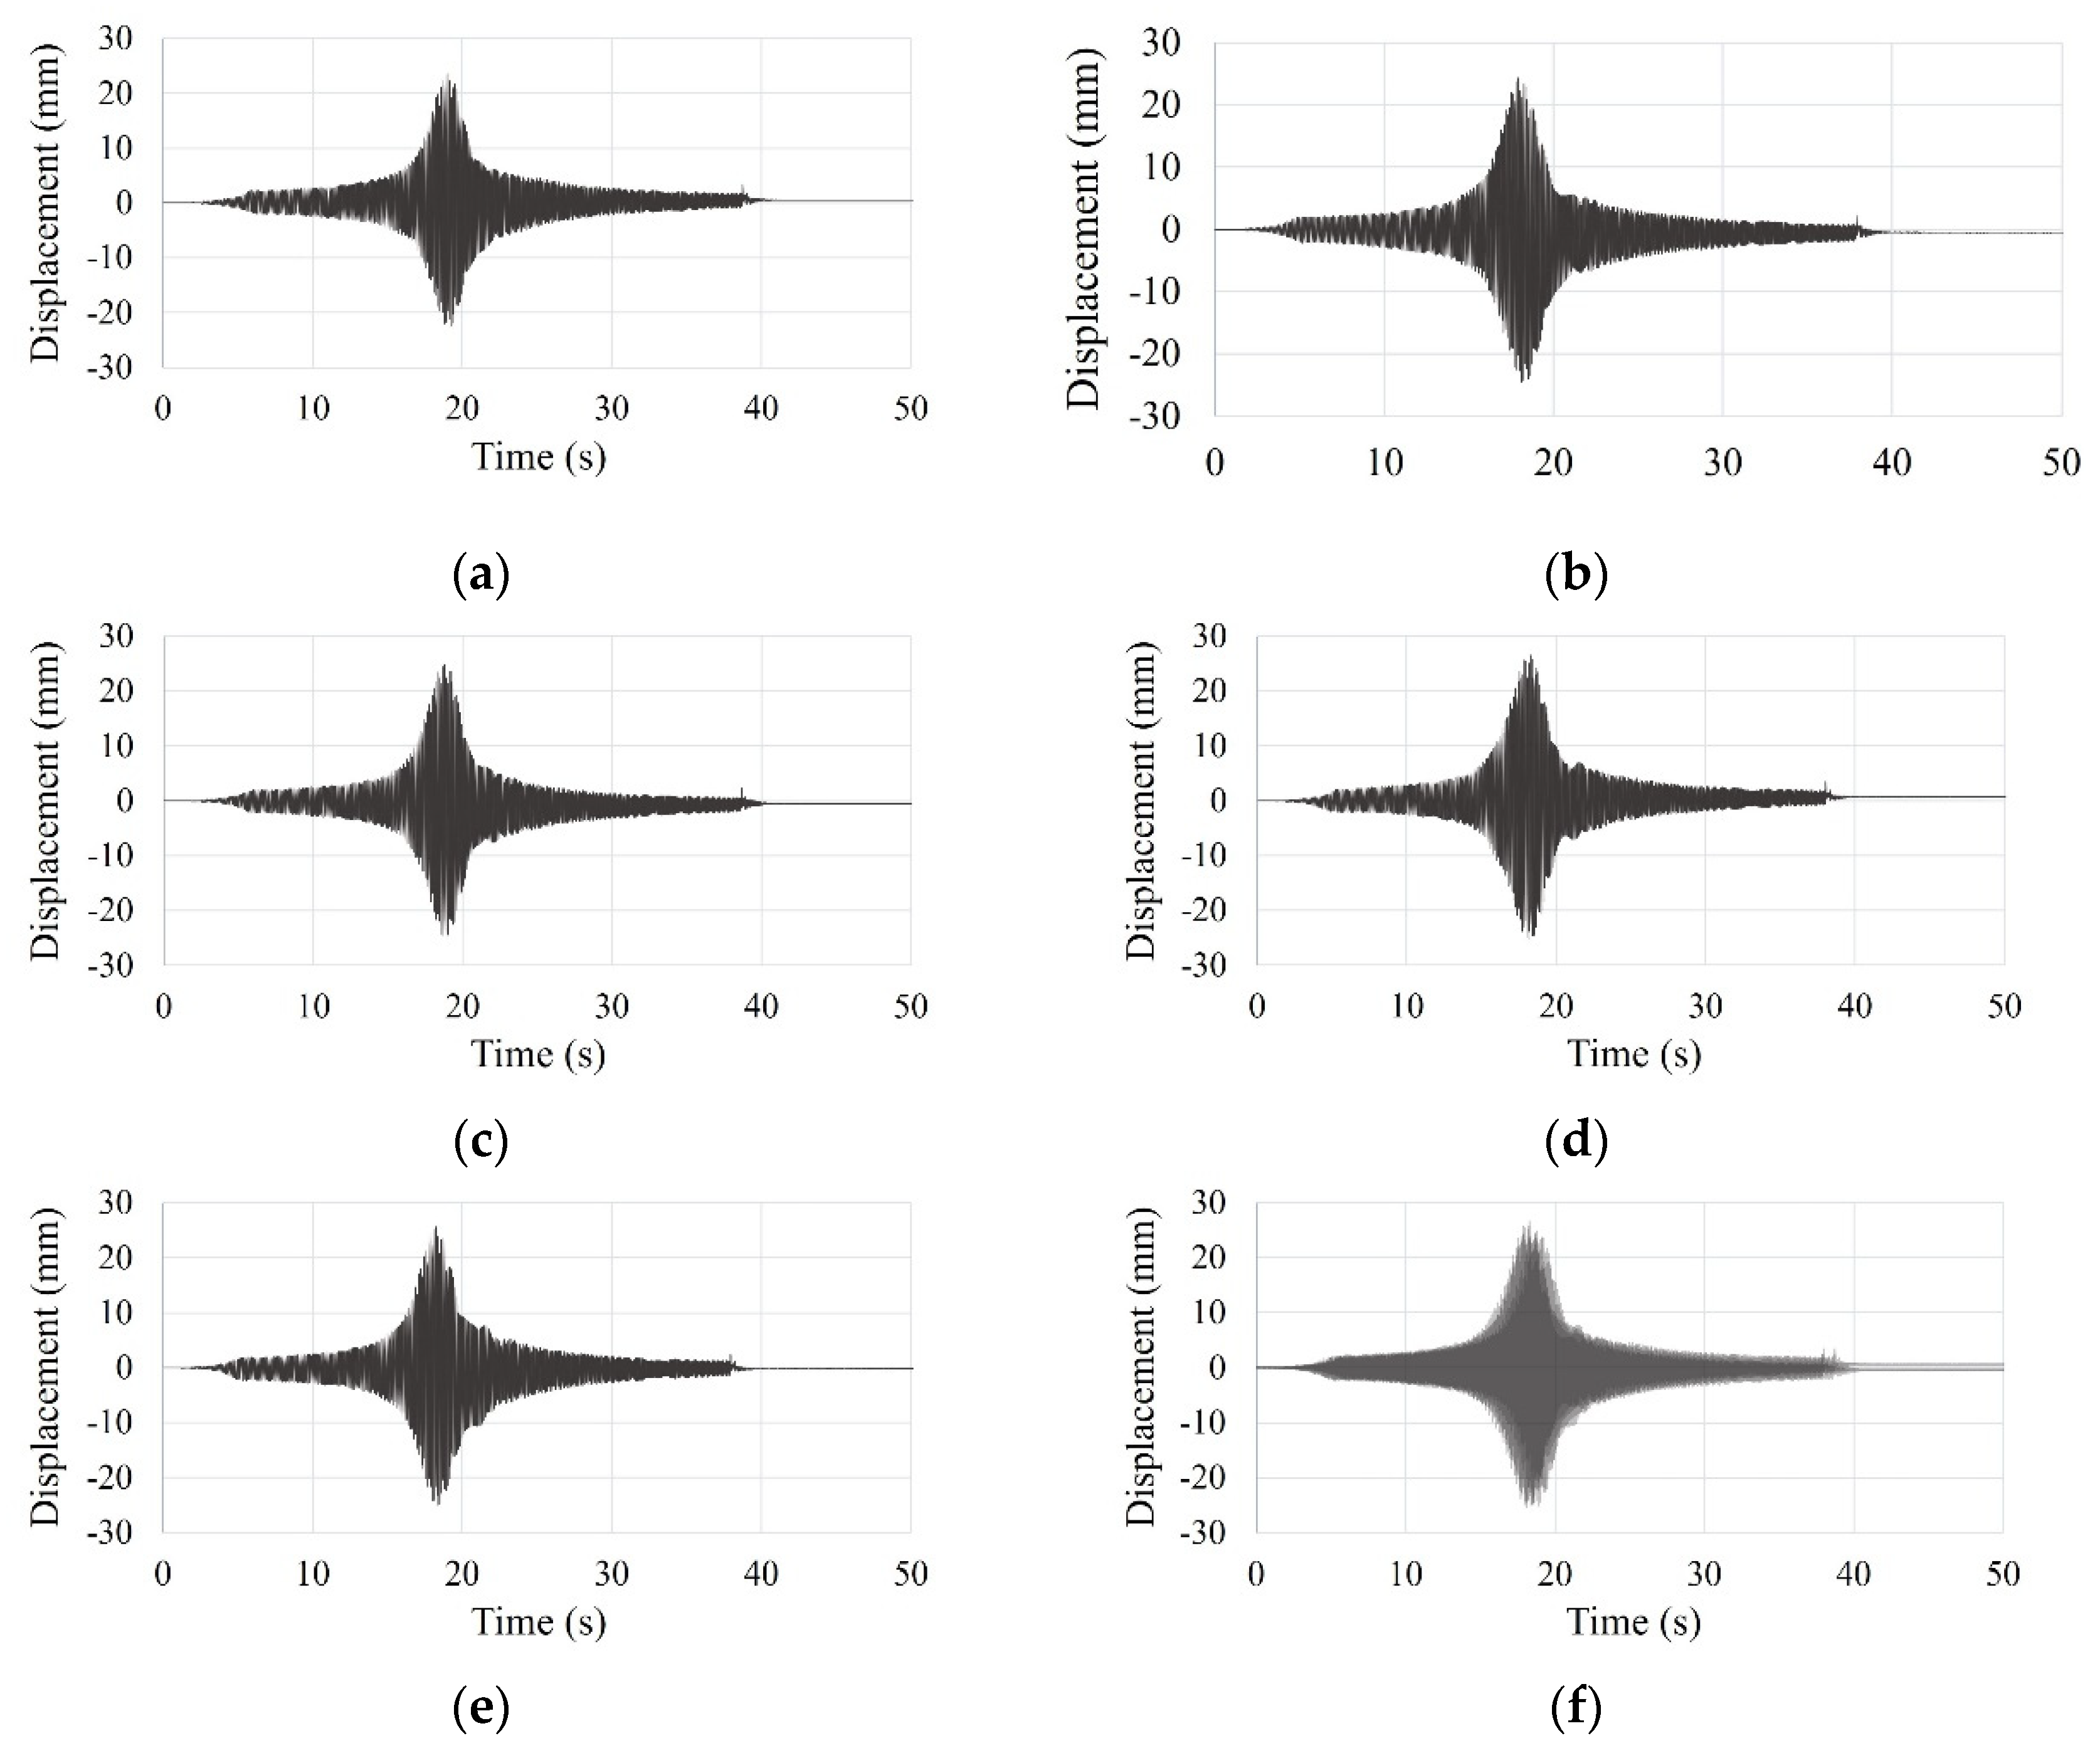
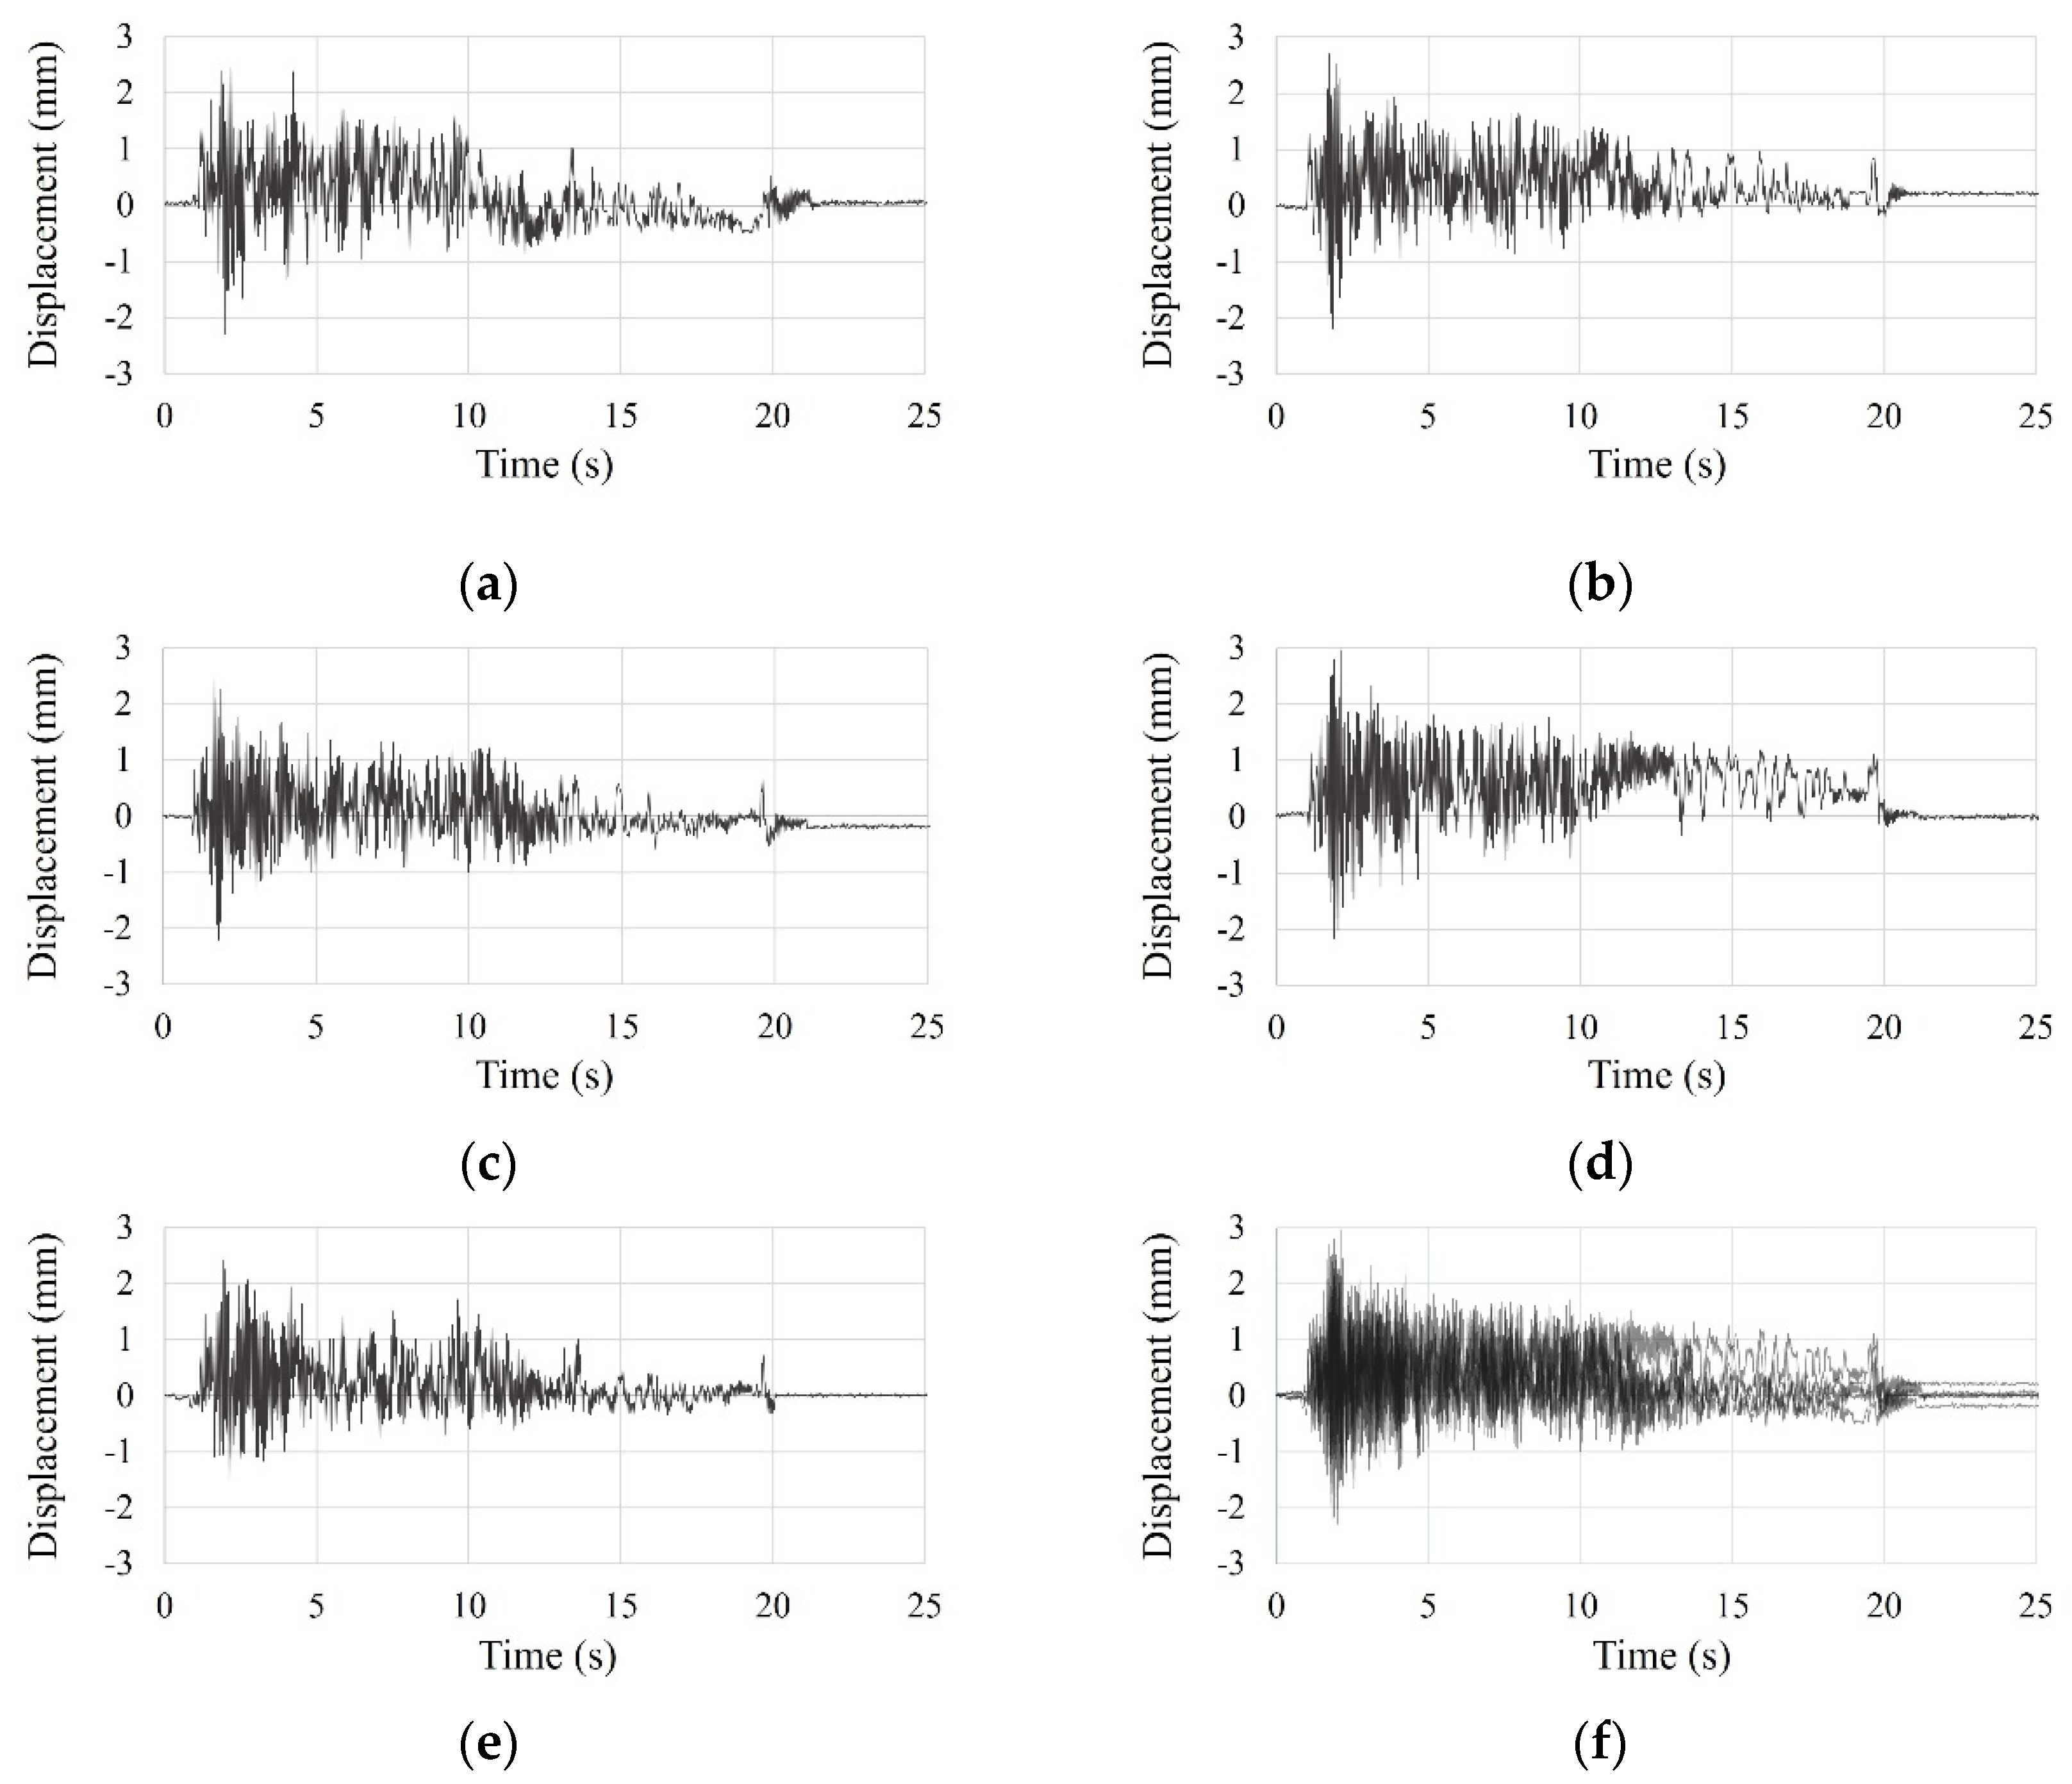
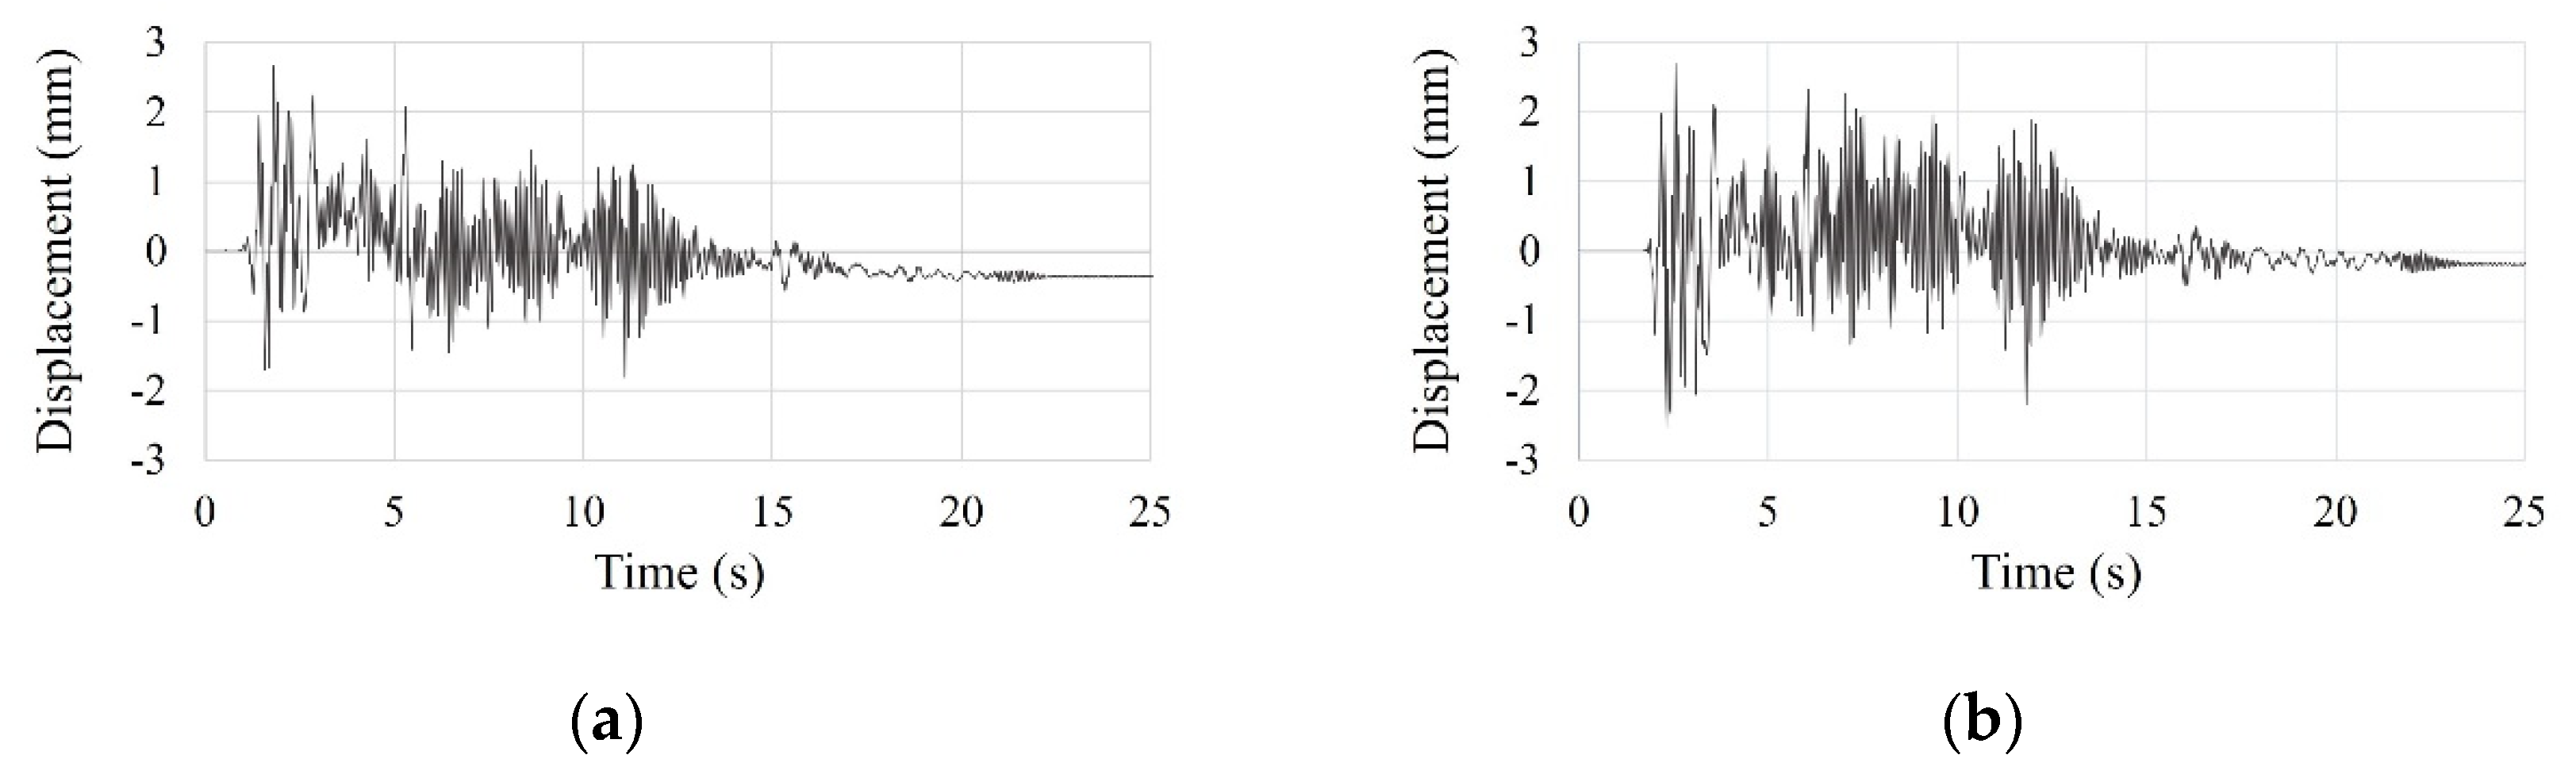
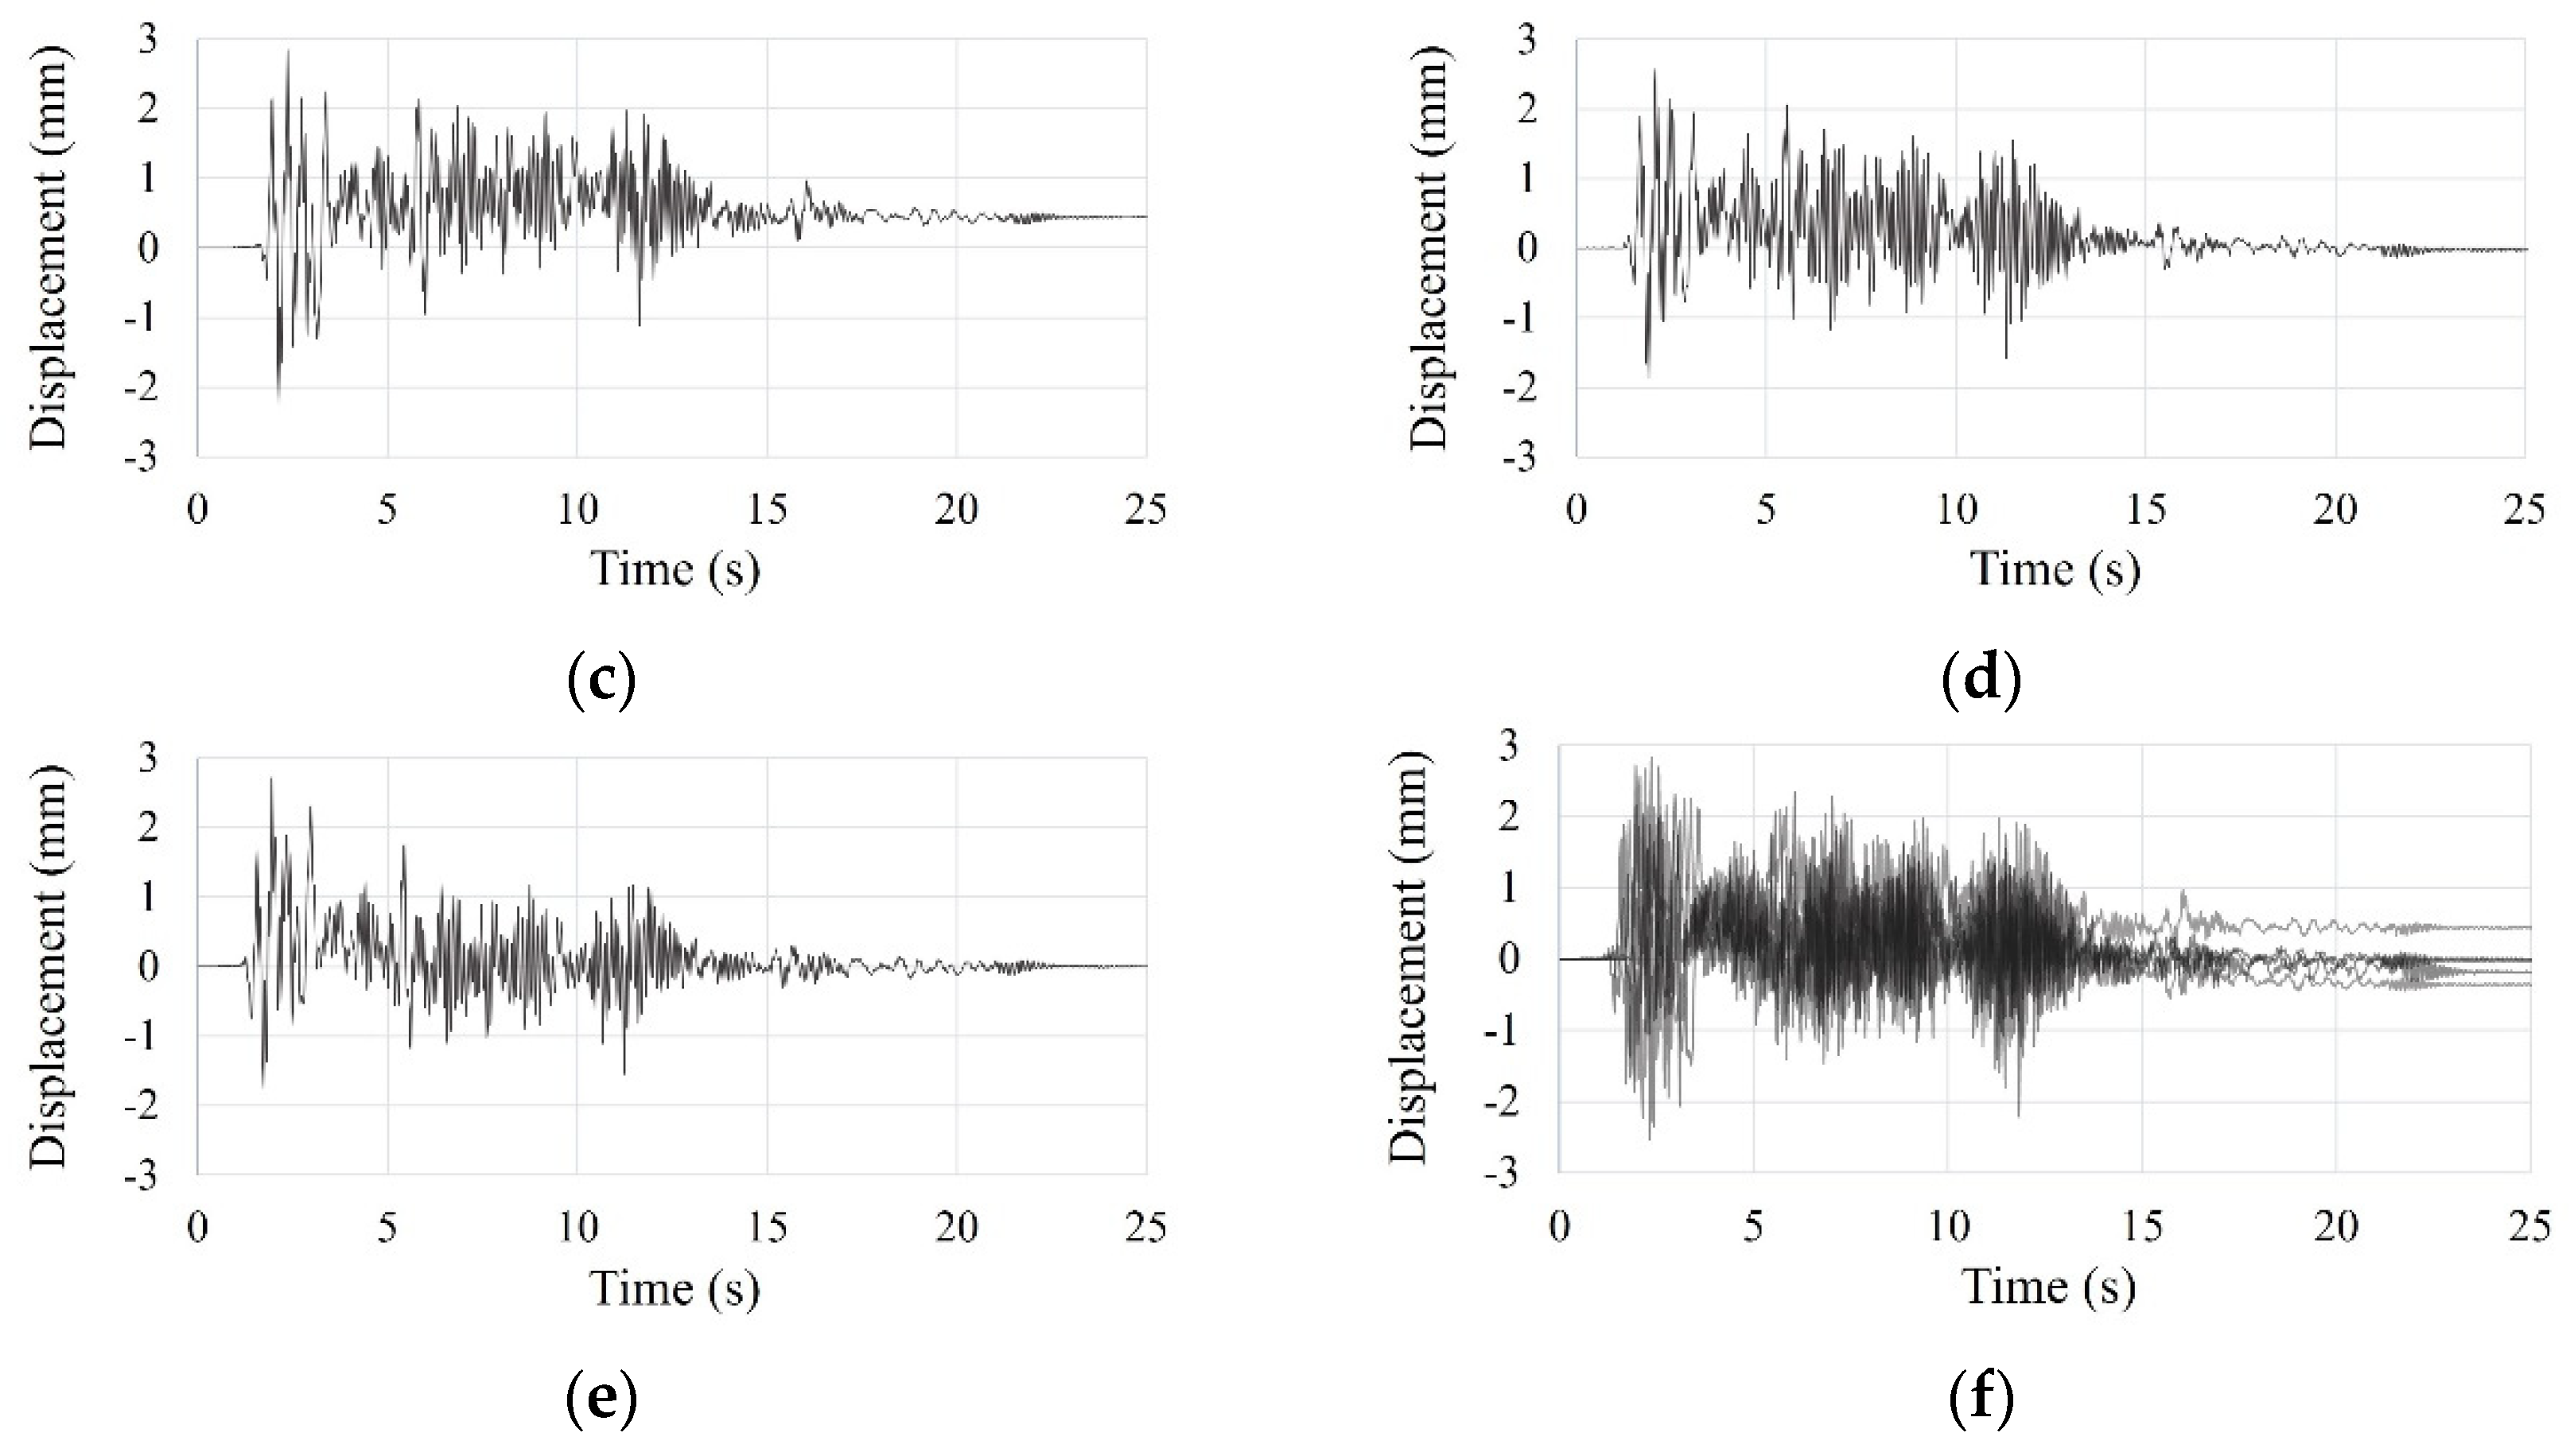
3.5.3. Scaled El Centro Earthquake Vibration
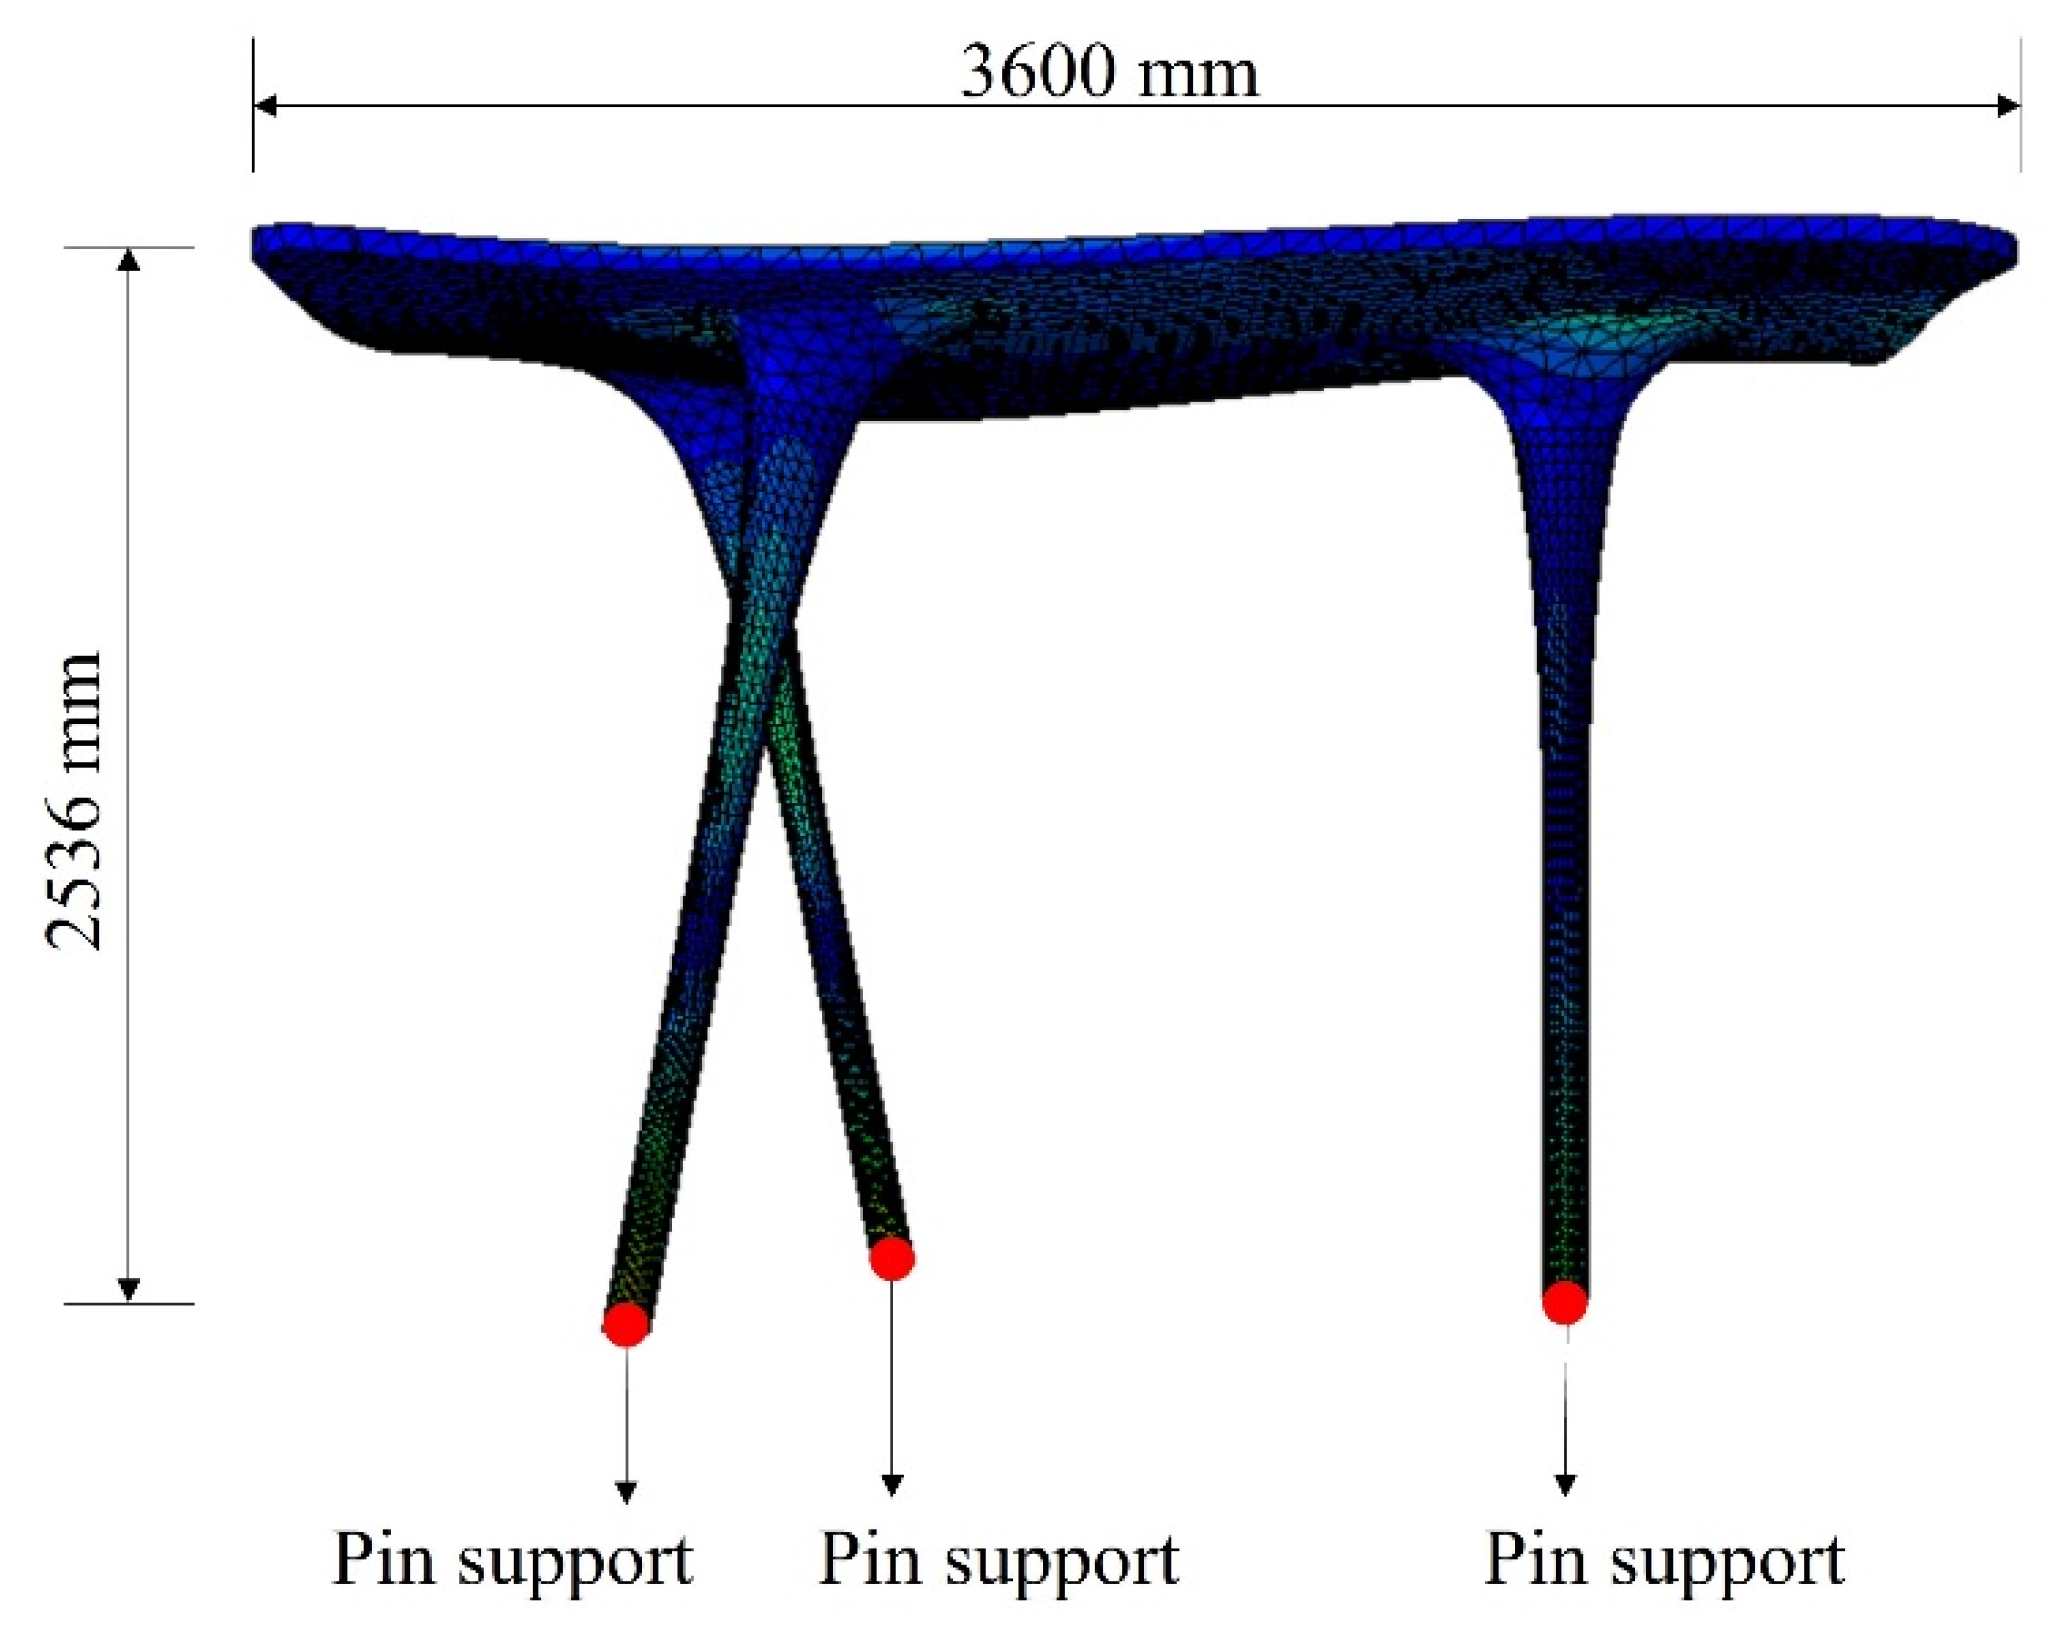
3.6. Finite Element Analysis
3.7. Seismic Performance
4. Conclusions
- (1)
- The introduced small-scale shaking table tests were validated by the comparison between theoretical and experimental frequencies. The theoretical frequency was obtained from the similitude law considering the height ratio (full-scale structures/small-scale structures). The experimental frequencies were obtained from the small-scale shaking table tests with the sinusoidal forced vibration.
- (2)
- The small-scale shaking table test results had a close agreement with the finite element analysis results of full-scale free-form structures under the scaled El Centro earthquake. With this investigation, the small-scale shaking table tests were sufficiently validated to study the seismic behavior of full-scale free-form structures.
- (3)
- As the difference between analysis and test results under sinusoidal forced and scaled El Centro earthquake vibration was small, evaluating seismic performance using small-scale shaking table tests is a reliable way for free-form concrete structures.
- (4)
- The maximum story drift of free-form concrete structures fabricated by F3D printing technology obtained from the tests and analysis was approximately 0.1% of story height, which was quite lower than the allowable story drift in several countries.
Author Contributions
Funding
Institutional Review Board Statement
Informed Consent Statement
Data Availability Statement
Conflicts of Interest
References
- Buswell, R.A.; Soar, R.C.; Gibb, A.G.; Thorpe, A. Freeform construction: Mega-scale rapid manufacturing for construction. Automat. Constr. 2007, 16, 224–231. [Google Scholar] [CrossRef]
- Kazemian, A.; Yuan, X.; Cochran, E.; Khoshnevis, B. Cementitious materials for construction-scale 3D printing: Laboratory testing of fresh printing mixture. Constr. Build. Mater. 2017, 145, 639–647. [Google Scholar] [CrossRef]
- Lee, D.; Lee, S.G.; Kim, S. Composite phase-change material mold for cost-effective production of free-form concrete panels. J. Constr. Eng. M. 2017, 143, 04017012. [Google Scholar] [CrossRef]
- Asprone, D.; Auricchio, F.; Menna, C.; Mercuri, V. 3D printing of reinforced concrete elements: Technology and design approach. Constr. Build. Mater. 2018, 165, 218–231. [Google Scholar] [CrossRef]
- Park, M.J.; Bae, J.; Ju, Y.K. Structural behavior of a composite curtain wall fabricated by the fused deposition modeling 3D printing method. Polymers 2022, 14, 1431. [Google Scholar] [CrossRef] [PubMed]
- Nguyen, A.C.; Vestartas, P.; Weinand, Y. Design framework for the structural analysis of free-form timber plate structures using wood-wood connections. Automat. Constr. 2019, 107, 102948. [Google Scholar] [CrossRef]
- Lu, B.; Weng, Y.; Li, M.; Qian, Y.; Leong, K.F.; Tan, M.J.; Qian, S. A systematical review of 3D printable cementitious materials. Constr. Build. Mater. 2019, 207, 477–490. [Google Scholar] [CrossRef]
- Lim, J.H.; Weng, Y.; Pham, Q.C. 3D printing of curved concrete surfaces using Adaptable Membrane Formwork. Constr. Build. Mater. 2020, 232, 117075. [Google Scholar] [CrossRef]
- Jeong, S.; Sim, J.; Kim, H.; Shin, D.; Hong, D. Application of LOM for freeform architecture. J. Korean. Soc. Precis. Eng. 2017, 34, 903–909. [Google Scholar] [CrossRef]
- Sim, J.; Kim, H.; Park, K.; Kim, C.; Hong, D. Manufacturing automation system of freeform concrete formwork using S-LOM method. J. Korean Soc. Precis. Eng. 2020, 37, 43–50. [Google Scholar] [CrossRef]
- Kim, H.-B.; Park, M.-J.; Ju, Y.K. Structural behavior analysis of polymer lattice reinforced 3D printing cementitious cladding. J. Archi. Inst. Korea Structu. Constr. 2018, 34, 3–10. [Google Scholar]
- Ryu, S.E. A Study on the Stress Behavior and Volume Changes of Seismic Designs according to Axial Changes of Irregular-shaped Structures. Master’s Thesis, Dong-Eui University, Busan, Korea, 2011. [Google Scholar]
- Lee, E.Y. Productivity Analysis and Improvement Plan for Irregular-Shaped Building Construction. Master’s Thesis, Sungkyunkwan University, Seoul, Korea, 2014. [Google Scholar]
- Lim, J.E. A Study on the Design Process and Plan of Irregular-Shaped High-Rise Buildings. Master’s Thesis, Yeungnam University, Gyeongsan, Korea, 2015. [Google Scholar]
- Park, B.; Lee, Y.; Park, M.; Ju, Y.K. Vibration control of a structure by a tuned liquid column damper with embossments. Eng. Struct. 2018, 168, 290–299. [Google Scholar] [CrossRef]
- Bae, J.; Lee, C.-H.; Park, M.; Alemayehu, R.W.; Ryu, J.; Kim, Y.; Ju, Y.K. Cyclic loading performance of radius-cut double coke-shaped strip dampers. Materials 2020, 13, 3920. [Google Scholar] [CrossRef] [PubMed]
- Alemayehu, R.W.; Kim, Y.; Park, M.J.; Park, M.; Ju, Y.K. Experimental and finite element study of polymer infilled tube-in- tube buckling restrained brace. Metals 2021, 11, 1358. [Google Scholar] [CrossRef]
- Bae, J.; Lee, C.-H.; Park, M.; Alemayehu, R.W.; Ryu, J.; Ju, Y.K. Modified low-cycle fatigue estimation using machine learning for radius-cut coke-shaped metallic damper subjected to cyclic loading. Int. J. Steel Struct. 2020, 20, 1849–1858. [Google Scholar] [CrossRef]
- Sommer, A.; Bachmann, H. Seismic behavior of asymmetric RC wall buildings: Principles and new deformation-based design method. Earthq. Eng. Struct. D. 2005, 34, 101–124. [Google Scholar] [CrossRef]
- Rahman, M.M.; Jadhav, S.M.; Shahrooz, B.M. Seismic performance of reinforce concrete buildings designed according to codes in Bangladesh, India and US. Eng. Struct. 2018, 160, 111–120. [Google Scholar] [CrossRef]
- Hu, J.W.; Kang, Y.S.; Choi, D.H.; Park, T. Seismic design, performance, and behavior of composite-moment frames with steel beam-to-concrete filled tube column connections. Int. J. Steel Struct. 2010, 10, 177–191. [Google Scholar] [CrossRef]
- Zou, X.K.; Wang, Q.; Li, G.; Chan, C.M. Integrated reliability-based seismic drift design optimization of base-isolated concrete buildings. J. Struct. Eng. 2010, 136, 1282–1295. [Google Scholar] [CrossRef]
- Carrillo, J.; Alcocer, S.M. Acceptance limits for performance-based seismic design of RC walls for low-rise housing. Earthq. Eng. Struct. D. 2012, 41, 2273–2288. [Google Scholar] [CrossRef]
- Özhendekci, D.; Özhendekci, N. Seismic performance of steel special moment resisting frames with different span arrangements. J. Constr. Steel Res. 2012, 72, 51–60. [Google Scholar] [CrossRef]
- Abou-Elfath, H.; Ramadan, M.; Meshaly, M.; Fdiel, H.A. Seismic performance of steel frames designed using different allowable story drift limits. Alex. Eng. J. 2017, 56, 241–249. [Google Scholar] [CrossRef]
- Gupta, A.K. Response Spectrum Method in Seismic Analysis and Design of Structures; Routledge: New York, NY, USA, 1990. [Google Scholar]
- The Journal of the American Institute of Architects. Available online: https://www.architectmagazine.com/project-gallery/meiso-no-mori-municipal-funeral-hall (accessed on 23 March 2022).
- Gosselin, C.; Duballet, R.; Roux, P.; Gaudillière, N.; Dirrenberger, J.; Morel, P. Large-scale 3D printing of ultra-high performance concrete–a new processing route for architects and builders. Mater. Design. 2016, 100, 102–109. [Google Scholar] [CrossRef]
- Lee, J.H. Deformation Compensation Method of Expanded Polystyrene Form-Liner Manufactured by 3D Printer. Master’s Thesis, Korea University, Seoul, Korea, 2021. [Google Scholar]
- Lee, D.Y.; Lee, D.M.; Cho, H.H.; Kang, K.I. The production process and mock-up test of freeform concrete segments using LOM type 3D printer. J. Korea Inst. Build. Constr. 2018, 18, 89–98. [Google Scholar]
- Lee, D.K.; Cho, J.Y. Similitude law on material non-linearity for seismic performance evaluation of RC columns. J. Korea Concr. Inst. 2010, 22, 409–417. [Google Scholar] [CrossRef][Green Version]
- Kim, D.K. Dynamics of Structures, 4th ed.; Goomibook: Seoul, Korea, 2017. [Google Scholar]
- Lee, J.H.; Park, M.J.; Yoon, S.W. Floor vibration experiment and serviceability test of iFLASH system. Materials 2020, 13, 5760. [Google Scholar] [CrossRef]
- Park, M.J.; Yoon, S.W.; Ju, Y.K. New approaches for floor vibrations of steel-polymer-steel sandwich floor system. Eng. Struct. 2022, 258, 114141. [Google Scholar] [CrossRef]
- Chopra, A.K. Dynamics of Structures, 5th ed.; Pearson: London, UK, 2017. [Google Scholar]
- Park, M.J.; Min, J.K.; Bae, J.; Ju, Y.K. Thermal contact conductance-based thermal behavior analytical model for a hybrid floor at elevated temperatures. Materials 2020, 13, 4257. [Google Scholar] [CrossRef]
- Park, M.J.; Bae, J.; Ryu, J.; Ju, Y.K. Fire design equation for steel-polymer composite floors in thermal fields via finite element analysis. Materials 2020, 13, 5573. [Google Scholar] [CrossRef]
- Park, M.J.; Ju, Y.K. Finite element model for the steel-polymer composite floor filled with phase-change amorphous polymers at elevated temperatures. Constr. Build. Mater. 2022, 319, 126059. [Google Scholar] [CrossRef]
- Park, M.J.; Alemayehu, R.W.; Ju, Y.K. Fire resistance performance of steel-polymer prefabricated composite floors using standard fire tests. Polymers 2022, 14, 1488. [Google Scholar] [CrossRef] [PubMed]
- Korea Institute of Construction Technology. Design Specific Technology for Ultra High Performance Concrete; Ministry of Land, Infrastructure and Transport: Sejong, Korea, 2009. [Google Scholar]
- Öztekin, E.; Pul, S.; Hüsem, M. Experimental determination of Drucker-Prager yield criterion parameters for normal and high strength concretes under triaxial compression. Constr. Build. Mater. 2016, 112, 725–732. [Google Scholar] [CrossRef]
- Khajeh Hesameddin, P.; Irfanoglu, A.; Hacker, T.J. Effective viscous damping ratio in seismic response of reinforced concrete structures. In Proceedings of the 6th International Conference on Advances in Experimental Structural Engineering, Champaign, IL, USA, 1–2 August 2015. [Google Scholar]
- MOLIT. Korean Design Standard (in Korean); Ministry of Land, Infrastructure and Transport: Sejong City, Korea, 2019. [Google Scholar]
- Federal Emergency Management Agency (FEMA). FEMA 356: Prestandard and Commentary for the Seismic Rehabilitation of Buildings; American Society of Civil Engineers (ASCE): Reston, VA, USA, 2000. [Google Scholar]
- BS EN 1998-1:2004; Eurocode 8: Design of Structures for Earthquake Resistance—Part 1: General Rules, Seismic Actions and Rules for Buildings; British Standard: London, UK, 2004.


| Height (H) (m) | Natural Period (T) (s) | Natural Frequency (f) (Hz) |
|---|---|---|
| 2.54 | 0.237 | 4.22 |
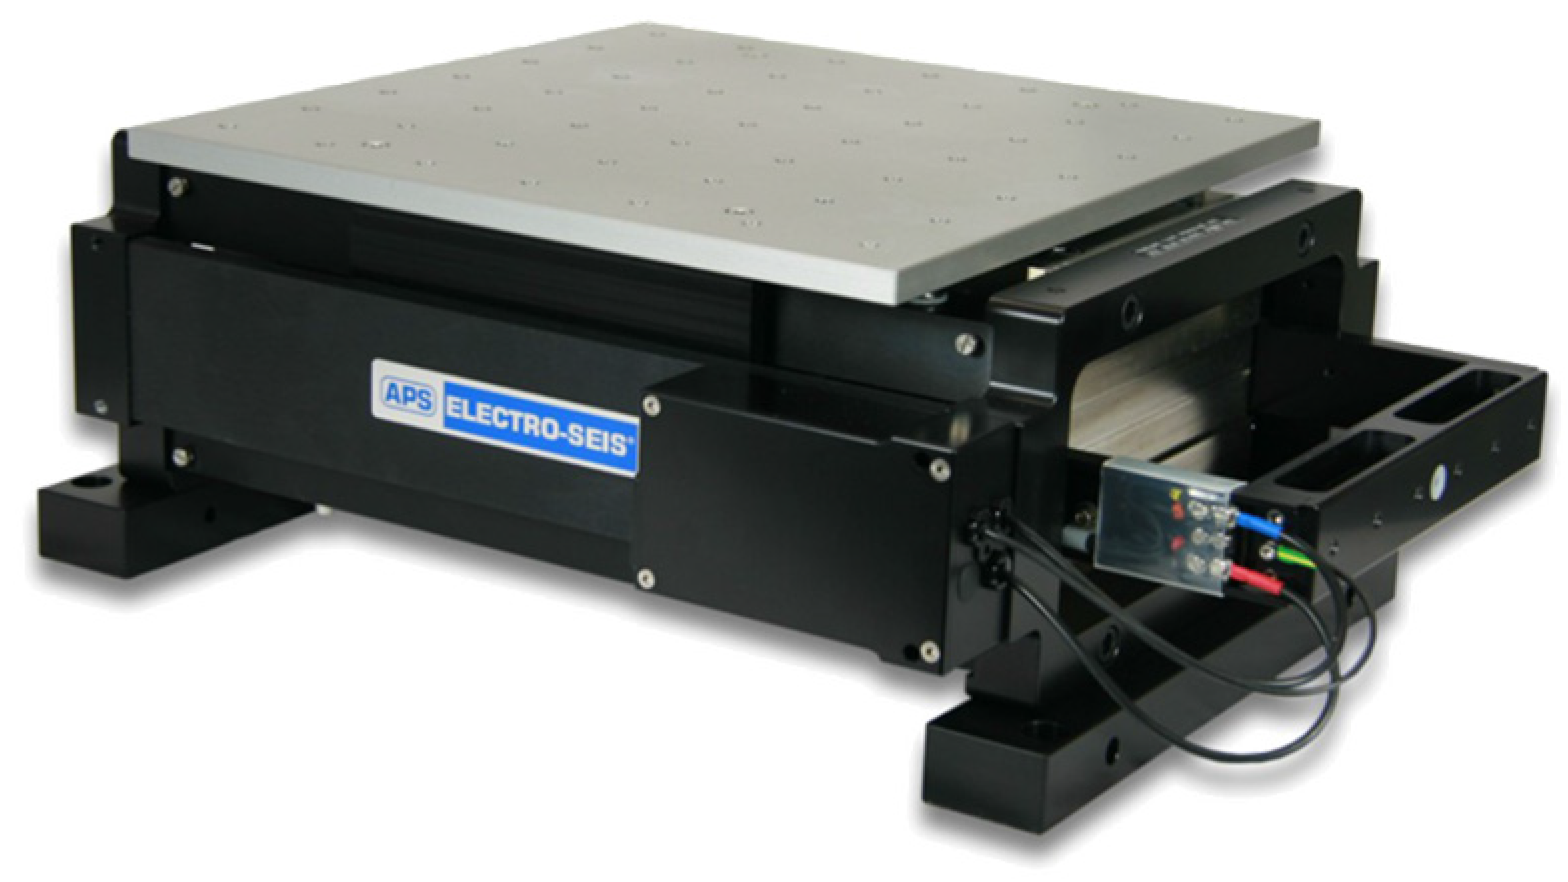
| Parameter | Specifications |
|---|---|
| Name | APS400 |
| Force (sine peak) | 445 N |
| Velocity (sine peak) | 1000 mm/s |
| Stroke (sine peak) | 158 mm |
| Frequency range | 200 Hz |
| Operation | Horizontal |
| Total shaker weight | 86 kg |
| Overall dimension (length × width × height) | 526 × 314 × 178 mm |
| Maximum test load weight | 23 kg |
| Parameters | Height | Time | Mass | Force | Acceleration | Stress | Strain |
|---|---|---|---|---|---|---|---|
| Height ratio (h) | 1/h | 1/(h1/2) | 1/(h2) | 1/(h2) | 1 | 1 | 1 |
| Specimen | H (m) | h | T (s) | f (Hz) | Stiffness (Ks) (N/m) | Mass (Ms) (kg) |
|---|---|---|---|---|---|---|
| SDOF model | 0.18 | 14.09 | 0.06314 | 15.84 | 1404 | 0.1418 |
| Small-scale model | 0.40 | 6.340 | 0.09413 | 10.62 | 1536 | 0.3446 |
| Test | SDOF Model | Small-Scale Model |
|---|---|---|
| 1 | 1.01% | 3.21% |
| 2 | 0.87% | 3.14% |
| 3 | 0.92% | 3.11% |
| 4 | 0.95% | 3.43% |
| 5 | 0.75% | 3.61% |
| Average | 0.90% | 3.30% |
| Specimen | Natural Frequency (Hz) | Error (%) | |
|---|---|---|---|
| Theoretical Value | Experimental Value | ||
| SDOF model | 15.84 | 16.51 | 4.23 |
| Small-scale model | 10.62 | 10.24 | 3.58 |
| Test | SDOF Model | Small-Scale Model |
|---|---|---|
| 1 | 2.61 mm | 2.51 mm |
| 2 | 2.60 mm | 2.38 mm |
| 3 | 2.67 mm | 2.49 mm |
| 4 | 2.61 mm | 2.55 mm |
| 5 | 2.74 mm | 2.52 mm |
| Average | 2.65 mm | 2.49 mm |
| Property | Value |
|---|---|
| Density | 2190 kg/m3 |
| Compressive strength | 180 MPa |
| Tensile strength | 14.6 MPa |
| Modulus of elasticity | 45.0 GPa |
| Flexural strength | 35.6 MPa |
| Poisson’s ratio | 0.2 |
Publisher’s Note: MDPI stays neutral with regard to jurisdictional claims in published maps and institutional affiliations. |
© 2022 by the authors. Licensee MDPI, Basel, Switzerland. This article is an open access article distributed under the terms and conditions of the Creative Commons Attribution (CC BY) license (https://creativecommons.org/licenses/by/4.0/).
Share and Cite
Park, M.J.; Cheon, G.; Alemayehu, R.W.; Ju, Y.K. Seismic Performance of F3D Free-Form Structures Using Small-Scale Shaking Table Tests. Materials 2022, 15, 2868. https://doi.org/10.3390/ma15082868
Park MJ, Cheon G, Alemayehu RW, Ju YK. Seismic Performance of F3D Free-Form Structures Using Small-Scale Shaking Table Tests. Materials. 2022; 15(8):2868. https://doi.org/10.3390/ma15082868
Chicago/Turabian StylePark, Min Jae, Gain Cheon, Robel Wondimu Alemayehu, and Young K. Ju. 2022. "Seismic Performance of F3D Free-Form Structures Using Small-Scale Shaking Table Tests" Materials 15, no. 8: 2868. https://doi.org/10.3390/ma15082868
APA StylePark, M. J., Cheon, G., Alemayehu, R. W., & Ju, Y. K. (2022). Seismic Performance of F3D Free-Form Structures Using Small-Scale Shaking Table Tests. Materials, 15(8), 2868. https://doi.org/10.3390/ma15082868