
Energy Transport along α-Helix Protein Chains: External Drives and Multifractal Analysis


Abstract
1. Introduction
2. Model and Methods
3. Results
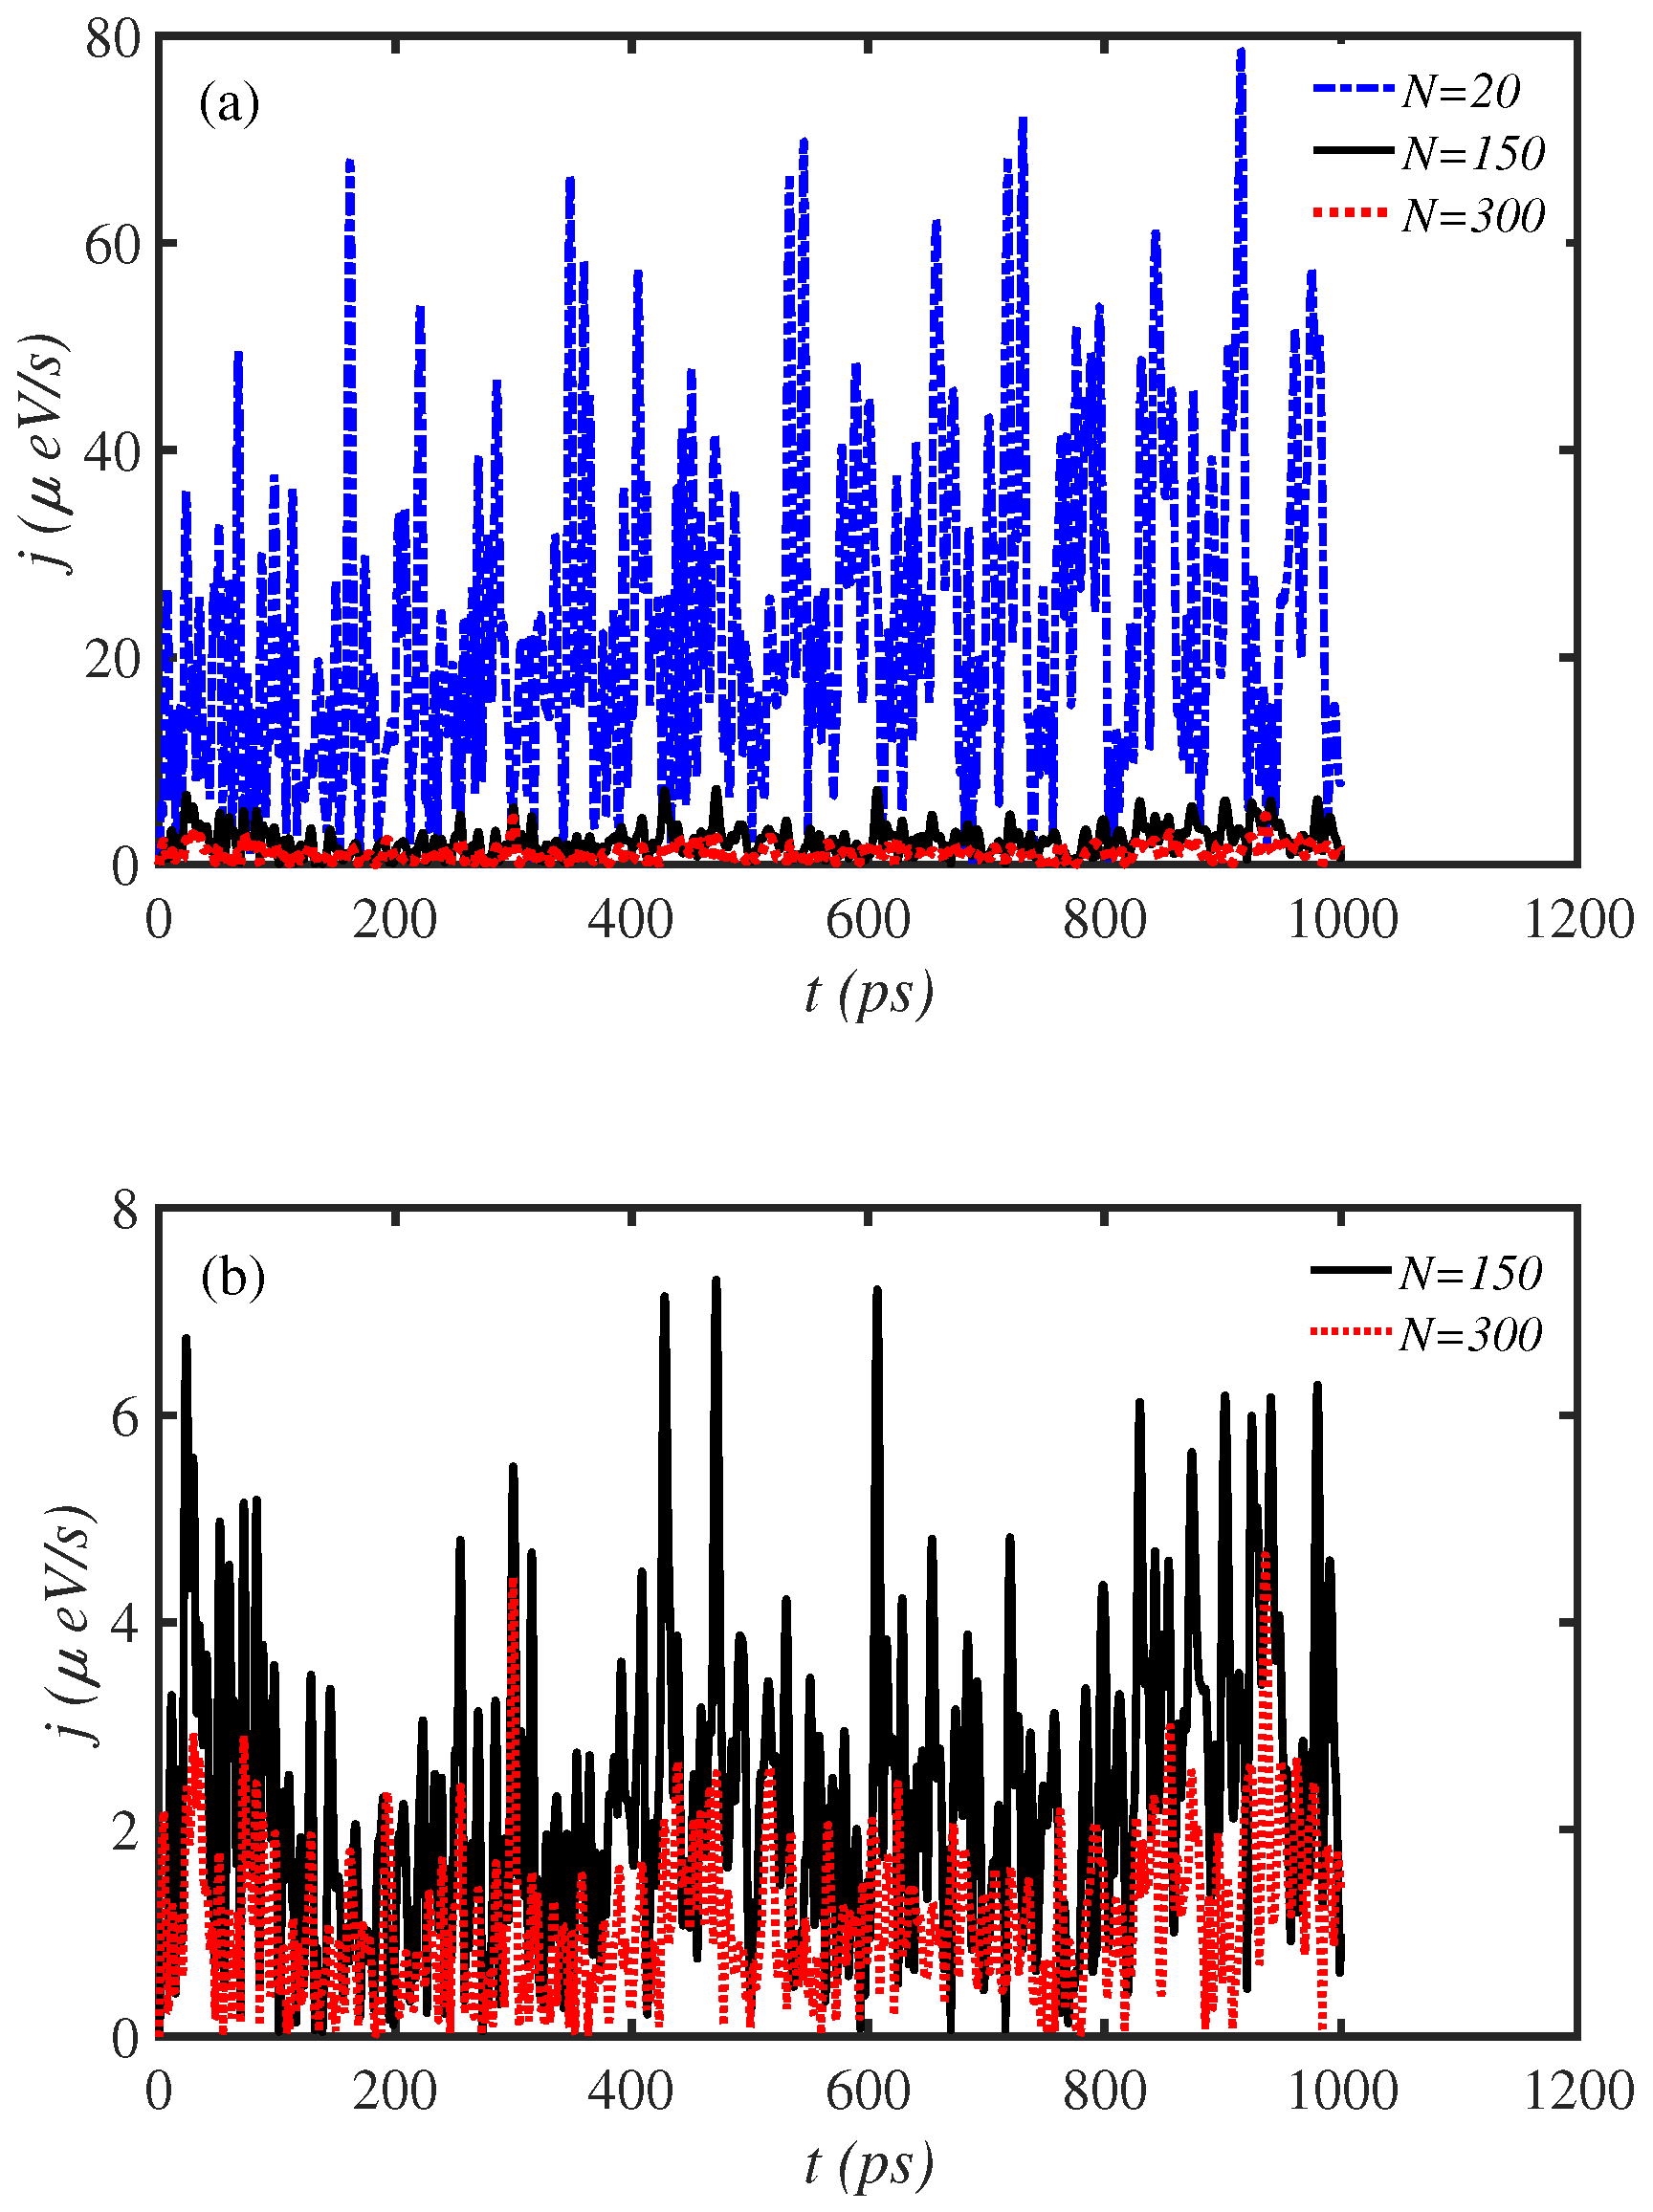
3.1. Length
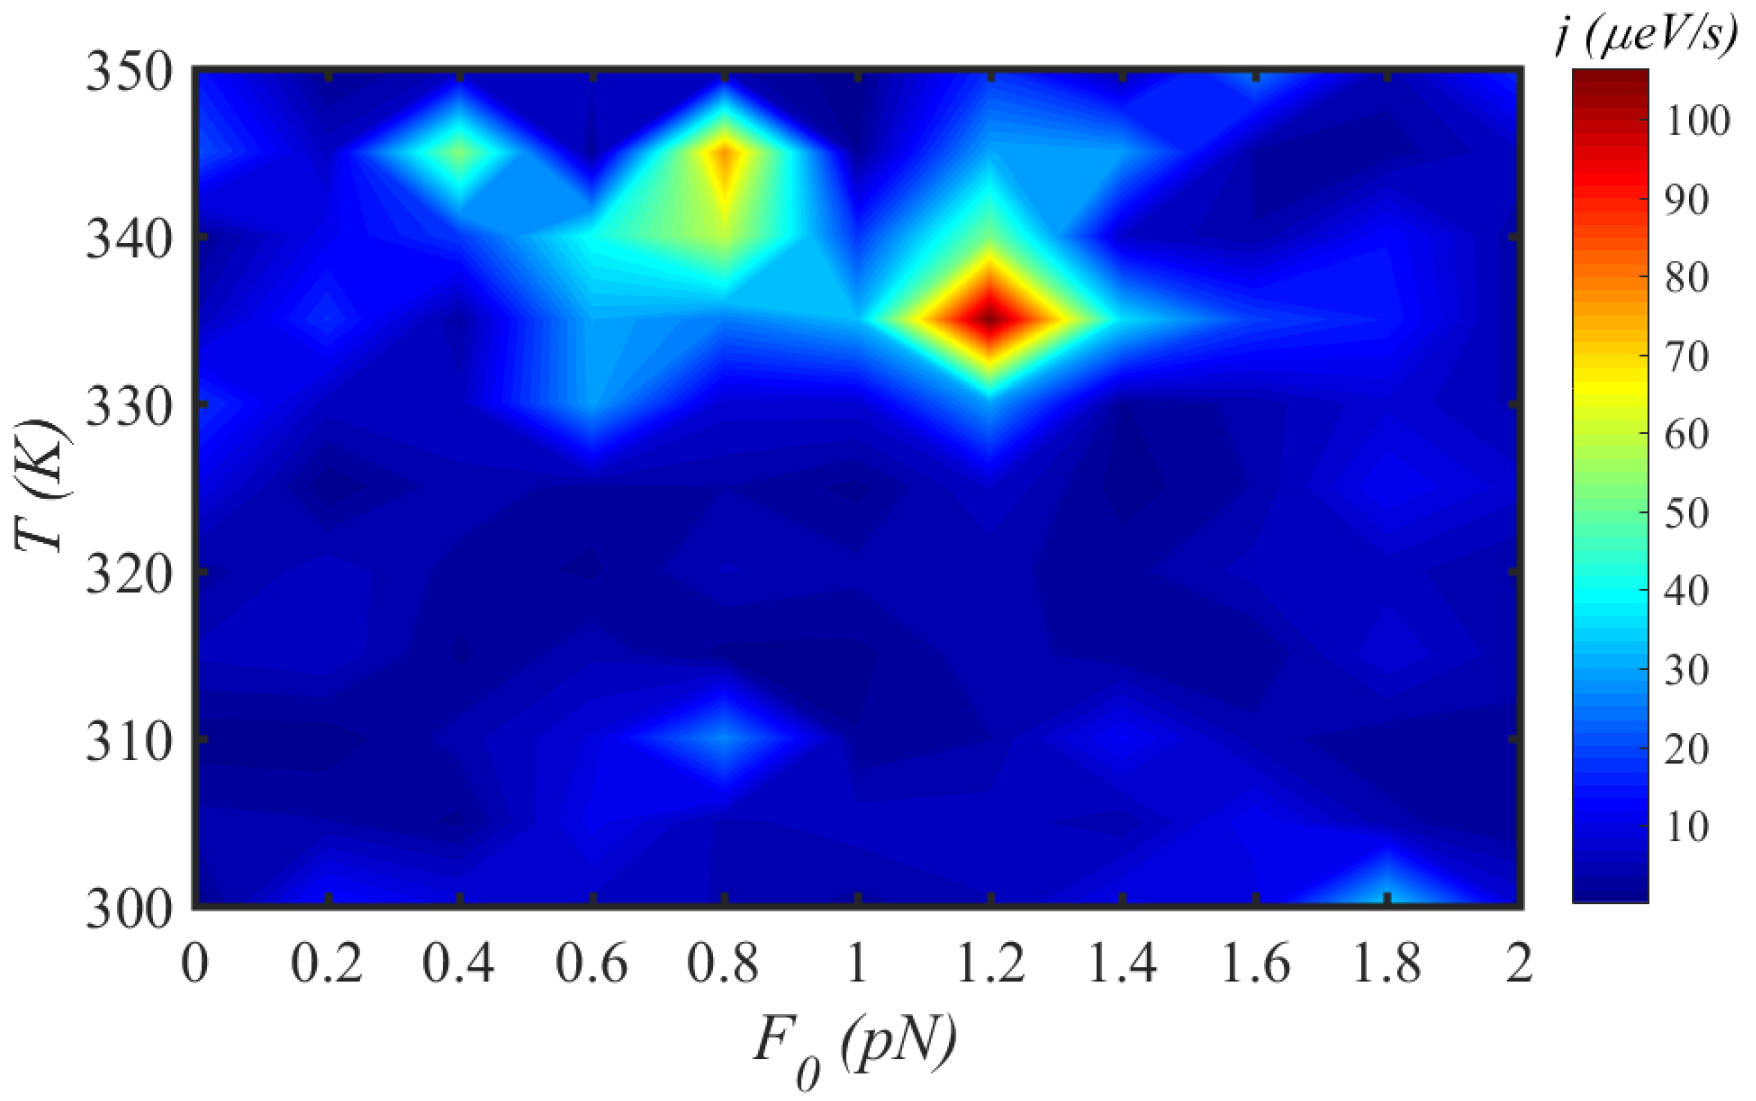
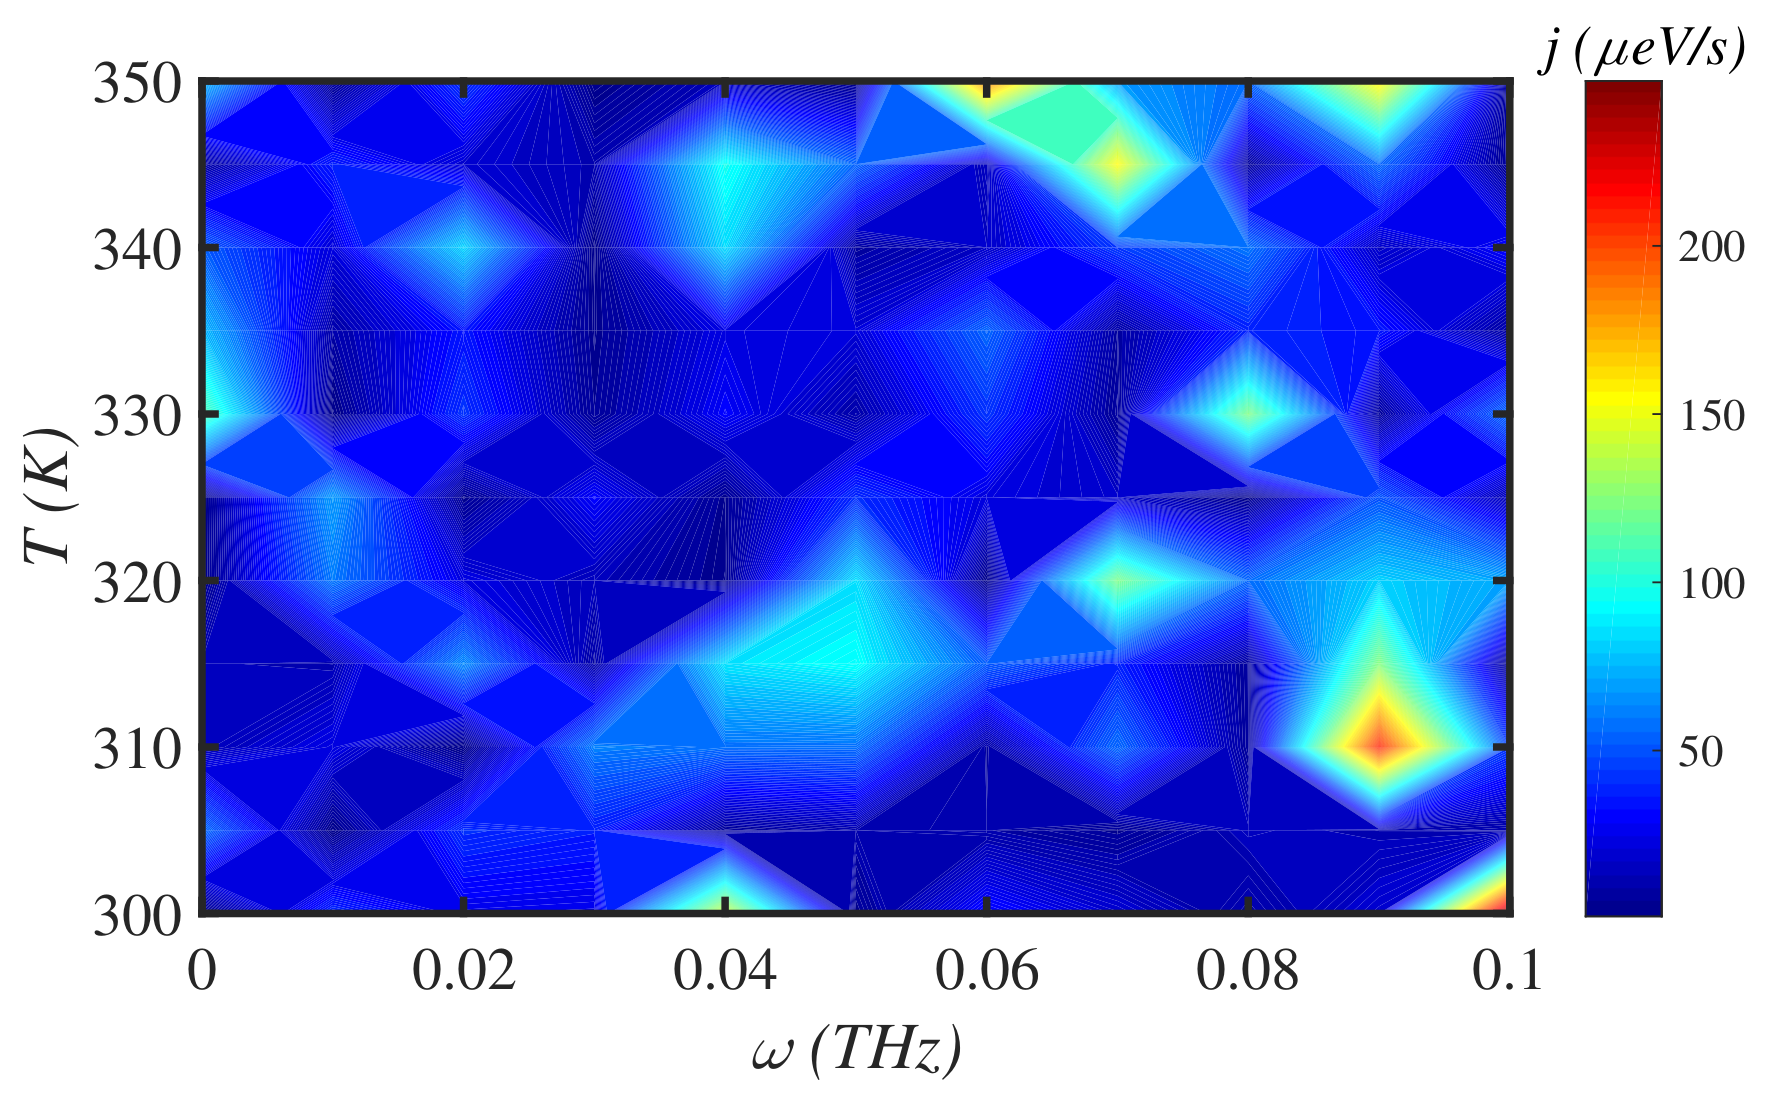
3.2. Temperature
3.3. Solvent
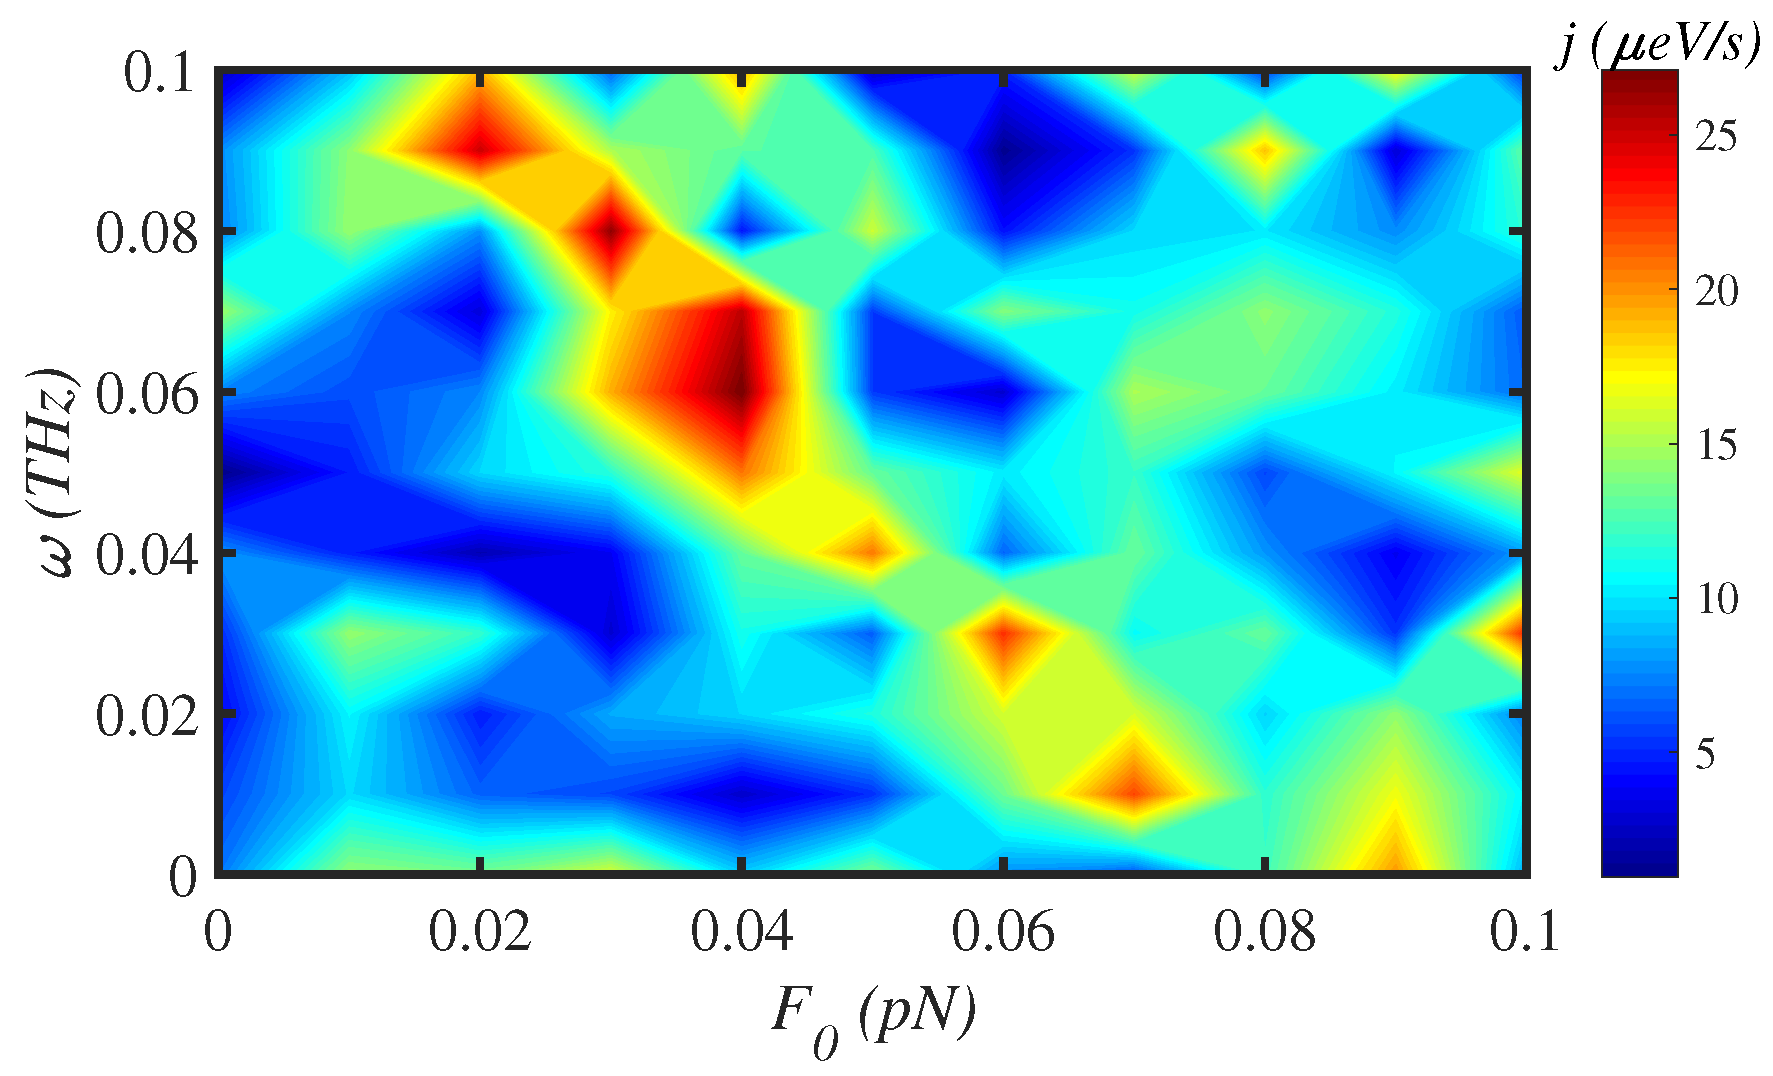
3.4. External Force
3.5. Multifractal Analysis
4. Discussion
5. Conclusions
Author Contributions
Funding
Institutional Review Board Statement
Informed Consent Statement
Data Availability Statement
Conflicts of Interest
Abbreviations
| ATP | adenosine triphosphate |
| ADP | adenosine diphosphate |
References
- Jülicher, F.; Ajdari, A.; Prost, J. Modeling molecular motors. Rev. Mod. Phys. 1997, 69, 1269–1282. [Google Scholar] [CrossRef]
- Vologodskii, A. Energy transformation in biological molecular motors. Phys. Life. Rev. 2006, 3, 119–132. [Google Scholar] [CrossRef]
- Davydov, A.S. Solitons in Molecular Systems; Kluwer Academic: Dordrecht, The Netherlands, 1991. [Google Scholar]
- Pang, X.F. The theory of bio-energy transport in the protein molecules and their properties. Phys. Life. Rev. 2011, 8, 264–286. [Google Scholar] [CrossRef] [PubMed]
- Pang, X.F. An improvement of the Davydov theory of bio-energy transport in the protein molecular systems. Phys. Rev. E 2000, 62, 6989–6998. [Google Scholar]
- Botan, V.; Backus, E.H.; Pfister, R.; Moretto, A.; Crisma, M.; Toniolo, C.; Nguyen, P.H.; Stock, G.; Hamm, P. Energy transport in peptide helices. Proc. Natl. Acad. Sci. USA 2007, 104, 12749–12754. [Google Scholar] [CrossRef]
- Davydov, A.S. Solitons in physical systems. Phys. Scripta 1979, 20, 387–394. [Google Scholar] [CrossRef]
- Davydov, A.S. The theory of contraction of proteins under their excitation. J. Theor. Biol. 1973, 38, 559–569. [Google Scholar] [CrossRef]
- Davydov, A.S. Solitons and energy-transfer along protein molecules. J. Theor. Biol. 1977, 66, 377–387. [Google Scholar] [CrossRef]
- Takeno, S. Quantum theory of vibron solitons-coherent states of a vibron-phonon system and self-localized modes. J. Phys. Soc. Jpn. 1990, 59, 3127–3141. [Google Scholar] [CrossRef]
- Yomosa, S. Toda-lattice solitons in α-helical proteins. J. Phys. Soc. Jpn. 1984, 53, 3692–3698. [Google Scholar] [CrossRef]
- Yomosa, S. Solitary excitations in muscle proteins. Phys. Rev. A 1985, 32, 1752. [Google Scholar] [CrossRef] [PubMed]
- Pang, X.F.; Zhang, H.W.; Luo, Y.H. The influence of the heat bath and structural disorder in protein molecules on soliton transported bio-energy in an improved model. J. Phys. Condens. Matter. 2005, 18, 613. [Google Scholar] [CrossRef]
- Pang, X.F.; Zhang, H.W.; Yu, J.F.; Feng, Y.P. States and properties of the soliton transported bio-energy in nonuniform protein molecules at physiological temperature. Phys. Lett. A 2005, 335, 408–416. [Google Scholar] [CrossRef]
- Hennig, D. Energy transport in α-helical protein models: One-strand versus three-strand systems. Phys. Rev. B 2002, 65, 174302. [Google Scholar] [CrossRef]
- Scott, A. Davydov’s soliton. Phys. Rep. 1982, 217, 1–67. [Google Scholar] [CrossRef]
- Austin, R.H. The Physics of Proteins; Frauenfelder, H., Ed.; Springer: New York, NY, USA, 2010. [Google Scholar]
- Pang, X.F.; Feng, Y.P. Quantum Mechanics in Nonlinear Systems; World Science: Hackensack, NJ, USA, 2005. [Google Scholar]
- Pang, X.F. Theory of bio-energy transport in protein molecules and its experimental evidences as well as applications(I). Front. Phys. China 2007, 2, 469–493. [Google Scholar] [CrossRef]
- Yakushevich, L.V.; Savin, A.V.; Manevitch, L.I. Nonlinear dynamics of topological solitons in DNA. Phys. Rev. E 2002, 66, 016614. [Google Scholar] [CrossRef]
- Dauxois, T.; Peyrard, M.; Bishop, A.R. Entropy-driven DNA denaturation. Phys. Rev. E 1993, 47, R44. [Google Scholar] [CrossRef]
- Behnia, S.; Fathizadeh, S. Modeling the electrical conduction in DNA nanowires: Charge transfer and lattice fluctuation theories. Phys. Rev. E 2015, 91, 022719. [Google Scholar] [CrossRef]
- Singh, A.; Singh, N. Pulling DNA: The effect of chain length on the mechanical stability of DNA chain. Macromol. Symp. 2015, 357, 64–69. [Google Scholar] [CrossRef]
- Singh, A.; Singh, N. Phase diagram of mechanically stretched DNA: The salt effect. Physica A 2013, 392, 2052–2059. [Google Scholar] [CrossRef]
- Horme<i>n</i>˜o, S.; Moreno-Herrero, F.; Ibarra, B.; Carrascosa, J.; Valpuesta, J.; Arias-Gonzalez, J. Condensation prevails over B-A transition in the structure of DNA at low humidity. Biophys. J. 2011, 100, 2006–2015. [Google Scholar]
- Schröder, C. Proteins in ionic liquids: Current status of experiments and simulations. Ionic liquids II 2017, 375, 127–152. [Google Scholar]
- Okur, H.I.; Hladílková, J.; Rembert, K.B.; Cho, Y.; Heyda, J.; Dzubiella, J.; Cremer, P.S.; Jungwirth, P. Beyond the Hofmeister series: Ion-specific effects on proteins and their biological functions. J. Phys. Chem. B 2017, 121, 1997–2014. [Google Scholar] [CrossRef]
- de Oliveira, V.M.; de Godoi Contessoto, V.; da Silva, F.B.; Caetano, D.L.; de Carvalho, S.J.; Leite, V.B. Effects of pH and salt concentration on stability of a protein G variant using coarse-grained models. Biophys. J. 2018, 114, 65–75. [Google Scholar] [CrossRef]
- Matsarskaia, O.; Roosen-Runge, F.; Schreiber, F. Multivalent ions and biomolecules: Attempting a comprehensive perspective. Chem. Phys. Chem. 2020, 21, 1742–1767. [Google Scholar] [CrossRef]
- Zoli, M. Twisting and bending stress in DNA minicircles. Soft Matter 2014, 10, 4304–4311. [Google Scholar] [CrossRef]
- Ai, B.Q.; He, D.; Hu, B. Heat conduction in driven Frenkel-Kontorova lattices: Thermal pumping and resonance. Phys. Rev. E 2010, 81, 031124. [Google Scholar] [CrossRef]
- Fathizadeh, S.; Behnia, S. Control of a DNA based piezoelectric biosensor. J. Phys. Soc. Jpn. 2020, 89, 024004. [Google Scholar] [CrossRef]
- Takayasu, H. Fractals in the Physical Sciences; Manchester University Press: Manchester, UK, 1990. [Google Scholar]
- Anselmo, D.H.; Vasconcelos, M.S.; Silva, R.; Mello, V.D. Non-additive model for specific heat of electrons. Phys. Lett. A 2016, 380, 3454–3459. [Google Scholar] [CrossRef]
- Behnia, S.; Fathizadeh, S.; Akhshani, A. DNA spintronics: Charge and spin dynamics in DNA wires. J. Phys. Chem. C 2016, 120, 2973–2983. [Google Scholar] [CrossRef]
- Pawelzik, K.; Schuster, H.G. Generalized dimensions and entropies from a measured time series. Phys. Rev. A 1987, 35, 481. [Google Scholar] [CrossRef] [PubMed]
- Canessa, E. Multifractality in Time Series. J. Phys. A 2000, 33, 3637. [Google Scholar] [CrossRef][Green Version]
- Stanley, H.E.; Meakin, P. Multifractal phenomena in physics and chemistry. Nature 1988, 335, 405–409. [Google Scholar] [CrossRef]
- Xiao, X.; Chen, H.; Bogdan, P. Deciphering the generating rules and functionalities of complex networks. Sci. Rep. 2021, 11, 22964. [Google Scholar] [CrossRef]
- Hilborn, R.C. Chaos and Nonlinear Dynamics: An Introduction for Scientists and Engineers; Oxford University Press on Demand: Oxford, UK, 2000. [Google Scholar]
- Backus, E.H.; Nguyen, P.H.; Botan, V.; Pfister, R.; Moretto, A.; Crisma, M.; Toniolo, C.; Stock, G.; Hamm, P. Energy transport in peptide helices: A comparison between high-and low-energy excitations. J. Phys. Chem B 2008, 112, 9091–9099. [Google Scholar] [CrossRef]
- Andrieux, D.; Gaspard, P. Fluctuation theorems and nonequilibrium thermodynamics of molecular motors. Phys. Rev. E 2006, 74, 011906. [Google Scholar] [CrossRef]
- Hwang, W.; Hyeon, C. Quantifying the heat dissipation from a molecular motor’s transport properties in nonequilibrium steady states. J. Phys. Chem. Lett. 2017, 8, 250–256. [Google Scholar] [CrossRef]
- Wang, F.; Shi, H.; He, R.; Wang, R.; Zhang, R.; Yuan, J. Non-equilibrium effect in the allosteric regulation of the bacterial flagellar switch. Nat. Phys. 2017, 13, 710–714. [Google Scholar] [CrossRef]
- Buchenberg, S.; Sittel, F.; Stock, G. Time-resolved observation of protein allosteric communication. Proc. Nat. Acad. Sci. USA 2017, 114, E6804–E6811. [Google Scholar] [CrossRef]
- Riedel, C.; Gabizon, R.; Wilson, C.A.; Hamadani, K.; Tsekouras, K.; Marqusee, S.; Pressé, S.; Bustamante, C. The heat released during catalytic turnover enhances the diffusion of an enzyme. Nature 2015, 517, 227–230. [Google Scholar] [CrossRef] [PubMed]
- Leitner, D.M.; Pandey, H.D.; Reid, K.M. Energy transport across interfaces in biomolecular systems. J. Phys. Chem. B 2019, 123, 9507–9524. [Google Scholar] [CrossRef] [PubMed]
- Beck, C.; Grimaldo, M.; Braun, M.K.; Bühl, L.; Matsarskaia, O.; Jalarvo, N.H.; Zhang, F.; Roosen-Runge, F.; Schreiber, F.; Seydel, T. Temperature and salt controlled tuning of protein clusters. Soft Matter 2021, 17, 8506–8516. [Google Scholar] [CrossRef] [PubMed]
- Eyal, E.; Bahar, I. Toward a molecular understanding of the anisotropic response of proteins to external forces: Insights from elastic network models. Biophys. J. 2008, 94, 3424–3435. [Google Scholar] [CrossRef] [PubMed]
- Jiawen, C.; Zhong-Ru, X.; Yinghao, W. Study of protein structural deformations under external mechanical perturbations by a coarse-grained simulation method. Biomech. Model. Mechanobiol. 2016, 15, 317–329. [Google Scholar]
- Behnia, S.; Fathizadeh, S.; Javanshour, E.; Nemati, F. Light-driven modulation of electrical current through DNA sequences: Engineering of a molecular optical switch. J. Phys. Chem. B 2020, 124, 3261–3270. [Google Scholar] [CrossRef]


Publisher’s Note: MDPI stays neutral with regard to jurisdictional claims in published maps and institutional affiliations. |
© 2022 by the authors. Licensee MDPI, Basel, Switzerland. This article is an open access article distributed under the terms and conditions of the Creative Commons Attribution (CC BY) license (https://creativecommons.org/licenses/by/4.0/).
Share and Cite
Sefidkar, N.; Fathizadeh, S.; Nemati, F.; Simserides, C. Energy Transport along α-Helix Protein Chains: External Drives and Multifractal Analysis. Materials 2022, 15, 2779. https://doi.org/10.3390/ma15082779
Sefidkar N, Fathizadeh S, Nemati F, Simserides C. Energy Transport along α-Helix Protein Chains: External Drives and Multifractal Analysis. Materials. 2022; 15(8):2779. https://doi.org/10.3390/ma15082779
Chicago/Turabian StyleSefidkar, Narmin, Samira Fathizadeh, Fatemeh Nemati, and Constantinos Simserides. 2022. "Energy Transport along α-Helix Protein Chains: External Drives and Multifractal Analysis" Materials 15, no. 8: 2779. https://doi.org/10.3390/ma15082779
APA StyleSefidkar, N., Fathizadeh, S., Nemati, F., & Simserides, C. (2022). Energy Transport along α-Helix Protein Chains: External Drives and Multifractal Analysis. Materials, 15(8), 2779. https://doi.org/10.3390/ma15082779