
Physicochemical Properties of Biochar Produced from Goldenrod Plants

 , , and
Abstract
:1. Introduction
2. Materials and Methods
2.1. Characteristics of the Biomass Material
2.2. The Torrefaction Process
2.3. Measurement of Moisture Content
2.4. Measurement of Bulk Density
2.5. Measurement of Ash Content
2.6. Measurement of Volatile Matter Content
2.7. Combustion Heat and Calorific Value Measurement
2.8. Statistical Analysis
3. Results
3.1. Biomass and Biochar Bulk Density
3.2. Moisture Content in Biomass and Biochar
3.3. Statistical Analysis Results
- group a: Giant goldenrod—plant vegetative, Canadian goldenrod—plant vegetative, Giant goldenrod—plant generative, and Canadian goldenrod—plant generative;
- group b: Canadian goldenrod—whole plant;
- group c: Giant goldenrod—whole plant.
- group a: Giant goldenrod—plant vegetative, Canadian goldenrod—plant vegetative, Giant goldenrod—plant generative and Canadian goldenrod—plant generative;
- group b: Canadian goldenrod—plant vegetative and Canadian goldenrod—whole plant;
- group c: Giant goldenrod—whole plant.
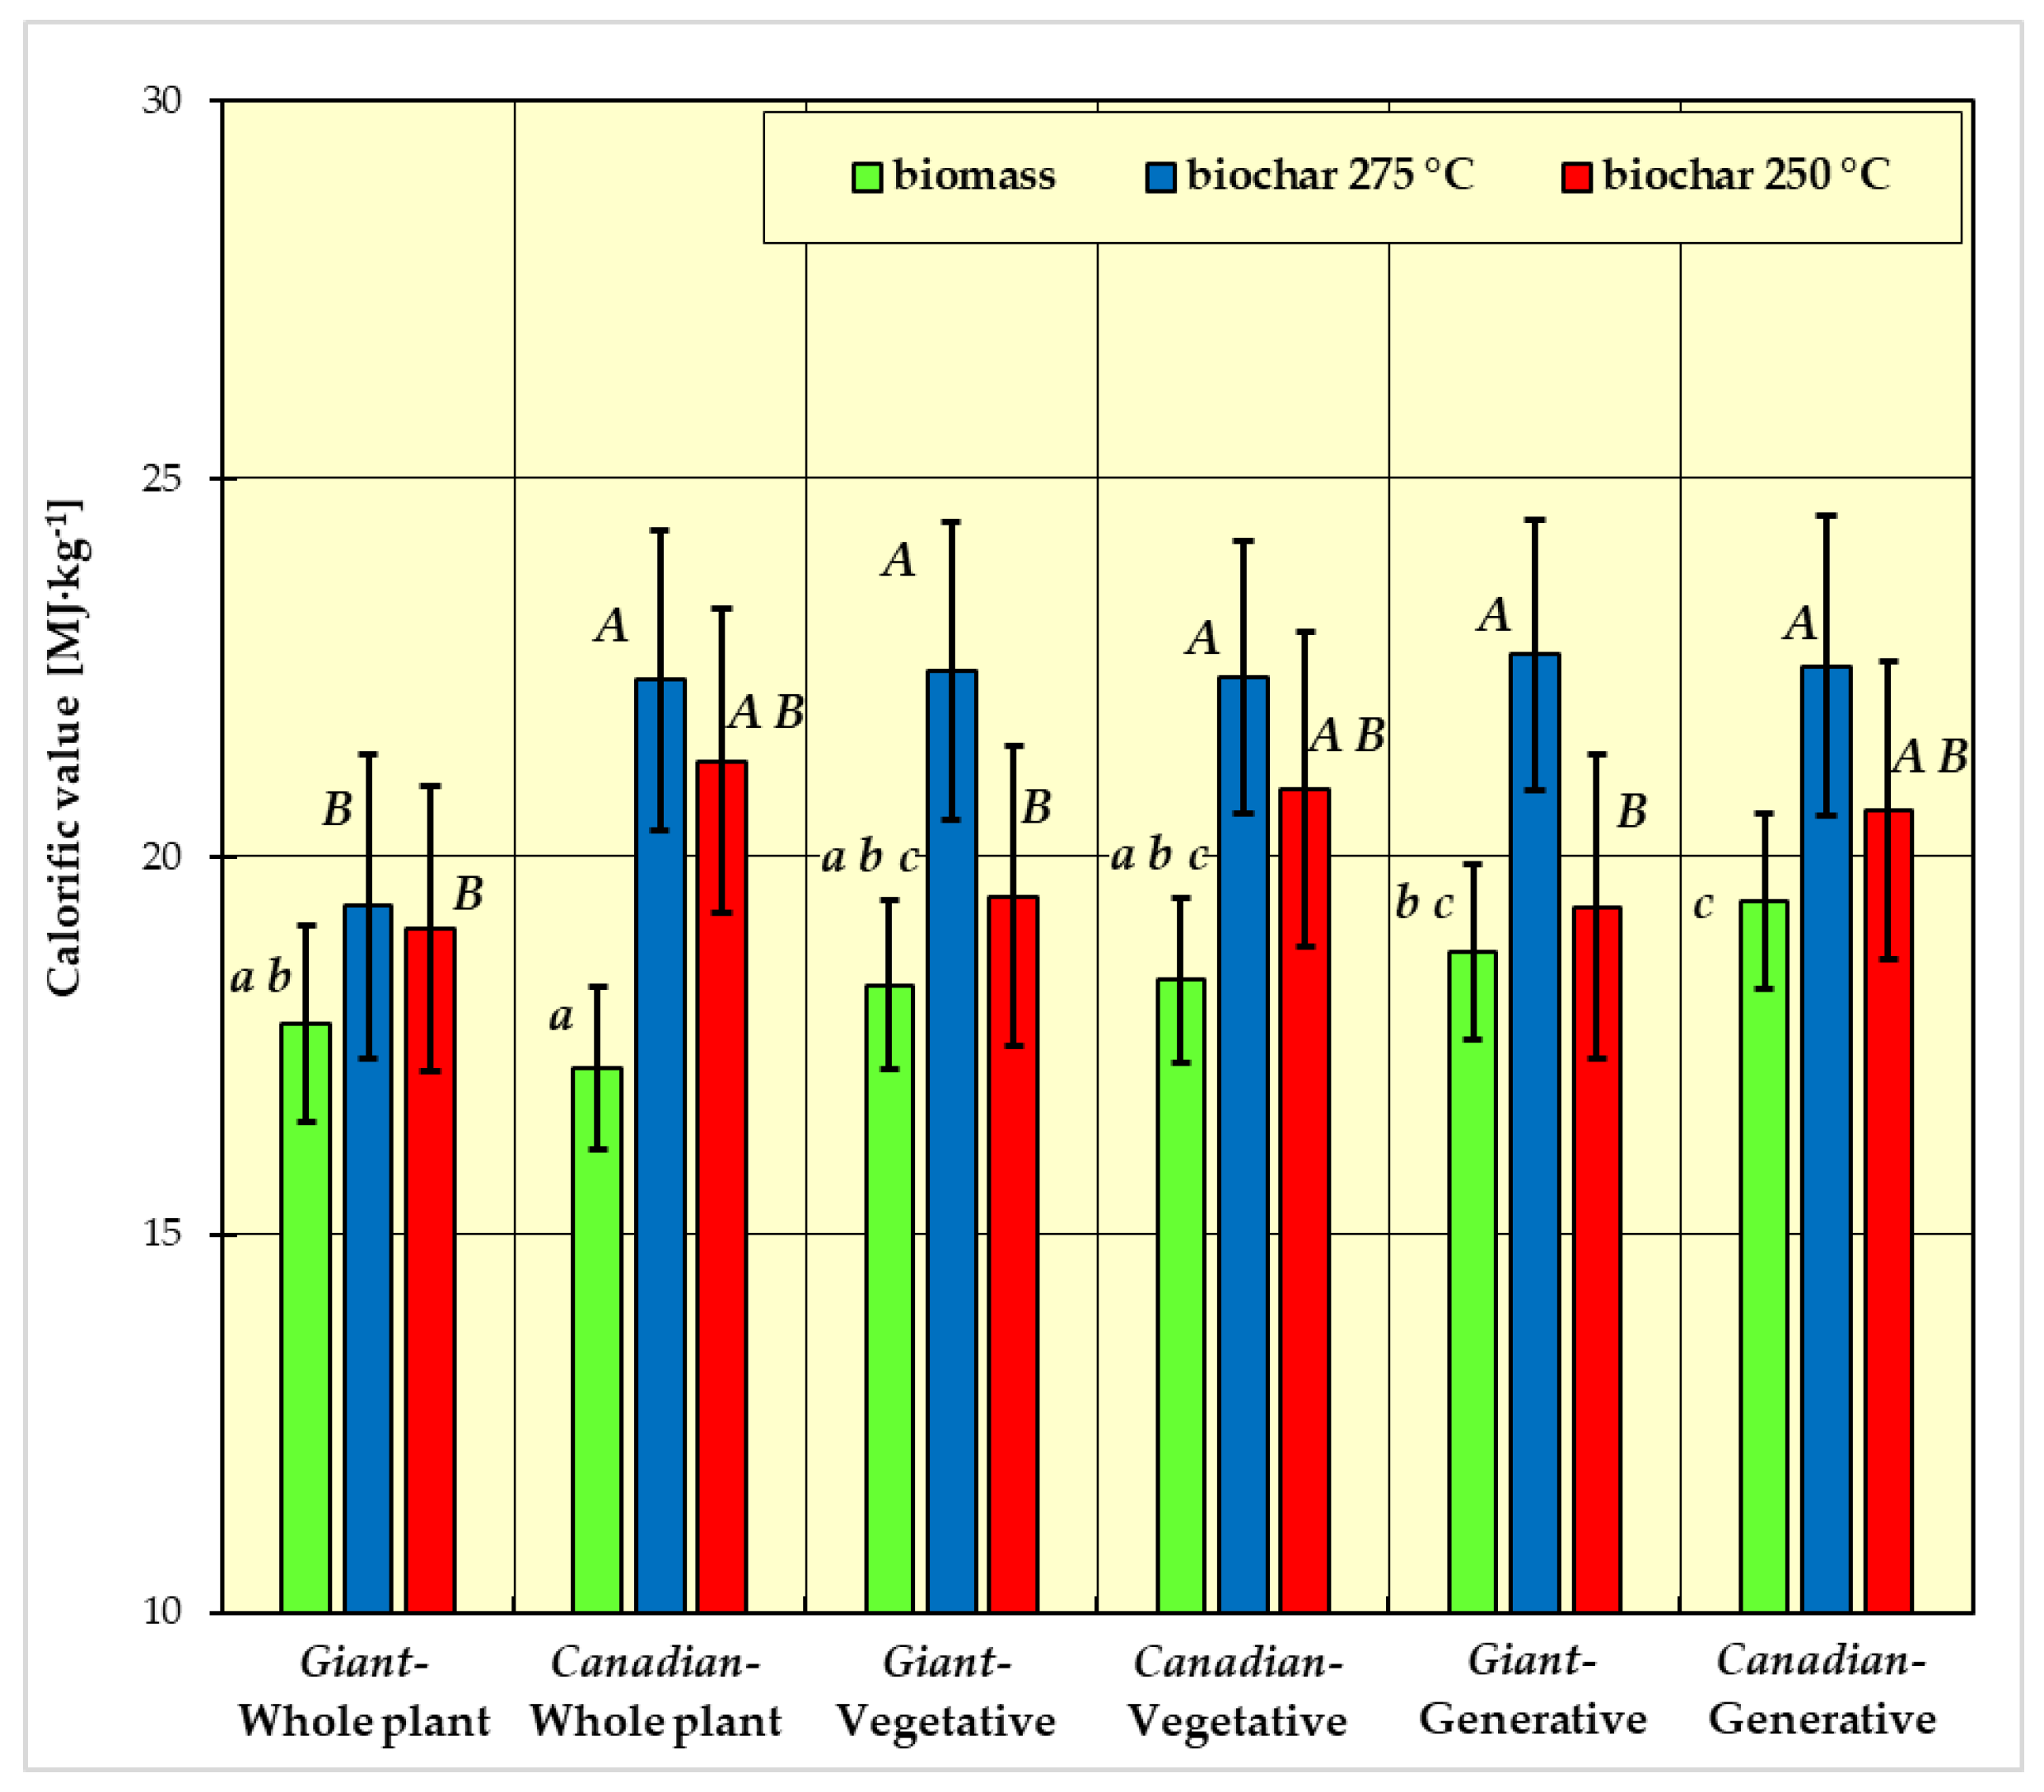
- group a: Giant goldenrod—whole plant, Canadian goldenrod—whole plant, goldenrod Giant-plant vegetative and goldenrod Canadian-plant vegetative;
- group b: goldenrod Giant-whole plant, goldenrod Giant-plant vegetative, Canadian goldenrod—plant vegetative and Giant goldenrod—plant generative;
- group c: Giant goldenrod—plant vegetative, Canadian goldenrod—plant vegetative, Giant goldenrod—plant generative and Canadian goldenrod—plant generative.
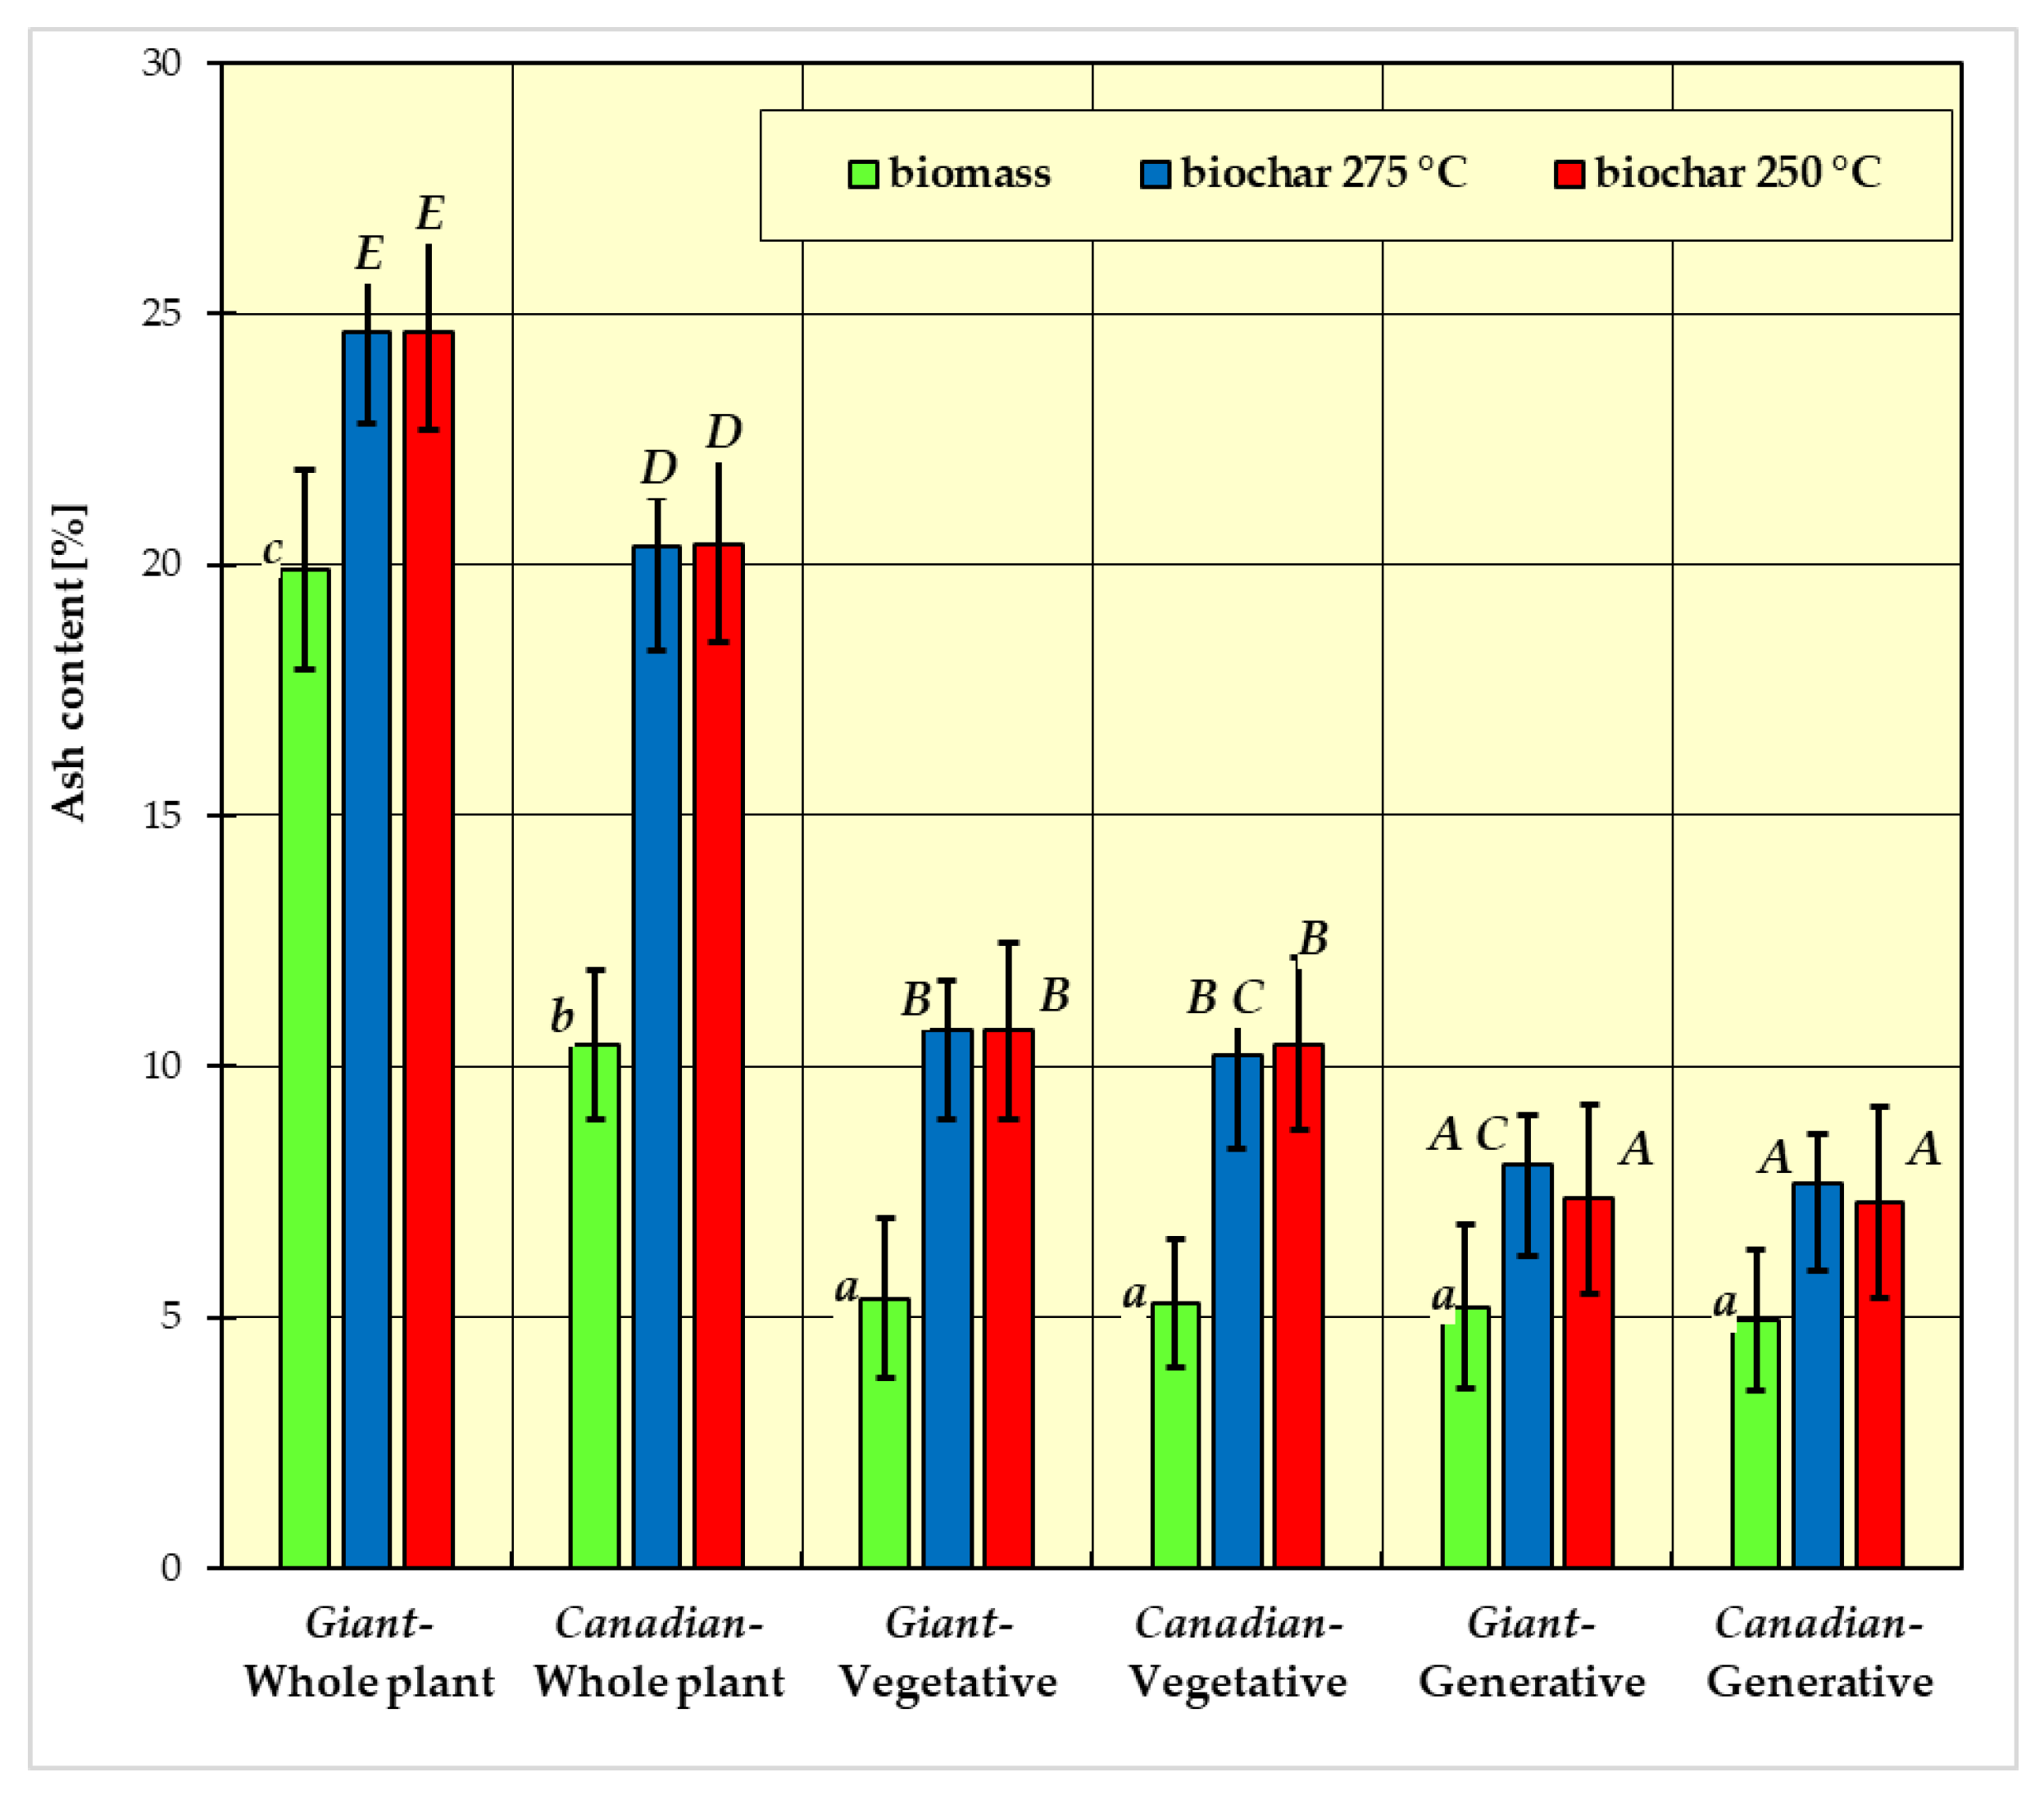
- group A: Canadian-generative-250 °C, Canadian-generative-275 °C, Giant-generative-250 °C, Giant-generative-275 °C;
- group B: Canadian-vegetative-250 °C, Canadian-vegetative-275 °C, Giant-vegetative-250 °C, Giant-vegetative-275 °C;
- group C: Giant-generative-275 °C, Canadian-vegetative-275 °C;
- group D: Canadian-whole plant-250 °C, Canadian-whole plant-275 °C;
- group E: Giant-whole plant-250 °C, Giant-whole plant-275 °C.
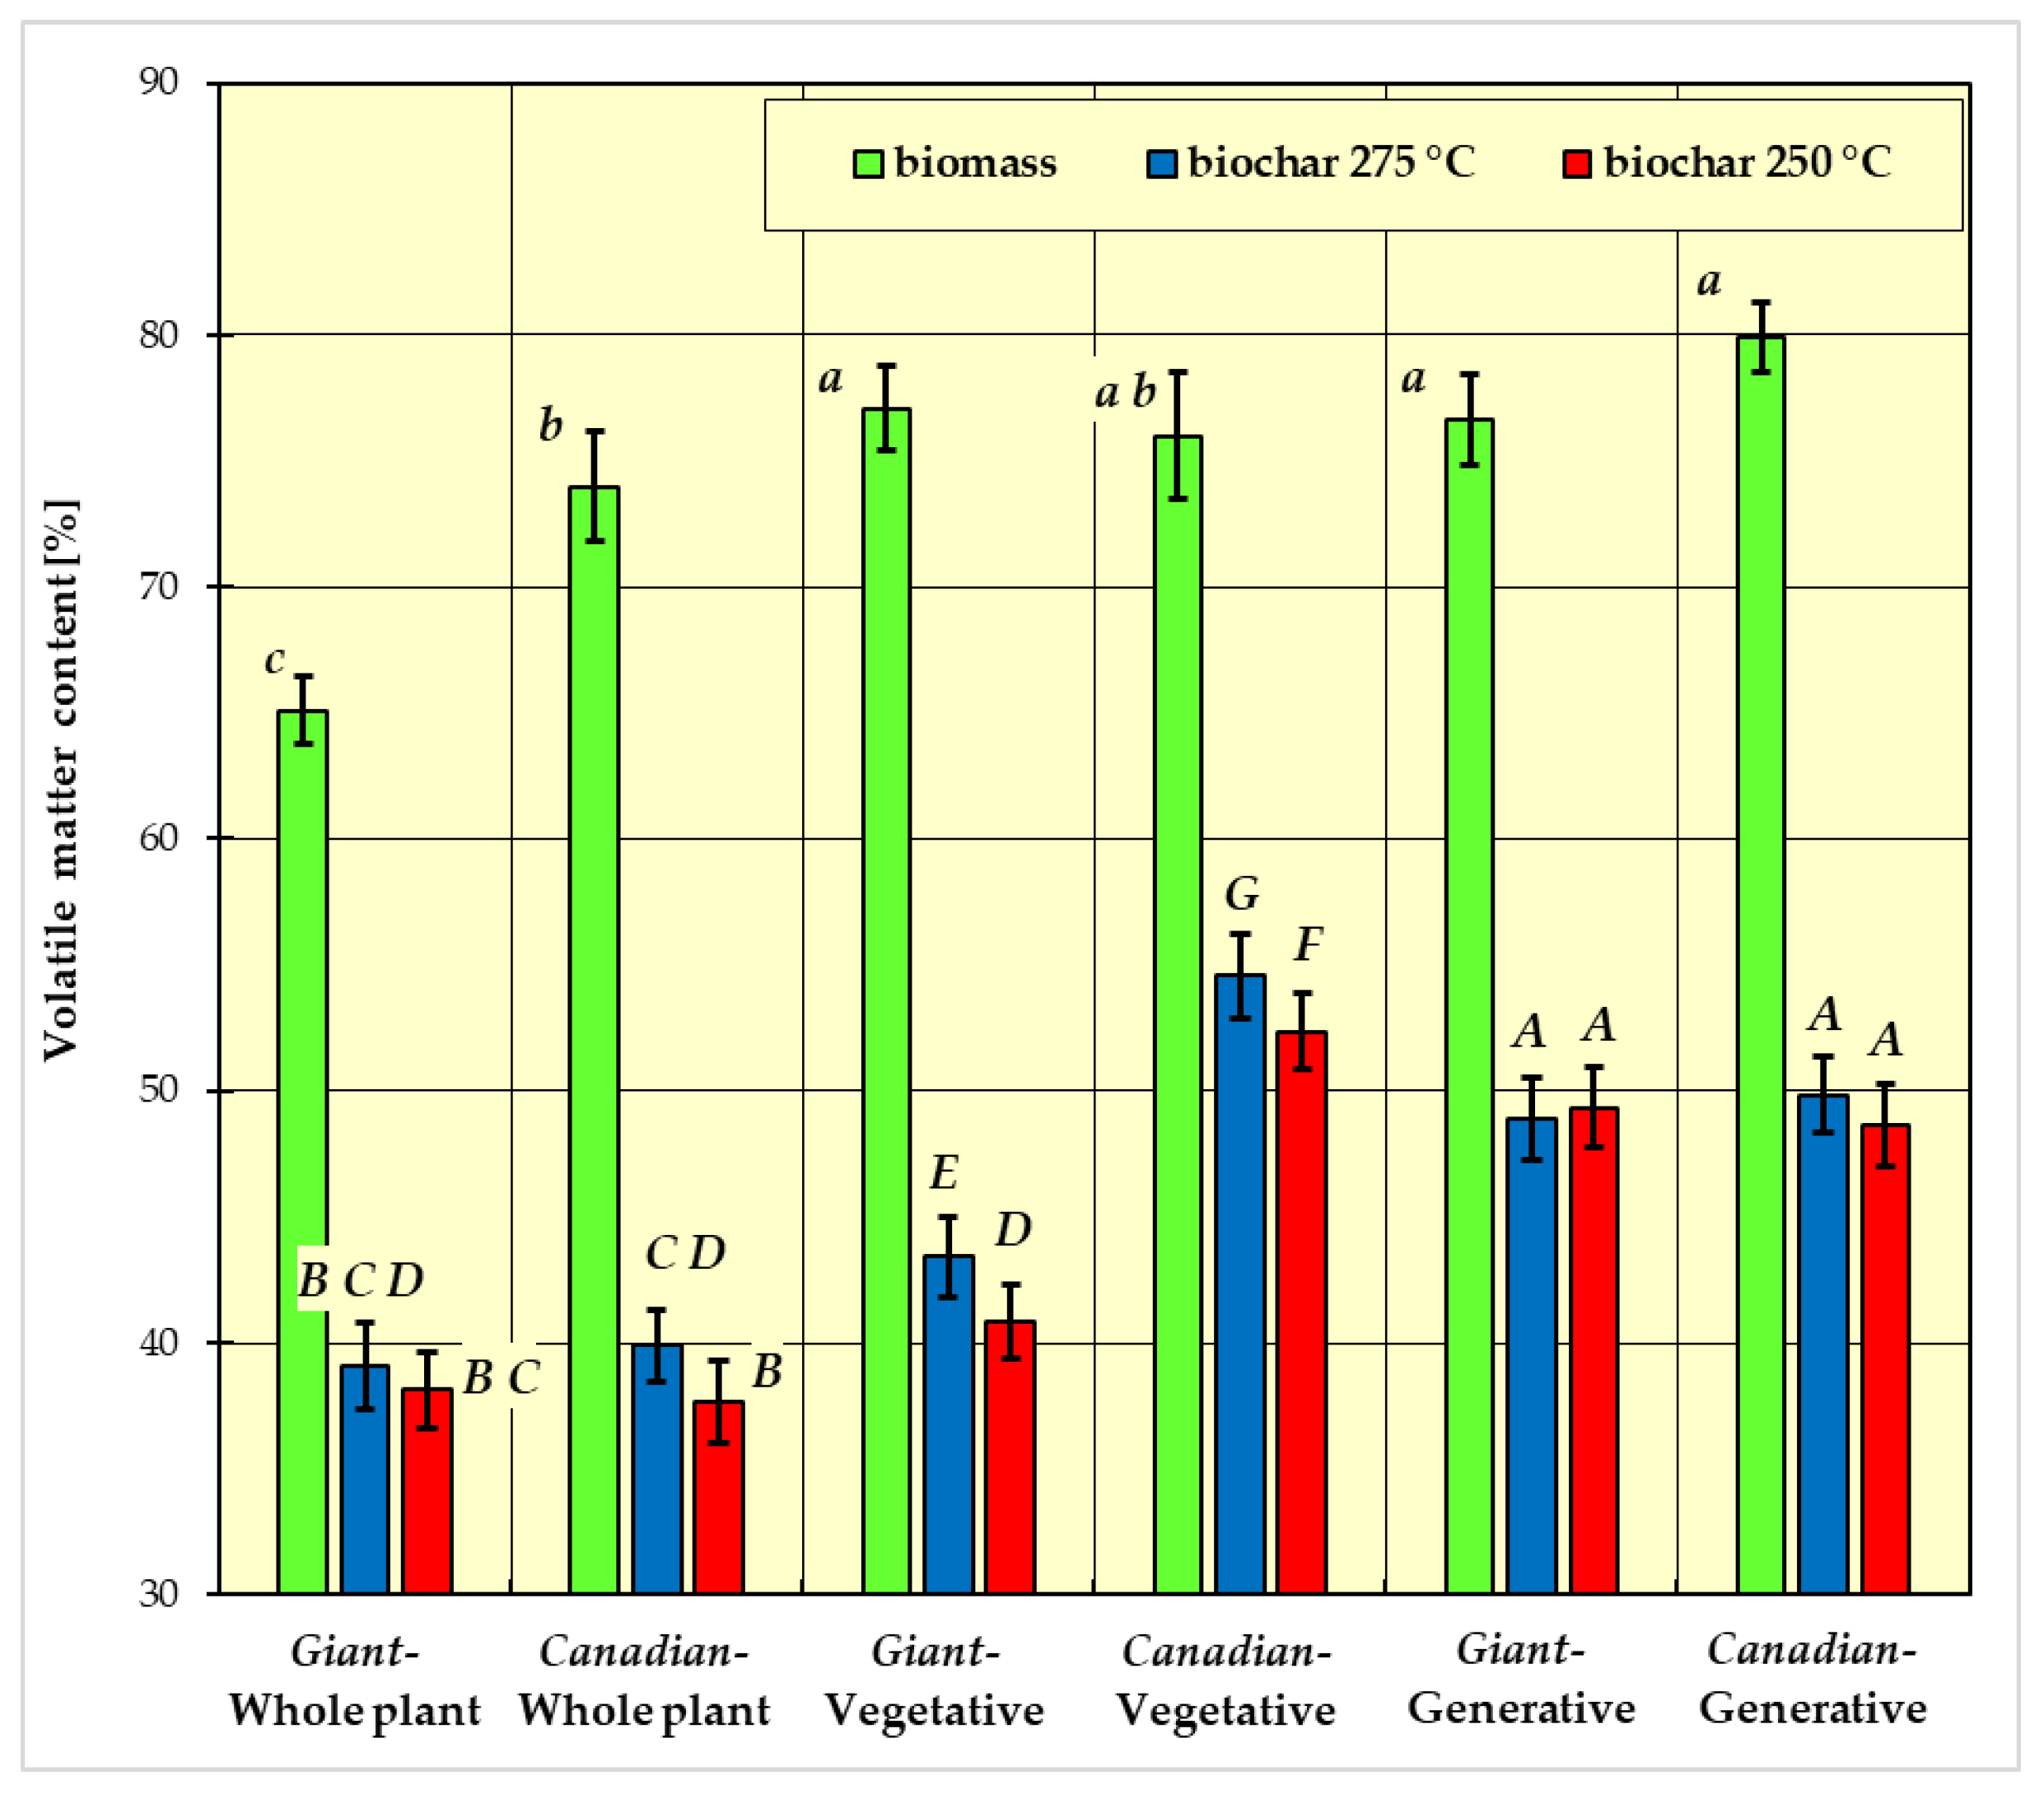
- group A: Canadian-generative-250 °C, Canadian-generative-275 °C, Giant-generative-250 °C, Giant-generative-275 °C;
- group B: Giant-whole plant-250 °C, Giant-whole plant-275 °C, Canadian-whole plant-250 °C;
- group C: Giant-whole plant-250 °C, Giant-whole plant-275 °C, Canadian-whole plant-275 °C;
- group D: Giant-whole plant-275 °C, Canadian-whole plant-275 °C, Giant-vegetative-250 °C;
- group E: Giant-vegetative-275 °C;
- group F: Canadian-vegetative-250 °C;
- group G: Canadian-vegetative-275 °C.
- group A: Canadian-generative-250 °C, Canadian-generative-275 °C, Giant-generative-275 °C, Canadian-vegetative-250 °C, Canadian-vegetative-275 °C, Giant-vegetative-275 °C, Canadian-whole plant-250 °C, Canadian-whole plant-275 °C;
- group B: Canadian-generative-250 °C, Giant-generative-250 °C, Canadian-vegetative-250°, Giant-vegetative-250 °C, Giant-whole plant-250 °C, Giant-whole plant-275 °C;
- group C: Canadian-generative-250 °C, Canadian-vegetative-250 °C, Giant-vegetative-250 °C, Canadian-whole plant-250 °C.
4. Discussion
5. Conclusions
Author Contributions
Funding
Institutional Review Board Statement
Informed Consent Statement
Data Availability Statement
Conflicts of Interest
References
- Lehmann, J.; Czimczik, C.; Laird, D.; Sohi, S. Stability of biochar in the soil. In Biochar for Environmental Management; Routledge: London, UK, 2009; Volume 9781849770552. [Google Scholar]
- Tomczyk, A.; Sokołowska, Z.; Boguta, P. Biochar physicochemical properties: Pyrolysis temperature and feedstock kind effects. Rev. Environ. Sci. Biotechnol. 2020, 19, 191–215. [Google Scholar] [CrossRef] [Green Version]
- Yeboah, N.N.N.; Shearer, C.R.; Burns, S.E.; Kurtis, K.E. Characterization of biomass and high carbon content coal ash for productive reuse applications. Fuel 2014, 116, 438–447. [Google Scholar] [CrossRef]
- Szyszlak-Bargłowicz, J.; Zajac, G.; Piekarski, W. Energy biomass characteristics of chosen plants. Int. Agrophys. 2012, 26, 175–179. [Google Scholar] [CrossRef] [Green Version]
- Szufa, S.; Piersa, P.; Adrian, Ł.; Czerwinska, J.; Lewandowski, A.; Lewandowska, W.; Sielski, J.; Dzikuc, M.; Wróbel, M.; Jewiarz, M.; et al. Sustainable drying and torrefaction processes of miscanthus for use as a pelletized solid biofuel and biocarbon-carrier for fertilizers. Molecules 2021, 26, 1014. [Google Scholar] [CrossRef]
- Chew, J.J.; Doshi, V. Recent advances in biomass pretreatment—Torrefaction fundamentals and technology. Renew. Sustain. Energy Rev. 2011, 15, 4212–4222. [Google Scholar] [CrossRef]
- Bartoli, M.; Giorcelli, M.; Jagdale, P.; Rovere, M.; Tagliaferro, A. A review of non-soil biochar applications. Materials 2020, 13, 261. [Google Scholar] [CrossRef] [Green Version]
- Knapczyk, A.; Francik, S.; Jewiarz, M.; Zawiślak, A.; Francik, R. Thermal treatment of biomass: A bibliometric analysis—The torrefaction case. Energies 2021, 14, 162. [Google Scholar] [CrossRef]
- Chen, W.-H.; Kuo, P.-C. A study on torrefaction of various biomass materials and its impact on lignocellulosic structure simulated by a thermogravimetry. Energy 2010, 35, 2580–2586. [Google Scholar] [CrossRef]
- Kazemi Shariat Panahi, H.; Dehhaghi, M.; Ok, Y.S.; Nizami, A.-S.; Khoshnevisan, B.; Mussatto, S.I.; Aghbashlo, M.; Tabatabaei, M.; Lam, S.S. A comprehensive review of engineered biochar: Production, characteristics, and environmental applications. J. Clean. Prod. 2020, 270, 122462. [Google Scholar] [CrossRef]
- Prins, M.J.; Ptasinski, K.J.; Janssen, F.J.J.G. From coal to biomass gasification: Comparison of thermodynamic efficiency. Energy 2007, 32, 1248–1259. [Google Scholar] [CrossRef]
- Prins, M.J.; Ptasinski, K.J.; Janssen, F.J.J.G. Torrefaction of wood. Part 2. Analysis of products. J. Anal. Appl. Pyrolysis 2006, 77, 35–40. [Google Scholar] [CrossRef]
- McKendry, P. Energy production from biomass (part 1): Overview of biomass. Bioresour. Technol. 2002, 83, 37–46. [Google Scholar] [CrossRef]
- Tran, K.-Q.; Luo, X.; Seisenbaeva, G.; Jirjis, R. Stump torrefaction for bioenergy application. Appl. Energy 2013, 112, 539–546. [Google Scholar] [CrossRef]
- Medic, D.; Darr, M.; Shah, A.; Rahn, S. Effect of torrefaction on water vapor adsorption properties and resistance to microbial degradation of corn stover. Energy Fuels 2012, 26, 2386–2393. [Google Scholar] [CrossRef]
- Kambo, H.S.; Dutta, A. A comparative review of biochar and hydrochar in terms of production, physico-chemical properties and applications. Renew. Sustain. Energy Rev. 2015, 45, 359–378. [Google Scholar] [CrossRef]
- Mihajlović, M.; Petrović, J.; Maletić, S.; Isakovski, M.K.; Stojanović, M.; Lopičić, Z.; Trifunović, S. Hydrothermal carbonization of Miscanthus × giganteus: Structural and fuel properties of hydrochars and organic profile with the ecotoxicological assessment of the liquid phase. Energy Convers. Manag. 2018, 159, 254–263. [Google Scholar] [CrossRef]
- Mendonça, F.G.D.; Cunha, I.T.D.; Soares, R.R.; Tristão, J.C.; Lago, R.M. Tuning the surface properties of biochar by thermal treatment. Bioresour. Technol. 2017, 246, 28–33. [Google Scholar] [CrossRef] [Green Version]
- Pinna, M.; Binda, G.; Altomare, M.; Marelli, M.; Dossi, C.; Monticelli, D.; Spanu, D.; Recchia, S. Biochar nanoparticles over TiO2 nanotube arrays: A green co-catalyst to boost the photocatalytic degradation of organic pollutants. Catalysts 2021, 11, 1048. [Google Scholar] [CrossRef]
- González-Castaño, M.; Morales, C.; de Miguel, J.C.; Boelte, J.H.; Klepel, O.; Flege, J.I.; Arellano-García, H. Are Ni/ and Ni5Fe1/biochar catalysts suitable for synthetic natural gas production? A comparison with γ-Al2O3 supported catalysts. Green Energy Environ. 2021, in press. [Google Scholar] [CrossRef]
- Kant Bhatia, S.; Palai, A.K.; Kumar, A.; Kant Bhatia, R.; Kumar Patel, A.; Kumar Thakur, V.; Yang, Y.-H. Trends in renewable energy production employing biomass-based biochar. Bioresour. Technol. 2021, 340, 125644. [Google Scholar] [CrossRef]
- Colmenares, J.C.; Varma, R.S.; Lisowski, P. Sustainable hybrid photocatalysts: Titania immobilized on carbon materials derived from renewable and biodegradable resources. Green Chem. 2016, 18, 5736–5750. [Google Scholar] [CrossRef] [PubMed] [Green Version]
- Mian, M.M.; Liu, G. Recent progress in biochar-supported photocatalysts: Synthesis, role of biochar, and applications. RSC Adv. 2018, 8, 14237–14248. [Google Scholar] [CrossRef] [Green Version]
- Guo, D.; Li, Y.; Cui, B.; Hu, M.; Luo, S.; Ji, B.; Liu, Y. Natural adsorption of methylene blue by waste fallen leaves of Magnoliaceae and its repeated thermal regeneration for reuse. J. Clean. Prod. 2020, 267, 121903. [Google Scholar] [CrossRef]
- Ji, B.; Zhu, L.; Wang, S.; Liu, Y. Temperature-effect on the performance of non-aerated microalgal-bacterial granular sludge process in municipal wastewater treatment. J. Environ. Manag. 2021, 282, 111955. [Google Scholar] [CrossRef]
- Wannapeera, J.; Fungtammasan, B.; Worasuwannarak, N. Effects of temperature and holding time during torrefaction on the pyrolysis behaviors of woody biomass. J. Anal. Appl. Pyrolysis 2011, 92, 99–105. [Google Scholar] [CrossRef]
- Nguyen, Q.; Nguyen, D.D.; He, C.; Bach, Q.-V. Pretreatment of Korean pine (Pinus koraiensis) via wet torrefaction in inert and oxidative atmospheres. Fuel 2021, 291, 119616. [Google Scholar] [CrossRef]
- Tang, J.; Zhang, S.; Zhang, X.; Chen, J.; He, X.; Zhang, Q. Effects of pyrolysis temperature on soil-plant-microbe responses to Solidago canadensis L.-derived biochar in coastal saline-alkali soil. Sci. Total Environ. 2020, 731, 138938. [Google Scholar] [CrossRef]
- Gala-Czekaj, D.; Synowiec, A.; Dabkowska, T. Self-renewal of invasive goldenrods (Solidago spp.) as a result of different mechanical management of fallow. Agronomy 2021, 11, 1065. [Google Scholar] [CrossRef]
- Szymura, M.; Szymura, T.H. Rozmieszczenie nawłoci (Solidago spp.) na obszarze Dolnego Śląska oraz ich wpływ na różnorodność biologiczną zasiedlanych fitocenoz. Acta Bot. Sil. 2011, 6, 195–212. [Google Scholar]
- Kapeluszny, J.; Haliniarz, M. Struktura biomasy nawłoci kanadyjskiej—Solidago canadensis L. uprawianej z siewu i sadzenia (The biomass structure of Canada goldenrod (Solidago canadensis L.) grown from seeds and seedlings). Zesz. Nauk. Uniw. Wrocławiu 2012, 101, 13–20. [Google Scholar]
- EN ISO 18134-3:2015-11; Solid Biofuels—Detrmination of Moisture Content—Oven Dry Method—Part 3: Moisture in General Analysis Sample. European Committee for Standardization: Geneva, Switzerland, 2015.
- EN ISO 18122:2016-01; Solid Biofuels—Determination of Ash Content. European Committee for Standardization: Geneva, Switzerland, 2016.
- EN ISO 18123:2016-0; Solid Biofuels—Determination of the Content of Volatile Matter. European Committee for Standardization: Geneva, Switzerland, 2016.
- EN ISO 18125:2017-07; Solid Biofuels—Determination of Calorific Value. European Committee for Standardization: Geneva, Switzerland, 2017.
- Francik, S.; Francik, R.; Sadowska, U.; Bystrowska, B.; Zawiślak, A.; Knapczyk, A.; Nzeyimana, A. Identification of phenolic compounds and determination of antioxidant activity in extracts and infusions of salvia leaves. Materials 2020, 13, 5811. [Google Scholar] [CrossRef] [PubMed]
- Francik, S.; Knapik, P.; Łapczyńska-Kordon, B.; Francik, R.; Ślipek, Z. Values of Selected Strength Parameters of Miscanthus x Giganteus Stalk Depending on Water Content and Internode Number. Materials 2022, 15, 1480. [Google Scholar] [CrossRef] [PubMed]
- Silva, M.P.; Moyano, E.L.; Scopel, A.L. Potential applications of biochar and terpene-enriched bio-oil produced from a semi-arid native Asteraceae. J. Anal. Appl. Pyrolysis 2017, 126, 39–49. [Google Scholar] [CrossRef]
- Wang, J.; Zhao, M.; Zhang, J.; Zhao, B.; Lu, X.; Wei, H. Characterization and utilization of biochars derived from five invasive plant species Bidens pilosa L., Praxelis clematidea, Ipomoea cairica, Mikania micrantha and Lantana camara L. for Cd2+ and Cu2+ removal. J. Environ. Manag. 2021, 280, 111746. [Google Scholar] [CrossRef] [PubMed]
- Arpia, A.A.; Chen, W.-H.; Ubando, A.T.; Tabatabaei, M.; Lam, S.S.; Culaba, A.B.; De Luna, M.D.G. Catalytic microwave-assisted torrefaction of sugarcane bagasse with calcium oxide optimized via Taguchi approach: Product characterization and energy analysis. Fuel 2021, 305, 121543. [Google Scholar] [CrossRef]
- Indum, P.; Mueanmas, C. Screening the factors affecting torrefaction of palm kernel shell by using Plackett-Burman Design. IOP Conf. Ser. Earth Environ. Sci. 2019, 268, 012061. [Google Scholar] [CrossRef]
- Rasat, M.S.M.; Karim, S.A.; Amin, M.F.M.; Jamaludin, M.H.; Abdullah, N.H.; Noor, A.M.; Ahmad, M.I.; Elham, P.; Razab, M.K.A.A. Study on characteristics and energy content’s optimization of torrefied oil palm empty fruit bunch biochar. Int. J. Adv. Sci. Technol. 2019, 28, 205–222. [Google Scholar]
- Kethobile, E.; Ketlogetswe, C.; Gandure, J. Torrefaction of non-oil Jatropha curcas L. (Jatropha) biomass for solid fuel. Heliyon 2020, 6, e05657. [Google Scholar] [CrossRef]
- Francik, R.; Kryczyk-Kozioł, J.; Francik, S.; Gryboś, R.; Krośniak, M. Bis(4,4′-dimethyl-2,2′-bipyridine)oxidovanadium(IV) Sulfate Dehydrate: Potential Candidate for Controlling Lipid Metabolism? Biomed. Res. Int. 2017, 2017, 6950516. [Google Scholar] [CrossRef]
- Rahman, A.A.A.; Ismail, R.I.; Shaari, A.R. Torrefaction Temperature and Holding Time Effect on Khaya Senegalensis Biomass. J. Adv. Res. Fluid Mech. Therm. Sci. 2021, 81, 150–157. [Google Scholar] [CrossRef]
- Chen, W.-H.; Lu, K.-M.; Tsai, C.-M. An experimental analysis on property and structure variations of agricultural wastes undergoing torrefaction. Appl. Energy 2012, 100, 318–325. [Google Scholar] [CrossRef]
- Mierzwa-Hersztek, M.; Gondek, K.; Jewiarz, M.; Dziedzic, K. Assessment of energy parameters of biomass and biochars, leachability of heavy metals and phytotoxicity of their ashes. J. Mater. Cycles Waste Manag. 2019, 21, 786–800. [Google Scholar] [CrossRef]
- Chen, D.; Zheng, Z.; Fu, K.; Zeng, Z.; Wang, J.; Lu, M. Torrefaction of biomass stalk and its effect on the yield and quality of pyrolysis products. Fuel 2015, 159, 27–32. [Google Scholar] [CrossRef]
- Sadiku, N.A.; Oluyege, A.O.; Sadiku, I.B. Analysis of the Calorific and Fuel Value Index of Bamboo as a Source of Renewable Biomass Feedstock for Energy Generation in Nigeria. Lignocellulose 2016, 5, 34–49. [Google Scholar]
- Holtmeyer, M.L.; Li, G.; Kumfer, B.M.; Li, S.; Axelbaum, R.L. The impact of biomass cofiring on volatile flame length. Energy Fuels 2013, 27, 7762–7771. [Google Scholar] [CrossRef]
- Velázquez-Martí, B.; Gaibor-Cházvez, J.; Niño-Ruiz, Z.; Narbona-Sahuquillo, S. Complete characterization of pruning waste from the lechero tree (Euphorbia laurifolia L.) as raw material for biofuel. Renew. Energy 2018, 129, 629–637. [Google Scholar] [CrossRef]
- Jasinskas, A.; Mieldažys, R.; Jotautienė, E.; Domeika, R.; Vaiciukevičius, E.; Marks, M. Technical, Environmental, and Qualitative Assessment of the Oak Waste Processing and Its Usage for Energy Conversion. Sustainability 2020, 12, 8113. [Google Scholar] [CrossRef]
- Bulkiah, T.; Sulistyawati, E. Sutrisno Wood Pellet Characteristics of Five Energy Species Grown in Post-Mining Reclamation Area in South Kalimantan. IOP Conf. Ser. Earth Environ. Sci. 2019, 394, 012050. [Google Scholar] [CrossRef]
- Marangwanda, G.T.; Madyira, D.M.; Ndungu, P.G.; Chihobo, C.H. Combustion Characterisation of Bituminous Coal and Pinus Sawdust Blends by Use of Thermo-Gravimetric Analysis. Energies 2021, 14, 7547. [Google Scholar] [CrossRef]
- Nowak, K.; Rabczak, S. Co-Combustion of Biomass with Coal in Grate Water Boilers at Low Load Boiler Operation. Energies 2021, 14, 2520. [Google Scholar] [CrossRef]
- Pankiewicz-Sperka, M.; Kapusta, K.; Basa, W.; Stolecka, K. Characteristics of Water Contaminants from Underground Coal Gasification (UCG) Process—Effect of Coal Properties and Gasification Pressure. Energies 2021, 14, 6533. [Google Scholar] [CrossRef]
- Tic, W.J.; Guziałowska-Tic, J. The Cost-Efficiency Analysis of a System for Improving Fine-Coal Combustion Efficiency of Power Plant Boilers. Energies 2021, 14, 4295. [Google Scholar] [CrossRef]
- Sideri, D.; Roumpos, C.; Pavloudakis, F.; Paraskevis, N.; Modis, K. Multivariate Geostatistical Modeling of Lower Calorific Value in Multi-Seam Coal Deposits. Appl. Sci. 2020, 10, 6208. [Google Scholar] [CrossRef]
- Kapusta, K. Effect of Lignite Properties on Its Suitability for the Implementation of Underground Coal Gasification (UCG) in Selected Deposits. Energies 2021, 14, 5816. [Google Scholar] [CrossRef]
- Singh, V.P.; Singh, B.D.; Mathews, R.P.; Mendhe, V.A.; Agnihotri, P.; Mishra, S.; Radhwani, M.; Dutta, S.; Subramanian, K.A.; Singh, A.; et al. Petrographical-geochemical characteristics and floral-faunal compositions of the Valia lignite deposits from Cambay Basin (Gujarat), western India. Int. J. Coal Geol. 2021, 248, 103866. [Google Scholar] [CrossRef]
- Yaman, E.; Ulusal, A.; Uzun, B.B. Co-pyrolysis of lignite and rapeseed cake: A comparative study on the thermal decomposition behavior and pyrolysis kinetics. SN Appl. Sci. 2021, 3, 97. [Google Scholar] [CrossRef]
- Yudisaputro, H.; Caesarendra, W.; Yuniarto, M.N.; Yohanes. A study on the Performance and Reliability Effect of Low-Rank Coal to the Steam Power Plant. J. Phys. Conf. Ser. 2021, 1845, 012053. [Google Scholar] [CrossRef]
- Weiland, J.J.; Guyonnet, R.; Gibert, R. Analysis of wood pyrolysis by a TG-DSC-IRTF coupling [Analyse de la pyrolyse menagee du bois par un couplage TG-DSC-IRTF]. J. Therm. Anal. Calorim. 1998, 51, 265–274. [Google Scholar] [CrossRef]
- Wen, J.-L.; Sun, S.-L.; Yuan, T.-Q.; Xu, F.; Sun, R.-C. Understanding the chemical and structural transformations of lignin macromolecule during torrefaction. Appl. Energy 2014, 121, 1–9. [Google Scholar] [CrossRef]
- Zheng, A.; Zhao, Z.; Chang, S.; Huang, Z.; Wang, X.; He, F.; Li, H. Effect of torrefaction on structure and fast pyrolysis behavior of corncobs. Bioresour. Technol. 2013, 128, 370–377. [Google Scholar] [CrossRef]


| Species/Plant Part | Biomass Bulk Density [kg∙m−3] | Biochar Bulk Density [kg∙m−3] |
|---|---|---|
| Giant goldenrod/whole plant | 464–482 | 229–301 |
| Giant goldenrod/vegetative part | 395–405 | 149–291 |
| Giant goldenrod/generative part | 361–452 | 188–253 |
| Canadian goldenrod/whole plant | 470–487 | 243–324 |
| Canadian goldenrod/vegetative part | 331–376 | 178–245 |
| Canadian goldenrod/generative part | 357–465 | 193–287 |
| Species/Plant Part | Biomass Moisture Content [%] | Biochar 275 °C Moisture Content [%] | Biochar 250 °C Moisture Content [%] |
|---|---|---|---|
| Giant goldenrod /whole plant | 9.18–10.73 | 5.19–6.08 | 5.28–6.19 |
| Giant goldenrod /vegetative part | 11.9–12.86 | 7.31–7.99 | 7.24–7.94 |
| Giant goldenrod /generative part | 11.01–12.20 | 8.34–9.37 | 8.09–8.96 |
| Canadian goldenrod /whole plant | 10.76–12.22 | 6.53–6.98 | 6.41–7.05 |
| Canadian goldenrod /vegetative part | 11.30–12.07 | 7.14–8.07 | 7.45–8.24 |
| Canadian goldenrod /generative part | 11.70–12.57 | 7.26–8.03 | 7.35–7.99 |
| Intergroup Factors | p Ash Content [%] | p Volatile Matter Content [%] | p Calorific Value [MJ∙kg−1] | p Combustion Heat [MJ∙kg−1] | ||||
|---|---|---|---|---|---|---|---|---|
| Species | 0.000008 | * | 0.000550 | * | 0.925095 | 0.868240 | ||
| Plant part | 0.000000 | * | 0.000000 | * | 0.019775 | * | 0.017319 | * |
| Species * Plant part | 0.000000 | * | 0.000005 | * | 0.484488 | 0.542392 |
| Intergroup Factors | p Ash Content [%] | p Volatile Matter Content [%] | p Calorific Value [MJ∙kg−1] | p Combustion Heat [MJ∙kg−1] | ||||
|---|---|---|---|---|---|---|---|---|
| Species | 0.001345 | * | 0.000000 | * | 0.015063 | * | 0.016005 | * |
| Plant part | 0.000000 | * | 0.000000 | * | 0.344569 | 0.513122 | ||
| Material | 0.795809 | 0.000771 | * | 0.000640 | * | 0.000596 | * | |
| Species *Plant part | 0.001258 | * | 0.000000 | * | 0.187318 | 0.098905 | ||
| Species *Material | 0.825913 | 0.299548 | 0.488718 | 0.435784 | ||||
| Plant part *Material | 0.844045 | 0.137445 | 0.263790 | 0.078582 | ||||
| Species *Plant part *Material | 0.994026 | 0.582448 | 0.588975 | 0.876665 |
Publisher’s Note: MDPI stays neutral with regard to jurisdictional claims in published maps and institutional affiliations. |
© 2022 by the authors. Licensee MDPI, Basel, Switzerland. This article is an open access article distributed under the terms and conditions of the Creative Commons Attribution (CC BY) license (https://creativecommons.org/licenses/by/4.0/).
Share and Cite
Łapczyńska-Kordon, B.; Ślipek, Z.; Słomka-Polonis, K.; Styks, J.; Hebda, T.; Francik, S. Physicochemical Properties of Biochar Produced from Goldenrod Plants. Materials 2022, 15, 2615. https://doi.org/10.3390/ma15072615
Łapczyńska-Kordon B, Ślipek Z, Słomka-Polonis K, Styks J, Hebda T, Francik S. Physicochemical Properties of Biochar Produced from Goldenrod Plants. Materials. 2022; 15(7):2615. https://doi.org/10.3390/ma15072615
Chicago/Turabian StyleŁapczyńska-Kordon, Bogusława, Zbigniew Ślipek, Karolina Słomka-Polonis, Jakub Styks, Tomasz Hebda, and Sławomir Francik. 2022. "Physicochemical Properties of Biochar Produced from Goldenrod Plants" Materials 15, no. 7: 2615. https://doi.org/10.3390/ma15072615
APA StyleŁapczyńska-Kordon, B., Ślipek, Z., Słomka-Polonis, K., Styks, J., Hebda, T., & Francik, S. (2022). Physicochemical Properties of Biochar Produced from Goldenrod Plants. Materials, 15(7), 2615. https://doi.org/10.3390/ma15072615