
Influence of Resorcinol to Sodium Carbonate Ratio on Carbon Xerogel Properties for Aluminium Ion Battery


Abstract
:1. Introduction
2. Materials and Methods
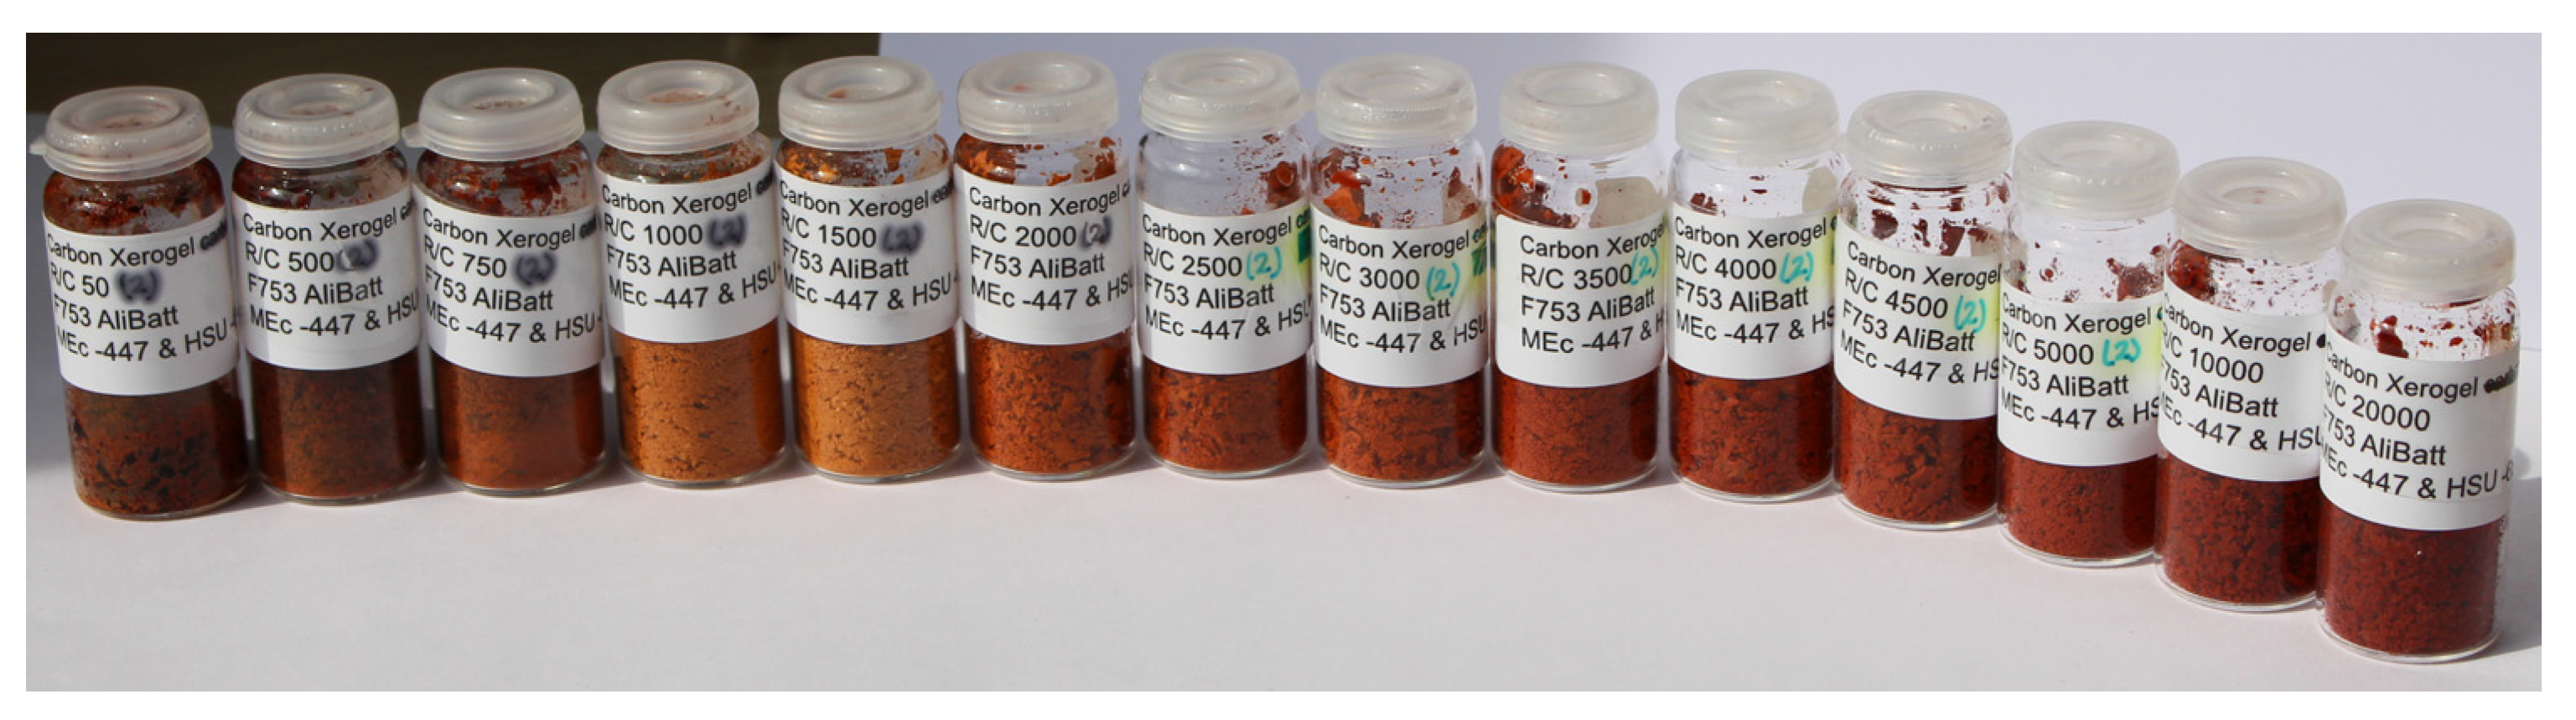
2.1. Synthesis of Xerogels
2.2. Preparation of Cathode Material for AIB Experiments
2.3. Electrochemical Measurements
2.4. Instrumental Analysis
3. Results
3.1. Physisorption of CXGs
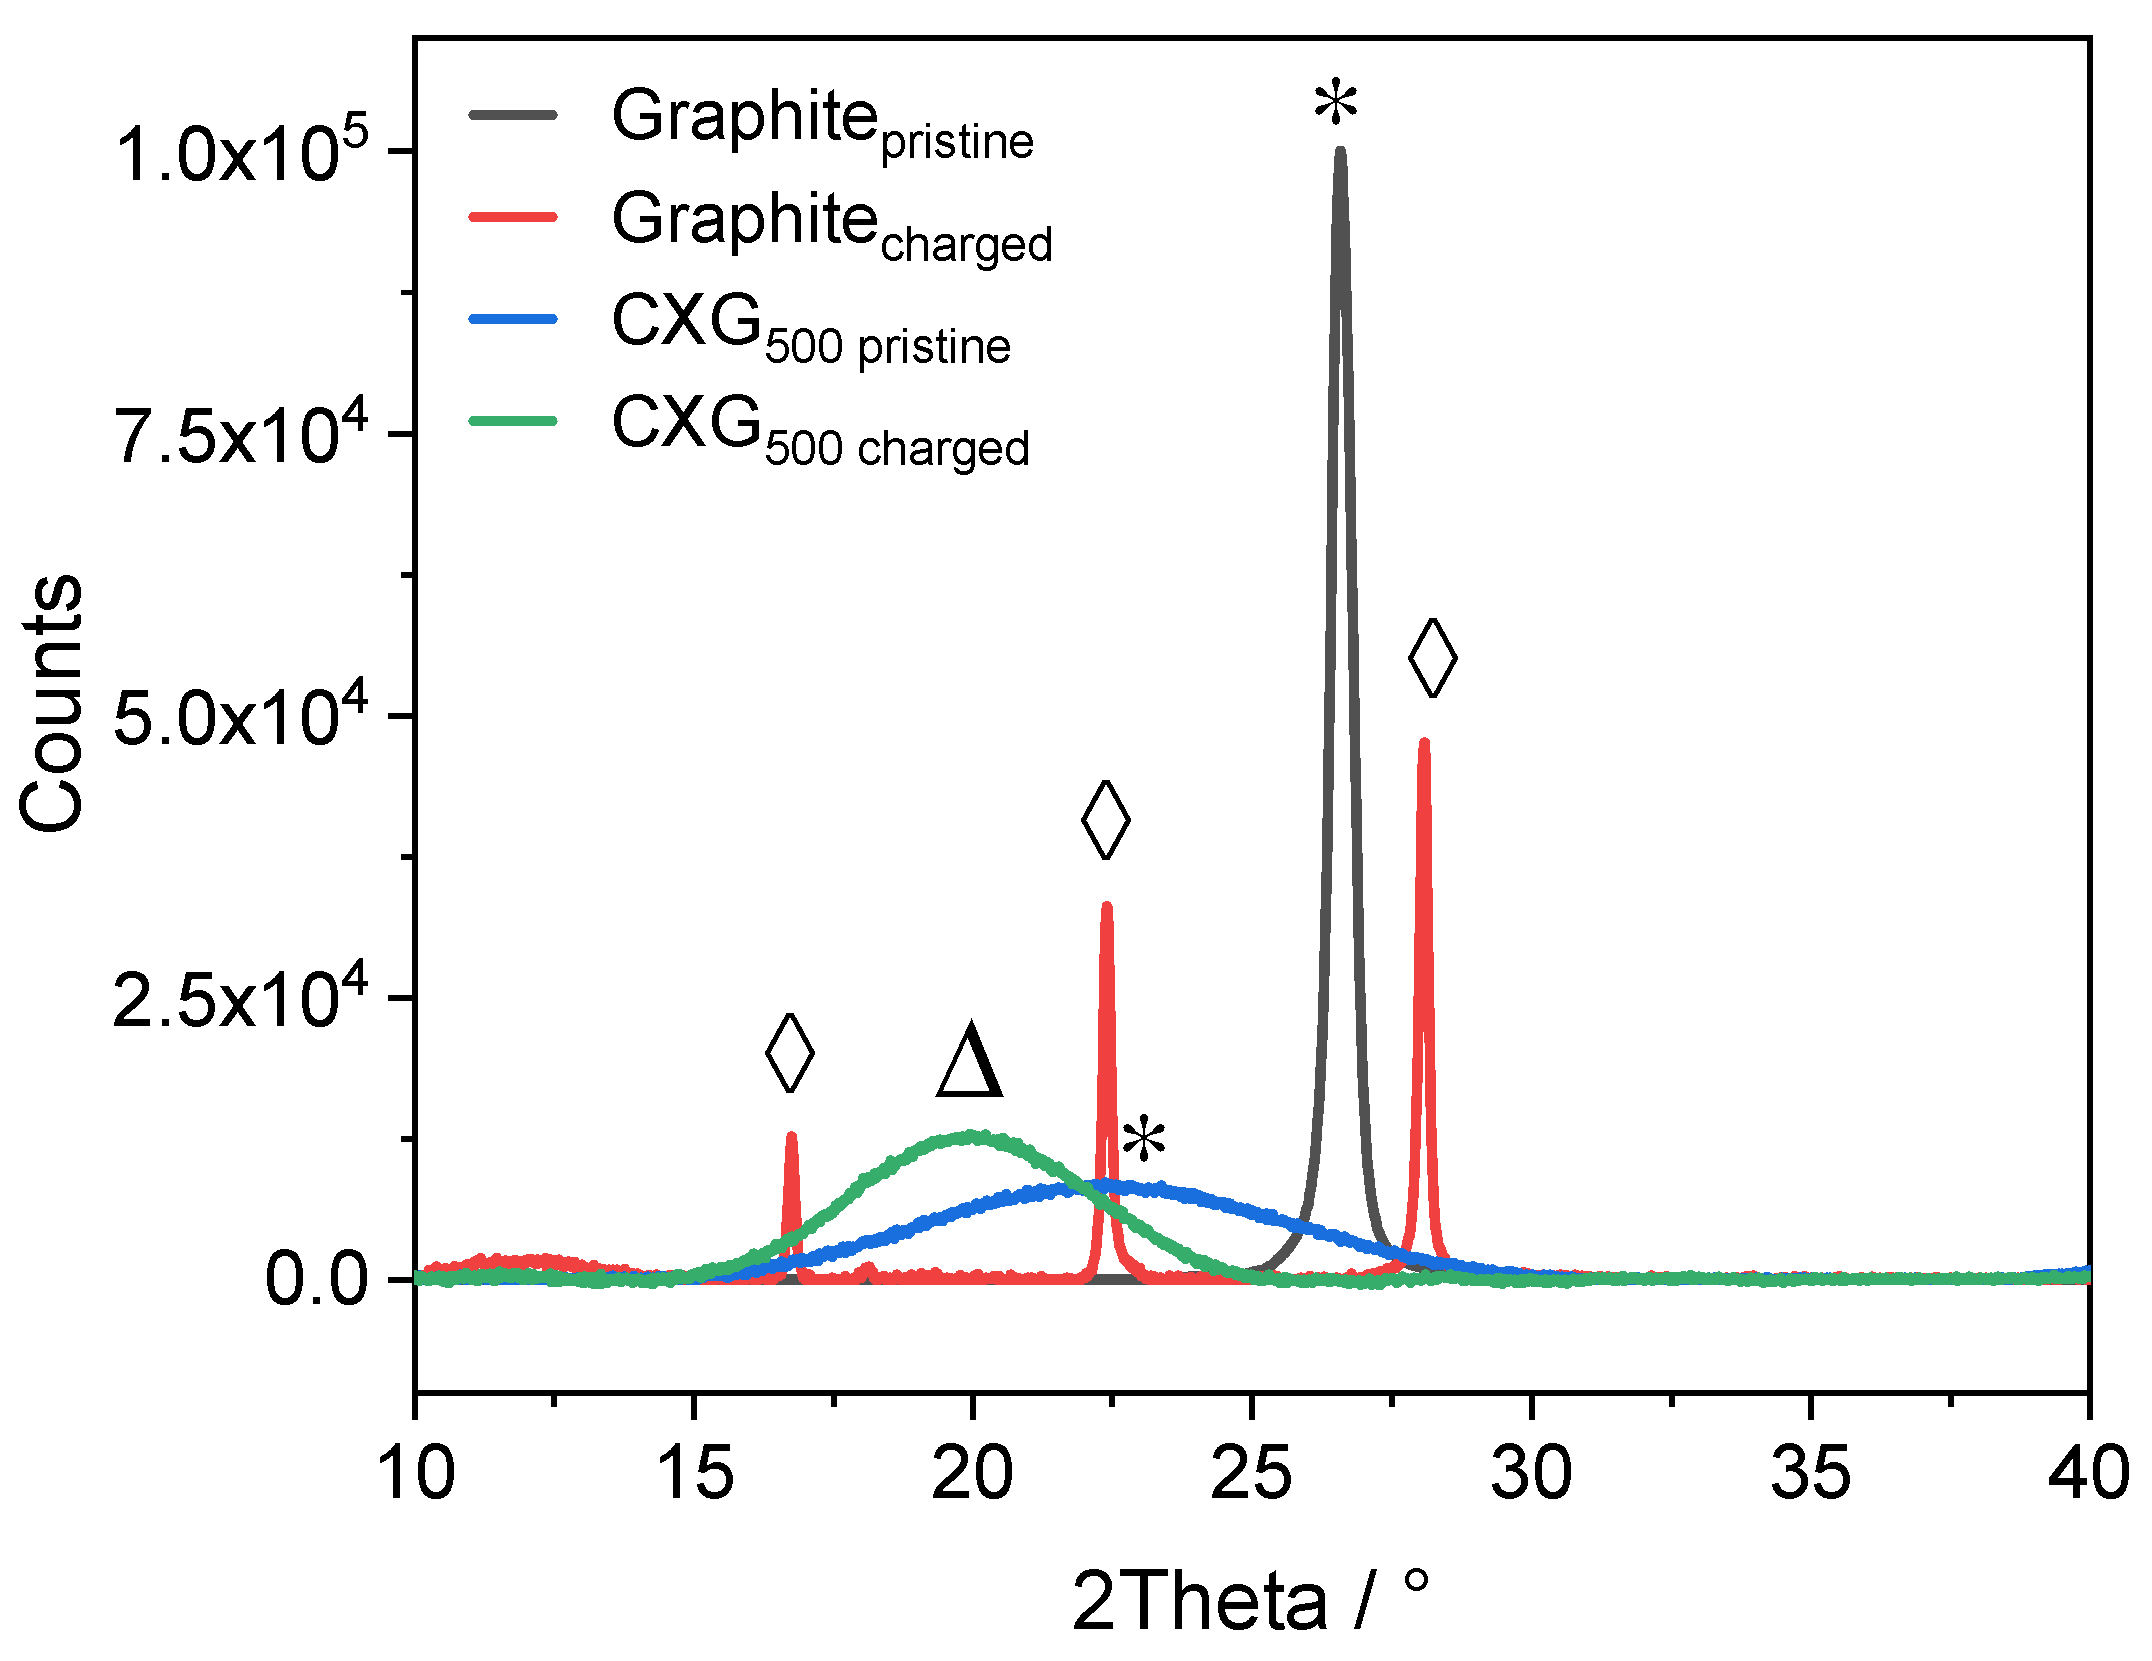
3.2. X-ray Diffraction
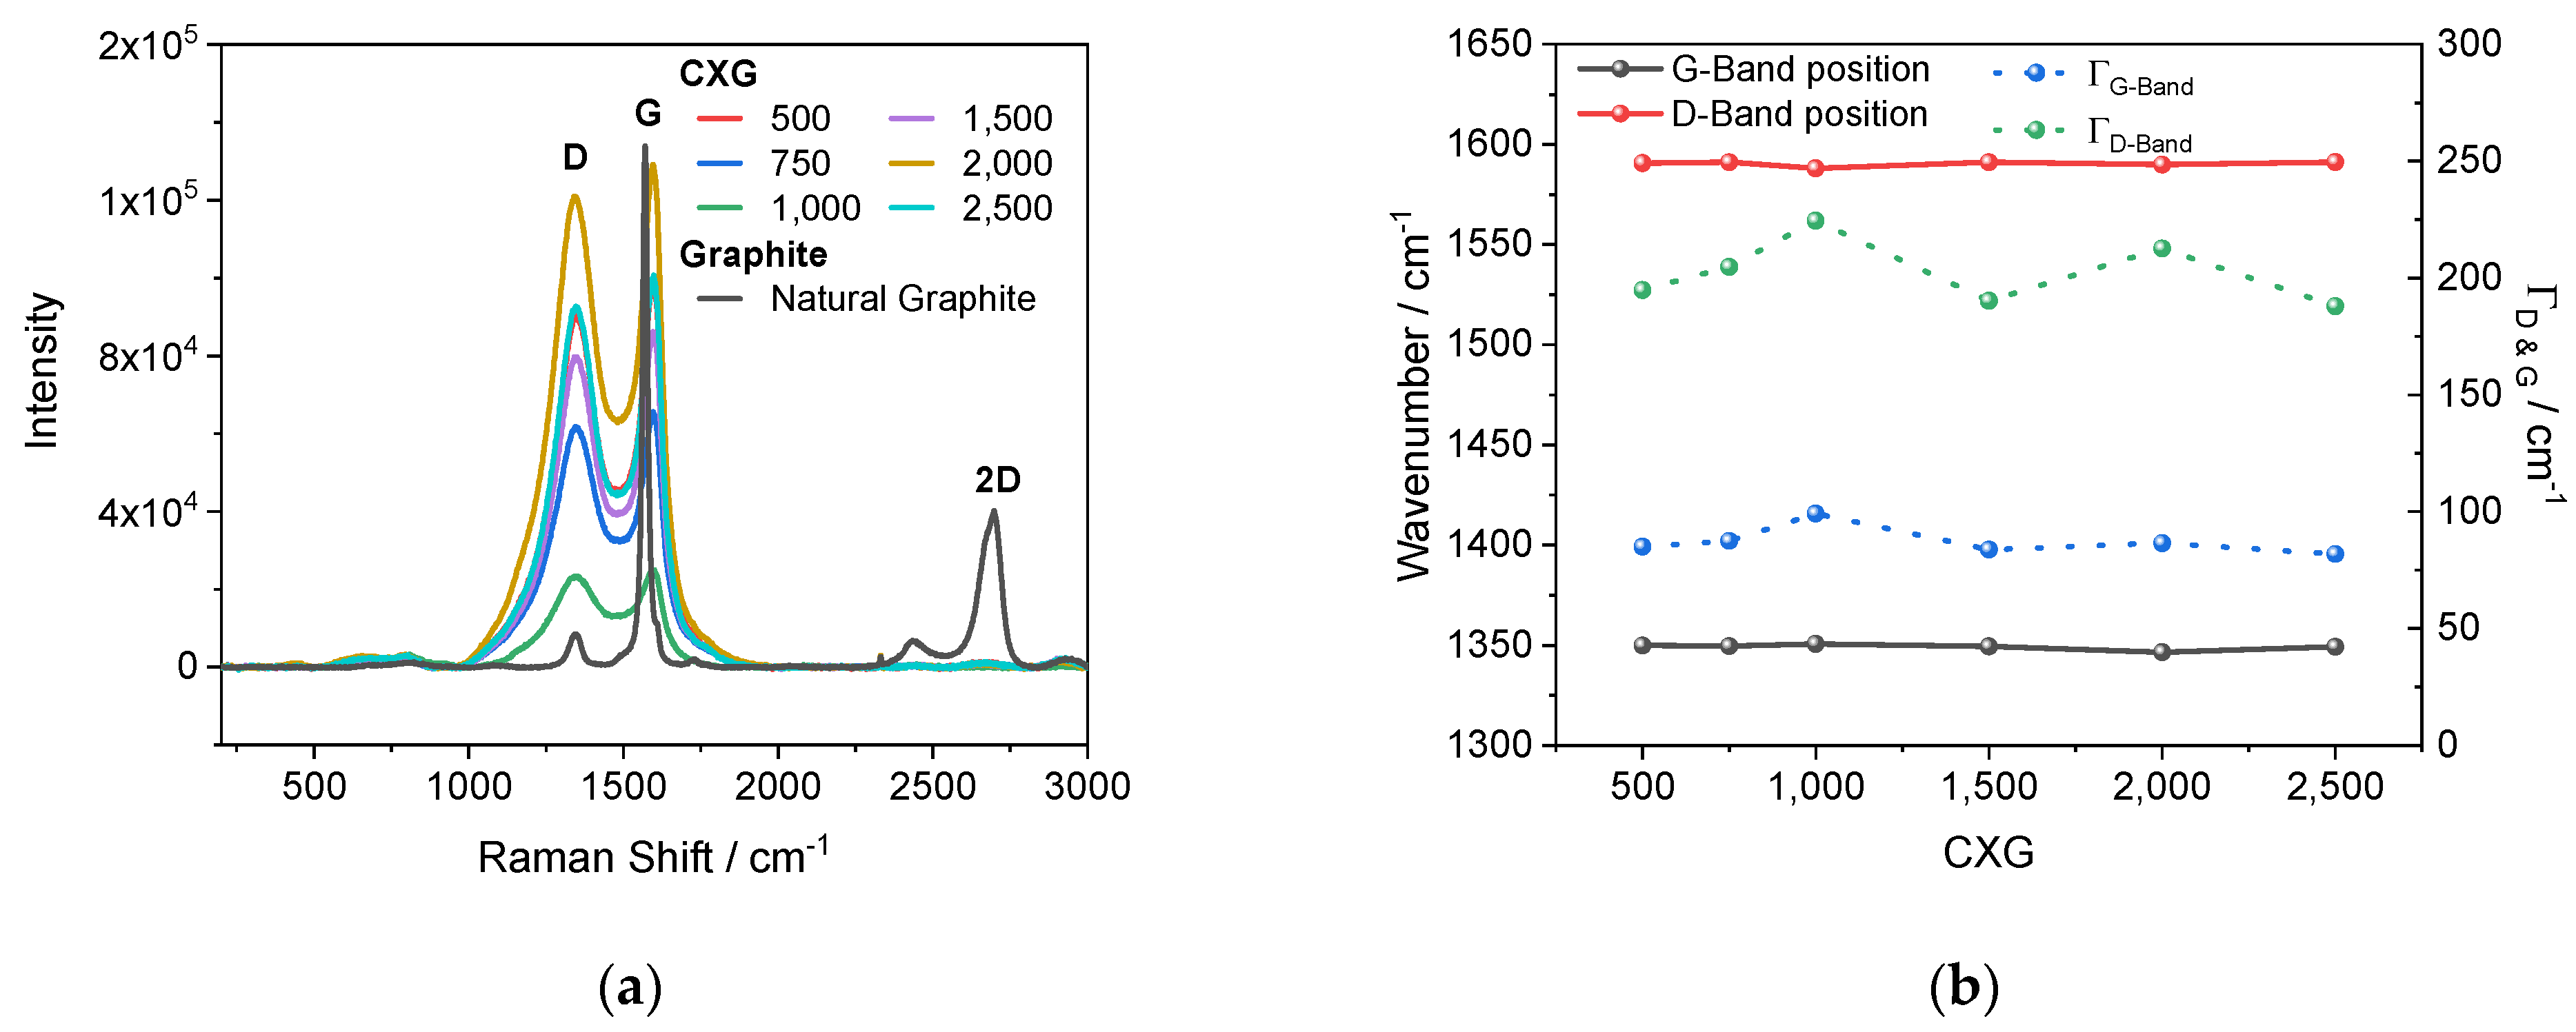
3.3. Raman
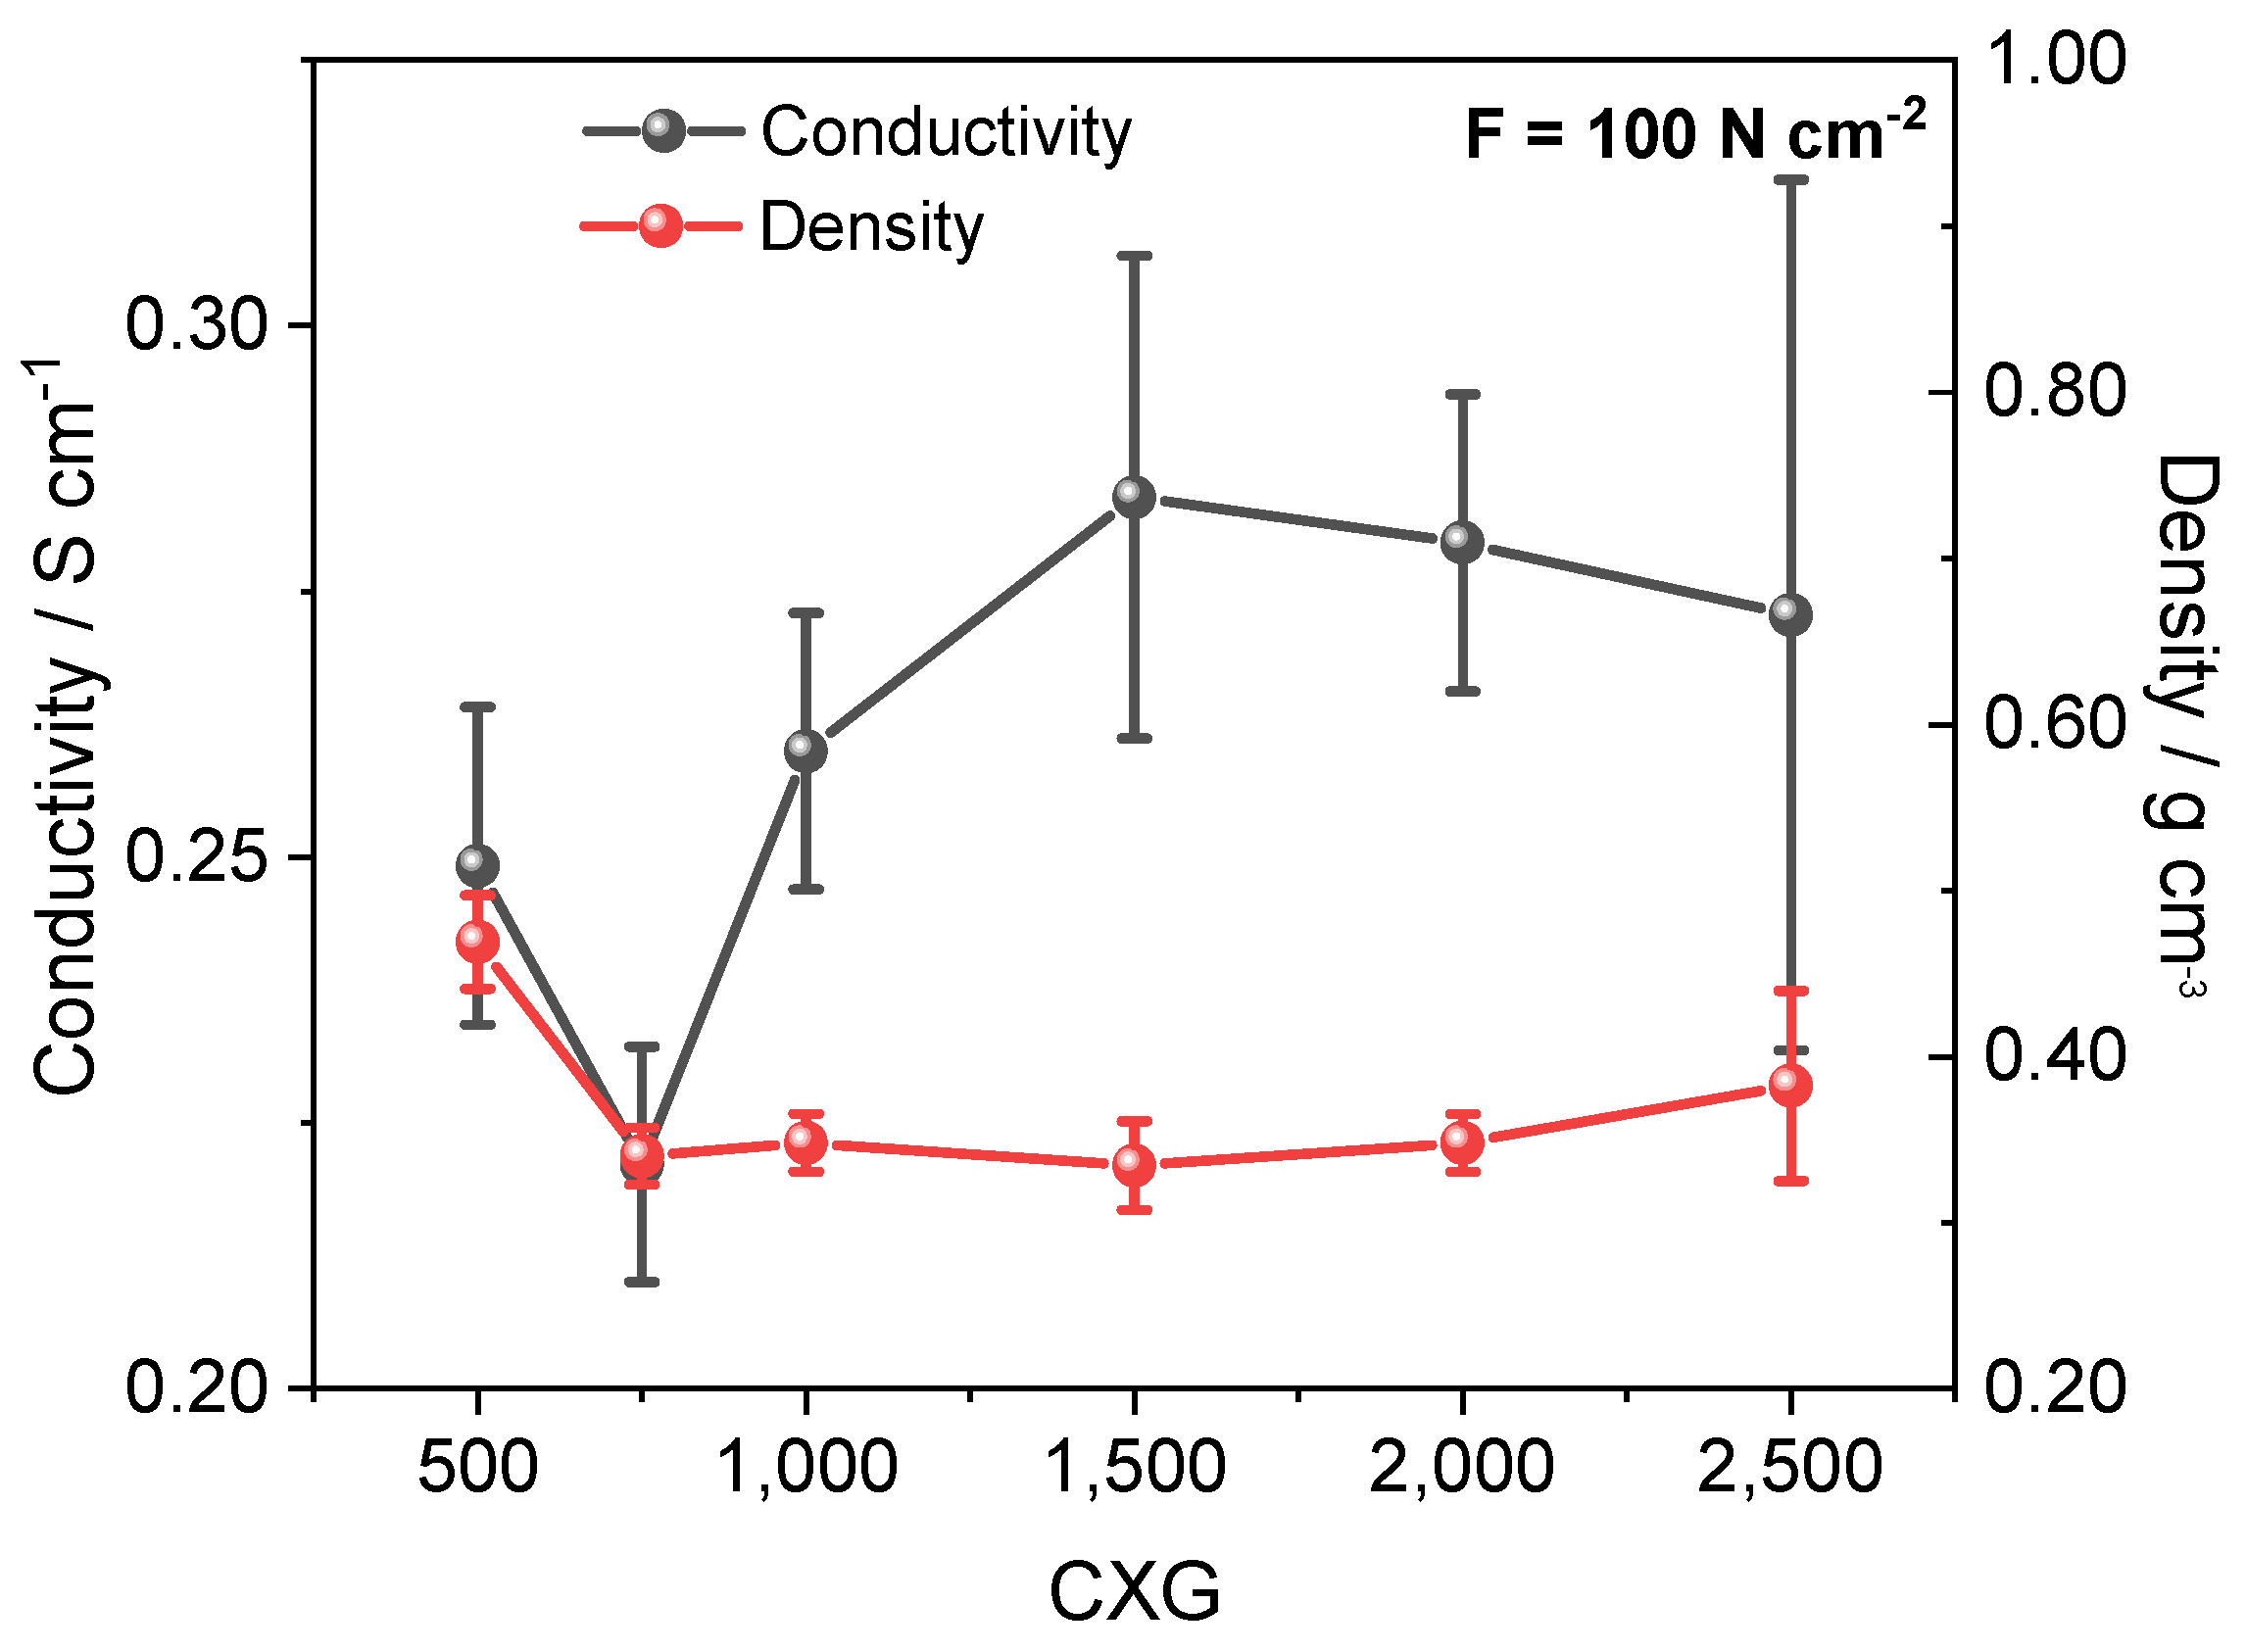
3.4. Electronic Conductivity
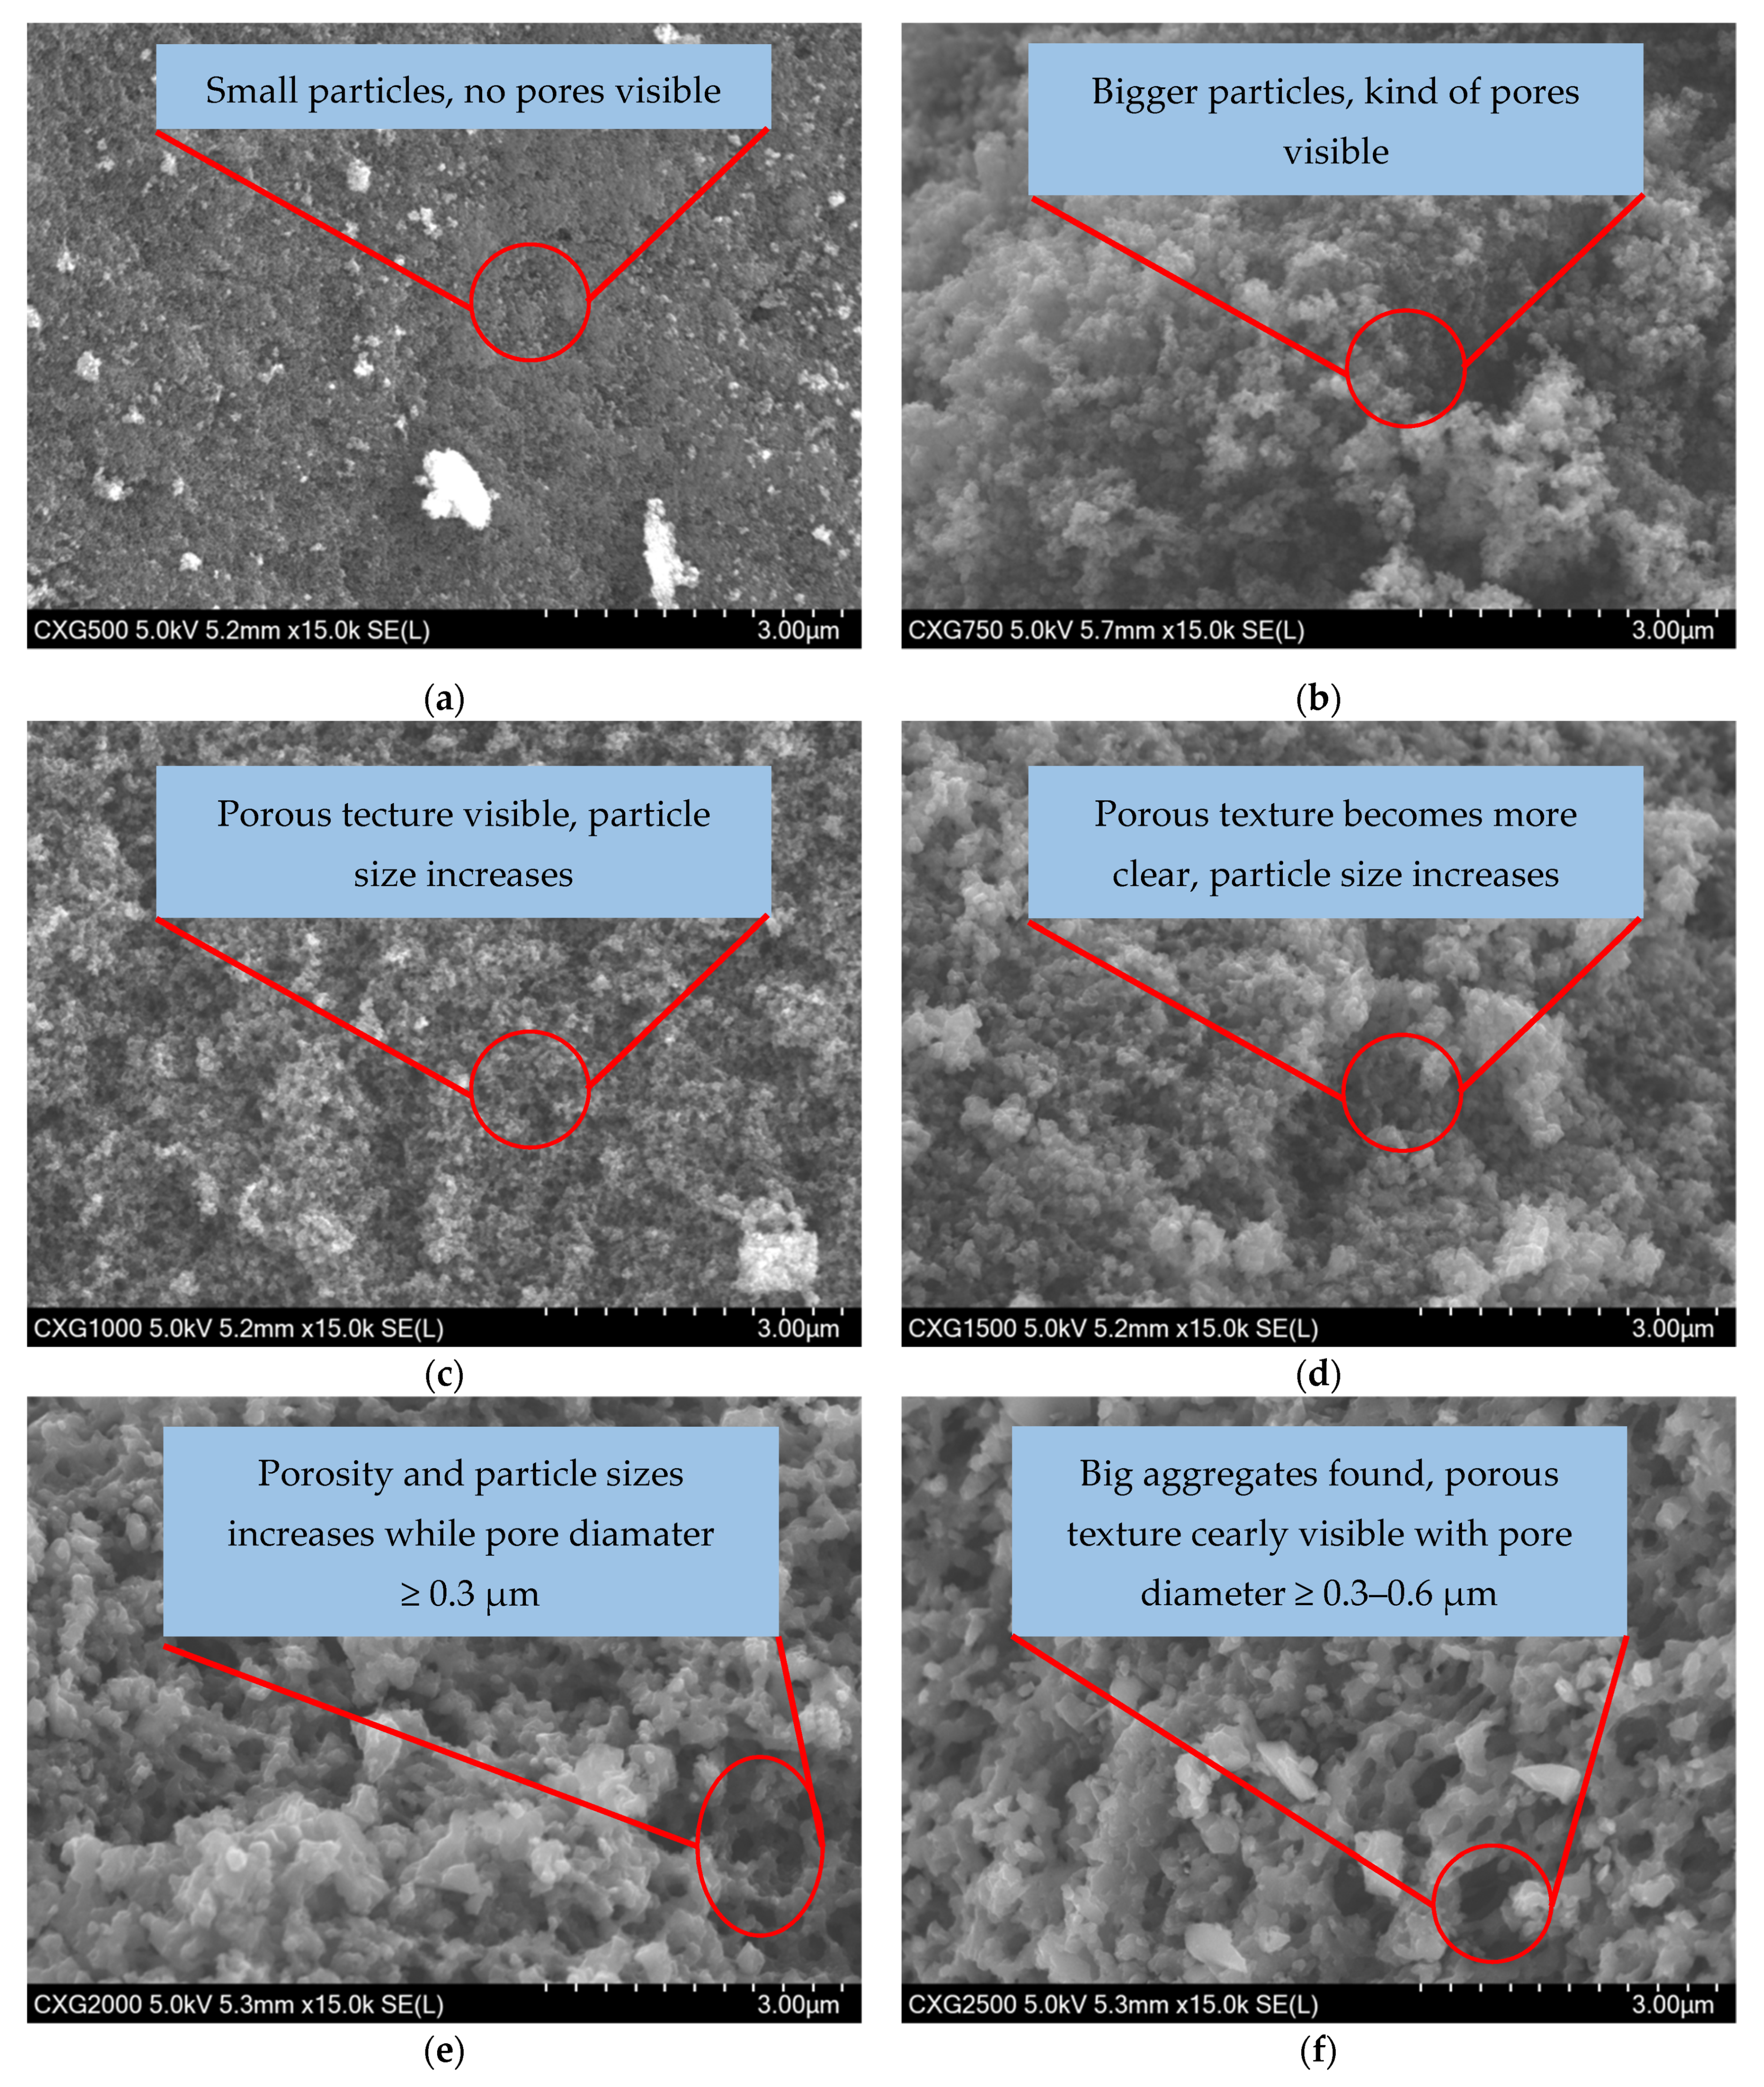
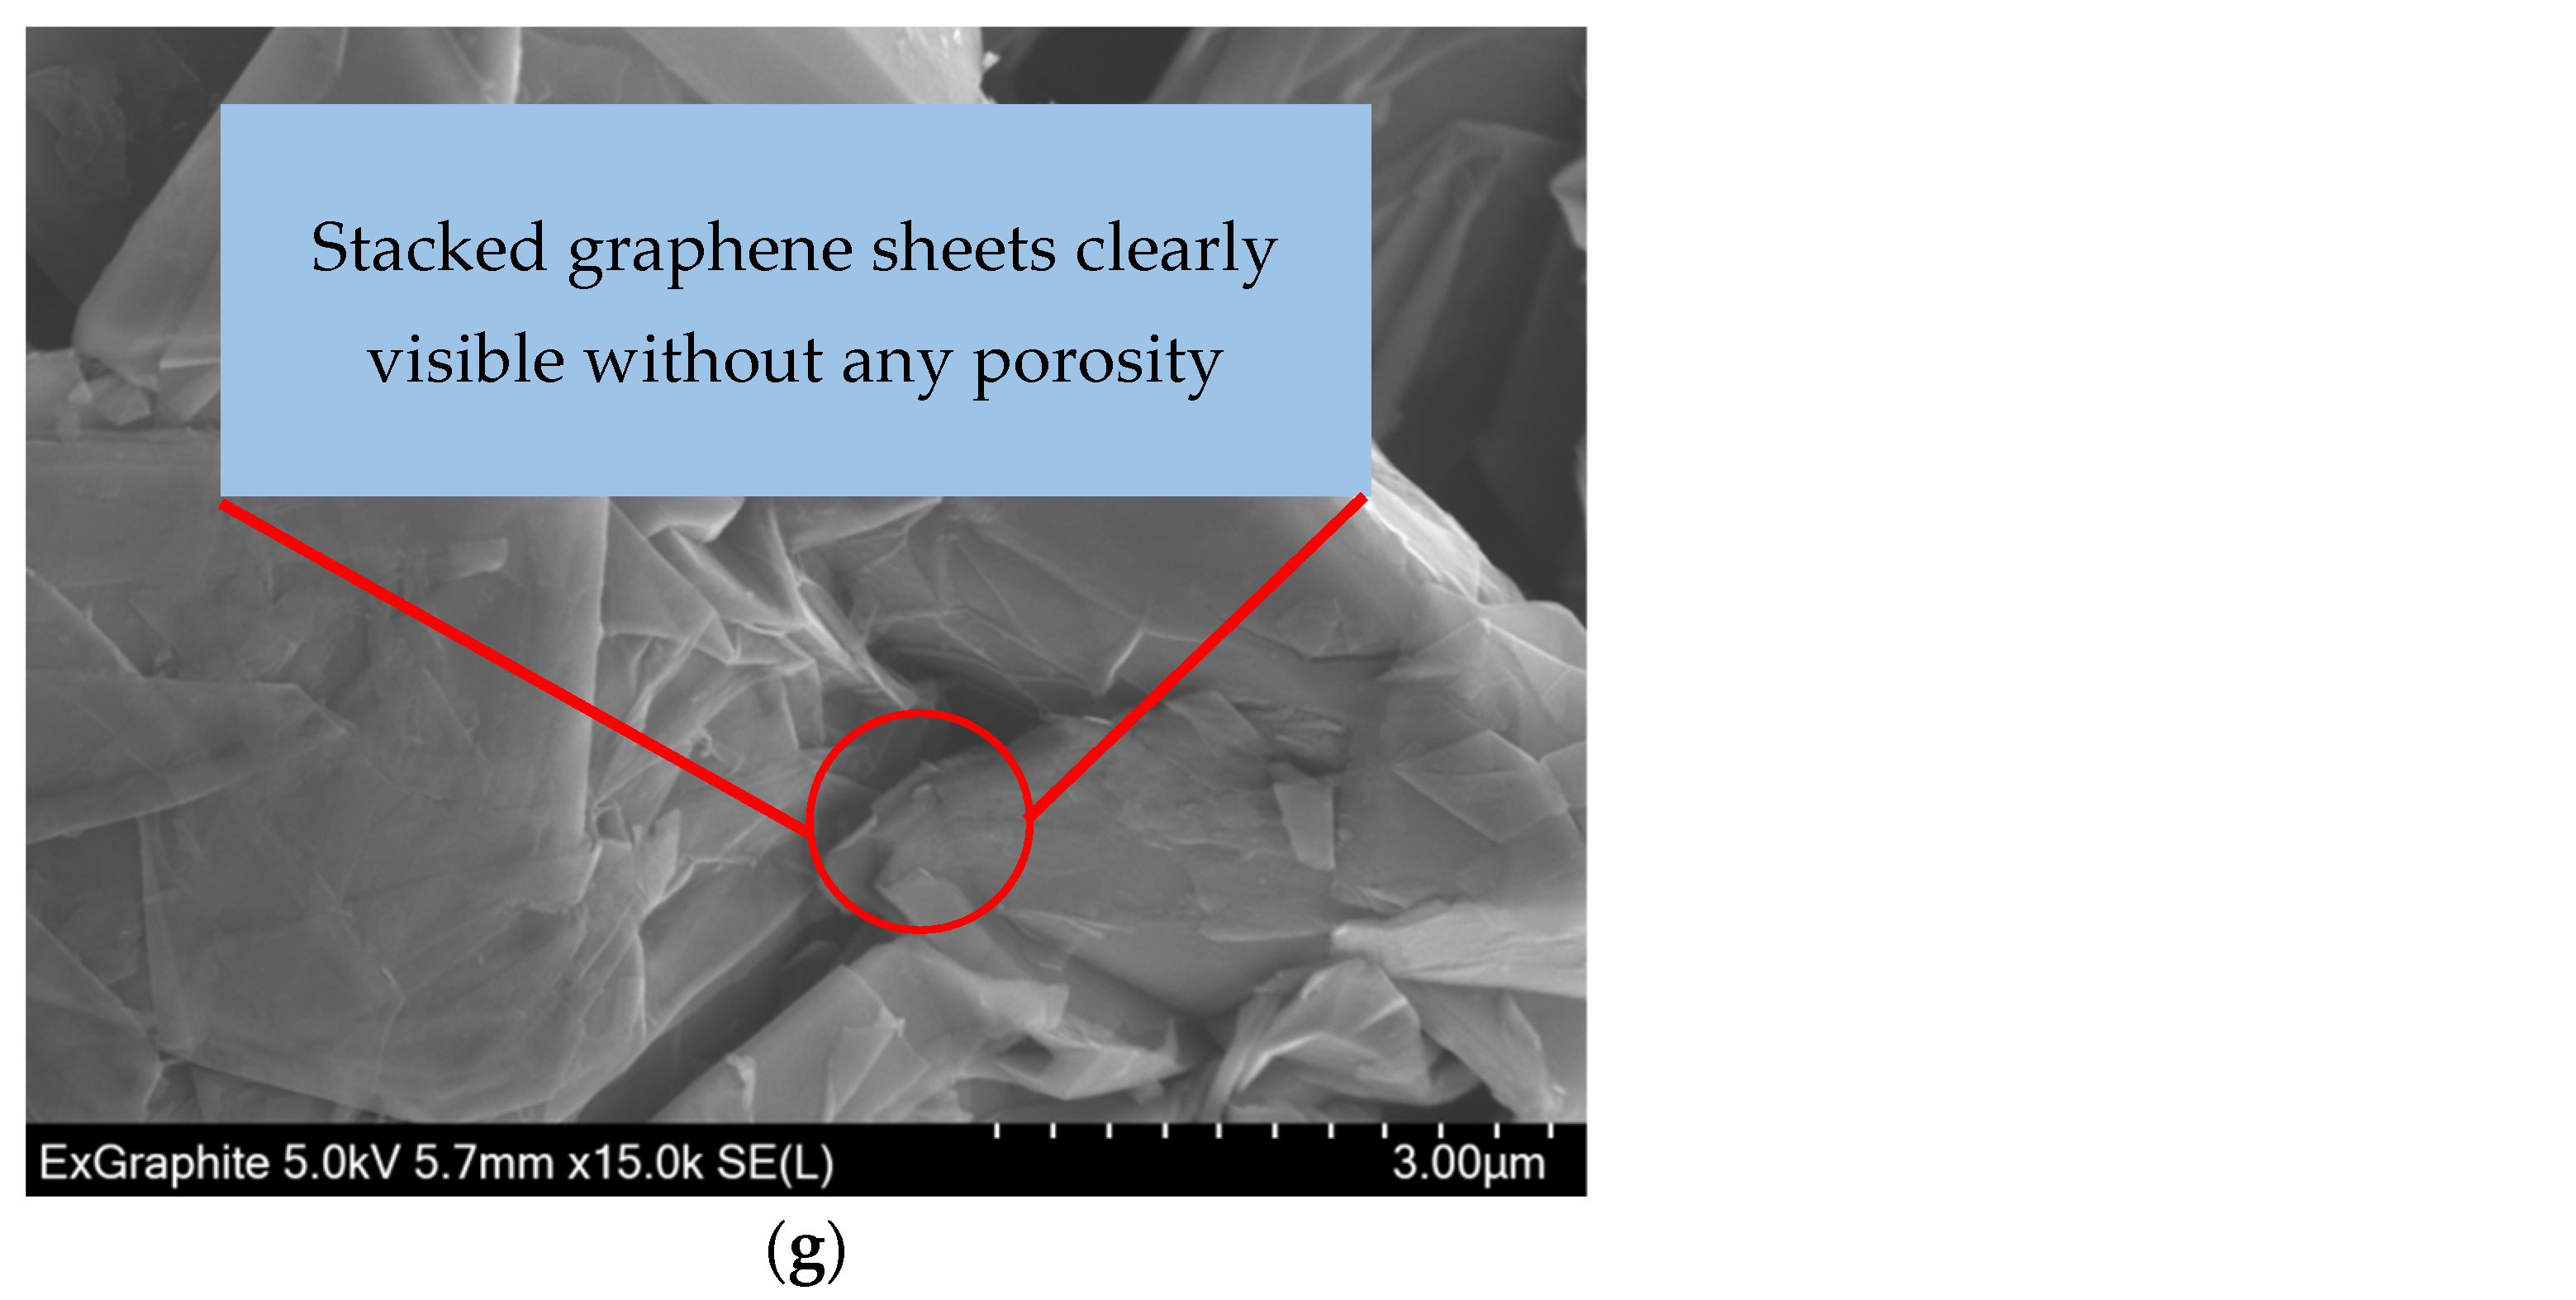
3.5. SEM
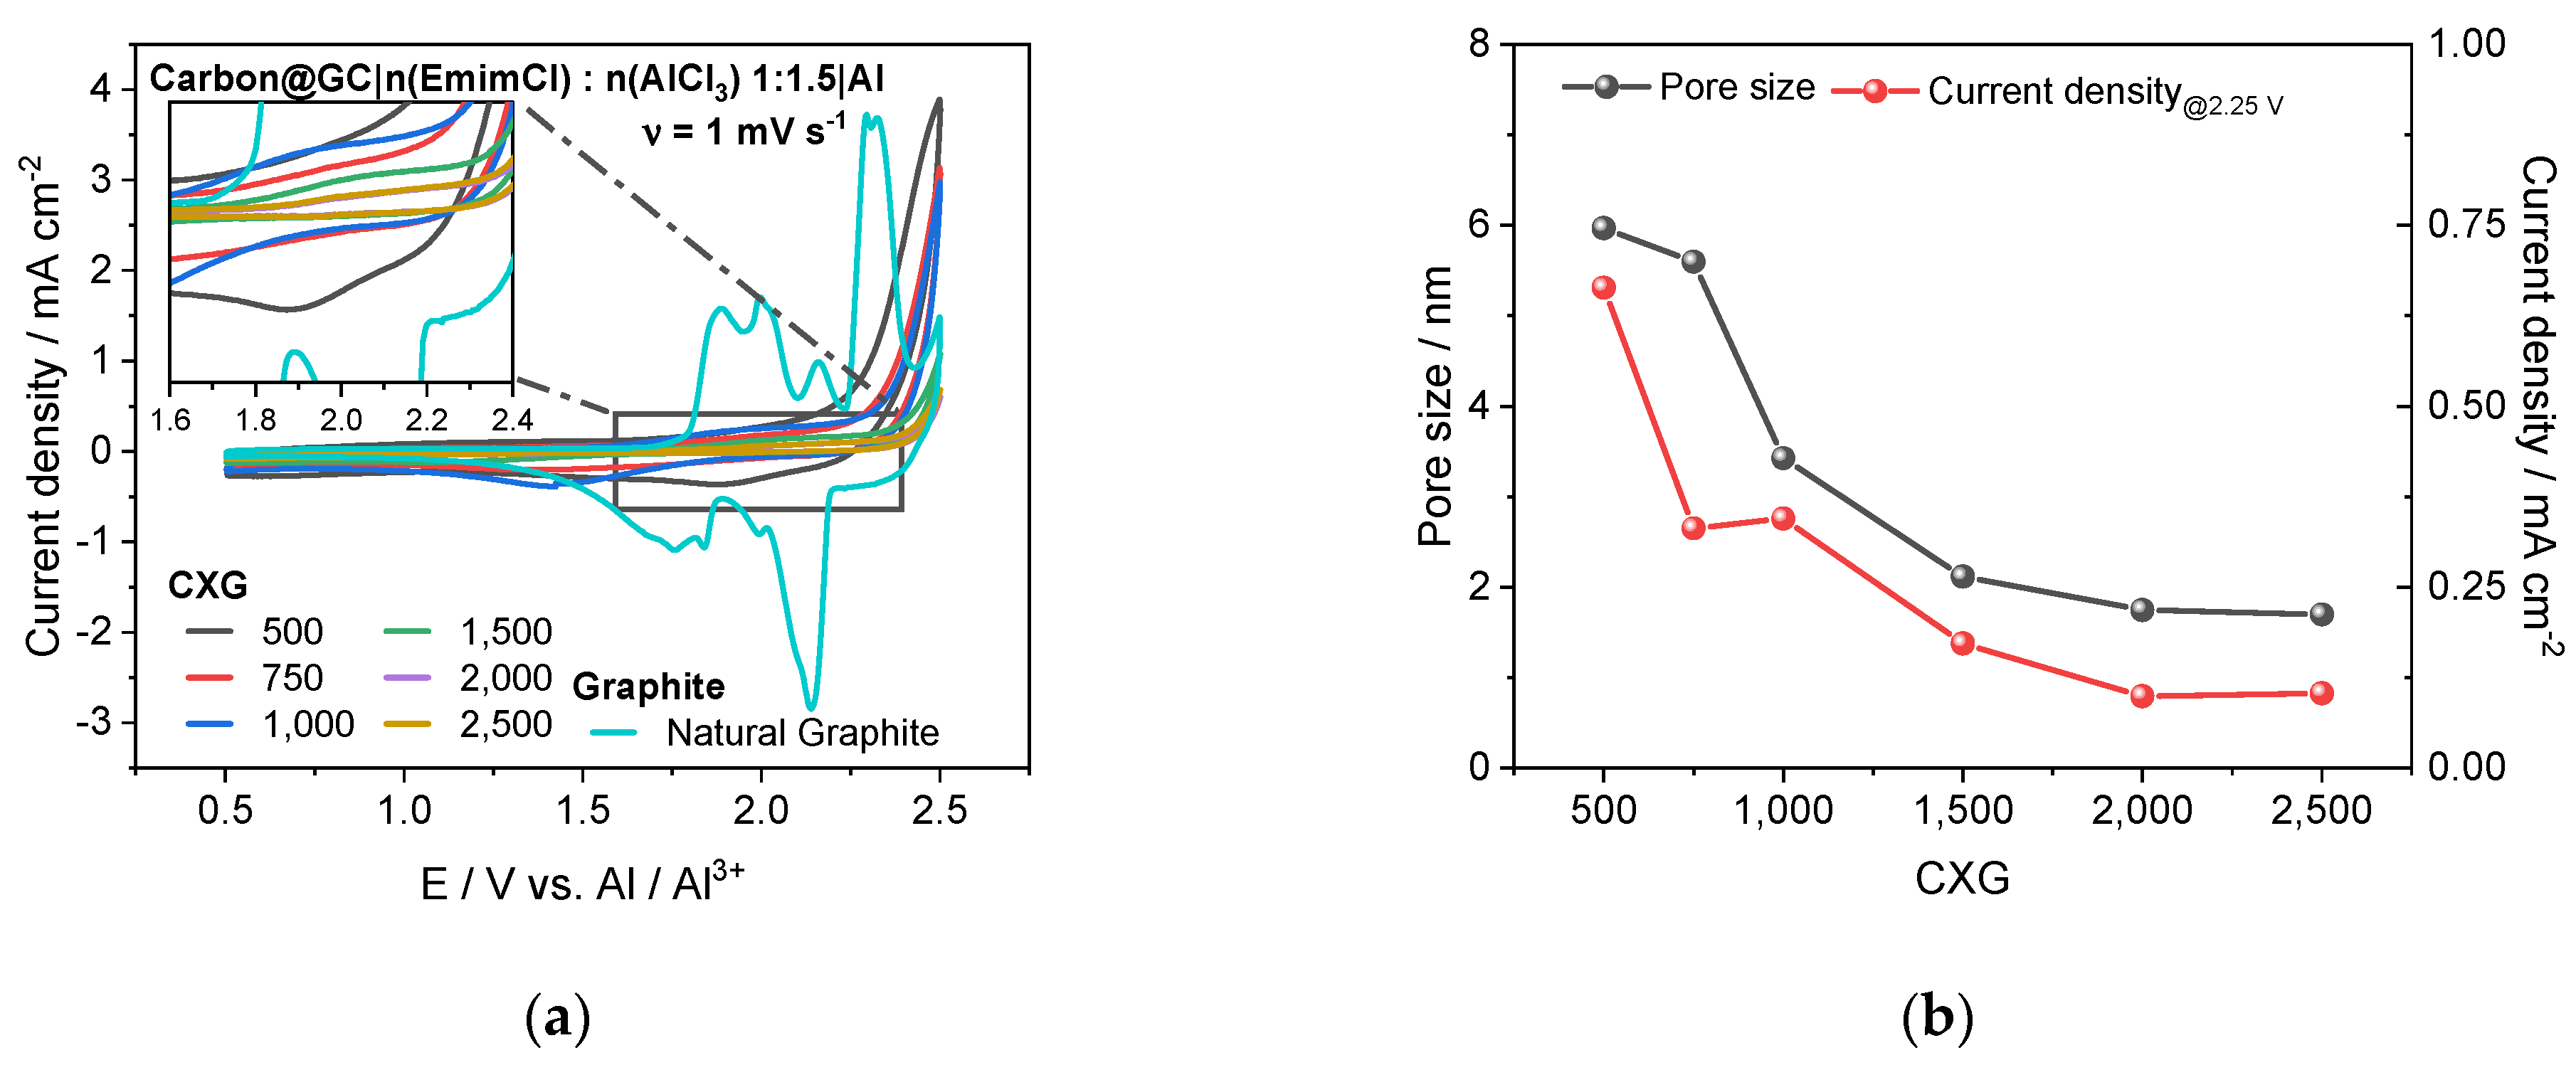
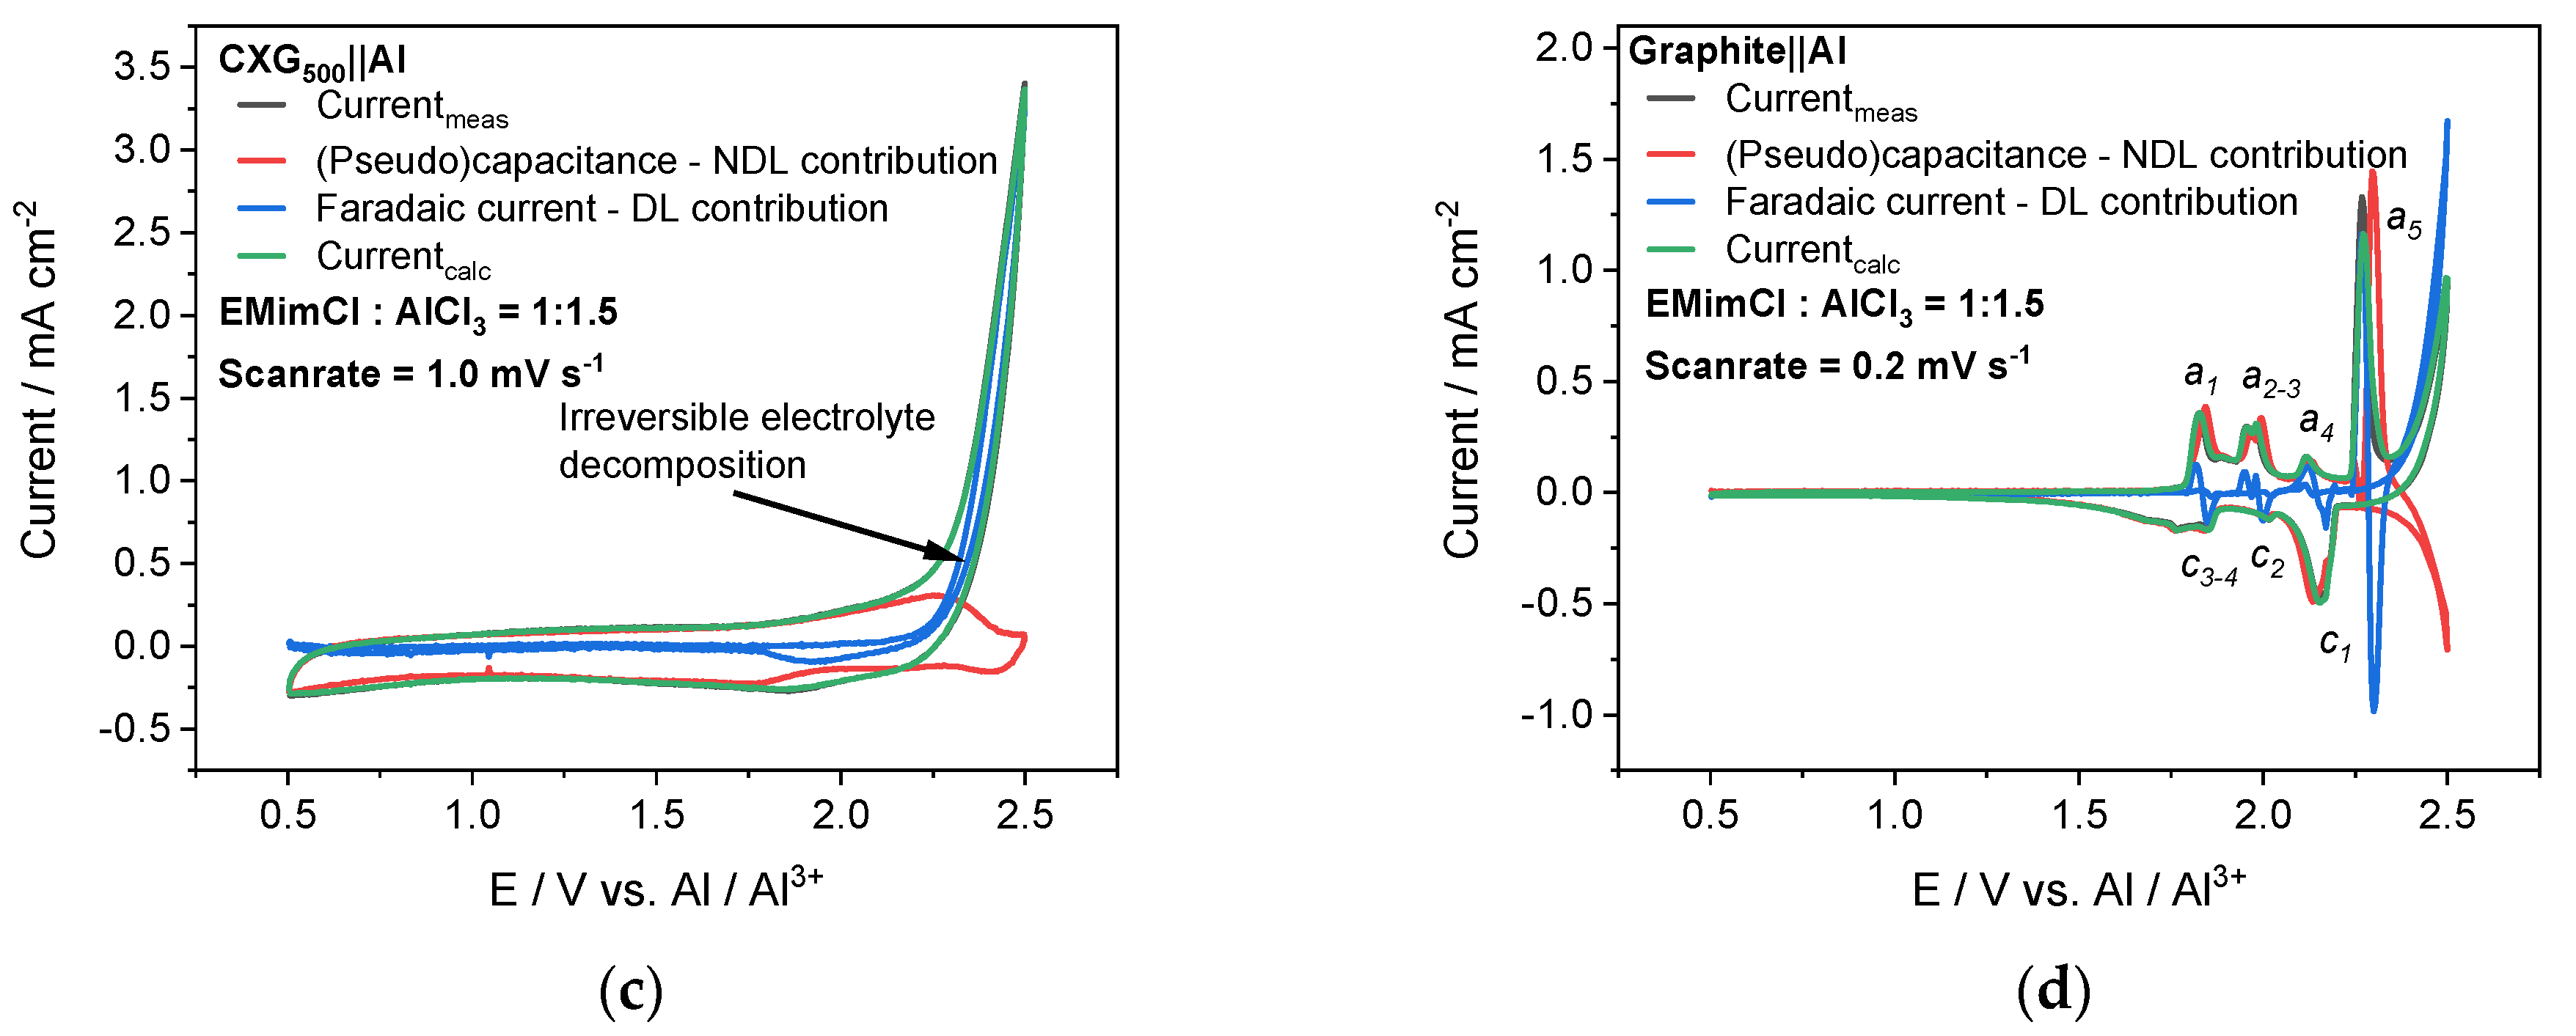
3.6. Half-Cell Experiments
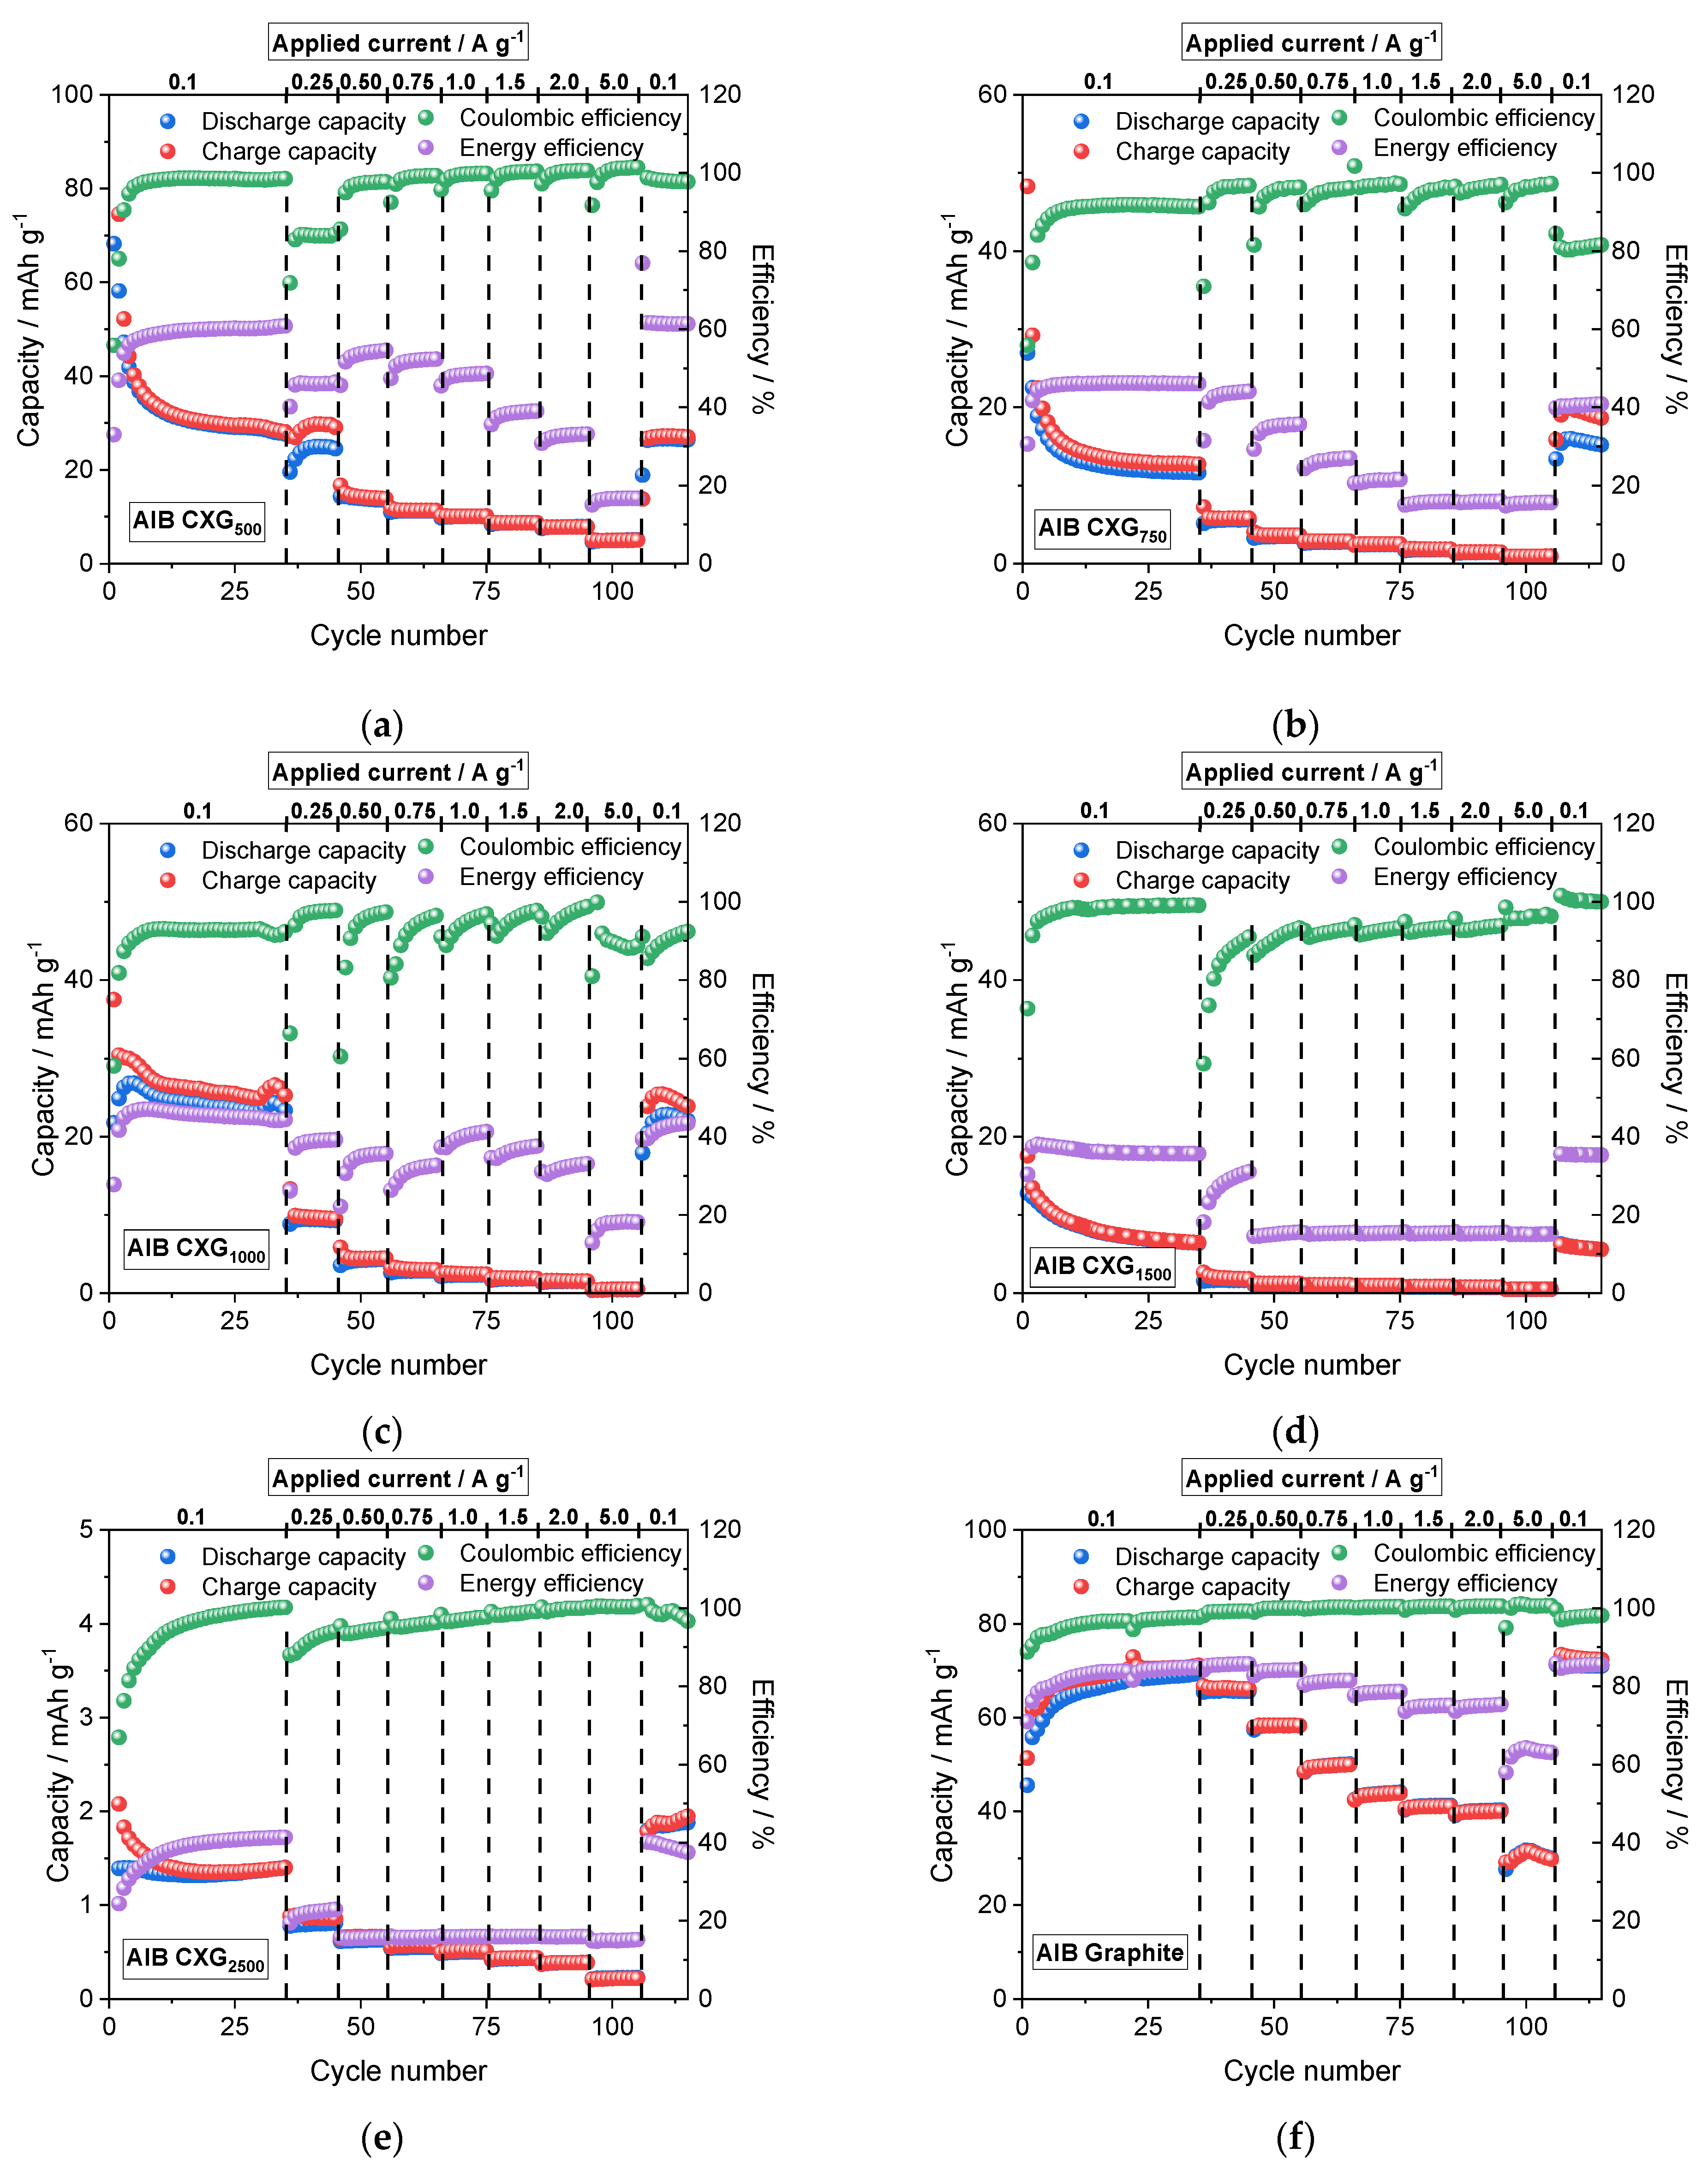
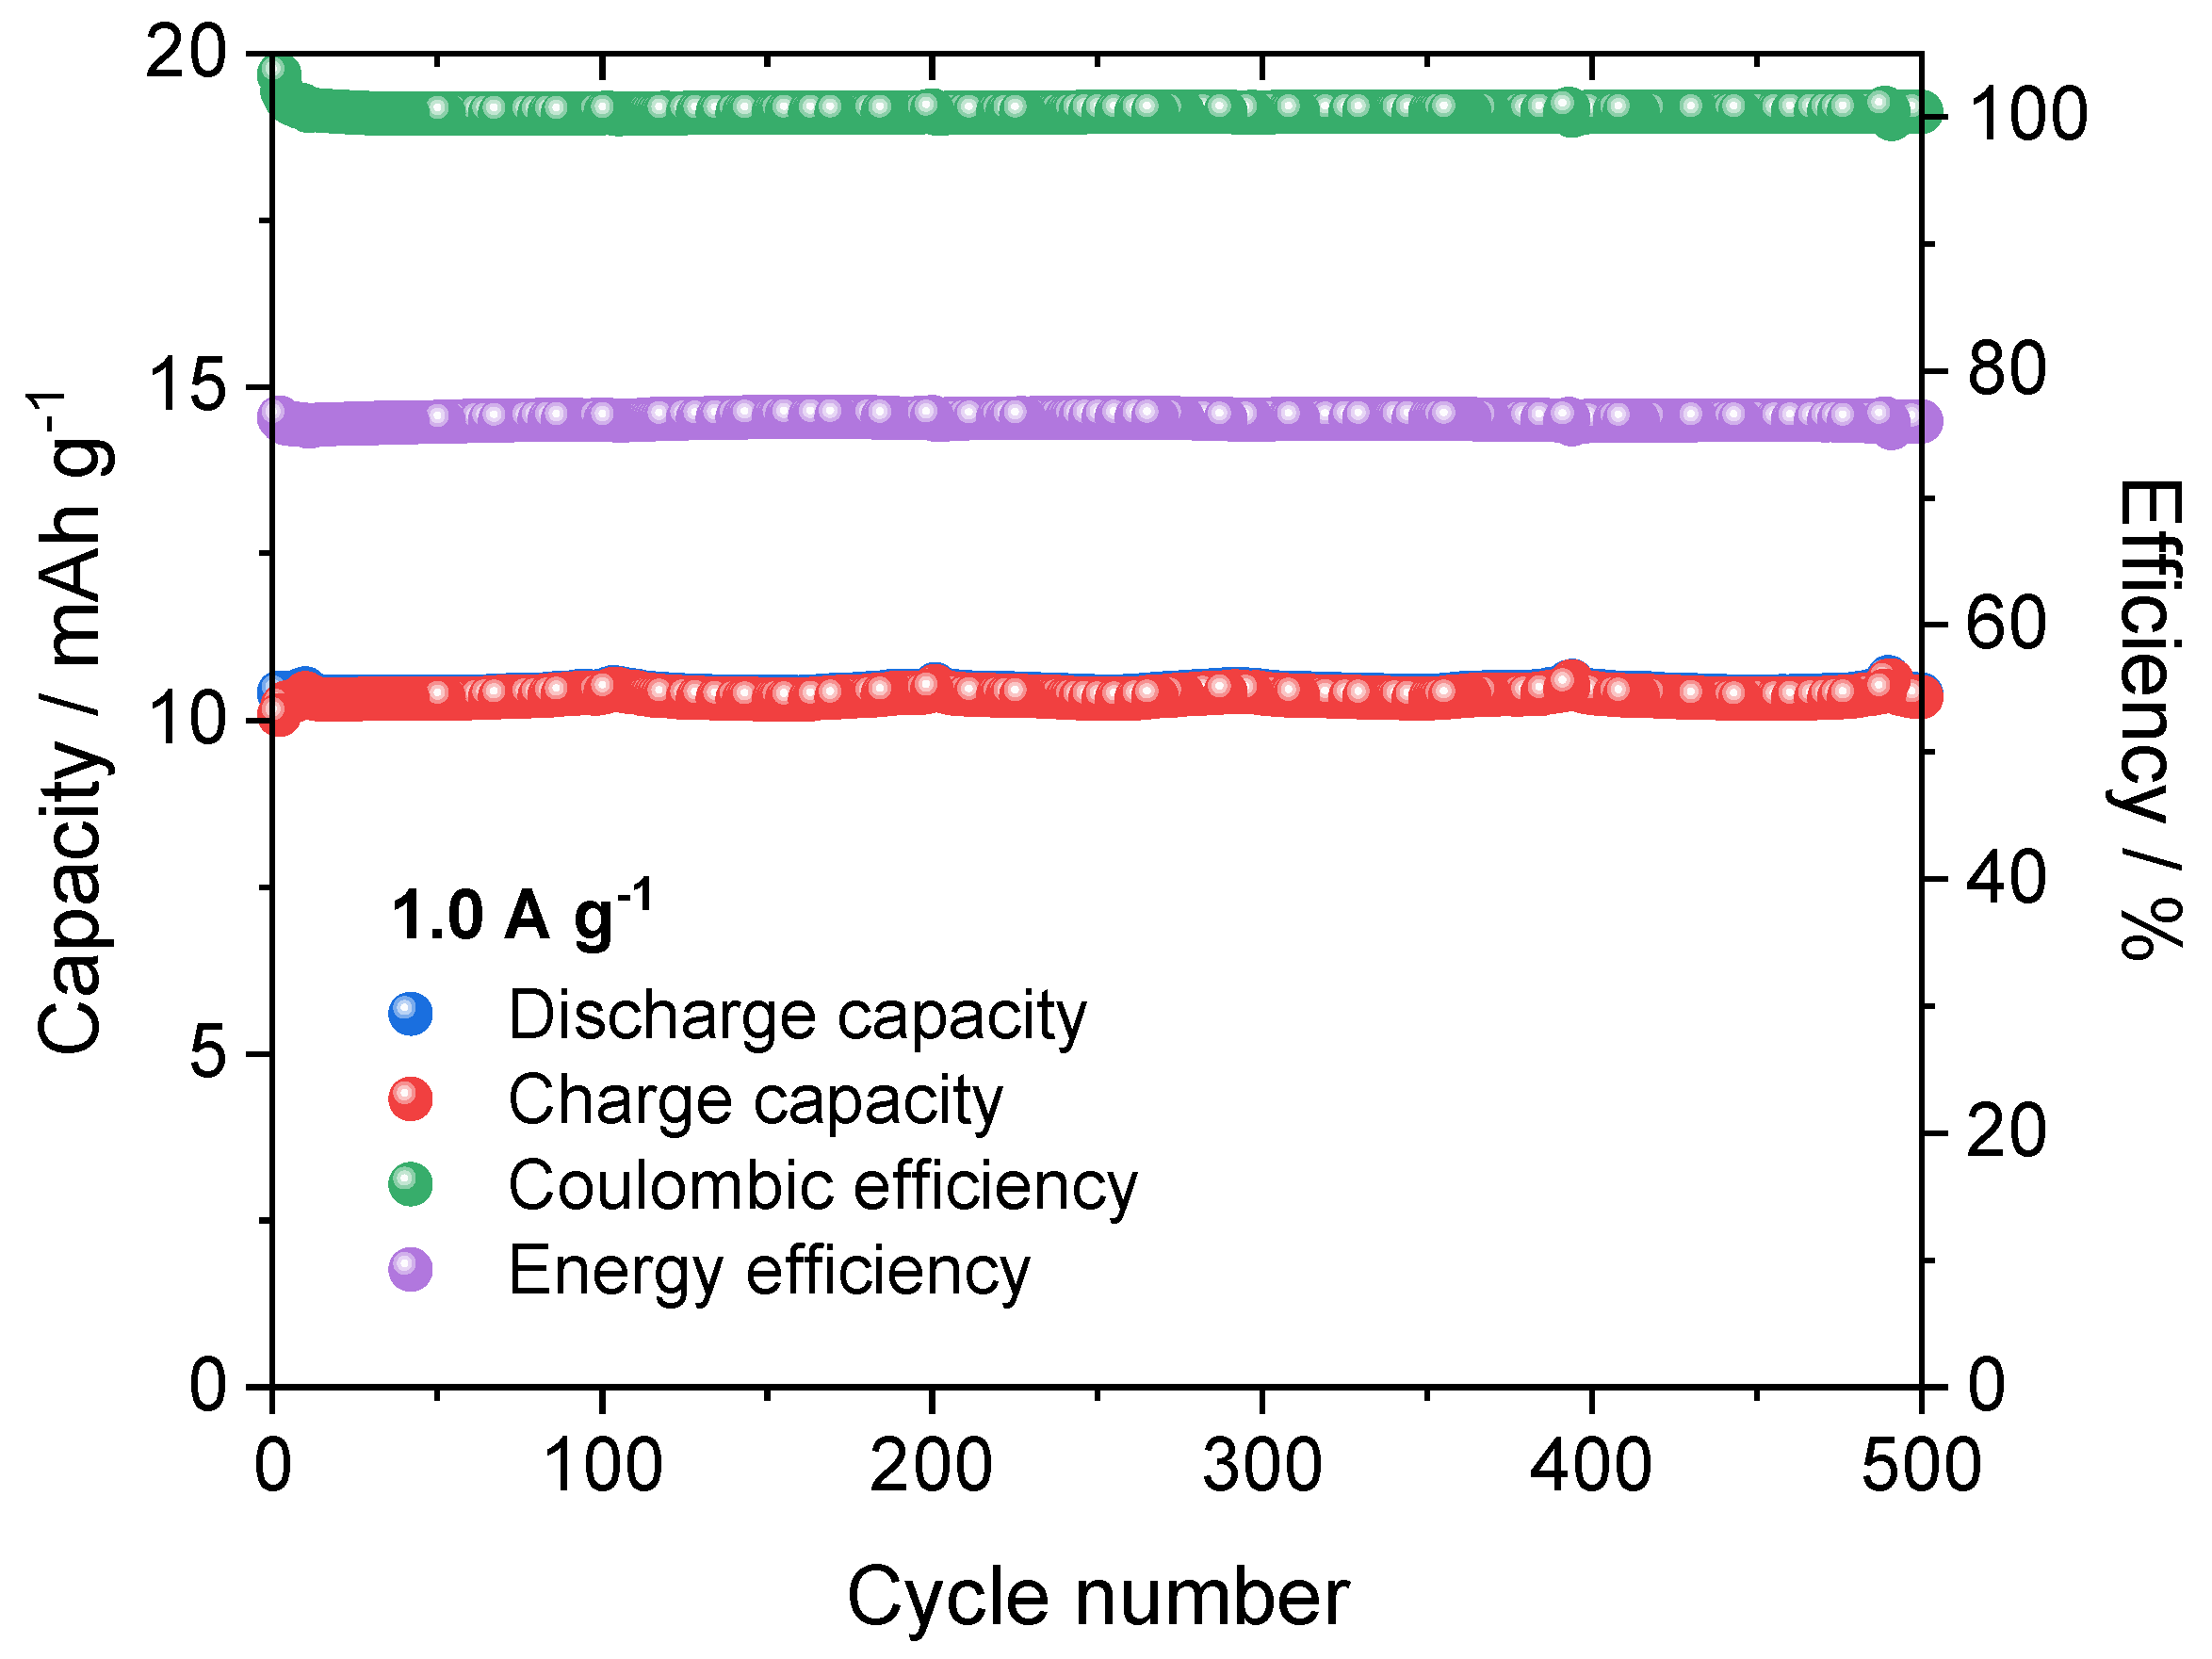
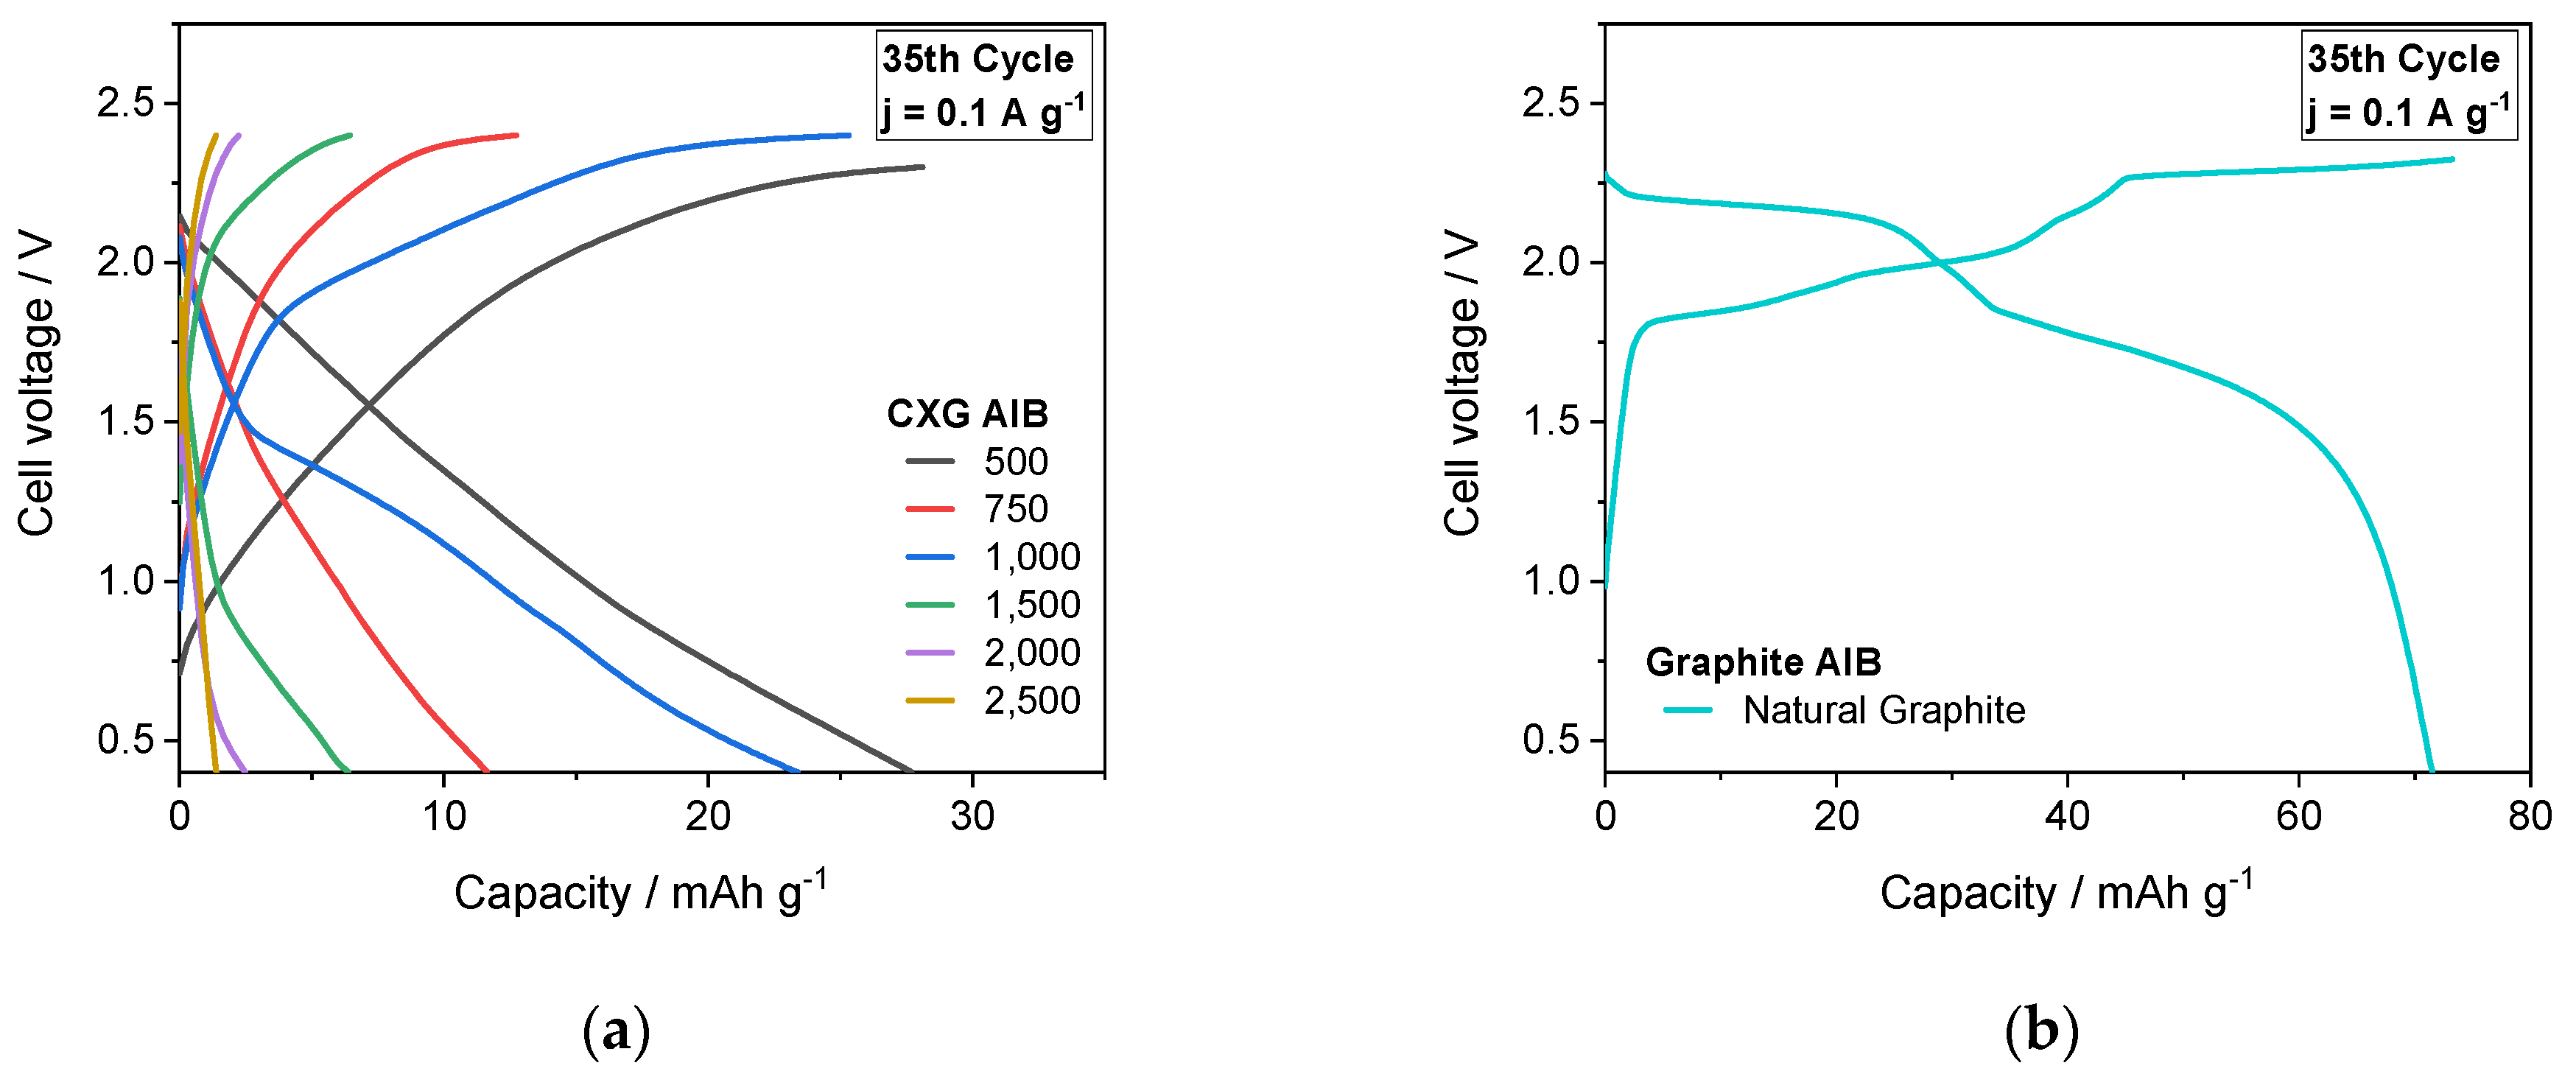
3.7. Cycling Performance of AIB Cells
4. Conclusions
Author Contributions
Funding
Acknowledgments
Conflicts of Interest
Appendix A

| CXG | Resistance Ω | Spec. Resistance Ω cm | Conductivity S cm−1 | Density g cm−3 |
|---|---|---|---|---|
| 50 | 0.400 | 2.565 | 0.390 | 0.781 |
| 500 | 1.040 | 4.012 | 0.249 | 0.469 |
| 750 | 1.573 | 4.522 | 0.221 | 0.340 |
| 1000 | 1.385 | 3.846 | 0.260 | 0.348 |
| 1500 | 1.252 | 3.522 | 0.284 | 0.334 |
| 2000 | 1.221 | 3.577 | 0.280 | 0.348 |
| 2500 | 1.186 | 3.665 | 0.273 | 0.382 |
| 3000 | 0.900 | 3.031 | 0.330 | 0.402 |
| 3500 | 1.124 | 3.640 | 0.275 | 0.403 |
| 4000 | 0.958 | 3.885 | 0.257 | 0.515 |
| 4500 | 0.905 | 4.044 | 0.247 | 0.555 |
| 5000 | 1.045 | 4.109 | 0.243 | 0.491 |
| 10,000 | 0.905 | 4.718 | 0.212 | 0.628 |
| 20,000 | 0.623 | 3.551 | 0.282 | 0.693 |
| NG | 0.017 | 0.052 | 19.322 | 0.782 |
| CXG | AreaDFT m2 g−1 | Fit Error % | Amic (DR) m2 g−1 | Ames m2 g−1 | Vsum cm3 g−1 | Vmic (DR) % | Vmes % | Pore Size nm |
|---|---|---|---|---|---|---|---|---|
| 500 | 1004 | 0.418 | 691 | 312 | 1.00 | 23.1 | 76.9 | 6.0 |
| 750 | 919 | 0.570 | 778 | 141 | 0.83 | 31.4 | 68.6 | 5.6 |
| 1000 | 894 | 0.194 | 717 | 177 | 0.50 | 47.8 | 52.2 | 3.4 |
| 1500 | 922 | 0.039 | 736 | 187 | 0.33 | 75.6 | 24.4 | 2.1 |
| 2000 | 918 | 0.037 | 716 | 202 | 0.27 | 88.5 | 11.5 | 1.7 |
| 2500 | 940 | 0.019 | 722 | 218 | 0.27 | 90.8 | 9.2 | 1.7 |
| 3000 | 948 | 0.037 | 763 | 184 | 0.27 | 95.5 | 4.5 | 1.7 |
| 3500 | 975 | 0.022 | 739 | 237 | 0.25 | 97.2 | 2.8 | 1.6 |
| 4000 | 915 | 0.131 | 726 | 189 | 0.25 | 95.3 | 4.7 | 1.6 |
| 4500 | 931 | 0.073 | 701 | 230 | 0.24 | 99.2 | 0.8 | 1.6 |
| 5000 | 934 | 0.077 | 717 | 217 | 0.24 | 98.4 | 1.6 | 1.6 |
| 10,000 | 926 | 0.217 | 724 | 201 | 0.25 | 98.0 | 2.0 | 1.6 |
| 20,000 | 911 | 0.017 | 689 | 222 | 0.25 | 92.7 | 7.3 | 1.6 |
| NG | 22 | 1.298 | / | 22 | 0.07 | 57.1 | 42.9 | 13.0 |
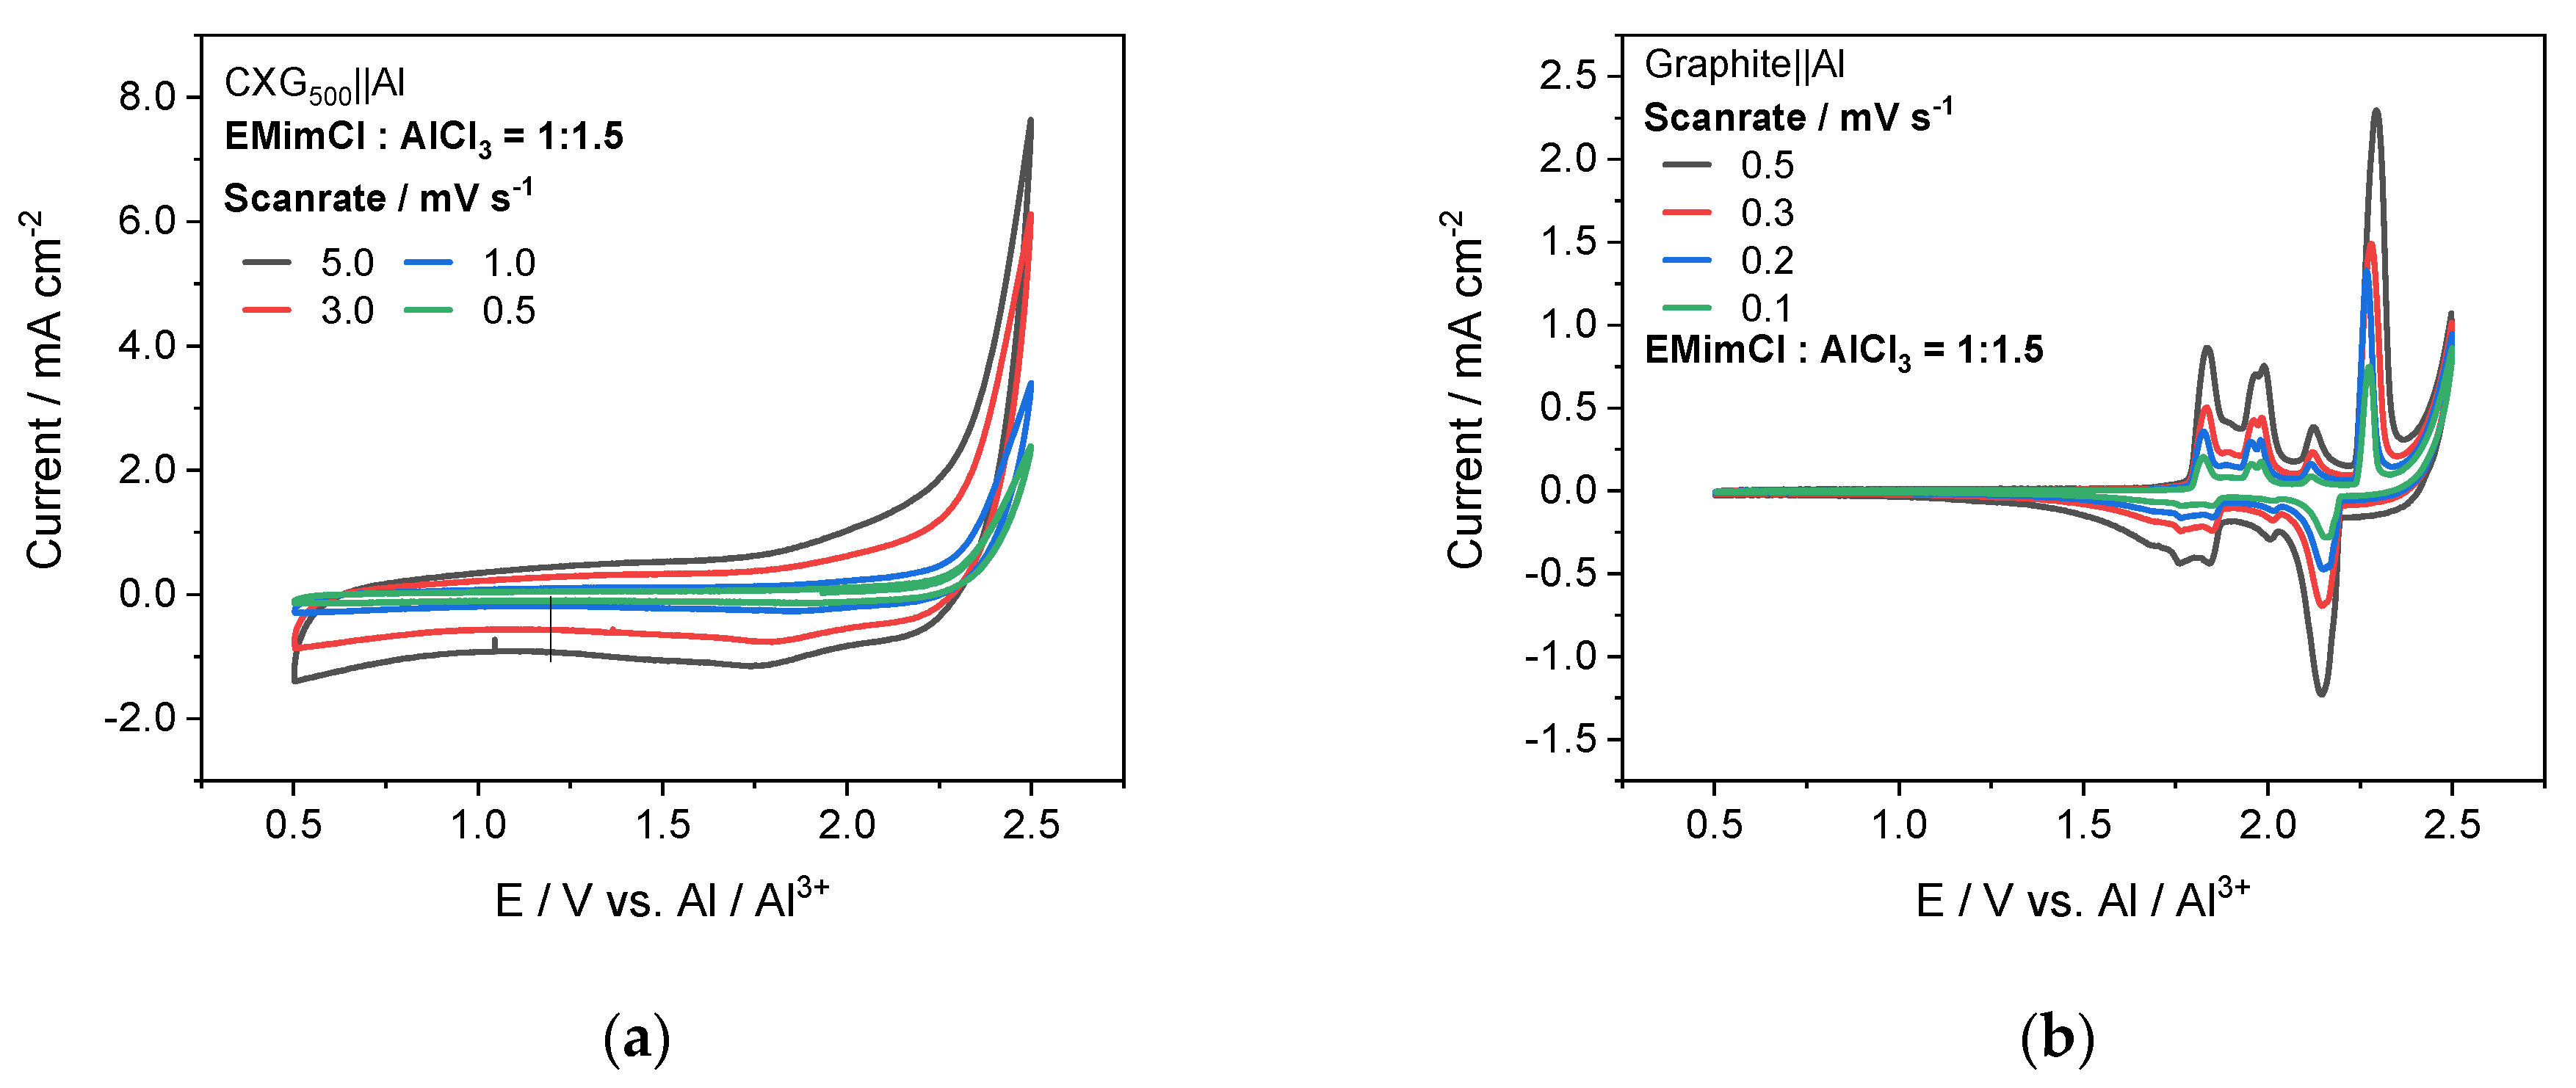
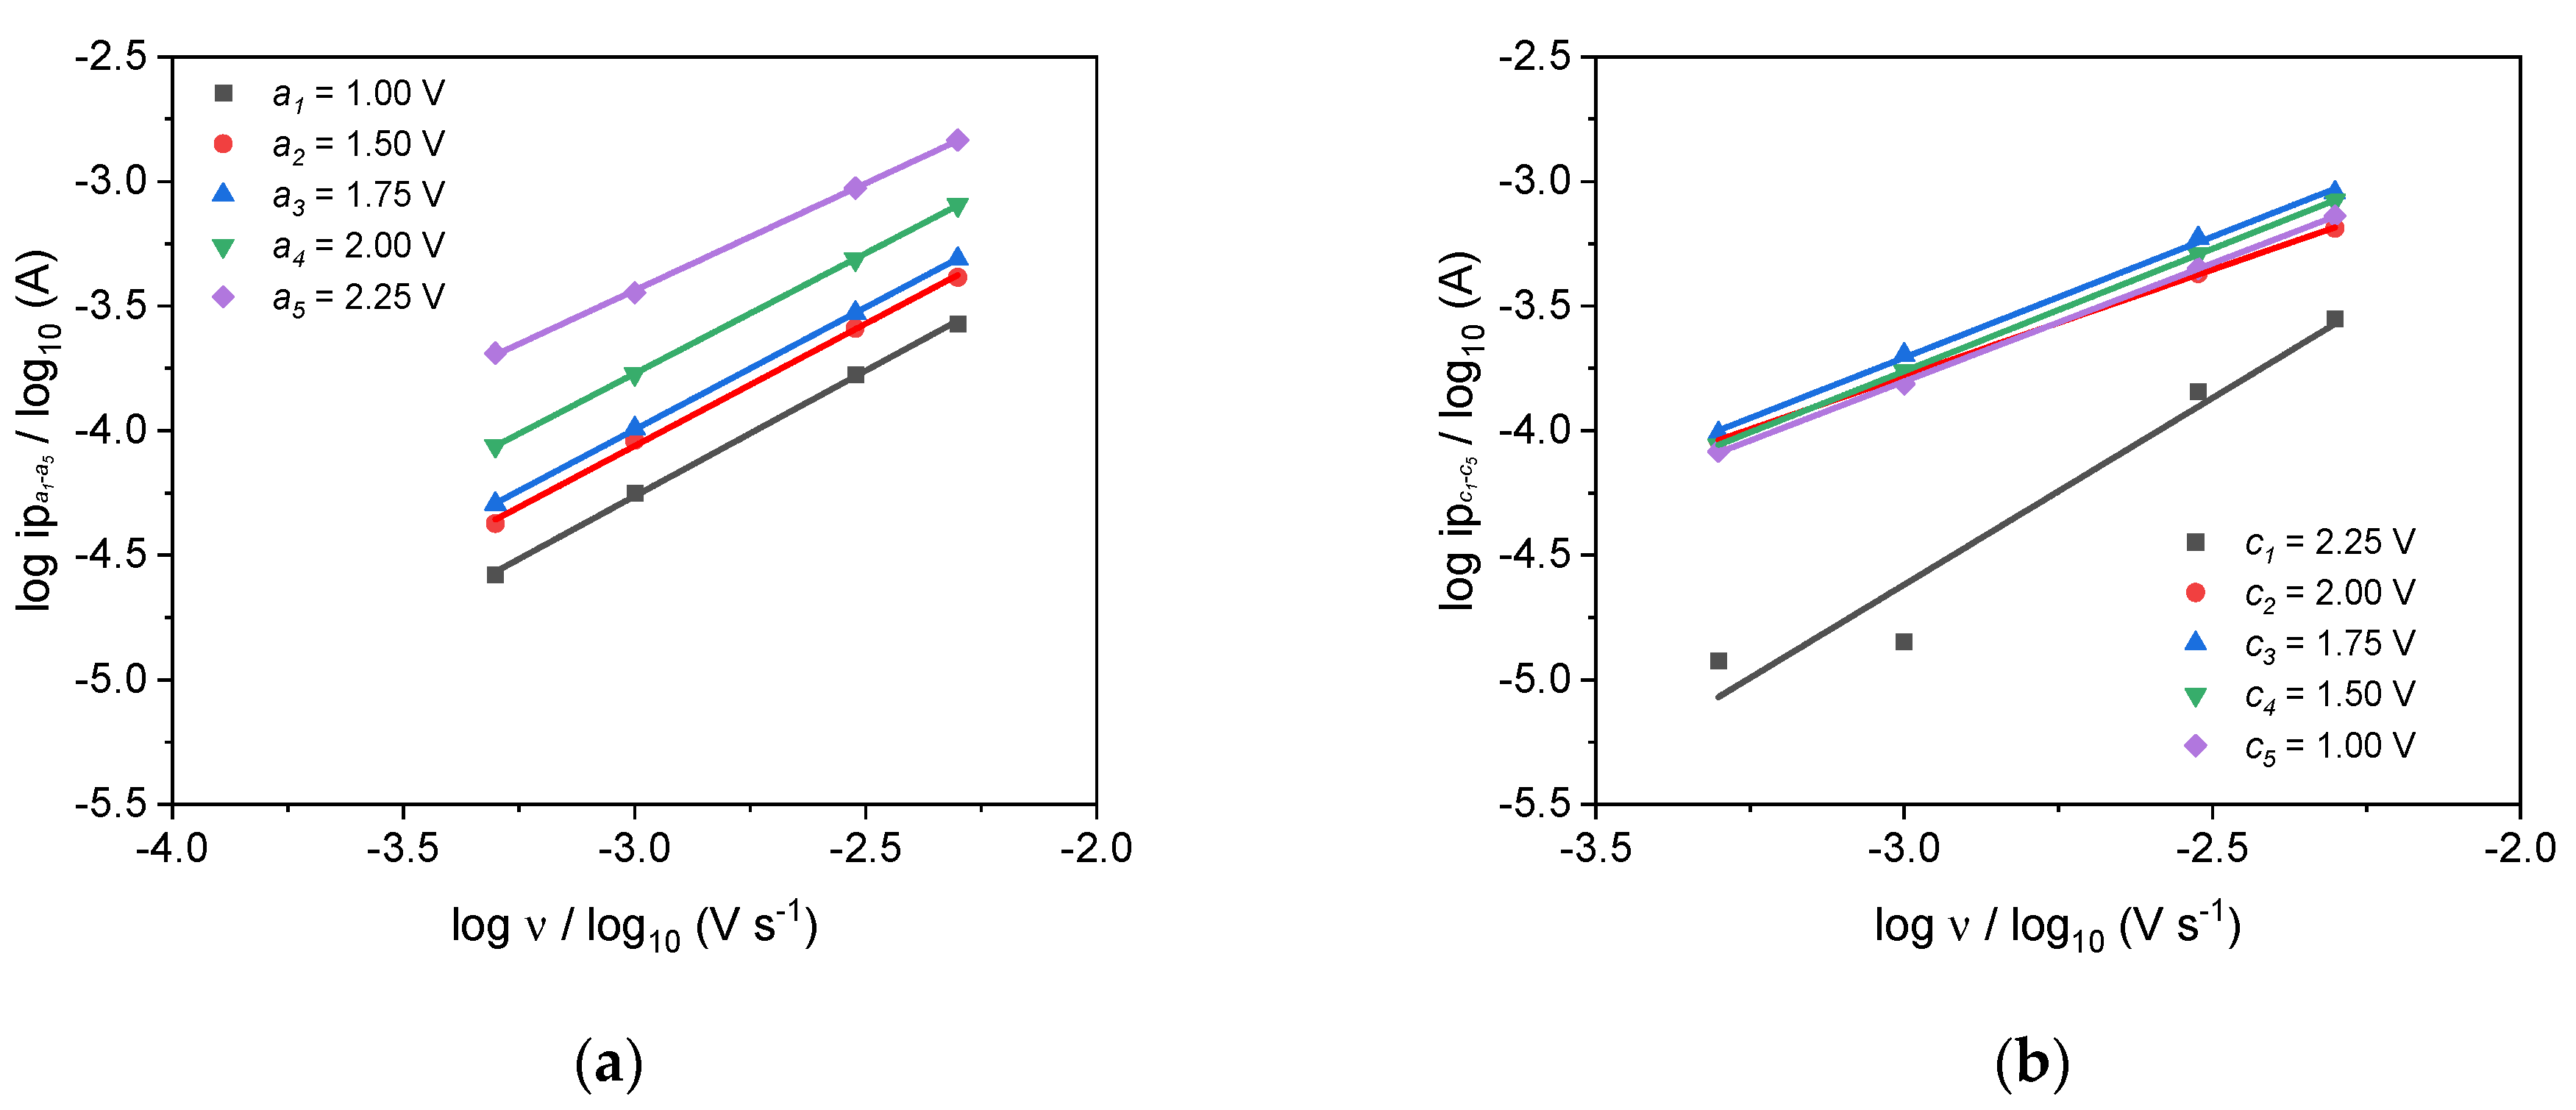

| b-Value (Lindström’s Method) | Anodic | a1 | a2 | a3 | a4 | a5 |
| 1.01 | 0.98 | 0.98 | 0.97 | 0.86 | ||
| Cathodic | c1 | c2 | c3 | c4 | c5 | |
| 1.50 | 0.85 | 0.97 | 0.98 | 0.95 | ||
| Charge mC | Rel. Charge Ratio % | |||||
| QMeasured | 968 | - | ||||
| QCalculated * | 1019 | 100 | ||||
| QFarad | 544 | QFarad/QCalculated | 53 | |||
| Q(Pseudo)cap | 475 | Q(Pseudo)cap/QCalculated | 47 | |||
| QEDLC | 445 | QEDLC/Q(Pseudo)cap | 94 | |||
| QPseudocap | 30 | QPseudocap/Q(Pseudo)cap | 6 | |||
| Error (measured vs. calculated charge/%) | 5 | |||||
| b-Value (Lindström’s Method) | Anodic | a1 | a2 | a3 | a4 | a5 |
| 0.89 | 0.91 | 0.90 | 0.91 | 0.67 | ||
| Cathodic | c1 | c2 | c3 | c4 | c5 | |
| 0.91 | 0.97 | 0.97 | 0.97 | 0.97 | ||
| Charge mC | Rel. Charge Ratio % | |||||
| QMeasured | 1110 | 100 | ||||
| QEDLC | 97 | QEDLC/QMeasured | 8 | |||
References
- Kurzweil, P. Lithiumionen-Batterien. In Elektrochemische Speicher: Superkondensatoren, Batterien, Elektrolyse-Wasserstoff, Rechtliche Grundlagen; Kurzweil, P., Dietlmeier, O.K., Eds.; Springer Fachmedien Wiesbaden: Wiesbaden, Germany, 2015; pp. 157–254. [Google Scholar] [CrossRef]
- Gruber, P.W.; Medina, P.A.; Keplerian, G.A.; Kesler, S.E.; Everson, M.P.; Wallington, T.J. Global Lithium Availability: A constraint for electric vehicles? J. Ind. Ecol. 2011, 15, 760–775. [Google Scholar] [CrossRef]
- Speirs, J.; Contestabile, M.; Houari, Y.; Gross, R. The future of lithium availability for electric vehicle batteries. Renew. Sustain. Energy Rev. 2014, 35, 183–193. [Google Scholar] [CrossRef]
- Zhang, M.; Song, X.; Ou, X.; Tang, Y. Rechargeable batteries based on anion intercalation graphite cathodes. Energy Storage Mater. 2019, 16, 65–84. [Google Scholar] [CrossRef]
- Wang, G.; Yu, M.; Wang, J.; Li, D.; Tan, D.; Löffler, M.; Zhuang, X.; Müllen, K.; Feng, X. Self-Activating, Capacitive Anion Intercalation Enables High-Power Graphite Cathodes. Adv. Mater. 2018, 30, 1800533. [Google Scholar] [CrossRef] [PubMed]
- Elia, G.A.; Kyeremateng, N.A.; Marquardt, K.; Hahn, R. An Aluminum/Graphite Battery with Ultra-High Rate Capability. Batter. Supercaps 2019, 2, 83–90. [Google Scholar] [CrossRef]
- Ambroz, F.; Macdonald, T.J.; Nann, T. Trends in Aluminium-Based Intercalation Batteries. Adv. Energy Mater. 2017, 7, 1602093. [Google Scholar] [CrossRef]
- Wang, S.; Kravchyk, K.; Krumeich, F.; Kovalenko, M.V. Kish Graphite Flakes as a Cathode Material for an Aluminum Chloride–Graphite Battery. ACS Appl. Mater. Interfaces 2017, 9, 28478–28485. [Google Scholar] [CrossRef]
- Kravchyk, K.V.; Wang, S.; Piveteau, L.; Kovalenko, M.V. Efficient Aluminum Chloride–Natural Graphite Battery. Chem. Mater. 2017, 29, 4484–4492. [Google Scholar] [CrossRef] [Green Version]
- Wang, D.-Y.; Wei, C.-Y.; Lin, M.-C.; Pan, C.-J.; Chou, H.-L.; Chen, H.-A.; Gong, M.; Wu, Y.; Yuan, C.; Angell, M.; et al. Advanced rechargeable aluminium ion battery with a high-quality natural graphite cathode. Nat. Commun. 2017, 8, 14283. [Google Scholar] [CrossRef]
- Lin, M.-C.; Gong, M.; Lu, B.; Wu, Y.; Wang, D.-Y.; Guan, M.; Angell, M.; Chen, C.; Yang, J.; Hwang, B.-J.; et al. An ultrafast rechargeable aluminium-ion battery. Nature 2015, 520, 324–328. [Google Scholar] [CrossRef]
- Jache, M.S.B.; Adelhelm, P. Use of Graphite as a Highly Reversible Electrode with Superior Cycle Life for Sodium-Ion Batteries by Making Use of Co-Intercalation Phenomena. Angew. Chem. Int. Ed. 2014, 53, 10169–10173. [Google Scholar] [CrossRef] [PubMed]
- Das, S.K. Graphene: A Cathode Material of Choice for Aluminum-Ion Batteries. Angew. Chem. Int. Ed. 2018, 57, 16606–16617. [Google Scholar] [CrossRef] [PubMed]
- Chen, H.; Xu, H.; Wang, S.; Huang, T.; Xi, J.; Cai, S.; Guo, F.; Xu, Z.; Gao, W.; Gao, C. Ultrafast all-climate aluminum-graphene battery with quarter-million cycle life. Sci. Adv. 2017, 3, eaao7233. [Google Scholar] [CrossRef] [PubMed] [Green Version]
- Yu, X.; Wang, B.; Gong, D.; Xu, Z.; Lu, B. Graphene Nanoribbons on Highly Porous 3D Graphene for High-Capacity and Ultrastable Al-Ion Batteries. Adv. Mater. 2017, 29, 1604118. [Google Scholar] [CrossRef] [PubMed]
- Chen, H.; Chen, C.; Liu, Y.; Zhao, X.; Ananth, N.; Zheng, B.; Peng, L.; Huang, T.; Gao, W.; Gao, C. High-Quality Graphene Microflower Design for High-Performance Li-S and Al-Ion Batteries. Adv. Energy Mater. 2017, 7, 1700051. [Google Scholar] [CrossRef]
- Yang, G.Y.; Chen, L.; Jiang, P.; Guo, Z.Y.; Wang, W.; Liu, Z.P. Fabrication of tunable 3D graphene mesh network with enhanced electrical and thermal properties for high-rate aluminum-ion battery application. RSC Adv. 2016, 6, 47655–47660. [Google Scholar] [CrossRef]
- Smajic, J.; Alazmi, A.; Batra, N.; Palanisamy, T.; Anjum, D.H.; Costa, P.M.F.J. Mesoporous Reduced Graphene Oxide as a High Capacity Cathode for Aluminum Batteries. Small 2018, 14, e1803584. [Google Scholar] [CrossRef] [Green Version]
- Lee Bray (USGS), Aluminum, (n.d.). Available online: https://pubs.usgs.gov/periodicals/mcs2020/mcs2020-aluminum.pdf (accessed on 5 November 2020).
- Olson, D.W. (USGS), Graphite (Natural), (n.d.). Available online: https://pubs.usgs.gov/periodicals/mcs2020/mcs2020-graphite.pdf (accessed on 5 November 2020).
- Liu, Z.; Wang, J.; Ding, H.; Chen, S.; Yu, X.; Lu, B. Carbon Nanoscrolls for Aluminum Battery. ACS Nano 2018, 12, 8456–8466. [Google Scholar] [CrossRef]
- Yamagata, S.; Takahara, I.; Wang, M.; Mizoguchi, T.; Yagi, S. EQCM analysis of intercalation species into graphite positive electrodes for Al batteries. J. Alloy. Compd. 2020, 846, 156469. [Google Scholar] [CrossRef]
- Takahashi, S.; Koura, N.; Kohara, S.; Saboungi, M.-L.; Curtiss, L. Technological and scientific issues of room-temperature molten salts. Plasmas Ions 1999, 2, 91–105. [Google Scholar] [CrossRef]
- Lei, H.; Tu, J.; Yu, Z.; Jiao, S. Exfoliation Mechanism of Graphite Cathode in Ionic Liquids. ACS Appl. Mater. Interfaces 2017, 9, 36702–36707. [Google Scholar] [CrossRef] [PubMed]
- Benzigar, M.R.; Talapaneni, S.N.; Joseph, S.; Ramadass, K.; Singh, G.; Scaranto, J.; Ravon, U.; Al-Bahily, K.; Vinu, A. Recent advances in functionalized micro and mesoporous carbon materials: Synthesis and applications. Chem. Soc. Rev. 2018, 47, 2680–2721. [Google Scholar] [CrossRef] [PubMed]
- Galeano, C.; Meier, J.C.; Peinecke, V.; Bongard, H.; Katsounaros, I.; Topalov, A.A.; Lu, A.; Mayrhofer, K.J.J.; Schüth, F. Toward Highly Stable Electrocatalysts via Nanoparticle Pore Confinement. J. Am. Chem. Soc. 2012, 134, 20457–20465. [Google Scholar] [CrossRef] [PubMed]
- Lu, A.-H.; Schüth, F. Nanocasting: A Versatile Strategy for Creating Nanostructured Porous Materials. Adv. Mater. 2006, 18, 1793–1805. [Google Scholar] [CrossRef]
- Masuda, H.; Fukuda, K. Ordered Metal Nanohole Arrays Made by a Two-Step Replication of Honeycomb Structures of Anodic Alumina. Science 1995, 268, 1466–1468. [Google Scholar] [CrossRef] [PubMed]
- Chuenchom, L.; Kraehnert, R.; Smarsly, B.M. Recent progress in soft-templating of porous carbon materials. Soft Matter 2012, 8, 10801–10812. [Google Scholar] [CrossRef] [Green Version]
- Gu, D.; Bongard, H.; Meng, Y.; Miyasaka, K.; Terasaki, O.; Zhang, F.; Deng, Y.; Wu, Z.; Feng, D.; Fang, Y.; et al. Growth of Single-Crystal Mesoporous Carbons with Imm Symmetry. Chem. Mater. 2010, 22, 4828–4833. [Google Scholar] [CrossRef]
- Job, N.; Théry, A.; Pirard, R.; Marien, J.; Kocon, L.; Rouzaud, J.-N.; Beguin, F.; Pirard, J.-P. Carbon aerogels, cryogels and xerogels: Influence of the drying method on the textural properties of porous carbon materials. Carbon 2005, 43, 2481–2494. [Google Scholar] [CrossRef]
- Chi, S.-H.; Kim, G.-C. Comparison of the oxidation rate and degree of graphitization of selected IG and NBG nuclear graphite grades. J. Nucl. Mater. 2008, 381, 9–14. [Google Scholar] [CrossRef]
- Calvo, E.G.; Ania, C.O.; Zubizarreta, L.; Menéndez, J.A.; Arenillas, A. Exploring New Routes in the Synthesis of Carbon Xerogels for Their Application in Electric Double-Layer Capacitors. Energy Fuels 2010, 24, 3334–3339. [Google Scholar] [CrossRef]
- Yoo, J.; Yang, I.; Kwon, D.; Jung, M.; Kim, M.-S.; Jung, J.C. Low-Cost Carbon Xerogels Derived from Phenol–Formaldehyde Resin for Organic Electric Double-Layer Capacitors. Energy Technol. 2021, 9, 2000918. [Google Scholar] [CrossRef]
- Chang, Y.-M.; Wu, C.-Y.; Wu, P.-W. Synthesis of large surface area carbon xerogels for electrochemical double layer capacitors. J. Power Sources 2013, 223, 147–154. [Google Scholar] [CrossRef]
- Canal-Rodríguez, M.; Arenillas, A.; Menéndez, J.; Beneroso, D.; Rey-Raap, N. Carbon xerogels graphitized by microwave heating as anode materials in lithium-ion batteries. Carbon 2018, 137, 384–394. [Google Scholar] [CrossRef]
- Piedboeuf, M.-L.; Léonard, A.; Reichenauer, G.; Balzer, C.; Job, N. How do the micropores of carbon xerogels influence their electrochemical behavior as anodes for lithium-ion batteries? Microporous Mesoporous Mater. 2018, 275, 278–287. [Google Scholar] [CrossRef]
- Gaikwad, M.M.; Kakunuri, M.; Sharma, C.S. Enhanced catalytic graphitization of resorcinol formaldehyde derived carbon xerogel to improve its anodic performance for lithium ion battery. Mater. Today Commun. 2019, 20, 100569. [Google Scholar] [CrossRef]
- Pekala, R.W.; Kong, F.M. A synthetic route to organic aerogels—Mechanism, structure, and properties. J. Phys. Colloq. 1989, 24, C4-33–C4-40. [Google Scholar] [CrossRef]
- Wang, J.; Polleux, J.; Lim, A.J.; Dunn, B. Pseudocapacitive Contributions to Electrochemical Energy Storage in TiO2 (Anatase) Nanoparticles. J. Phys. Chem. C 2007, 111, 14925–14931. [Google Scholar] [CrossRef]
- Piedboeuf, M.-L.; Léonard, A.; Deschamps, F.L.; Job, N. Carbon xerogels as model materials: Toward a relationship between pore texture and electrochemical behavior as anodes for lithium-ion batteries. J. Mater. Sci. 2016, 51, 4358–4370. [Google Scholar] [CrossRef]
- Job, N.; Pirard, R.; Marien, J.; Pirard, J.-P. Porous carbon xerogels with texture tailored by pH control during sol–gel process. Carbon 2004, 42, 619–628. [Google Scholar] [CrossRef]
- Páez, E.I.; Haro, M.; Juárez-Pérez, E.J.; Carmona, R.J.; Parra, J.B.; Ramos, R.L.; Ania, C.O. Fast synthesis of micro/mesoporous xerogels: Textural and energetic assessment. Microporous Mesoporous Mater. 2015, 209, 2–9. [Google Scholar] [CrossRef] [Green Version]
- Nagy, B.; Czakkel, O.; László, K. Novel synthesis route of metal doped resorcinol–formaldehyde polymer xerogels with tuned porosity. Microporous Mesoporous Mater. 2014, 185, 66–71. [Google Scholar] [CrossRef]
- Job, N.; Sabatier, F.; Pirard, J.-P.; Crine, M.; Léonard, A. Towards the production of carbon xerogel monoliths by optimizing convective drying conditions. Carbon 2006, 44, 2534–2542. [Google Scholar] [CrossRef] [Green Version]
- Maldonado-Hódar, F.J.; Moreno-Castilla, C.; Rivera-Utrilla, J.; Hanzawa, Y.; Yamada, Y. Catalytic Graphitization of Carbon Aerogels by Transition Metals. Langmuir 2000, 16, 4367–4373. [Google Scholar] [CrossRef]
- Kakunuri, M.; Vennamalla, S.; Sharma, C.S. Synthesis of carbon xerogel nanoparticles by inverse emulsion polymerization of resorcinol–formaldehyde and their use as anode materials for lithium-ion battery. RSC Adv. 2014, 5, 4747–4753. [Google Scholar] [CrossRef]
- Schuepfer, D.B.; Badaczewski, F.; Guerra-Castro, J.M.; Hofmann, D.M.; Heiliger, C.; Smarsly, B.; Klar, P.J. Assessing the structural properties of graphitic and non-graphitic carbons by Raman spectroscopy. Carbon 2020, 161, 359–372. [Google Scholar] [CrossRef]
- Weibang, L.; Tsai, M.-H.; Lin, S.-Y.; Lin, K.-I.; Lin, M.-F. Essential properties of AlCl4-related graphite intercalation compounds of aluminum-ion-based battery cathodes. arXiv 2021, arXiv:2105.01113. [Google Scholar]
- Canal-Rodríguez, M.; Arenillas, A.; Villanueva, S.F.; Montes-Morán, M.A.; Menénedez, J.A. Graphitized Carbon Xerogels for Lithium-Ion Batteries. Materials 2019, 13, 119. [Google Scholar] [CrossRef] [Green Version]
- Moon, C.-W.; Kim, Y.; Im, S.-S.; Park, S.-J. Effect of Activation Temperature on CO2Capture Behaviors of Resorcinol-based Carbon Aerogels. Bull. Korean Chem. Soc. 2014, 35, 57–61. [Google Scholar] [CrossRef] [Green Version]
- Aghabararpour, M.; Motahari, S.; Sanaee, Z.; Ghahreman, A. Fabrication of binder-free electrode using reinforced resorcinol formaldehyde-based carbon aerogels. J. Nanopart. Res. 2019, 21, 178. [Google Scholar] [CrossRef]
- Fuentes-Quezada, E.; de la Llave, E.; Halac, E.; Jobbágy, M.; Viva, F.; Bruno, M.M.; Corti, H.R. Bimodal mesoporous hard carbons from stabilized resorcinol-formaldehyde resin and silica template with enhanced adsorption capacity. Chem. Eng. J. 2018, 360, 631–644. [Google Scholar] [CrossRef]
- Ribeiro-Soares, J.; Oliveros, M.; Garin, C.; David, M.; Martins, L.; Almeida, C.; Martins-Ferreira, E.; Takai, K.; Enoki, T.; Magalhães-Paniago, R.; et al. Structural analysis of polycrystalline graphene systems by Raman spectroscopy. Carbon 2015, 95, 646–652. [Google Scholar] [CrossRef] [Green Version]
- Pfaff, T.; Badaczewski, F.M.; Loeh, M.O.; Franz, A.; Hoffmann, J.-U.; Reehuis, M.; Zeier, W.G.; Smarsly, B.M. Comparative Microstructural Analysis of Nongraphitic Carbons by Wide-Angle X-ray and Neutron Scattering. J. Phys. Chem. C 2019, 123, 20532–20546. [Google Scholar] [CrossRef]
- Quan, Y.; Liu, Q.; Zhang, S.; Zhang, S. Comparison of the morphology, chemical composition and microstructure of cryptocrystalline graphite and carbon black. Appl. Surf. Sci. 2018, 445, 335–341. [Google Scholar] [CrossRef]
- Schwan, J.; Ulrich, S.; Batori, V.; Ehrhardt, H.; Silva, S.R.P. Raman spectroscopy on amorphous carbon films. J. Appl. Phys. 1996, 80, 440–447. [Google Scholar] [CrossRef] [Green Version]
- Tuinstra, F.; Koenig, J.L. Raman Spectrum of Graphite. J. Chem. Phys. 1970, 53, 1126–1130. [Google Scholar] [CrossRef] [Green Version]
- Ferrari, A.C. Raman spectroscopy of graphene and graphite: Disorder, electron–phonon coupling, doping and nonadiabatic effects. Solid State Commun. 2007, 143, 47–57. [Google Scholar] [CrossRef]
- Nemanich, R.J.; Solin, S.A. First- and second-order Raman scattering from finite-size crystals of graphite. Phys. Rev. B 1979, 20, 392–401. [Google Scholar] [CrossRef]
- Kawashima, Y.; Katagiri, G. Fundamentals, overtones, and combinations in the Raman spectrum of graphite. Phys. Rev. B 1995, 52, 10053–10059. [Google Scholar] [CrossRef]
- Reich, S.; Thomsen, C. Raman spectroscopy of graphite. Philos. Trans. R. Soc. London. Ser. A Math. Phys. Eng. Sci. 2004, 362, 2271–2288. [Google Scholar] [CrossRef]
- Cançado, L.G.; Jorio, A.; Ferreira, E.H.M.; Stavale, F.; Achete, C.A.; Capaz, R.B.; Moutinho, M.V.O.; Lombardo, A.; Kulmala, T.S.; Ferrari, A.C. Quantifying Defects in Graphene via Raman Spectroscopy at Different Excitation Energies. Nano Lett. 2011, 11, 3190–3196. [Google Scholar] [CrossRef] [Green Version]
- Ferreira, E.; Moutinho, M.V.O.; Stavale, F.; Lucchese, M.M.; Capaz, R.B.; Achete, C.A.; Jorio, A. Evolution of the Raman spectra from single-, few-, and many-layer graphene with increasing disorder. Phys. Rev. B 2010, 82, 125429. [Google Scholar] [CrossRef] [Green Version]
- Basko, D.M.; Piscanec, S.; Ferrari, A.C. Electron-electron interactions and doping dependence of the two-phonon Raman intensity in graphene. Phys. Rev. B 2009, 80, 165413. [Google Scholar] [CrossRef] [Green Version]
- Cançado, L.G.; Jorio, A.; Pimenta, M.A. Measuring the absolute Raman cross section of nanographites as a function of laser energy and crystallite size. Phys. Rev. B 2007, 76, 064304. [Google Scholar] [CrossRef]
- Casiraghi, C.; Ferrari, A.C.; Robertson, J. Raman spectroscopy of hydrogenated amorphous carbons. Phys. Rev. B 2005, 72, 085401. [Google Scholar] [CrossRef] [Green Version]
- Cançado, L.G.; Da Silva, M.G.; Ferreira, E.; Hof, F.; Kampioti, K.; Huang, K.; Penicaud, A.; Achete, C.A.; Capaz, R.B.; Jorio, A. Disentangling contributions of point and line defects in the Raman spectra of graphene-related materials. 2D Mater. 2017, 4, 025039. [Google Scholar] [CrossRef]
- Tondi, G.; Fierro, V.; Pizzi, A.; Celzard, A. Tannin-based carbon foams. Carbon 2009, 47, 1480–1492. [Google Scholar] [CrossRef]
- Primak, W.; Fuchs, L.H. Electrical Conductivities of Natural Graphite Crystals. Phys. Rev. 1954, 95, 22–30. [Google Scholar] [CrossRef]
- Seehra, M.S.; Pavlovic, A.S. X-Ray diffraction, thermal expansion, electrical conductivity, and optical microscopy studies of coal-based graphites. Carbon 1993, 31, 557–564. [Google Scholar] [CrossRef]
- Marinho, B.; Ghislandi, M.; Tkalya, E.; Koning, C.E.; de With, G. Electrical conductivity of compacts of graphene, multi-wall carbon nanotubes, carbon black, and graphite powder. Powder Technol. 2012, 221, 351–358. [Google Scholar] [CrossRef]
- Kraiwattanawong, K.; Tamon, H.; Praserthdam, P. Influence of solvent species used in solvent exchange for preparation of mesoporous carbon xerogels from resorcinol and formaldehyde via subcritical drying. Microporous Mesoporous Mater. 2011, 138, 8–16. [Google Scholar] [CrossRef]
- Oyedoh, E.; Albadarin, A.; Walker, G.; Mirzaeian, M.; Ahmad, M. Preparation of Controlled Porosity Resorcinol Formaldehyde Xerogels for Adsorption Applications. Chem. Eng. Trans. 2013, 32, 1651–1656. [Google Scholar] [CrossRef]
- Pan, C.-J.; Yuan, C.; Zhu, G.; Zhang, Q.; Huang, C.-J.; Lin, M.-C.; Angell, M.; Hwang, B.-J.; Kaghazchi, P.; Dai, H. An operando X-ray diffraction study of chloroaluminate anion-graphite intercalation in aluminum batteries. Proc. Natl. Acad. Sci. USA 2018, 115, 5670–5675. [Google Scholar] [CrossRef] [PubMed] [Green Version]
- Li, J.; Liu, Q.; Flores, R.A.; Lemmon, J.P.; Bligaard, T. DFT simulation of the X-ray diffraction pattern of aluminum-ion-intercalated graphite used as the cathode material of the aluminum-ion battery. Phys. Chem. Chem. Phys. 2020, 22, 5969–5975. [Google Scholar] [CrossRef] [PubMed]
- Bhauriyal, P.; Mahata, A.; Pathak, B. The staging mechanism of AlCl4 intercalation in a graphite electrode for an aluminium-ion battery. Phys. Chem. Chem. Phys. 2017, 19, 7980–7989. [Google Scholar] [CrossRef] [PubMed]
- Chen, C.-Y.; Tsuda, T.; Kuwabata, S.; Hussey, C.L. Rechargeable aluminum batteries utilizing a chloroaluminate inorganic ionic liquid electrolyte. Chem. Commun. 2018, 54, 4164–4167. [Google Scholar] [CrossRef] [PubMed]
- Liu, C.; Liu, Z.; Li, Q.; Niu, H.; Wang, C.; Wang, Z.; Gao, B. Binder-free ultrasonicated graphite flakes@carbon fiber cloth cathode for rechargeable aluminum-ion battery. J. Power Sources 2019, 438, 226950. [Google Scholar] [CrossRef]
- Lindström, H.; Södergren, S.; Solbrand, A.; Ransom, H.; Hjelm, J.; Hagfeldt, A.; Lindquist, S.-E. Li+ Ion Insertion in TiO2 (Anatase). 2. Voltammetry on Nanoporous Films. J. Phys. Chem. B 1997, 101, 7717–7722. [Google Scholar] [CrossRef]
- Xu, J.H.; Schoetz, T.; McManus, J.R.; Subramanian, V.R.; Fields, P.W.; Messinger, R.J. Tunable Pseudocapacitive Intercalation of Chloroaluminate Anions into Graphite Electrodes for Rechargeable Aluminum Batteries. J. Electrochem. Soc. 2021, 168, 060514. [Google Scholar] [CrossRef]
- Li, C.; Rath, P.C.; Lu, S.-X.; Patra, J.; Su, C.-Y.; Bresser, D.; Passerini, S.; Chang, J.-K. Ordered nano-structured mesoporous CMK-8 and other carbonaceous positive electrodes for rechargeable aluminum batteries. Chem. Eng. J. 2021, 417, 129131. [Google Scholar] [CrossRef]
- Elia, G.A.; Hasa, I.; Greco, G.; Diemant, T.; Marquardt, K.; Hoeppner, K.; Behm, R.J.; Hoell, A.; Passerini, S.; Hahn, R. Insights into the reversibility of aluminum graphite batteries. J. Mater. Chem. A 2017, 5, 9682–9690. [Google Scholar] [CrossRef] [Green Version]
- Schoetz, T.; de Leon, C.P.; Ueda, M.; Bund, A. Perspective—State of the Art of Rechargeable Aluminum Batteries in Non-Aqueous Systems. J. Electrochem. Soc. 2017, 164, A3499–A3502. [Google Scholar] [CrossRef] [Green Version]
- Forsman, W.; Dziemianowicz, T.; Leong, K.; Carl, D. Graphite intercalation chemistry: An interpretive review. Synth. Met. 1983, 5, 77–100. [Google Scholar] [CrossRef]
- Özmen-Monkul, B.; Lerner, M.M. The first graphite intercalation compounds containing tris(pentafluoroethyl)trifluorophosphate. Carbon 2010, 48, 3205–3210. [Google Scholar] [CrossRef]
- Schmuelling, G.; Placke, T.; Kloepsch, R.; Fromm, O.; Meyer, H.-W.; Passerini, S.; Winter, M. X-ray diffraction studies of the electrochemical intercalation of bis(trifluoromethanesulfonyl)imide anions into graphite for dual-ion cells. J. Power Sources 2013, 239, 563–571. [Google Scholar] [CrossRef]
- Zhang, X.; Sukpirom, N.; Lerner, M.M. Graphite intercalation of bis(trifluoromethanesulfonyl) imide and other anions with perfluoroalkanesulfonyl substituents. Mater. Res. Bull. 1999, 34, 363–372. [Google Scholar] [CrossRef]
- Wang, D.-Y.; Huang, S.-K.; Liao, H.-J.; Chen, Y.-M.; Wang, S.-W.; Kao, Y.-T.; An, J.-Y.; Lee, Y.-C.; Chuang, C.-H.; Huang, Y.-C.; et al. Insights into dynamic molecular intercalation mechanism for Al C battery by operando synchrotron X-ray techniques. Carbon 2019, 146, 528–534. [Google Scholar] [CrossRef]


| Stage (n) | d(n+2)/d(n+1) Ratio | Dominant (00l) Peak |
|---|---|---|
| 1 | 1.50 | 002 |
| 2 | 1.33 | 003 |
| 3 | 1.25 | 004 |
| 4 | 1.20 | 005 |
| 5 | 1.17 | 006 |
| 6 | 1.14 | 007 |
| Peak Pair (1) | Peak Pair (2) | |
|---|---|---|
| 2θ (00n+1)/2θ degree | 28.0 | 22.4 |
| 2θ (00n+2)/2θ degree | 22.4 | 16.7 |
| dobs(n+1)/Å | 3.18 | 3.98 |
| dobs(n+2)/Å | 3.98 | 5.31 |
| dobs(n+2)/dobs(n+1) | 1.25 | 1.33 |
| Dominant stage (n) | 3 | 2 |
| Periodic distance IC/Å | 15.93 | |
| AlxCly gallery height (di)/Å | 9.23 | 12.58 |
| AlxCly gallery expansion (∆d)/Å | 5.88 | 9.23 |
| Literature for (di)/Å (dominant stage) | 5.7 (4) [11] 9.54 (3) [75] 9.59 (4) [83] | |
| Literature for (∆d)/Å (dominant stage) | 6.24 (4) [83] | |
| CXG | Spec. Area m² g−1 | VMe cm3 g−1 | Mean Pore Size nm | LA/LC nm | ΓD-Band m−1 | Conduct. S cm−1 | Qdis @ 0.1 A g−1 30th Cycle mAh g−1 | CE% | EE % |
|---|---|---|---|---|---|---|---|---|---|
| 500 | 1004 | 0.77 | 6.0 | 1.57/0.96 | 195 | 0.249 | 28.7 | 98.2 | 60.2 |
| 750 | 919 | 0.57 | 5.6 | 1.45/0.99 | 205 | 0.221 | 11.8 | 91.5 | 46.1 |
| 1000 | 894 | 0.26 | 3.4 | 1.45/1.04 | 224 | 0.260 | 23.3. | 93.0 | 44.8 |
| 1500 | 922 | 0.08 | 2.1 | 1.39/1.06 | 190 | 0.284 | 6.6 | 99.1 | 35.7 |
| 2500 | 944 | 0.02 | 1.7 | 1.45/0.94 | 188 | 0.273 | 1.4 | 99.7 | 41.1 |
| NG | 22 | 0.03 | 13.0 | 9.0–41.0 | 110 | 19.3 | 68.8 | 97.4 | 84.7 |
Publisher’s Note: MDPI stays neutral with regard to jurisdictional claims in published maps and institutional affiliations. |
© 2022 by the authors. Licensee MDPI, Basel, Switzerland. This article is an open access article distributed under the terms and conditions of the Creative Commons Attribution (CC BY) license (https://creativecommons.org/licenses/by/4.0/).
Share and Cite
Eckert, M.; Suthar, H.; Drillet, J.-F. Influence of Resorcinol to Sodium Carbonate Ratio on Carbon Xerogel Properties for Aluminium Ion Battery. Materials 2022, 15, 2597. https://doi.org/10.3390/ma15072597
Eckert M, Suthar H, Drillet J-F. Influence of Resorcinol to Sodium Carbonate Ratio on Carbon Xerogel Properties for Aluminium Ion Battery. Materials. 2022; 15(7):2597. https://doi.org/10.3390/ma15072597
Chicago/Turabian StyleEckert, Martin, Heena Suthar, and Jean-Francois Drillet. 2022. "Influence of Resorcinol to Sodium Carbonate Ratio on Carbon Xerogel Properties for Aluminium Ion Battery" Materials 15, no. 7: 2597. https://doi.org/10.3390/ma15072597
APA StyleEckert, M., Suthar, H., & Drillet, J.-F. (2022). Influence of Resorcinol to Sodium Carbonate Ratio on Carbon Xerogel Properties for Aluminium Ion Battery. Materials, 15(7), 2597. https://doi.org/10.3390/ma15072597