
Energy Absorption and Stiffness of Thin and Thick-Walled Closed-Cell 3D-Printed Structures Fabricated from a Hyperelastic Soft Polymer


Abstract
:1. Introduction
1.1. Nature and Characterization of Lattice Structures
- I.
- open-cells are closed with a relatively thin solid wall/membrane
- II.
1.2. Thermoplastic Polyurethane for Additive Manufacturing
- I
- Design of support-less continuous surface-based lattice structure. This type of design can eliminate the requirement of filament retraction during printing. Repeated retraction of filament is normally seen during printing truss-based lattice structures as these are non-continuous surfaces.
- II
- Printing process parameter optimization. The retraction is not allowed as this is a major problem during soft-material printing. Repeated retraction is responsible for buckling, kinking, and filament slippage in the feed module. The hygroscopic nature of TPU is minimised by keeping the filament in the dry box during the 3D printing process.
1.3. Analysis of Cellular Structures
2. Materials and Methods
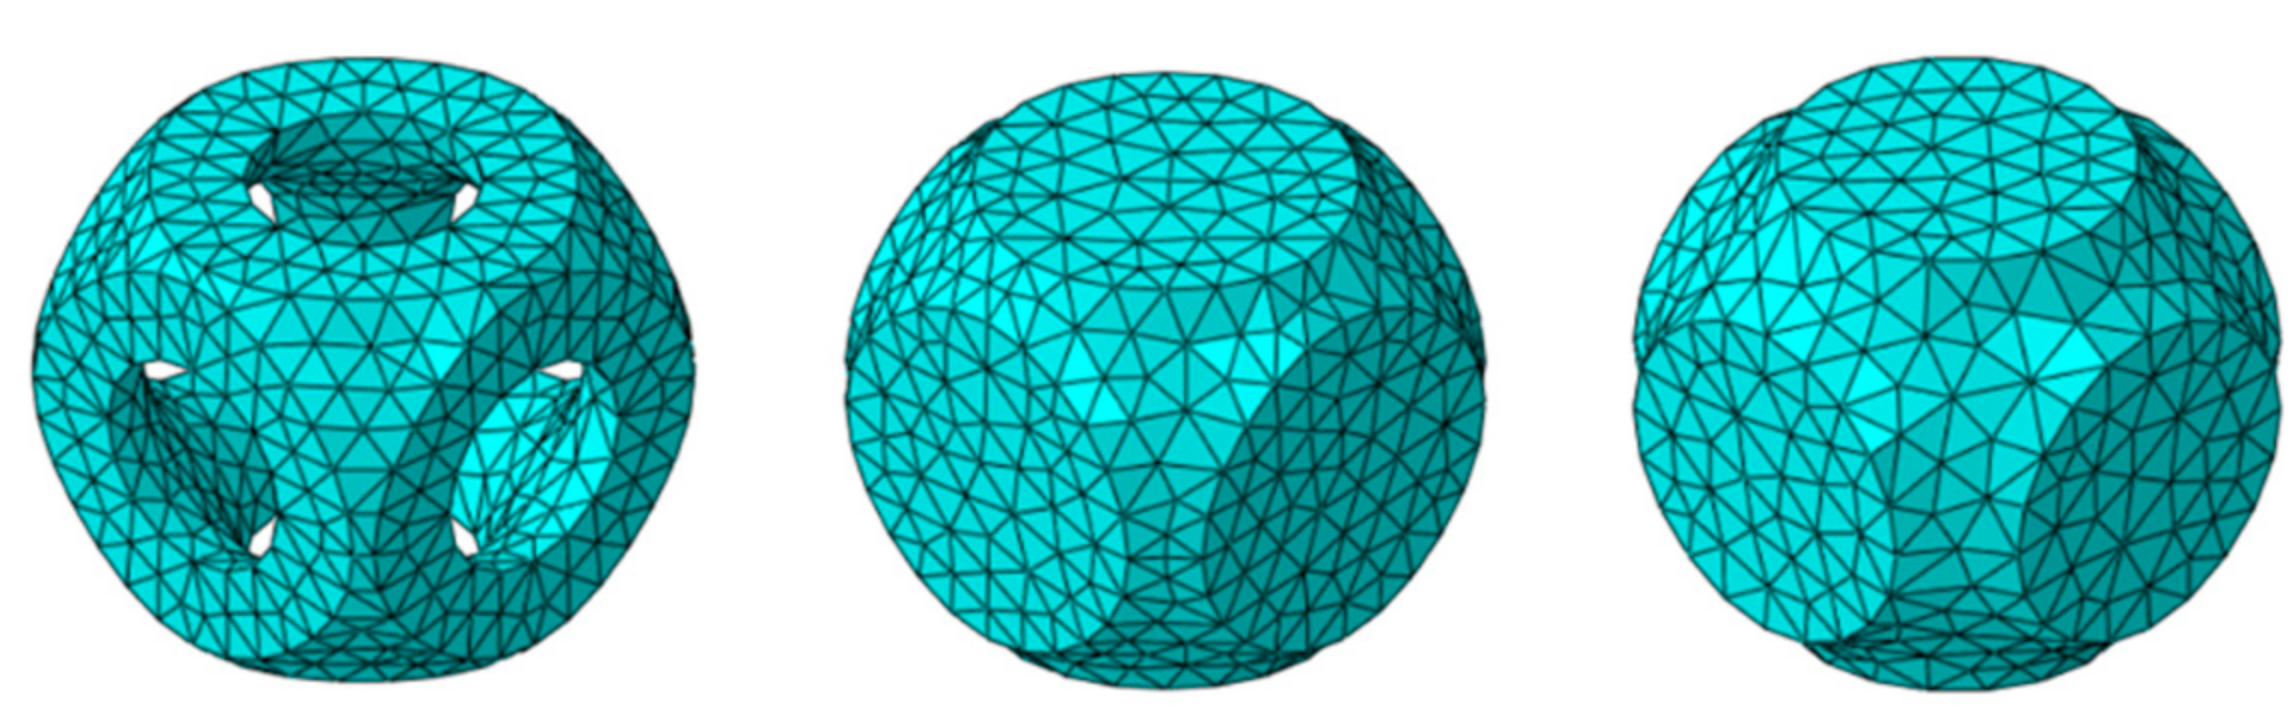
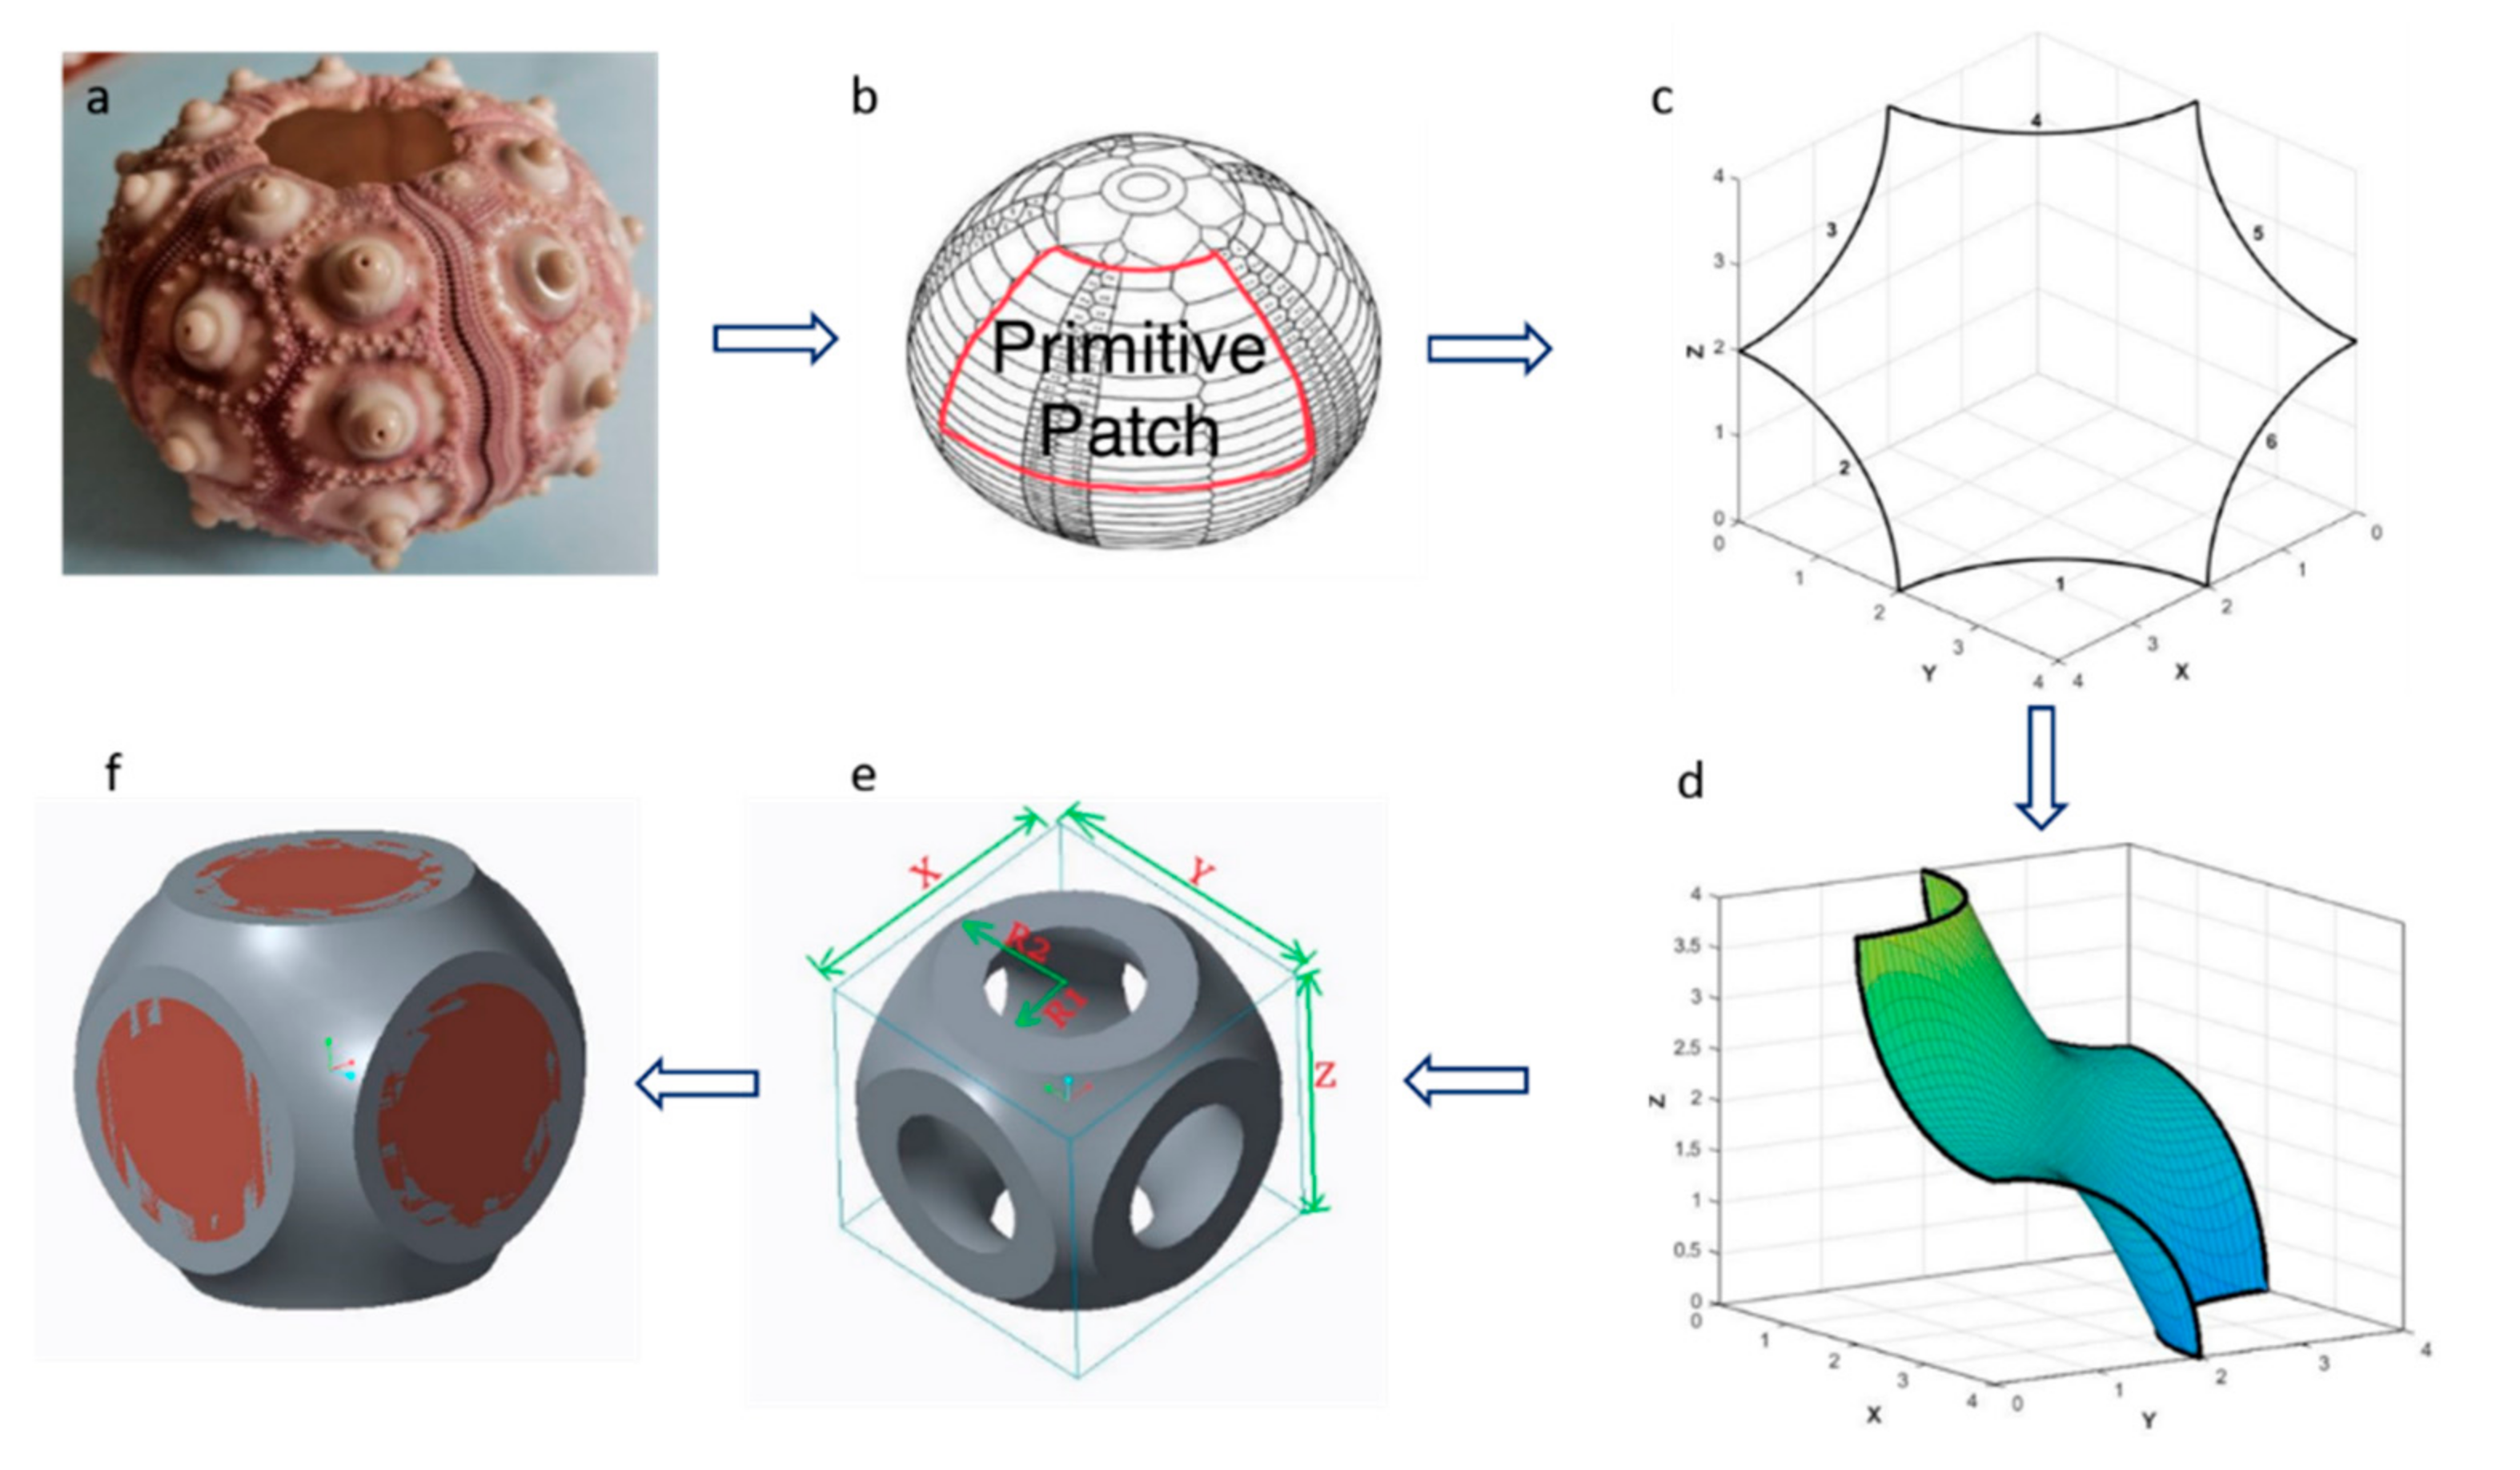
2.1. Design of Closed Lattice Cell
2.2. Additive Manufacturing
2.3. SEM Measurements
3. Experiments and Simulation
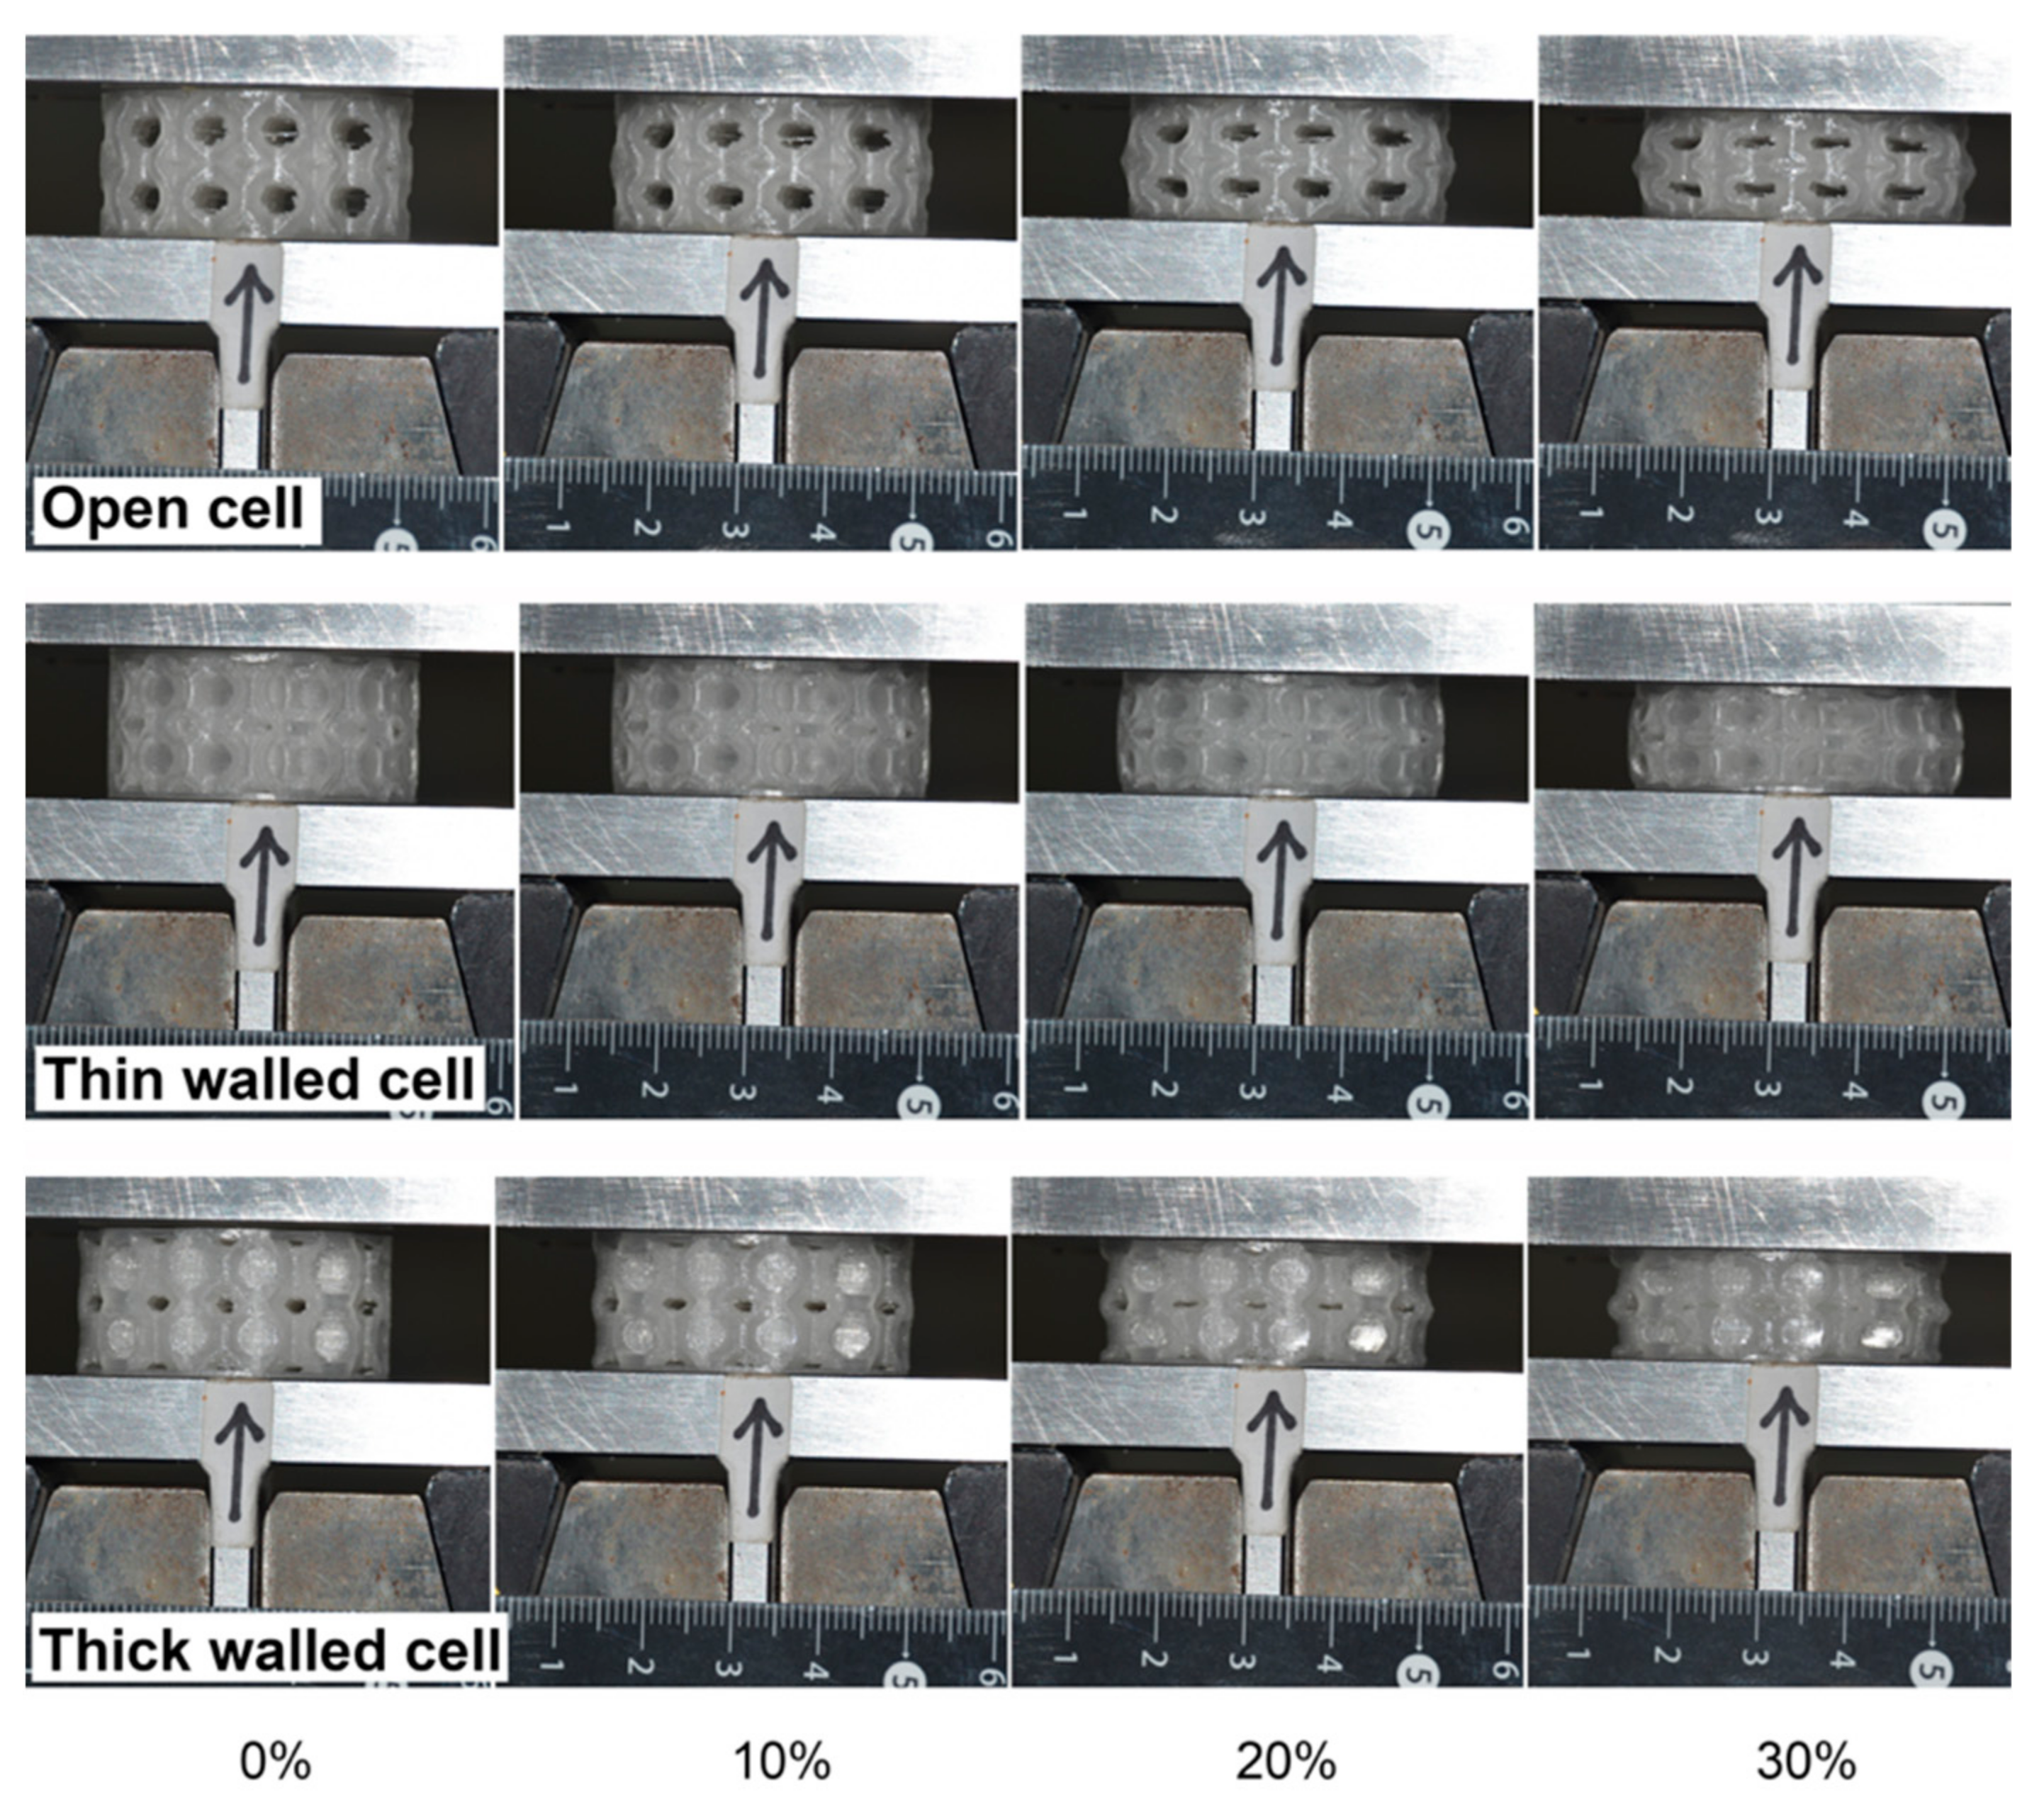
3.1. Experiments
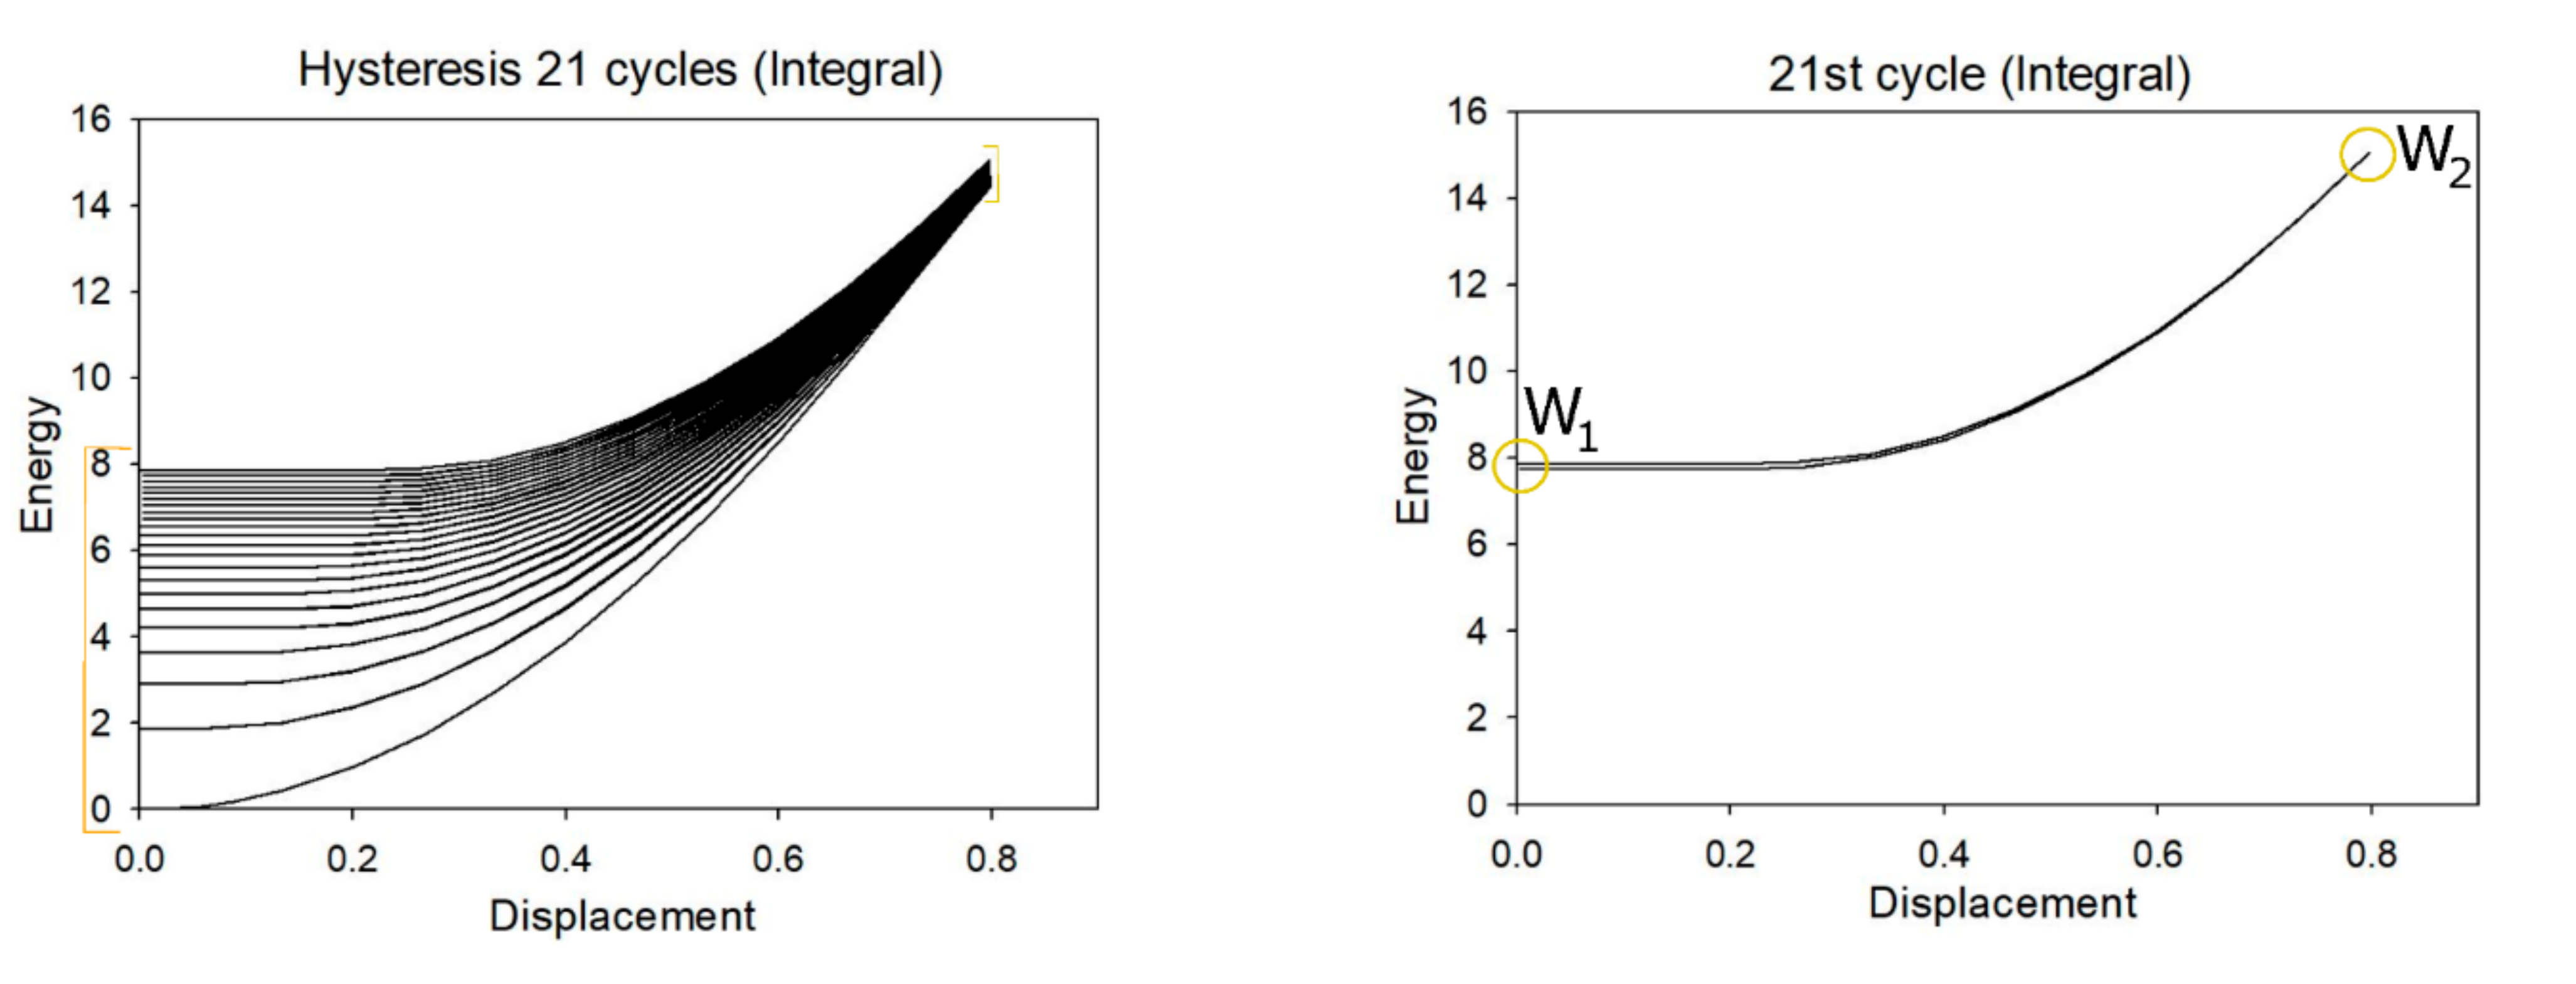
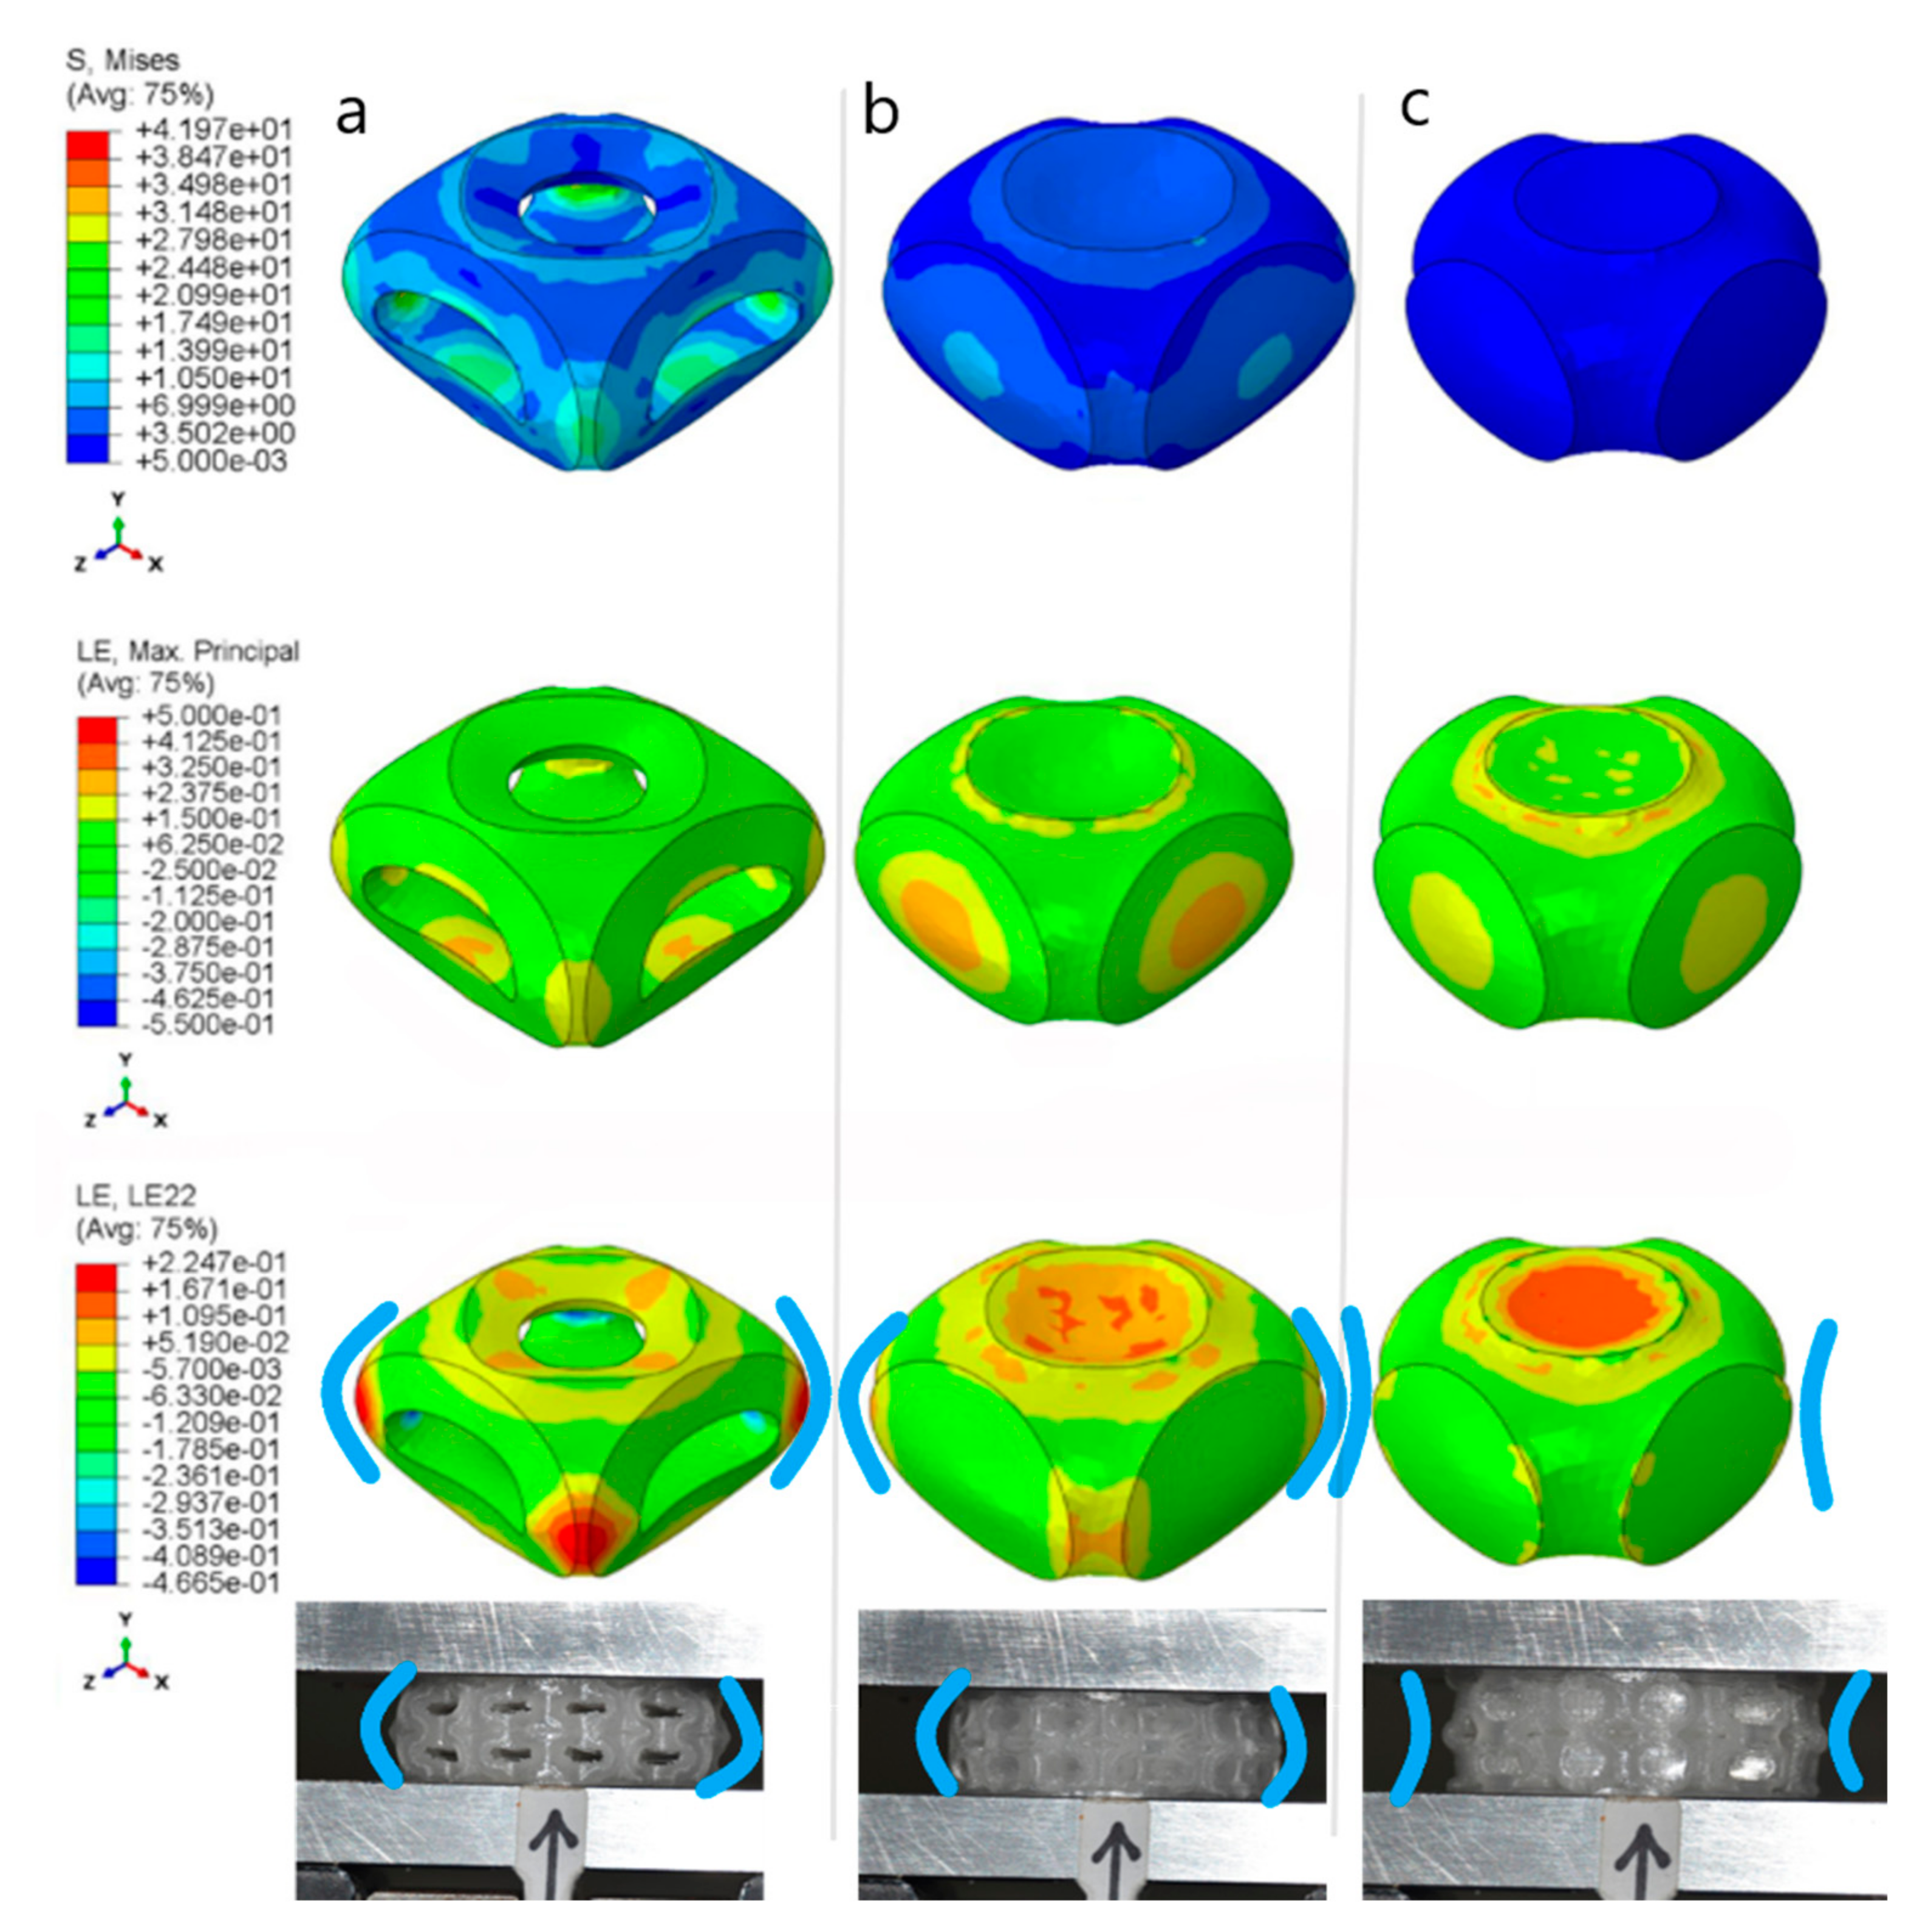
3.2. Simulation
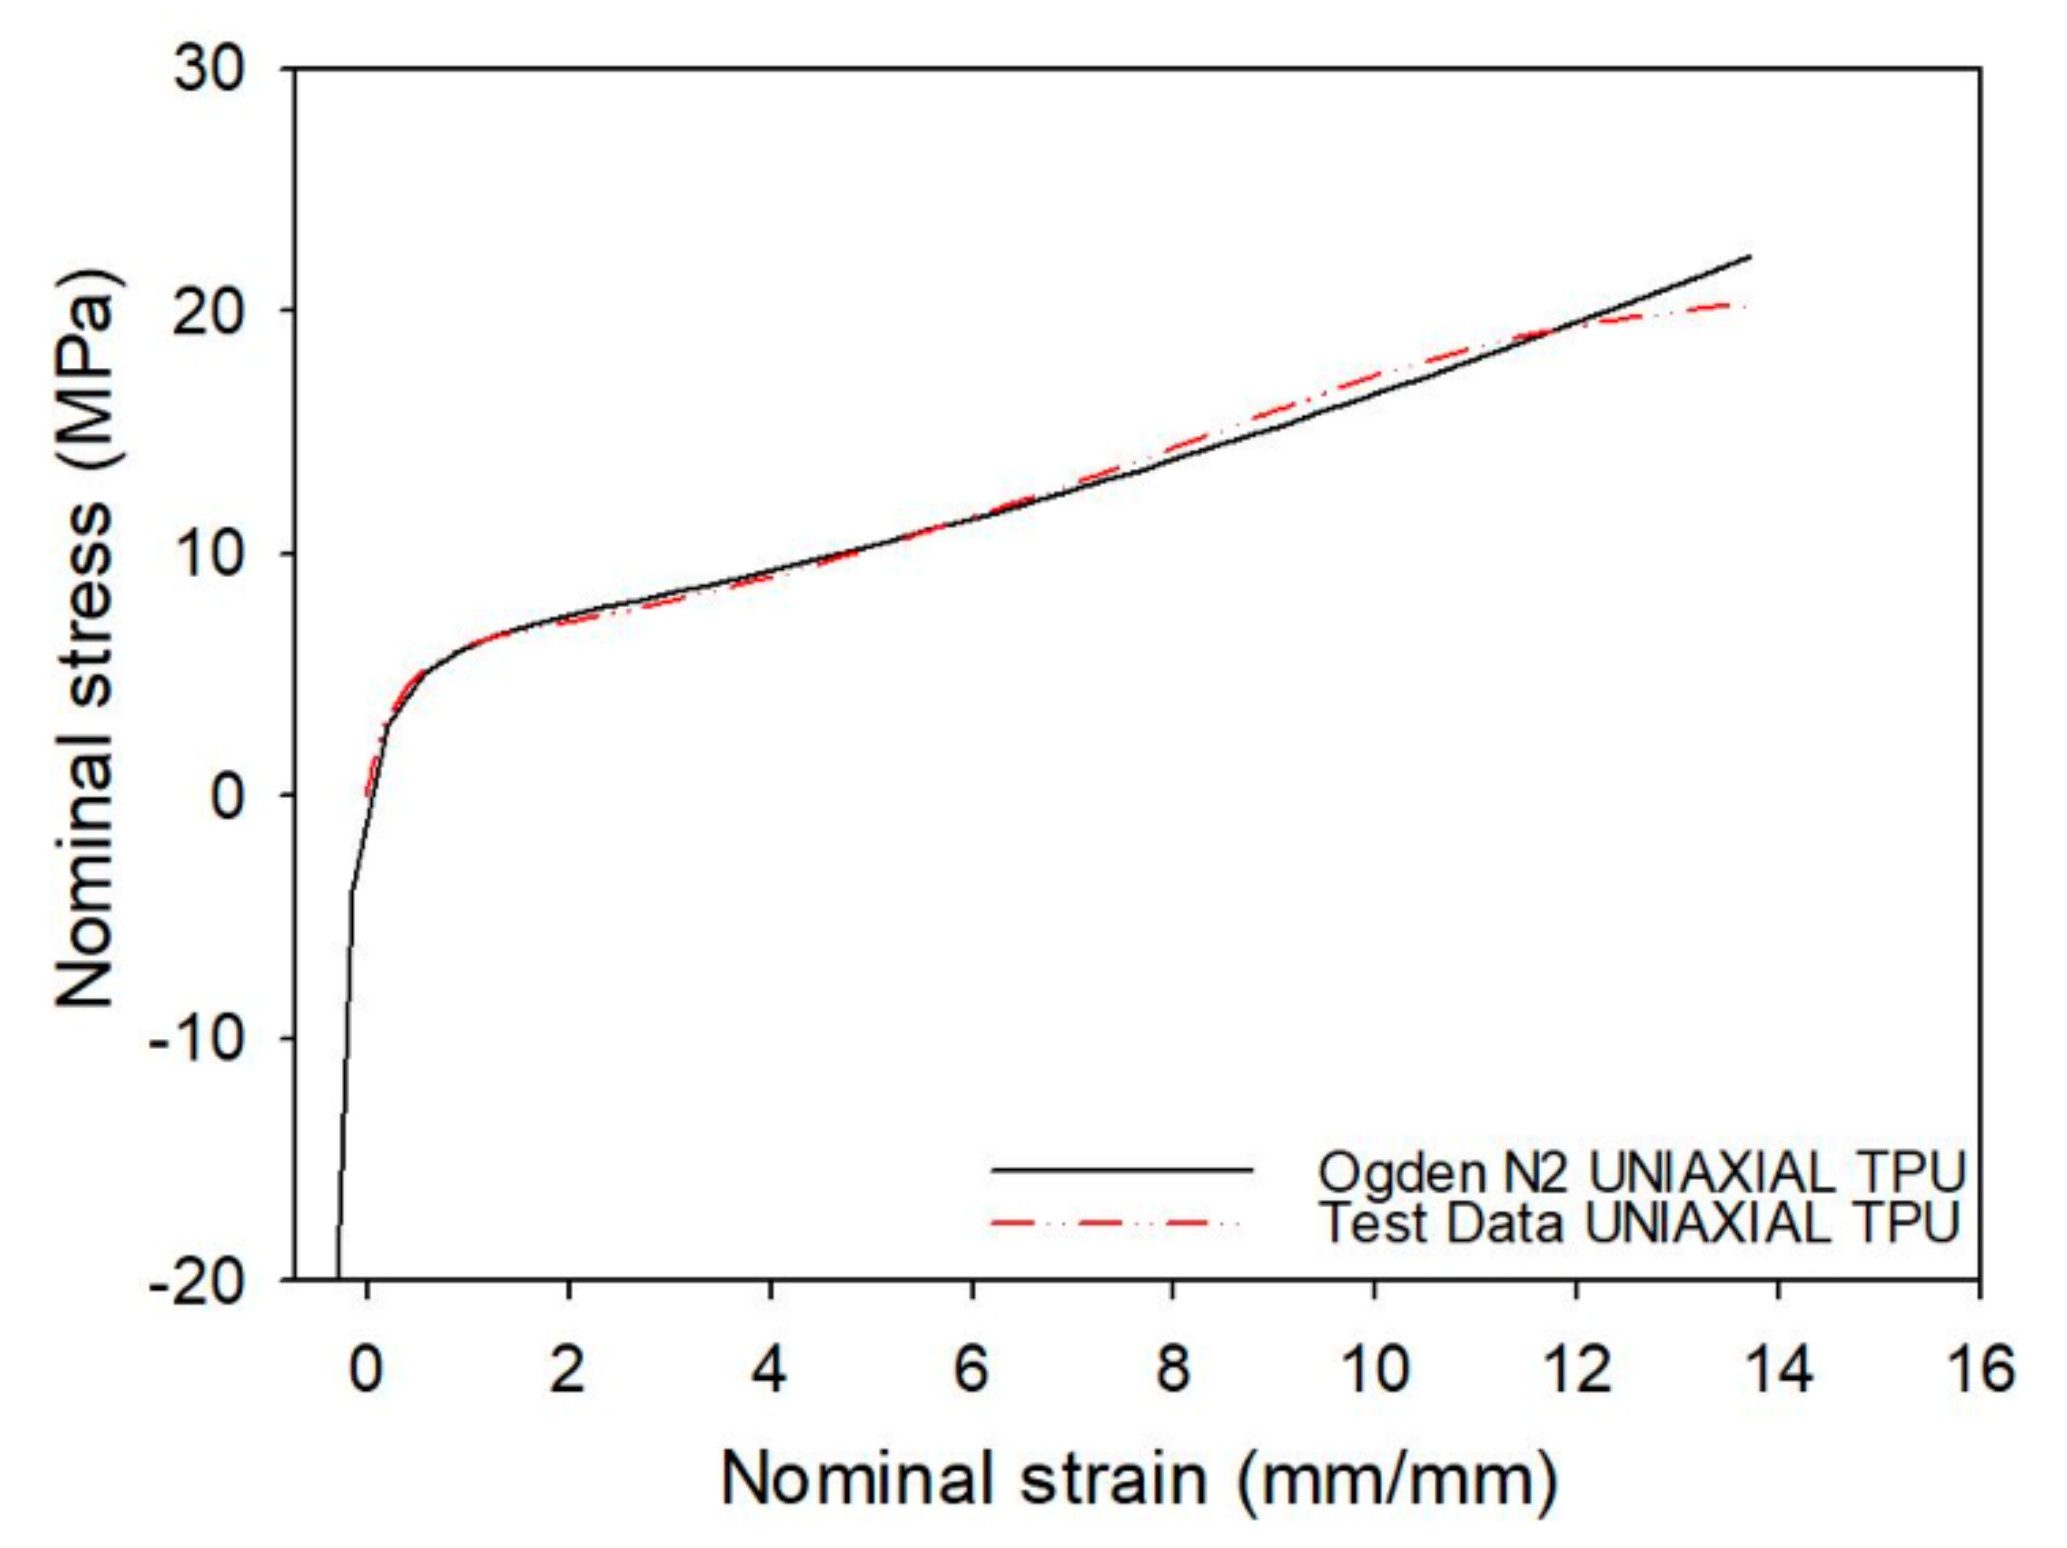
3.3. Material Model
4. Results
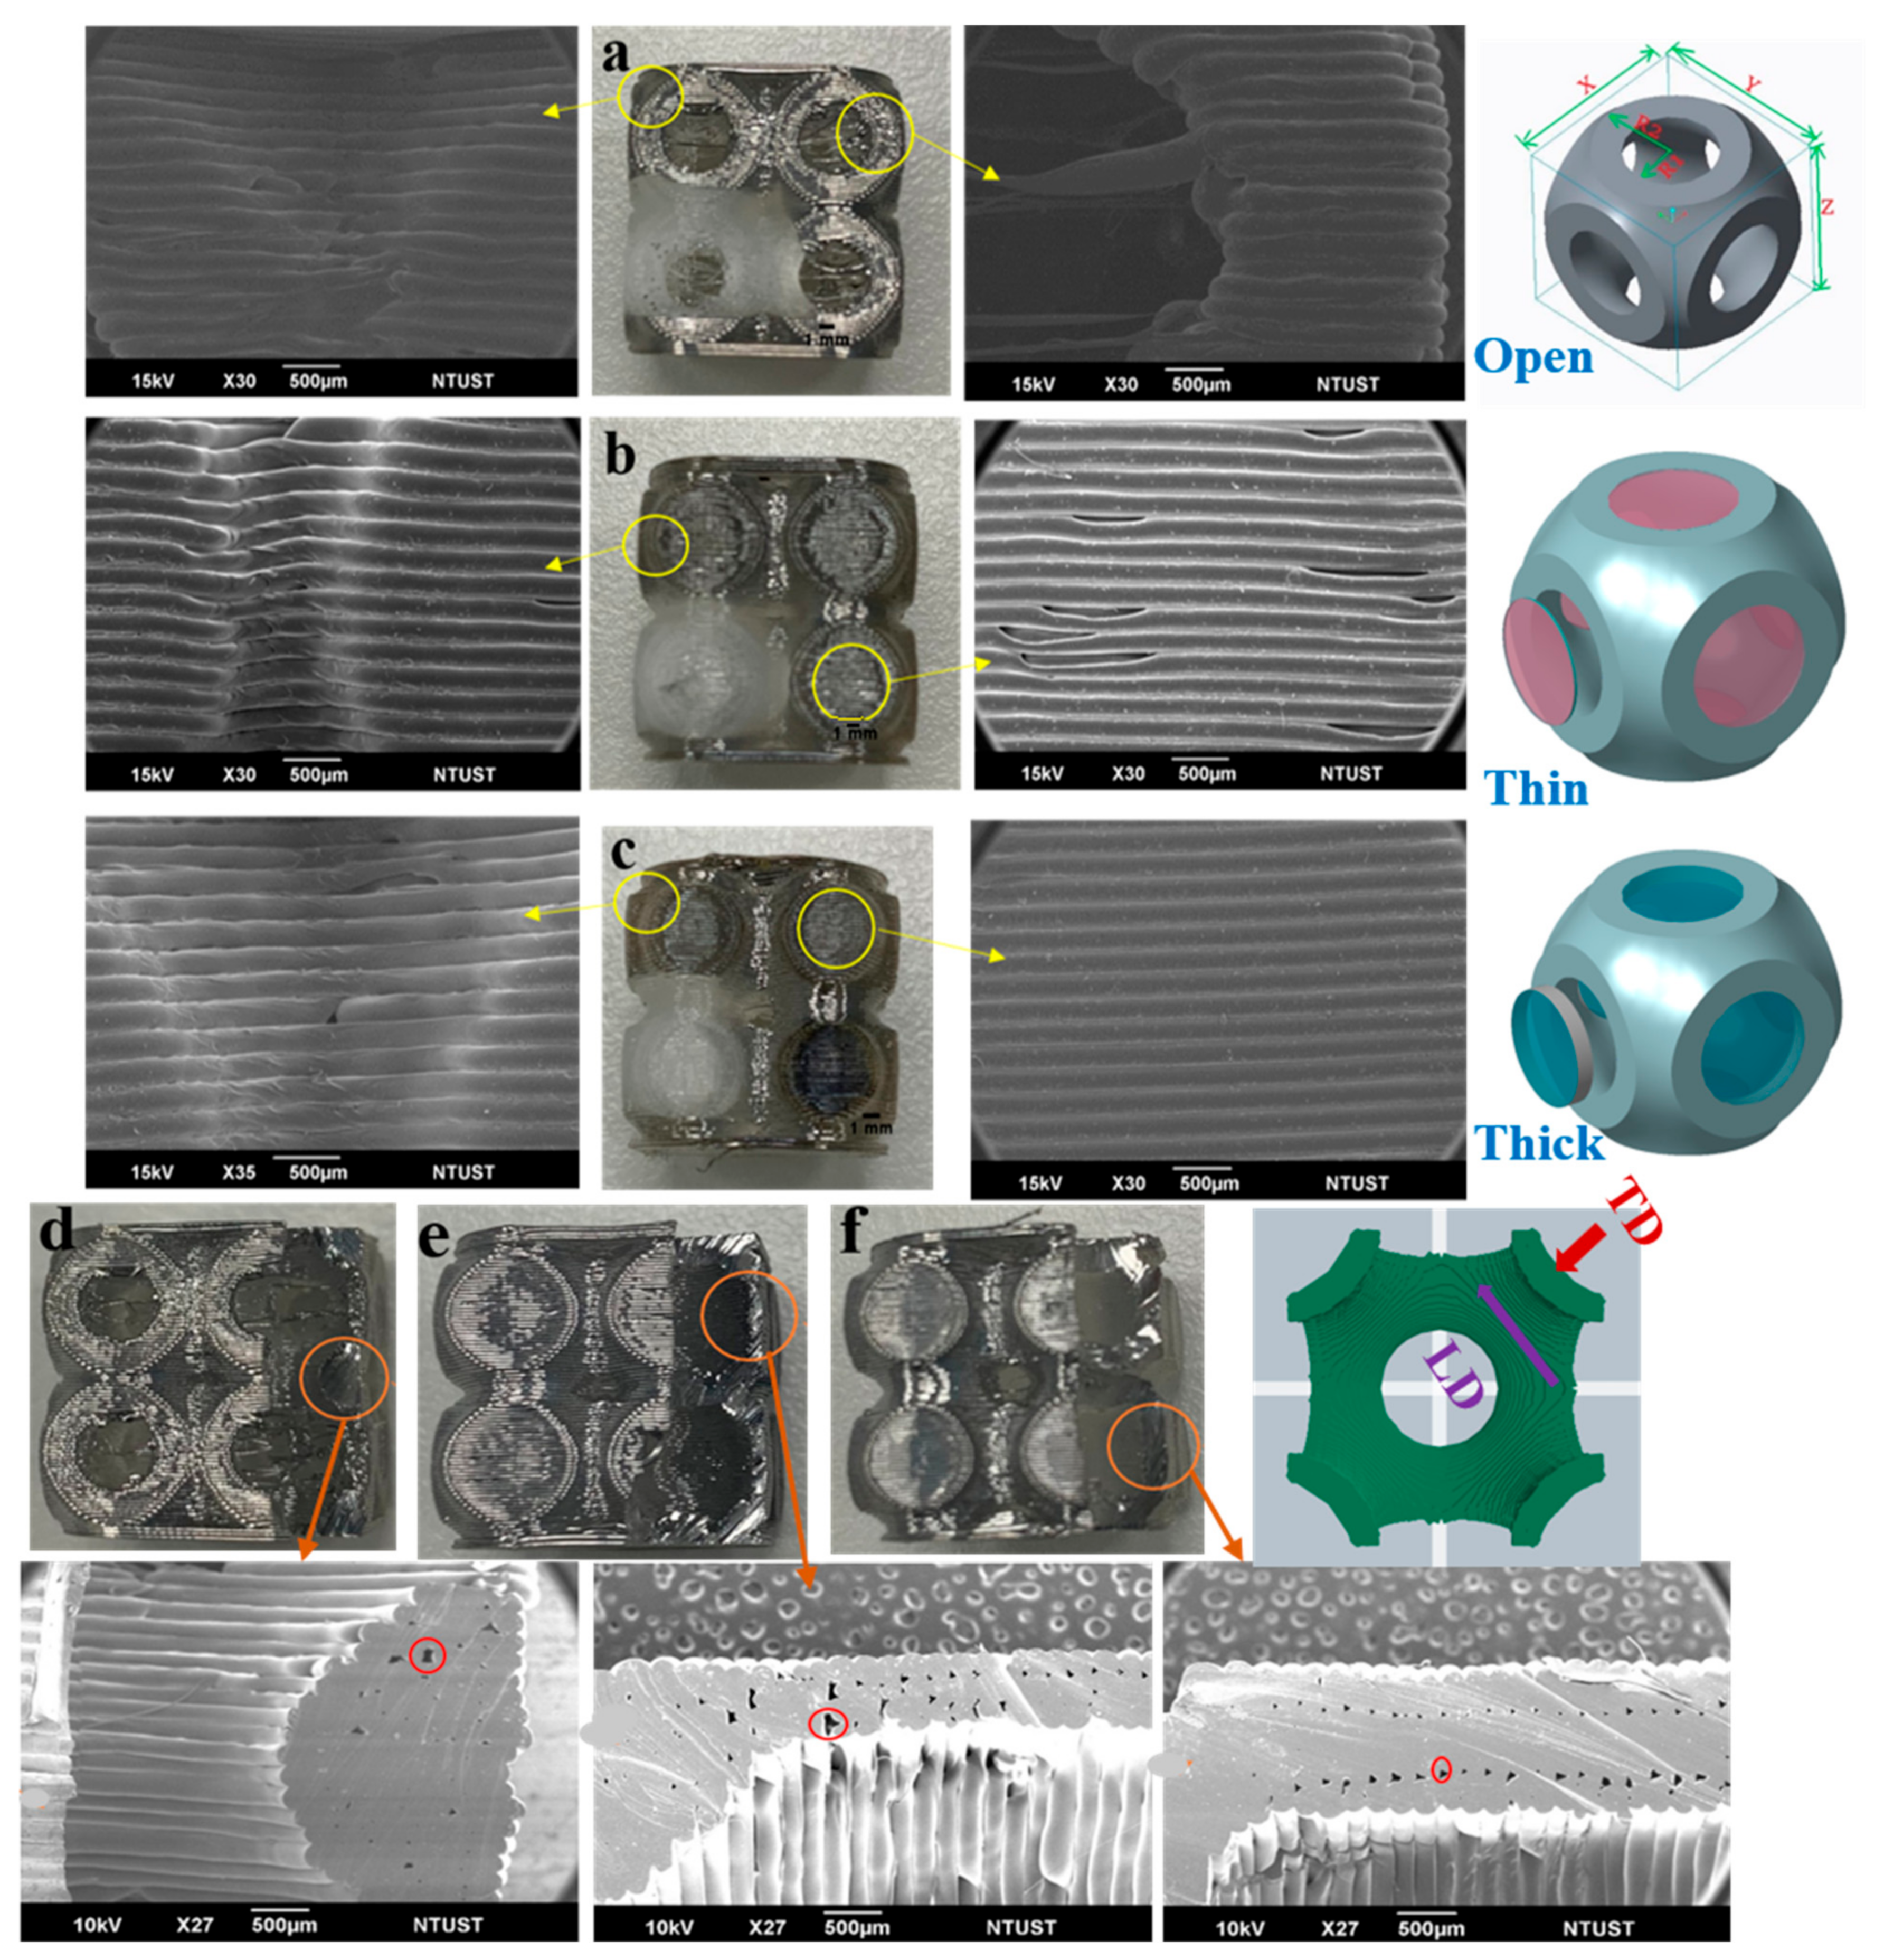
4.1. SEM Analysis
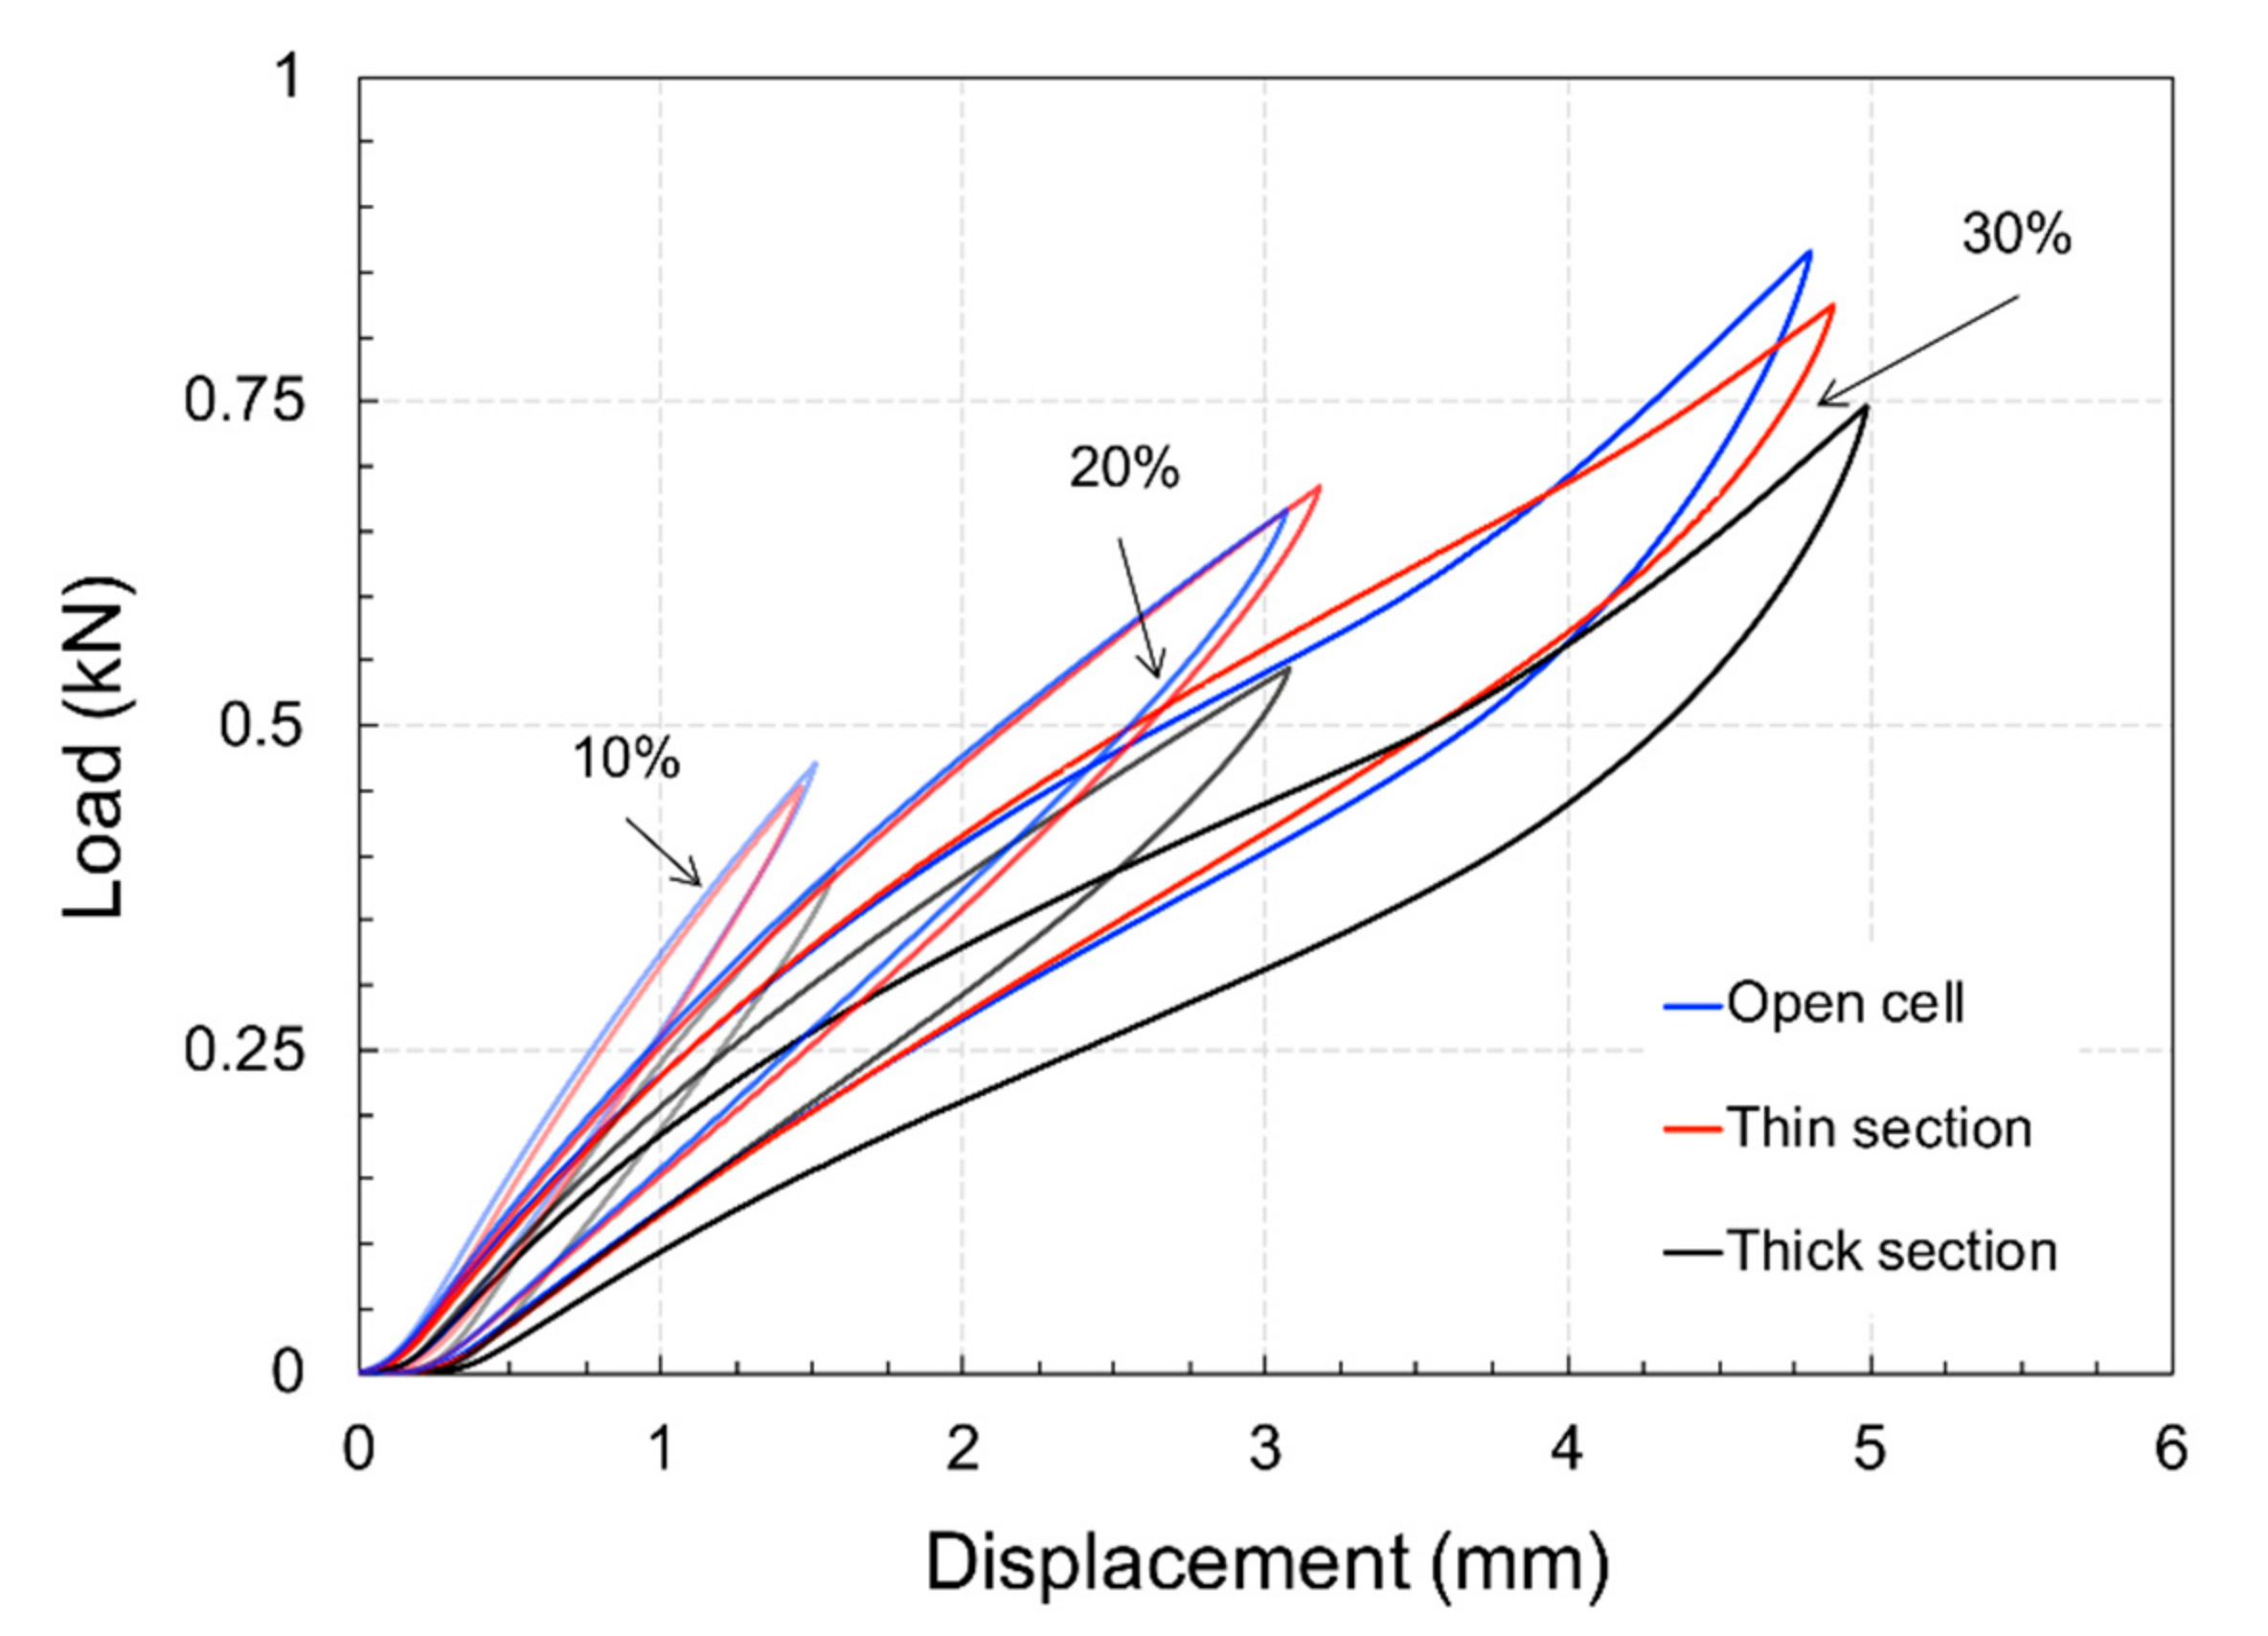
4.2. Functional Response of Structures
5. Discussion
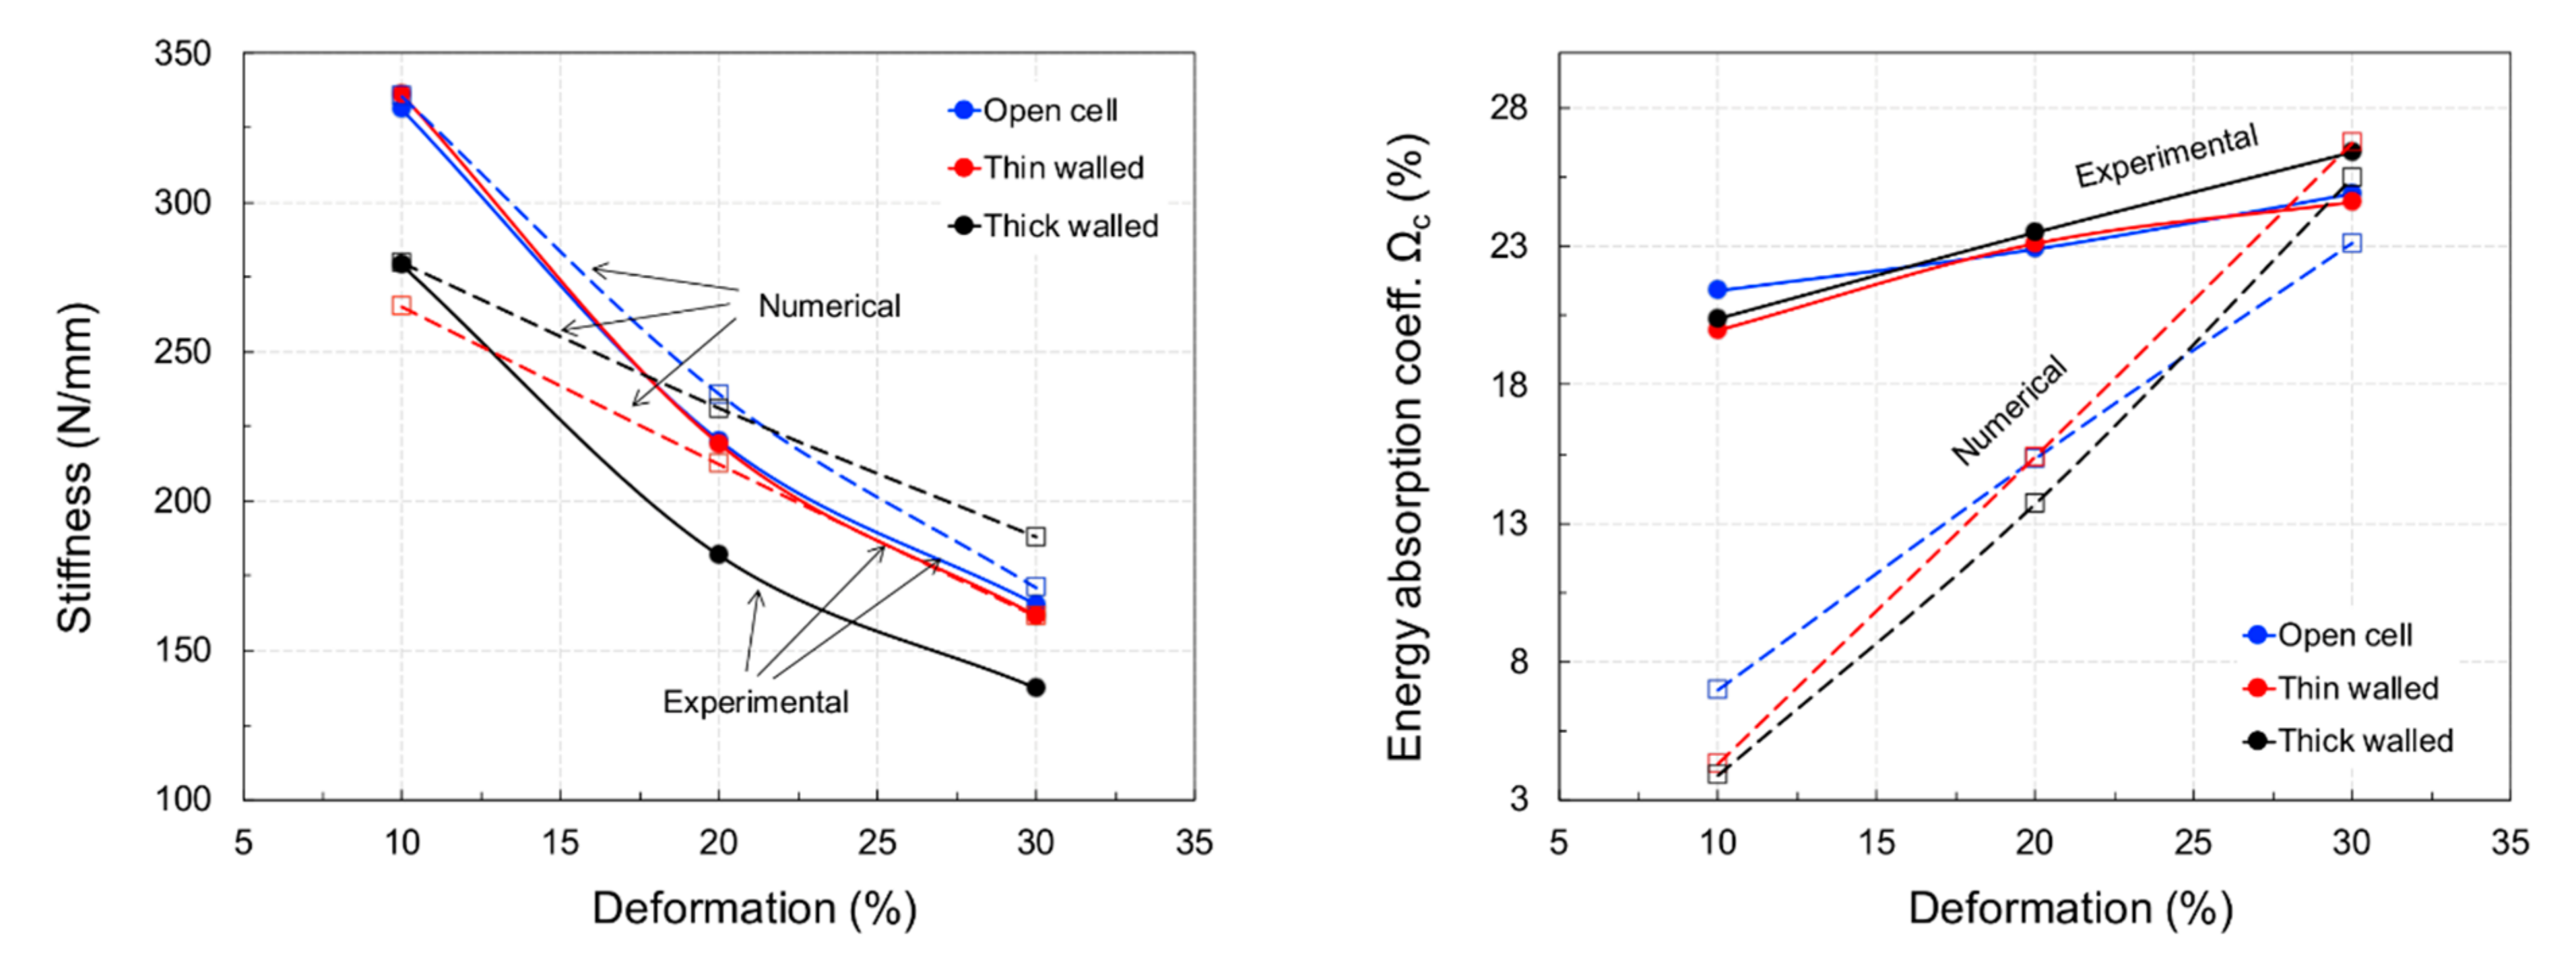
5.1. Mechanical Properties
- -
- was accurate for the closed thick-walled structures;
- -
- overrated the thin-walled structures by a factor of 1.25;
- -
- underestimated the open-cell structures by a factor of 1.5.

5.2. Effect of AM Process
5.3. Effect of Hyperelasticity, Suggestions Relating to Design
6. Conclusions
- -
- AM of TPU allows closed-cell lattice structures to be designed that mimic the sea urchin and behave as non-linear springs with excellent energy absorption properties;
- -
- closed cells with thin walls are more effective for optimising mechanical and functional-properties compared to those with thick walls. Hence, a closed-cell lattice structure should be designed with a thin wall to maintain or enhance an open-cell lattice structure’s mechanical and functional requirements;
- -
- FE simulations can be employed to reveal manufacturing defects, including the fact that printed TPU samples are anisotropic, with the degree of anisotropy depending on the level of deformation;
- -
- strong interaction between the layering process and structural properties must be considered during the design phase of lattice structures produced via MEX.
Author Contributions
Funding
Institutional Review Board Statement
Informed Consent Statement
Data Availability Statement
Conflicts of Interest
References
- Pearce, P. Structure in Nature Is a Strategy for Design; MIT Press: Cambridge, MA, USA, 1990. [Google Scholar]
- Wester, T. 3-D Form and Force Language Proposal for a Structural Basis. Int. J. Space Struct. 2011, 26, 229–239. [Google Scholar] [CrossRef]
- Gibson, L.J.; Ashby, M.F. Cellular Solids; Cambridge University Press: Cambridge, UK, 1997. [Google Scholar] [CrossRef]
- Opgenoord, M.M.J.; Willcox, K.E. Design for additive manufacturing: Cellular structures in early-stage aerospace design. Struct. Multidiscip. Optim. 2019, 60, 411–428. [Google Scholar] [CrossRef]
- Nazir, A.; Abate, K.M.; Kumar, A.; Jeng, J.-Y. A state-of-the-art review on types, design, optimization, and additive manufacturing of cellular structures. Int. J. Adv. Manuf. Technol. 2019, 104, 3489–3510. [Google Scholar] [CrossRef]
- Ashby, M.F. The properties of foams and lattices. Philos. Trans. R. Soc. A Math. Phys. Eng. Sci. 2006, 364, 15–30. [Google Scholar] [CrossRef]
- Bhat, C.; Kumar, A.; Jeng, J.-Y. Effect of atomic tessellations on structural and functional properties of additive manufactured lattice structures. Addit. Manuf. 2021, 47, 102326. [Google Scholar] [CrossRef]
- Li, T.; Chen, Y.; Hu, X.; Li, Y.; Wang, L. Exploiting negative Poisson’s ratio to design 3D-printed composites with enhanced mechanical properties. Mater. Des. 2018, 142, 247–258. [Google Scholar] [CrossRef]
- Verma, S.; Yang, C.-K.; Lin, C.-H.; Jeng, J.Y. Additive manufacturing of lattice structures for high strength mechanical interlocking of metal and resin during injection molding. Addit. Manuf. 2022, 49, 102463. [Google Scholar] [CrossRef]
- Verma, S.; Kumar, A.; Lin, S.-C.; Jeng, J.-Y. A bio-inspired design strategy for easy powder removal in powder-bed based additive manufactured lattice structure. Virtual Phys. Prototyp. 2022, 1–21. [Google Scholar] [CrossRef]
- Maconachie, T.; Leary, M.; Lozanovski, B.; Zhang, X.; Qian, M.; Faruque, O.; Brandt, M. SLM lattice structures: Properties, performance, applications and challenges. Mater. Des. 2019, 183. [Google Scholar] [CrossRef]
- Lu, T.J.; Xu, F.; Wen, T. Thermo-Fluid Behaviour of Periodic Cellular Metals; Springer: Berlin/Heidelberg, Germany, 2013. [Google Scholar] [CrossRef]
- Kumar, A.; Collini, L.; Daurel, A.; Jeng, J.-Y. Design and additive manufacturing of closed cells from supportless lattice structure. Addit. Manuf. 2020, 33, 101168. [Google Scholar] [CrossRef]
- Prajapati, M.J.; Kumar, A.; Lin, S.-C.; Jeng, J.-Y. Multi-material additive manufacturing with lightweight closed-cell foam-filled lattice structures for enhanced mechanical and functional properties. Addit. Manuf. 2022, 54, 102766. [Google Scholar] [CrossRef]
- Peng, T.; Kellens, K.; Tang, R.; Chen, C.; Chen, G. Sustainability of additive manufacturing: An overview on its energy demand and environmental impact. Addit. Manuf. 2018, 21, 694–704. [Google Scholar] [CrossRef]
- Dwivedi, K.A.; Huang, S.-J.; Wang, C.-T. Integration of various technology-based approaches for enhancing the performance of microbial fuel cell technology: A review. Chemosphere 2022, 287, 132248. [Google Scholar] [CrossRef] [PubMed]
- Zhu, Y.; Ramadani, E.; Egap, E. Thiol ligand capped quantum dot as an efficient and oxygen tolerance photoinitiator for aqueous phase radical polymerization and 3D printing under visible light. Polym. Chem. 2021, 12, 5106–5116. [Google Scholar] [CrossRef]
- Qin, C.; Yue, Z.; Chao, Y.; Forster, R.J.; Maolmhuaidh, F.Ó.; Huang, X.-F.; Beirne, S.; Wallace, G.G.; Chen, J. Bipolar electroactive conducting polymers for wireless cell stimulation. Appl. Mater. Today 2020, 21, 100804. [Google Scholar] [CrossRef]
- Qi, H.J.; Boyce, M.C. Stress–strain behavior of thermoplastic polyurethanes. Mech. Mater. 2005, 37, 817–839. [Google Scholar] [CrossRef]
- Collini, L.; Ursini, C.; Kumar, A. Design and optimization of 3D fast printed cellular structures. Mater. Des. Process. Commun. 2021, 3, e227. [Google Scholar] [CrossRef]
- Shen, F.; Yuan, S.; Guo, Y.; Zhao, B.; Bai, J.; Qwamizadeh, M.; Chua, C.K.; Wei, J.; Zhou, K. Energy Absorption of Thermoplastic Polyurethane Lattice Structures via 3D Printing: Modeling and Prediction. Int. J. Appl. Mech. 2016, 8, 1640006. [Google Scholar] [CrossRef]
- Ha, N.S.; Lu, G. A review of recent research on bio-inspired structures and materials for energy absorption applications. Compos. Part B Eng. 2020, 181, 107496. [Google Scholar] [CrossRef]
- Ha, N.S.; Lu, G.; Xiang, X. Energy absorption of a bio-inspired honeycomb sandwich panel. J. Mater. Sci. 2019, 54, 6286–6300. [Google Scholar] [CrossRef]
- Kumar, A.; Verma, S.; Jeng, J. Support-less Lattice Structures for Energy Absorption Fabricated by Fused Deposition Modeling. 3D Print. Addit. Manuf. 2020, 7, 85–96. [Google Scholar] [CrossRef]
- Jeng, J.-Y.; Kumar, A. Shoe Midsole Structure and Method for Manufacturing Same. U.S. Patent No. 10,881,167, 5 January 2021. Available online: https://patents.google.com/patent/US10881167B2/en (accessed on 20 November 2021).
- Gaynor, A.T.; Guest, J.K. Topology optimization considering overhang constraints: Eliminating sacrificial support material in additive manufacturing through design. Struct. Multidiscip. Optim. 2016, 54, 1157–1172. [Google Scholar] [CrossRef]
- Thomas, D. The Development of Design Rules for Selective Laser Melting. Ph.D. Thesis, University of Wales, Cardiff, UK, 2009. [Google Scholar]
- Cloots, M.; Spierings, A.B.; Wegener, K. Assessing new support minimizing strategies for the additive manufacturing technology SLM. In Proceedings of the 2013 International Solid Freeform Fabrication Symposium, Austin, TX, USA, 12–14 August 2013; pp. 12–14. [Google Scholar] [CrossRef]
- Worobets, J.; Wannop, J.W.; Tomaras, E.; Stefanyshyn, D. Softer and more resilient running shoe cushioning properties enhance running economy. Footwear Sci. 2014, 6, 147–153. [Google Scholar] [CrossRef]
- Sun, P.-C.; Wei, H.-W.; Chen, C.-H.; Wu, C.-H.; Kao, H.-C.; Cheng, C.-K. Effects of varying material properties on the load deformation characteristics of heel cushions. Med. Eng. Phys. 2008, 30, 687–692. [Google Scholar] [CrossRef] [PubMed]
- Abbot, D.W.; Kallon, D.V.V.; Anghel, C.; Dube, P. Finite Element Analysis of 3D Printed Model via Compression Tests. Procedia Manuf. 2019, 35, 164–173. [Google Scholar] [CrossRef]
- Bergström, J.S.; Boyce, M.C. Constitutive modeling of the time-dependent and cyclic loading of elastomers and application to soft biological tissues. Mech. Mater. 2001, 33, 523–530. [Google Scholar] [CrossRef]
- de León, A.S.; Domínguez-Calvo, A.; Molina, S.I. Materials with enhanced adhesive properties based on acrylonitrile-butadiene-styrene (ABS)/thermoplastic polyurethane (TPU) blends for fused filament fabrication (FFF). Mater. Des. 2019, 182, 108044. [Google Scholar] [CrossRef]
- Hohimer, C.; Christ, J.; Aliheidari, N.; Mo, C.; Ameli, A. 3D printed thermoplastic polyurethane with isotropic material properties. Behav. Mech. Multifunct. Mater. Compos. 2017, 10165, 1016511. [Google Scholar] [CrossRef]
- Kim, G.; Barocio, E.; Pipes, R.B.; Sterkenburg, R. 3D printed thermoplastic polyurethane bladder for manufacturing of fiber reinforced composites. Addit. Manuf. 2019, 29, 100809. [Google Scholar] [CrossRef]
- Keleş, Ö.; Blevins, C.W.; Bowman, K.J. Effect of build orientation on the mechanical reliability of 3D printed ABS. Rapid Prototyp. J. 2017, 23, 320–328. [Google Scholar] [CrossRef]
- Popescu, D.; Zapciu, A.; Amza, C.; Baciu, F.; Marinescu, R. FDM process parameters influence over the mechanical properties of polymer specimens: A review. Polym. Test. 2018, 69, 157–166. [Google Scholar] [CrossRef]
- Penumakala, P.K.; Santo, J.; Thomas, A. A critical review on the fused deposition modeling of thermoplastic polymer composites. Compos. Part B Eng. 2020, 201, 108336. [Google Scholar] [CrossRef]
- Frick, A.; Rochman, A. Characterization of TPU-elastomers by thermal analysis (DSC). Polym. Test. 2004, 23, 413–417. [Google Scholar] [CrossRef]
- Garner, S.M. Flexible Glass; John Wiley & Sons, Inc.: Hoboken, NJ, USA, 2017. [Google Scholar] [CrossRef]


| Cell Structure | Material | Specimen/ Unit Cell Size (mm) | Open Shell Thickness (T) (mm) | Closing Wall Thickness (Tw) (mm) | VRC |
|---|---|---|---|---|---|
| Open-cell | TPU | Φ37 × 16/8 × 8 × 8 | 1.2 | – | 56.9 |
| Thin-walled | 1.0 | 0.6 | 57.0 | ||
| Thick-walled | 0.66 | 1.2 | 56.6 |
| Extruder Diameter (mm) | Extruder Temperature (°C) | Platform Temperature (°C) | Layer Thickness (mm) | Infill (%) | Print Speed (mm/min) |
|---|---|---|---|---|---|
| 0.4 | 230 | 70 | 0.2 | 100 | 1100 |
| Order | μi | αi | Di |
|---|---|---|---|
| 1 | 0.4055 | 2.4580 | 6.1616 × 10⁻³ |
| 2 | 6.1298 | −1.9004 | 0.0000 |
| S | A (s−1MPa−m) | m | C | E |
|---|---|---|---|---|
| 2.2 | 0.556 | 4.0 | 0.0 | 0.01 |
| Lattice Structure | K0 (N/mm) | Wc (J/m3) | Ωc (%) | |||||||||||||||
|---|---|---|---|---|---|---|---|---|---|---|---|---|---|---|---|---|---|---|
| εN,c (%) | 10 | 20 | 30 | 10 | 20 | 30 | 10 | 20 | 30 | |||||||||
| Exp | FEA | Exp | FEA | Exp | FEA | Exp | FEA | Exp | FEA | Exp | FEA | Exp | FEA | Exp | FEA | Exp | FEA | |
| Open-cell | 331.0 | 335.3 | 220.3 | 235.8 | 165.5 | 171.0 | 7.58 | 1.21 | 27.73 | 8.32 | 59.61 | 25.12 | 21.4 | 7.0 | 22.9 | 15.3 | 24.9 | 23.1 |
| Thin-wall | 336.0 | 264.6 | 219.2 | 212.3 | 161.7 | 161.4 | 6.84 | 1.08 | 32.72 | 13.33 | 61.52 | 48.23 | 20.0 | 4.3 | 23.1 | 15.4 | 24.6 | 26.7 |
| Thick-wall | 278.9 | 279.7 | 181.9 | 231.1 | 137.5 | 188.1 | 6.35 | 0.98 | 25.04 | 12.06 | 57.11 | 49.13 | 20.4 | 3.9 | 23.5 | 13.7 | 26.4 | 25.5 |
Publisher’s Note: MDPI stays neutral with regard to jurisdictional claims in published maps and institutional affiliations. |
© 2022 by the authors. Licensee MDPI, Basel, Switzerland. This article is an open access article distributed under the terms and conditions of the Creative Commons Attribution (CC BY) license (https://creativecommons.org/licenses/by/4.0/).
Share and Cite
Kumar, A.; Collini, L.; Ursini, C.; Jeng, J.-Y. Energy Absorption and Stiffness of Thin and Thick-Walled Closed-Cell 3D-Printed Structures Fabricated from a Hyperelastic Soft Polymer. Materials 2022, 15, 2441. https://doi.org/10.3390/ma15072441
Kumar A, Collini L, Ursini C, Jeng J-Y. Energy Absorption and Stiffness of Thin and Thick-Walled Closed-Cell 3D-Printed Structures Fabricated from a Hyperelastic Soft Polymer. Materials. 2022; 15(7):2441. https://doi.org/10.3390/ma15072441
Chicago/Turabian StyleKumar, Ajeet, Luca Collini, Chiara Ursini, and Jeng-Ywan Jeng. 2022. "Energy Absorption and Stiffness of Thin and Thick-Walled Closed-Cell 3D-Printed Structures Fabricated from a Hyperelastic Soft Polymer" Materials 15, no. 7: 2441. https://doi.org/10.3390/ma15072441
APA StyleKumar, A., Collini, L., Ursini, C., & Jeng, J.-Y. (2022). Energy Absorption and Stiffness of Thin and Thick-Walled Closed-Cell 3D-Printed Structures Fabricated from a Hyperelastic Soft Polymer. Materials, 15(7), 2441. https://doi.org/10.3390/ma15072441