This work was divided into two parts to investigate the effect of Nb and Mo content on the effects of CrFeCoNiNbxMoy alloys. Part 1 was the CrFeCoNiNbxMox alloys, and x was 0.15, 0.3 and 0.5. The same amount of Nb and Mo was added to the CrFeCoNi alloy. The microstructure revolution of CrFeCoNiNbxMox alloys were studied in this part; the relationships between the properties and the microstructures were also investigated. Part 2 studied the properties of CrFeCoNiNbxMo1−x alloys, where x was 0.25, 0.5 and 0.75. This part studied the effect of different ratios of Nb and Mo on the microstructures and properties of the alloys. The total amount of Nb and Mo was fixed at one part (20 at.%) because the alloys would easily crack during solidification if an excess amount of Nb and Mo was added.
3.1. CrFeCoNiNbxMox Alloys
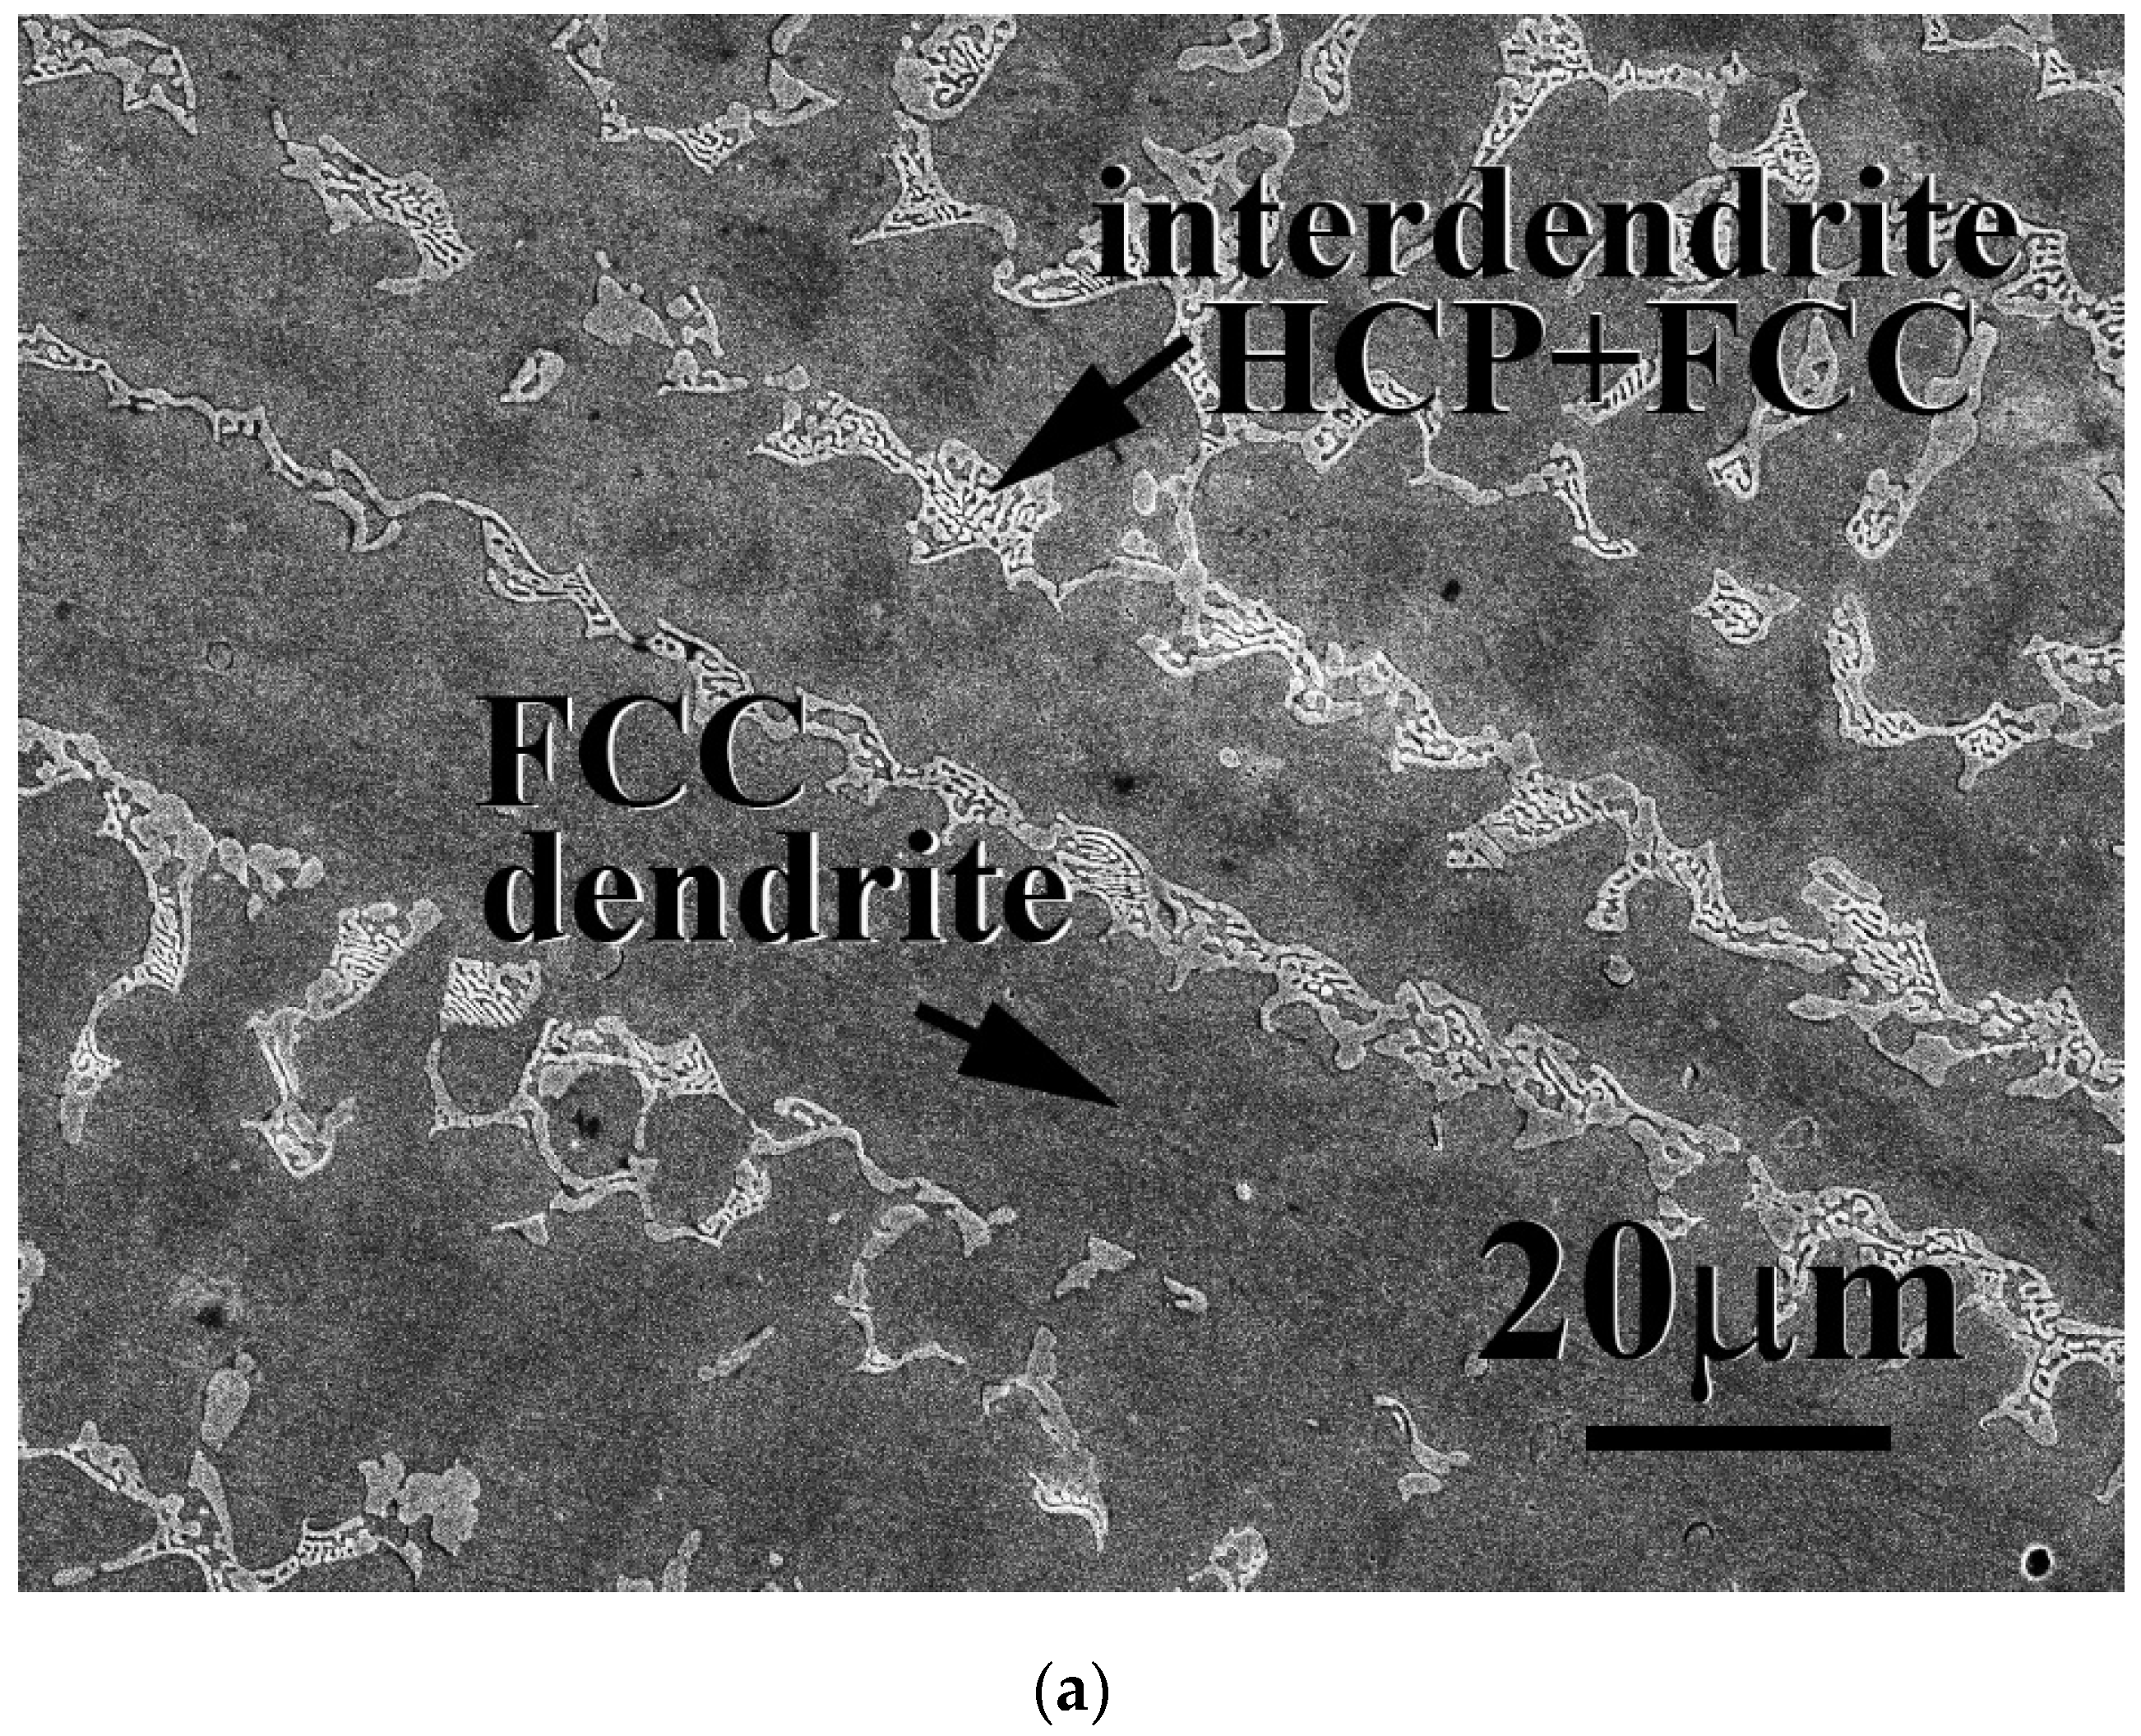
The microstructures of as-cast CrFeCoNiNb
xMo
x alloys, x = 0.15, 0.3 and 0.5, are shown in
Figure 1. In our previous study, the CrFeCoNi alloy had an FCC-structured granular microstructure and some Cr-rich precipitates with HCP structure [
20]. After adding Nb and Mo, the microstructures of as-cast CrFeCoNiNb
xMo
x alloys became dendritic ones. The dendrites of CrFeCoNiNb
xMo
x alloys showed a single phase, and the interdendrities of CrFeCoNiNb
xMo
x alloys showed a eutectic structure.
Table 2 shows the chemical compositions of the alloys and the phases existing in the alloys. According to our previous study [
23], the HCP phase had higher Nb and Mo content, and FCC had higher Cr- Fe and Ni content. Therefore, the FCC and HCP phases were easy to identify by detecting the compositions. The dendrites of CrFeCoNiNb
0.15Mo
0.15 and CrFeCoNiNb
0.3Mo
0.3 alloys were an FCC phase and the dendrites of CrFeCoNiNb
0.5Mo
0.5 alloy were an HCP-structured laves phase. All of the interdendrites of CrFeCoNiNb
xMo
x alloys were a eutectic structure with two phases which were FCC and HCP phases (laves phase). This indicated that the alloy changed from a hypoeutectic alloy to a hypereutectic one. That is, CrFeCoNiNb
0.15Mo
0.15 and CrFeCoNiNb
0.3Mo
0.3 alloys were hypoeutectic alloys, and CrFeCoNiNb
0.5Mo
0.5 alloy was a hypereutectic alloy.
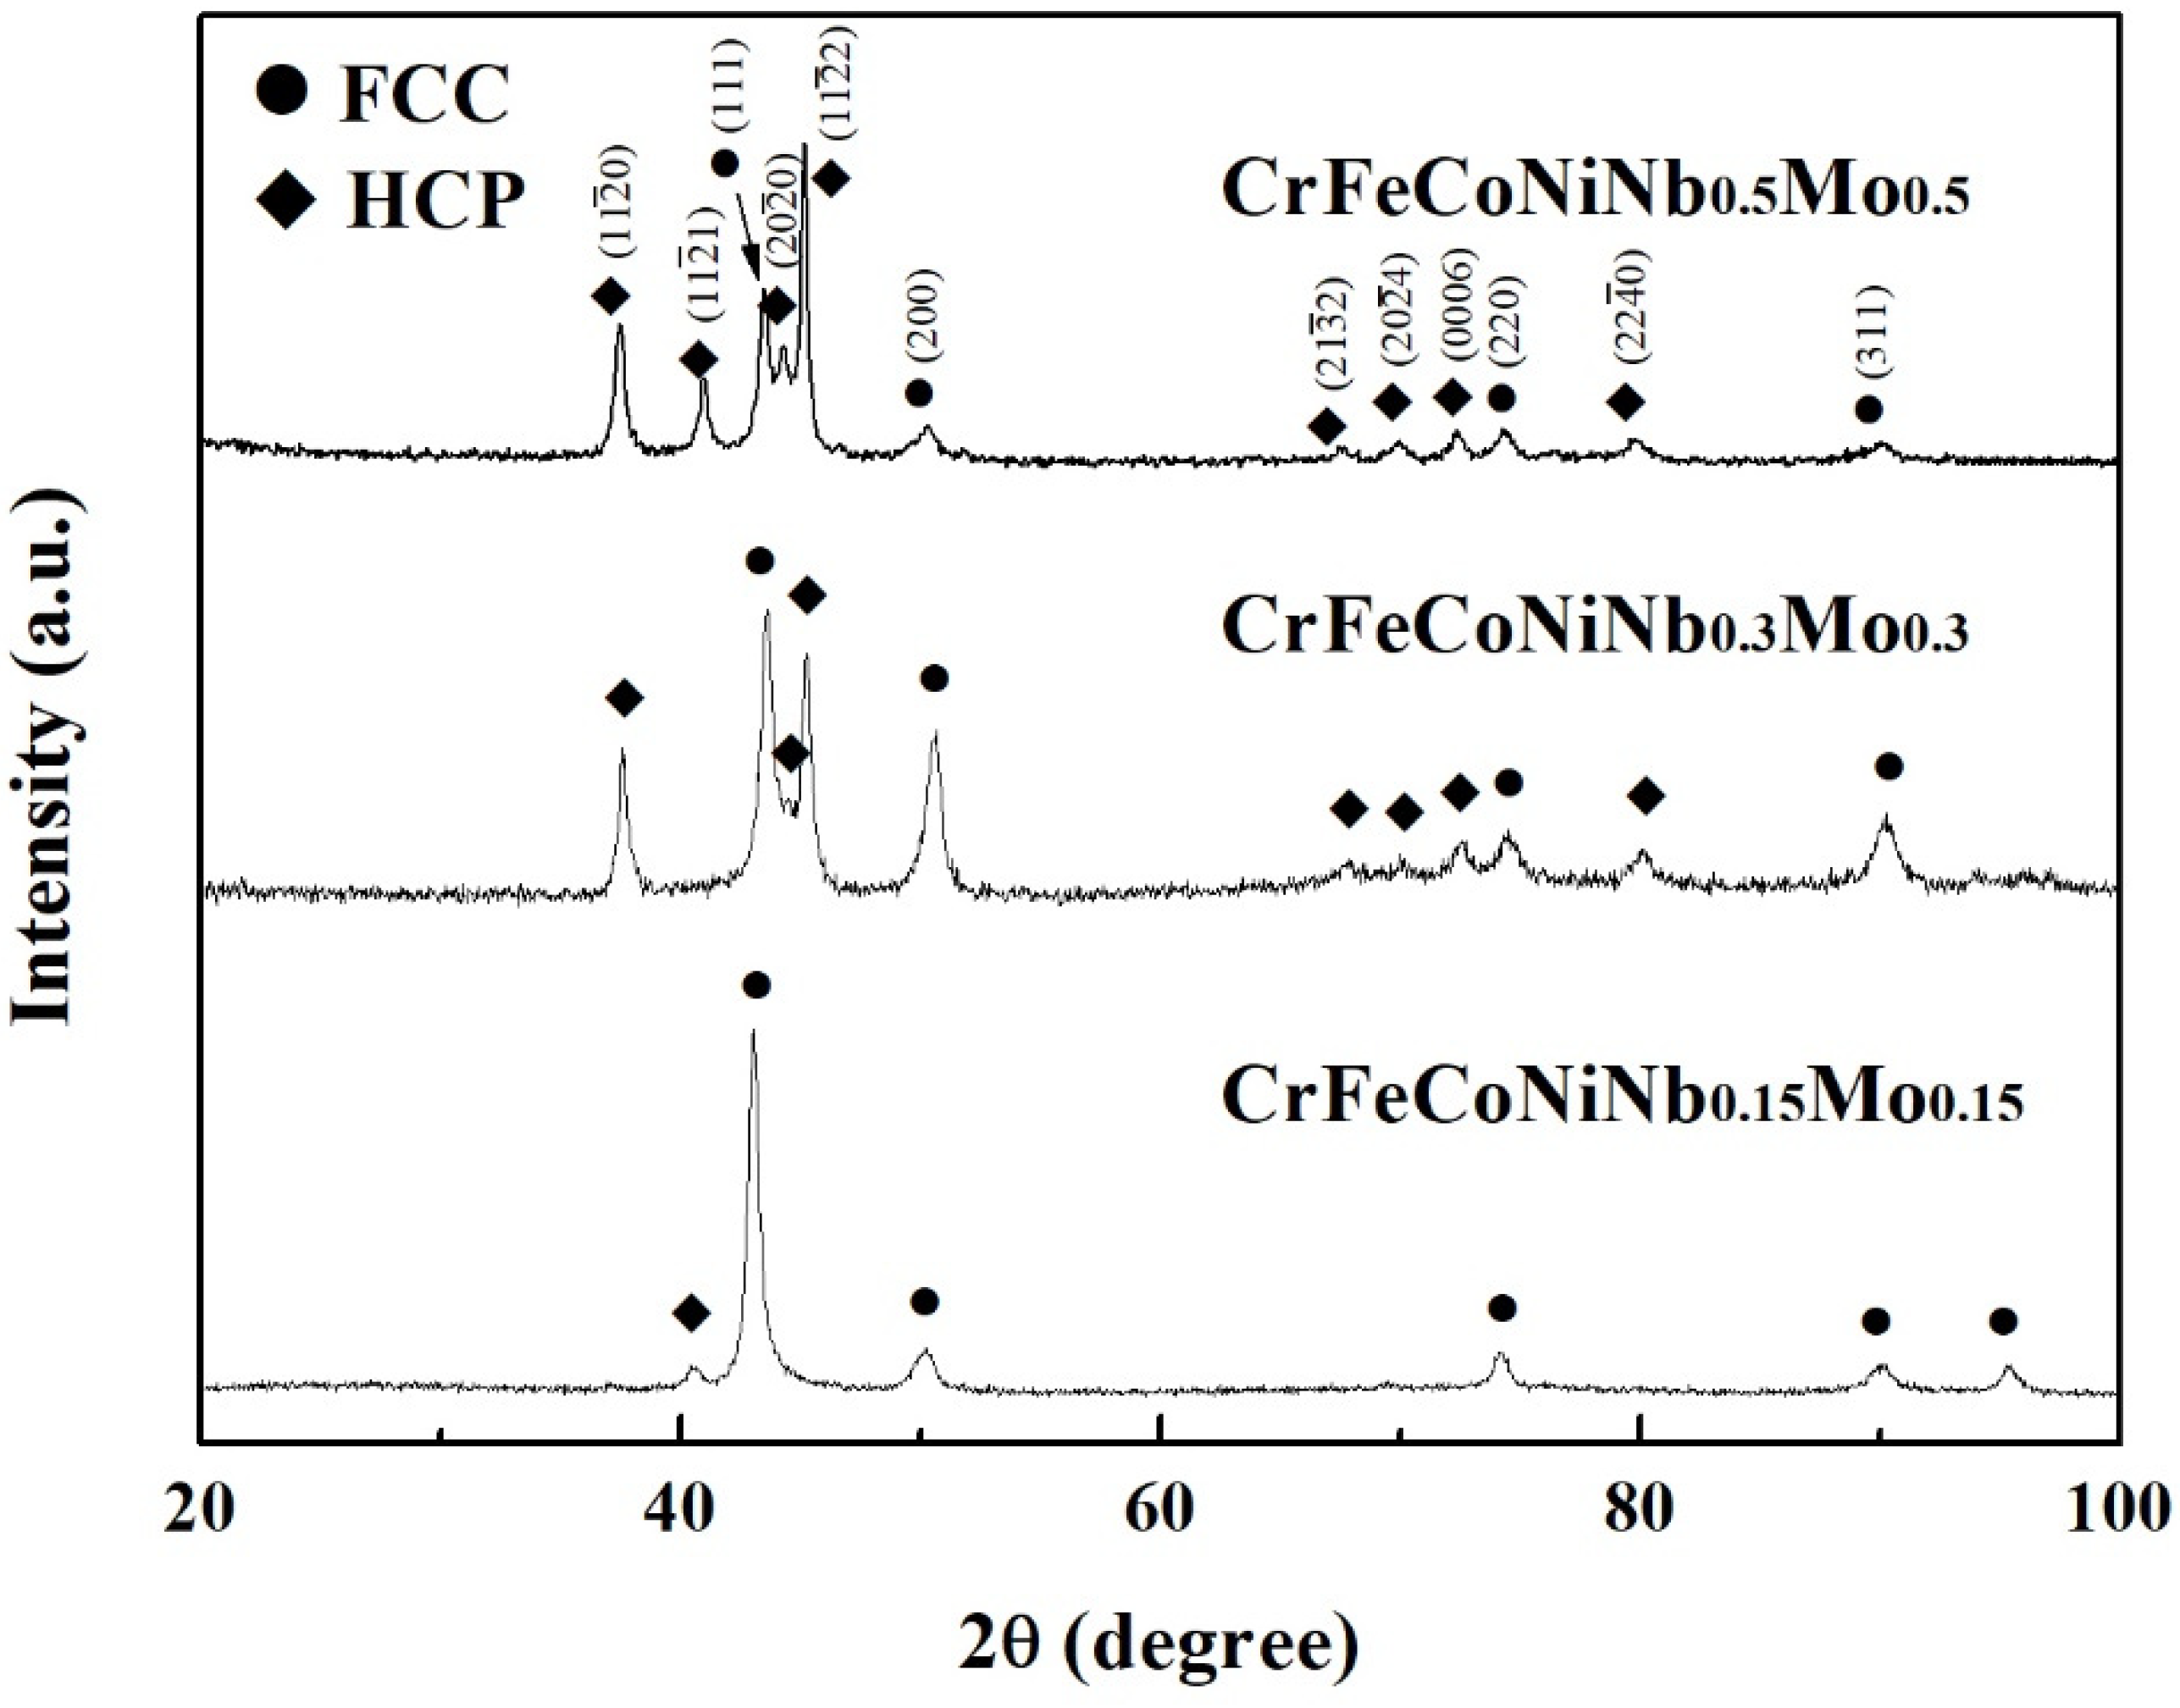
Figure 2 shows the XRD patterns of the CrFeCoNiNb
xMo
x alloys. Two phases of FCC and laves phases (HCP structure) were identified in these alloys. The FCC phase was the main phase in the CrFeCoNiNb
0.15Mo
0.15 alloy. Only a small amount of laves phase was in this alloy. Increasing the Nb and Mo content resulted in increasing the amount of laves phase. The laves phase became the major phase in the CrFeCoNiNb
0.5Mo
0.5 alloy. This result quite matches with the SEM observation.
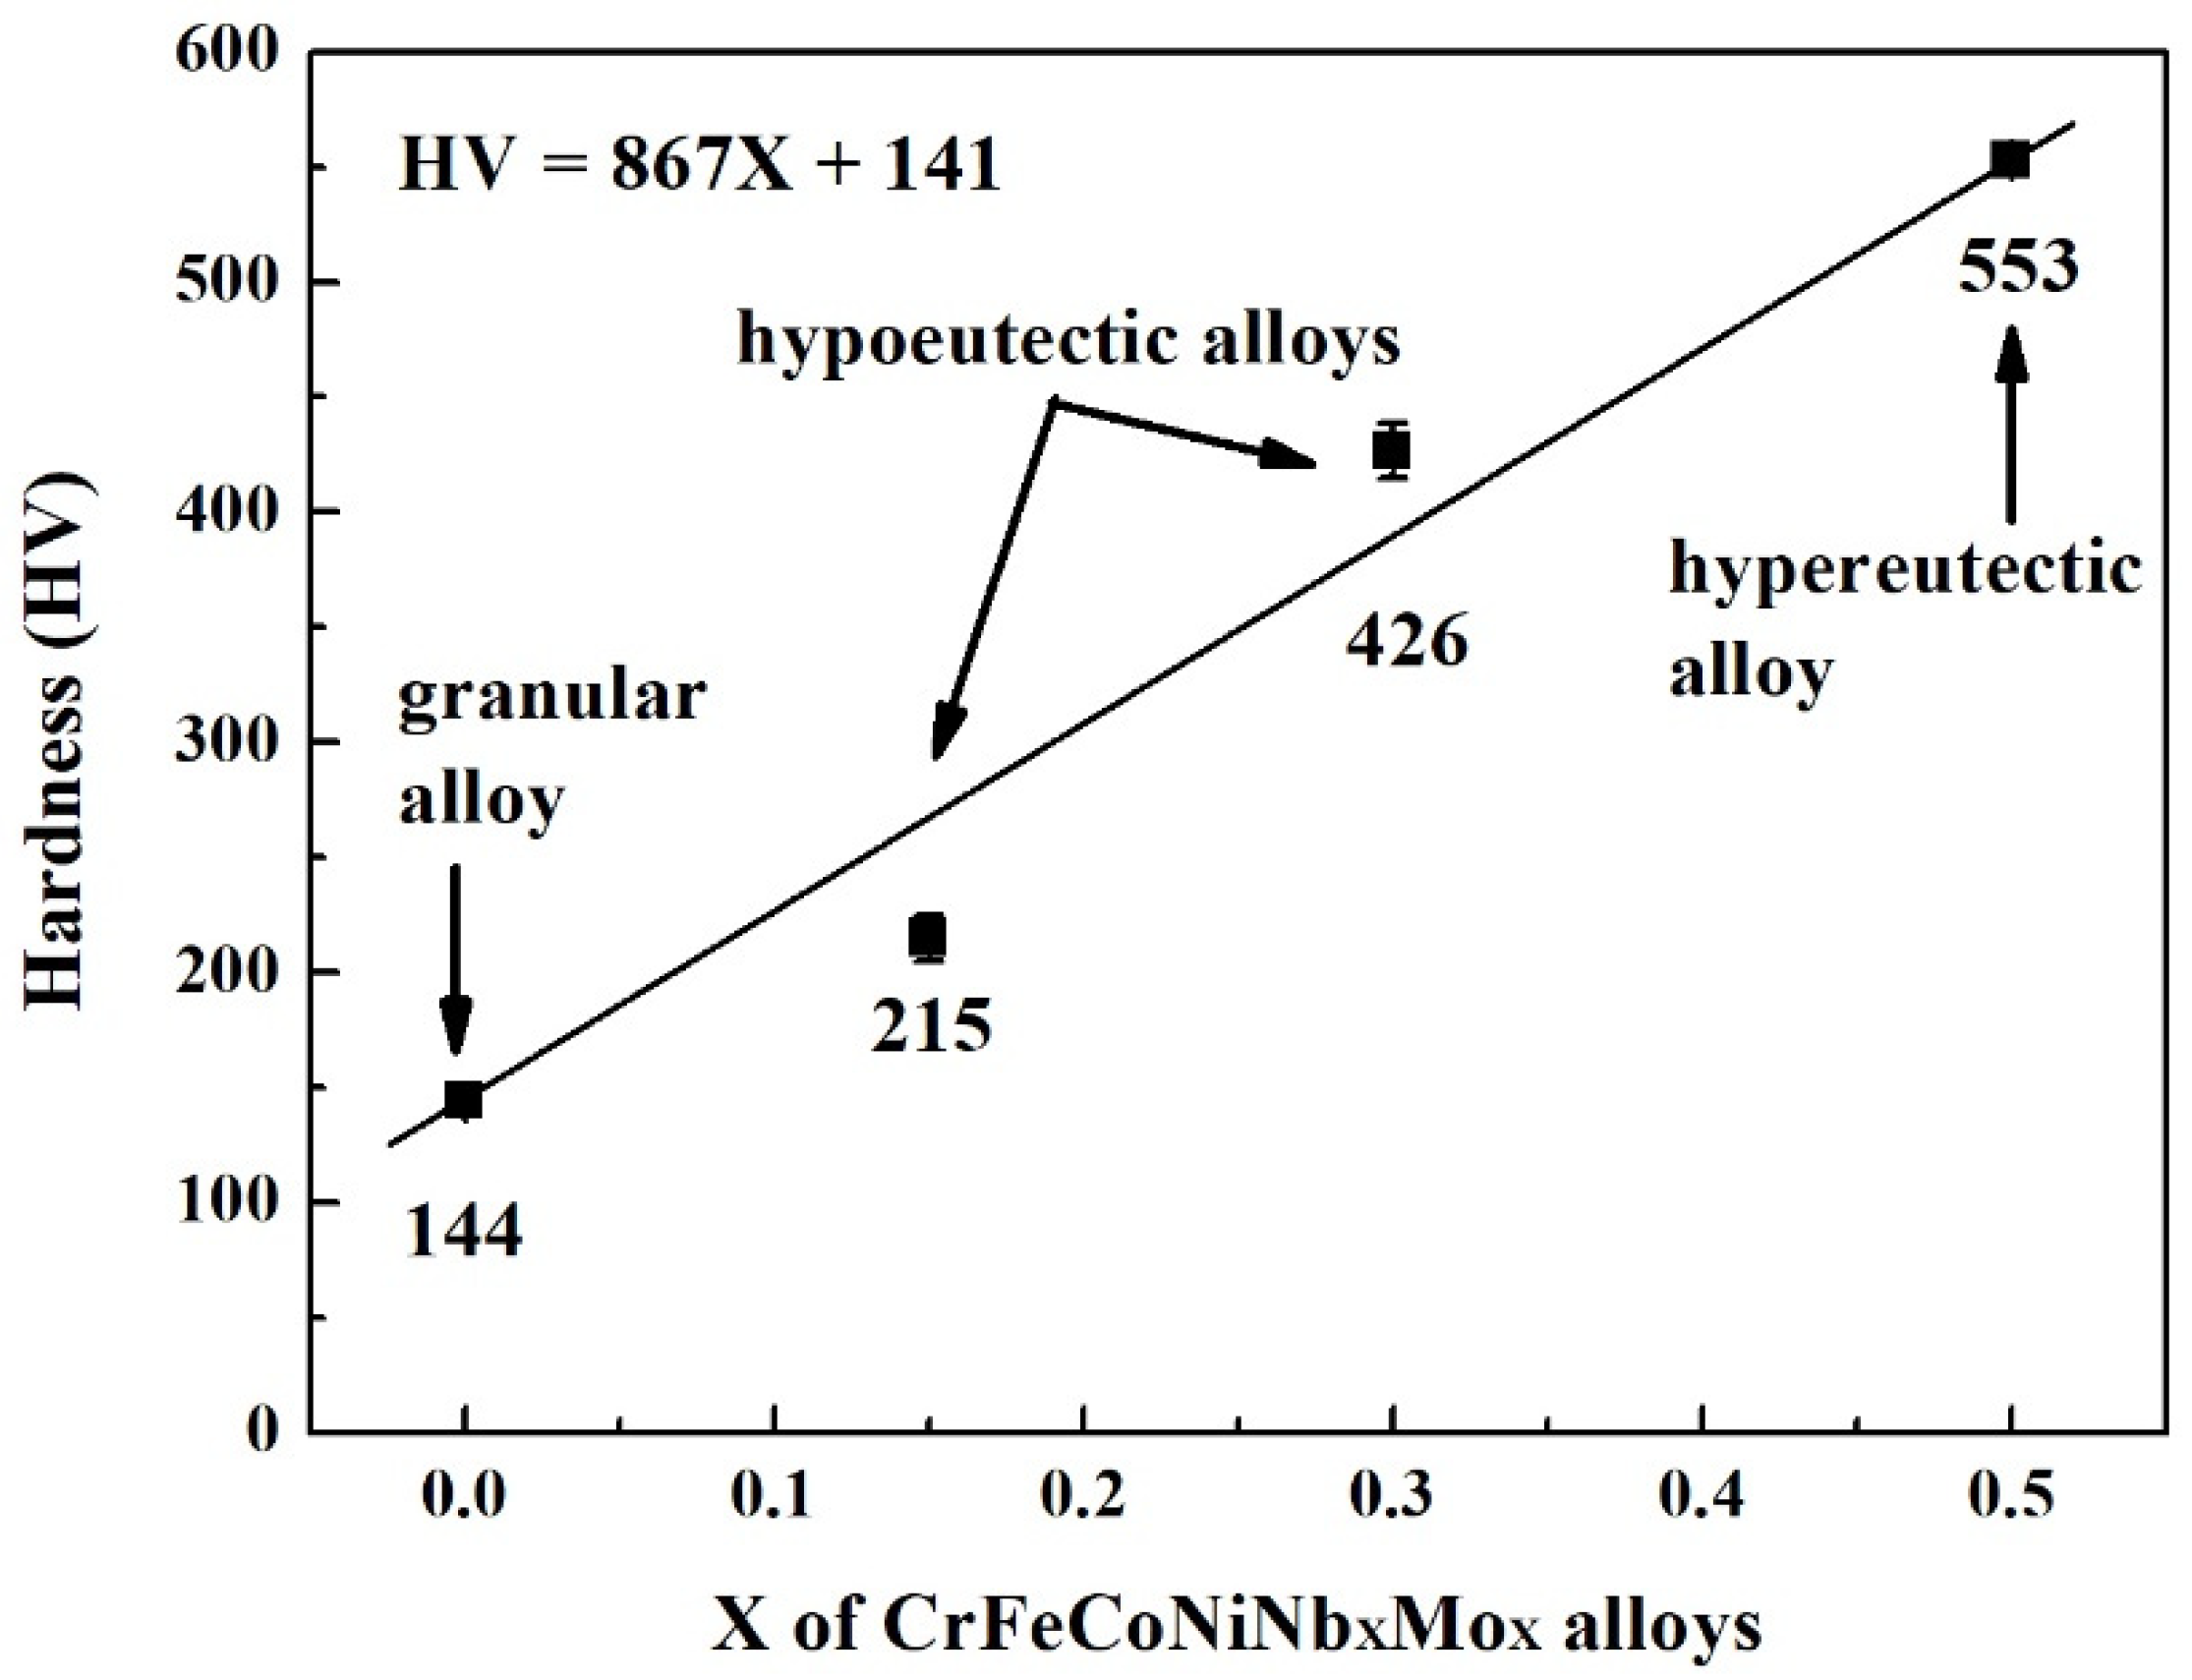
Figure 3 plots the hardness of CrFeCoNiNb
xMo
x alloys as a function of Nb and Mo content. Increasing Nb and Mo content would almost linearly increase the hardness of the CrFeCoNiNb
xMo
x alloys. The hardness of CrFeCoNiNb
0.15Mo
0.15 alloy was only 215 HV, and the hardness of CrFeCoNiNb
0.5Mo
0.5 reached 553 HV. Adding Nb and Mo into CrFeCoNi alloy increases the hardness because the atomic radiuses of niobium and molybdenum are larger than those of the other elements. The atomic radiuses of niobium and molybdenum are 1.43 and 1.40 Å, respectively; the atomic radiuses of cobalt, chromium, iron and nickel are 1.253, 1.249, 1.241 and 1.243 Å, respectively [
24]. Therefore, the hardness of the CrFeCoNiNb
xMo
x alloys increased due to the solid solution strengthening effect. Our previous work indicated that increasing niobium and molybdenum content increases the density of dislocation in the FCC phase [
23]. This was another effect enhancing the hardness of the alloys. Additionally, the hardness of the HCP-structured laves phase was higher than that of the FCC phase because the slip system of the HCP phase was less than that of the FCC phase. The hardness of CrFeCoNiNb
xMo
x alloys increased after adding more niobium and molybdenum elements due to the increase in the HCP phase and solid solution strengthening effect.
Figure 4 shows the potentiodynamic polarization curves of the as-cast CrFeCoNiNb
xMo
x alloys in 1 M deaerated H
2SO
4 solution at 30 °C. The potentiodynamic polarization data of these polarization curves are listed in
Table 3. The potentiodynamic polarization curves of the alloys with potential negative than corrosion potential (
Ecorr) was the cathode. The potentiodynamic polarization curves of the alloys with potential positive than corrosion potential was the anode. The corrosion potential (
Ecorr) of CrFeCoNiNb
xMo
x alloys was very close. The standard electrode potential of the elements used in present work is listed in
Table 4 [
25]. The niobium is more active than the other elements because the standard electrode potential of niobium is more negative. Therefore, the corrosion potential of CrFeCoNiNb
0.5Mo
0.5 alloy had the most negative corrosion potential (
Ecorr). The corrosion current densities (
icorr) of CrFeCoNiNb
xMo
x alloys were all around 10 μA/cm
2. The potentiodynamic polarization curve of CrFeCoNiNb
0.15Mo
0.15 alloy had an apparent anodic peak, and the other alloys had no anodic peak. The passivation potential (
Epp) and critical current density (
icrit) of the anodic peak of CrFeCoNiNb
0.15Mo
0.15 alloy is listed in
Table 3. Thus, the CrFeCoNiNb
0.3Mo
0.3 and CrFeCoNiNb
0.5Mo
0.5 alloys easily entered into the passivation regions and formed the passive films during corrosion in H
2SO
4 solution. The lowest passivation current densities (
ipass) of these alloys were about 12 A/cm
2. All the passivation regions of these alloys were breakdown at a potential (
Eb) of about 1.2 V (SHE) due to oxygen evolution reaction [
26].
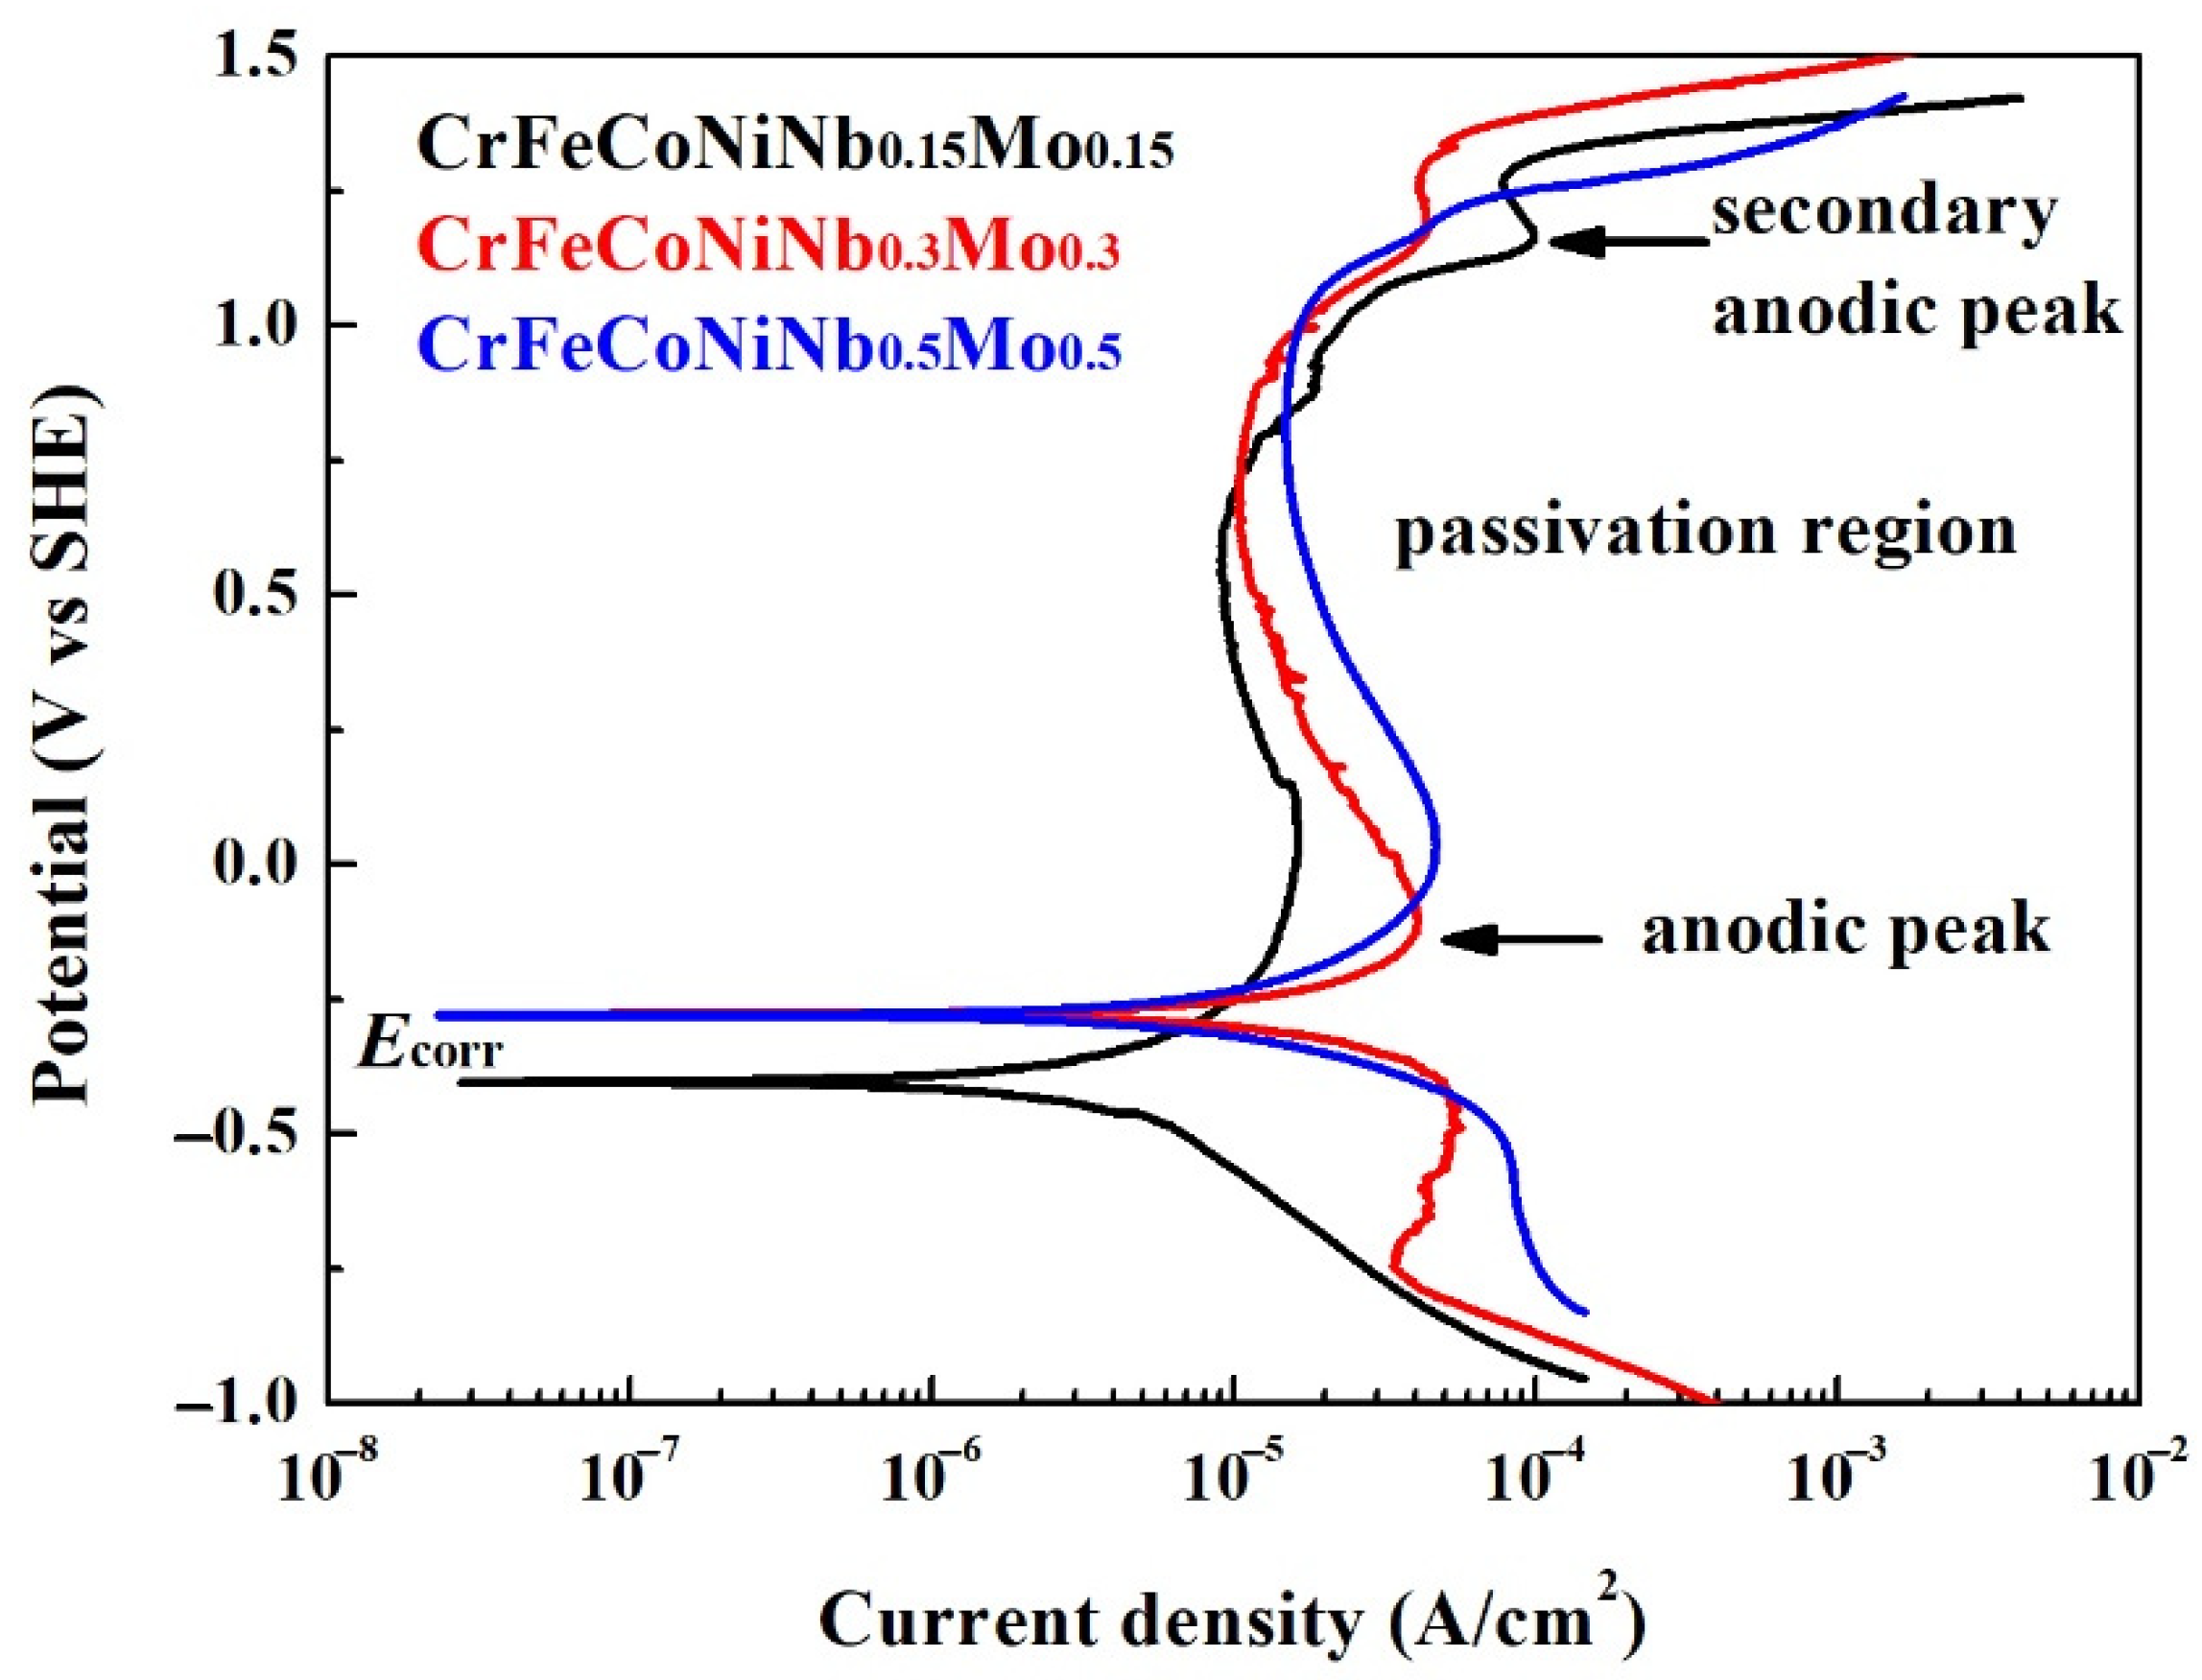
Figure 5 displays the potentiodynamic polarization curves of the as-cast CrFeCoNiNb
xMo
x alloys in 1 M deaerated NaCl solution at 30 °C. The potentiodynamic polarization data of these polarization curves are listed in
Table 5. The corrosion potential (
Ecorr) of CrFeCoNiNb
0.15Mo
0.15 alloy was more negative than the other alloys, and CrFeCoNiNb
0.15Mo
0.15 alloy also had the smallest corrosion current density (
icorr). All of the potentiodynamic polarization curves of CrFeCoNiNb
xMo
x alloys in 1 M deaerated NaCl solution had apparent anodic peaks. Additionally, the potentiodynamic polarization curves of Cr–FeCoNiNb
0.15Mo
0.15 and CrFeCoNiNb
0.3Mo
0.3 alloys had small secondary anodic peaks. The CrFeCoNiNb
0.15Mo
0.15 alloy had the lowest passivation current density. The passivation current densities (
ipass) of these alloys were about 9–15 μA/cm
2.
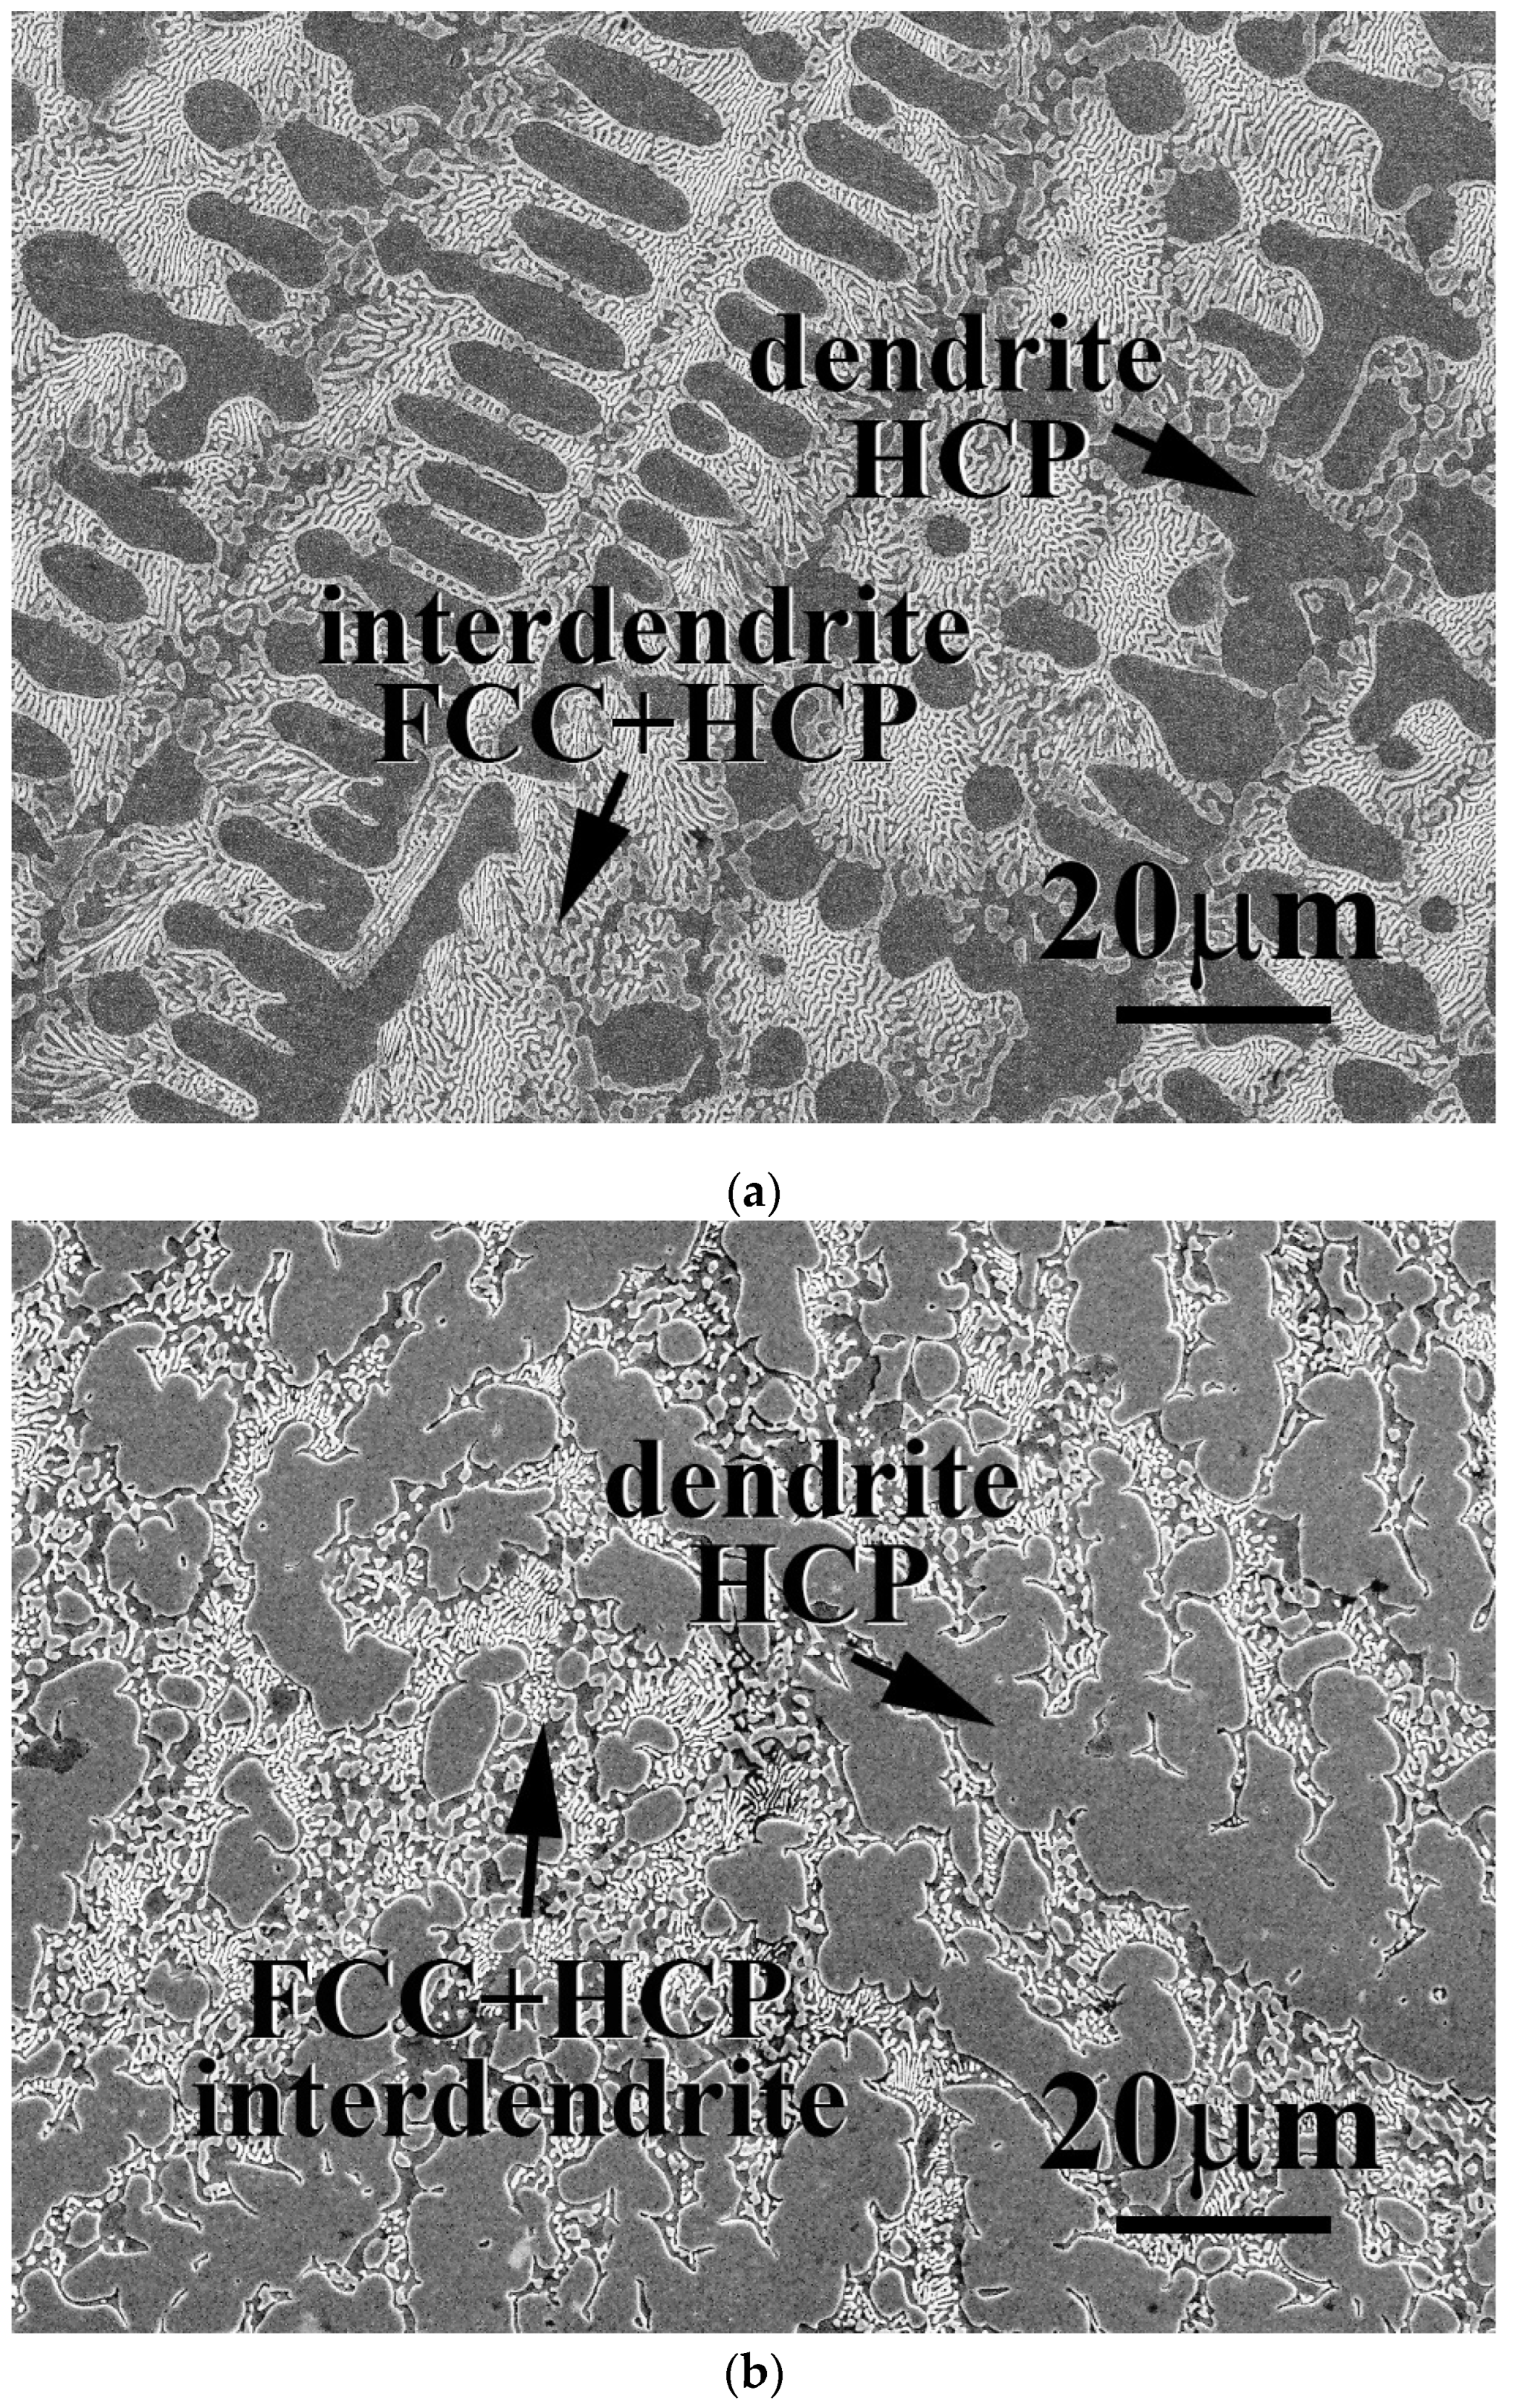
3.2. CrFeCoNiNbxMo1−x Alloys
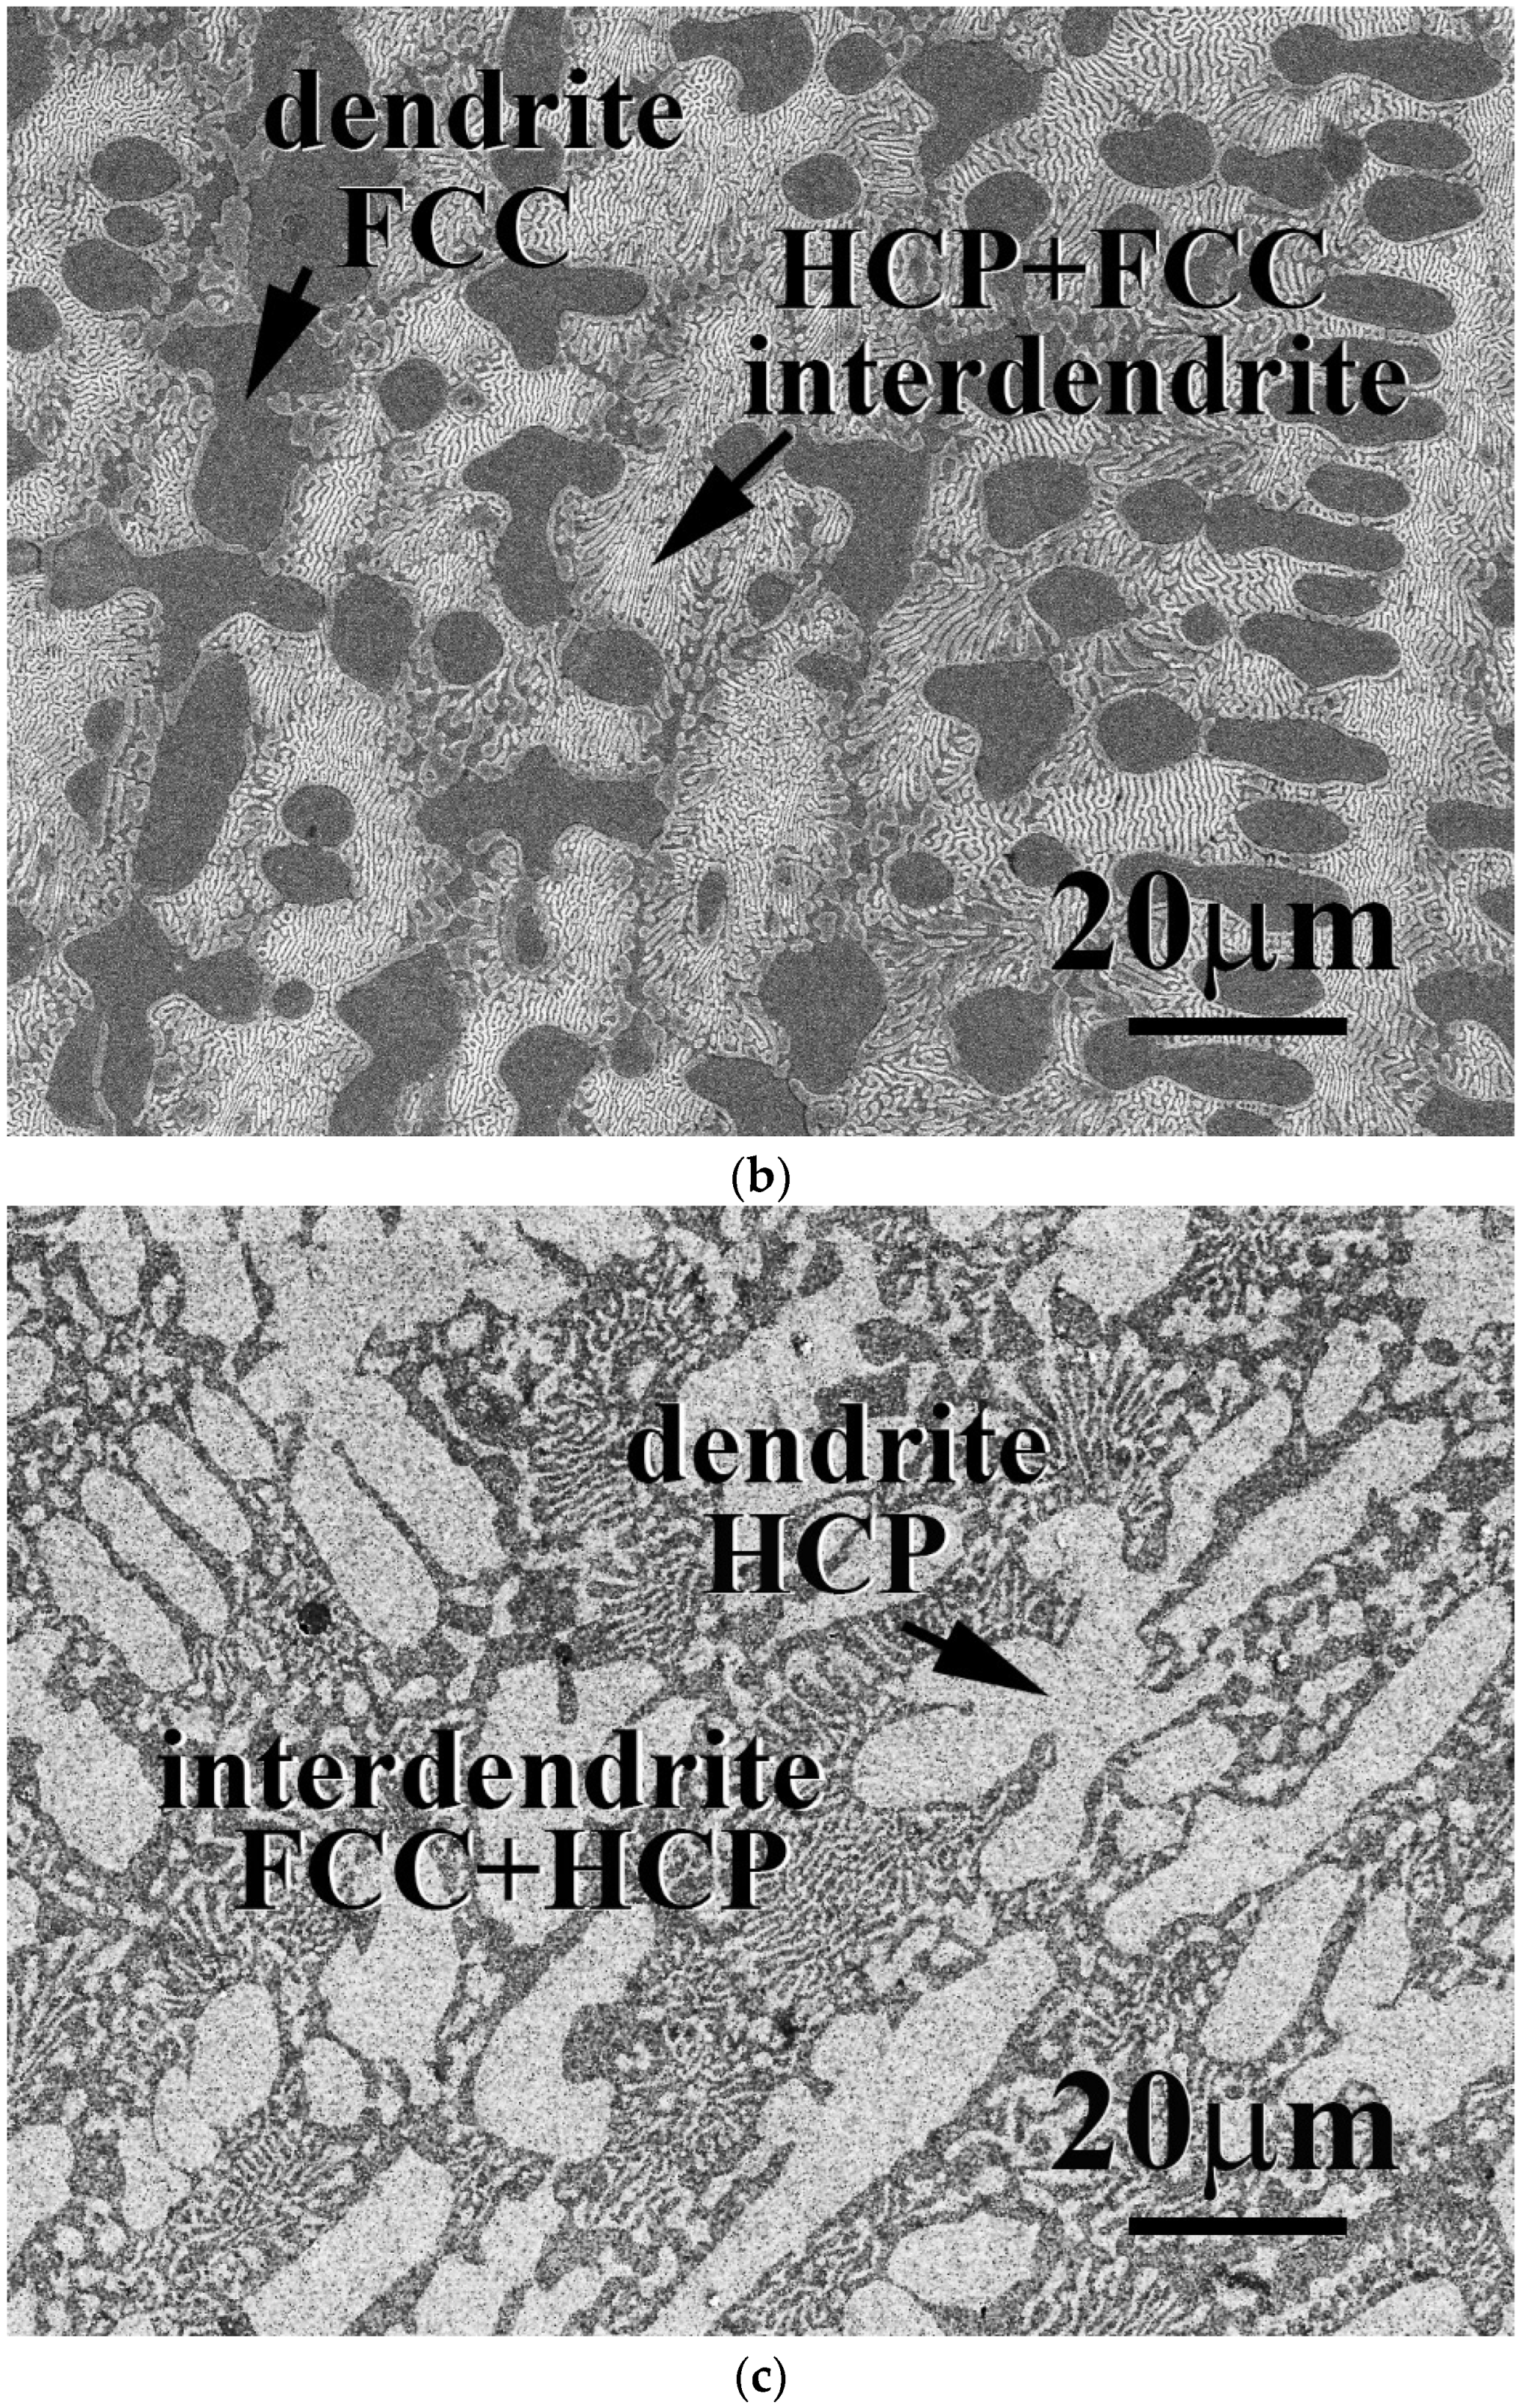
The microstructures and properties of CrFeCoNiNb
xMo
1−x alloys were studied in this part. The total amount of Nb and Mo of these alloys was kept as one part; the amount of Nb and Mo thus equaled 20 at.%. The microstructures of as-cast CrFeCoNiNb
xMo
1−x alloys, x = 0.25 and 0.75, are shown in
Figure 6. All of the CrFeCoNiNb
xMo
1−x alloys, x = 0.25, 0.5 and 0.75, had a hypereutectic microstructure because a large amount of Nb and Mo were added into these alloys. The dendrites of CrFeCoNiNb
xMo
1−x alloys were an HCP phase (laves phase), and the interdendrites of CrFeCoNiNb
xMo
1−x alloys were a eutectic structure with FCC and HCP phases (laves phase).
Table 6 lists the chemical compositions of the alloys and the phases existing in the alloys. As described above, the Nb and Mo content in the HCP phase of the alloys is higher than that in the FCC phase.
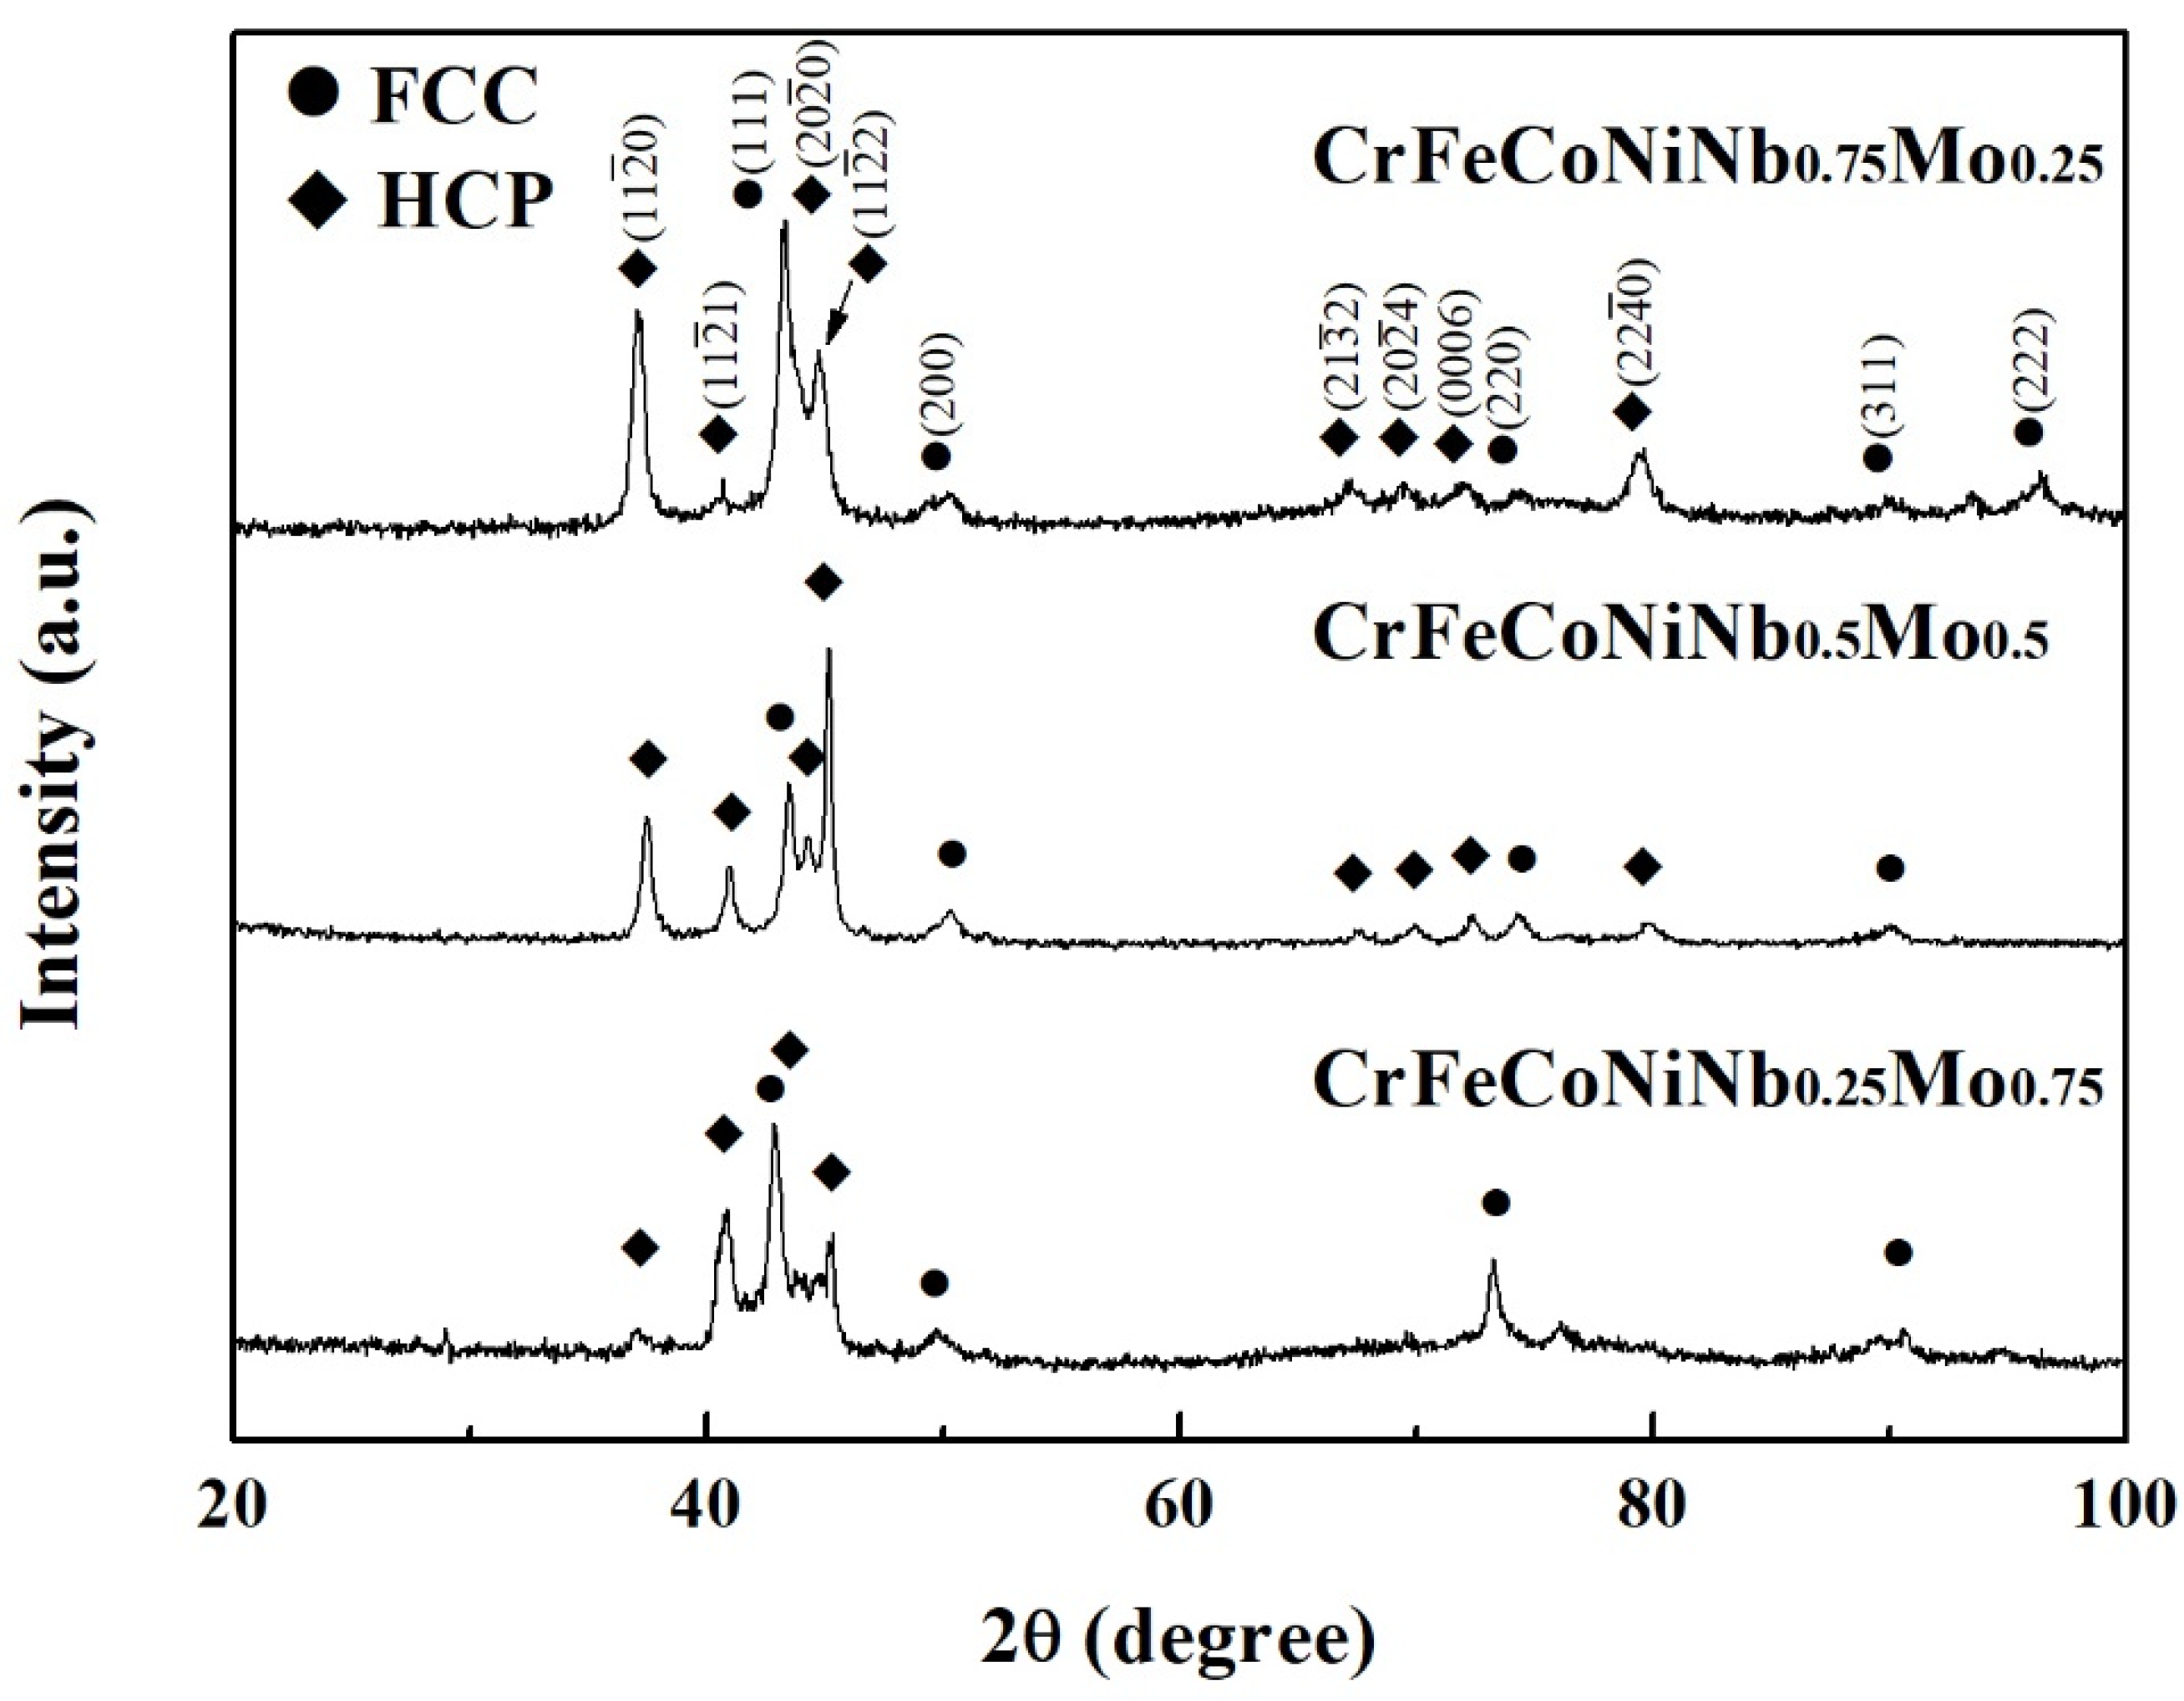
Figure 7 shows the XRD patterns of the CrFeCoNiNb
xMo
1−x alloys. Two phases existing in these alloys were FCC and HCP-structured laves phases. The HCP phase was the main phase in these CrFeCoNiNb
xMo
1−x alloys, and the FCC phase became the minor phase in these alloys.
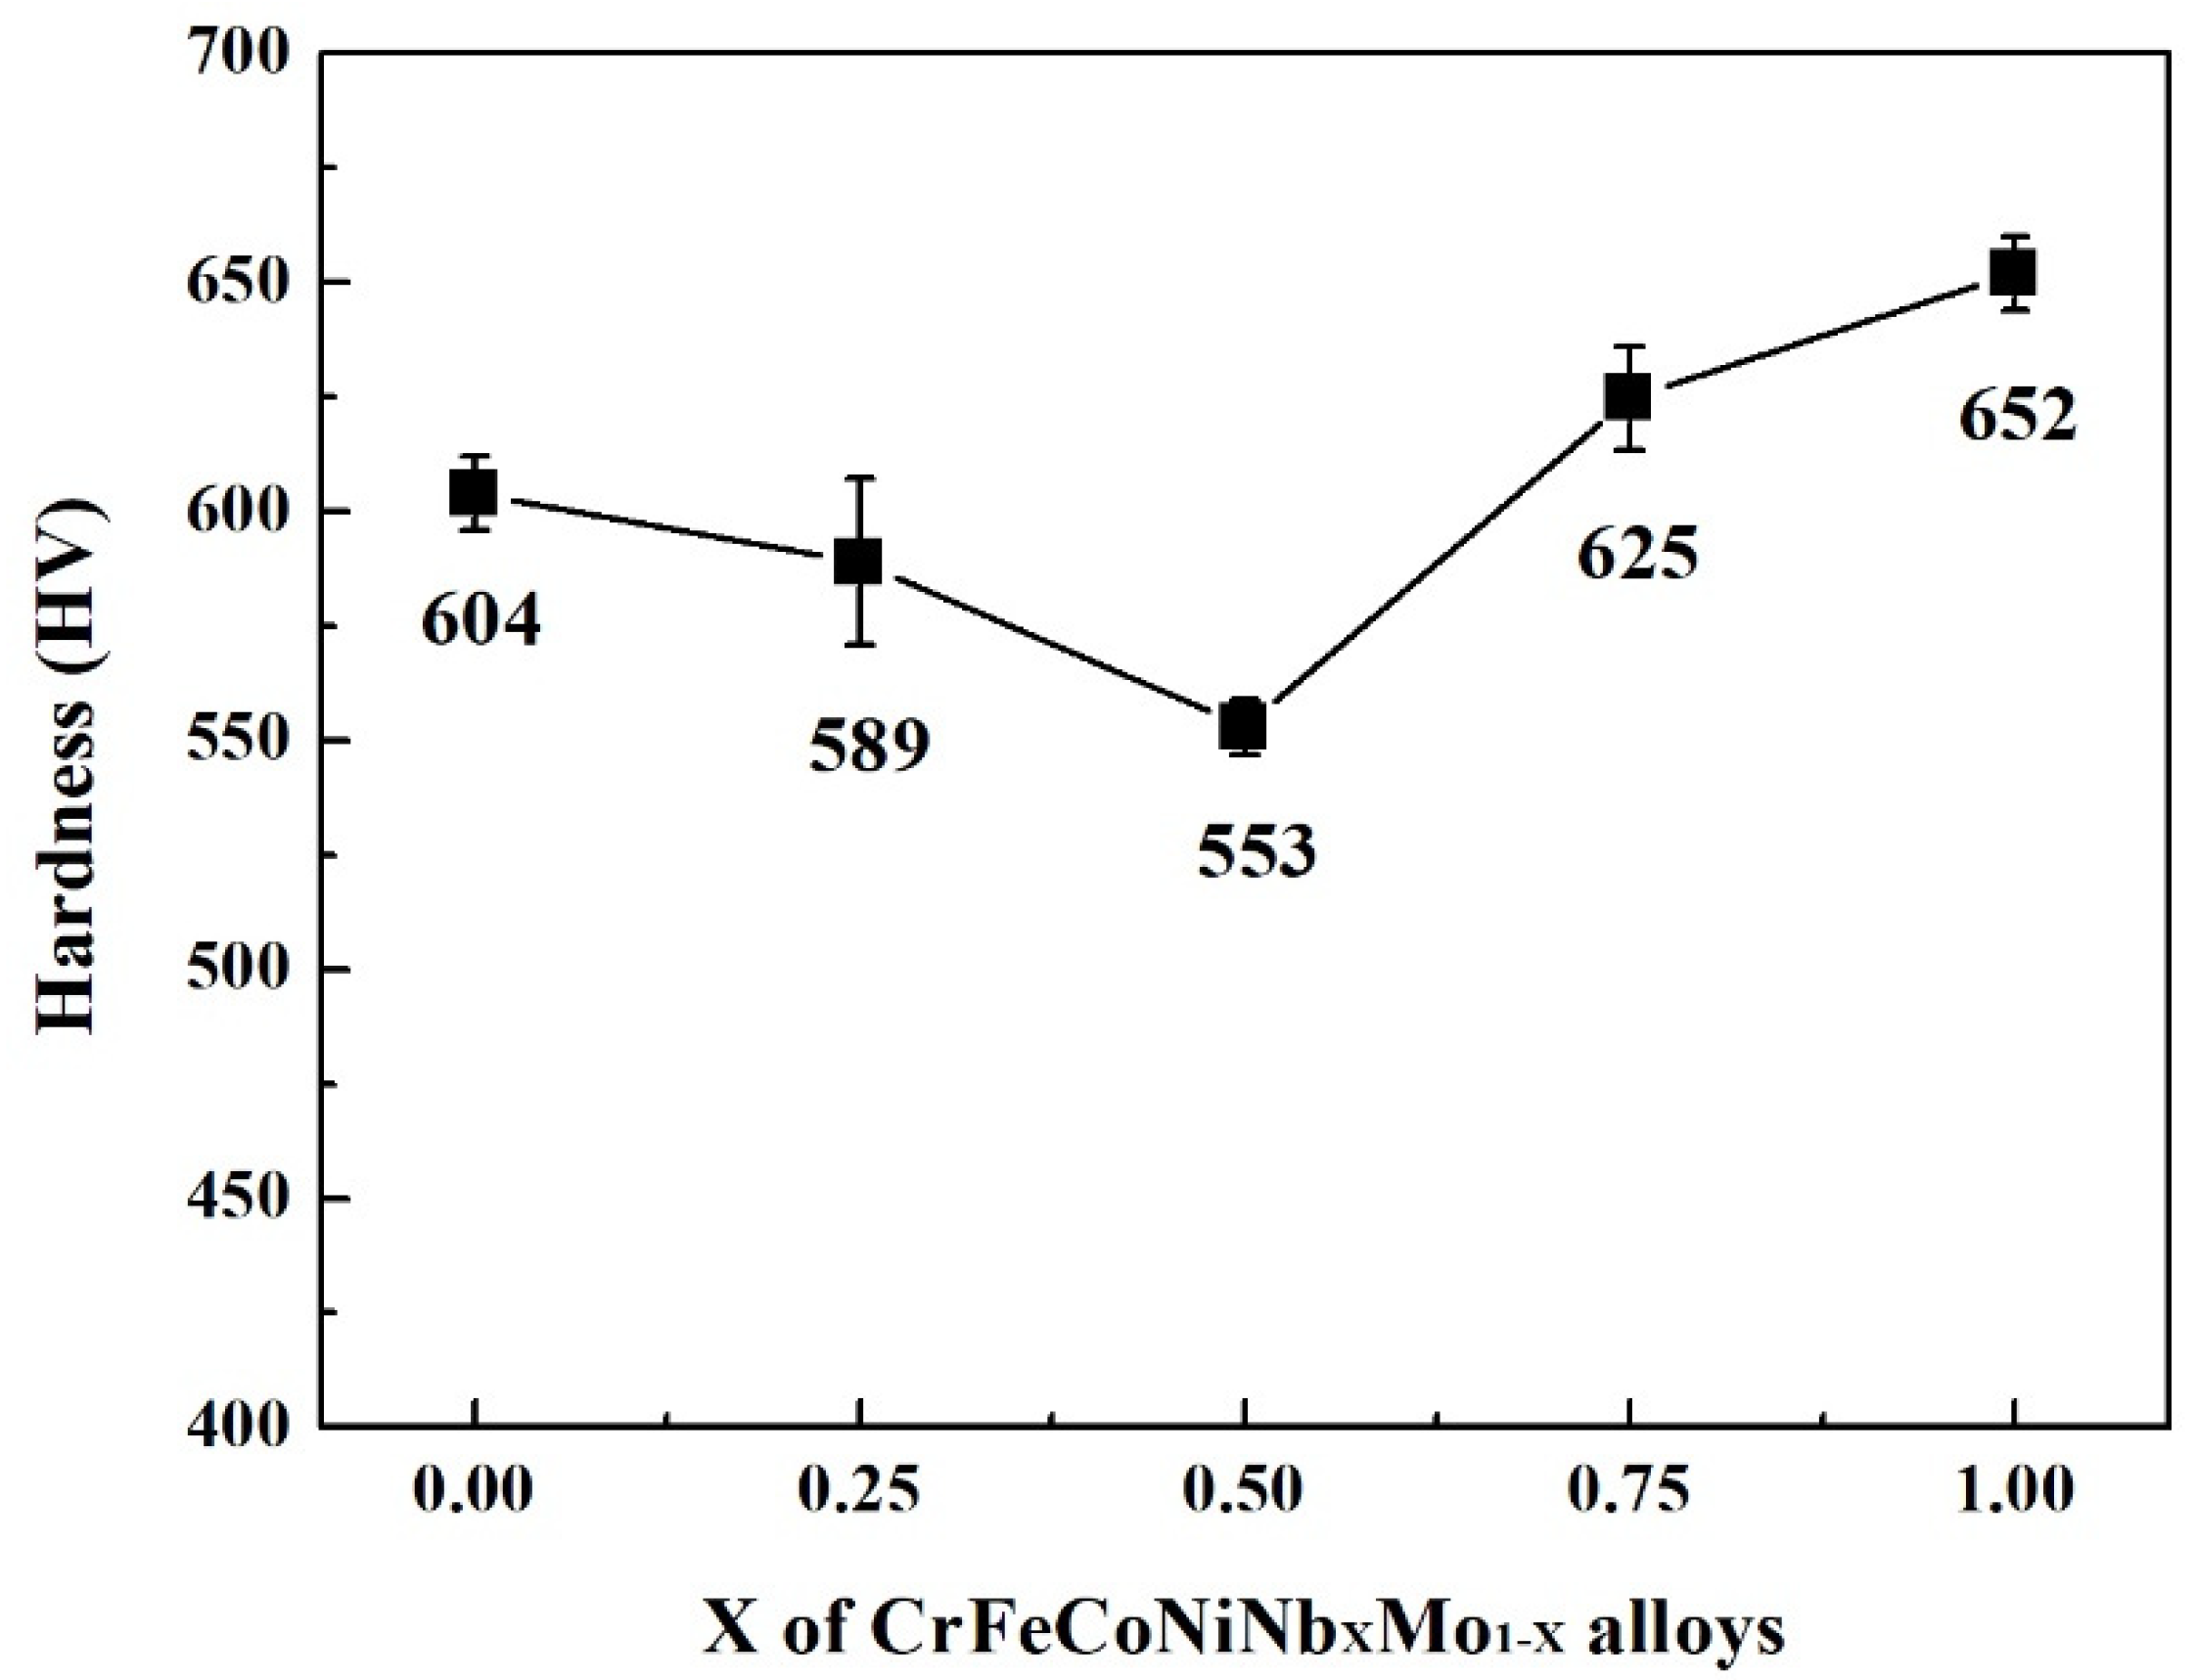
Figure 8 displays the hardness of CrFeCoNiNb
xMo
1−x alloys, some of the data were from our previous study [
23]. According to our previous study, the overall hardness of the alloy was contributed by the hard HCP dendrites and the soft interdendrities (HCP + HCC). The hardness of both HCP and FCC phases increased with increasing the content of Nb and Mo due to solid solution strengthening. However, the hardness of the FCC phase was still softer than that of the HCP phase. Because the hardness of interdendrities was softer than that of dendrites, increasing the volume fraction of interdendrite would decrease the overall hardness of the alloy. The CrFeCoNiNb
0.5Mo
0.5 alloy had the lowest hardness among these alloys because of the largest ratio of interdendrities in this alloy. The CrFeCoNiNb
0.75Mo
0.25 alloy had the highest hardness of 625 HV among the alloys in the present study.
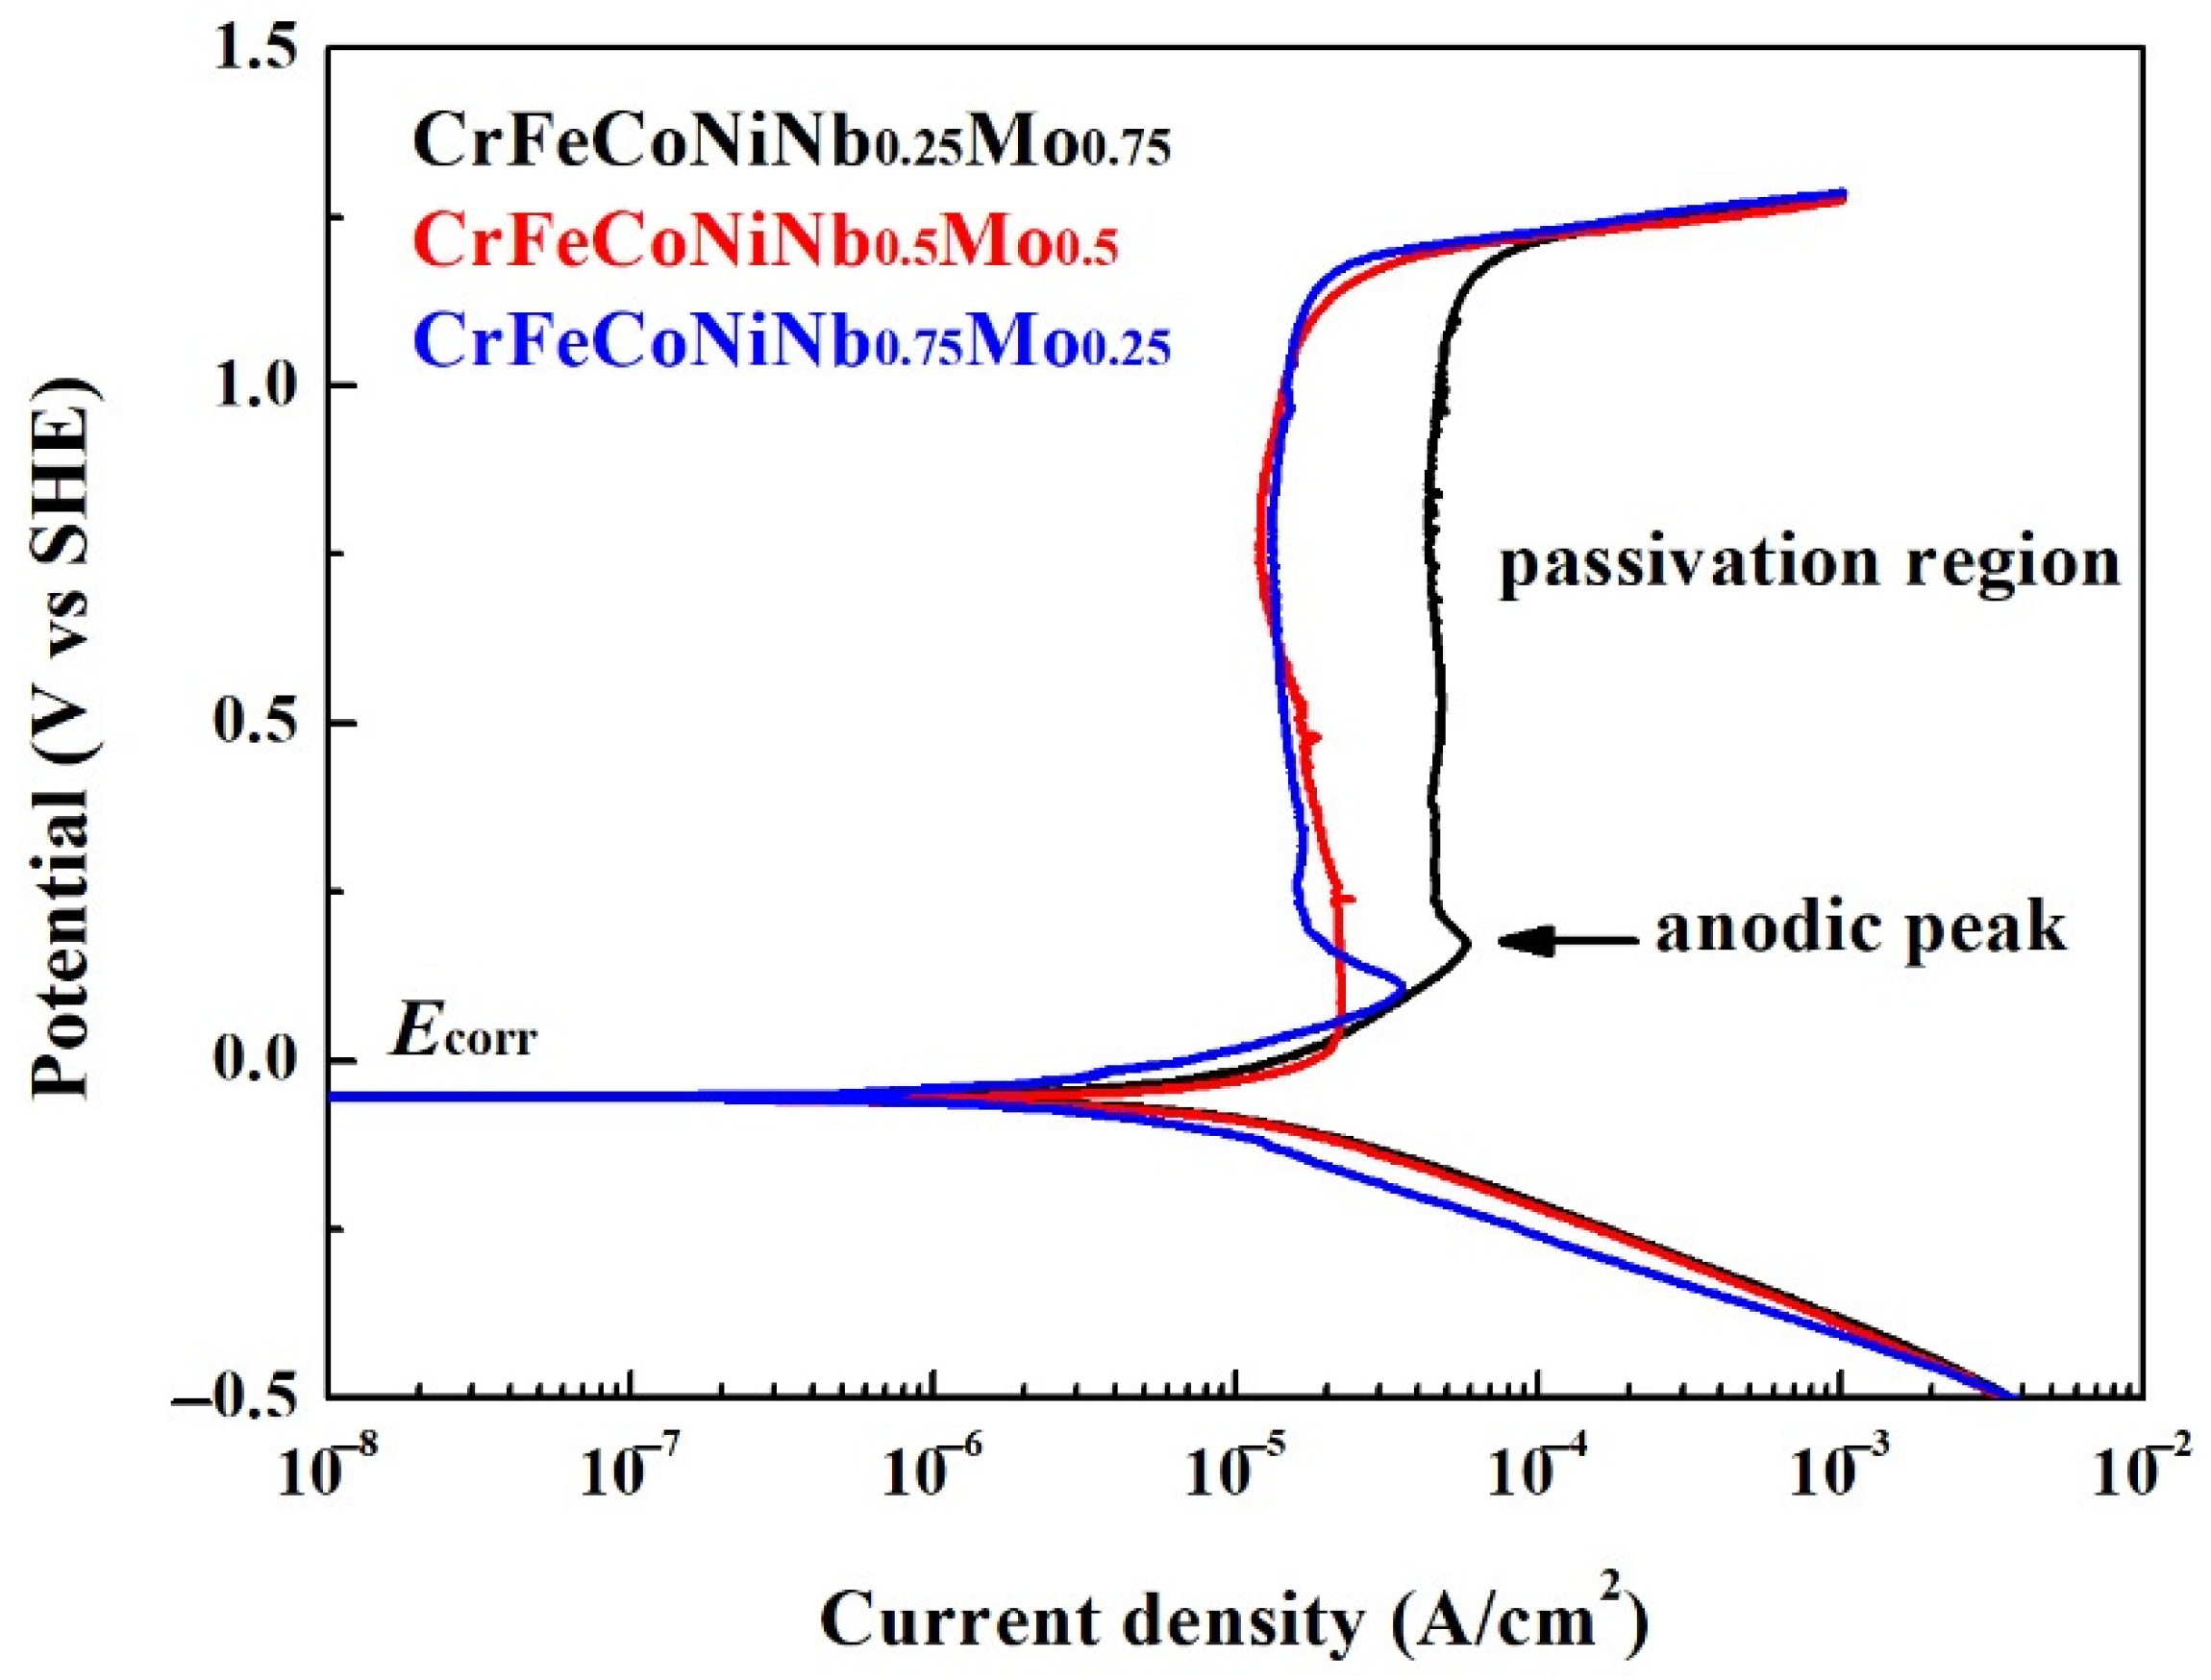
Figure 9 shows the potentiodynamic polarization curves of the as-cast CrFeCoNiNb
xMo
1−x alloys in 1 M deaerated H
2SO
4 solution at 30 °C. The potentiodynamic polarization data of these polarization curves are listed in
Table 7. The corrosion potential (
Ecorr) and the corrosion current densities (
icorr) of CrFeCoNiNb
xMo
1−x alloys were very close; the CrFeCoNiNb
0.25Mo
0.75 alloy had the lowest
icorr of about 5 μA/cm
2. The potentiodynamic polarization curve of CrFeCoNiNb
0.25Mo
0.75 and CrFeCoNiNb
0.75Mo
0.25 alloys had apparent anodic peaks, but the CrFeCoNiNb
0.5Mo
0.5 alloy had no anodic peak. The passivation potential (
Epp) and critical current density (
icrit) of the anodic peaks of the alloys are listed in
Table 7. This indicated that the CrFeCoNiNb
0.5Mo
0.5 alloys easily entered the passivation regions and formed the passive films during corrosion in H
2SO
4 solution among these alloys. The current densities of the passivation regions (
ipass) of CrFeCoNiNb
0.5Mo
0.5 and CrFeCoNiNb
0.75Mo
0.25 alloys were about 12 A/cm
2, but the CrFeCoNiNb
0.25Mo
0.75 alloy had a larger passivation current density (
ipass). The passivation regions of these alloys were all breakdown at a potential (
Eb) of about 1.2 V (SHE) because of oxygen evolution reaction [
26]. In order to compare the properties of corrosion potential, corrosion current density, anodic peak and passivation region of each alloy in the present study, the CrFeCoNiNb
0.5Mo
0.5 alloy had the best corrosion resistance among the alloys in H
2SO
4 solution.
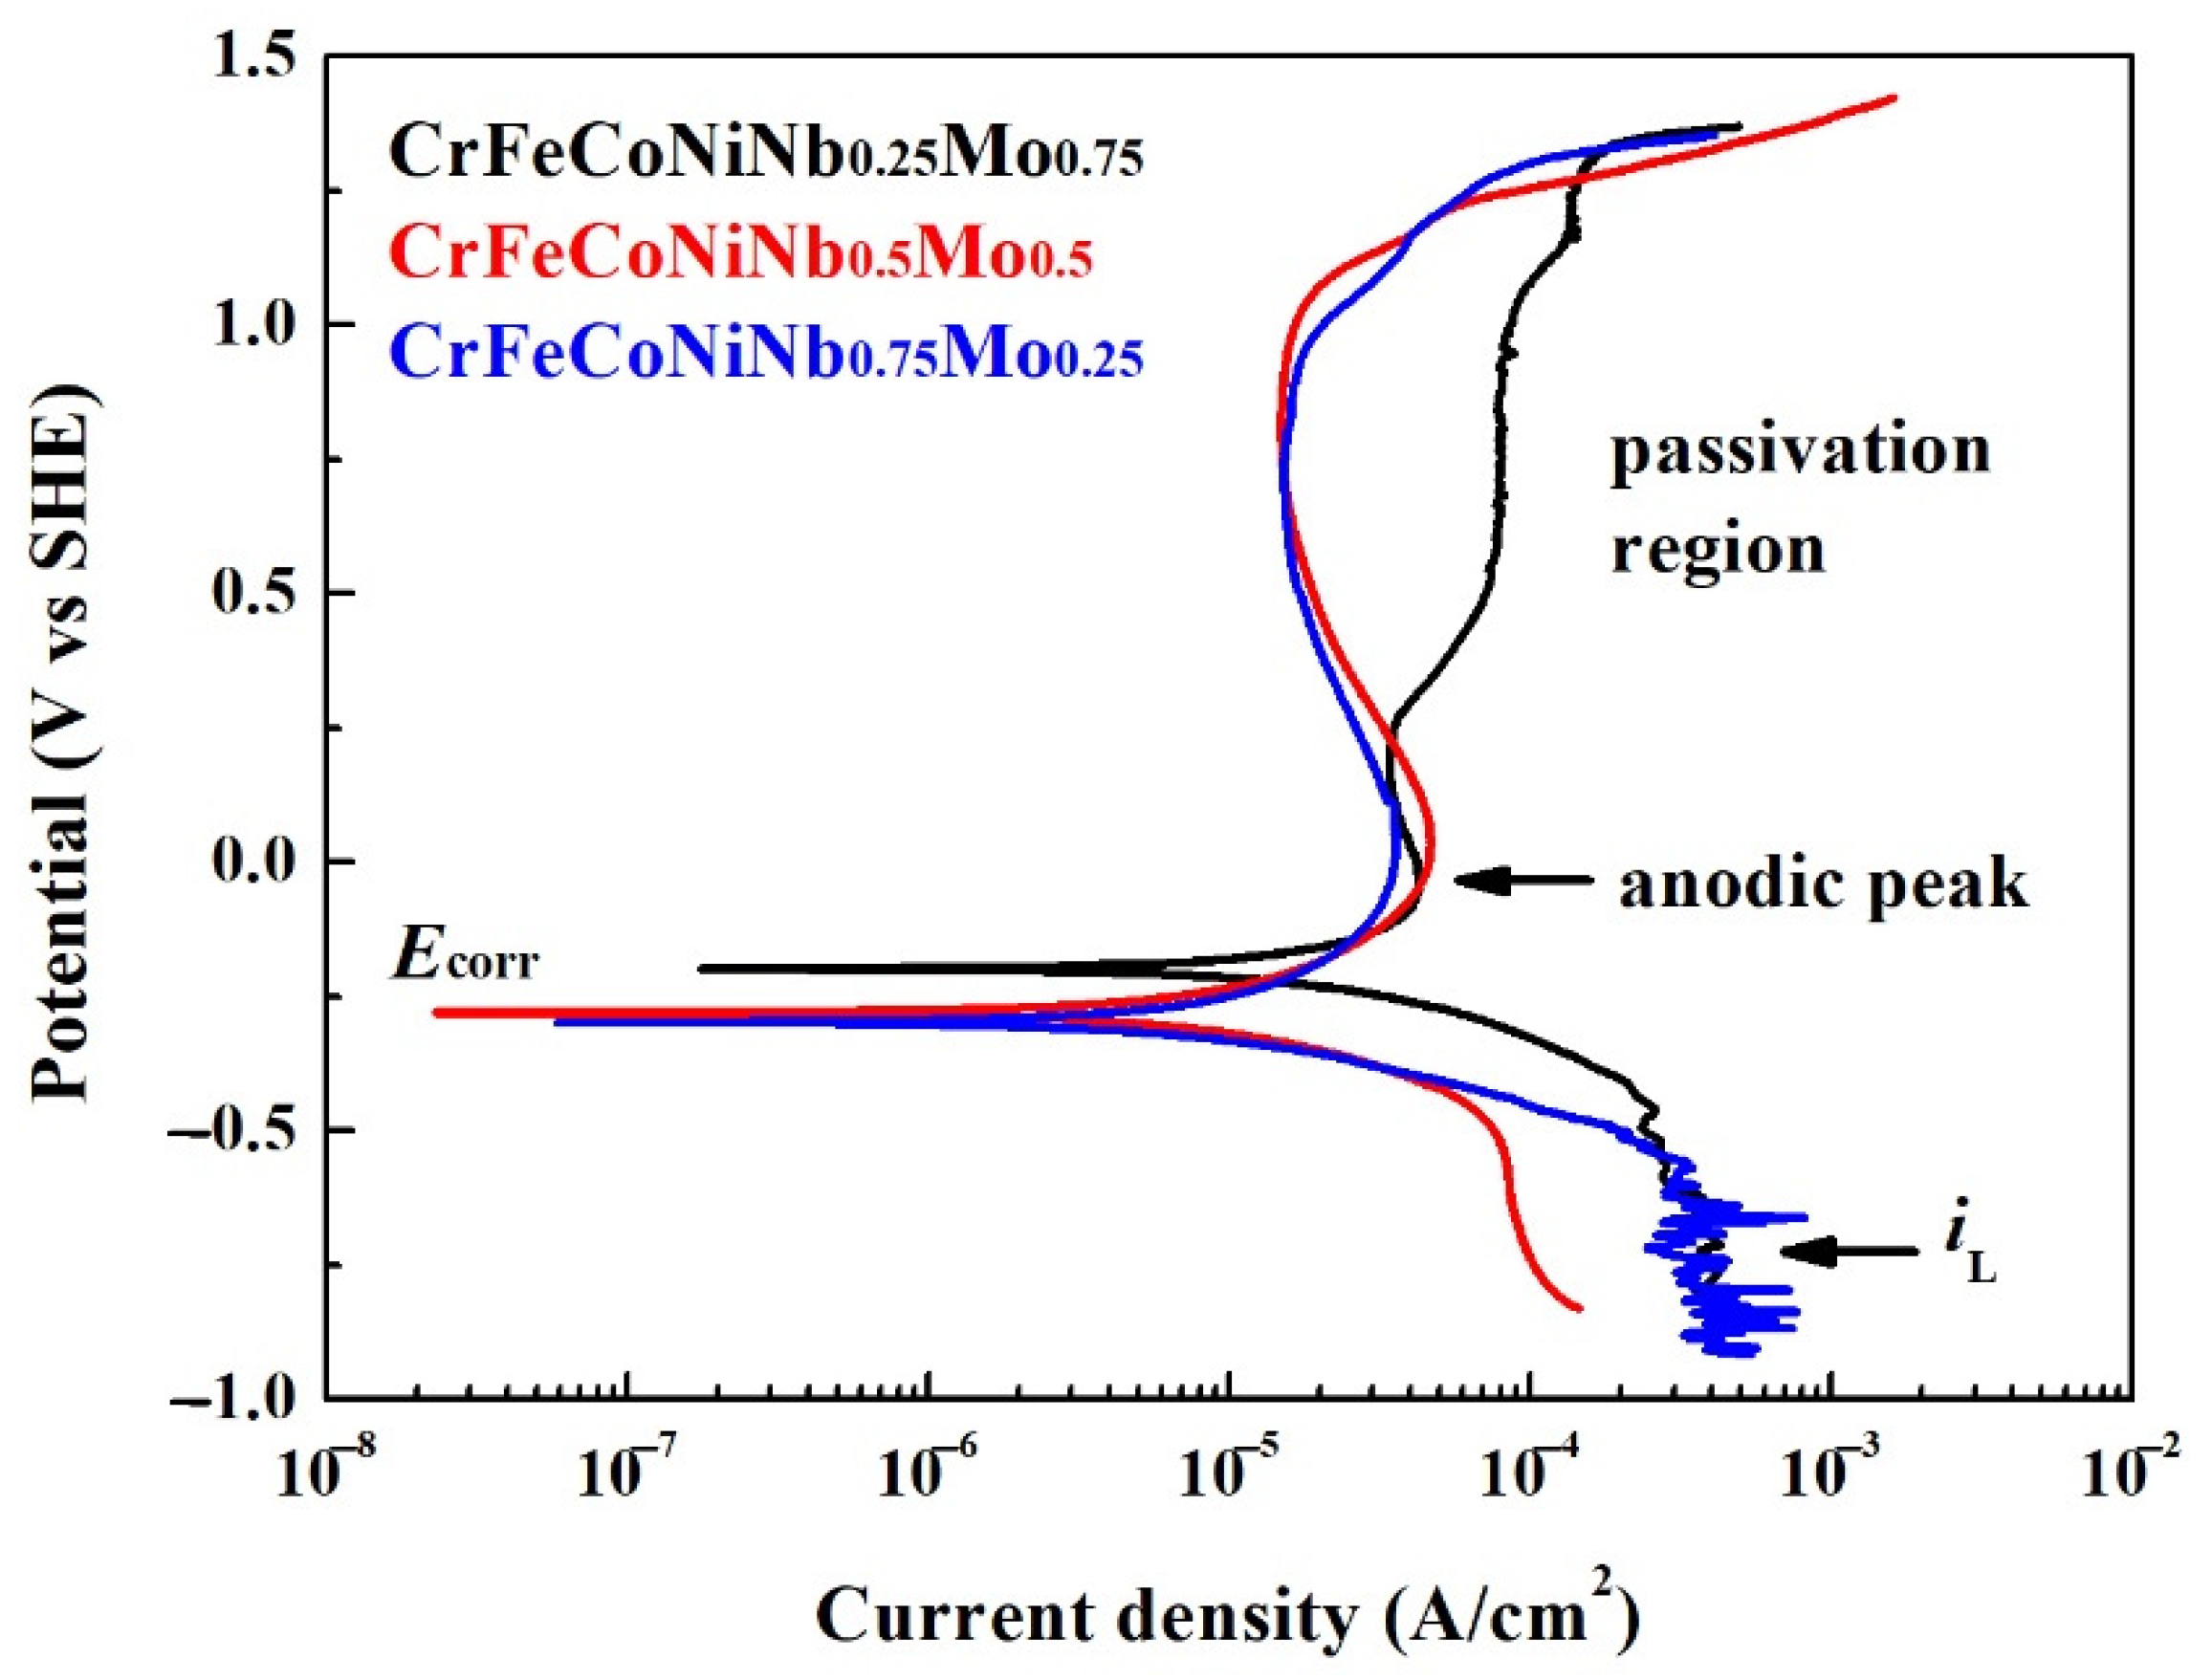
Figure 10 shows the potentiodynamic polarization curves of the as-cast CrFeCoNiNb
xMo
1−x alloys in 1 M deaerated NaCl solution at 30 °C. The potentiodynamic polarization data of these polarization curves are listed in
Table 8. The cathodic limit current density (
iL) was found in these CrFeCoNiNb
xMo
1−x alloys. The cathodic limit current density meant that the maximum reaction rate was limited because of the diffusion rate of hydroxyl ions (OH
−) in the solution [
26]. The corrosion potential (
Ecorr) of CrFeCoNiNb
0.25Mo
0.75 alloy was more positive than the other alloys; the corrosion potential (
Ecorr) of CrFeCoNiNb
0.5Mo
0.5 and CrFeCoNiNb
0.75Mo
0.25 alloy was very close. Moreover, the corrosion current density (
icorr) of CrFeCoNiNb
0.25Mo
0.75 alloy was larger than the other alloys. The corrosion current density (
icorr) of CrFeCoNiNb
0.5Mo
0.5 and CrFeCoNiNb
0.75Mo
0.25 alloys were about 10 μA/cm
2. All of the CrFeCoNiNb
xMo
1−x alloys had apparent anodic peaks in 1 M deaerated NaCl solution. The passivation regions of CrFeCoNiNb
0.5Mo
0.5 and CrFeCoNiNb
0.75Mo
0.25 alloys were better than that of CrFeCoNiNb
0.25Mo
0.75 alloy. The minimum passivation current densities (
ipass) of CrFeCoNiNb
0.5Mo
0.5 and CrFeCoNiNb
0.75Mo
0.25 alloys were about 15 μA/cm
2. When comparing the properties of corrosion potential, corrosion current density, anodic peak and passivation region of each alloy in the present study, the CrFeCoNiNb
0.5Mo
0.5 alloy had the best corrosion resistance among the alloys in NaCl solution.
The corrosion rate of the alloys in deaerated 1 M H
2SO
4 and 1 M NaCl solutions can be calculated by assuming that all of the corrosion types of the alloys in these solutions are a type of uniform corrosion. Therefore, the relationship between corrosion depth of one year and corrosion current density is listed as the following Equation [
27]:
where
M is the average atomic mass (g/mol),
icorr is the corrosion current density (A/cm
2),
t is the corrosion time (31,536,000 s, 1 yr),
ρ is the average density (g/cm
3),
n is the number of average valence electron and
F is the Faraday constant (96,500 C/mol). This study assumes that the average density of an alloy is
ρ = ∑X
iρi, where X
i and
ρi are the molar fraction and density of element i. The corrosion rates (mm per year) of the alloys in deaerated 1 M H
2SO
4 and 1 M NaCl solutions are listed in
Table 9. The CrFeCoNiNb
0.3Mo
0.3 alloy had the smallest corrosion rate (0.0732 mm/yr) in 1 M deaerated H
2SO
4 solution, and alloy CrFeCoNiNb
0.75Mo
0.25 had the largest corrosion rate (0.3315 mm/yr) in this solution. The CrFeCoNiNb
0.15Mo
0.15 alloy had the smallest corrosion rate (0.0425 mm/yr) in 1 M deaerated NaCl solution, and CrFeCoNiNb
0.5Mo
0.5 and CrFeCoNiNb
0.75Mo
0.25 alloys had larger corrosion rate in this solution. The corrosion rate of CrFeCoNiNb
0.5Mo
0.5 alloy (0.1152 mm/yr) in 1 M deaerated NaCl solution was higher than that of CrFeCoNiNb
0.15Mo
0.15 alloy in the same solution. However, the CrFeCoNiNb
0.5Mo
0.5 alloy still possessed the best combination of corrosion resistance and hardness among these alloys.


