
Evaluation of Design Procedure and Performance of Continuously Reinforced Concrete Pavement According to AASHTO Design Methods


Abstract
:1. Introduction
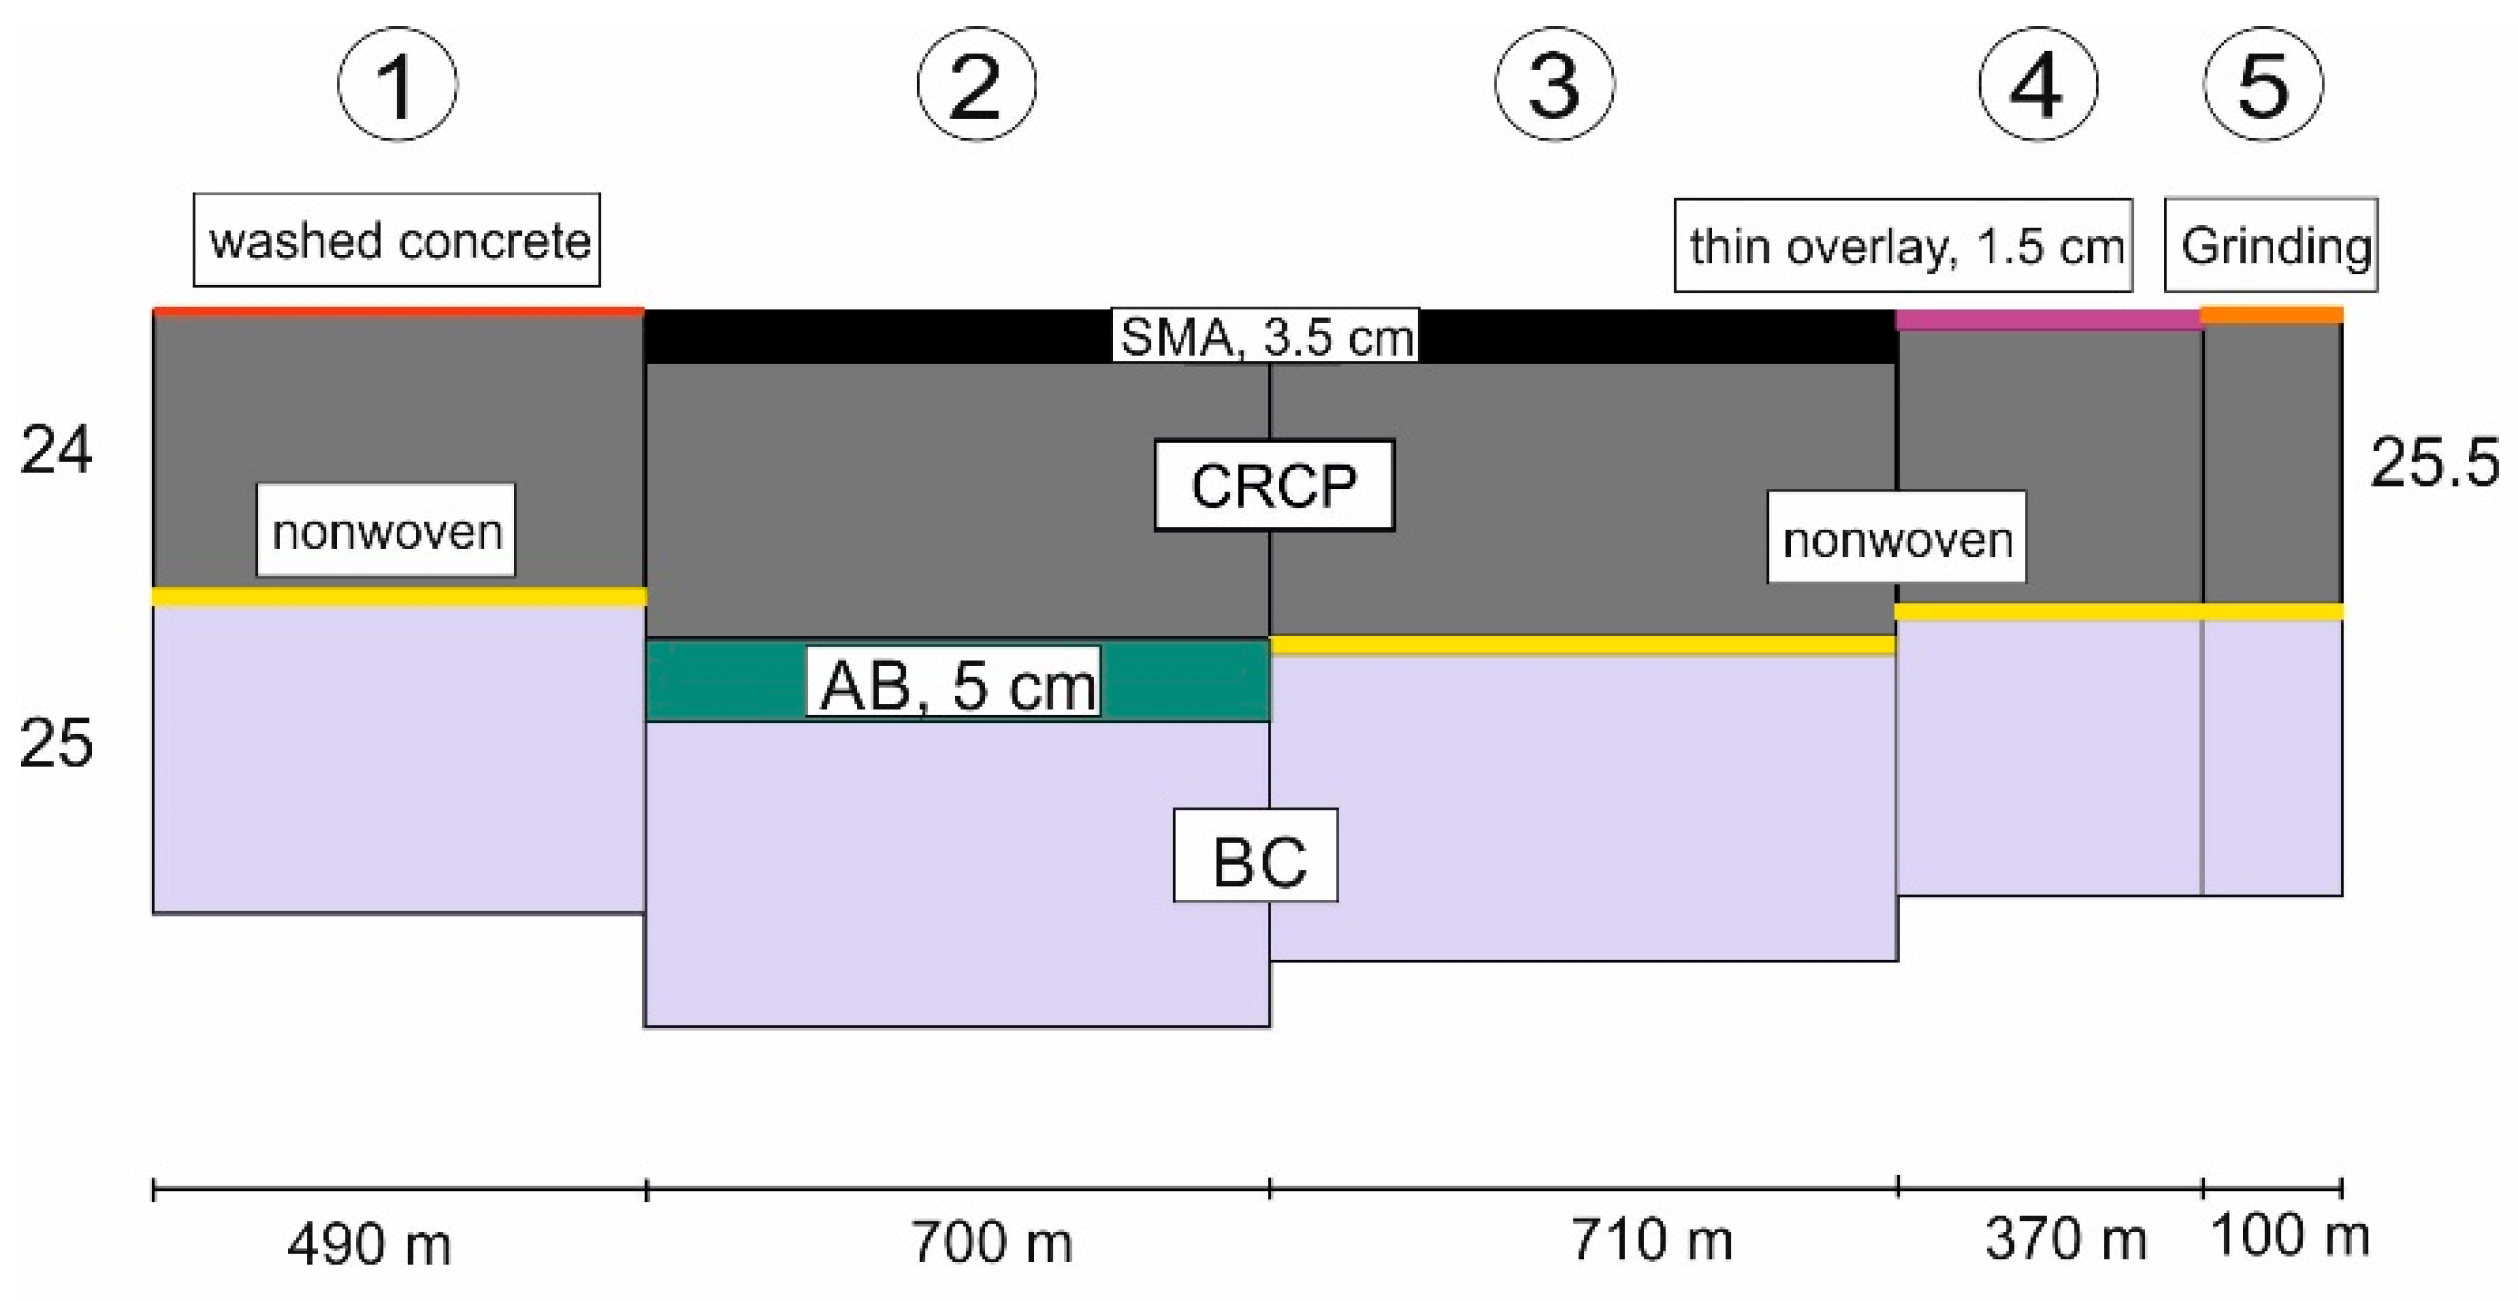
2. Selected Test Tracks in This Study
3. Design Standards Used in This Study
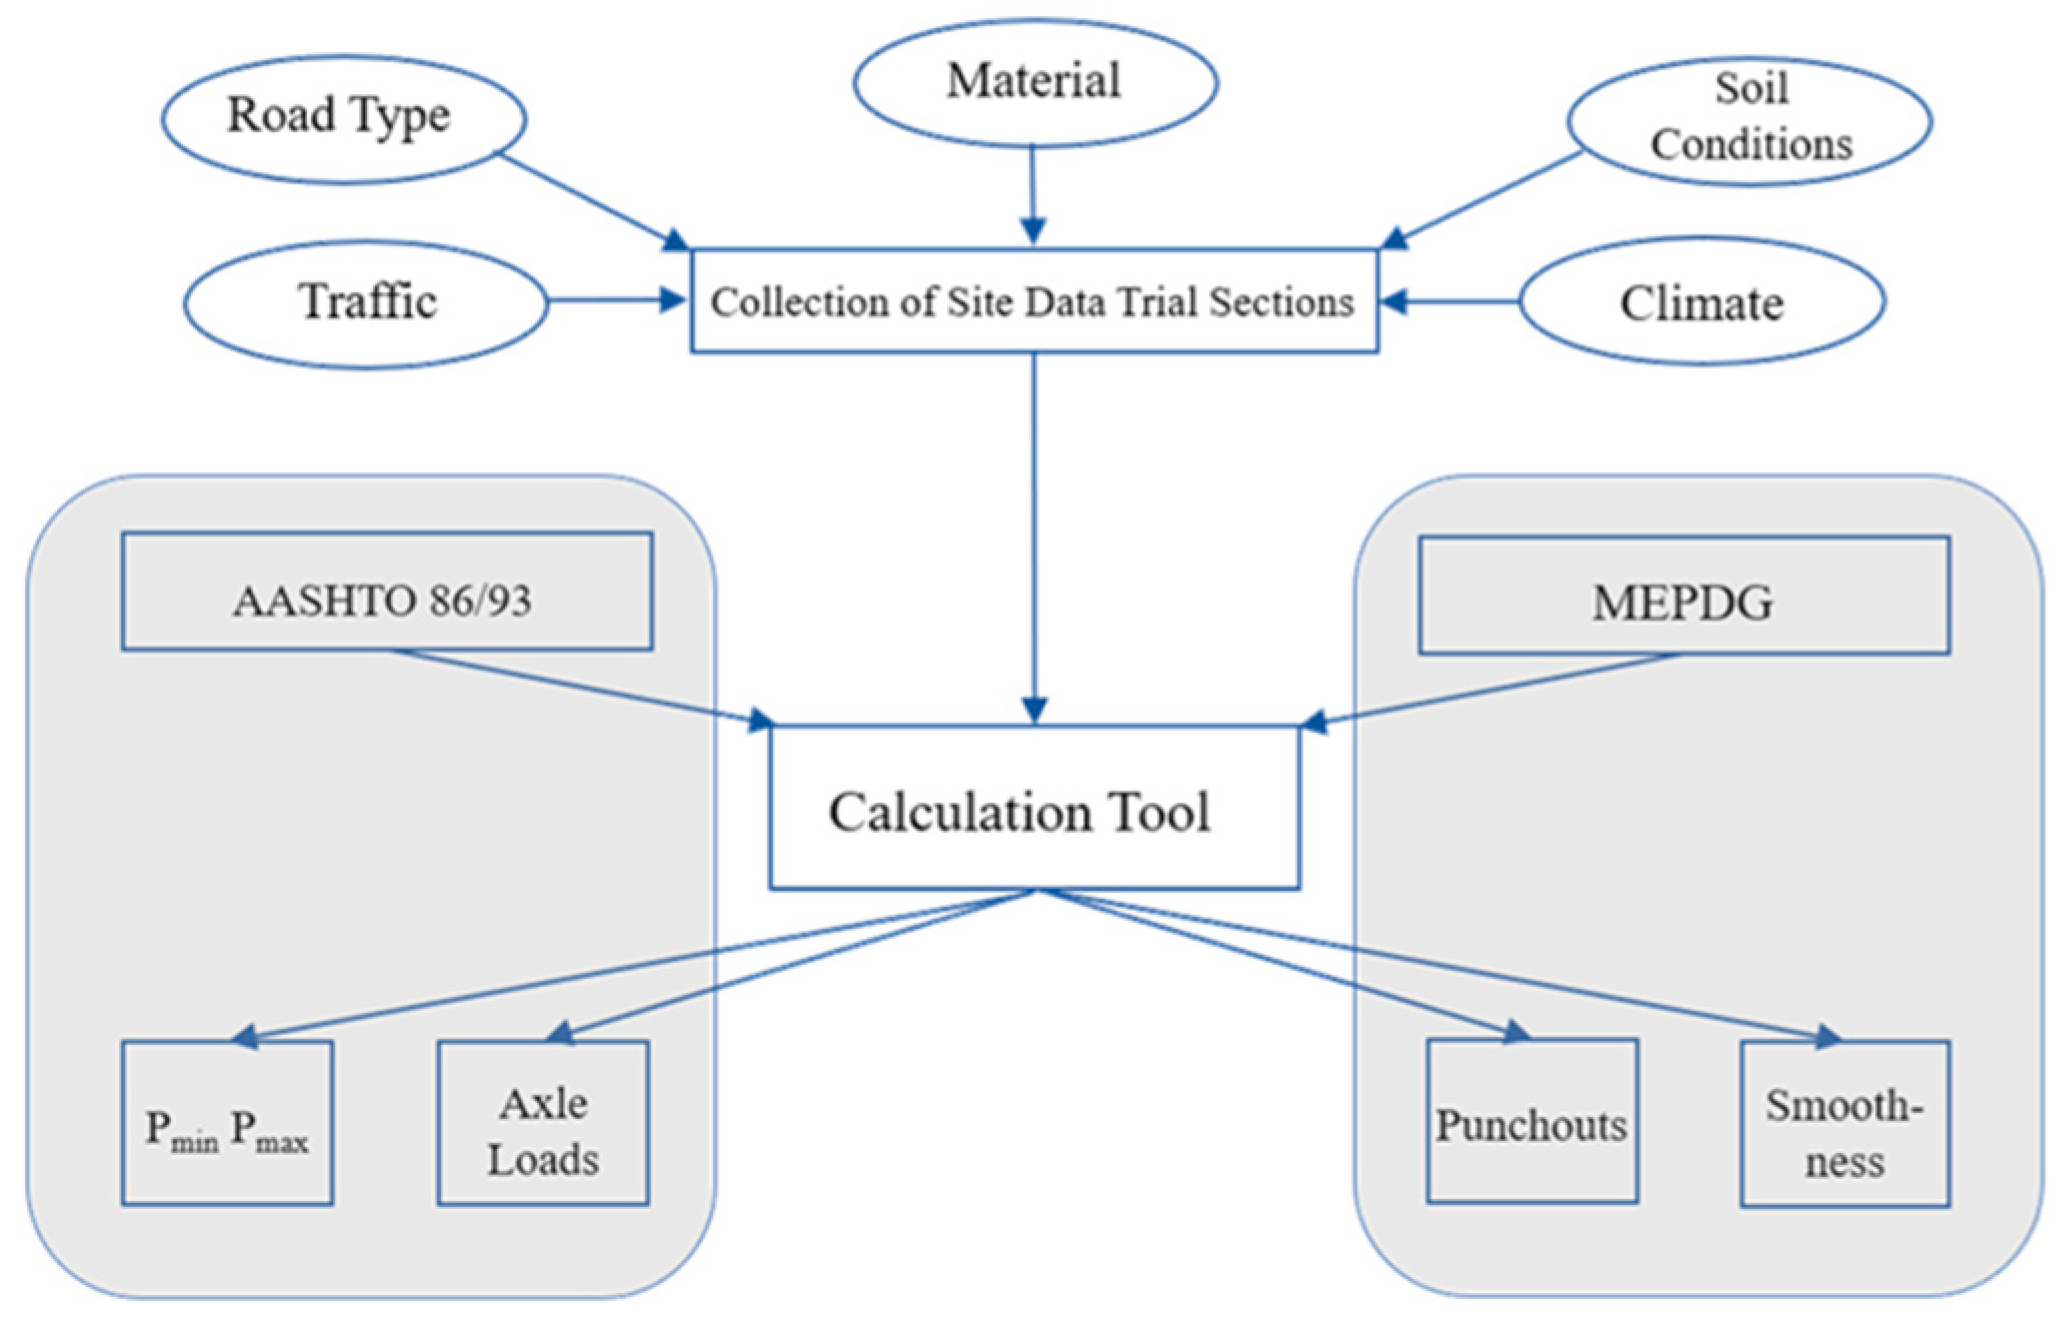
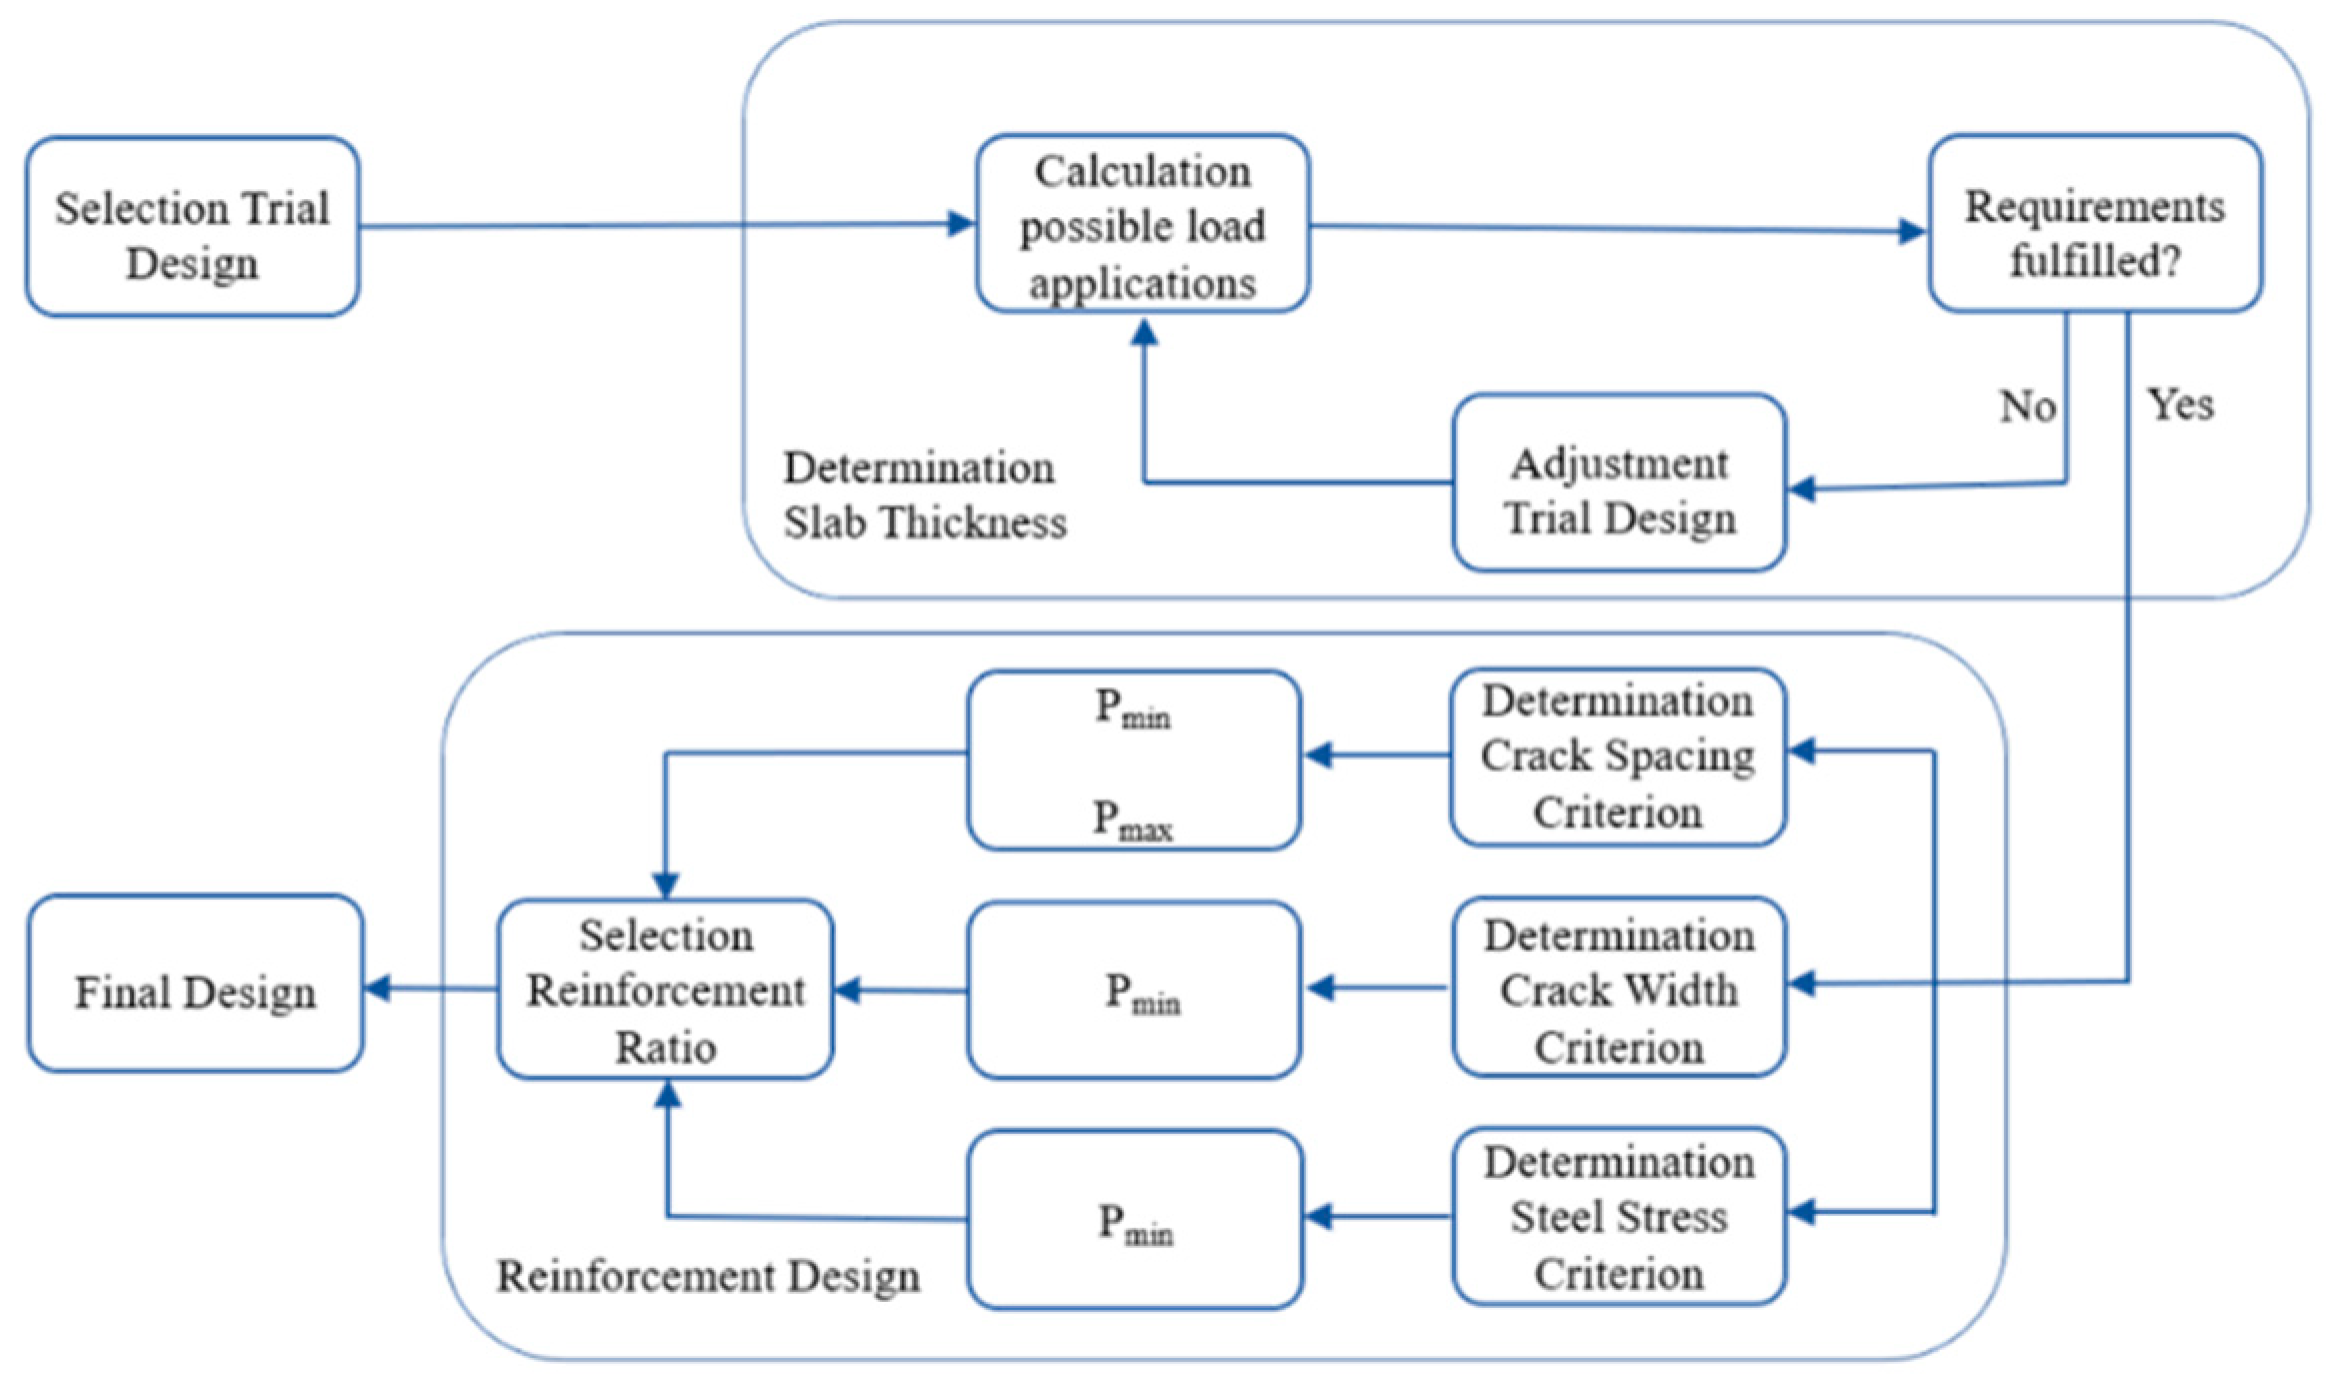
3.1. AASHTO 86/93
3.2. MEPDG
4. Evaluation of CRCP Sections
4.1. AASHTO 86/93
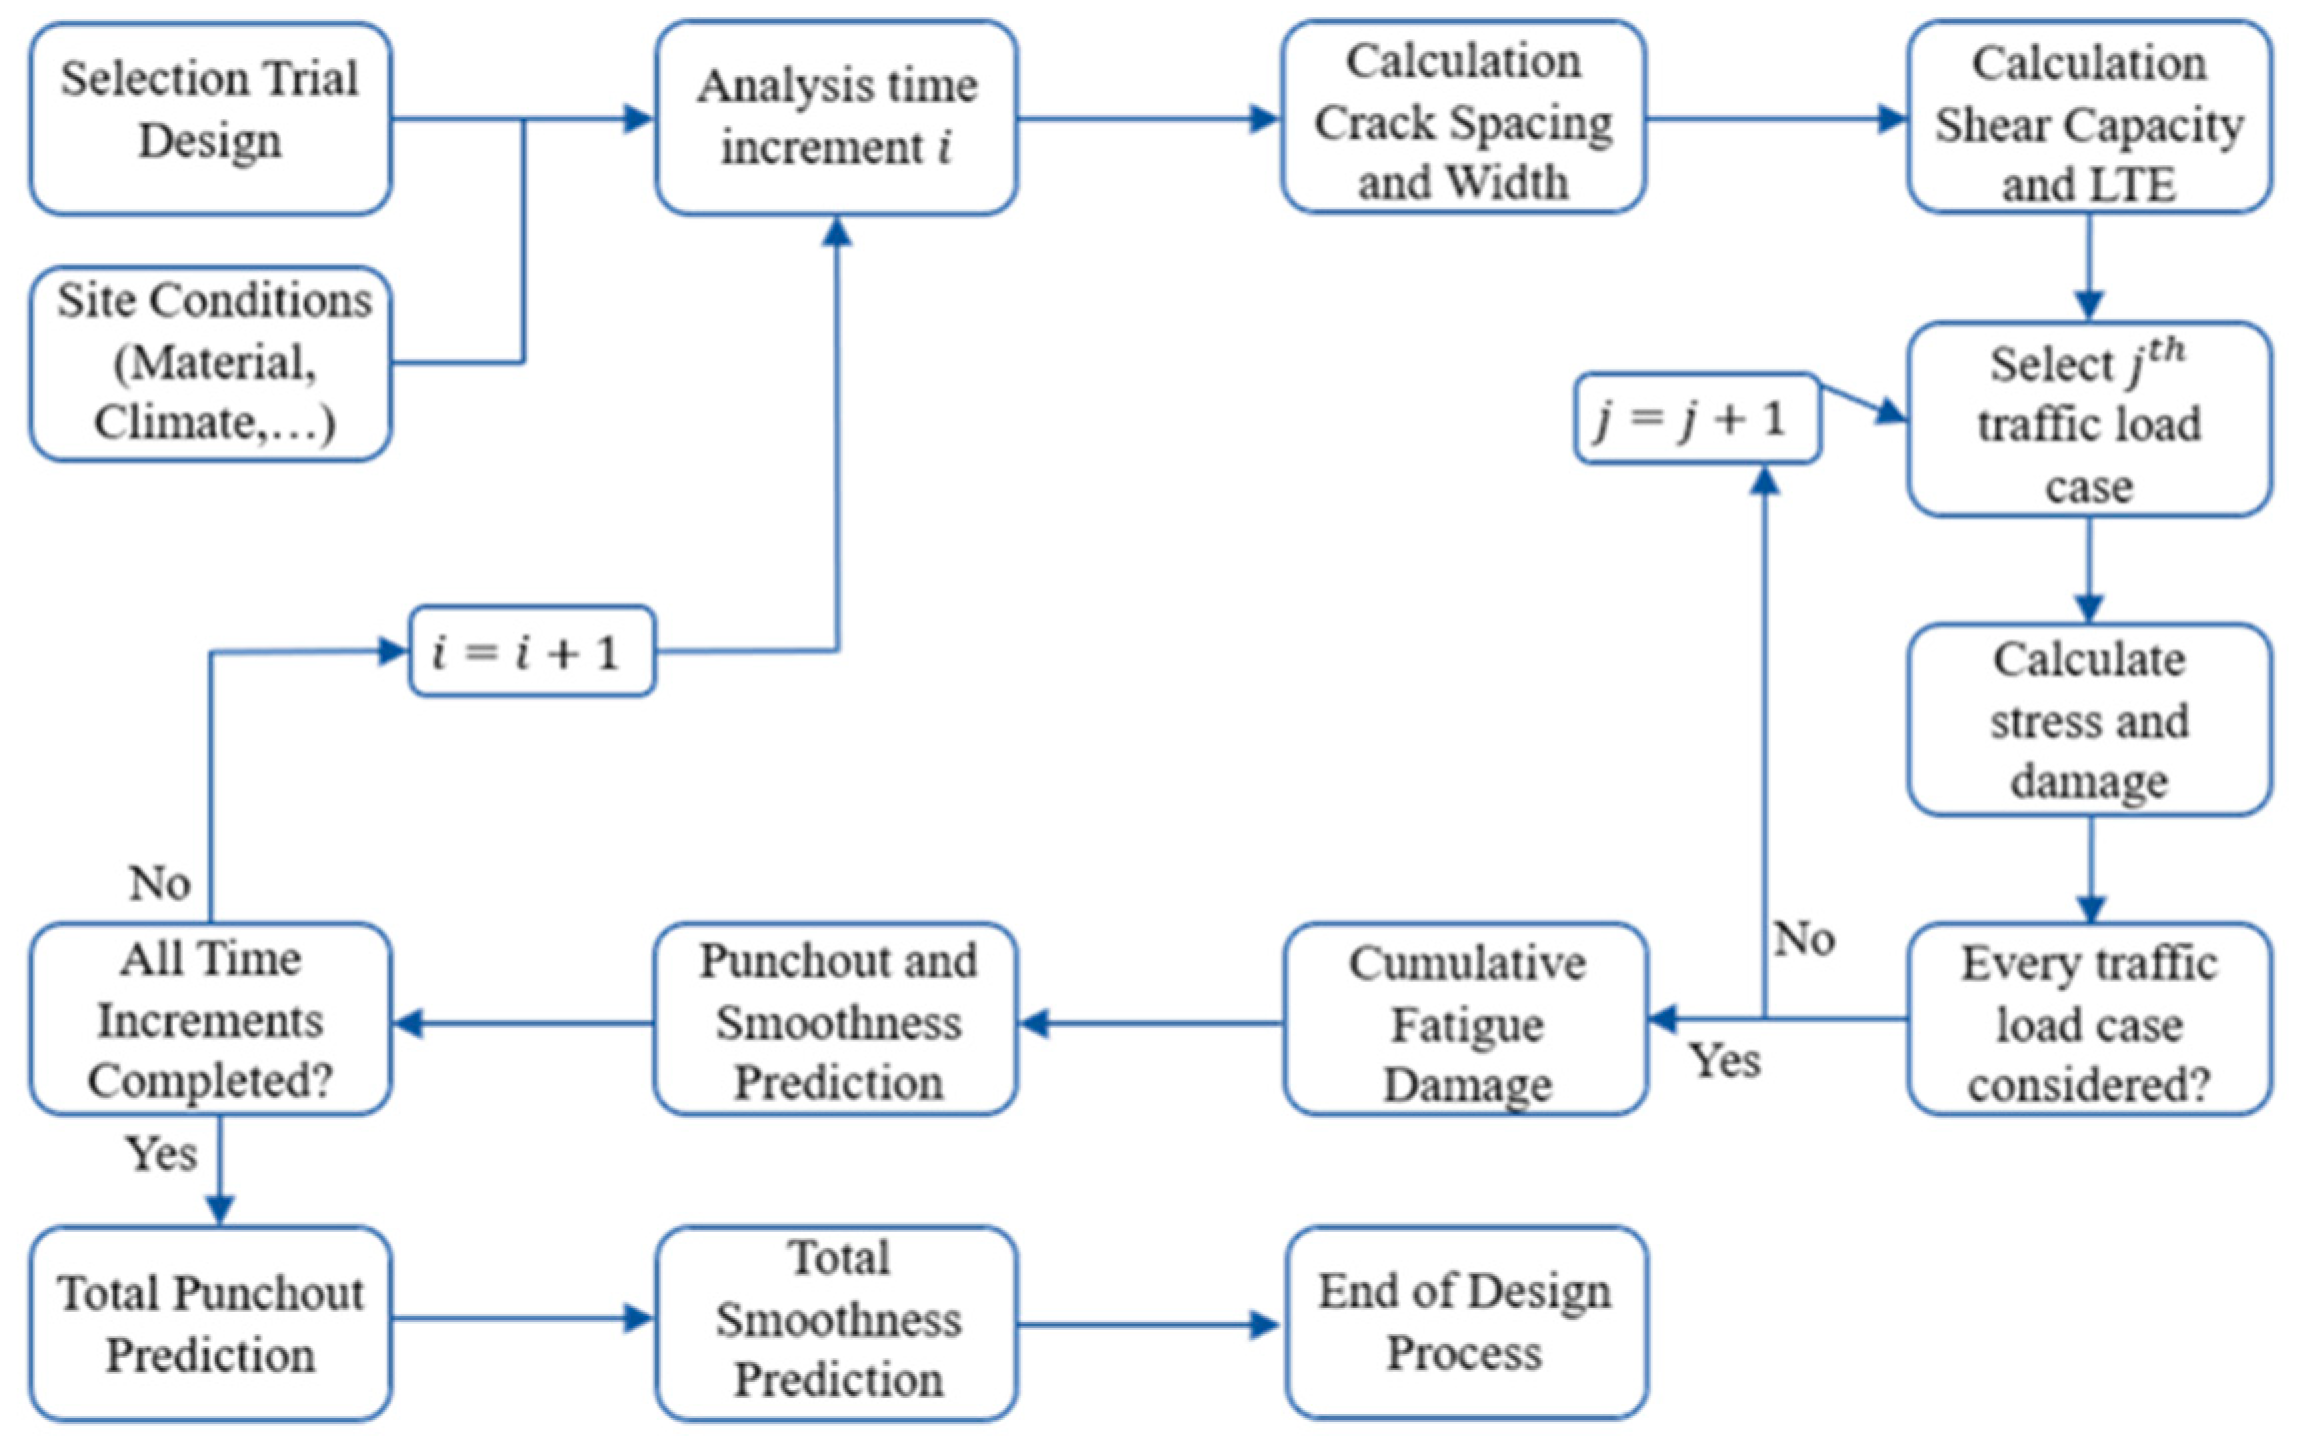
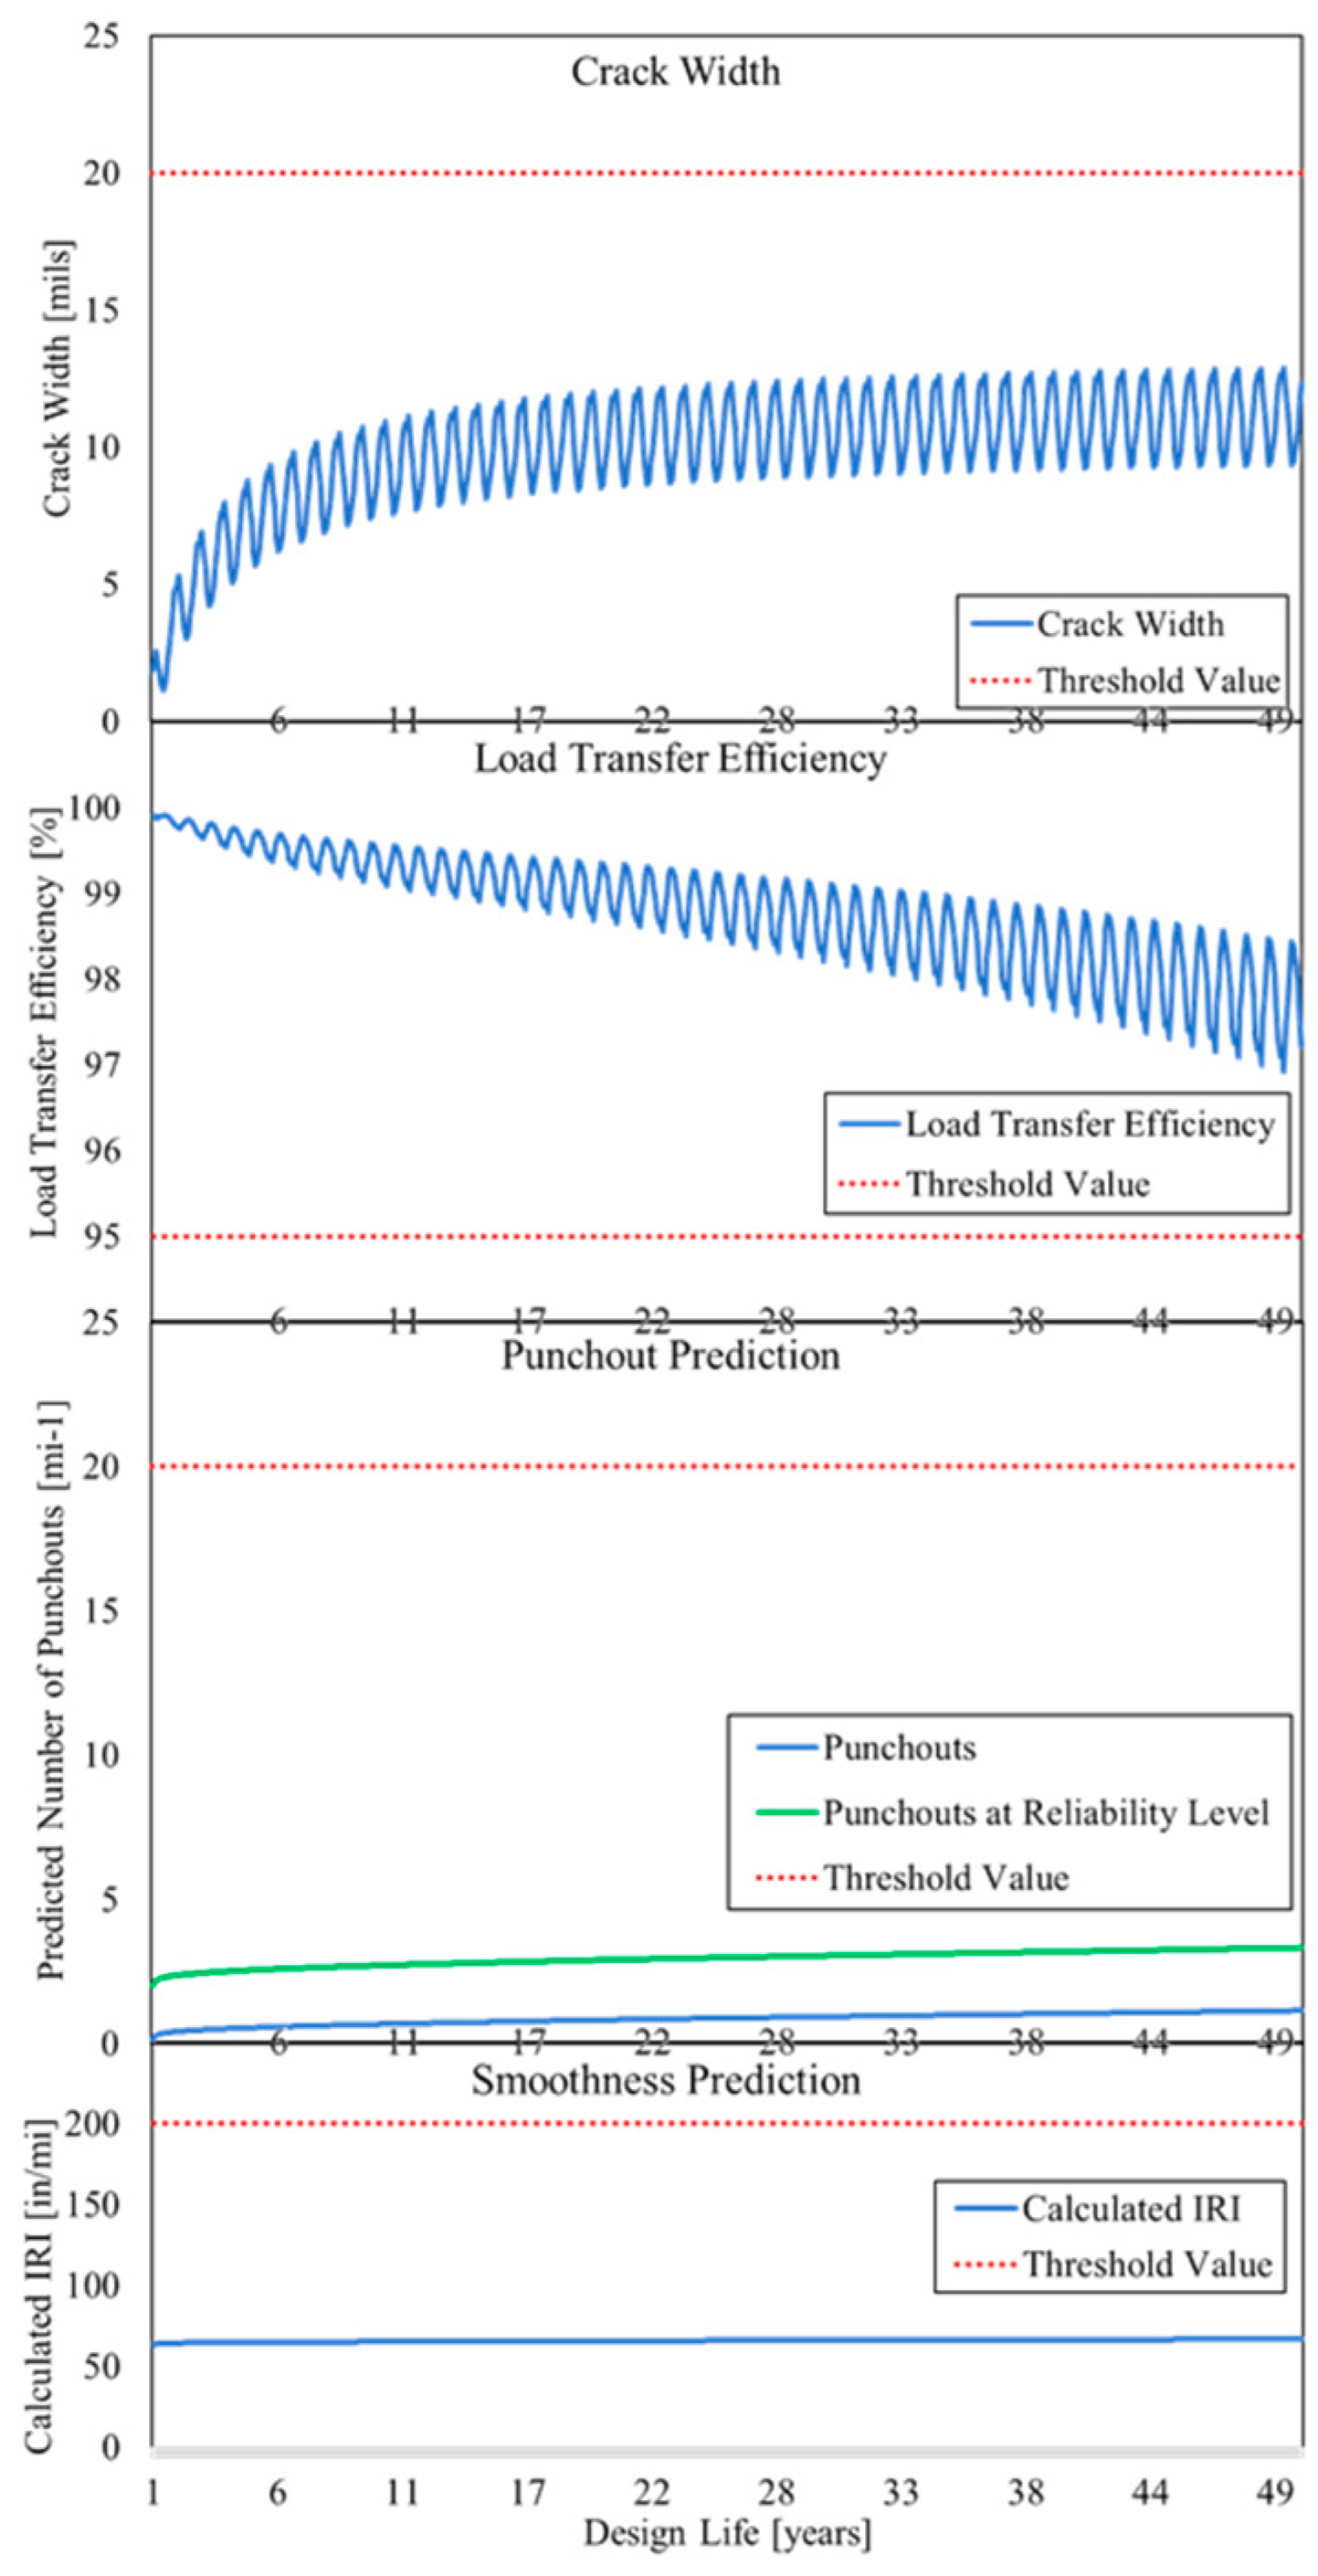
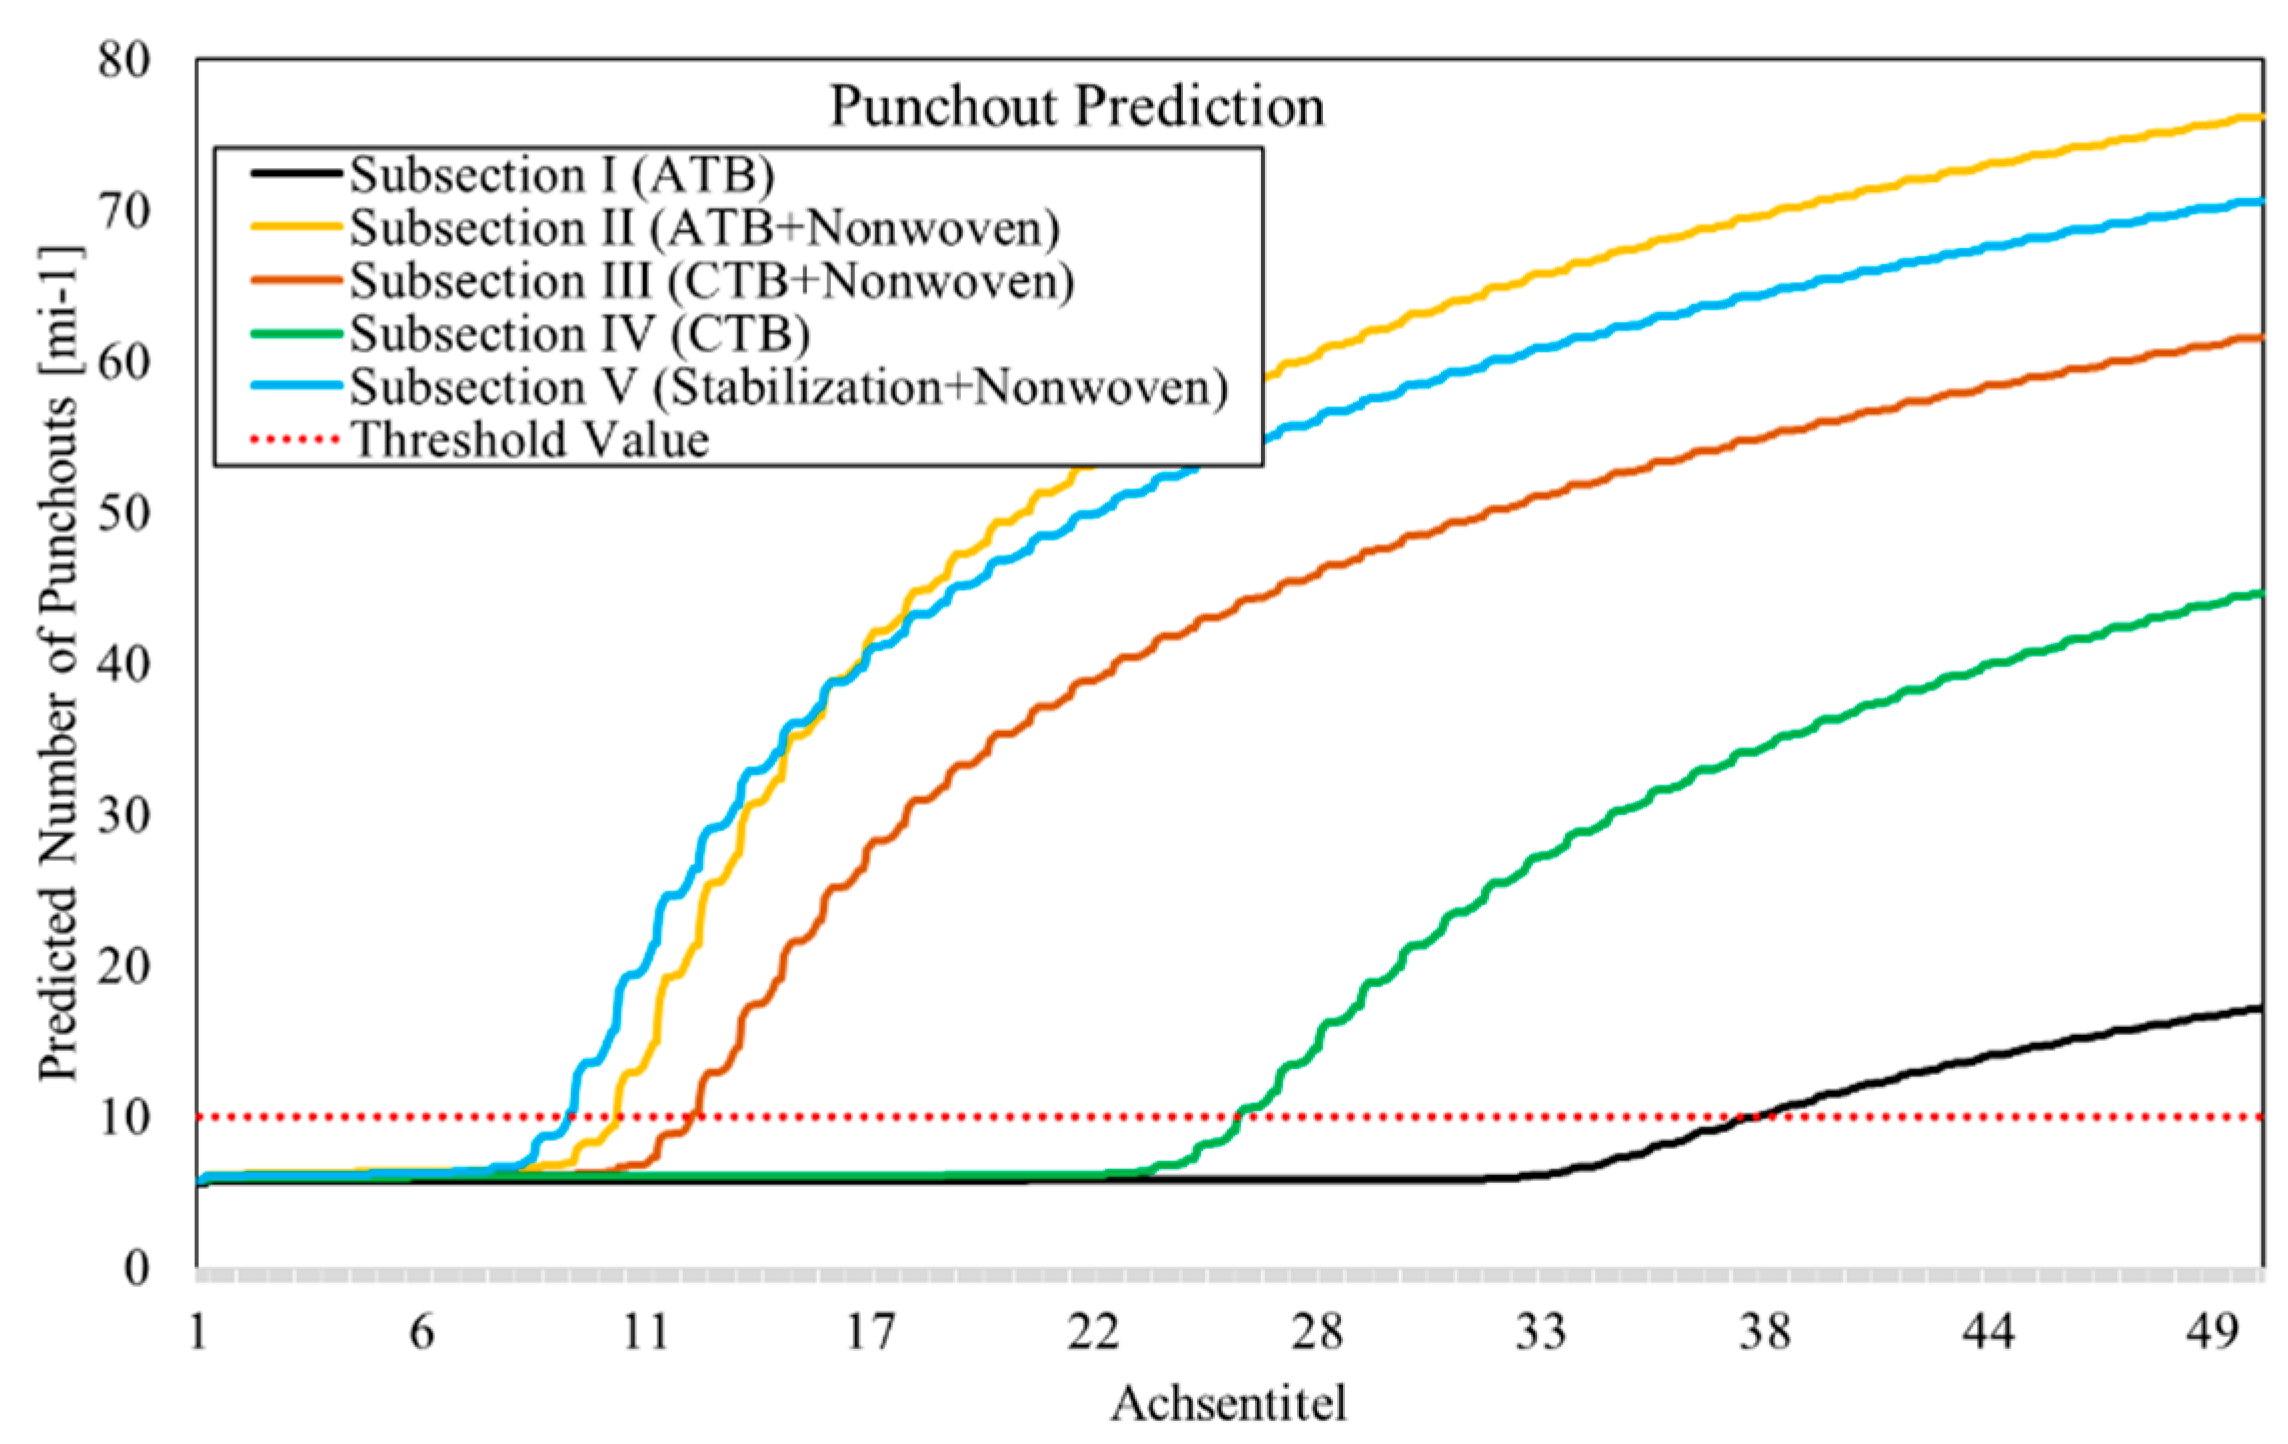
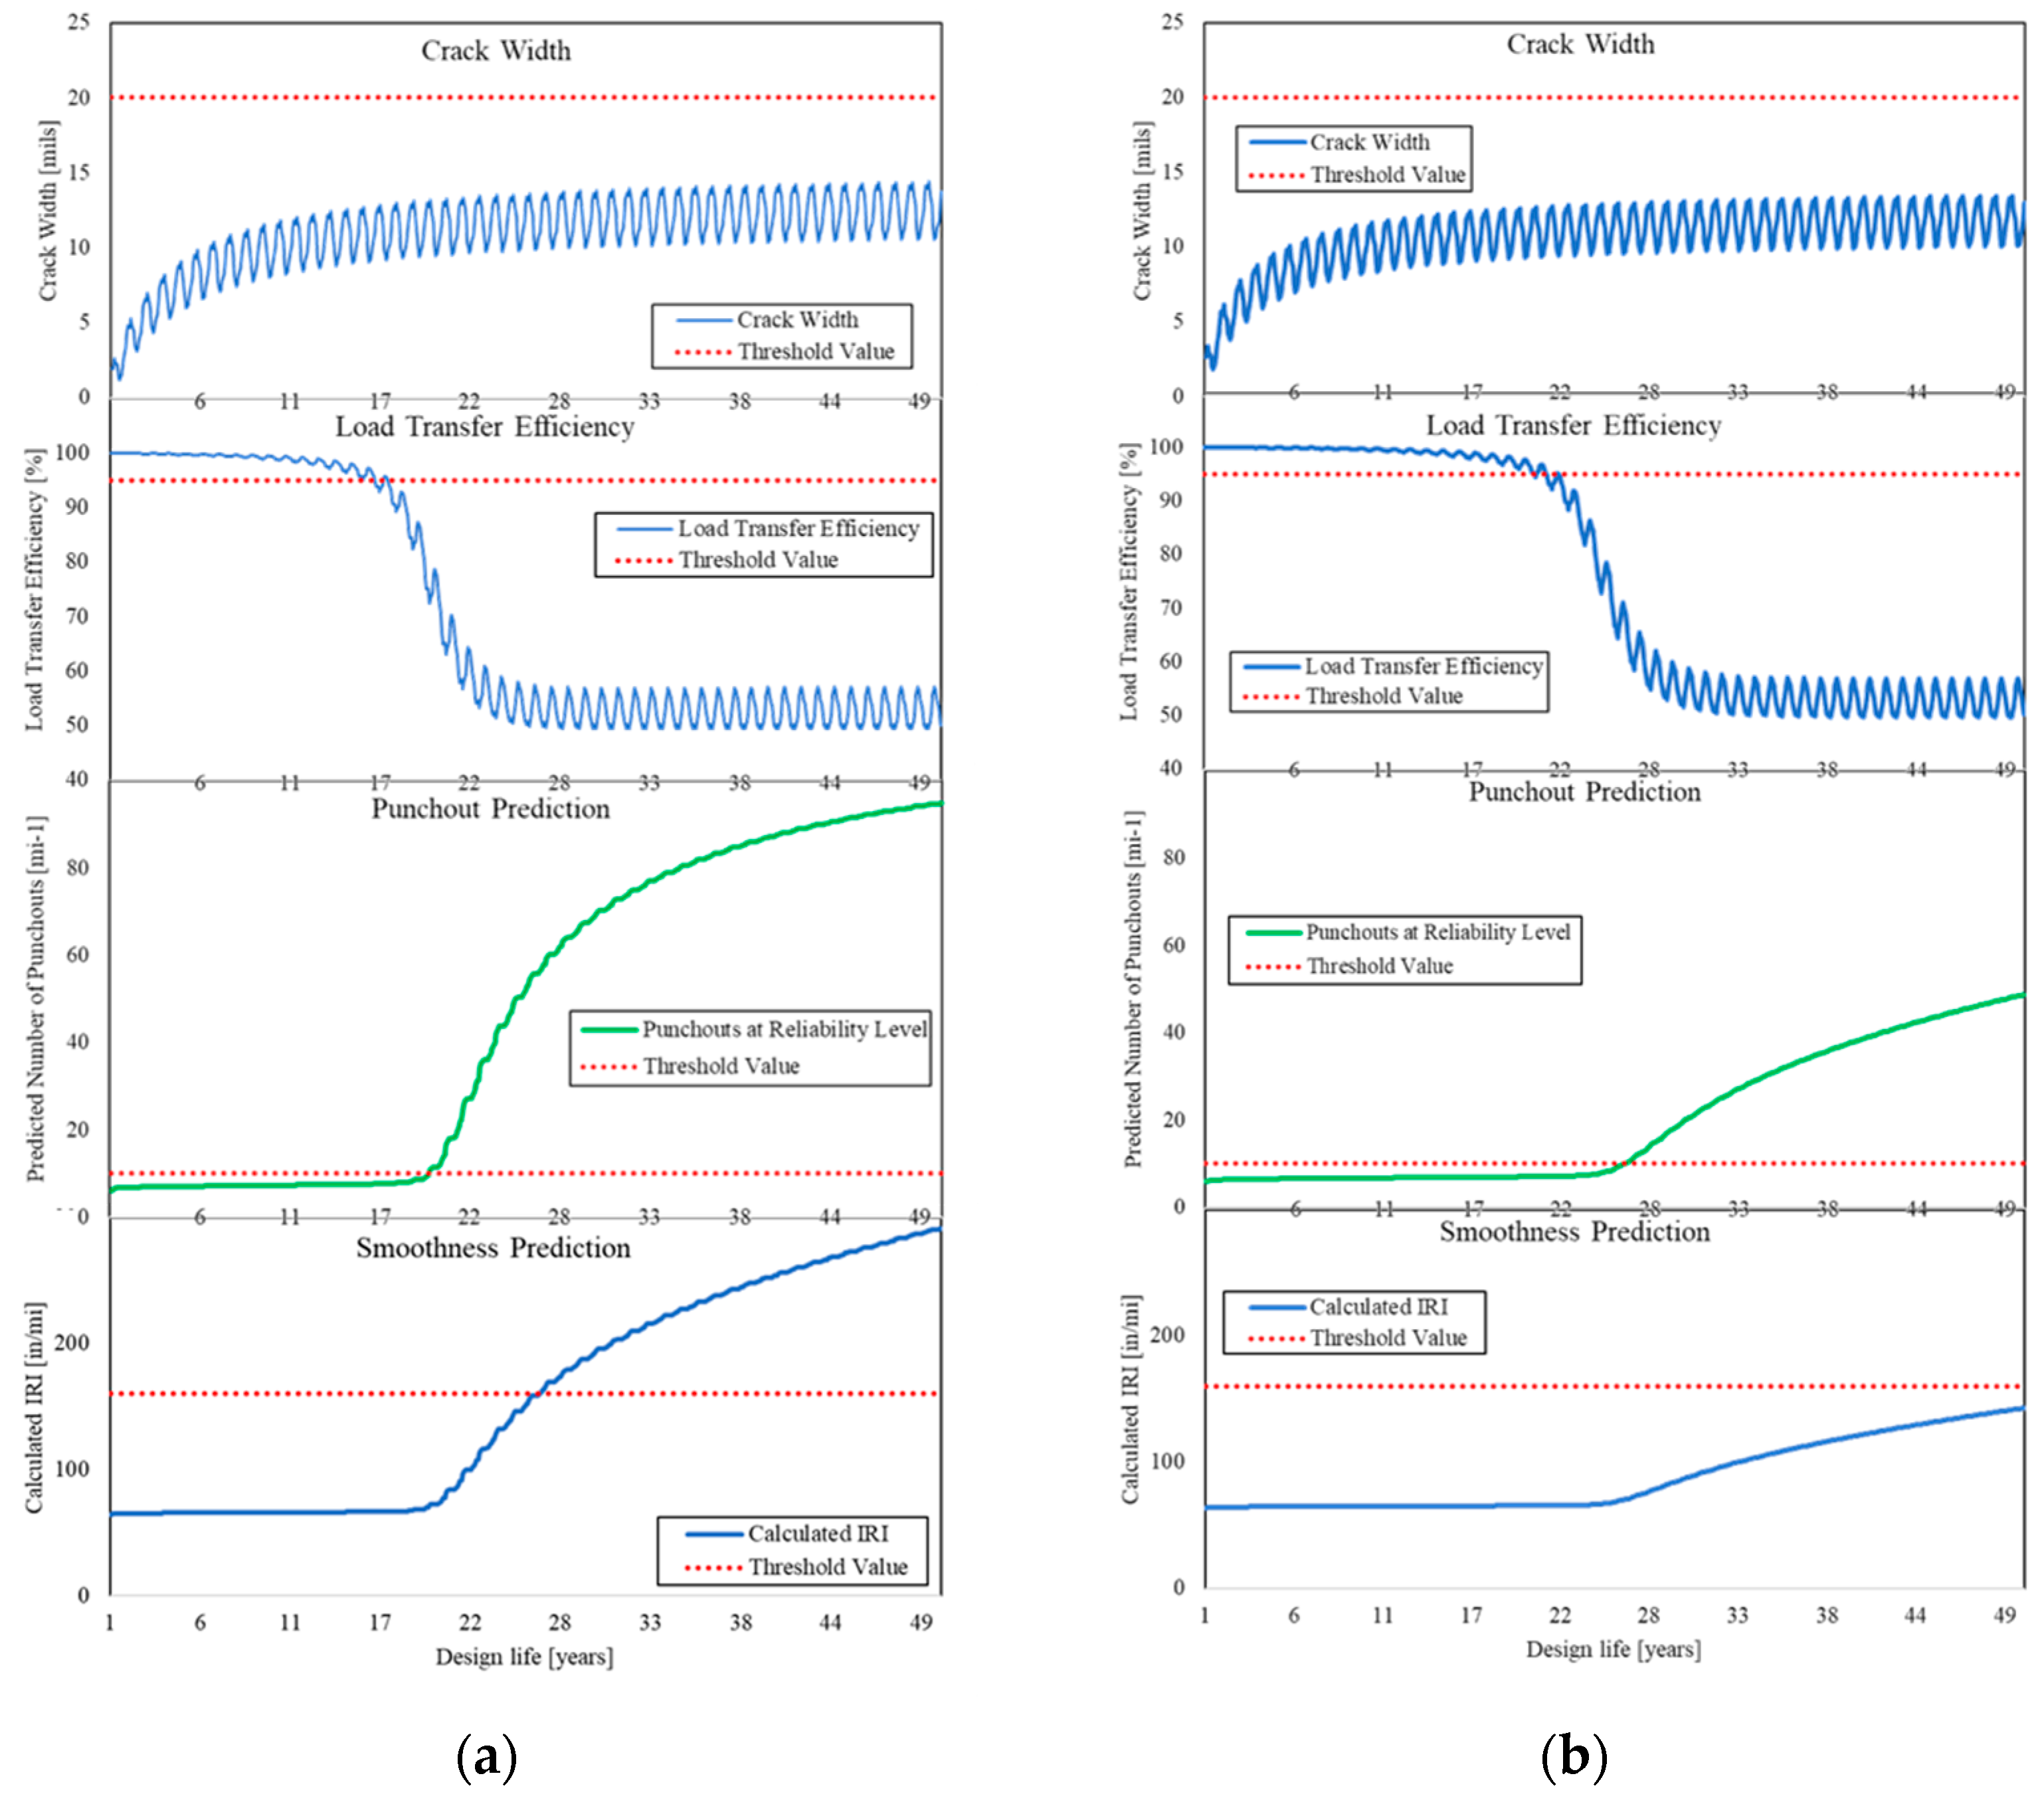
4.2. MEPDG
5. Conclusions
Author Contributions
Funding
Institutional Review Board Statement
Informed Consent Statement
Data Availability Statement
Acknowledgments
Conflicts of Interest
Abbreviation
| Abbreviation | Explanation |
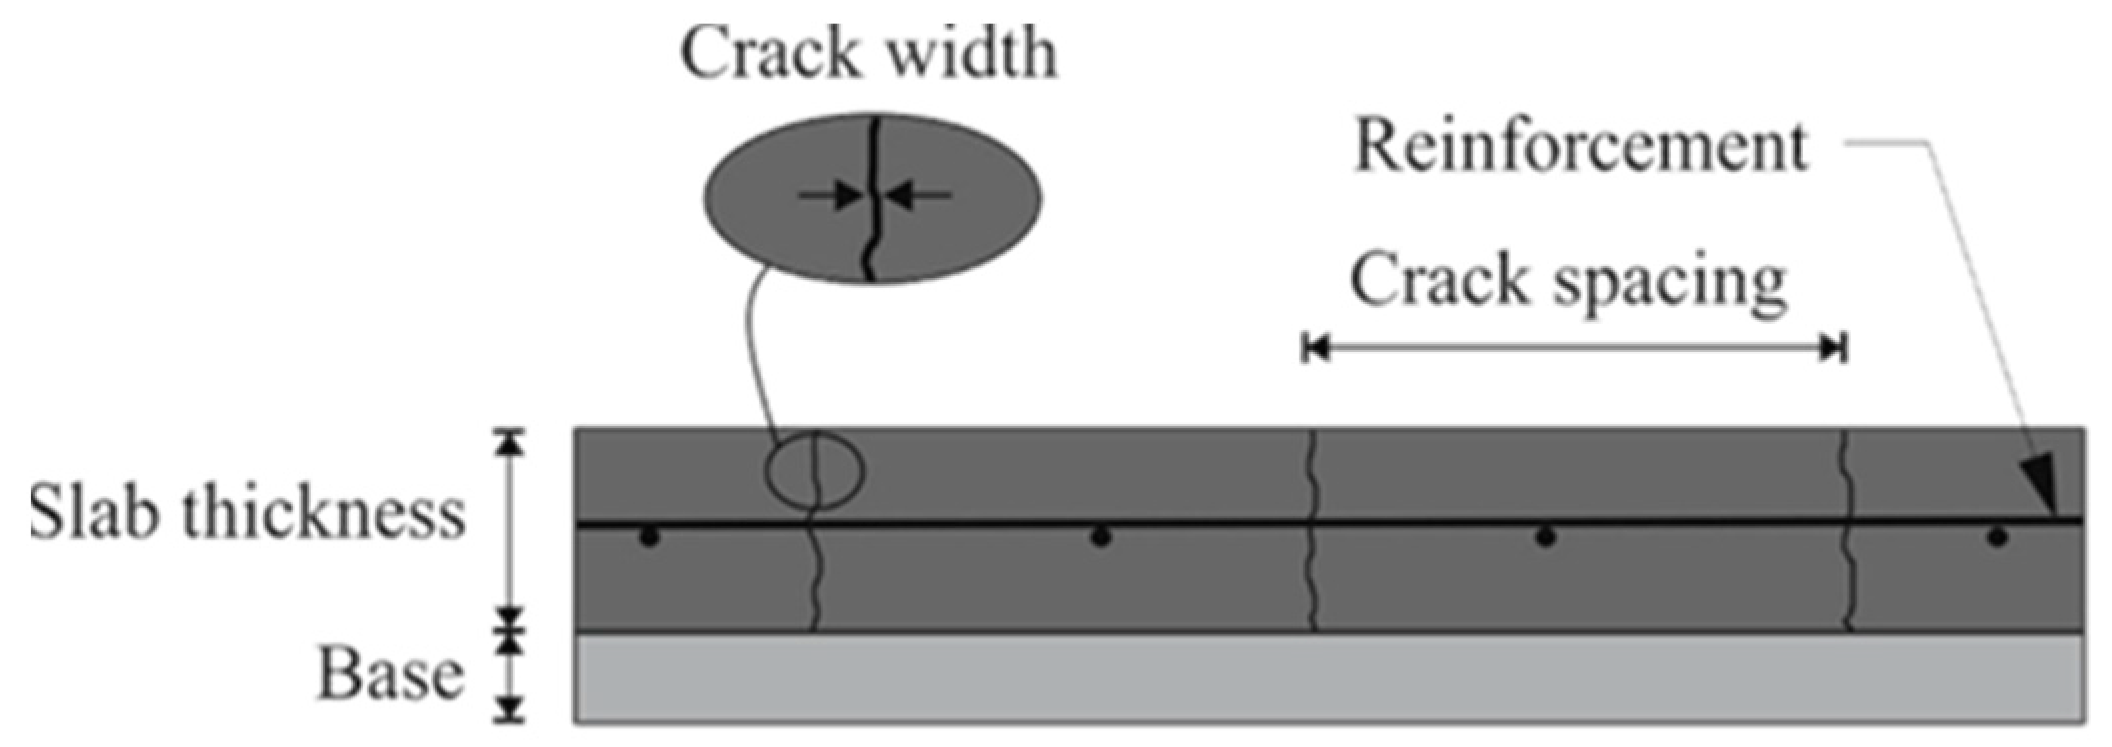
| CS | Crack spacing |
| CW | Crack width |
| SS | Steel stress |
| JPCP | Jointed plain concrete pavement |
| CRCP | Continuously reinforced concrete pavement |
| LTE | Load transfer efficiency |
| AASHTO | American Association of State Highway and Transportation Officials |
| MEPDG | Mechanistic Empirical Pavement Design Guide |
| AADTT | Average annual daily truck traffic |
| IRI | International roughness index |
References
- Benmokrane, B.; Bakouregui, A.S.; Mohamed, H.M.; Thébeau, D.; Abdelkarim, O.I. Design, Construction, and Performance of Continuously Reinforced Concrete Pavement Reinforced with GFRP Bars: Case Study. J. Compos. Constr. 2020, 24, 05020004. [Google Scholar] [CrossRef]
- Jung, D.-H.; Park, K.-W.; Suh, Y.-C. Comparison of CRCP and JCP based on a 30-year performance history. Int. J. Pavement Eng. 2020, 22, 69–76. [Google Scholar]
- Rao, P.L. CRCP a cost-effective long-life pavement solution for highways & expressways. In Proceedings of the 10th International Symposium on Concrete Roads, Brussels, Belgium, 18–22 September 2006. [Google Scholar]
- Khazanovich, L.; Balbo, J.T.; Salles de Salles, L. Structural analysis of transverse cracks in short continuously reinforced concrete pavements. Int. J. Pavement Eng. 2019, 21, 1853–1863. [Google Scholar]
- Hiller, J.E.; Brand, A.S.; Roesler, J.R. Continuously Reinforced Concrete Pavement Manual, Guidelines for Design, Construction, Maintenance, and Rehabilitation; Federal Highway Administration: Washington, DC, USA, 2016.
- Roesler, J.R.; Kohler, E.R. Crack Width Measurements in Continuously Reinforced Concrete Pavements. J. Transp. Eng. 2005, 131, 645–652. [Google Scholar]
- Elsefi, M.A.; Al-Qadi, I.L. Mechanism and modeling of transverse cracking development in continuously reinforced concrete pavement. Int. J. Pavement Eng. 2006, 7, 341–349. [Google Scholar]
- Kashif, M.; Naseem, A.; Iqbal, N.; De Winne, P.; De Backer, H. Evaluating the Early-Age Crack Induction in Advanced Reinforced Concrete Pavement Using Partial Surface Saw-Cuts. Appl. Sci. 2021, 11, 1659. [Google Scholar] [CrossRef]
- Kim, S.M.; Cho, Y.K.; Lee, J.H. Advanced reinforced concrete pavement: Concept and design. Constr. Build. Mater. 2020, 231, 117130. [Google Scholar] [CrossRef]
- Dahal, S.; Roesler, J.R. Continuously Reinforced Concrete Pavement Cracking Patterns and Properties with Internal Curing and Active Cracking. J. Transp. Res. Rec. 2022, 325–333. [Google Scholar] [CrossRef]
- Buch, N.; Xin, D.; Soares, J.; Zollinger, D.G. Performance of CRC Pavements, Volume VI—CRC Pavement Design, Construction, and Performance; Federal Highway Administration: Washington, DC, USA, 1999.
- McCollough, B.F.; Ma, J.H. Analysis of Load, Temperature, and Shrinkage Effect on Continuously Reinforcement Concrete Pavement. Transp. Res. Rec. 1978. Available online: https://www.semanticscholar.org/paper/ANALYSIS-OF-LOAD%2C-TEMPERATURE%2C-AND-SHRINKAGE-EFFECT-Ma-Mccullough/6180076ce58d5fb15d17d62a3521f7acc96b823c (accessed on 16 February 2022).
- Roesler, J.; Kohler, E. Crack spacing and crack width investigation from experimental CRCP sections. Int. J. Pavement Eng. 2006, 7, 331–340. [Google Scholar]
- American Association of State Highway and Transportation Officials. AASHTO Guide for Design of Pavement Structures; American Association of State Highway and Transportation Officials: Washington, DC, USA, 1993. [Google Scholar]
- Ren, D. Optimisation of the Crack Pattern in Continuously Reinforced Concrete Pavements. Ph.D Thesis, Delft University of Technology, Delft, The Netherlands, 2015. [Google Scholar]
- Tayabji, S. Continuously Reinforced Concrete Pavement Performance and Best Practices; Federal Highway Administration: Washington, DC, USA, 2012.
- Won, M. Evaluation of MEPDG with TxDOT Rigid Pavement Database; Federal Highway Administration: Austin, TX, USA, 2009.
- Shi, X.; Zollinger, D.G.; Mukhopadhyay, A.K. Punchout study for continuously reinforced concrete pavement containing reclaimed asphalt pavement using pavement ME models. Int. J. Pavement Eng. 2018, 21, 1199–1212. [Google Scholar] [CrossRef]
- Bijleveld, F.; de Bondt, A.; Khedoe, R.; Stet, M.J.A.; Bijleveld, F. Innovative construction techniques and functional verification on airfield pavements—A Dutch case study. In Proceedings of the 10th International Conference on the Bearing Capacity of Roads, Railways and Airfields, Athens, Greece, 28–30 June 2017. [Google Scholar]
- Dossey, T.; McCullough, B.F. Considerations for High-Performance Concrete Paving: Recommendations from 20 Years of Field Experience in Texas. J. Transp. Res. Board 1999, 1684, 17–24. [Google Scholar]
- Selezneva, O.; Rao, C.; Darter, M.; Zollinger, D.G.; Khazanovich, L. Development of a Mechanistic-Empirical Structural Design Procedure for Continuously Reinforced Concrete Pavements. Transp. Res. Rec. 2004, 1896, 46–56. [Google Scholar] [CrossRef]
- Rasmussen, R.O.; Rodgers, R.; Ferragut, T.R. Continously Reinforced Concrete Pavement, Design & Construction Guidelines; Federal Highway Administration: Washington, DC, USA, 2011.
- Transportation Research Board. Guide for Mechanistic-Empirical Design of New and Rehabilitated Pavement Structures, Final Report, 1-37A; Transportation Research Board: Champagne, IL, USA, 2004. [Google Scholar]
- American Association of State Highway and Transportation Officials. Mechanistic-Empirical Pavement Design Guide, A Manual of Practice; American Association of State Highway and Transportation Officials: Washington, DC, USA, 2008. [Google Scholar]
- Medina-Chavez, C.I.; Won, M.C. Mechanistic-Empirical Data Collection Approach for Rigid Pavements; Federal Highway Administration: Sterling, VA, USA, 2006.
- Roesler, J.; Hiller, J.E. Continuously Reinforced Concrete Pavement: Design Using the AASHTO Pavement ME Design Program; Federal Highway Administration: Washington, DC, USA, 2013.
- Beeldens, A.; Caestecker, C.; Rens, L. Durchgehend bewehrte Fahrbahndecken aus Beton-Stand der Technik in Belgien. Beton 2005, 55, 536–538. [Google Scholar]
- Szydlo, A.; Ruttmar, I. Experiences from construction of concrete motorways in Poland. In Proceedings of the 10th International Symposium on Concrete Roads, Brussels, Belgium, 18–22 September 2006. [Google Scholar]
- Seruga, T.; Seruga, A. Wybrane czynniki wpływające na konstruowanie łączonych nawierzchni betonowych. Geoinżynieria Drog. Mosty Tunele 2009, 1, 70–75. [Google Scholar]
- Huang, Y.H. Pavement Analysis and Design, 2nd ed.; Upper Saddle River: Bergen County, NJ, USA, 2004. [Google Scholar]
- Concrete Reinforcement Steel Institute. Summary of CRCP Design and Construction, Practice in the U.S.; Concrete Reinforcement Steel Institute: Champaign, IL, USA, 2001. [Google Scholar]
- Elfino, M.; Nair, H.; Gudimettla, J.M.; Crawford, G. Design Comparison Between 1993 AASHTO and MEPDG Using Level 1 Input for Continuously Reinforced Concrete Pavement: A Case Study in Virginia. In Proceedings of the Transportation Research Board 89th Annual Meeting, Washington, DC, USA, 10–14 January 2010. [Google Scholar]
- Daleiden, J.F.; Rauhut, J.B.; Killingsworth, B.; Antwi, E.O.; Darter, M.I.; Ahmad, R.J. Evaluation of the AASHTO Design Equations and Recommended Improvements; Strategic Highway Research Program: Washington, DC, USA, 1994. [Google Scholar]
- National Academy of Sciences-National Research Council. The AASHO Road Test, Special Report 61G; National Academy of Sciences-National Research Council: Washington, DC, USA, 1962.
- Katre, L.; Harinkhede, B. Continuously Reinforced Concrete Pavement: A Review. Int. J. Eng. Res. Technol. 2021, 10, 300–304. [Google Scholar]
- Mallick, R.B.; El-Korchi, T. Pavement Engineering: Principles and Practice, 3rd ed.; Taylor & Francis Inc.: Boca Raton, FL, USA, 2018. [Google Scholar]
- National Research Council. Guide for Mechanistic-Empirical Design of New and Rehabilitated Pavement Structures (Appendix LL); National Research Council: Champaign, IL, USA, 2003.
- Cargnin, A.; Balbo, J. Cracking patterns of continuously reinforced concrete pavement using black and galvanized steel under tropical climate. Int. J. Pavement Eng. 2019, 22, 1–12. [Google Scholar] [CrossRef]
- Zollinger, D.G. Investigation of Punchout Distress in Continuously Reinforced Concrete Pavement. Ph.D. Thesis, University of Illinois, Champaign, IL, USA, 1989. [Google Scholar]
- Hansen, W.; Jensen, E. Mechanism of Load Transfer-Crack Width Relation in JPCP: Influence of Coarse Aggregate Properties. In Proceedings of the 7th International Conference on Concrete Pavements, Orlando, FL, USA, 9–13 September 2001. [Google Scholar]


| No | Tracks | Year | Length (km) | AADTT (Truck/24 h) | Total Load (m) | Cement | Reinforcement Ratio (%) | Slab Thickness (cm) | fcm (MPa) | |
|---|---|---|---|---|---|---|---|---|---|---|
| Longitudinal | Transverse | |||||||||
| 1 | A5 Darmstadt | 2004 | 1.52 | 7873 | 63 | I | 0.75 | 0.15 | 24 | 38 |
| 2 | A4 | 2005 | 1.1 | 5700 | 45 | I | 0.76 | 0.07 | 23 | 40 |
| 3 | Geseke | 2009 | 1.1 | 450 | 2 | I/II | 0.82 | 0.15 | 22 | 43 |
| 4 | E313 | 2012 | 7 | 5750 | 23 | III | 0.74 | 0.35 | 25 | 43/53 |
| 5 | A5 Bruchsal | 2015 | 2.27 | 10,060 | 29 | I/III | 0.75 | 0.14 | 24 | 38 |
| A5 Darmstadt | A5 Bruchsal | Geseke | A4 | E313 | ||||||
|---|---|---|---|---|---|---|---|---|---|---|
| Longitudinal Reinforcement (%) | ||||||||||
| Min | Max | Min | Max | Min | Max | Min | Max | Min | Max | |
| CS (ft) | 0.48 | 0.77 | 0.45 | 0.74 | 0.56 | 0.87 | 0.60 | 0.92 | 0.72 | 1.06 |
| CW (in) | 0.57 | - | 0.54 | - | 0.65 | - | 0.70 | - | 0.82 | - |
| SS (ksi) | 0.56 | - | 0.53 | - | 0.66 | - | 0.67 | - | 0.81 | - |
| Range | 0.57 | 0.77 | 0.54 | 0.74 | 0.66 | 0.87 | 0.70 | 0.92 | 0.82 | 1.06 |
| Parameter | Symbol | Units | Tracks | ||||
|---|---|---|---|---|---|---|---|
| A5-D | A4 | Geseke | E313 | A5-B | |||
| PCC 28 day compressive strength | f′c28 | psi | 5076.3 | 8702.3 | 6236.6 | 6671.7 | 5076.3 |
| PCC elastic modulus | EPCC,i | psi | 4,319,423.2 | 4,728,230.3 | 4,787,689.3 | 4,951,868.3 | 4,319,423,2 |
| PCC 28 day tensile strength | ft,i | psi | 451.2 | 971.8 | 500.2 | 517.3 | 451.2 |
| PCC modulus of rupture | MRi | psi | 676.9 | 886.2 | 750.2 | 775.9 | 676.9 |
| Ultimate shrinkage | ε∞ | - | 683.4 | 513.5 | 663.2 | 622.5 | 546.7 |
| PCC temperature at set time (zero stress) | Tset | °F | 84.1 | 68.8 | 84.1 | 64.4 | 71.4 |
| Bond slip coefficient | k1 | psi | 594,945.9 | 1,019,909.6 | 730,933.5 | 781,923.2 | 594,945.9 |
| Peak bond stress | Um | psi | 1189.9 | 2039.8 | 1461.9 | 1563.8 | 1189.9 |
| Poisson’s ratio | µPCC | - | 0.2 | 0.2 | 0.2 | 0.2 | 0.2 |
| LTE of base | LTEBase | % | granular base: 20%; ATB/CTB: 30%; LCB: 40% | ||||
| Base friction coefficient | F | - | ATB: 7.5; CTB: 8.9; soil cement: 7.9; LCB: 6.6 | ||||
Publisher’s Note: MDPI stays neutral with regard to jurisdictional claims in published maps and institutional affiliations. |
© 2022 by the authors. Licensee MDPI, Basel, Switzerland. This article is an open access article distributed under the terms and conditions of the Creative Commons Attribution (CC BY) license (https://creativecommons.org/licenses/by/4.0/).
Share and Cite
Moharekpour, M.; Liu, P.; Schmidt, J.; Oeser, M.; Jing, R. Evaluation of Design Procedure and Performance of Continuously Reinforced Concrete Pavement According to AASHTO Design Methods. Materials 2022, 15, 2252. https://doi.org/10.3390/ma15062252
Moharekpour M, Liu P, Schmidt J, Oeser M, Jing R. Evaluation of Design Procedure and Performance of Continuously Reinforced Concrete Pavement According to AASHTO Design Methods. Materials. 2022; 15(6):2252. https://doi.org/10.3390/ma15062252
Chicago/Turabian StyleMoharekpour, Milad, Pengfei Liu, Joshua Schmidt, Markus Oeser, and Ruxin Jing. 2022. "Evaluation of Design Procedure and Performance of Continuously Reinforced Concrete Pavement According to AASHTO Design Methods" Materials 15, no. 6: 2252. https://doi.org/10.3390/ma15062252
APA StyleMoharekpour, M., Liu, P., Schmidt, J., Oeser, M., & Jing, R. (2022). Evaluation of Design Procedure and Performance of Continuously Reinforced Concrete Pavement According to AASHTO Design Methods. Materials, 15(6), 2252. https://doi.org/10.3390/ma15062252