
Tribological Characteristics of a-C:H:Si and a-C:H:SiOx Coatings Tested in Simulated Body Fluid and Protein Environment

 ,
,  , , ,
, , ,  , ,
, , 
Abstract

1. Introduction
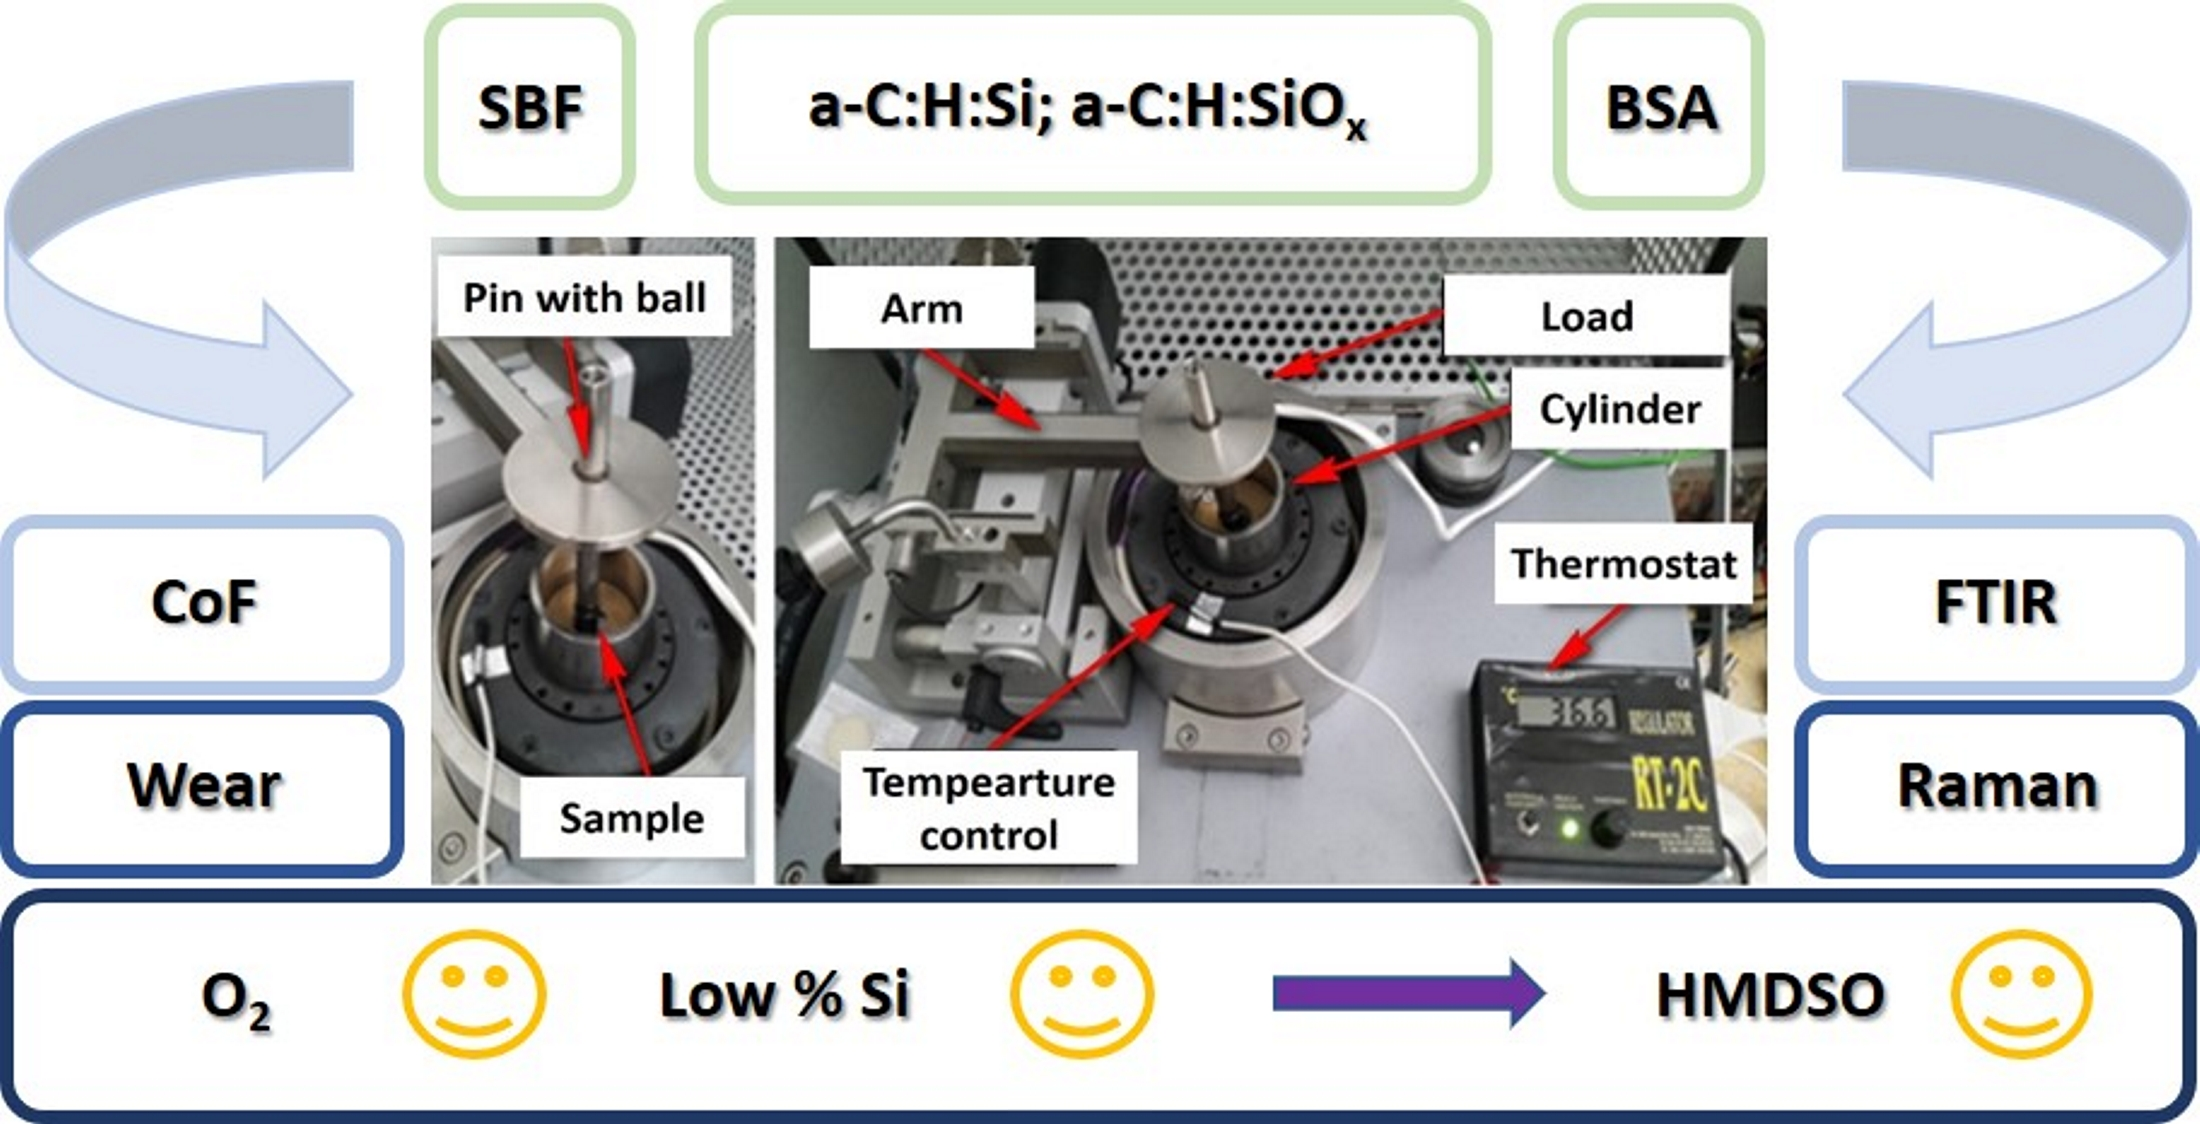
2. Materials and Methods
3. Results and Discussion
3.1. Frictional Behavior
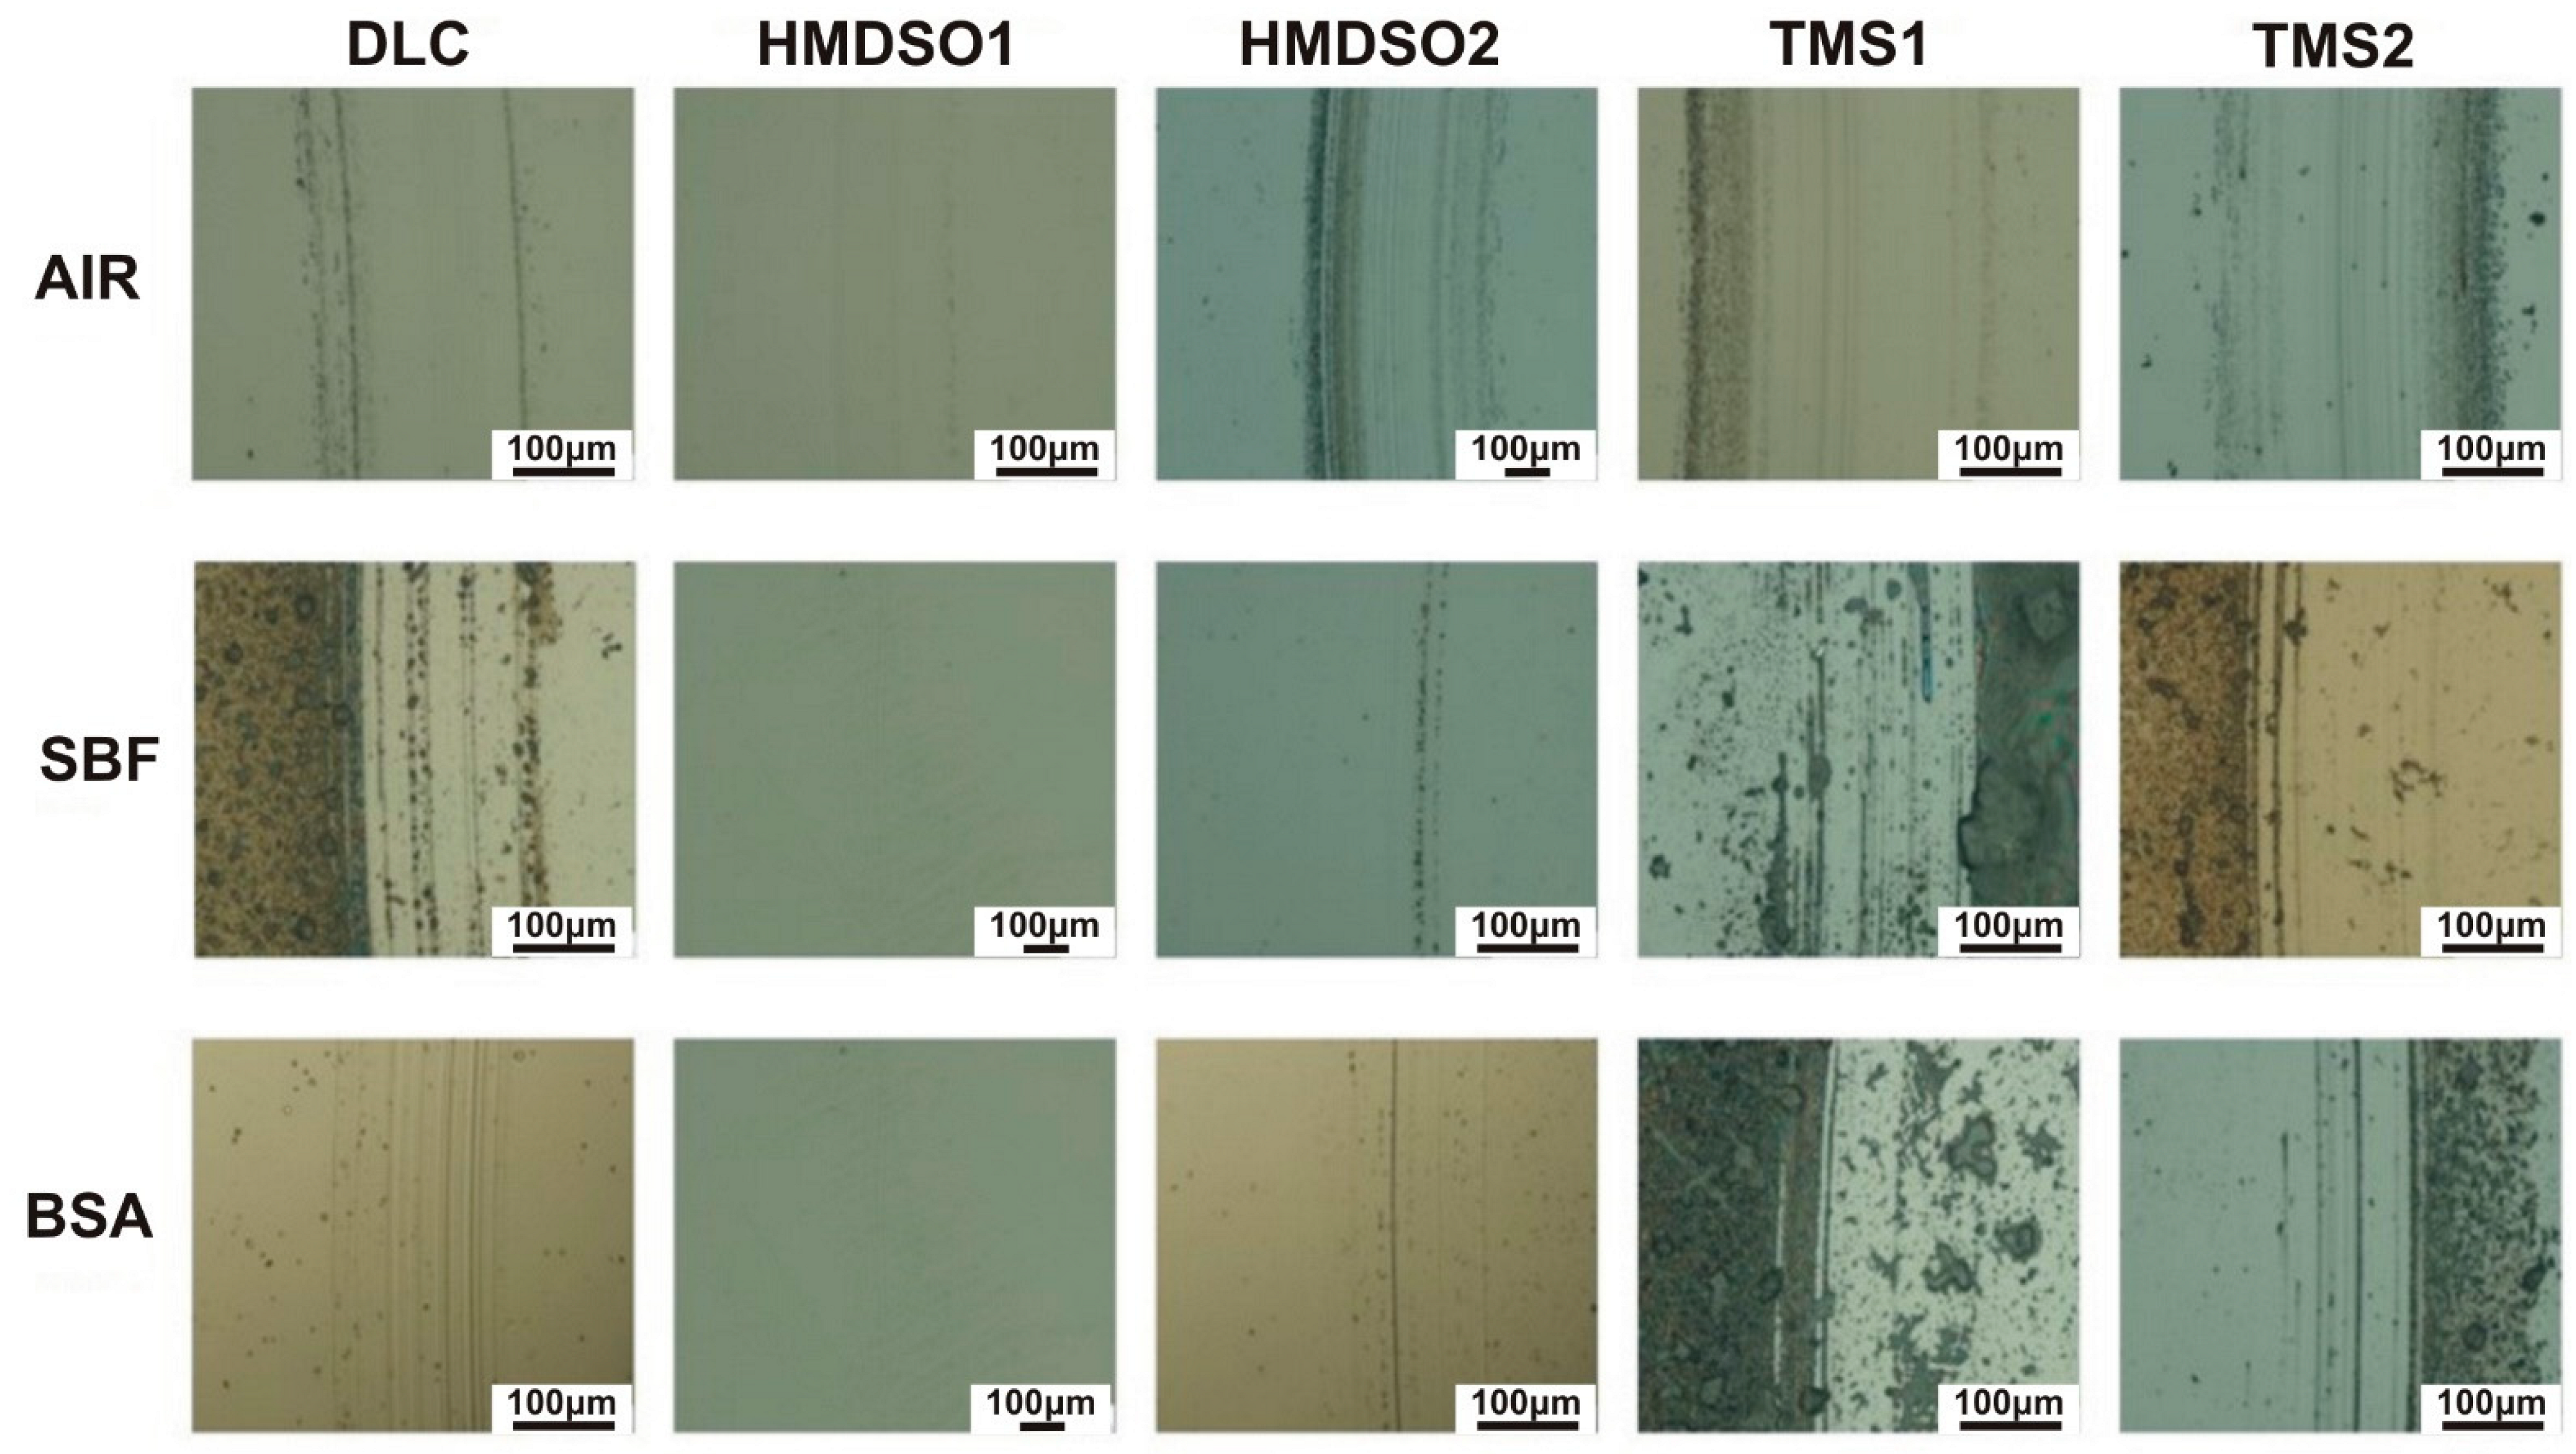
3.2. Wear Rate Analysis
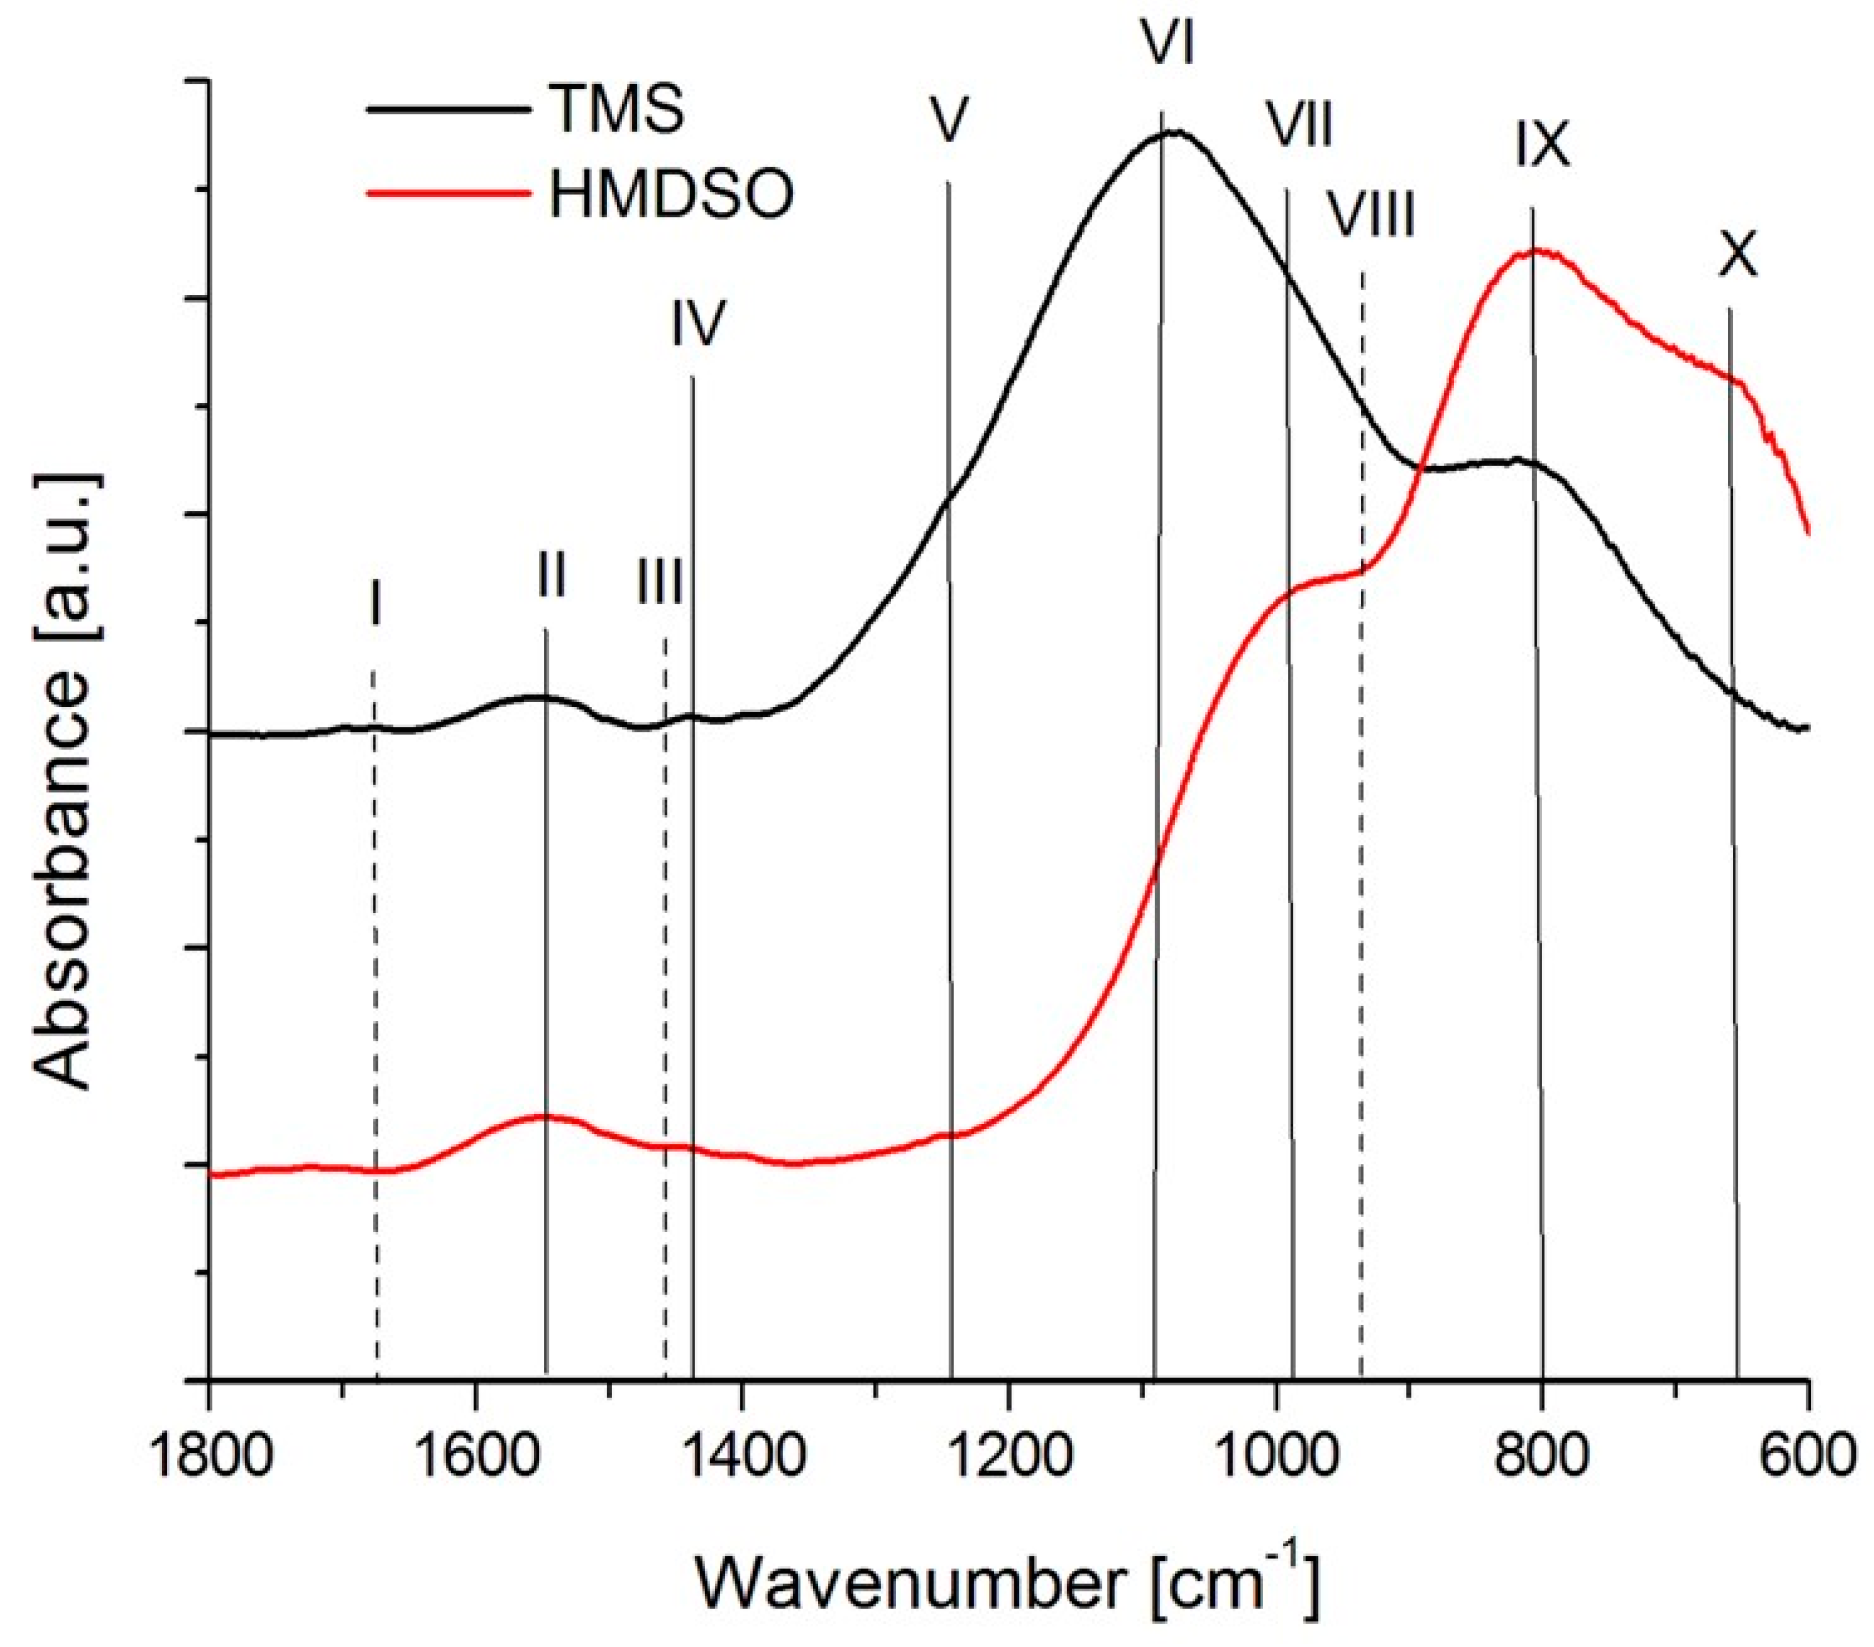
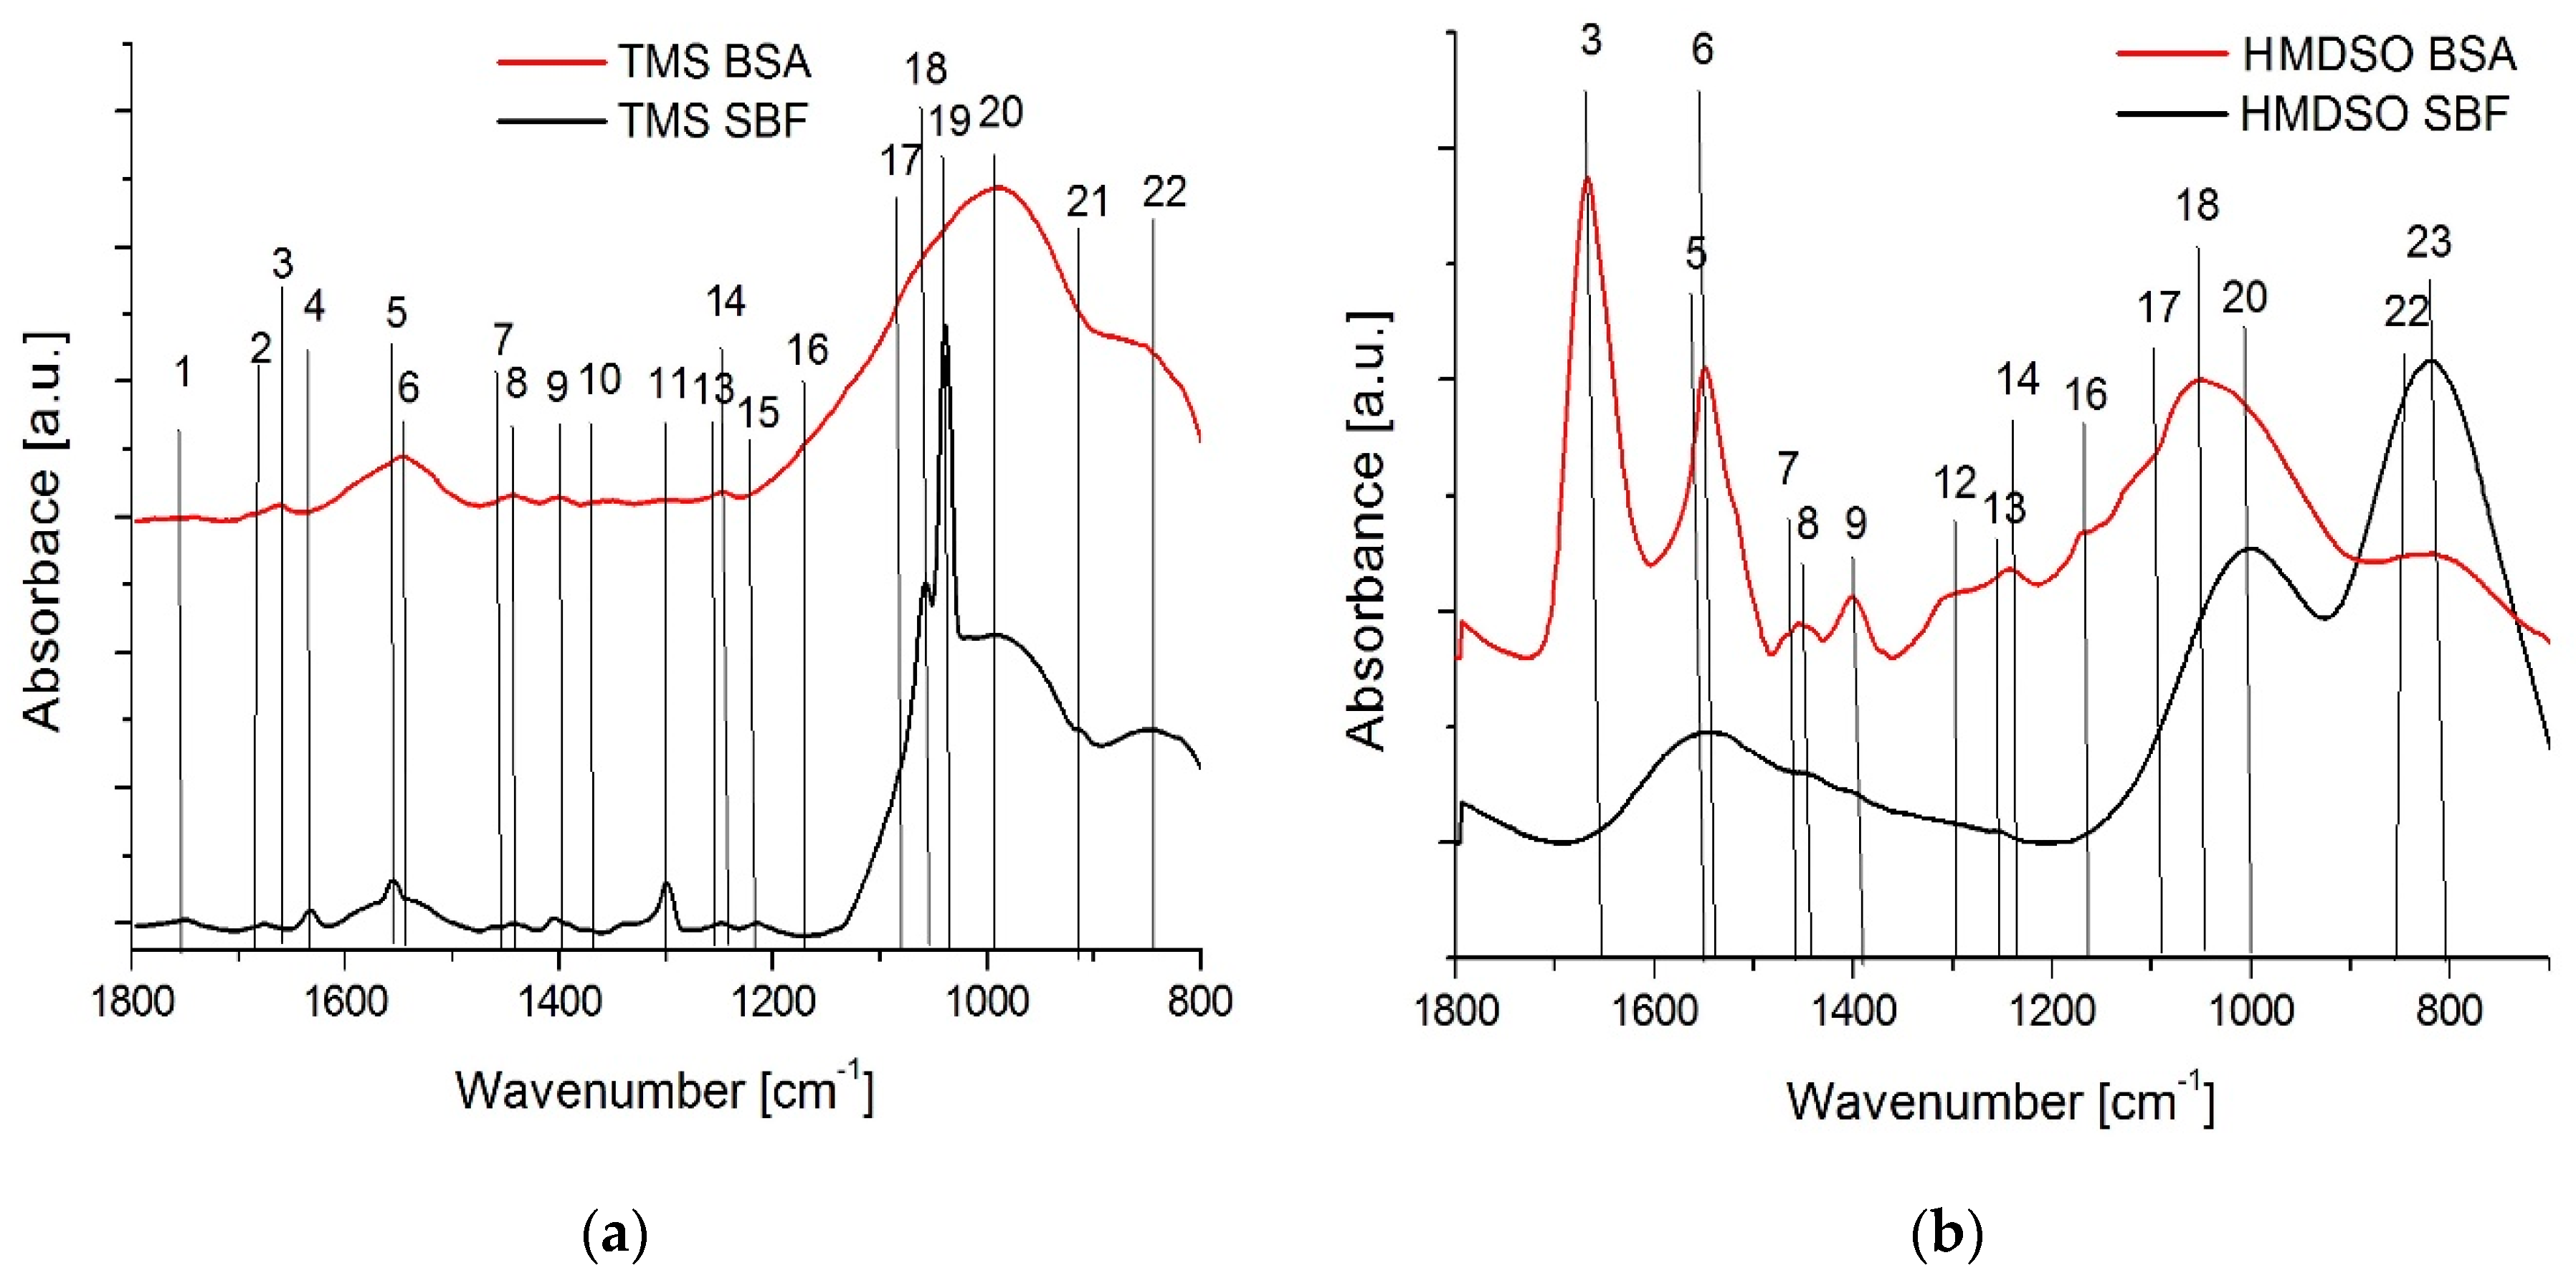
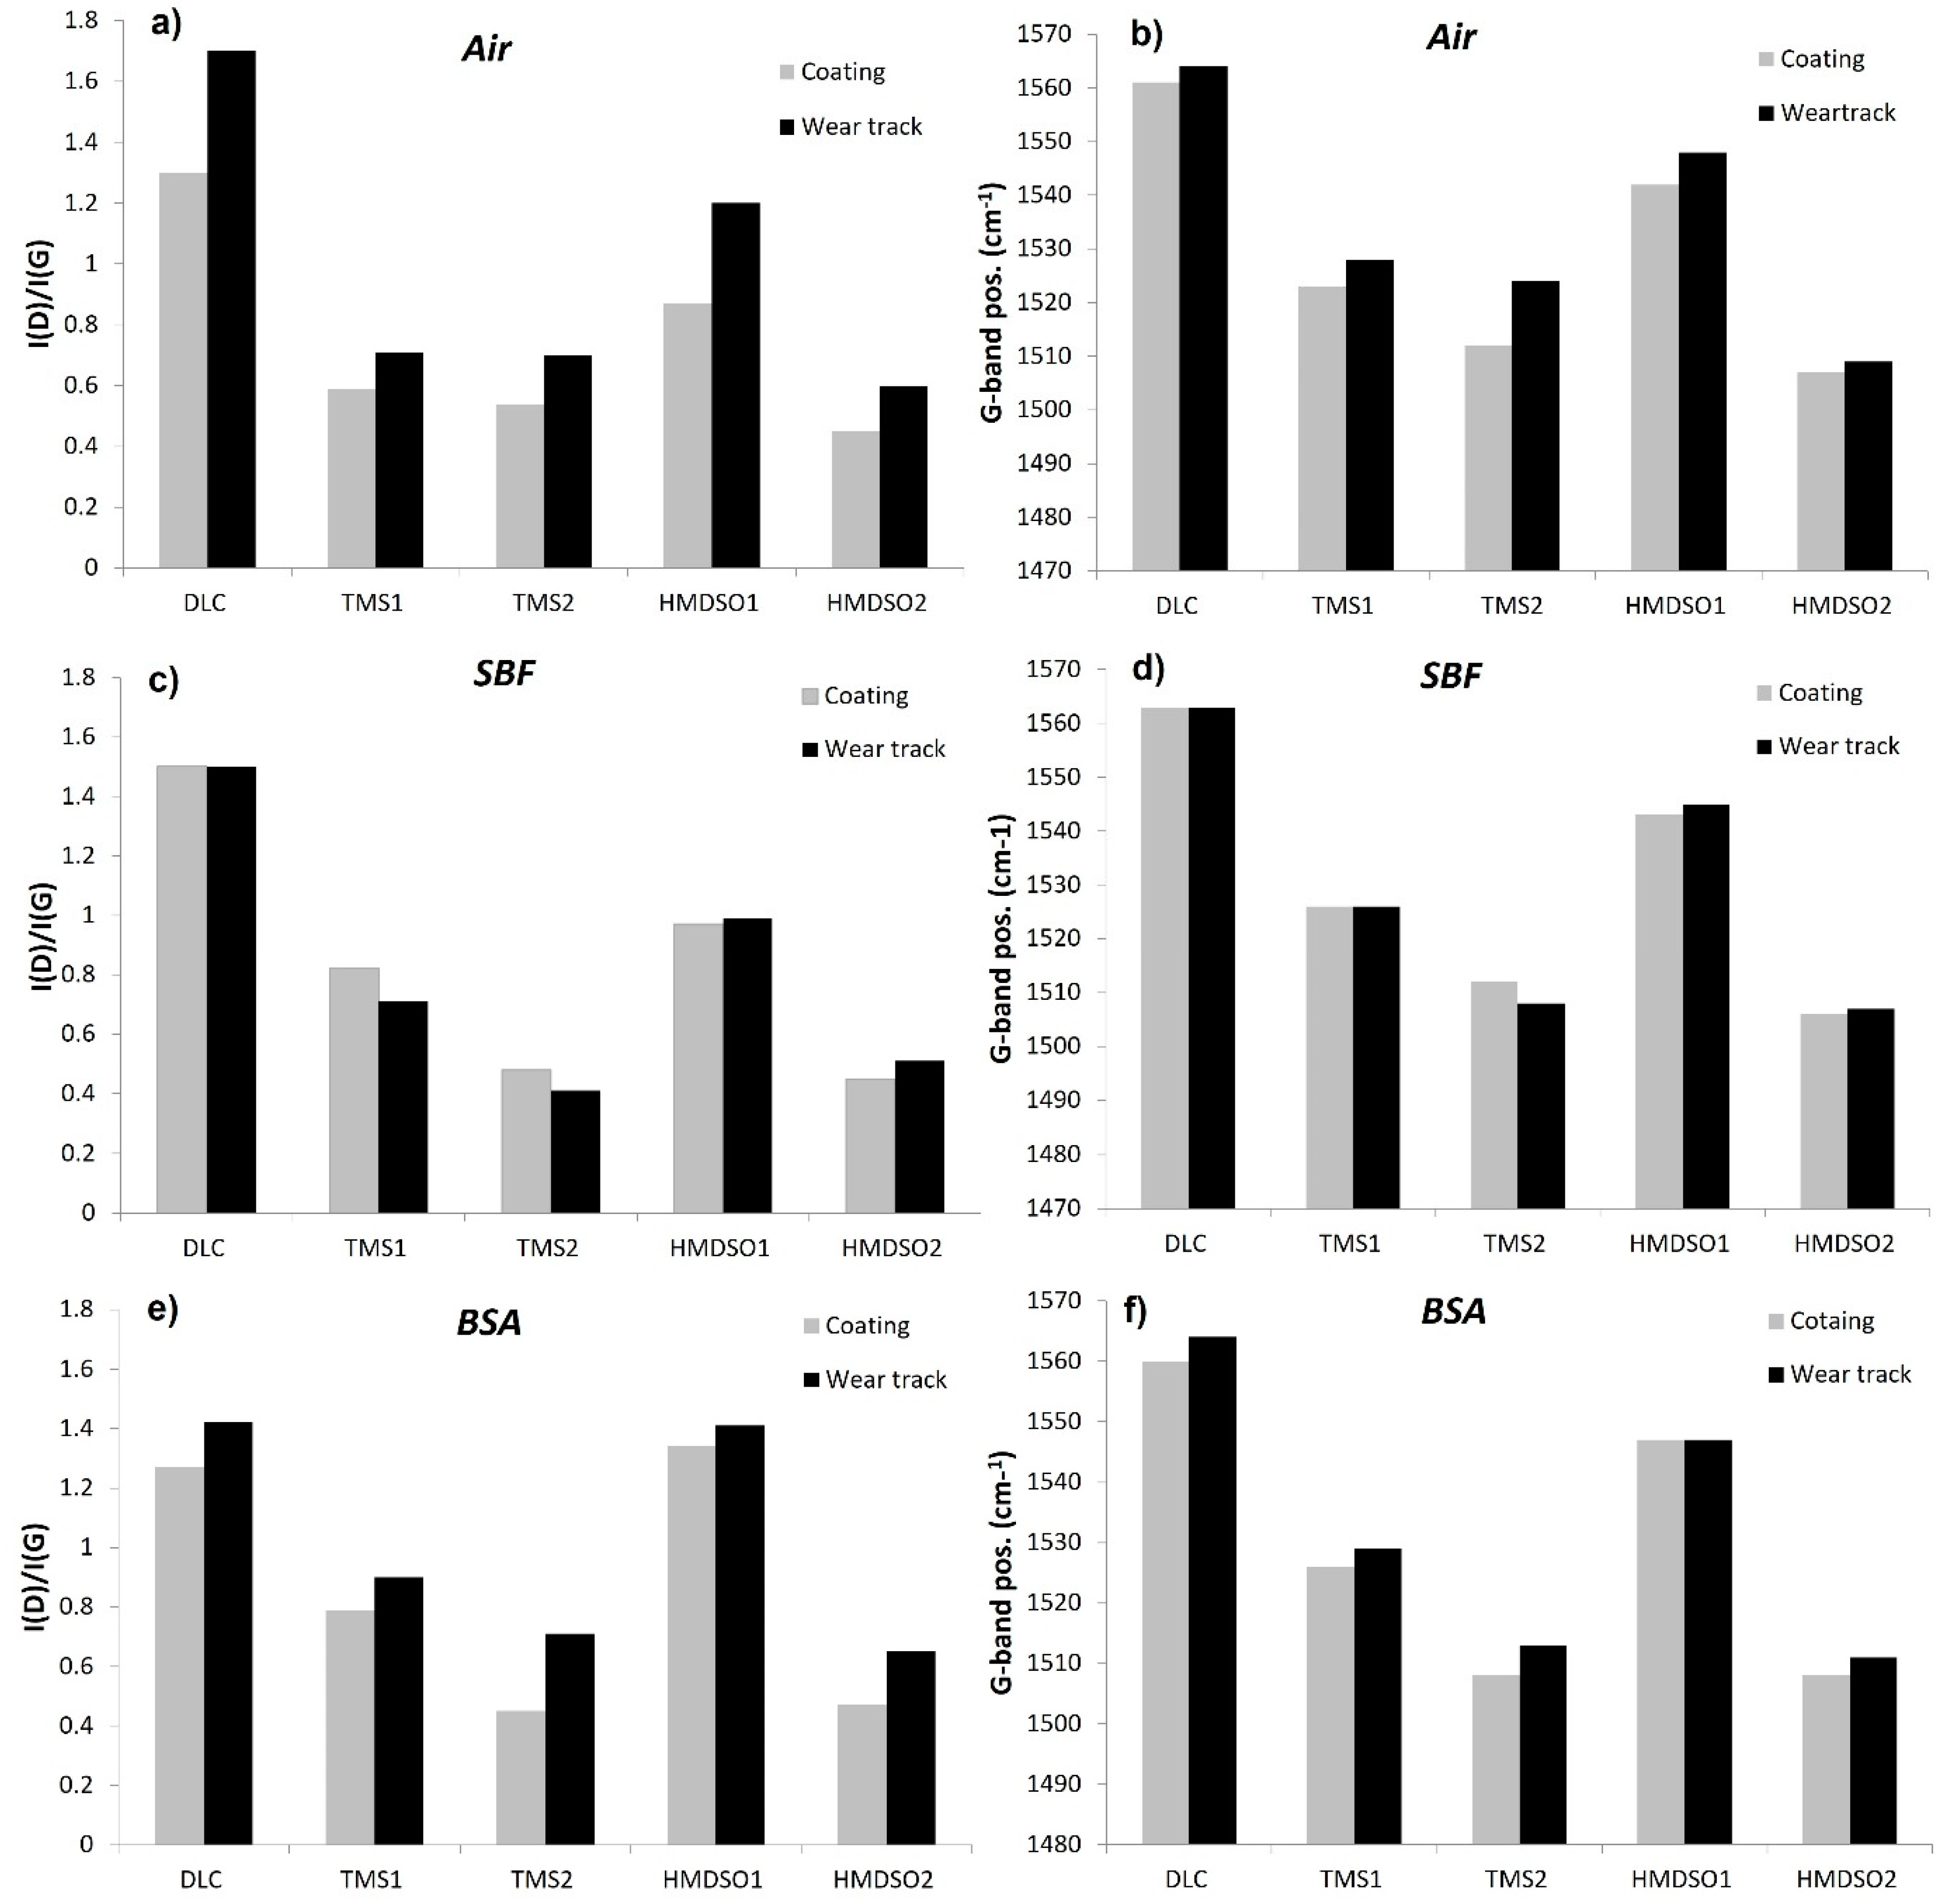
3.3. Chemical Characterization
3.4. Model of Interaction between BSA and Silicon-Incorporated DLC Films
4. Conclusions
Author Contributions
Funding
Institutional Review Board Statement
Informed Consent Statement
Data Availability Statement
Conflicts of Interest
References
- Shtansky, D.V.; Roy, M. Surface engineering for biotribological application. In Surface Engineering for Enhanced Performance against Wear; Roy, M., Ed.; Springer: Vienna, Austria, 2013. [Google Scholar]
- Merola, M.; Affatato, S. Materials for Hip Prostheses: A Review of Wear and Loading Considerations. Materials 2019, 12, 495. [Google Scholar] [CrossRef] [PubMed]
- Bauer, S.; Schmuki, P.; von der Mark, K.; Park, J. Engineering biocompatible implant surfaces: Part I: Materials and surfaces. Prog. Mater. Sci. 2013, 58, 261–326. [Google Scholar] [CrossRef]
- Hesketh, J.; Meng, Q.; Dowson, D.; Neville, A. Biotribocorrosion of metal-on-metal hip replacements: How surface degradation can influence metal ion formation. Tribol. Int. 2013, 65, 128–137. [Google Scholar] [CrossRef]
- Kenney, C.; Dick, S.; Lea, J.; Liu, J.; Ebraheim, N.A. A systematic review of the causes of failure of Revision Total Hip Arthroplasty. J. Orthop. 2019, 16, 393–395. [Google Scholar] [CrossRef]
- Khatod, M.; Cafri, G.; Inacio, M.; Schepps, A.L.; Paxton, E.W.; Bini, S.A. Revision total hip arthoplasty: Factors associated with Re-revision surgery. J. Bone Jt. Surg. Am. 2015, 97, 359–366. [Google Scholar] [CrossRef]
- Ramos, B.; Saito, E.; Trava-Airoldi, V.; Lobo, A.O.; Marciano, F. Diamond-like carbon electrochemical corrosion resistance by addition of nanocrystalline diamond particles for biomedical applications. Surf. Coat. Technol. 2014, 259, 732–736. [Google Scholar] [CrossRef]
- Capote, G.; Ramírez, M.; da Silva, P.; Lugo, D.; Trava-Airoldi, V. Improvement of the properties and the adherence of DLC coatings deposited using a modified pulsed-DC PECVD technique and an additional cathode. Surf. Coat. Technol. 2016, 308, 70–79. [Google Scholar] [CrossRef]
- Gotzmann, G.; Beckmann, J.; Scholz, B.; Herrmann, U.; Wetzel, C. Low-energy electron-beam modification of DLC coatings reduces cell count while maintaining biocompatibility. Surf. Coat. Technol. 2018, 336, 34–38. [Google Scholar] [CrossRef]
- Jamesh, M.I.; Li, P.; Bilek, M.; Boxman, R.; McKenzie, D.R.; Chu, P.K. Evaluation of corrosion resistance and cytocompatibility of graded metal carbon film on Ti and NiTi prepared by hybrid cathodic arc/glow discharge plasma-assisted chemical vapor deposition. Corros. Sci. 2015, 97, 126–138. [Google Scholar] [CrossRef]
- Hang, R.; Ma, S.; Chu, P.K. Corrosion behavior of DLC-coated NiTi alloy in the presence of serum proteins. Diam. Relat. Mater. 2010, 19, 1230–1234. [Google Scholar] [CrossRef]
- Gerke, L.; Schauer, J.-C.; Pohl, M.; Winter, J. Adhesion and elasticity of plasma deposited wear resistant a-C:H coatings on nickel–titanium. Surf. Coat. Technol. 2009, 203, 3214–3218. [Google Scholar] [CrossRef]
- Erdemir, A.; Donnet, C. Tribology of diamond-like carbon films: Recent progress and future prospects. J. Phys. D Appl. Phys. 2006, 39, 311–327. [Google Scholar] [CrossRef]
- Batory, D.; Szymanski, W.; Clapa, M. Mechanical and tribological properties of gradient a-C:H/Ti coatings. Mater. Sci. Pol. 2013, 31, 415–423. [Google Scholar] [CrossRef]
- Bociąga, D.; Sobczyk-Guzenda, A.; Szymanski, W.; Jedrzejczak, A.; Jastrzebska, A.; Olejnik, A.; Jastrzębski, K. properties, chemical analysis and evaluation of antimicrobial response of Si-DLC coatings fabricated on AISI 316 LVM substrate by a multi-target DC-RF magnetron sputtering method for potential biomedical applications. Appl. Surf. Sci. 2017, 417, 23–33. [Google Scholar] [CrossRef]
- Ishihara, M.; Kosaka, T.; Nakamura, T.; Tsugawa, K.; Hasegawa, M.; Kokai, F.; Koga, Y. Antibacterial activity of fluorine incorporated DLC films. Diam. Relat. Mater. 2006, 15, 1011–1014. [Google Scholar] [CrossRef]
- Zhang, T.F.; Wan, Z.X.; Ding, J.C.; Zhang, S.; Wang, Q.M.; Kim, K.H. Microstructure and high-temperature tribological properties of Si-doped hydrogenated diamond-like carbon films. Appl. Surf. Sci. 2018, 435, 963–973. [Google Scholar] [CrossRef]
- Wu, Y.; Zhou, S.; Zhao, W.; Ouyang, L. Comparative corrosion resistance properties between (Cu, Ce)-DLC and Ti co-doped (Cu, Ce)/Ti-DLC films prepared via magnetron sputtering method. Chem. Phys. Lett. 2018, 705, 50–58. [Google Scholar] [CrossRef]
- Batory, D.; Gorzedowski, J.; Rajchel, B.; Szymanski, W.; Kolodziejczyk, L. Silver implanted diamond-like carbon coatings. Vacuum 2014, 110, 78–86. [Google Scholar] [CrossRef]
- Batory, D.; Jedrzejczak, A.; Kaczorowski, W.; Szymanski, W.; Kolodziejczyk, L.; Clapa, M.; Niedzielski, P. Influence of the process parameters on the characteristics of silicon-incorporated a-C:H:SiOx coatings. Surf. Coat. Technol. 2015, 271, 112–118. [Google Scholar] [CrossRef]
- Batory, D.; Jedrzejczak, A.; Szymanski, W.; Niedzielski, P.; Fijalkowski, M.; Louda, P.; Kotela, I.; Hromadka, M.; Musil, J. Mechanical characterization of a-C:H:SiOx coatings synthesized using radio-frequency plasma-assisted chemical vapor deposition metod. Thin Solid Film. 2015, 590, 299–305. [Google Scholar] [CrossRef]
- Batory, D.; Jedrzejczak, A.; Kaczorowski, W.; Kolodziejczyk, L.; Burnat, B. The effect of Si incorporation on the corrosion resistance of a-C:H:SiOx coatings. Diam. Relat. Mater. 2016, 67, 1–7. [Google Scholar] [CrossRef]
- Namus, R.; Rainforth, W. Influence of protein adsorption on tribocorrosion behaviour of CoCrMo biomedical-grade alloys. Tribol. Int. 2020, 150, 106364. [Google Scholar] [CrossRef]
- Wang, Z.; Yan, Y.; Su, Y.; Qiao, L. Effect of proteins on the surface microstructure evolution of a CoCrMo alloy in bio-tribocorrosion processes. Colloids Surf. B 2016, 145, 176–184. [Google Scholar] [CrossRef] [PubMed]
- Dimah, M.K.; Devesa Albeza, F.; Amigó Borrás, V.; Igual Muñoz, A. Study of the biotribocorrosion behaviour of titanium biomedical alloys in simulated body fluids by electrochemical techniques. Wear 2012, 294, 409–418. [Google Scholar] [CrossRef]
- Hang, R.; Qi, Y. A study of biotribological behavior of DLC coatings and its influence to human serum albumin. Diam. Relat. Mater. 2010, 19, 62–66. [Google Scholar] [CrossRef]
- Alemón, B.; Flores, M.; Ramírez, W.; Huegel, J.C.; Broitman, E. Tribocorrosion behavior and ions release of CoCrMo alloy coated with aTiAlVCN/CNx multilayer in simulated body fluid plus bovine serum albumin. Tribol. Int. 2015, 81, 159–168. [Google Scholar] [CrossRef]
- Escudeiro, A.; Polcar, T.; Cavaleiro, A. Adsorption of bovine serum albumin on Zr co-sputtered a-C(:H) films: Implication wear behavior. J. Mech. Behav. Biomed. Mater. 2014, 39, 316–327. [Google Scholar] [CrossRef][Green Version]
- Scholes, C. A frictional study of total hip joint replacements. Phys. Med. Biol. 2000, 45, 3721. [Google Scholar] [CrossRef]
- Ahlroos, T.; Saikko, V. Wear of prosthetic joint materials in various lubricants. Wear 1997, 211, 113–119. [Google Scholar] [CrossRef]
- Carapeto, A.P.; Serro, A.P.; Nunes, B.M.F.; Martins, M.C.L.; Todorovic, S.; Duarte, M.T.; André, V.; Colaço, R.; Saramago, B. Characterization of two DLC coatings for joint prosthesis: The role of albumin on the tribological behavior. Surf. Coat. Technol. 2010, 204, 3451–3458. [Google Scholar] [CrossRef]
- Jedrzejczak, A.; Kolodziejczyk, L.; Szymanski, W.; Piwonski, I.; Cichomski, M.; Kisielewska, A.; Dudek, M.; Batory, D. Friction and wear of a-C:H:SiOx coatings in combination with AISI 316L and ZrO2 counterbodies. Tribol. Int. 2017, 112, 155–162. [Google Scholar] [CrossRef]
- Jedrzejczak, A.; Batory, D.; Dominik, M.; Smietana, M.; Cichomski, M.; Szymanski, W.; Bystrzycka, E.; Prowizor, M.; Kozlowski, W.; Dudek, M. Carbon coatings with high concentrations of silicon deposited by RF PECVD method at relatively high self-bias. Surf. Coat. Technol. 2017, 329, 212–217. [Google Scholar] [CrossRef]
- Sonnenfeld, A.; Tun, T.M.; Zajíčková, L.; Kozlov, K.V.; Wagner, H.-E.; Behnke, J.F.; Hippler, R. Deposition process based on organosilicon precursors in dielectric barrier discharges at atmospheric pressure—A comparison. Plasmas Polym. 2001, 6, 237–266. [Google Scholar] [CrossRef]
- Hauert, R.; Müller, U. An overview on tailored tribological and biological behavior of diamond-like carbon. Diam. Relat. Mater. 2003, 12, 171–177. [Google Scholar] [CrossRef]
- Roy, R.K.; Choi, H.-W.; Park, S.-J.; Lee, K.-R. Surface energy of the plasma treated Si incorporated diamond-like carbon films. Diam. Relat. Mater. 2007, 16, 1732–1738. [Google Scholar] [CrossRef]
- Wu, B.; Deng, Q.; Leng, Y.; Wang, C.; Huang, N. Characterization of adsorption and lubrication of synovial fluid proteins and HA on DLC joint bearings surface. Surf. Coat. Technol. 2017, 320, 320–332. [Google Scholar] [CrossRef]
- Lambert, J.B. Introduction to Organic Spectroscopy; Macmillan Publ.: New York, NY, USA, 1987; Chapter 7. [Google Scholar]
- Vorsina, I.A.; Grigorieva, T.F.; Barinova, A.P.; Lyakhov, N.Z. Mechanochemical interaction of silicon dioxide with organic acids. Russ. J. Bioorg. Chem. 2013, 39, 765–770. [Google Scholar]
- Das, L.; Guleria, A.; Adhikari, S. Aqueous phase one-pot green synthesis of SnSe nanosheets in a protein matrix: Negligible cytotoxicity and room temperature emission in the visible region. RSC Adv. 2015, 75, 61390–61397. [Google Scholar] [CrossRef]
- Lee Smith, A. Analysis of Silicones; Wiley: New York, NY, USA, 1974; Chapter 10. [Google Scholar]
- Arkles, B. Infrared Analysis of Organosilicon Compounds: Spectra-Structure Correlations, Reprinted from Silicon Compounds: Silanes & Silicones; Gelest. Inc.: Morrisville, PA, USA, 2013. [Google Scholar]
- Siliprandi, R.A.; Zanini, S.; Grimoldi, E.; Fumagalli, F.; Barni, R.; Riccardi, C. Atmospheric pressure plasma discharge for polysiloxane thin films deposition and comparison with low pressure process. Plasma Chem. Plasma Process. 2011, 31, 353–372. [Google Scholar] [CrossRef]
- Jing, S.-Y.; Lee, H.-J.; Choi, C.K. Bond Structure on Si-O-C Composite films with a low dielectric constant deposited by using inductively coupled plasma chemical vapor deposition. J. Korean Phys. Soc. 2002, 41, 769–773. [Google Scholar]
- Casiraghi, C.; Piazza, F.; Ferrari, A.C.; Grambole, D.; Robertson, J. Boding in hydrogenated diamond-like carbon by Raman spectroscopy. Diam. Relat. Mater. 2005, 14, 1098–1102. [Google Scholar] [CrossRef]
- Papakonstantinou, P.; Zhao, J.F.; Lemoine, P.; McAdams, E.T.; McLaughlin, J.A. The effects of Si incorporation on the electrochemical and nanomechanical properties of DLC thin films. Diam. Relat. Mater. 2002, 11, 1074–1080. [Google Scholar] [CrossRef]
- Camargo, S.; Neto, A.B.; Santos, R.; Freire, F.; Carius, R.; Finger, F. Improved high-temperature stability of Si-incorporated a-C:H films. Diam. Relat. Mater. 1998, 7, 1155–1162. [Google Scholar] [CrossRef]
- Wu, W.-J.; Hon, M.-H. Thermal stability of diamond-like carbon films with added silicon. Surf. Coat. Technol. 1999, 111, 134–140. [Google Scholar] [CrossRef]
- Dwyer-Joyce, R.S. Predicting the abrasive wear of ball bearings by lubricant debris. Wear 1999, 233–235, 692–701. [Google Scholar] [CrossRef]
- Myant, C.; Cann, P. On the matter of synovial fluid lubrication: Implications for Metal-on-Metal hip tribology. J. Mech. Behav. Biomed. Mater. 2014, 34, 338–348. [Google Scholar]


| Coating | Pressure [Pa] | Gas Mixture and Flow Ratio | Bias | Deposition Time | Si Content [at.%] | O Content [at.%] |
|---|---|---|---|---|---|---|
| DLC | 20 | CH4 | −800 | 37 | - | - |
| TMS1 | CH4/TMS-18/4 | 17 | 5.0 | - | ||
| TMS2 | CH4/TMS-17/8 | 15 | 10.0 | - | ||
| HMDSO1 | CH4/HMDSO-18/3 | 28 | 0.45 | 9.3 | ||
| HMDSO2 | CH4/HMDSO-16/12 | 21 | 5.3 | 10.3 |
| No. | Wavenumber [cm−1] | Vibrating Mode [cm−1] | Ref. | TMS | HMDSO |
|---|---|---|---|---|---|
| I | 1680 | C=O (stretch) | [38] | +(weak) | - |
| II | 1550 | C=O (stretch) | [39] | + | + |
| III | 1460 | CH3 (deformation) | [38] | + | + |
| IV | 1440 | C-OH/Si-OH (bend) | [38,40,41] | + | - |
| V | 1250 | Si-CH3 (bend) | [41,42] | + | + |
| VI | 1080 | Si-O-C/Si-CH2-Si (stretch) | [43,44] | +(strong) | +(weak) |
| VII | 998 | Si-O(stretch) | [41,42,43] | + | +(strong) |
| VIII | 940 | Si-OH/Si-O (stretch) | [41,42] | + | + |
| IX | 798 | Si-C (stretch) | [41,42] | +(strong) | + |
| X | 660 | Si-O (bend) | [38,40,43] | + | - |
| No. | Wavenumber [cm−1] | Vibrating Mode [cm−1] | Ref. | TMS SBF | TMS BSA | HMDSO SBF | HMDSO BSA |
|---|---|---|---|---|---|---|---|
| 1 | 1750 | C=O (stretch) | [38] | + | - | - | - |
| 2 | 1680 | C=O (stretch) | [38] | + | + | - | - |
| 3 | 1659 | C=O, C-N (stretch) (amid I) | [38,40] | - | + | - | +(strong) |
| 4 | 1630 | C=C (stretch) | [38] | + | - | - | - |
| 5 | 1550 | C=O (stretch) | [39] | +(strong) | + | + | + |
| 6 | 1540 | N-H, C-N (deformation) (amid II) | [38,40] | - | + | - | +(strong) |
| 7 | 1460 | CH3 (deformation) | [38] | + | + | + | + |
| 8 | 1440 | C-OH/Si-OH (Bend) | [38,41,42] | + | + | + | + |
| 9 | 1390 | C-N (stretch) (amide III band) | [38,41] | - | + | - | +(strong) |
| 10 | 1370 | SiOCOCH3 | [41,42] | +(weak) | +(weak) | - | - |
| 11 | 1305 | C=O (stretch) | [38] | +(strong) | - | - | - |
| 12 | 1299 | C-N (stretch) (amide III) | [38,40] | - | - | - | + |
| 13 | 1250 | Si-CH3 (bend) | [41,42] | + | + | + | + |
| 14 | 1240 | C-N (stretch) | [38,40] | - | + | - | + |
| 15 | 1213 | C-O-C (stretch) | [38] | + | - | - | - |
| 16 | 1170 | C-C-N (stretch) | [38] | - | + | - | + |
| 17 | 1080 | Si-O-C/R1-Si-O-Si-R2 | [43,44] | + | + | + | + |
| 18 | 1057 | (stretch) | [41,42,43] | +(strong) | + | + | + |
| 19 | 1038 | Si-O/Si-CH2-Si (stretch) | [41,42,43] | +(strong) | + | - | - |
| 20 | 1000 | Si-O-Si (stretch) | [41,42,43] | + | + | + | + |
| 21 | 920 | Si-O(stretch) | [38] | + | - | - | - |
| 22 | 857 | CH=CH (deformation) | [44] | + | + | + | + |
| 23 | 802 | Si-O-C (stretch) | [41,42] | + | + | + | + |
Publisher’s Note: MDPI stays neutral with regard to jurisdictional claims in published maps and institutional affiliations. |
© 2022 by the authors. Licensee MDPI, Basel, Switzerland. This article is an open access article distributed under the terms and conditions of the Creative Commons Attribution (CC BY) license (https://creativecommons.org/licenses/by/4.0/).
Share and Cite
Jedrzejczak, A.; Szymanski, W.; Kolodziejczyk, L.; Sobczyk-Guzenda, A.; Kaczorowski, W.; Grabarczyk, J.; Niedzielski, P.; Kolodziejczyk, A.; Batory, D. Tribological Characteristics of a-C:H:Si and a-C:H:SiOx Coatings Tested in Simulated Body Fluid and Protein Environment. Materials 2022, 15, 2082. https://doi.org/10.3390/ma15062082
Jedrzejczak A, Szymanski W, Kolodziejczyk L, Sobczyk-Guzenda A, Kaczorowski W, Grabarczyk J, Niedzielski P, Kolodziejczyk A, Batory D. Tribological Characteristics of a-C:H:Si and a-C:H:SiOx Coatings Tested in Simulated Body Fluid and Protein Environment. Materials. 2022; 15(6):2082. https://doi.org/10.3390/ma15062082
Chicago/Turabian StyleJedrzejczak, Anna, Witold Szymanski, Lukasz Kolodziejczyk, Anna Sobczyk-Guzenda, Witold Kaczorowski, Jacek Grabarczyk, Piotr Niedzielski, Agnieszka Kolodziejczyk, and Damian Batory. 2022. "Tribological Characteristics of a-C:H:Si and a-C:H:SiOx Coatings Tested in Simulated Body Fluid and Protein Environment" Materials 15, no. 6: 2082. https://doi.org/10.3390/ma15062082
APA StyleJedrzejczak, A., Szymanski, W., Kolodziejczyk, L., Sobczyk-Guzenda, A., Kaczorowski, W., Grabarczyk, J., Niedzielski, P., Kolodziejczyk, A., & Batory, D. (2022). Tribological Characteristics of a-C:H:Si and a-C:H:SiOx Coatings Tested in Simulated Body Fluid and Protein Environment. Materials, 15(6), 2082. https://doi.org/10.3390/ma15062082