
Exploratory Data Analysis for the Evaluation of Tribological Properties of Wear-Resistant Surface Layers Modified with Rare-Earth Metals


Abstract
:1. Introduction
2. Methodology
2.1. Surface Modification
2.2. Tribological Tests
- hardness test:
- -
- micro combi tester MCT3 ANTON PAAR (Anton Paar, Corcelles-Cormondreche, Switzerland),
- -
- nominal loading force 2000 mN,
- -
- loading/unloading rate = 4000 mN/min,
- -
- Vickers indenter.
- scratch test
- -
- micro combi tester MCT3 ANTON PAAR (Anton Paar, Corcelles-Cormondreche, Switzerland),
- -
- initial loading force 30 mN,
- -
- final loading force 15,000 mN
- -
- loading/unloading rate = 59,979.8 mN/min,
- -
- Rockwell indenter
- -
- indenter radius 100 μm.
- tribological tests under dry and fluid friction:
- -
- tribometer TRB3 Anton Paar (Anton Paar, Corcelles-Cormondreche, Switzerland),
- -
- reciprocating motion,
- -
- amplitude: 10 mm
- -
- frequency: 1 Hz
- -
- number of cycles: 10,000
- -
- friction type: dry friction/fluid friction (water solution 10% SiO2)
- -
- temperature: 23 ± 1°
- -
- humidity: 50 ± 1%
- tests for the maximum wear track depth and area measured from the surface profile:
- -
- optical profilometer: Leica DCM8 (Leica, Wetzlar, Germany)
- -
- the maximum track depth and the track area measured from the surface profile were taken as measures of the sample wear.
2.3. Exploratory Data Analysis
- What are your analysis goals and outcomes?
- What tasks do you perform during analysis?
- What tools do you use?
- Python 3.10.2,
- Jupyter Notebook 6.4.5,
- Numpy 1.22.0,
- Pandas 1.4.1,
- Matplotlib 3.5.1,
- Seaborn 0.11.2,
- Scipy 1.8.0.
- Inserting missing data. When the set has empty spaces, they can be filled using several strategies, such as inserting the mean, median, or the most common value.
- Identification of outliers. Outliers are data that do not follow the distribution of other data. Since they are anomalies that should not be modelled, they must be identified and removed. Outliers also have a negative effect on the Pearson’s linear correlation coefficient.
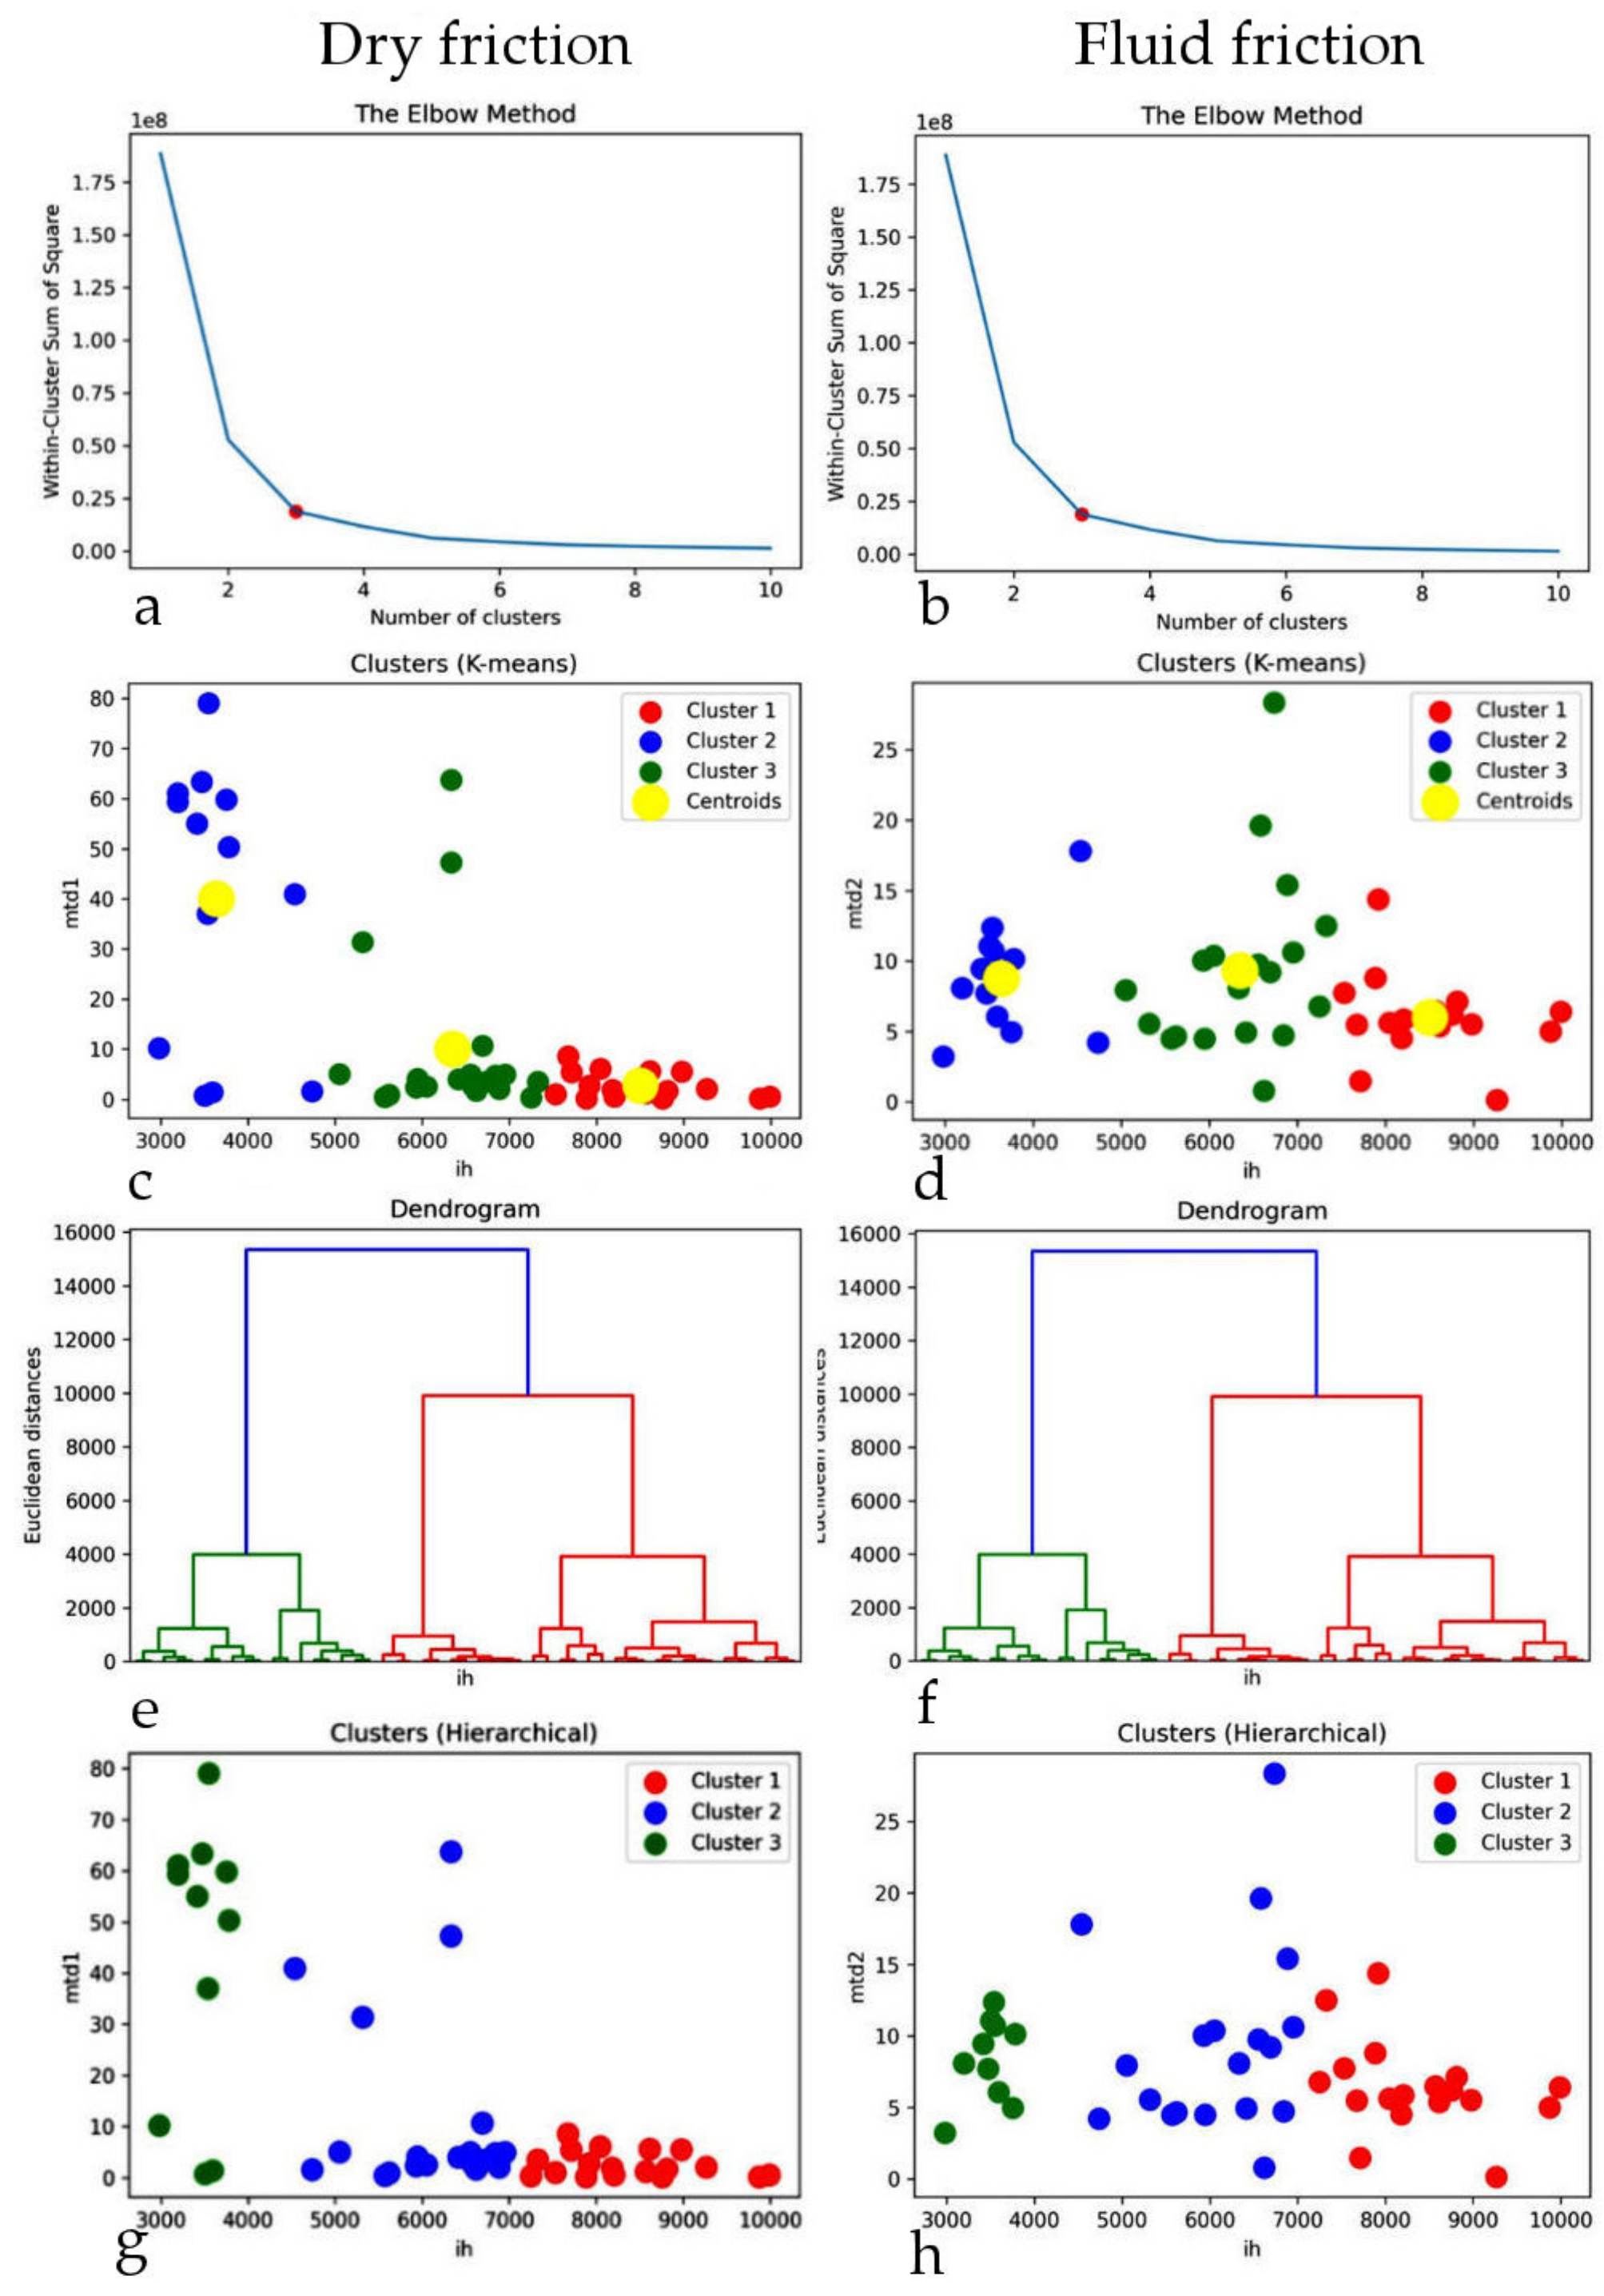
- Cluster analysis. It is an unsupervised learning method that groups similar data using various algorithms (K-means, Hierarchical Clustering). This method enables cluster analysis, anomaly detection, and dimensionality reduction.
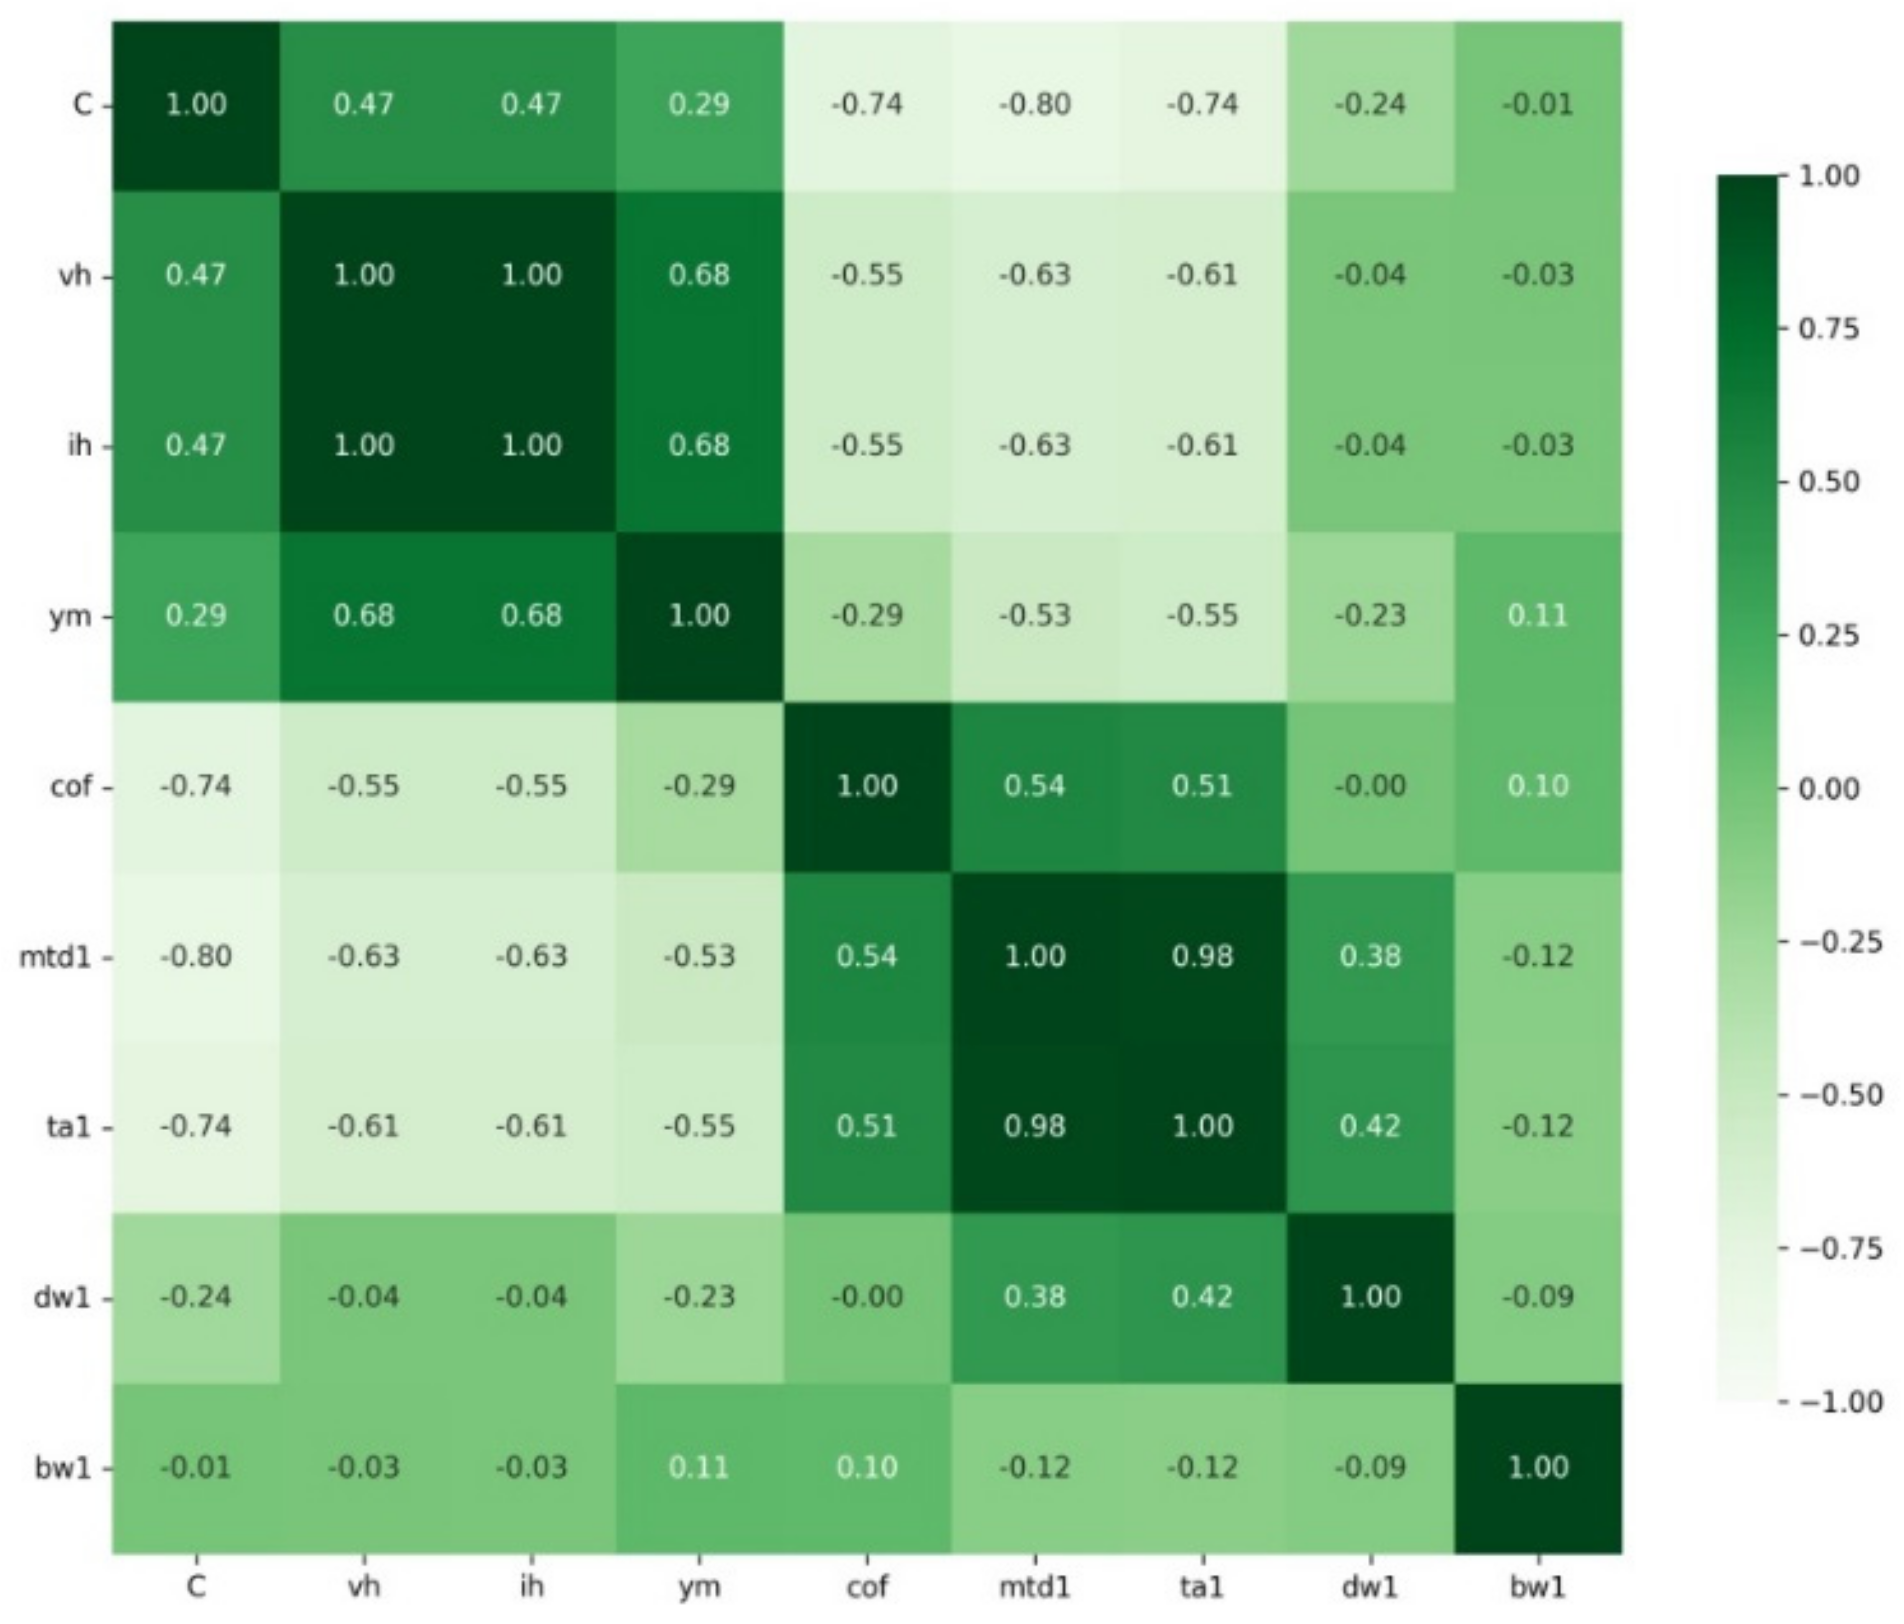
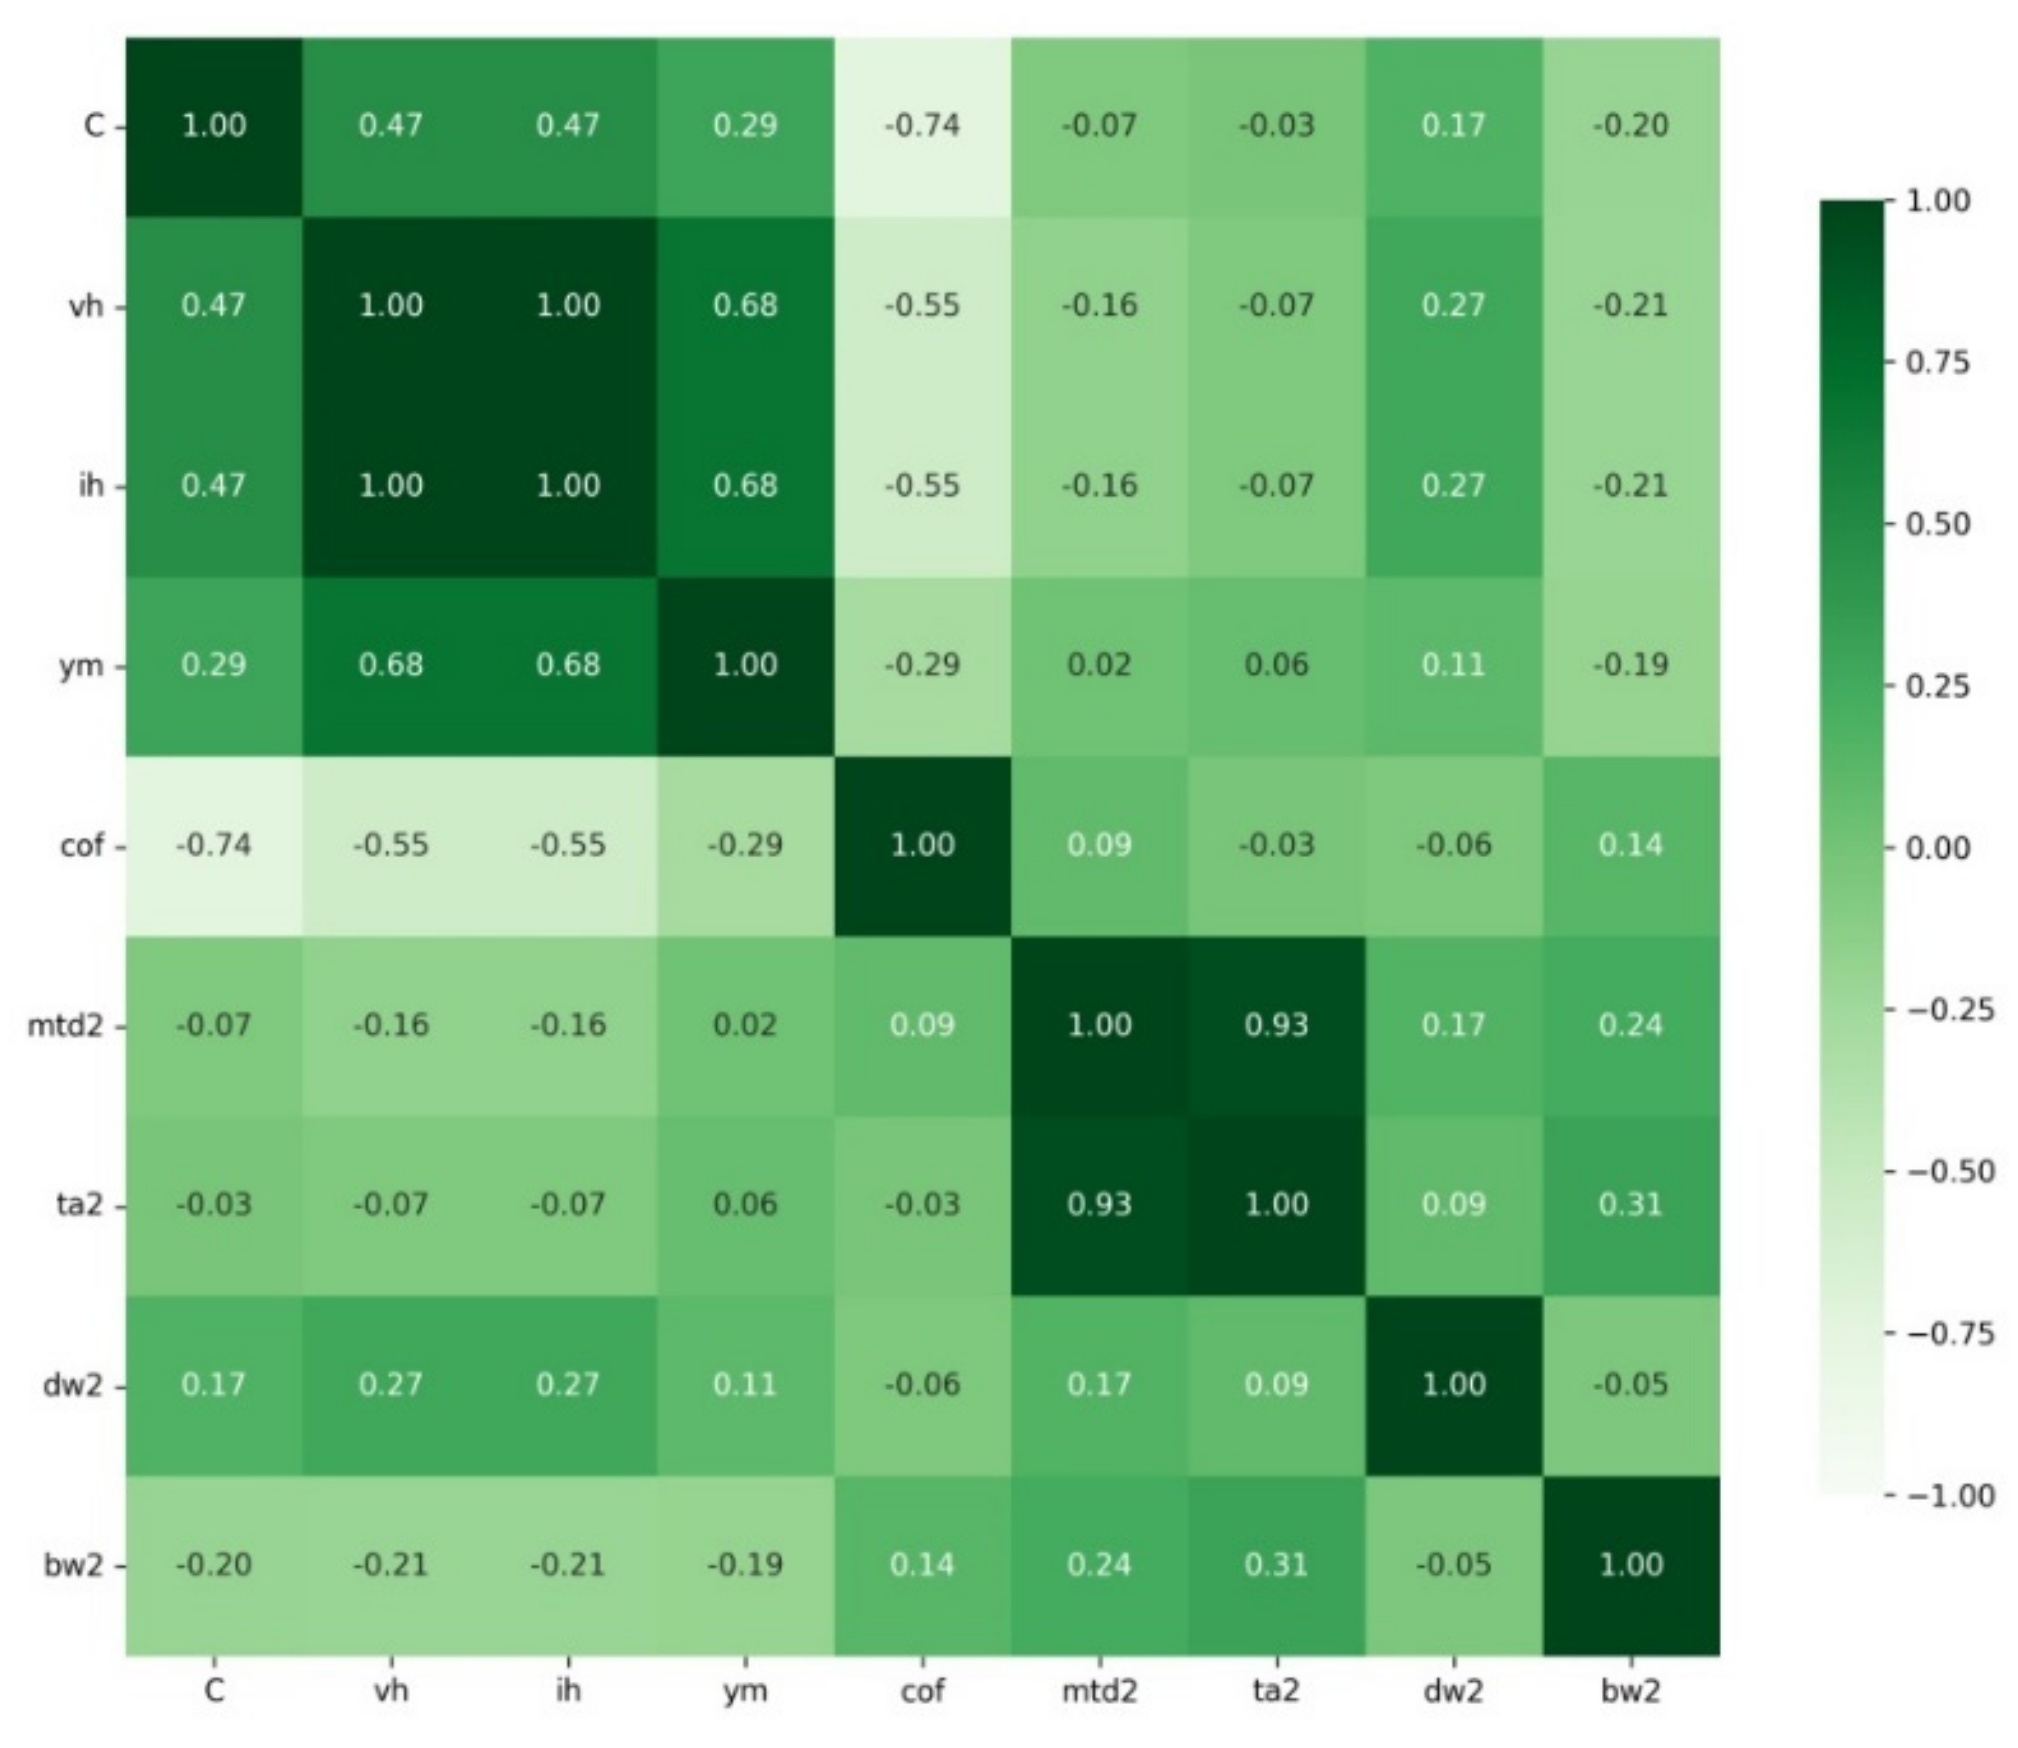
- Heatmap. A heatmap is a data visualisation technique that shows the magnitude of a phenomenon as a colour in two dimensions. Colour variation can be due to shade or intensity, giving visual clues as to how this phenomenon is clustered and how it changes in space.
- dry friction,
- fluid friction.
3. Results and Discussion
4. Conclusions
Author Contributions
Funding
Institutional Review Board Statement
Informed Consent Statement
Data Availability Statement
Conflicts of Interest
References
- Naumov, A.V. Review of the world market of rare earth metals. Russ. J. NonFerrous Met. 2008, 49, 2231. [Google Scholar]
- Lundin, R.; Wilson, J.R. Rare earth metals. Adv. Mater. Processes 2000, 158, 52–55. [Google Scholar]
- Wang, L.; Lin, Q.; Ji, J.; Lan, D. New study concerning development of application of rare earth metals. J. Alloys Compd. 2005, 408–412, 384–386. [Google Scholar] [CrossRef]
- Committee on Assessing the Need for a Defense Stockpile National Materials Advisory Board; Division of Engineering and Physical Science. Managing Materials for a 21st Century Military; The National Academies Press: Washington, DC, USA, 2008; Available online: http://www.nap.edu/catalog.php?record_id=12028 (accessed on 2 January 2022).
- Wang, K.L.; Zhang, Q.B.; Sun, M.L.; Wei, X.G.; Zhu, Y.M. Microstructure and corrosion resistance of laser clad coatings with rare earth elements. Corros. Sci. 2001, 43, 255–267. [Google Scholar] [CrossRef]
- Wang, X.H.; Zhang, M.; Zhou, Z.D.; Qu, S.Y. Microstructure and properties of laser clad TiC+NiCrBSi+rare earth composite coatings. Surf. Coat. Technol. 2002, 161, 195–199. [Google Scholar] [CrossRef]
- Zhao, G.M.; Wang, K.L. Effect of La2O3 on corrosion resistance of laser clad ferrite-based alloy coatings. Corros. Sci. 2006, 48, 273–284. [Google Scholar] [CrossRef]
- Liu, Q.B.; Zou, J.L.; Zheng, M.; Dong, C. Effect of Y2O3 con-tent on microstructure of gradient bioceramic composite coating produced by wide-band laser cladding. J. Rare Earths 2005, 23, 446. [Google Scholar]
- Wu, C.F.; Ma, M.X.; Liu, W.J.; Zhong, M.L.; Zhang, H.J.; Zhang, W.M. Laser cladding in-situ carbide particle reinforced Fe-based composite coatings with rare earth oxide addition. J. Rare Earths 2009, 27, 997. [Google Scholar] [CrossRef]
- Yi, W.; Zheng, C.Q.; Fan, P.; Cheng, S.H.; Li, W.; Ying, G.F. Ef-fect of rare earth on oxidation resistance of iron base flux-ing alloy spray-welding coating. J. Alloys Compd. 2000, 311, 65. [Google Scholar] [CrossRef]
- Xing, X.G.; Han, Z.J.; Wang, H.F.; Lu, P.N. Electrochemical corrosion resistance of CeO2-Cr/Ti coatings on 304 stainless steel via pack cementation. J. Rare Earths 2015, 33, 1122. [Google Scholar] [CrossRef]
- Kasińska, J. Wide–ranging influence of mischmetal on properties of G17CrMo5–5 cast steel. Metalurgija 2015, 54, 135–138. [Google Scholar]
- Kasińska, J. Influence of Rare Earth Metals on Microstructure and Mechanical Properties of G20Mn5 Cast Steel. Arch. Foundry Eng. 2018, 18, 37–42. [Google Scholar]
- Kasińska, J.; Myszka, D. Influence of rare earths metals (REM) on the structure and selected properties of grey cast iron. Metalurgija 2020, 59, 459–462. [Google Scholar]
- Dzioba, I.; Pala, R.; Kasińka, J. Experimental—Numerical Analysis of Stress State in Front of the Crack Tip of Modified And Unmodified G17crmo5–5 Cast Steel by Rare Earth Metals in a Brittle-Ductile Transition Region. Arch. Metall. Mater. 2016, 61, 1175–1181. [Google Scholar] [CrossRef]
- Satet, R.L.; Hoffmann, M.J. Experimental evidence of the impact of rare-earth elements on particle growth and mechanical behaviour of silicon nitride. J. Am. Ceram. Soc. 2000, 88, 2485–2490. [Google Scholar] [CrossRef]
- Choi, H.J.; Lee, J.G.; Kim, Y.W. High temperature strength and oxidation behaviourof hot-pressed silicon nitride-disilicate ceramics. J. Mater. Sci. 1997, 32, 1937–1942. [Google Scholar] [CrossRef]
- Tatarkoa, T.; Kasiarováa, M.; Dusza, J.; Morgielb, J.; Sajgalíkc, P.; Hvizdoš, P. Wear resistance of hot-pressed Si3N4/SiC micro/nanocomposites sintered withrare-earth oxide additives. Wear 2010, 269, 867–874. [Google Scholar] [CrossRef]
- Becher, P.F.; Painter, G.S.; Shibata, N.; Waters, S.B.; Lin, H.T. Effects of rare-earth(RE) intergranular adsorption on the phase transformation, microstructureevolution and mechanical properties in silicon nitride with RE2O3+MgO additives: RE = La, Gd, and Lu. J. Am. Ceram. Soc. 2008, 91, 2328–2336. [Google Scholar] [CrossRef]
- Becher, P.F.; Shibata, N.; Painter, G.S.; Averill, F.; Van Benthem, K.; Lin, H.-T.; Waters, S.B. Observations on the influence of secondary Me oxide additives (Me = Si, Al, Mg) on the microstructural evolution and mechanical behavior of siliconnitride ceramics containing RE2O3(RE = La, Gd, Lu). J. Am. Ceram. Soc. 2010, 93, 570–580. [Google Scholar] [CrossRef]
- Sharma, S.P.; Dwivedi, D.K.; Jain, P.K. Effect of La2O3 addi-tion on the microstructure, hardness and abrasive wear behavior of flame sprayed Ni based coatings. Wear 2009, 267, 853. [Google Scholar] [CrossRef]
- Zhang, Z.Y.; Lu, X.C.; Luo, J.B. Tribological properties of rare earth oxide added Cr3C2-NiCr coatings. Appl. Surf. Sci. 2007, 253, 4377. [Google Scholar] [CrossRef]
- Kalandyk, B. Microstructure and Abrasive Wear Resistance of 18Cr-4Ni-2.5Mo Cast Steel. Arch. Foundry Eng. 2012, 12, 81–84. [Google Scholar] [CrossRef]
- Kalandyk, B.; Kasińska, J. Effects of Rare Earth Metal Addition on Wear Resistance of Chromium-Molybdenum Cast Steel. Arch. Foundry Eng. 2017, 17, 63–68. [Google Scholar]
- Madej, M. Tribological Properties of Diamond-Like Carbon Coatings. Adv. Mater. Res. 2014, 874, 9–15. [Google Scholar] [CrossRef]
- Styp-Rekowski, M.; Mańka, E.; Matuszewski, M.; Madej, M.; Ozimina, D. Tribological problems in shaft hoist ropes wear proces. Ind. Lubr. Tribol. 2015, 67/1, 157–164. [Google Scholar]
- Wuest, T.; Weimer, D.; Irgens, C.; Thoben, K.-D. Machine learning in manufacturing: Advantages, challenges, and applications. Prod. Manuf. Res. 2016, 4, 23–45. [Google Scholar] [CrossRef] [Green Version]
- Marian, M.; Tremmel, S. Current Trends and Applications of Machine Learning in Tribology—A Review. Lubricants 2021, 9, 86. [Google Scholar] [CrossRef]
- Pearson, R.K. Exploratory Data Analysis Using R; CRC Press: Boca Raton, FL, USA, 2018. [Google Scholar]
- Cox, V. Translating Statistics to Make Decisions—A Guide for the Non-Statistician; Apress: New York, NY, USA, 2017. [Google Scholar]


| Tribological Tests | Hardness * | Scratch Test * | |||||||||
|---|---|---|---|---|---|---|---|---|---|---|---|
| Dry Friction | Friction with Lubricant | Vickershardness (HV) | Instrumental Hardness HIT (MPa) | Young's Moudulus | Coefficient of Friction | Maximum Penetration Depth of the Indenter (μm) | |||||
| Sample Designation | RE Oxygen | Rare Earth Oxides % mas | Coefficient of Friction | Linear Wear (μm) | Coefficient of Friction | Linear Wear (μm) | (GPa) | ||||
| 1 | - | 0 | 0.06 | 39.16 | - | - | - | - | - | 0.181 | −27.677 |
| 2 | CeO2 | 2 | 0.55 | 47.24 | - | - | 301.3 | 3192.5 | 207.4 | 0.214 | −13.918 |
| 3 | La2O3 | 2 | 0.48 | 33.54 | - | - | - | - | - | 0.193 | −16,982 |
| 4 | Y2O3 | 2 | 0.57 | 46.71 | - | - | 301.7 | 3196.4 | 194.1 | 0.221 | −19.903 |
| 3-1 | - | 0 | 0.78 | 55.61 | 0.35 | 124.26 | 333.9 | 3537.6 | 184.1 | 0.158 | −7.283 |
| 3-2 | CeO2 | 2 | 0.82 | 71.74 | 0.55 | 45.45 | 322.4 | 3415.9 | 171.9 | 0.163 | −5.659 |
| 3-3 | La2O3 | 2 | 0.54 | 64.1 | 0.6 | 57.14 | 327.7 | 3471.9 | 186.5 | 0.186 | −9.281 |
| 3-4 | Y2O3 | 2 | 0.79 | 71.07 | 0.18 | 96.74 | 428.2 | 4536.7 | 205 | 0.131 | −6.557 |
| 4-1 | - | 0 | 0.67 | 55.8 | 0.5 | 60.97 | 335 | 3549.8 | 181.2 | 0.159 | −7.46 |
| 4-2 | CeO2 | 2 | 0.38 | 97.73 | 0.62 | 64.03 | 356.7 | 3779.6 | 189.5 | 0.164 | −9.219 |
| 4-3 | La2O3 | 2 | 0.27 | 55.68 | 0.52 | 59.47 | 354 | 3750.9 | 184.7 | 0.165 | −9.338 |
| 4-4 | Y2O3 | 2 | 0.69 | 54.15 | 0.5 | 97.26 | 501.4 | 5312.6 | 214.5 | 0.119 | −5.899 |
| Abbrev. | Description | Unit | Test Type |
|---|---|---|---|
| cof1 | Coefficient of friction (dry friction) | Tribological tests | |
| lw1 | Linear wear (dry friction) | (μm) | Tribological tests |
| cof2 | Coefficient of friction (lubricated friction) | Tribological tests | |
| lw2 | Linear wear (lubricated friction) | (μm) | Tribological tests |
| vh | Vickers hardness | (HV) | Hardness |
| ih | Instrumental hardness | (MPa) | Hardness |
| ym | Young’s modulus | (GPa) | Hardness |
| cof | Coefficient of friction | Scratch test | |
| mpdi | Maximum penetration depth of the indenter | (μm) | Scratch test |
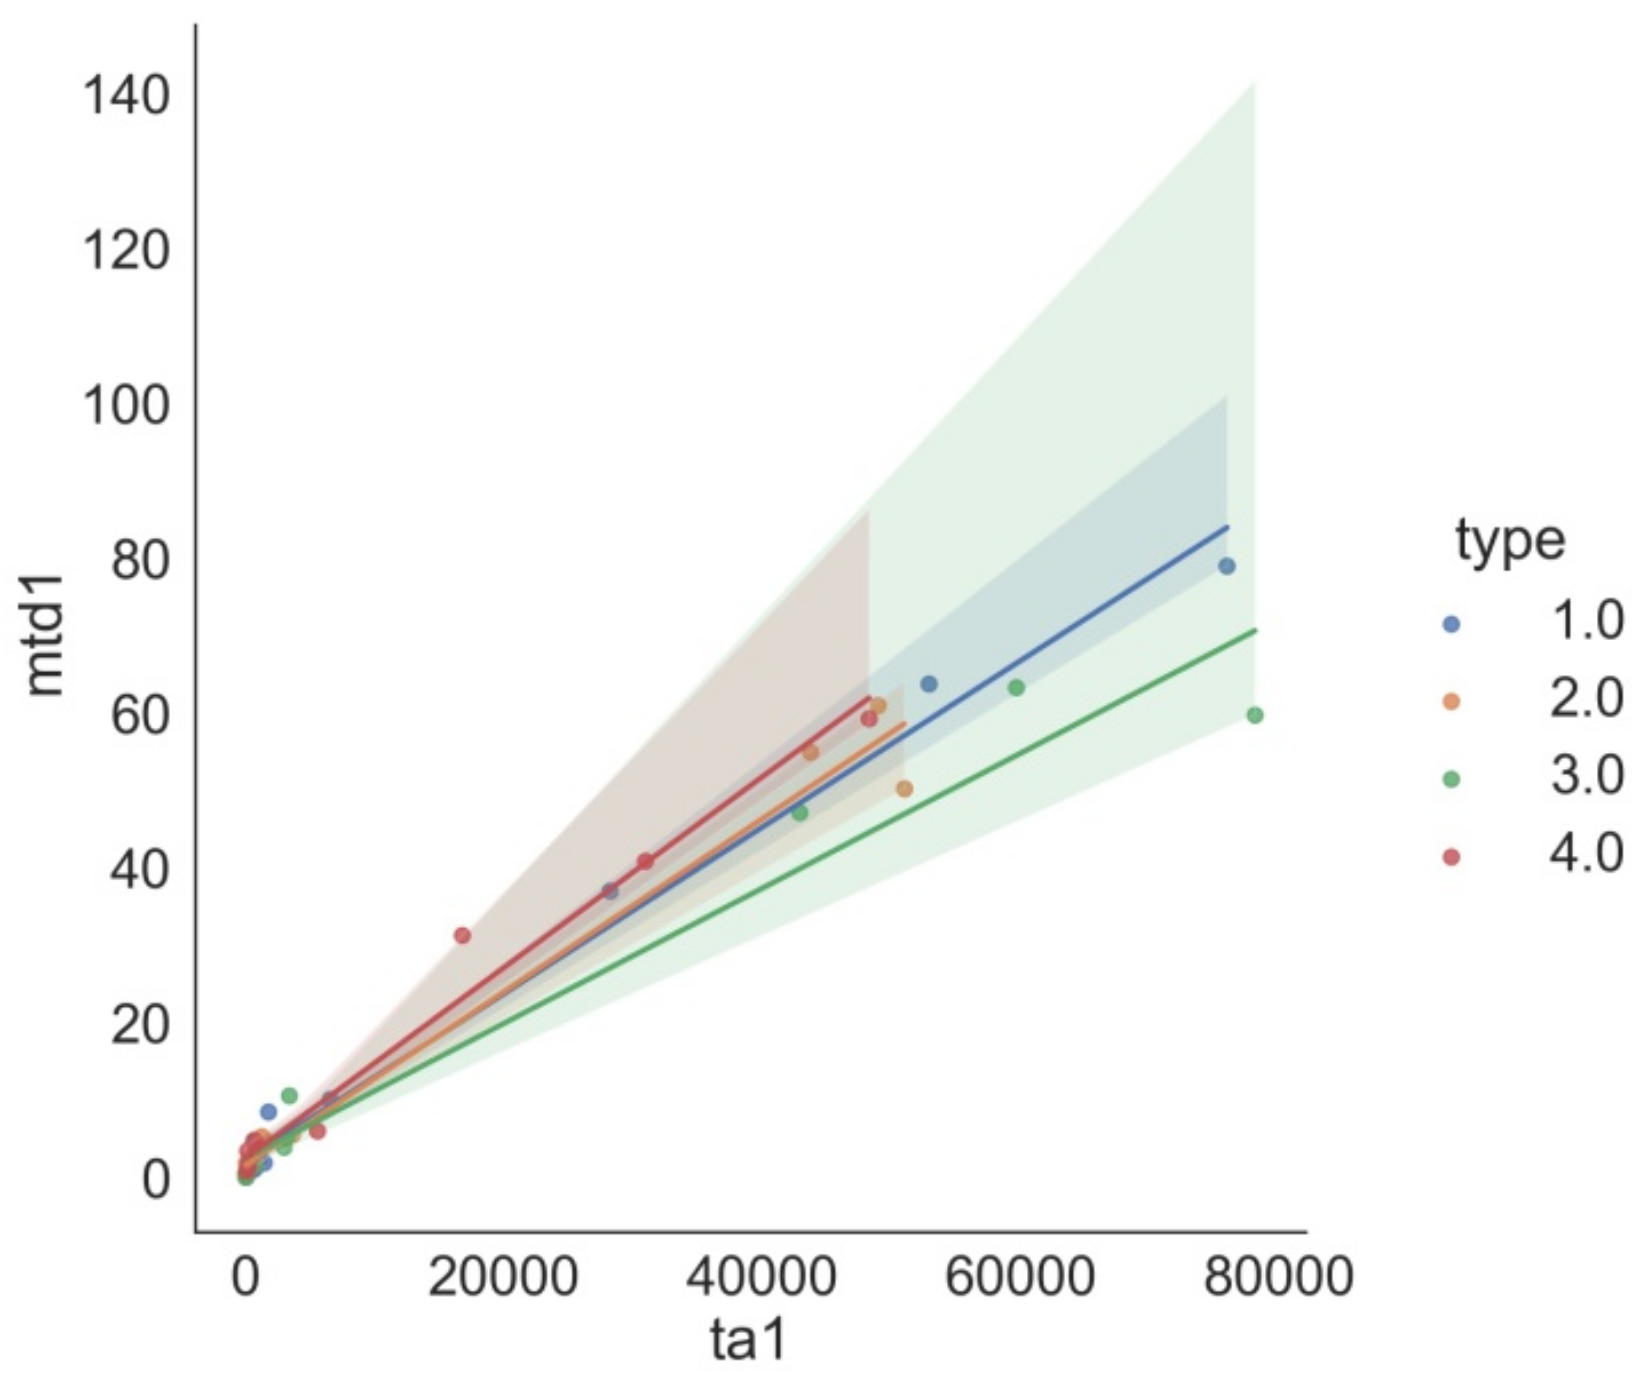
| mtd1 | Maximum track depth (dry friction) | (μm) | Leica |
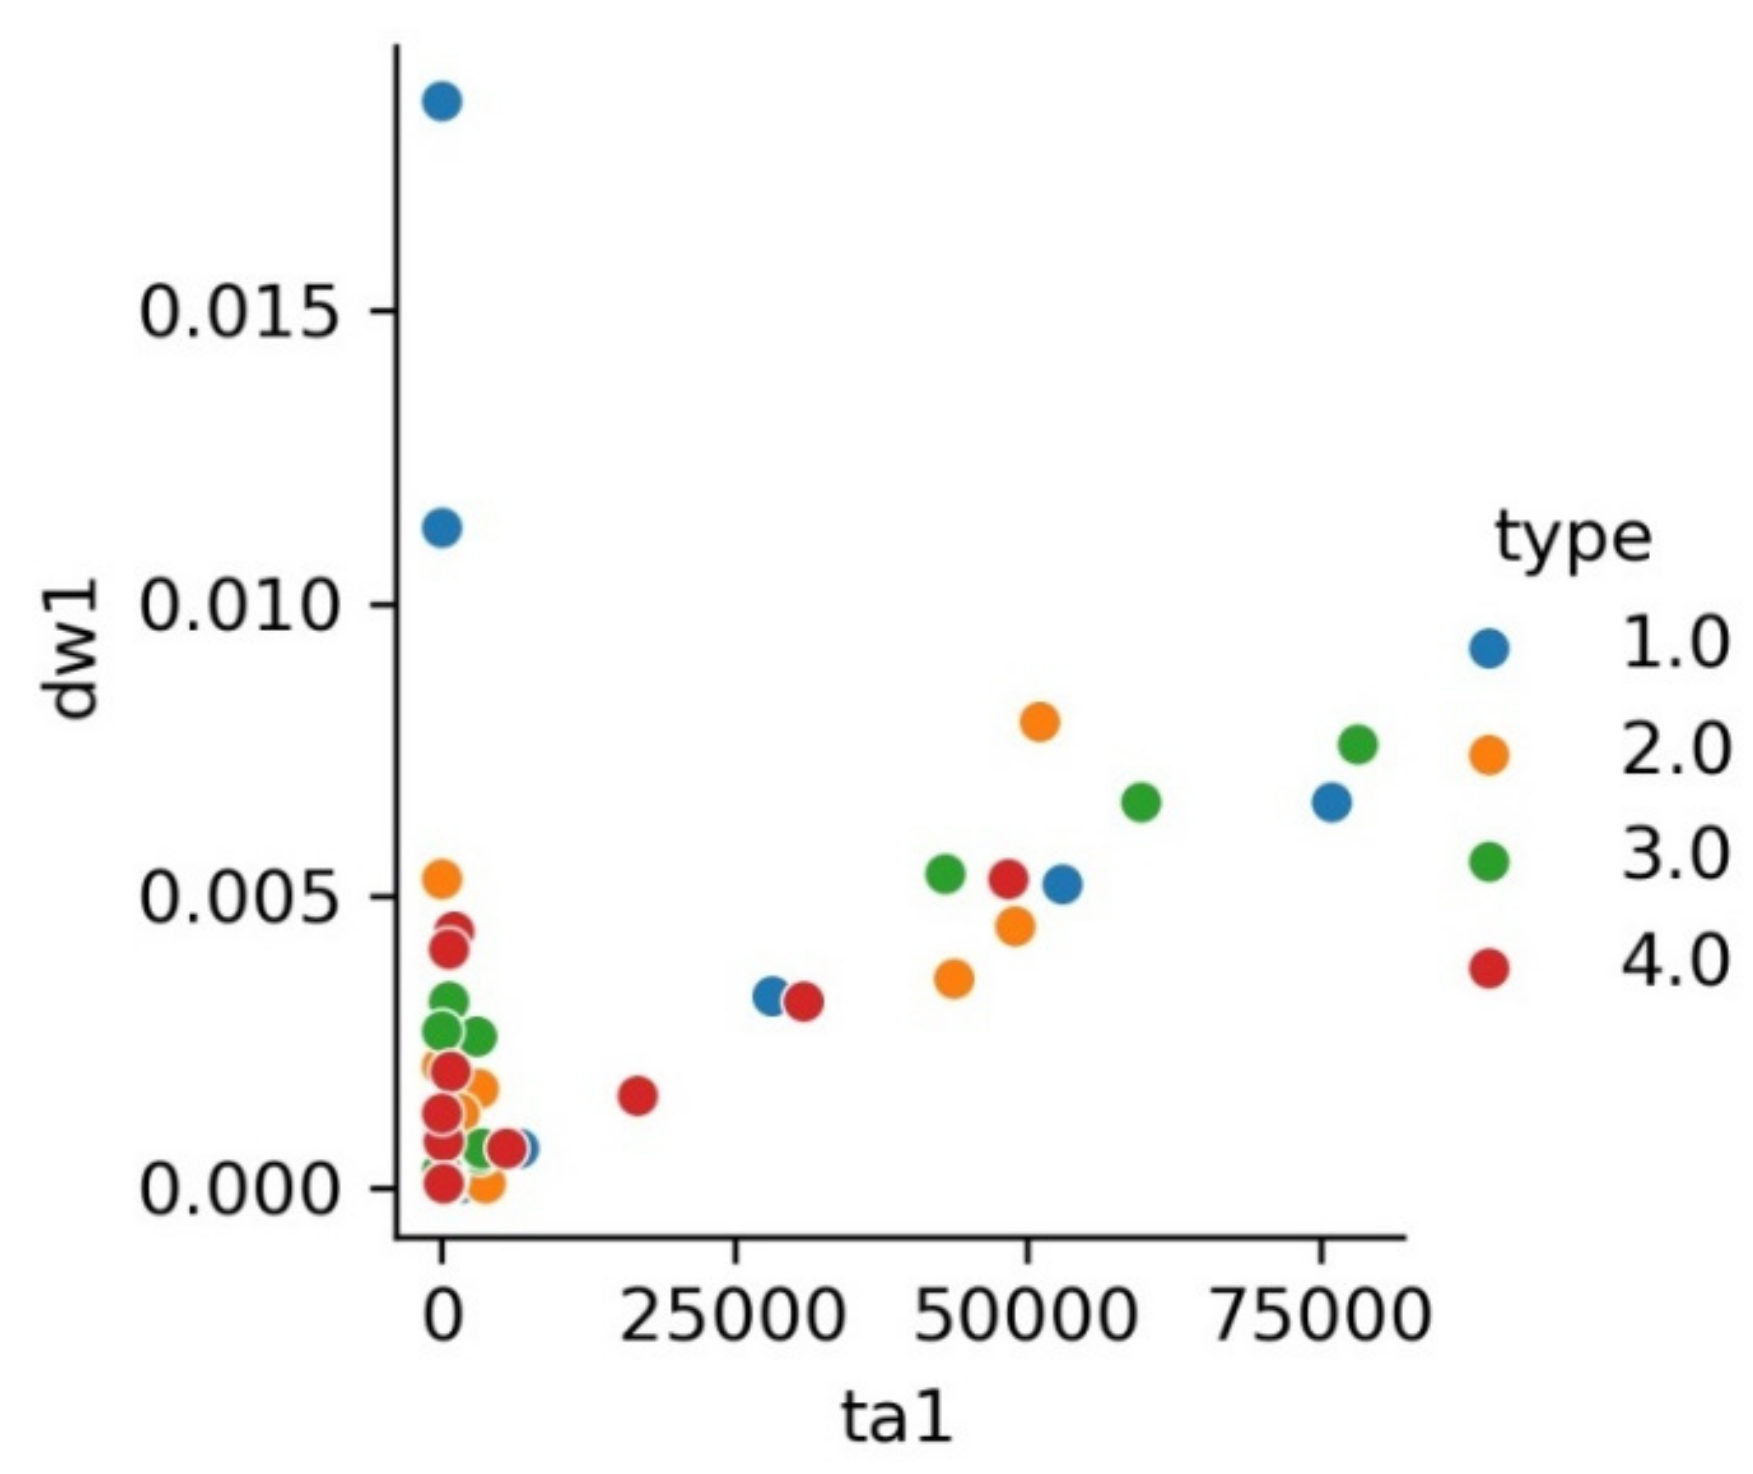
| ta1 | Track area (dry friction) | (μm2) | Leica |
| mwd2 | Maximum track depth (lubricated friction) | (μm) | Leica |
| ta2 | Track area (lubricated friction) | (μm2) | Leica |
| dw1 | Disc wear (dry friction) | (g) | Mass loss |
| bw1 | Ball wear (dry friction) | (g) | Mass loss |
| dw2 | Disc wear (lubricated friction) | (g) | Mass loss |
| bw2 | Ball wear (lubricated friction) | (g) | Mass loss |
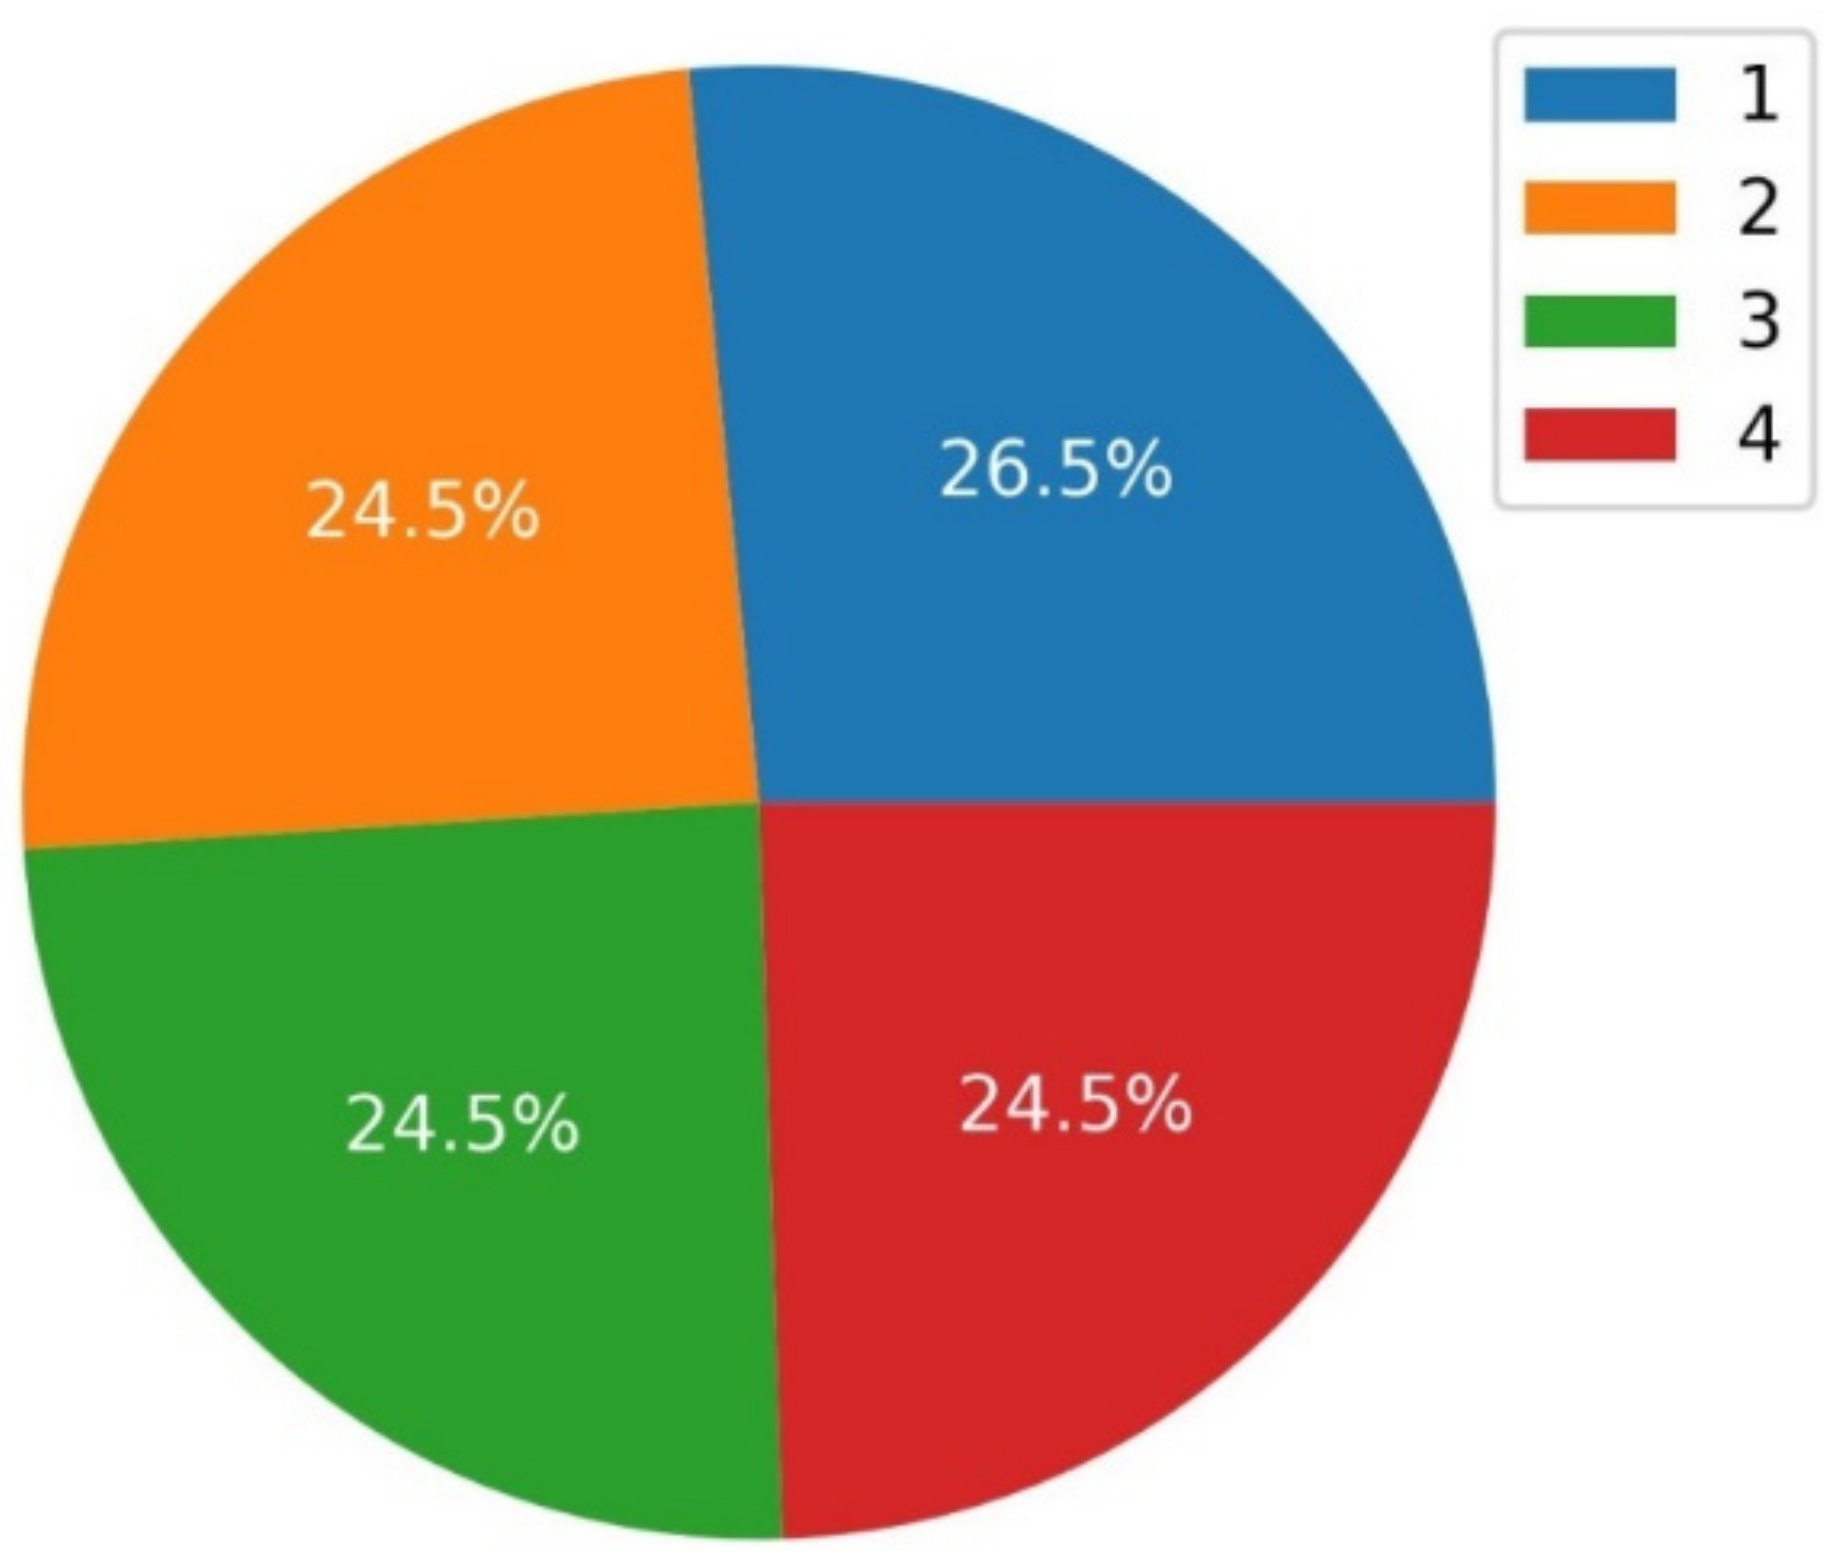
| type | 1—without additives, | ||
| 2—with an addition of CeO2, | |||
| 3—with an addition of La2O3 | |||
| 4—with an addition of Y2O3 |
| NaN Values before Removal | NaN Value after Removal | ||
|---|---|---|---|
| C | 0 | ||
| Si | 4 | ||
| Cr | 0 | ||
| Ni | 21 | ||
| Mo | 24 | ||
| Mn | 45 | ||
| Fe | 8 | ||
| Co | 41 | ||
| B | 25 | C | 0 |
| W | 20 | Si | 4 |
| V | 28 | Cr | 0 |
| WC | 41 | Fe | 0 |
| cof1 | 0 | cof1 | 0 |
| lw1 | 0 | lw1 | 0 |
| cof2 | 4 | cof2 | 4 |
| lw2 | 4 | lw2 | 4 |
| vh | 2 | vh | 2 |
| ih | 2 | ih | 2 |
| ym | 2 | ym | 2 |
| cof | 0 | cof | 0 |
| mpdi | 0 | mpdi | 0 |
| mwd1 | 0 | mwd1 | 0 |
| wa1 | 0 | wa1 | 0 |
| mwd2 | 4 | mwd2 | 4 |
| wa2 | 4 | wa2 | 4 |
| dw1 | 0 | dw1 | 0 |
| bw1 | 0 | bw1 | 0 |
| dw2 | 4 | dw2 | 4 |
| bw2 | 4 | bw2 | 4 |
| type | 0 | type | 0 |
| dtype: | int64 | dtype: | int64 |
| No. | C | Si | Cr | Fe | cof1 | lw1 | vh | ih | ym | cof | mpdi | mtd1 | ta1 | dw1 | bw1 | Type |
|---|---|---|---|---|---|---|---|---|---|---|---|---|---|---|---|---|
| 1 | 0.1 | 2.1 | 18.0 | 62.9 | 0.06 | 39.16 | 598 | 6330 | 214 | 0.181 | −27,667 | 63.79 | 52,888 | 0.0052 | 0.0003 | 1.0 |
| 2 | 0.1 | 2.1 | 18.0 | 62.9 | 0.55 | 47.24 | 301 | 3193 | 207 | 0.214 | −13,918 | 61.05 | 48,955 | 0.0045 | 0.0001 | 2.0 |
| 3 | 0.1 | 2.1 | 18.0 | 62.9 | 0.48 | 33.54 | 598 | 6330 | 214 | 0.193 | −16,982 | 47.23 | 42,889 | 0.0054 | 0.0000 | 3.0 |
| 4 | 0.1 | 2.1 | 18.0 | 62.9 | 0.57 | 46.71 | 301 | 3196 | 194 | 0.221 | −19,903 | 59.33 | 48,247 | 0.0053 | 0.0000 | 4.0 |
| 5 | 0.6 | 3.8 | 11.0 | 3.0 | 0.78 | 55.61 | 334 | 3538 | 184 | 0.158 | −7,283 | 37.07 | 28,214 | 0.0033 | 0.0001 | 1.0 |
| No. | C | Si | Cr | Fe | cof2 | lw1 | vh | ih | ym | cof | mpdi | mtd2 | ta2 | dw2 | bw2 | Type |
|---|---|---|---|---|---|---|---|---|---|---|---|---|---|---|---|---|
| 1 | 0.1 | 2.1 | 18.0 | 62.9 | 0.38 | 58.16 | 598 | 6330 | 214 | 0.181 | −27,667 | 8.09 | 4939 | 0.0019 | 0.0008 | 1.0 |
| 2 | 0.1 | 2.1 | 18.0 | 62.9 | 0.38 | 58.16 | 301 | 3193 | 207 | 0.214 | −13,918 | 8.09 | 4939 | 0.0019 | 0.0008 | 2.0 |
| 3 | 0.1 | 2.1 | 18.0 | 62.9 | 0.38 | 58.16 | 598 | 6330 | 214 | 0.193 | −16,982 | 8.09 | 4939 | 0.0019 | 0.0008 | 3.0 |
| 4 | 0.1 | 2.1 | 18.0 | 62.9 | 038 | 58.16 | 301 | 3196 | 194 | 0.221 | −19,903 | 8.09 | 4939 | 0.0019 | 0.0008 | 4.0 |
| 5 | 0.6 | 3.8 | 11.0 | 3.0 | 0.35 | 124.26 | 334 | 3538 | 184 | 0.158 | −7.283 | 12.37 | 13,033 | 0.0090 | 0.0140 | 1.0 |
| C | vh | ih | ym | cof | mtd1 | ta1 | dw1 | bw1 | |
|---|---|---|---|---|---|---|---|---|---|
| count | 49 | 49 | 49 | 49 | 49 | 49 | 49 | 49 | 49 |
| mean | 0.877 | 597 | 6330 | 214 | 0.138 | 15.60 | 12,675.0 | 0.00289 | 0.00024 |
| std | 0.317 | 187 | 1982 | 20 | 0.039 | 23.13 | 22,171.4 | 0.00338 | 0.00018 |
| min | 0.100 | 281 | 2980 | 172 | 0.072 | 0.18 | 8.7 | 0.0010 | 0.00000 |
| 25% | 0.800 | 447 | 4733 | 202 | 0.102 | 1.58 | 177.5 | 0.0007 | 0.00010 |
| 50% | 1.000 | 625 | 6579 | 214 | 0.134 | 3.95 | 1093.0 | 0.0017 | 0.00020 |
| 75% | 1.000 | 744 | 7885 | 225 | 0.165 | 10.66 | 78,109.0 | 0.0041 | 0.00030 |
| max | 1.300 | 942 | 9985 | 257 | 0.221 | 70.05 | 78,109.0 | 0.01860 | 0.00080 |
| C | vh | ih | ym | cof | mtd2 | ta2 | dw2 | bw2 | |
|---|---|---|---|---|---|---|---|---|---|
| count | 49 | 49 | 49 | 49 | 49 | 49 | 49 | 49 | 49 |
| mean | 0.877 | 597 | 6330 | 214 | 0.138 | 8.09 | 4938.5 | 0.00194 | 0.00082 |
| std | 0.317 | 187 | 1982 | 20 | 0.039 | 4.90 | 6094.1 | 0.00184 | 0.00195 |
| min | 0.100 | 281 | 2980 | 172 | 0.072 | 0.16 | 4.6 | 0.00000 | 0.00000 |
| 25% | 0.800 | 447 | 4733 | 202 | 0.102 | 5.02 | 912.8 | 0.00070 | 0.00030 |
| 50% | 1.000 | 625 | 6579 | 214 | 0.134 | 7.14 | 3008.0 | 0.00130 | 0.00050 |
| 75% | 1.000 | 744 | 7885 | 225 | 0.165 | 10.03 | 5109.0 | 0.00220 | 0.01400 |
| max | 1.300 | 942 | 9985 | 257 | 0.221 | 28.33 | 30,517.0 | 0.00760 | 0.01400 |
| Correlation | Dry Friction | Fluid Friction | ||||||
|---|---|---|---|---|---|---|---|---|
| Positive | Negative | Positive | Negative | |||||
| Strong | V.Strong | Strong | V.Strong | Strong | V.Strong | Strong | V.Strong | |
| 0.5–0.7 | 0.7–1 | −0.5–0.7 | −0.7–1 | 0.5–0.7 | 0.7–1 | −0.5–0.7 | −0.7–1 | |
| C | Cof, mwd, wa | Cof | ||||||
| vh | Ym | Ih | Cof, mtd, ta | Ym | Ih | Cof | ||
| ih | Ym | Vh | Cof, mtd, wa | Ym | Vh | Cof | ||
| ym | Vh, ih | mtd, ta | Vh, ih | |||||
| cof | mtd, ta | Vh, ih | C | Vh, ih | C | |||
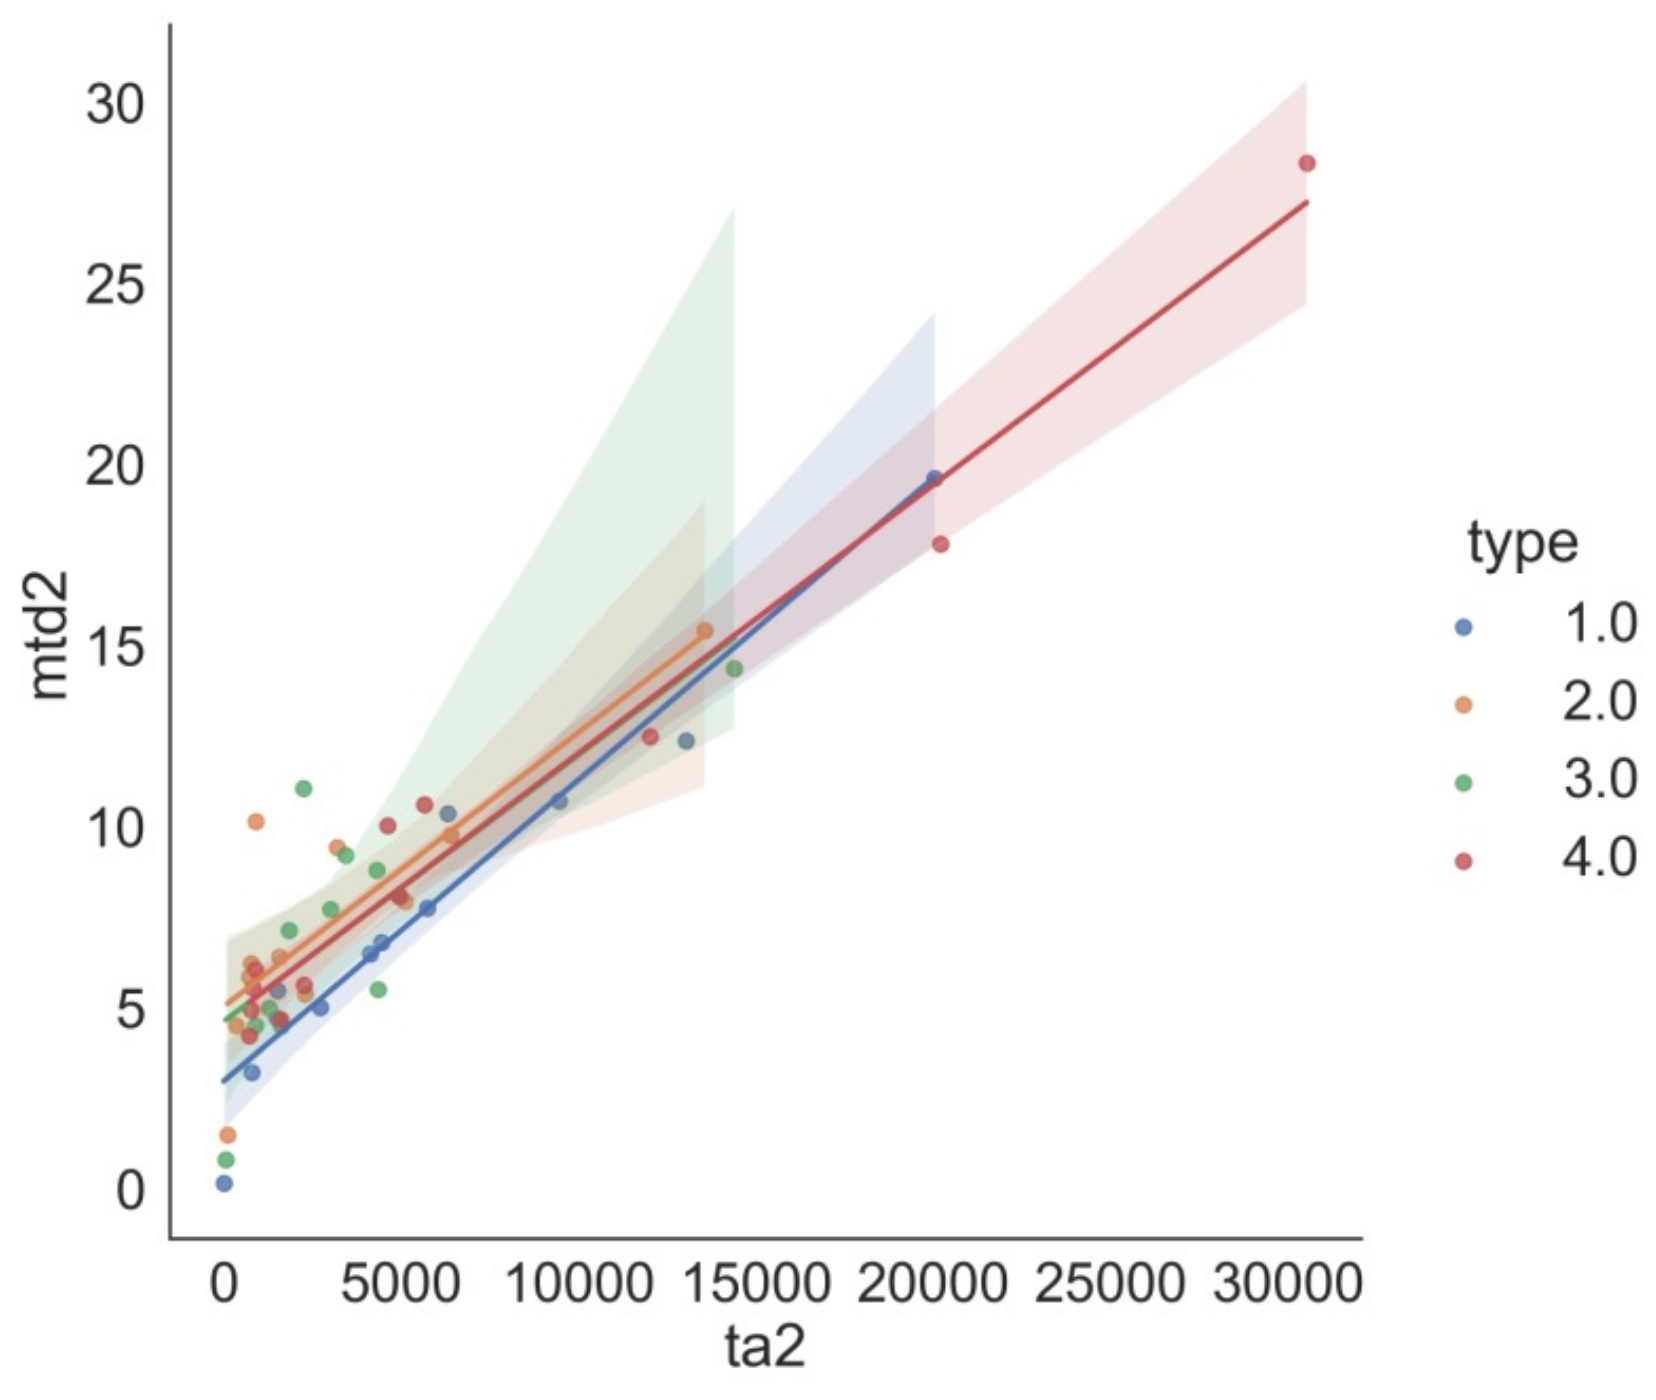
| mtd | Cof | ta | Vh, ih, ym | C | ta | |||
| ta | Cof | mtd | Vh, ih, ym | C | mtd | |||
| Correlation | Negative | Positive |
|---|---|---|
| Very strong | −0.7 to −1 | 0.7 to 1 |
| Strong | −0.5 to −0.7 | 0.5 to 0.7 |
Publisher’s Note: MDPI stays neutral with regard to jurisdictional claims in published maps and institutional affiliations. |
© 2022 by the authors. Licensee MDPI, Basel, Switzerland. This article is an open access article distributed under the terms and conditions of the Creative Commons Attribution (CC BY) license (https://creativecommons.org/licenses/by/4.0/).
Share and Cite
Malinowski, P.; Kasińska, J.; Rutkowski, S.; Madej, M. Exploratory Data Analysis for the Evaluation of Tribological Properties of Wear-Resistant Surface Layers Modified with Rare-Earth Metals. Materials 2022, 15, 2032. https://doi.org/10.3390/ma15062032
Malinowski P, Kasińska J, Rutkowski S, Madej M. Exploratory Data Analysis for the Evaluation of Tribological Properties of Wear-Resistant Surface Layers Modified with Rare-Earth Metals. Materials. 2022; 15(6):2032. https://doi.org/10.3390/ma15062032
Chicago/Turabian StyleMalinowski, Paweł, Justyna Kasińska, Sławomir Rutkowski, and Monika Madej. 2022. "Exploratory Data Analysis for the Evaluation of Tribological Properties of Wear-Resistant Surface Layers Modified with Rare-Earth Metals" Materials 15, no. 6: 2032. https://doi.org/10.3390/ma15062032
APA StyleMalinowski, P., Kasińska, J., Rutkowski, S., & Madej, M. (2022). Exploratory Data Analysis for the Evaluation of Tribological Properties of Wear-Resistant Surface Layers Modified with Rare-Earth Metals. Materials, 15(6), 2032. https://doi.org/10.3390/ma15062032