1. Introduction
Nowadays, the demand for more sophisticated materials is growing rapidly. Therefore, one of the objects of current research in the field of advanced materials is the continuous improvement of their design to improve their physical, chemical, and mechanical properties leading to their use in high-end applications. Modifying the microstructure of a material is an effective method of tailoring its properties to achieve specific improvements in material properties. In this paradigm, refining the grain size of crystalline materials to produce ultrafine-grained (UFG) or nanocrystalline (NC) materials has been shown to be an effective technique to increase their strength [
1,
2,
3]. Such a refined microstructure can be achieved by processes involving severe plastic deformation (SPD) or compacting ultrafine powders or nanoparticle-sized powders from bulk materials using various powder metallurgy processes. Research in this area has been growing rapidly over the last decade, with the main objectives being to increase the productivity of the processes and to understand the deformation mechanisms of these materials better [
4,
5,
6].
One of the most widely used methods of intensive plastic deformation to refine the microstructure of materials today is ECAP (Equal Channel Angular Pressing). The ECAP method can be applied to a wide variety of metals and alloys to create ultrafine grains and to improve mechanical and physical properties. Titanium, copper, aluminium, and aluminium alloys are the most commonly used materials in SPD-ECAP studies, with aluminium alloys finding applications mainly in the automotive, aerospace, and space industries due to their excellent mechanical properties, corrosion resistance, and higher strength-to-weight ratio. The development of the principles underlying the SPD techniques dates back to the 1930s to the pioneering work of P.W. Bridgman of Harvard University. This work concerned the effects of a combination of large hydrostatic pressures and simultaneous shear deformation acting on solids. The main objective of this process is to produce very strong and lightweight parts that would find applications in engineering practice [
7,
8]. The method of intense plastic deformation (SPD) is a general term describing a group of metal processing techniques. The method consists of the creation of a highly fragmented, inhomogeneous, anisotropic structure due to large deformations, which retains the residual features of the recrystallised amorphous state [
1]. The purpose of these technologies is to obtain non-porous metals and alloys with an “ultrafine grain size” of
d < 500
, or directly nanocrystalline structures (
d < 100 nm) [
9].
The grain size of polycrystalline materials affects many critical material properties, including strength and resistance to plastic deformation. Materials with a small grain size have several advantages over their coarse-grained counterparts, which include higher strength, an extremely high yield point, high hardness, improved toughness, and other favourable properties. Many traditional high-volume formation methods involving simple rolling, drawing, or extrusion cannot meet the requirements for the reliable forming of nanostructured materials. The formation of nanostructures in high-volume samples is quite challenging and often not possible except by using special mechanical deformation methods at low or elevated temperatures [
9].
The ECAP method is used to obtain high-density nanostructured materials with high grain morphological uniformity from massive plastic deformable semi-finished products. Shear deformation of the sample occurs when it crosses the contact surface between the channels. After several repetitions of the ECAP procedure, a systematic increase in deformation occurs, leading to a gradual decrease in grain size due to the formation of a network of small-angle and then large-angle grain boundaries. This characteristic of the method makes it possible to subject ductile materials and difficult-to-form metals and alloys to intense plastic deformation. The ECAP technology can also be used to control the crystallographic structure of bulk structural materials [
10].
The extrusion angle at which the mould channels intersect is the most important experimental factor affecting grain, as it determines the overall reshaping of the blank after each pass through the die. In most applications, an angle between 90° and 120° is used. This is because, despite the high efficiency of the ECAP process with a 90° refracted channel, in reality, it is much easier to push very hard materials and materials with low ductility through a die with an angle greater than 90° (e.g., 110°) [
9]. In practice, the reshaping of the material after each extrusion process depends on both the extrusion angle between the two parts of the channel and the angle describing the outer arc of curvature at the point where the inlet and outlet channels intersect [
7]. Calculations show that this angle plays only a minor role for channel angles of 90° and above. On the other hand, for channel angles less than 90° (e.g., 60°), this angle has a much more significant effect on material reshaping than the extrusion angle [
10] in many experiments. By changing the orientation of the sample before re-extrusion, different microstructures and textures of the material can be created. Several processing methods have been developed to achieve deep grain refinement (in the order of nanometres) by changing the orientation after each pass. In order to obtain different textures and microstructures, three basic ECAP routes are defined, which are referred to as A, B, and C.
In procedure A, the orientation of the sample remains unchanged after each push. In procedure B, the sample is rotated 90° about its longitudinal axis after each pass. If the rotation is always in the same direction, the route is
. If the direction of rotation alternates counter-clockwise and clockwise, the route is
. It is procedure C if the sample is rotated 180° about its longitudinal axis after each pass. The difference between methods A, B, and C is, therefore, the direction of shear and the orientation of its plane. In a series of experiments, it was shown that procedure
is a very good method of processing materials and producing ultrafine microstructures because it deforms the sample uniformly in all planes [
7,
9,
11].
Similar to the temperature, speed, and orientation of the sample during extrusion, the number of passes plays an important role in determining the progress of recrystallisation and the resulting mechanical properties during the ECAP process. As mentioned above, curing of different alloys can be achieved by implementing different numbers of ECAP passes, which implies that the grain size, refinement intensity, relative elongation of the material, and structure are also greatly influenced by the number of die passes. For most alloys, although the grain refinement is continuous but less intensive as the number of passes increases, the ductility and yield point also decrease [
7,
9].
Polycrystalline materials are classified into several categories according to grain size. They can be classified as coarse-grained if the average grain size is greater than 10 µm, as fine-grained if the average grain size is from 10 to 0.5 µm, as ultrafine-grained if the average grain size is from 500 to 100 nm, and as nanocrystalline (NC-Nanocrystalline (Nanostructured) Materials) if the average grain size is from 100 to 1 nm [
8,
12]. The production of these materials is feasible in two ways. In the first approach, known as “bottom-up”, polycrystalline metals are assembled from single atoms using deposition techniques or from fabricated nanoscale building blocks, e.g., by ultrasonic milling or by compacting a pre-prepared nano powder [
8]. However, these techniques have major drawbacks, as the products are very small and suitable for use mainly in microdevices and always contain at least a small amount of residual porosity and impurities from manufacturing [
13]. The second option is the top-down approach, in which larger coarse-grained polycrystalline solids are processed by severe plastic deformation. The purpose is to refine their microstructure with minimal change in the initial dimensions of the workpiece. The resulting grain sizes are typically in the range of 100 to 1000 nm or, in some cases, less than 100 nm. UFG materials have been shown to exhibit excellent strength at room temperature and good superplastic properties at elevated temperatures. As a result of the larger dimensions, the products then have potential use in a variety of structural applications. The most important of these two methods is the “top-down” method, as it has enabled the development of the methods of severe plastic deformation (SPD) [
8,
13].
Many works have been published describing the results obtained in the formation of, mainly through ECAP, aluminium and its alloys, nickel, copper, and later, pure iron, steel, titanium, and other metals and alloys [
14,
15]. Several plastic deformation methods significantly change the mechanical properties of metals and their alloys, especially their strength and ductility. This has been demonstrated by several recent papers dealing with Al-Mg, Al-Mn, and also Al-Mn-Mg alloys and other difficult-to-work materials [
16].
An important factor that significantly influences the microstructure development is the
Φ angle, formed by the channels’ longitudinal axes. This angle determines the amount of shear deformation in the individual passes. A smaller
Φ angle results in a higher shear deformation at each pass, and this arrangement is, therefore, more effective in grain refinement. The influence of the angle in the range from 90° to 157.5° was studied on aluminium by Nakashima et al. [
17] using the technological path B
C. They found that grain refinement is most effective, at the same volume of deformation, at an angle of 90°. They attributed this result to an angle of 60°, which is formed by two shear planes in the deformed billet. For more difficult-to-form materials (steels, Ti alloys), an angle of 120° and a higher extrusion temperature is usually used.
During the application of large deformations, the grain size gradually converges with the size of the subgrains because the subgrains have the smallest possible dimensions at which the grain boundaries can absorb dislocations. The finest structures can be achieved at low homologous temperatures and the highest strain rates. Grain size is also very sensitive to the presence of alloying elements that slow down healing, such as the alloying of aluminium with magnesium [
18]. Wagner et al. [
19] subjected AA6060 aluminium to ECAP and provided information about the formation of shear and matrix bands resulting in the strain partitioning with cracking. After performing SEM analysis, a structure similar to that formed in ultrafine grain materials was observed. Karon et al. [
20] investigated the properties and microstructure of AN 6060 after ECAP. Again, an increase in strength properties and a decrease in ductility were observed. In addition to studying the impact of ECAP on the mechanical properties of aluminium alloys, Yulinova et al. [
21] were focused on the electrochemical properties. These investigators did not observe a worsening of the electrochemical corrosion behaviour of the Al alloy after ECAP.
Chung et al. [
22] studied the fatigue life of aluminium alloy 6061 subjected to ECAP. After one pass, the authors reported a significant increase in low- and high-cycle fatigue life. However, further deformation eliminated this improvement, especially in high-cycle fatigue. Ch. Xu et al. [
23] investigated the superplastic behaviour of three aluminium alloys (Al-Mg-Sc, Al-Cu-Mg, and Al-Zn-Mg-Ca-Zr) after large plastic deformation by the ECAP method. After deformation, the grain size was in the range of 200–300 nm. All alloys showed a good to exceptional ability for superplastic forming (2000, 450, and 1100% elongation). Horita et al. [
24] reported that the elongation at break was over 1500% after ECAP Al-Mg-Sc. Islamgaliev et al. [
25] investigated the superplasticity characteristics of Al alloy 1421 (Al-Mg-Li-Zr-Sc) after ECAP (8 passes at 370 °C, achieved grain size—800 nm). At a strain rate of 10
−2 s
−1, they reached an elongation of over 1300%. Experimental results show that aluminium alloys subjected to ECAP have increased superplasticity at relatively low temperatures and high strain rates.
Theoretical Background
Ultrafine-grained materials (UFG) are materials with a grain size below 1 μm. Their strength can be derived using the Hall–Petch relation (1):
where
is the yield point [MPa],
is the frictional stress required for the movement of dislocations,
kxy is the material constant [N∙mm
−3/2], and
d is the mean grain diameter [mm]. From relation (1), it follows that the smaller the grain size, the stronger the material, and at the same time, the yield point increases. In some cases, however, softening of the material can also occur if the grains are reduced below a certain critical size.
A more detailed elucidation of the Hall–Petch relationship in the investigation of oxygen-free copper after the ECAP treatment was discussed by Meshal Y. Alawadhi et al. (2021) [
26]. In their research, the yield stress was plotted as a function of the inverse of the square root of the average grain size. It was found that the resulting graph is definitely not linear over the entire range of grain sizes used in this research. In the range of grain sizes
, the values are consistent with relation (2), but at smaller grain sizes (if
), the constant
reached negative values. These results indicate a transition from hardening to softening of the material and an inverse Hall–Petch effect with much larger values (at grain sizes of approximately less than 1 μm) than for the intermediate grain size transition (at grain sizes of approximately less than 2 nm).
Thus, two strengthening mechanisms contribute to the overall strength of oxygen-free copper: Grain boundary strengthening
and dislocation strengthening
. The total stress is, therefore, a combination of these strengthening mechanisms with the assumption that each of them works independently (2):
Grain boundary strengthening is based on the Hall–Petch relation (2), while dislocation strengthening is defined by the Taylor Equation (3) [
27]:
where
α is a numerical factor depending on the dislocation arrangement,
M is a Taylor factor with a constant value of 3.06 for uniaxial tensile deformation in the fully constrained model,
G is the shear modulus,
b is the Burgers vector, and
ρ is related to the density of dislocations. In practice, the dislocation density and yield stress generally show a similar evolution to the stress values when processed by the ECAP method. It can be seen that the yield stress at saturation is related to the maximum dislocation density by the Taylor relation for metals with a surface-centred crystal lattice (f.c.c.) [
26]. The dislocation density increases while the grain size decreases with stress during the deformation process in the case of the ECAP technology. Thus, after combining the previous relations (1), (2), and (3), the total strength is (4):
On the basis of the above research, the main objective was set, namely, to investigate the relationship between the development of structural and mechanical changes of the AlMgSi0.5 alloy during extrusion by the ECAP method. When this knowledge is used at the design stage, the extrusion technology can be more effectively designed and controlled to achieve the desired grain size and material strengthening.
2. Materials and Methods
2.1. Experimental Material AlMgSi0.5
Aluminium alloy AlMgSi0.5 (EN AW 6060) is a medium-strength, heat-treatable alloy with a strength slightly below 6005 A. Alternative names and designations include Al-Mg-Si0.5, 3.3206, and A96060. It is a heat-treatable alloy with excellent corrosion resistance, weldability, and machinability.
It is also characterised by good cold formability. It is commonly used for the production of complex cross-sections, can be easily anodised, and is suitable for welding with all common methods. Its chemical composition according to standards and tolerances are listed in
Table 1.
The test material samples were measured in the experiment through the ECAP process. The samples of the selected material EN AW 6060 were forced through a hydraulic press through a 90° angled channel. After their extrusion and evaluation of the forces, one sample from each pair was ground with different fine grinding wheels and polished in an electropolisher. Subsequently, after chemical etching, their microstructure was measured as a function of the number of passes through the die using a GX51 metallographic microscope. For the second sample in each pair, test bars with a square cross-section of non-normalised dimensions were fabricated, and their mechanical properties (yield point, ultimate tensile stress, ductility, modulus of elasticity, and Poisson’s number) were further analysed and recorded by tensile tests.
The use of the selected alloy is varied. It is most often applied to medium-strength components operating at temperatures of 50–70 °C for long periods of time, where good processability, corrosion resistance, or decorative appearance is required. Typical application areas are materials for furniture, decorative items, automotive finishes, light poles and masts, architecture, and the food industry.
EN AW 6060 is much more closely related to 6063 than 6061. The main difference between 6060 and 6063 is that 6063 has a slightly higher magnesium content. Applications requiring a higher-strength material typically use 6061 or 6082 aluminium alloy.
The starting material for testing intensive plastic deformation by ECAP was a pressed bar of a circular cross-section made of Al-Mg-Si0.5 (alloy EN AW 6060) with a diameter of 10 mm. It is a structural material with good ductility, gloss, and corrosion resistance. In addition, its already-mentioned applications include the aerospace and automotive industries, construction, and fine mechanics (e.g., aircraft and helicopter parts, car bodies, and measuring equipment components).
2.2. Experiment Preparation
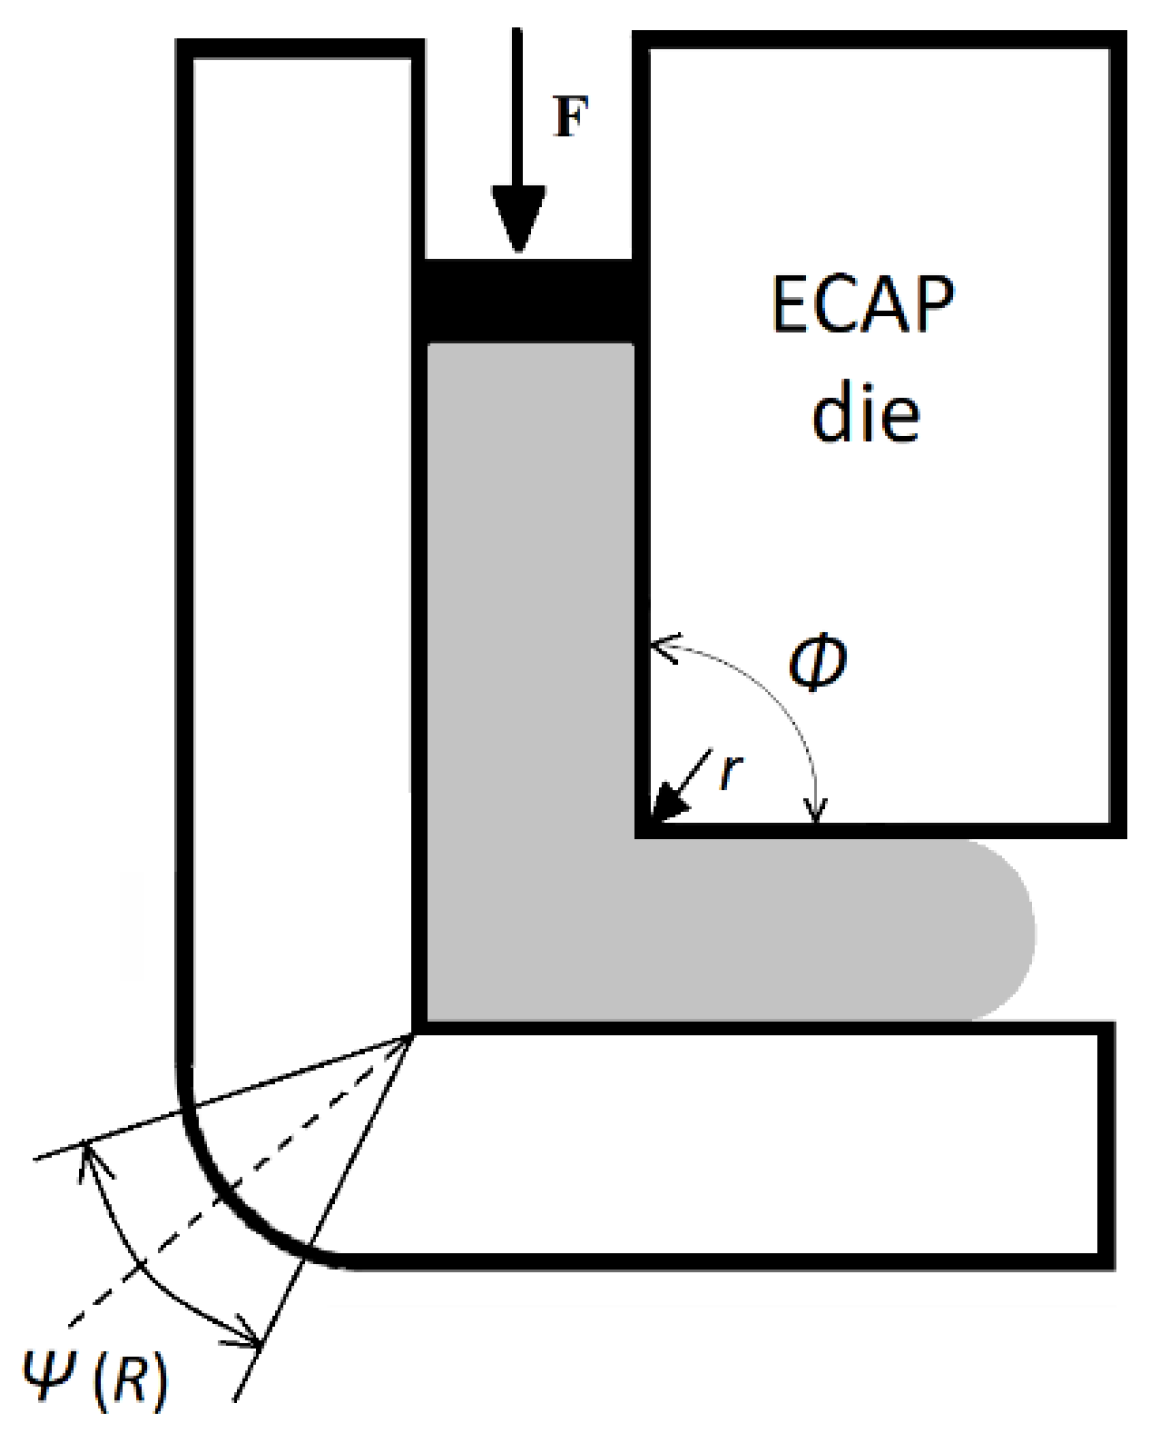
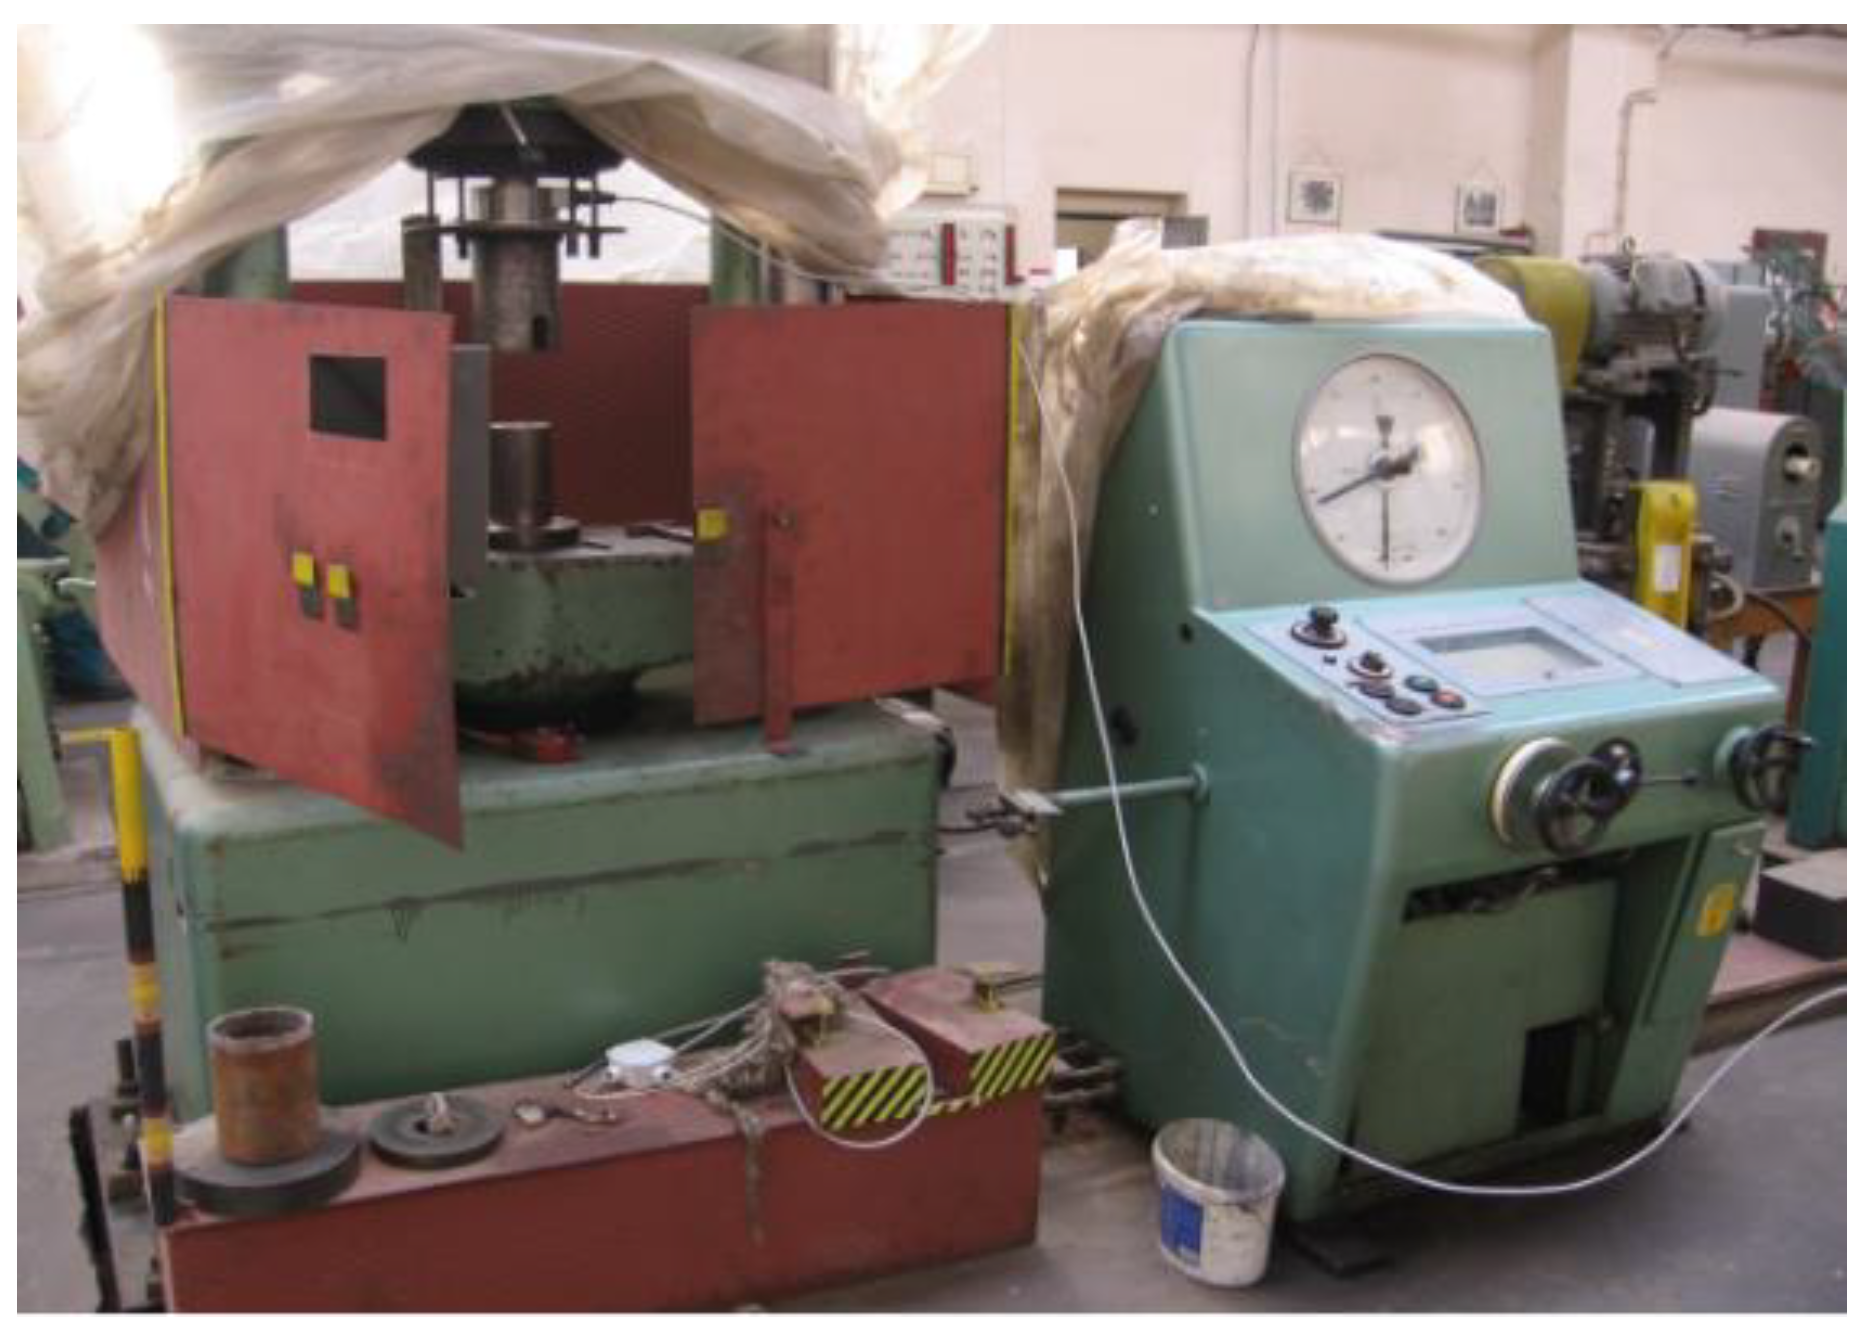
The hydraulic press used is shown in
Figure 1. The sample size was limited to a maximum length of 100 mm and a circular cross-section of 10 mm. These samples were processed through a total of four passes through route C (in procedure C, the sample is rotated 180° after each pass), where the channel angle was
Φ = 90° and the external channel curvature angle
Ψ(R) ≅ 0°.
A simplified drawing of the die and its angles is shown in
Figure 2. The experiments were performed with a pressing speed of 1.73 mm·s
−1.
The aim of these experiments was to determine the strength of the material after each pass, as well as the dependence of the change in structure (grain size) and mechanical properties (tensile strength, yield point, Young’s modulus, etc.).
For the measurement of forces in the ECAP process, a strain gauge resistive sensor type 3/350 XK 11 designed at VŠB Ostrava (Czech Republic) was used, which measures forces up to 1000 kN with an accuracy of 0.5%. Its nominal resistance is R1–R8 = 350 Ω. This sensor is one of the foil strain gauges used for precise measurements of deformations, pressures, moments, and forces acting on the tested bodies. Its principle is to detect the deformation of a mechanically stressed conductor (in this case, the extruded sample) that causes a change in geometric dimensions. This results in a linearly varying resistance, the progression and conversion of which into measured information is provided by other devices.
The NicDAQ laboratory instrument and LabView software from National Instruments were used to amplify and modify the strain gauge signals. The samples were processed sequentially through four passes of the ECAP die.
Figure 3 shows the flow of information from the experiment up to the level of processing in the PC program.
2.3. Metallographic Analysis
In order to increase the visibility of the microstructure (morphology) of the material, the samples were ground on a KOMPAKT 1031 grinder with 600-, 1200-, and 2000-grit MESH sandpaper. The term “MESH” is a grain size expressed as a number that indicates the number of meshes per inch (25.4 mm) that the abrasive will still pass through during sieving. Thus, the higher the grain size number, the denser the sieve and the finer the abrasive. The device was switched on when the water supply began, and its rotation speed (rpm) could be continuously varied by a potentiometer. The sample was successively sanded with sandpaper, in the order of coarsest to finest, rinsing it each time with water and ethanol to remove contaminants effectively.
The samples were then polished for 20 s in a Lector Pol-5 device. This is an electrolytic polisher manufactured by Struers that allows both electrolytic polishing and etching. The polishing was carried out under a DC current of 24 V in an electrolyte referred to by the company as D2.
Electrolytic polishing is not as versatile as mechanical polishing. Therefore, it is used as in the presented case, especially for soft materials, which can easily form grooves and a thick Beilby layer during conventional grinding. This continuous layer (also referred to as the B-layer) represents the strain-hardening material on the surface of the sample that forms when it is mechanically impacted. Finally, the samples were chemically etched for 4 s in the same Struers LectroPol-5 device under a DC current of 2 V in electrolyte D2. The etching process enhances the surface structures due to the disruption of the grain boundaries, allowing a thorough investigation of the grain size. However, the method used does not result in colour differentiation of individual grains. An inverted metallographic microscope GX51 was used for visual observation of the metallographic grinding and polishing. This instrument allows examination of the material by means of the reflected light in the bright field, reflected light in the dark field, reflected light in the interference differential contrast, and reflected polarised light.
The samples were observed under reflected light with a maximum magnification of 1000×. In this method of examining a sample, the surface of the material is illuminated and then (similar to reflection in a mirror) the light reflected from its surface can be observed.
2.4. Measurement of Mechanical Properties
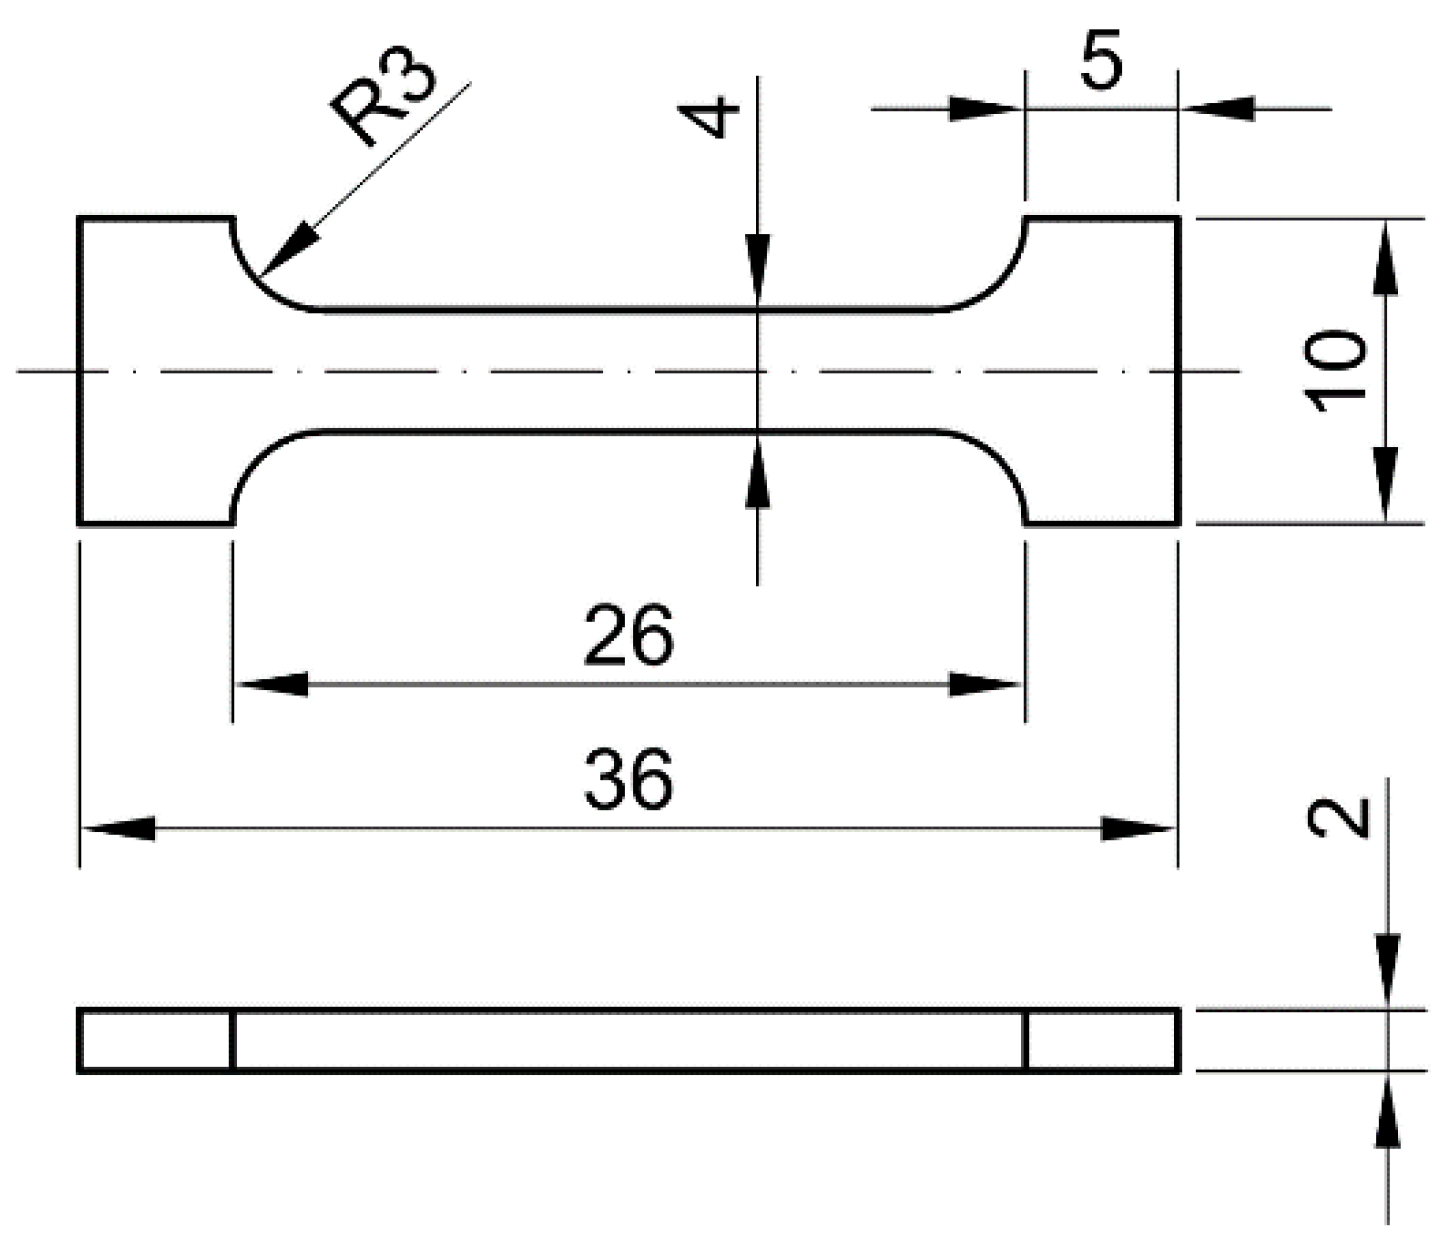
In order to perform tensile tests on the samples, modified bars of non-normalised samples with rectangular cross-sections were constructed after being pushed through the die. The tests were carried out in a specialised accredited company, namely in the testing laboratory of VÚHŽ a.s. Dobrá (Czech Republic). This laboratory has developed a methodology for tensile testing on non-standard bars with verification of the repeatability of the results.
Figure 4 shows the test samples used for the tensile test and their dimensions. For each group of samples evaluated, 2 test pieces were produced.
The applicable normative procedures were followed as much as possible when performing the tensile test to determine the required parameters. Several necessary modifications to the test methodology were made within the permitted standards due to the limited dimensions of the non-standard test pieces used.
3. Results
3.1. Yield Point, Breaking Stress, and Ductility
Methodologically, the determination of the yield point , breaking stress , and ductility A was carried out by modifying the standard EN 10002-1. Due to the size of the sample, no extensometer was used (strain sensing was realised by electronic transverse scanning at 250× magnification with an accuracy of ±0.5 µm). The calculations of the mechanical values were carried out in accordance with EN ISO 6892-1:2009.
3.2. Young’s Modulus of Elasticity
Young’s modulus
Emat was determined in accordance with the standard ASTM E-111 [
29]. This test method makes it possible to determine not only Young’s modulus but also other important quantities of structural materials.
3.3. Determination of the Poisson’s Ratio µ
In the tests, the Poisson ratio was determined by measuring the deformation in the transverse and longitudinal direction in the proportional deformation region and then processing the measured deformation waveforms. Its values, together with the other quantities, are given in
Table 2.
Due to the small size of the test bodies, it was not possible to use the extensometer in either of the two mutually perpendicular directions. Therefore, the longitudinal strain was measured in the same way as for ductility, yield point, and strength, i.e., by electronic sensing from the crosspiece at 250× magnification and with an accuracy of ±0.5 µm).
3.4. Discussion of Test Results
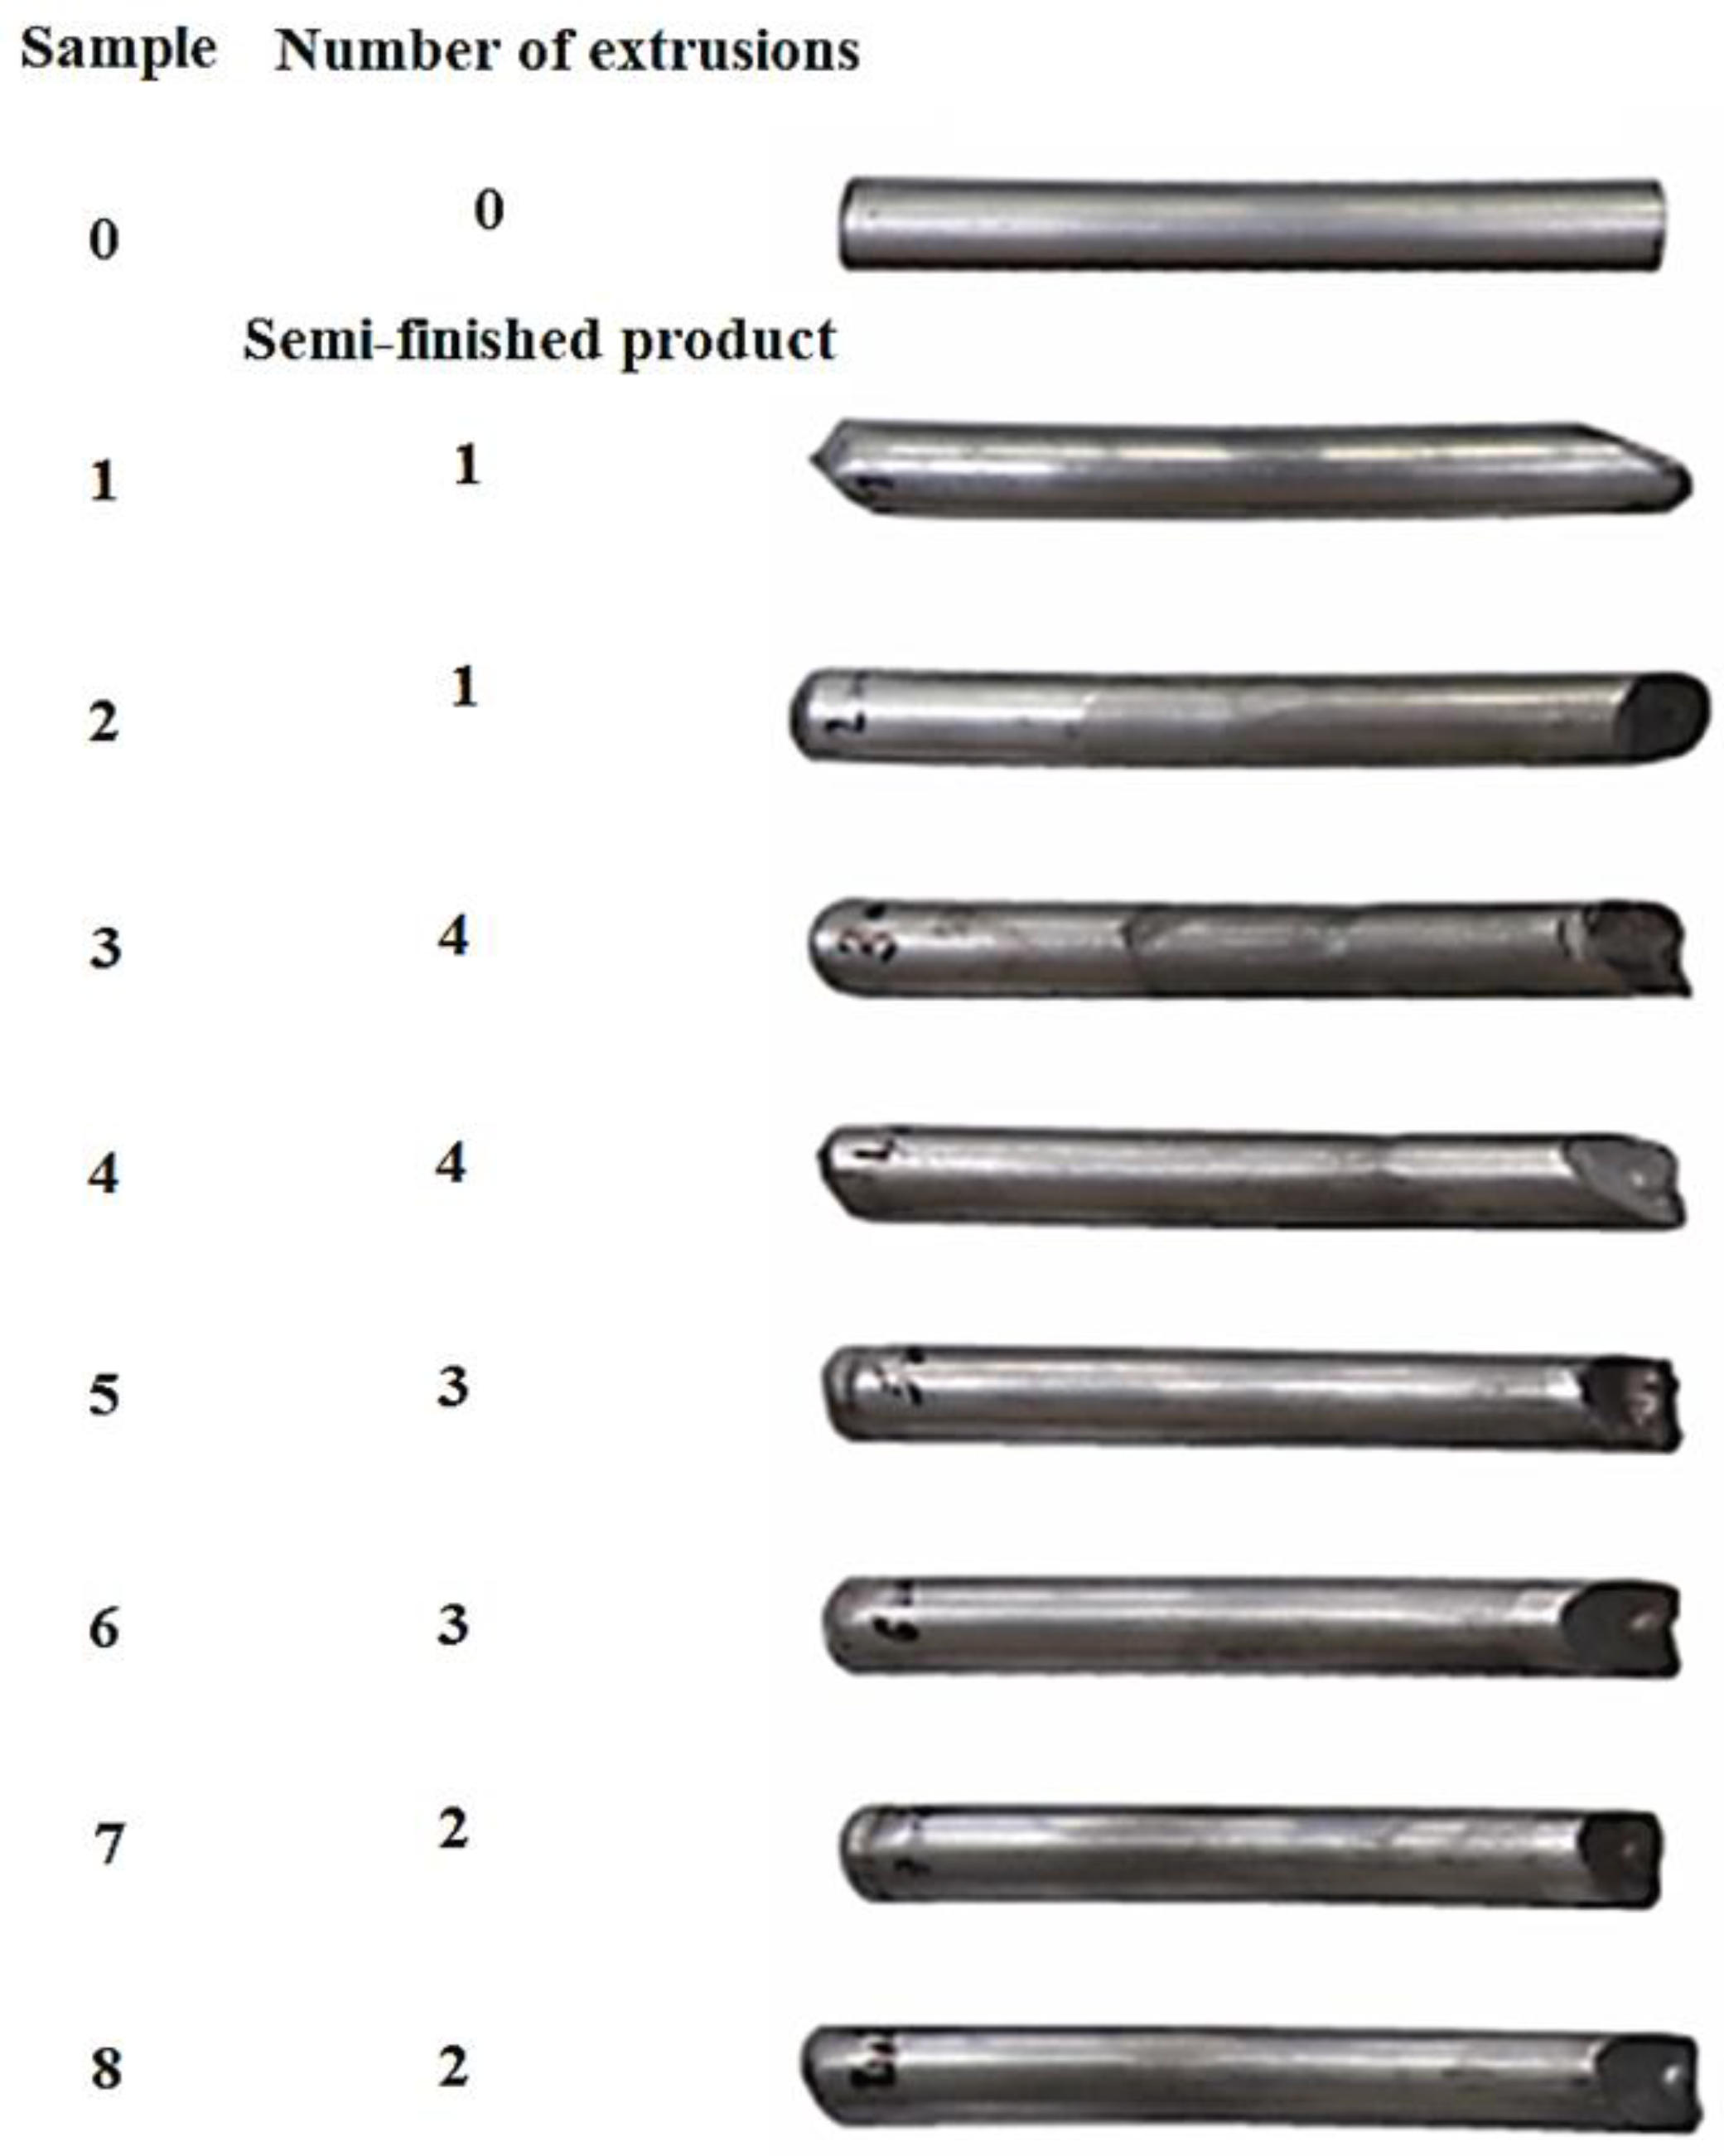
Figure 5 shows a set of samples generated by the ECAP method. A total of four pairs of samples were extruded and subjected to the first to fourth extrusion. After processing a total of 20 passes through the ECAP process, tests were performed on each pair of samples to determine their properties. The first sample from each pair was used for metallographic examinations and the second for the determination of mechanical properties.
3.5. Measurement of Forces
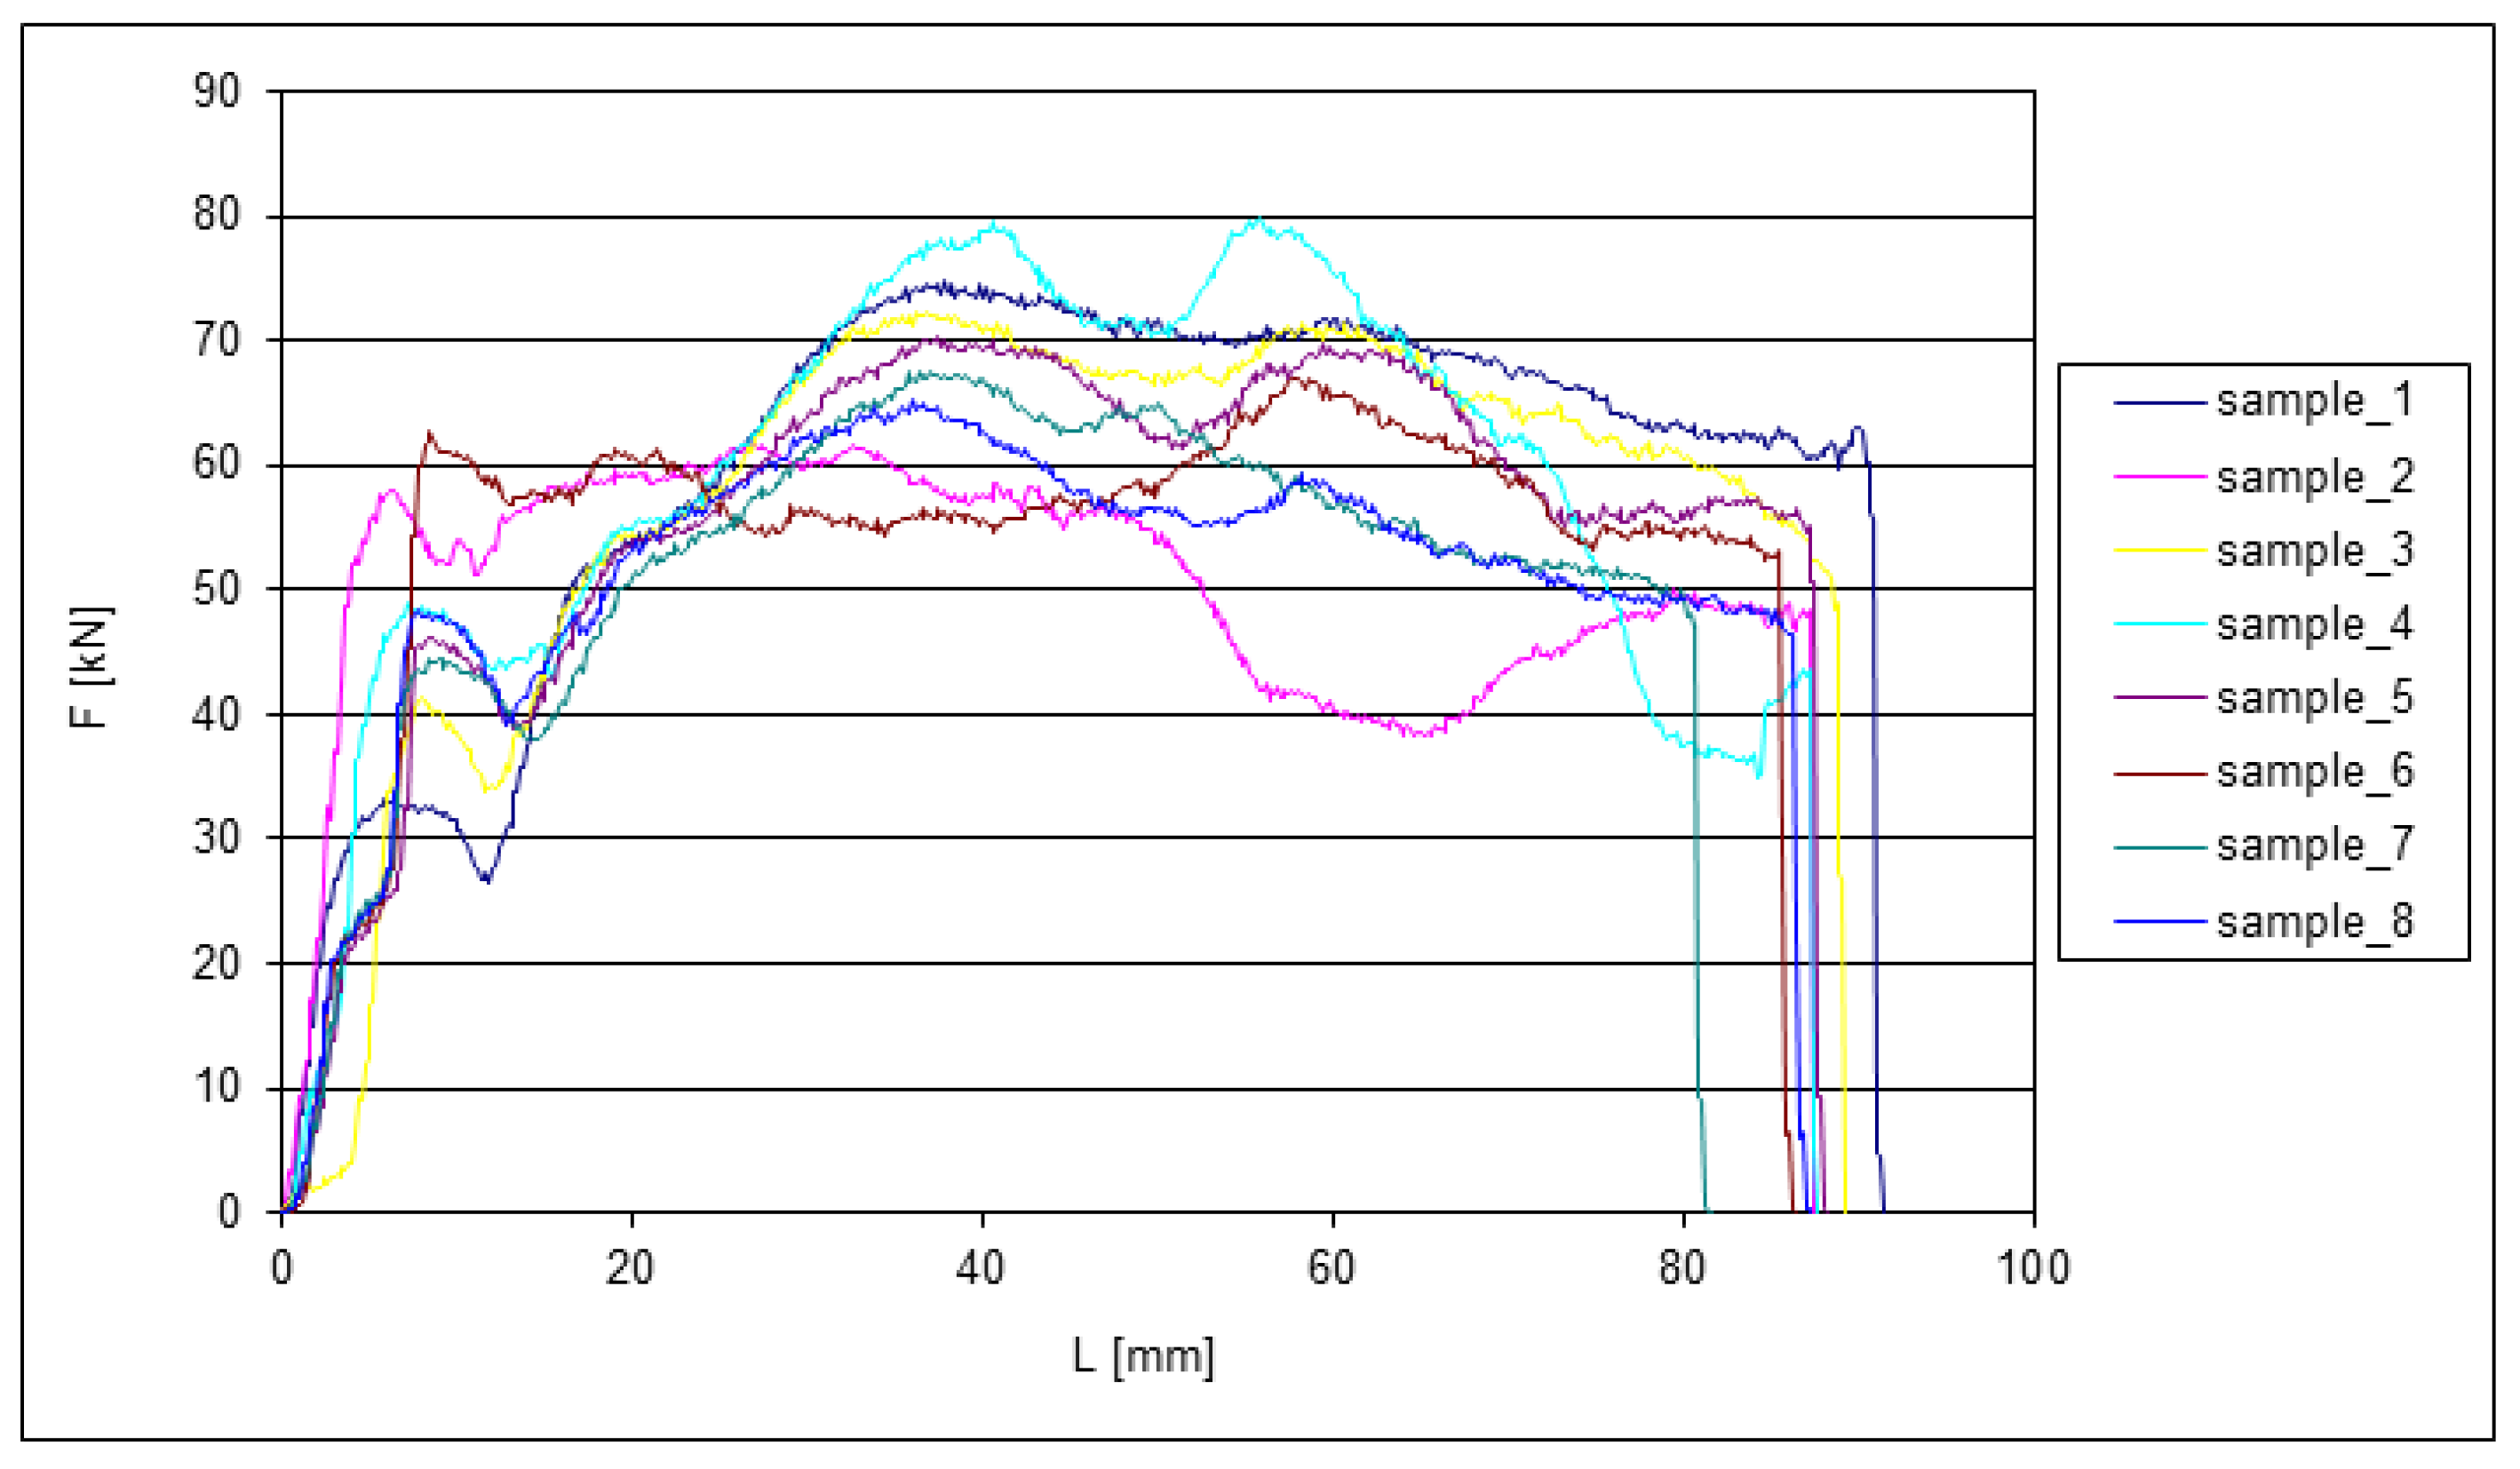
The following graphs show the dependence of F = f(L) for the EN AW 6060 alloy when extruded through the die. Since all eight tested samples had identical dimensions at the beginning of the experiments, the change in length can be very well observed from the graphs. The extrusion forces were measured sequentially depending on the extruded length of the samples. Two samples were always compared after each pass. During each extrusion, the edges of the samples were deformed significantly.
It can be observed that the curves in
Figure 6 have a large dispersion of deformation forces at the first pass of the ECAP. The dispersion of forces
Fmax was up to 23 kN, which represents 28% of the measured range.
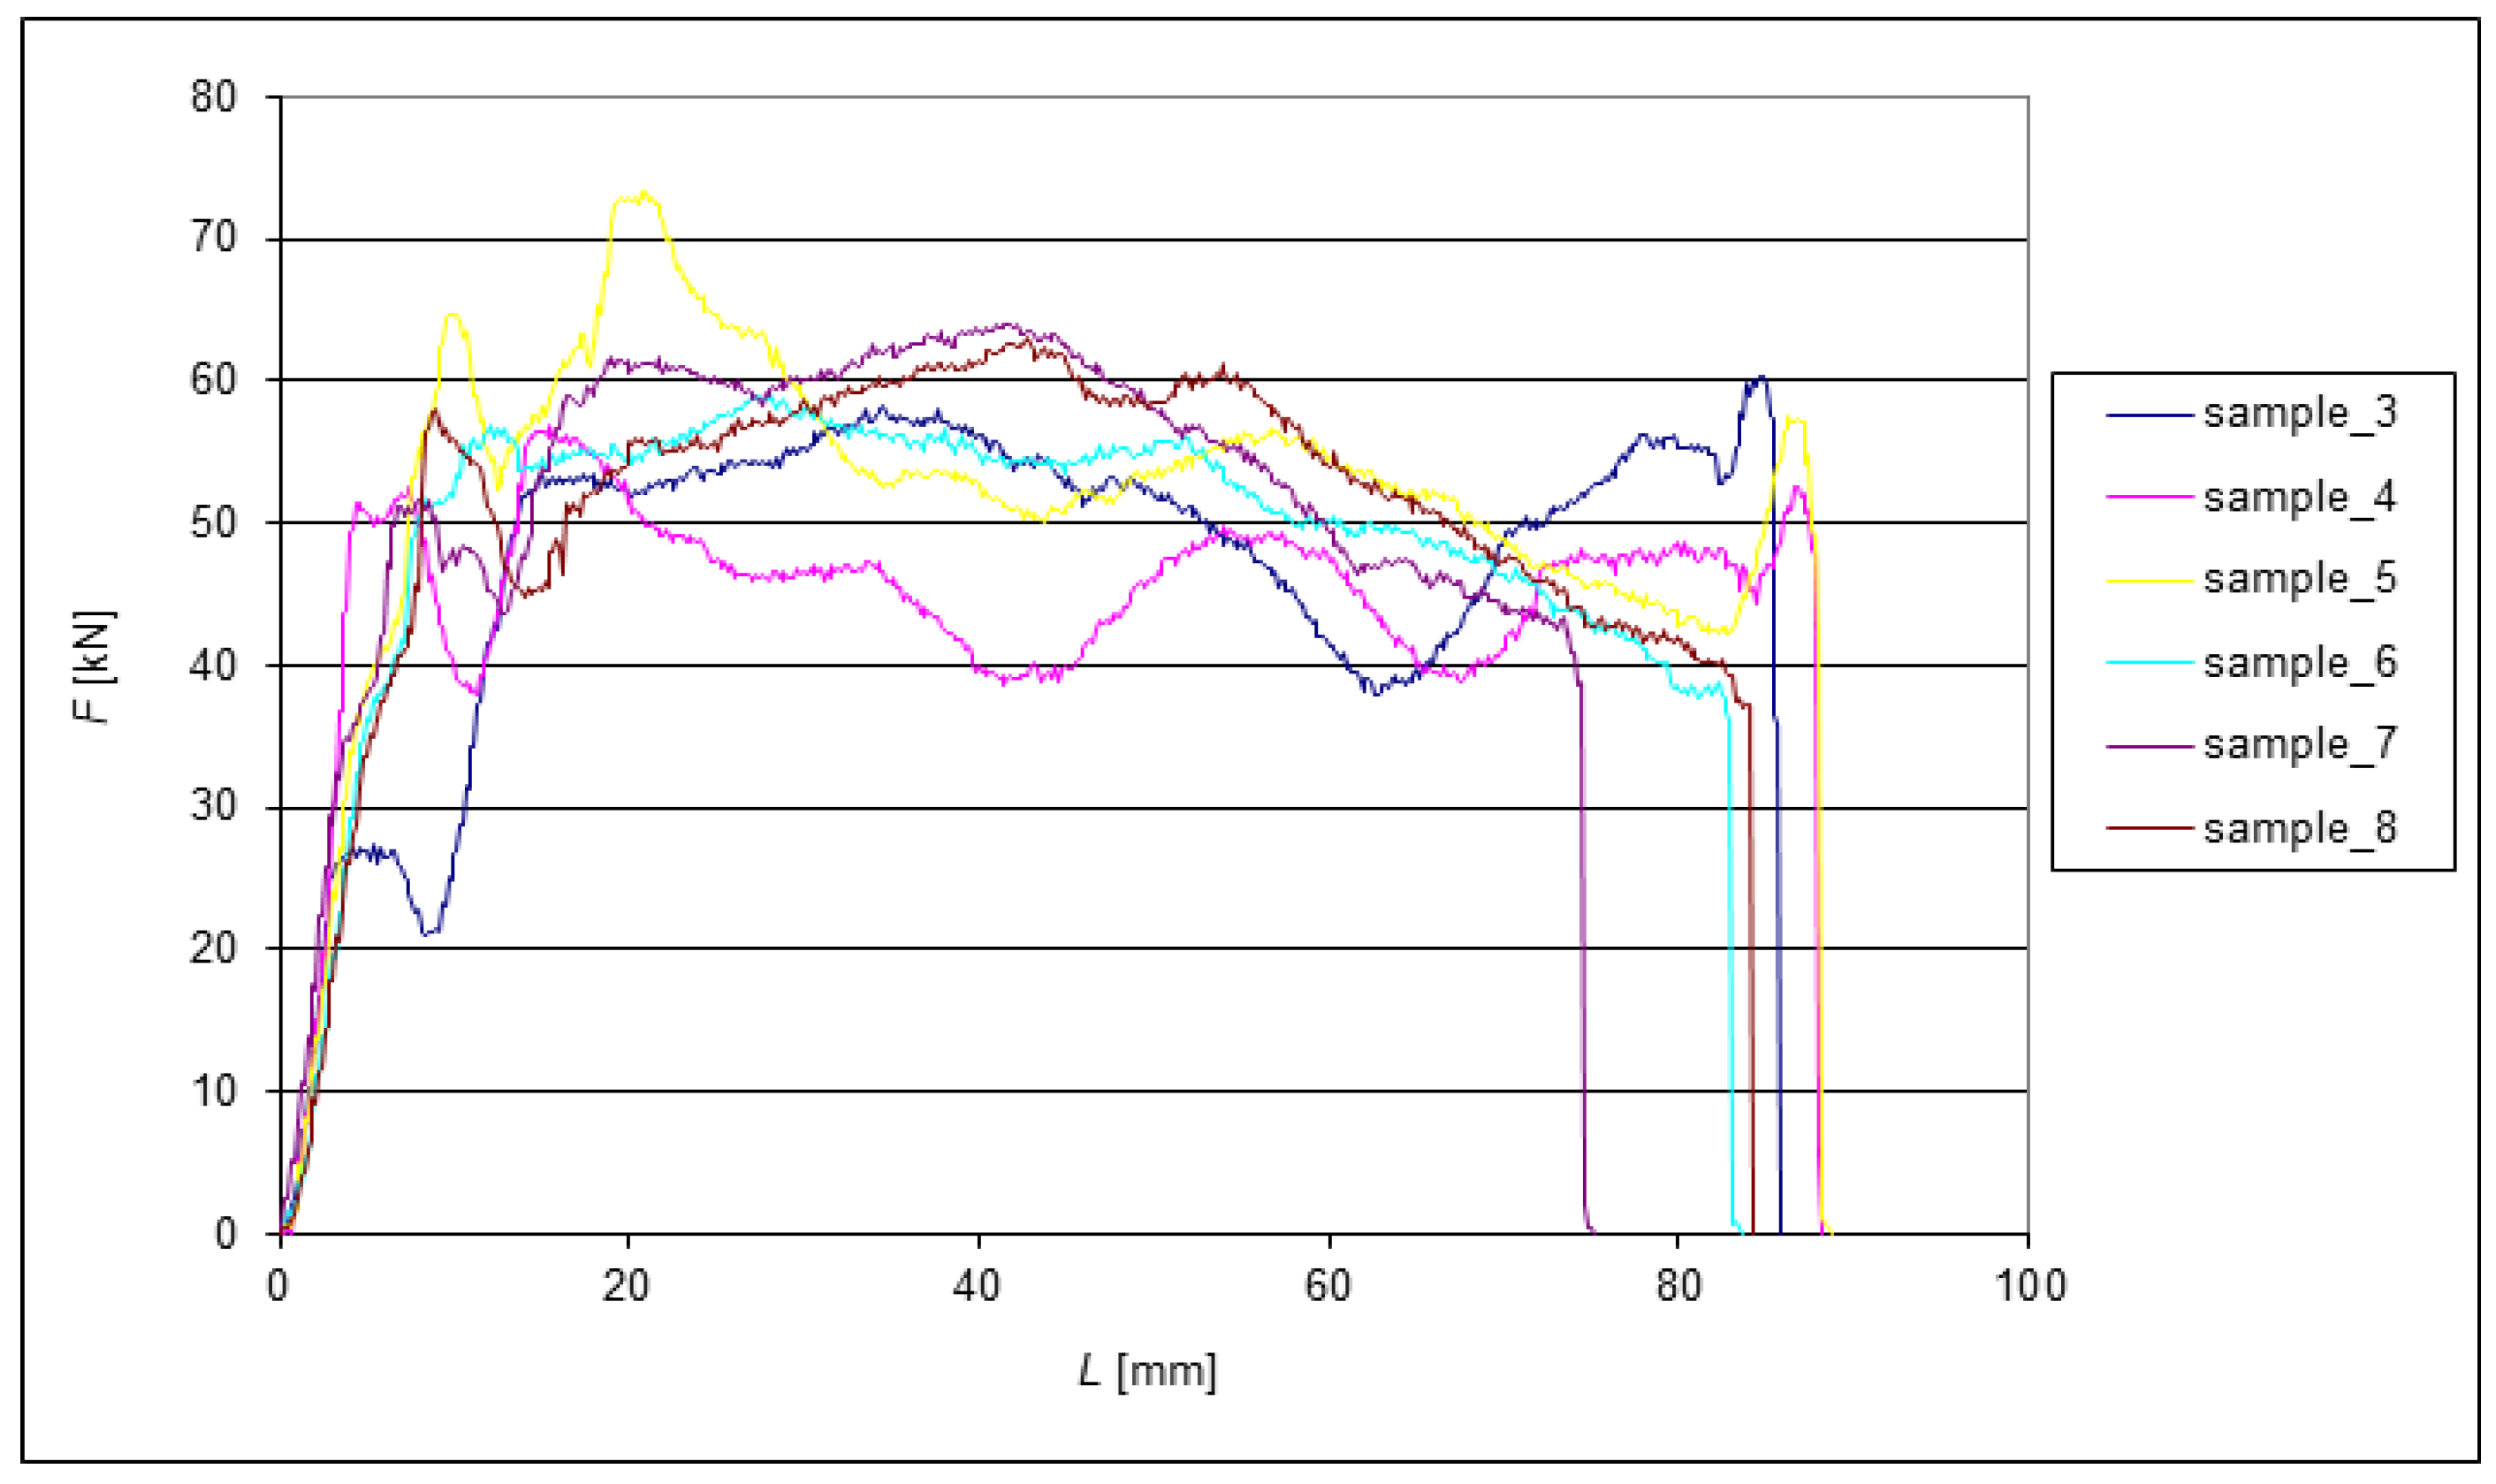
Figure 7 shows the subsequent reduction in dispersion
Fmax to 12.5% of the measured force range after the second extrusion. As expected, there was a general, albeit small, reduction in the sample length. Compared to the other samples, greater shortening was observed for Sample 7 after only two extrusions. To some extent, this may have been due to measurement inaccuracy due to irreducible deformation of the end of the samples.
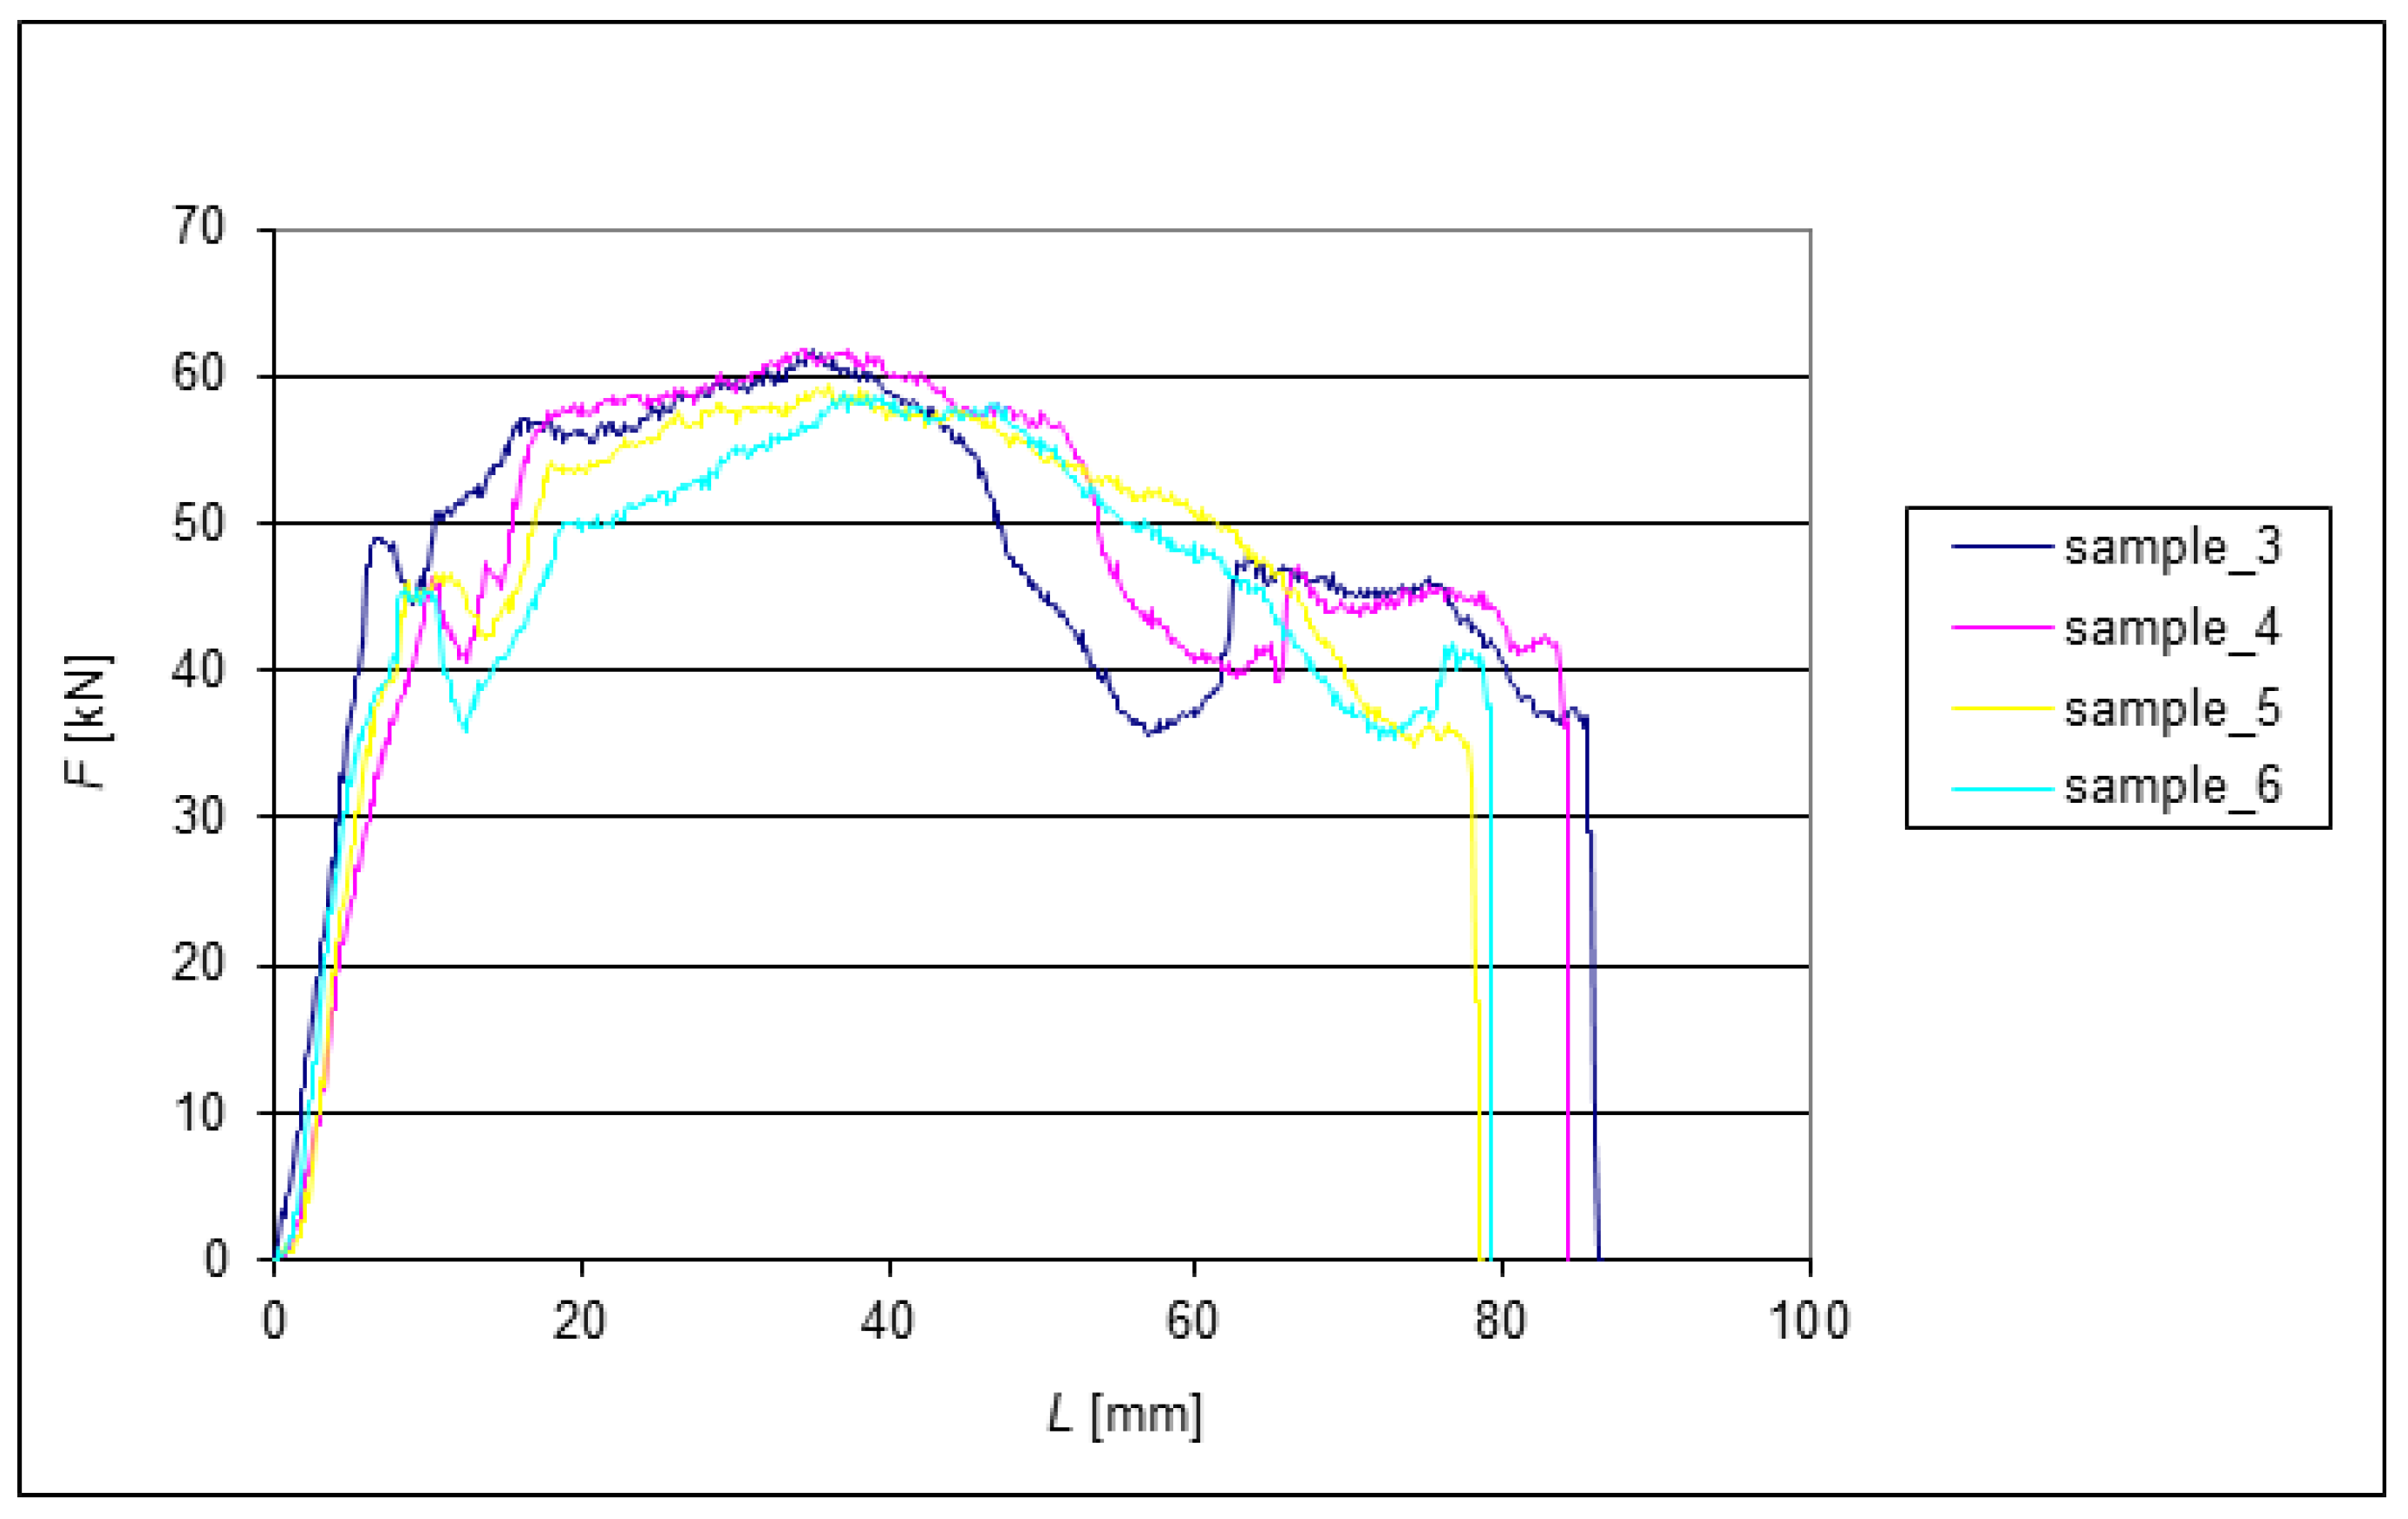
Figure 8 shows the force waveform after the third ECAP pass.
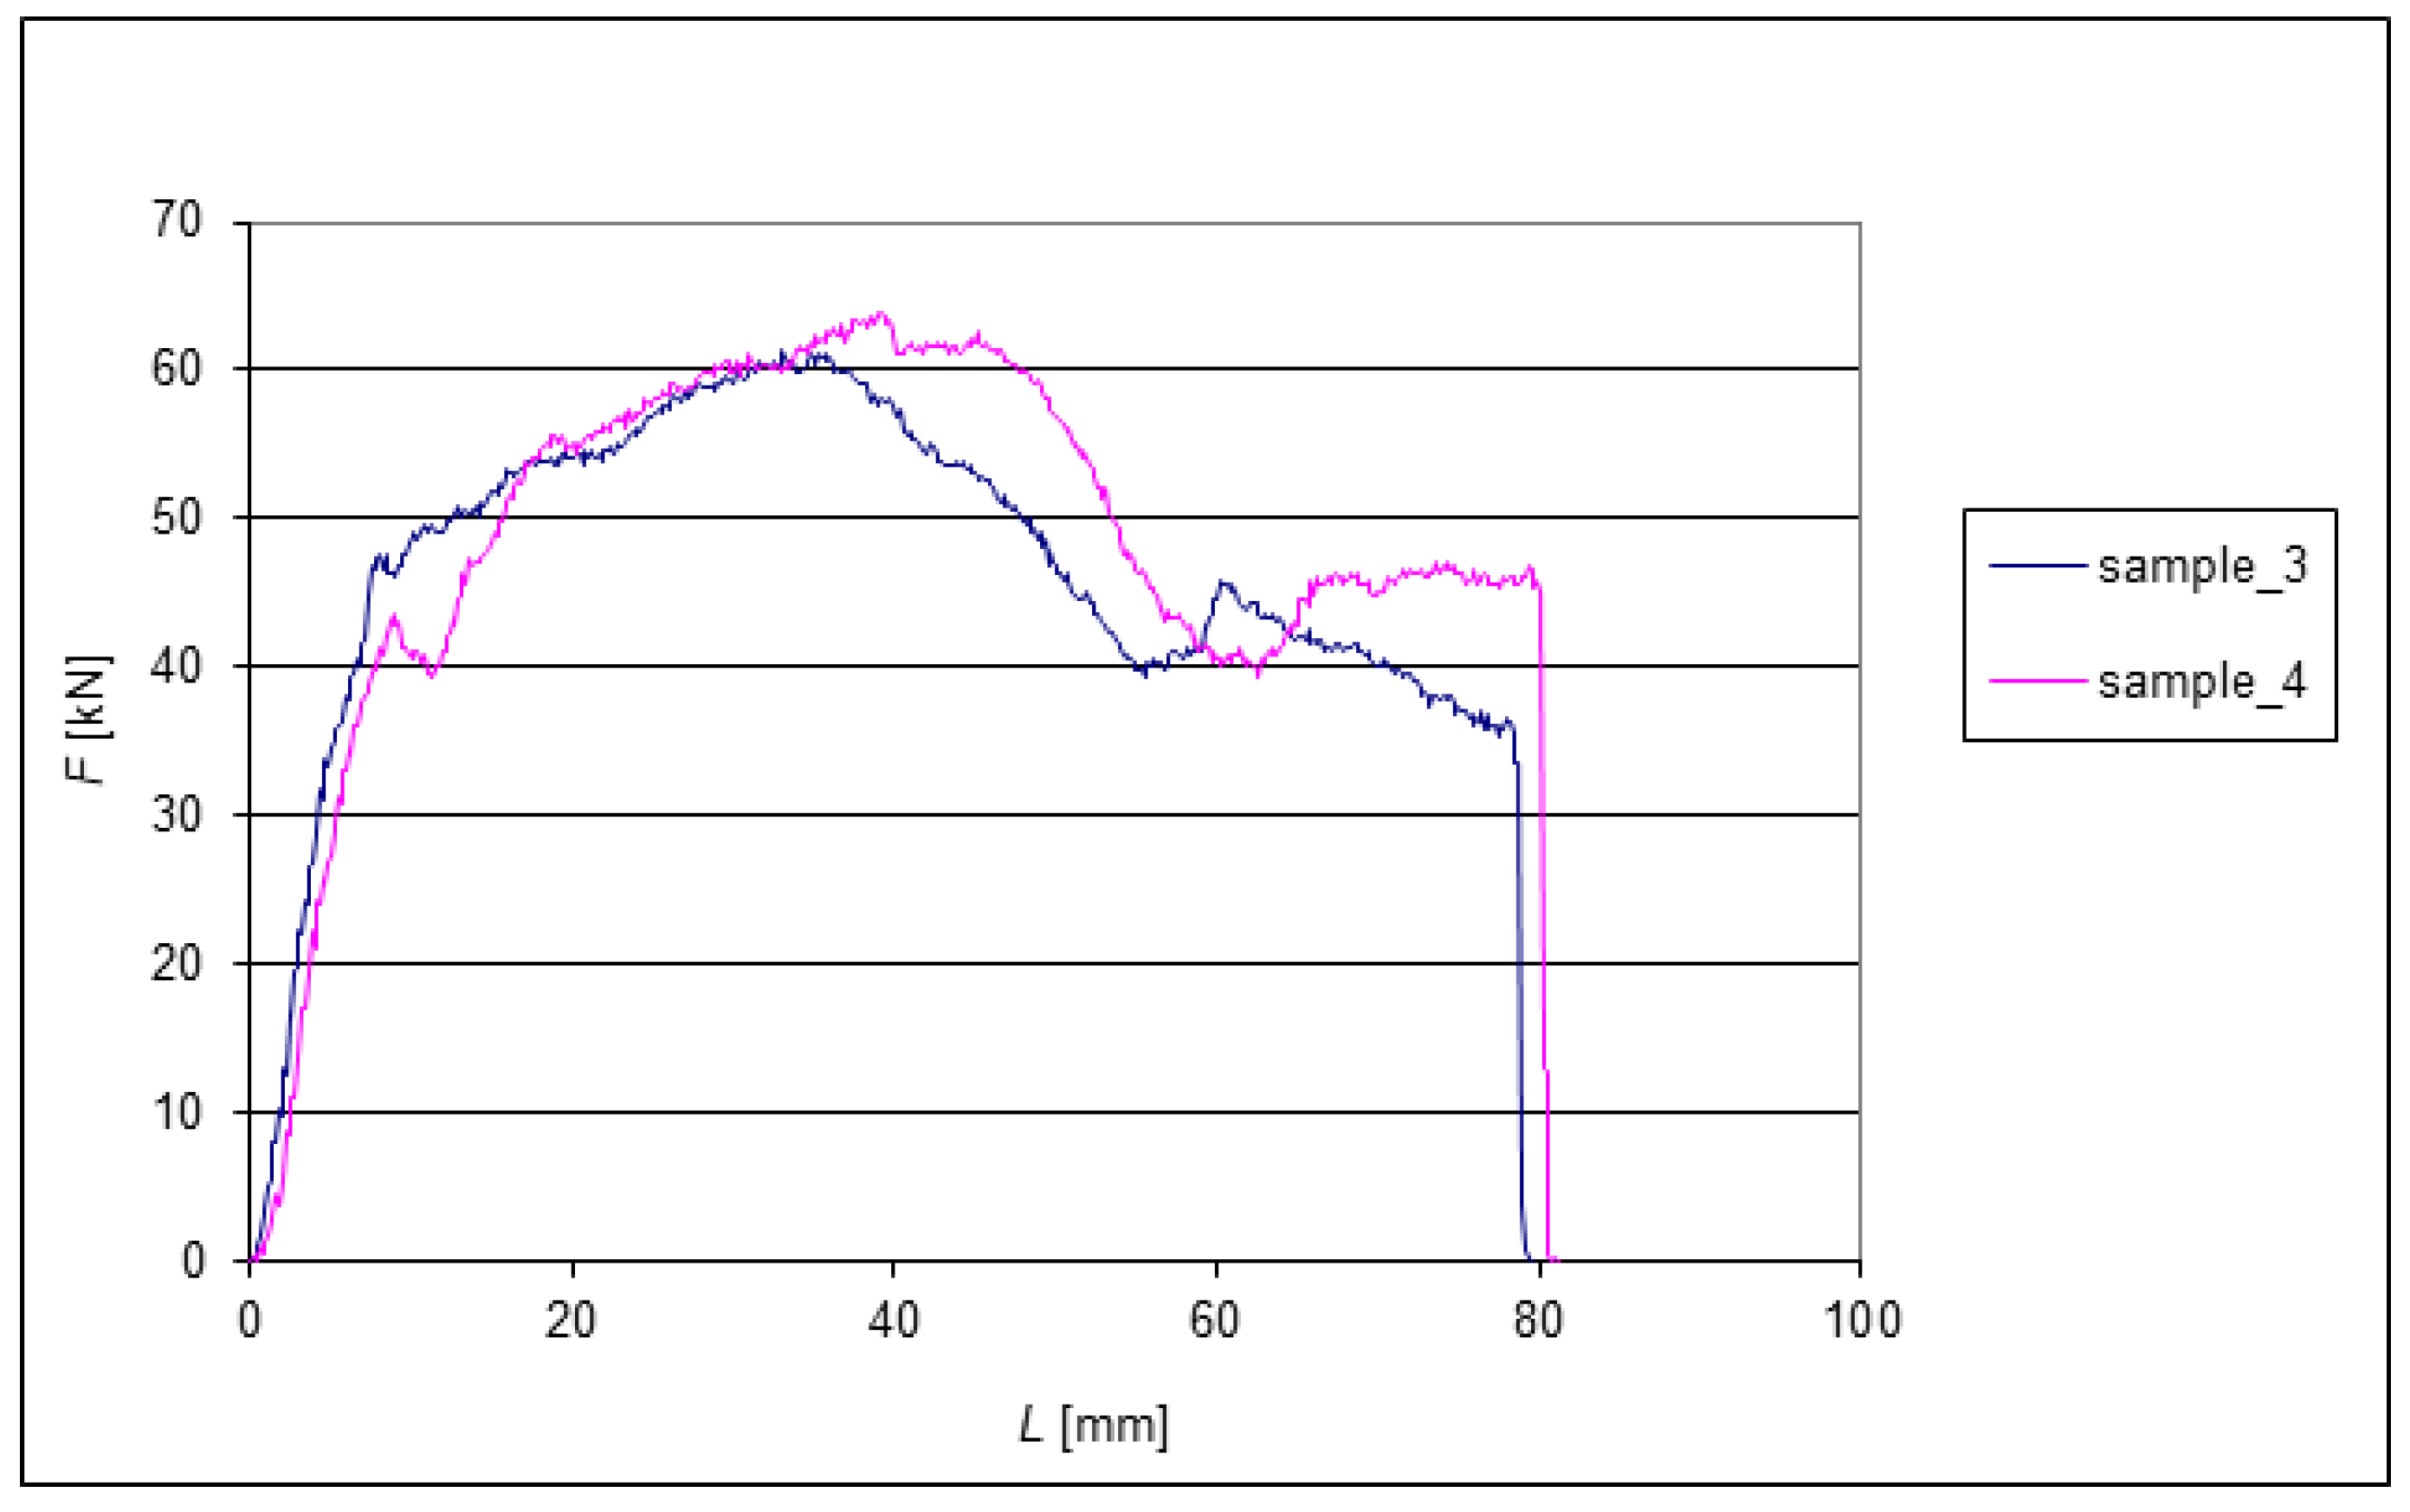
Figure 9 shows the forces during the final extrusion of the last pair of Samples 3 and 4. However, there was no significant dispersion of forces
. Their dispersion is 2.5 kN, which is approximately 4%. The final length of the two samples differed by approximately 1.5 mm.
After completing the specified number of extrusions of all samples by the ECAP method and recording the values with a strain gauge, metallographic research and mechanical property tests followed. The behaviour of the compressed material is aptly described by the Hall–Petch relationship, which can be generalised to various materials, including the material under study. There is a grain size limit within which the strength stops increasing or even begins decreasing. Within this limit, the structure of the materials is fragmented, so a further increase in stress is undesirable.
3.6. Results from Metallographic Tests
Measurements of medium grain size were made in two directions.
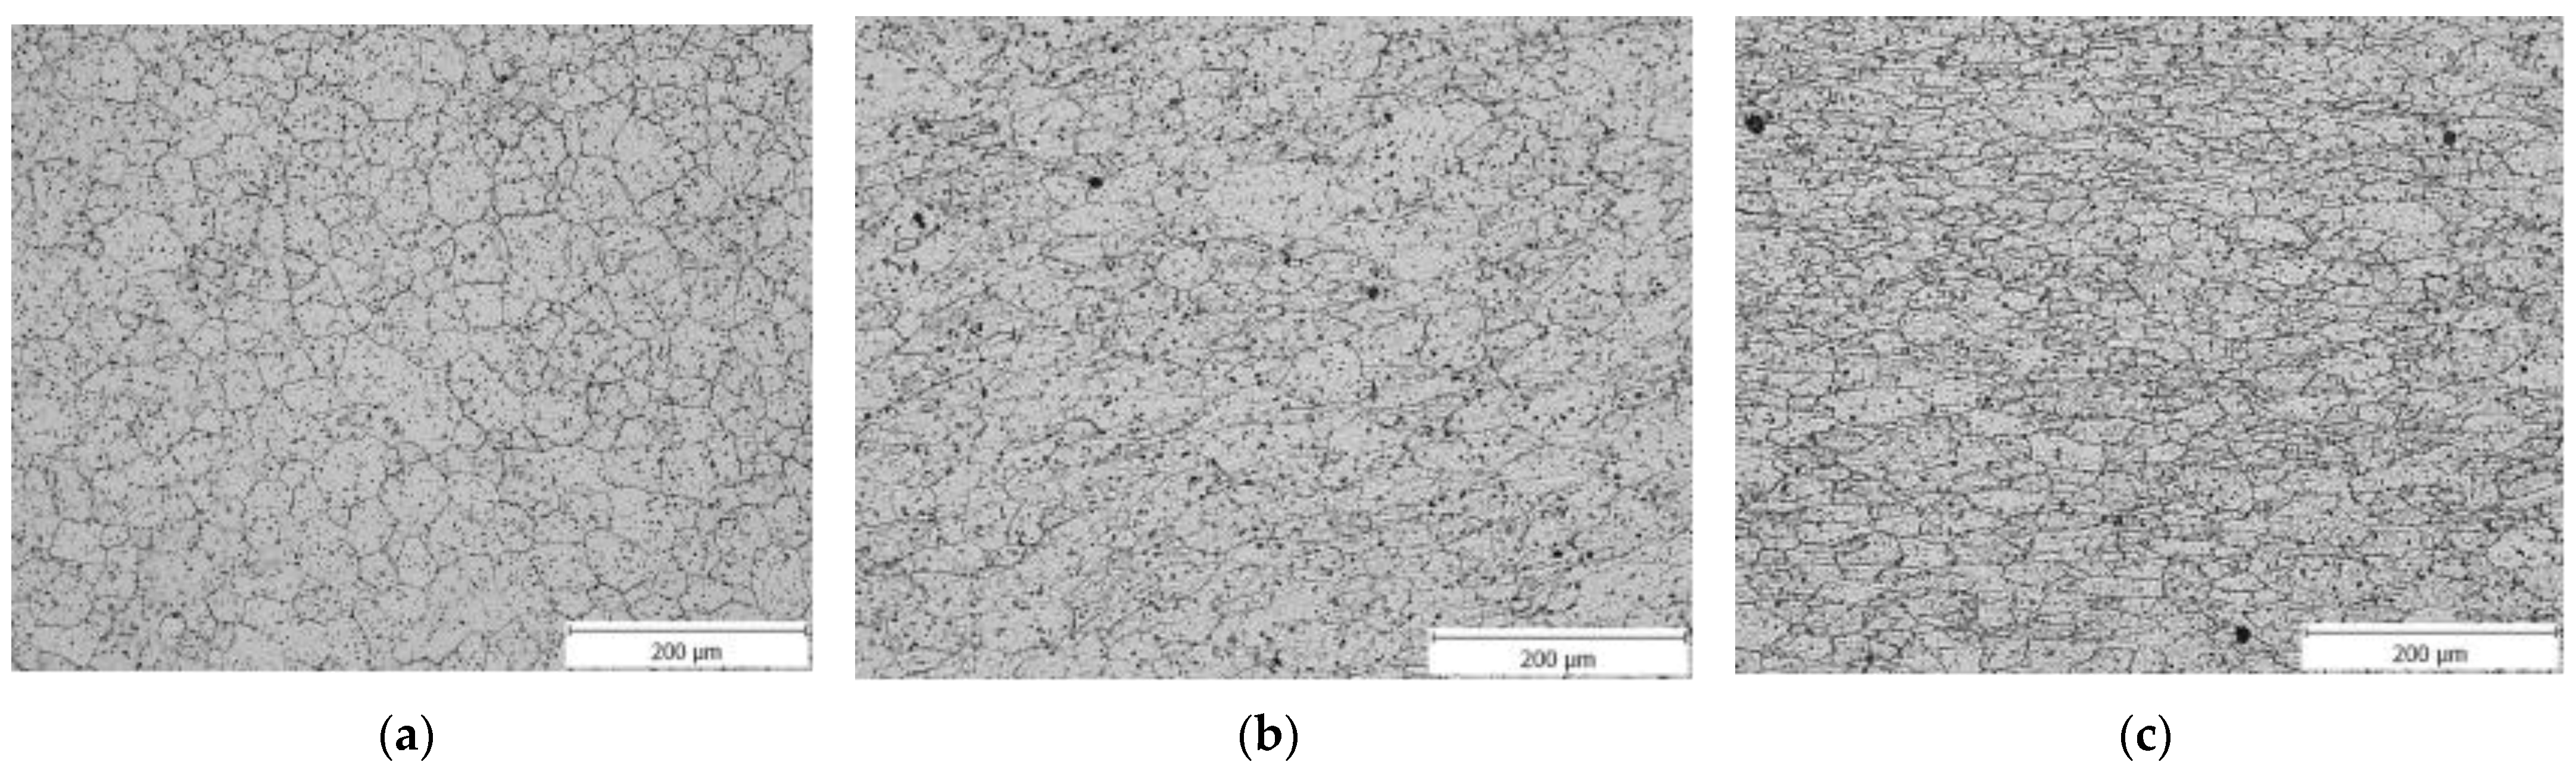
Figure 10a shows the microstructure of the initial material. It shows that the microstructure is homogeneous and without obvious anisotropy. The mean grain size is relatively large for the undeformed samples, approximately 28.9 μm. The microstructure of the material after one pass through the ECAP die can be seen in
Figure 10b. The mean grain size of the sample is 12.51 μm after one pass.
Figure 10c shows the microstructure of the material after four passes through the ECAP die; the mean grain size is 4.63 µm.
The intense plastic deformation during extrusion obviously has a great impact on the microstructure and grain size of the processed materials. In addition to the temperature and strain rate, the magnitude of the stacking fault energy (SFE) has an impact on the formation of the resulting microstructure during the SPD process and the movement of dislocations through the material. Stacking faults are among the surface defects in f.c.c. lattice metals that can commonly occur during forming. The relatively large SFE, which is typical for aluminium alloys, prevents complete dislocation during deformation, and only partial (incomplete) dislocation occurs. Moreover, even the dislocation slip, in which dislocations move in slip planes in the material, is limited due to cold forming.
3.7. Mechanical Properties
Table 2 shows the values of mechanical properties determined from tensile tests. These are the average values of the mechanical quantities determined from two tests for each individual group of samples.
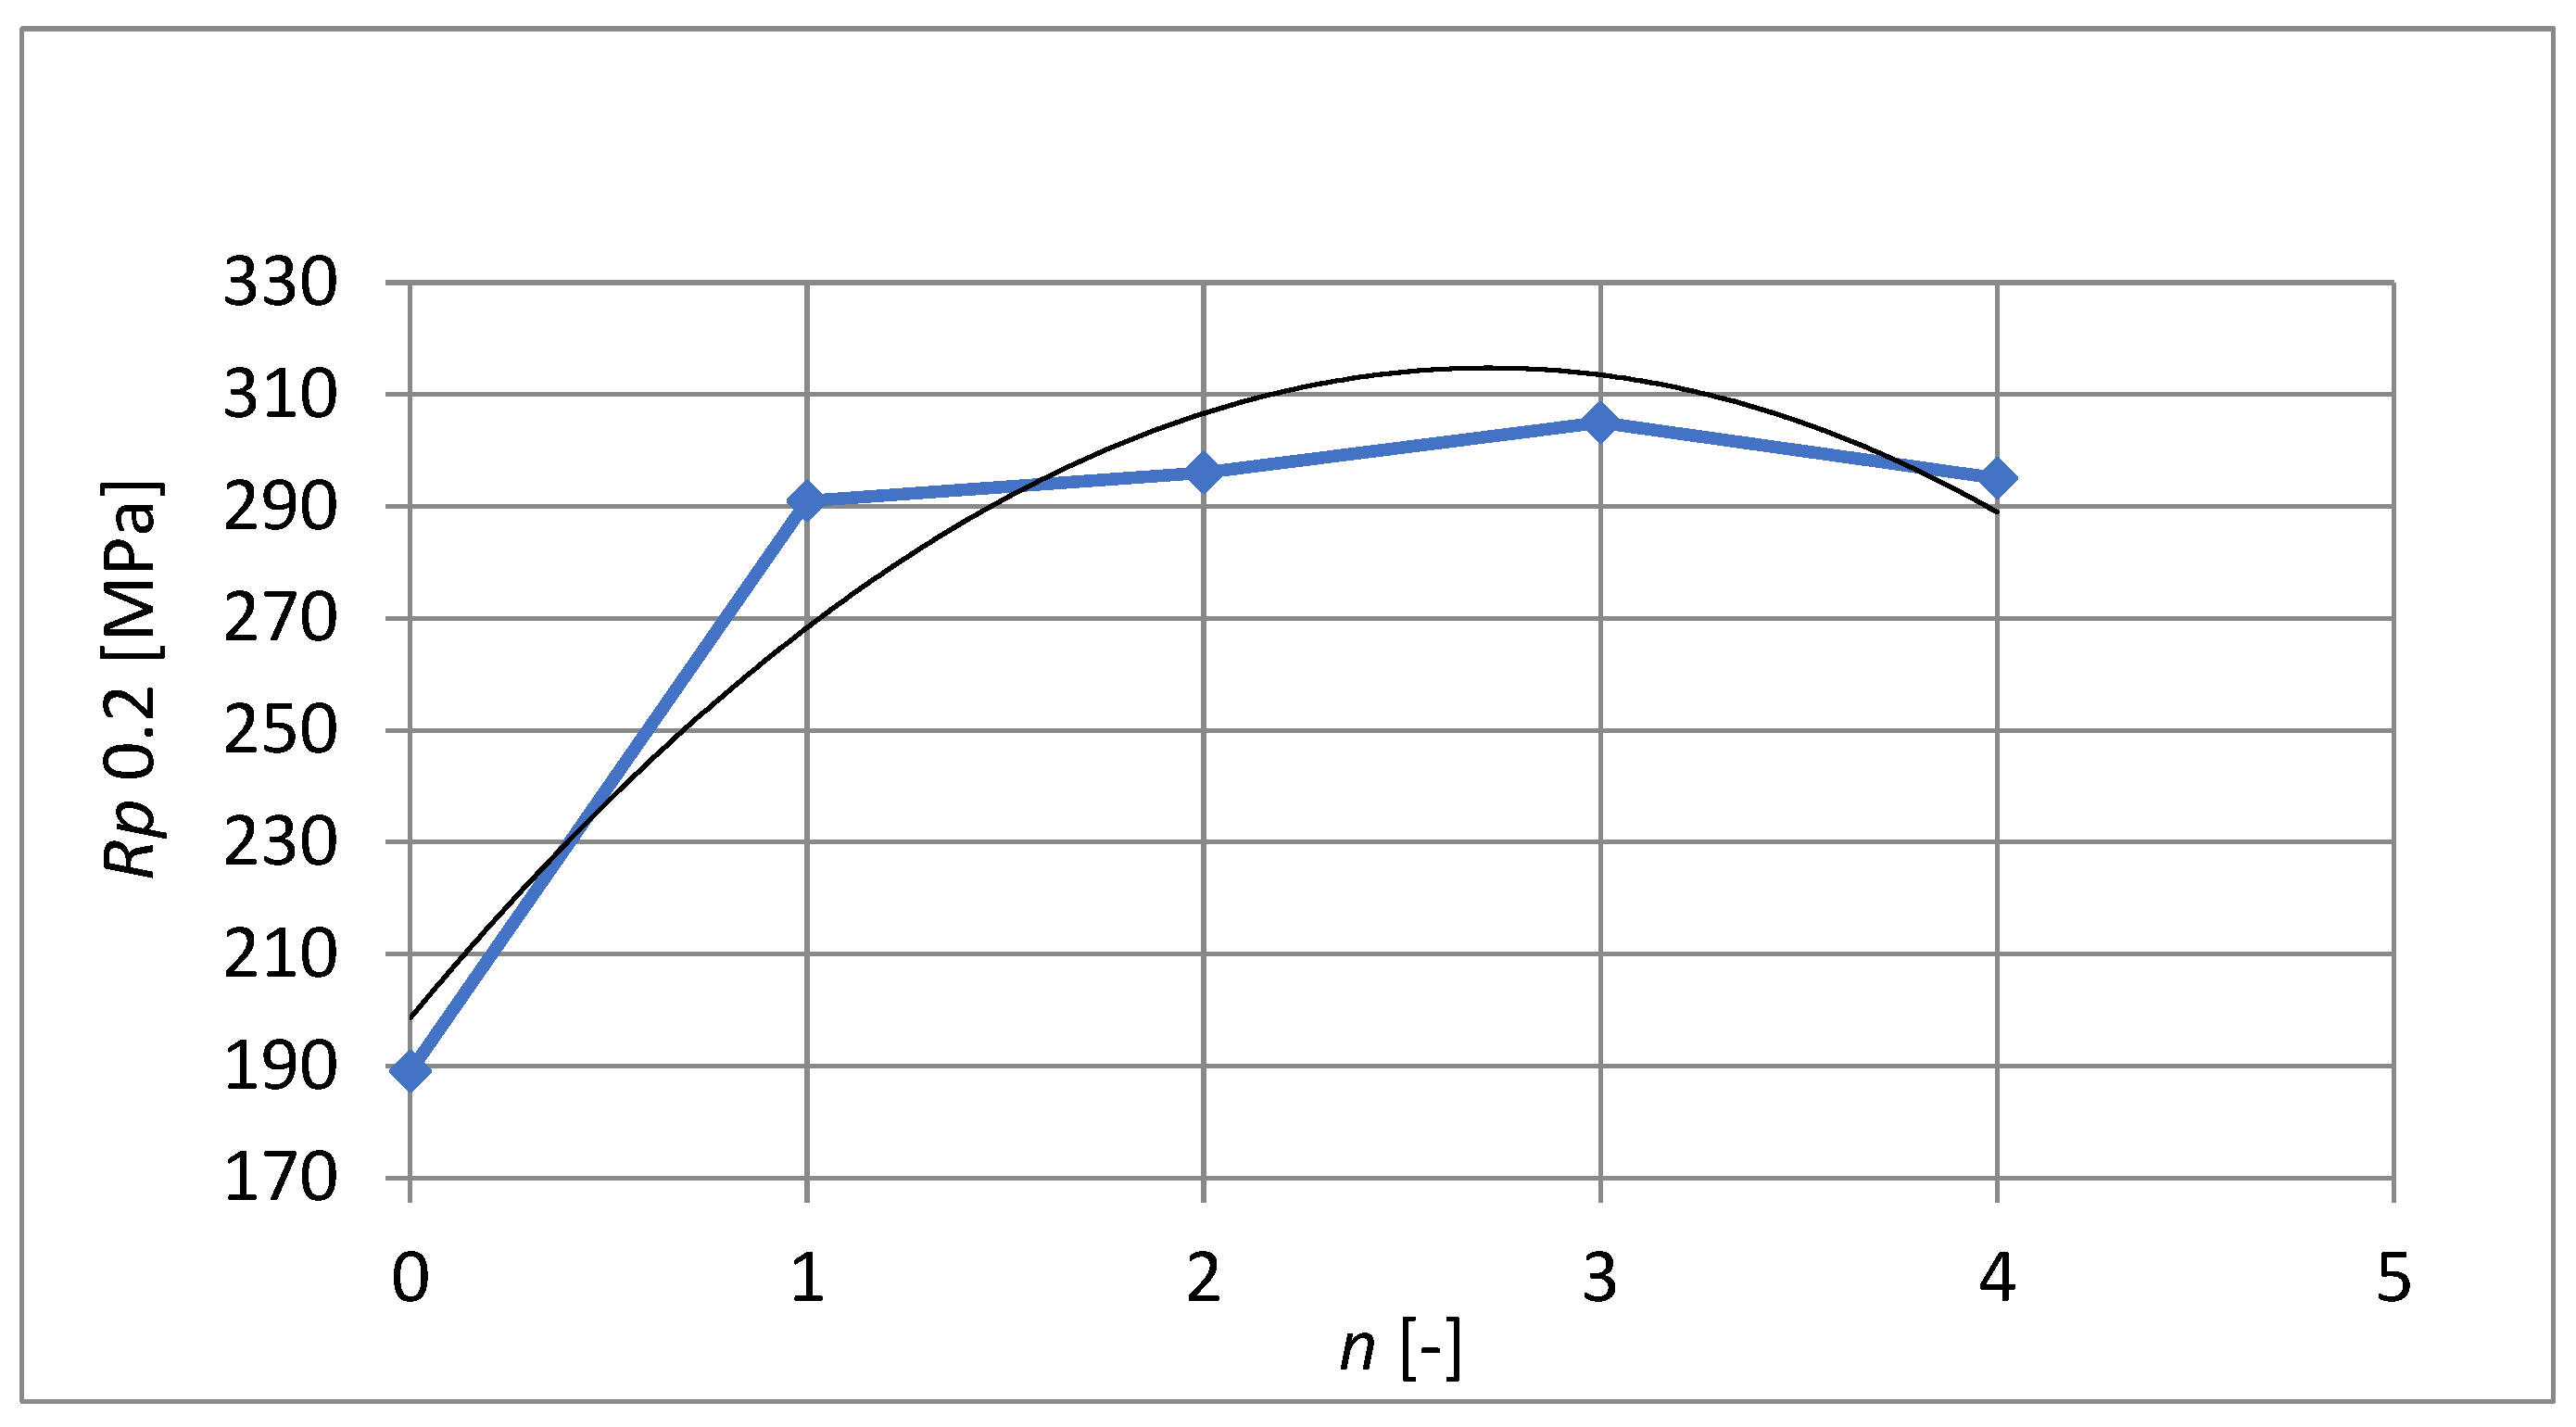
Figure 11 shows the yield point course versus the number of passes through the ECAP die. The greatest increase in the yield point is achieved after the first pass through the ECAP die, where the value increases from
Rp0.2 =189 MPa to
Rp0.2 = 291 MPa, an increase of more than 50%. Subsequent extrusions led to a minimal increase in the yield point and then a decrease after the fourth extrusion.
In addition to the yield point value itself,
Figure 11 also shows a polynomial regression curve determined by the least-squares method. With this dependence, the parameter of the largest coefficient of determination is determined as
R2 = 0. 9118(5):
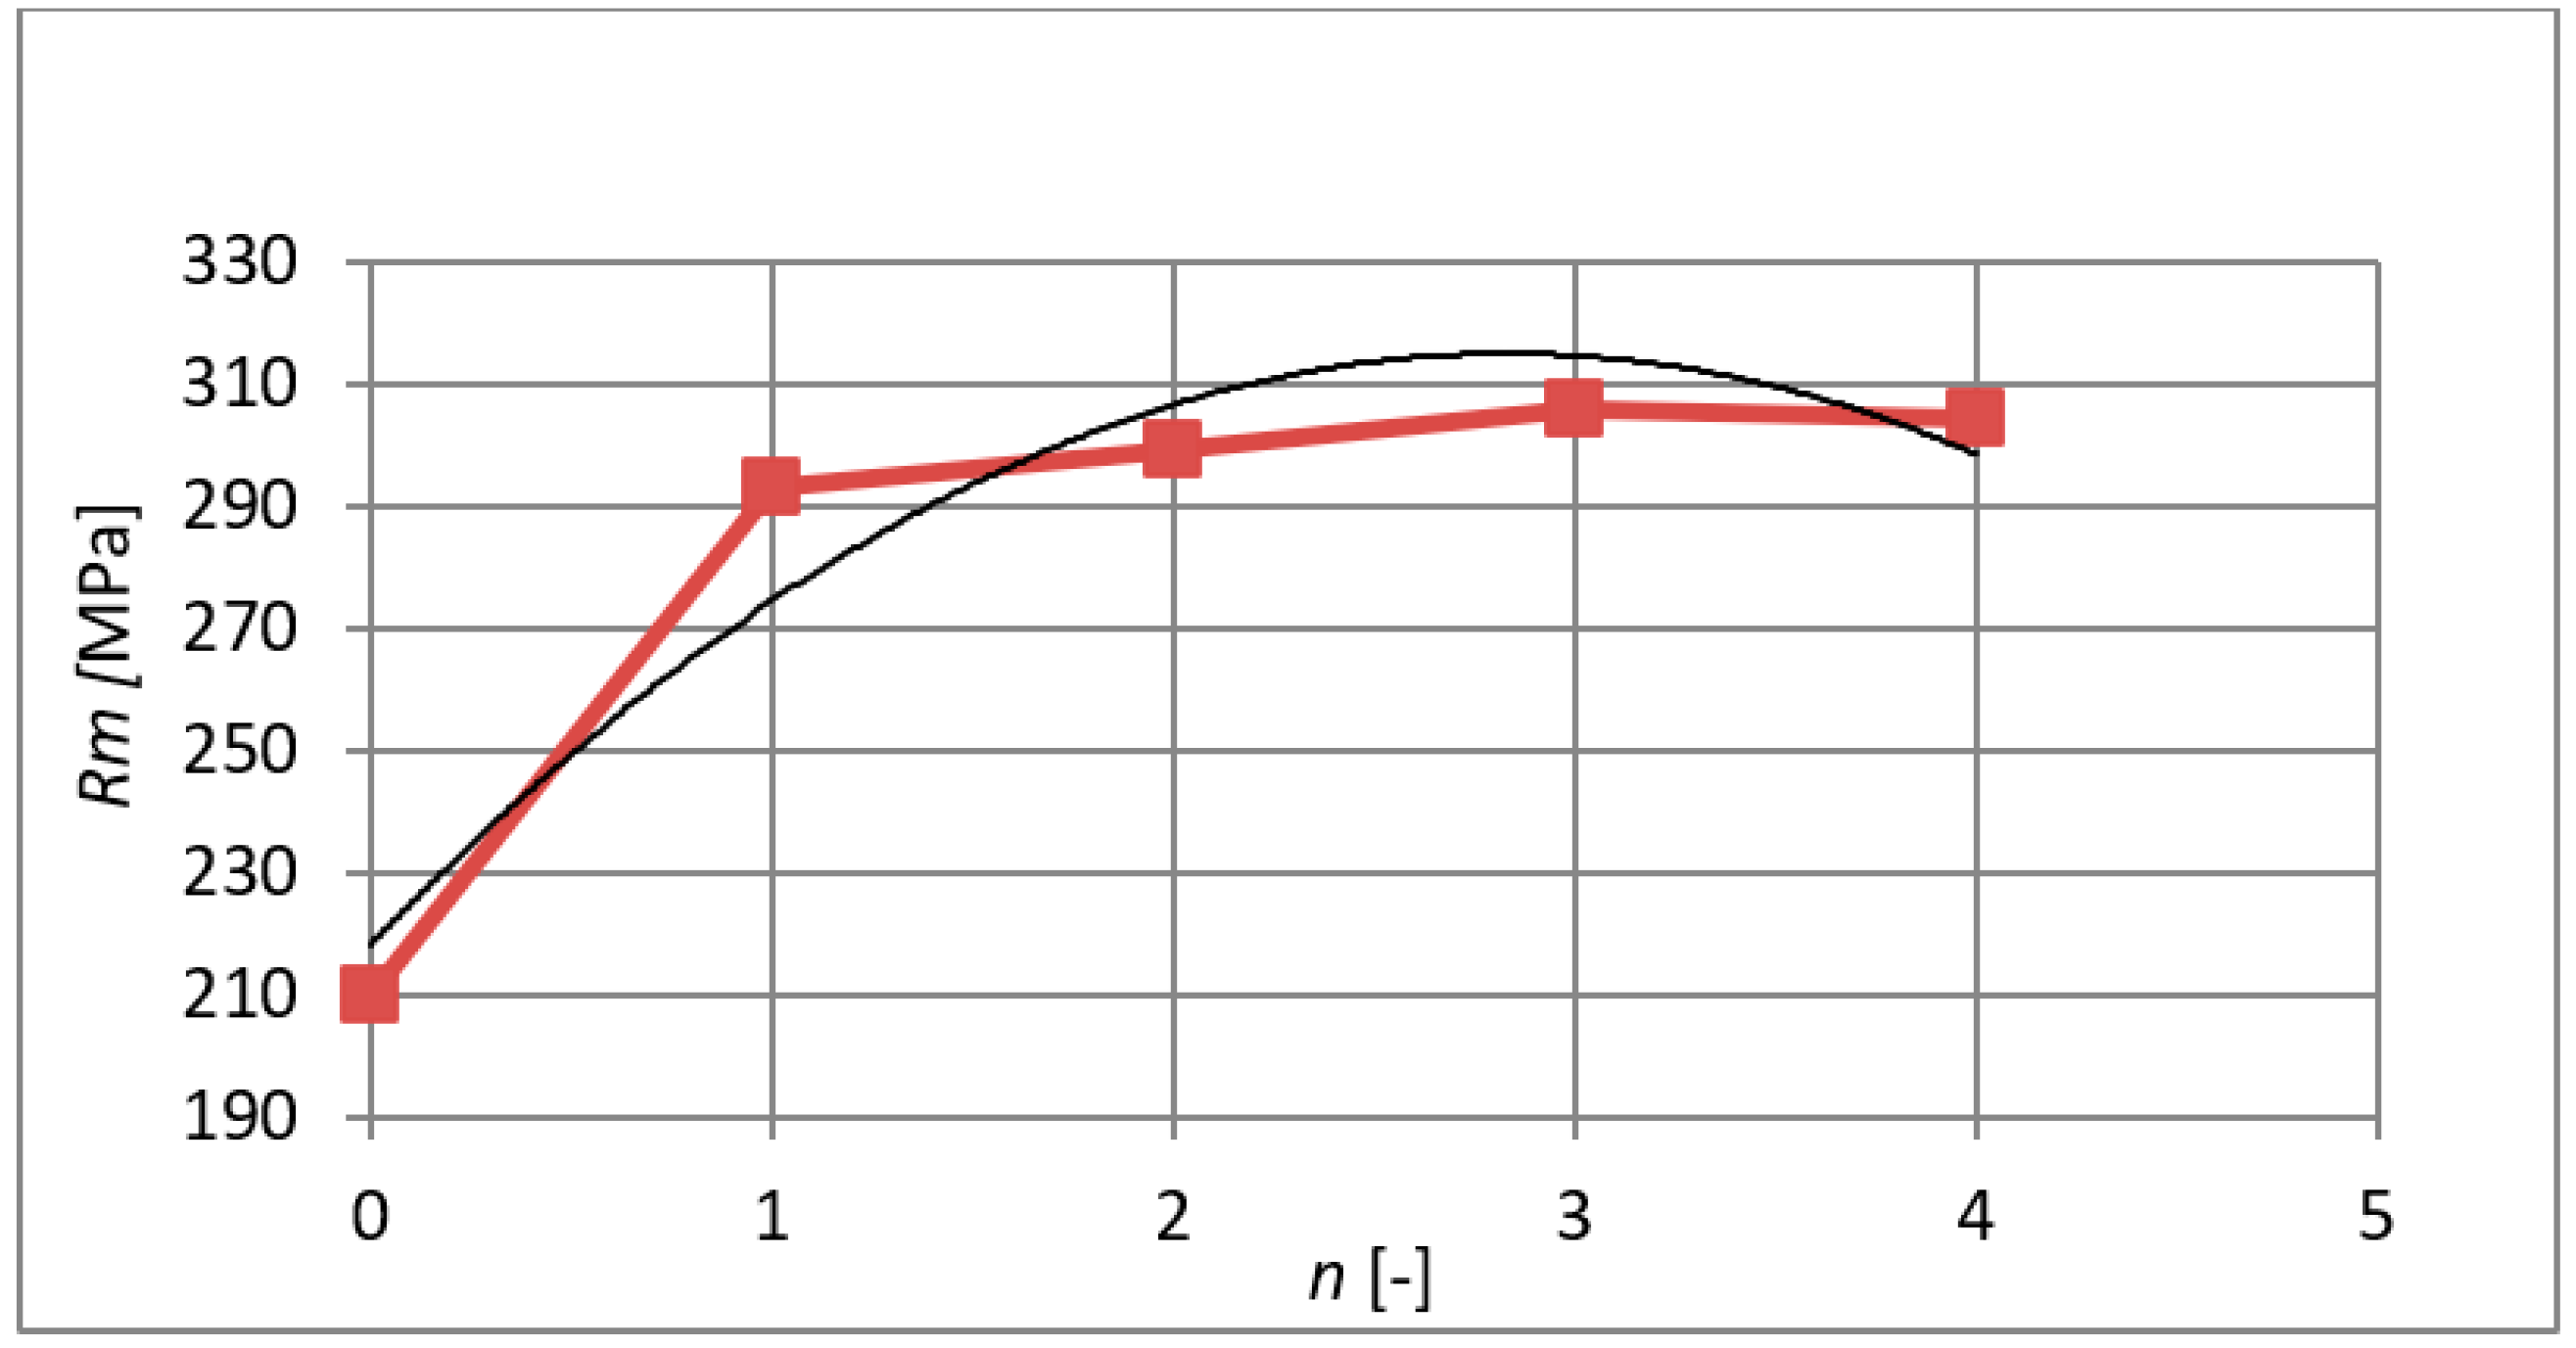
Figure 12 shows the course of the ultimate tensile strength and its gradual increase after each extrusion. The maximum coefficient of determination in this case is
R2 = 0.9139, and the calculation of the regression curve is (6):
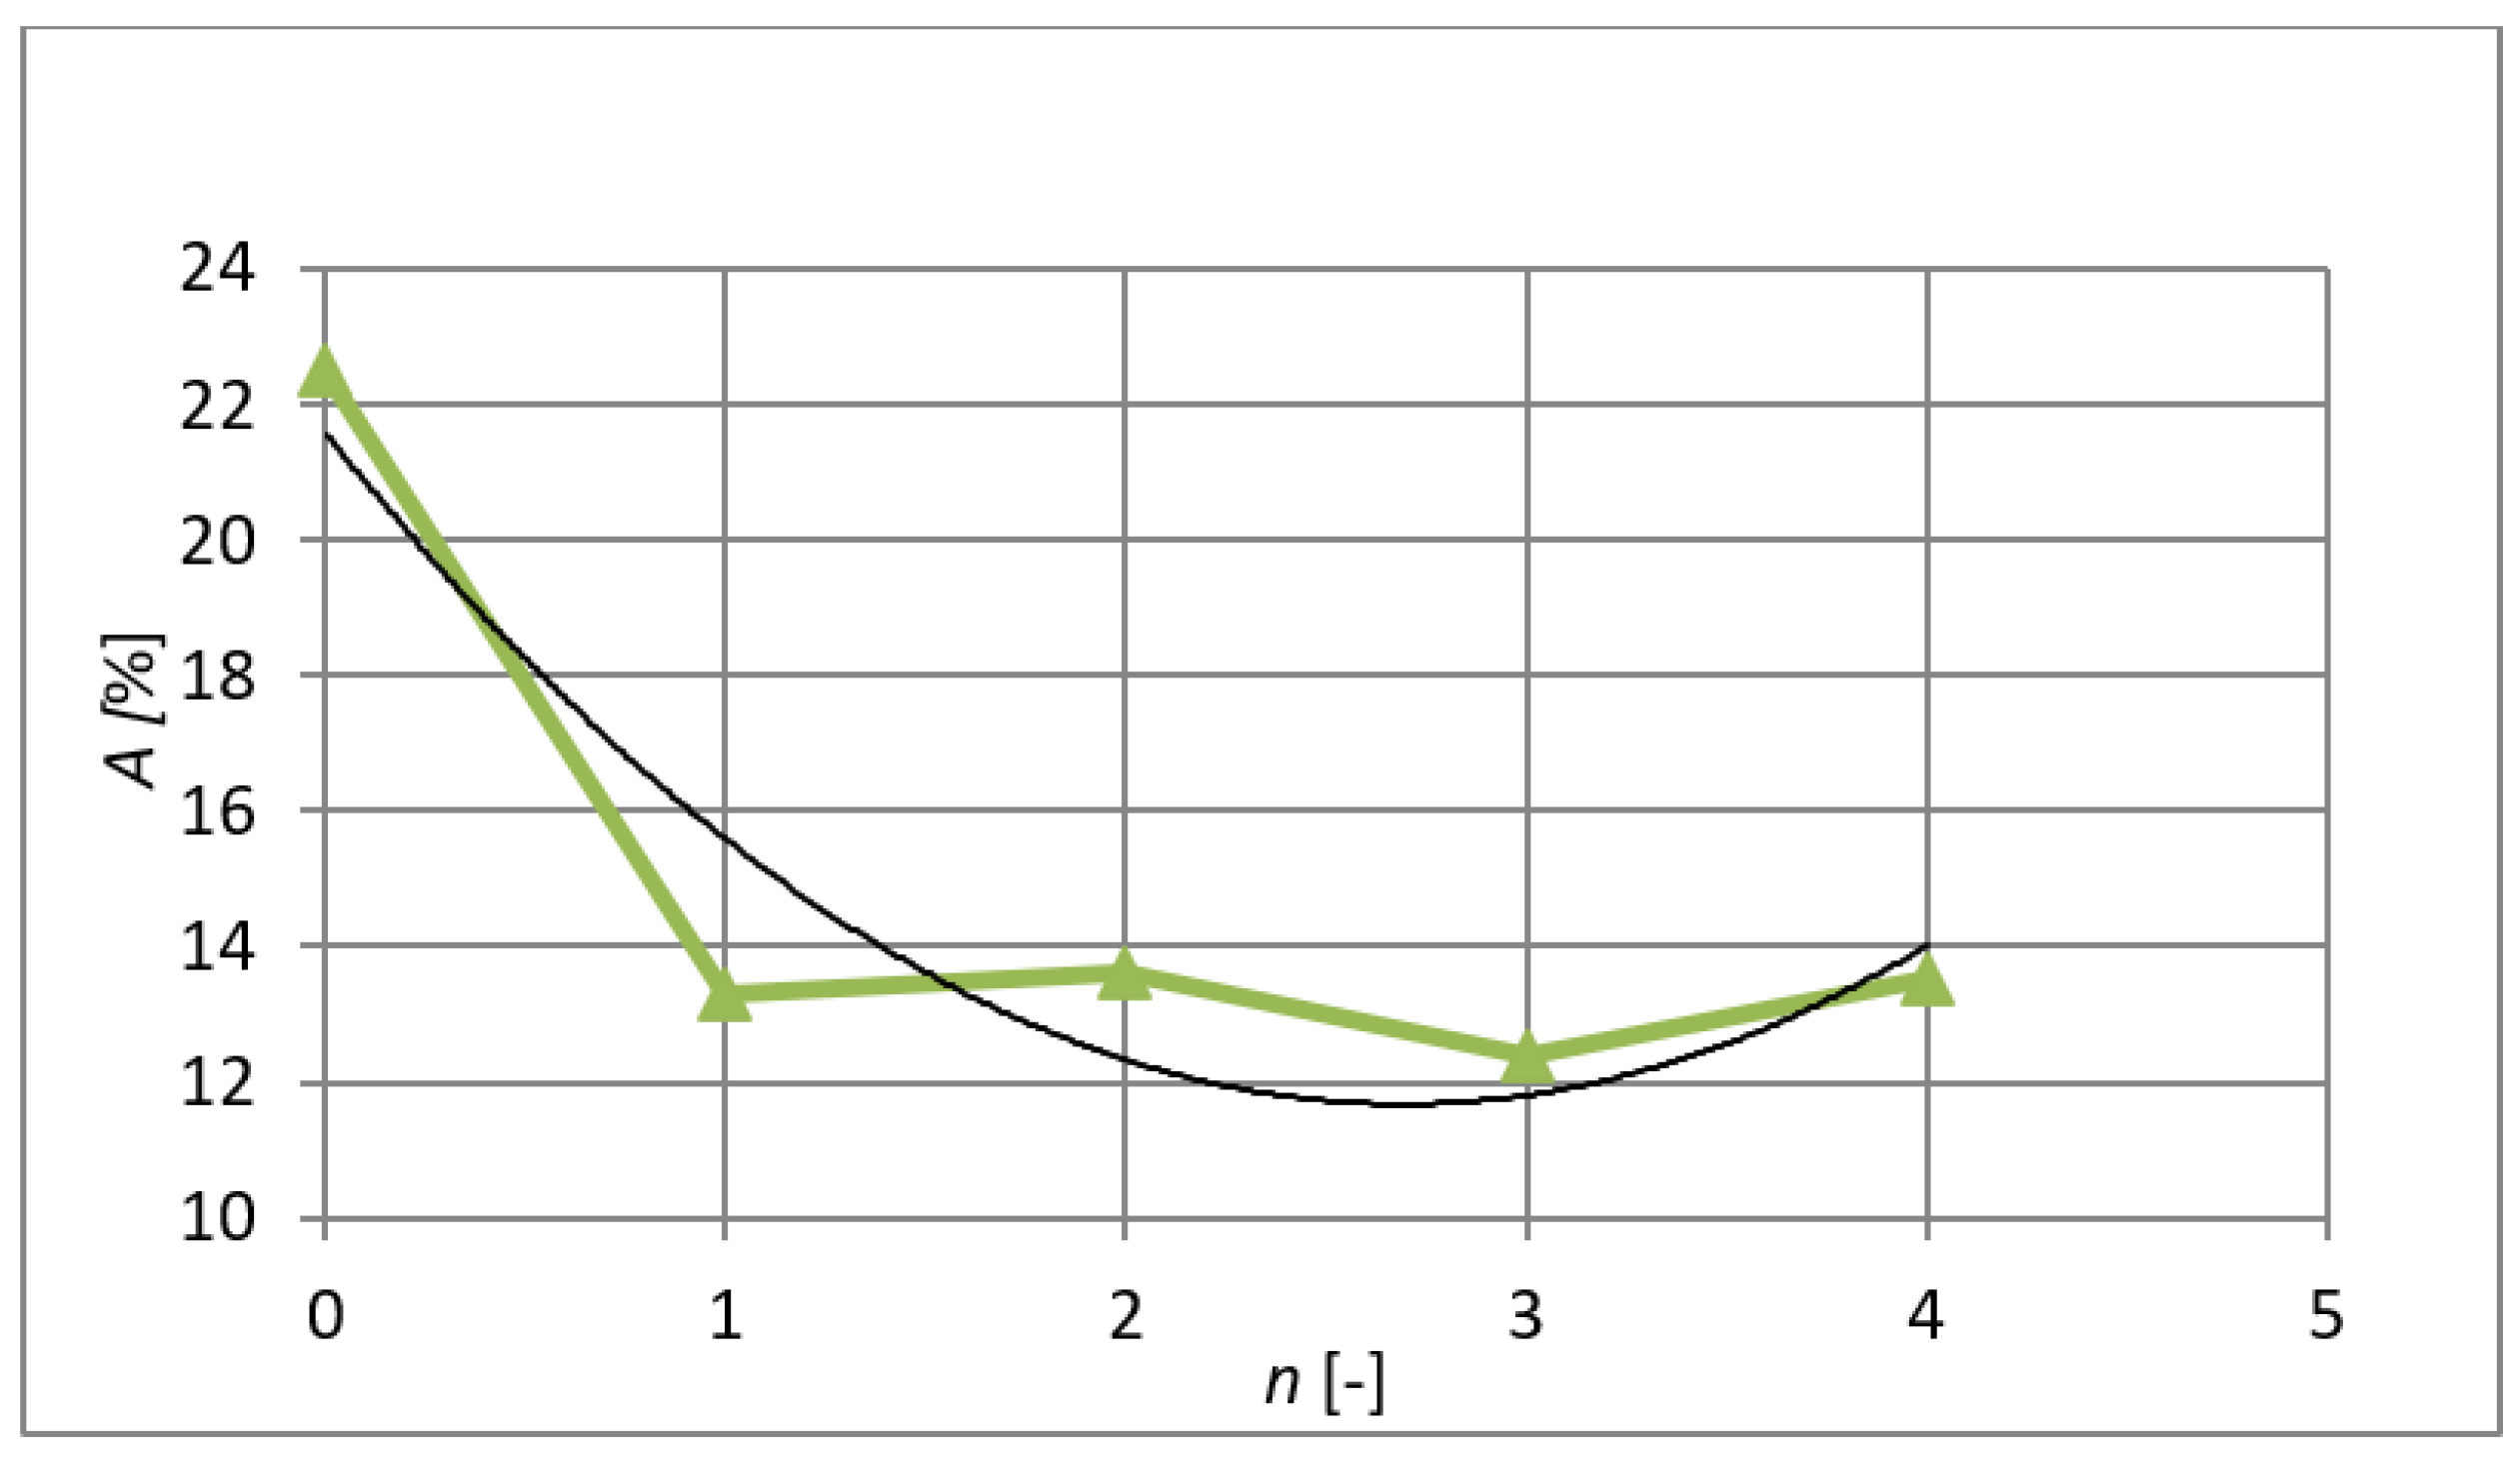
In addition to a number of improved properties, fine-grained and nanocrystalline materials are often characterised by reduced ductility [
20]. However, this is also visible in
Figure 13, where it can be seen that in contrast to the increasing breaking stress and yield point after extrusions by the ECAP method, the ductility of the material is significantly reduced by almost 10%. It is not possible to state unequivocally whether this is due to poor consolidation or whether some intrinsic physical reason is responsible. The largest coefficient of determination is
R2 = 0.8814. The regression curve in this case is (7):
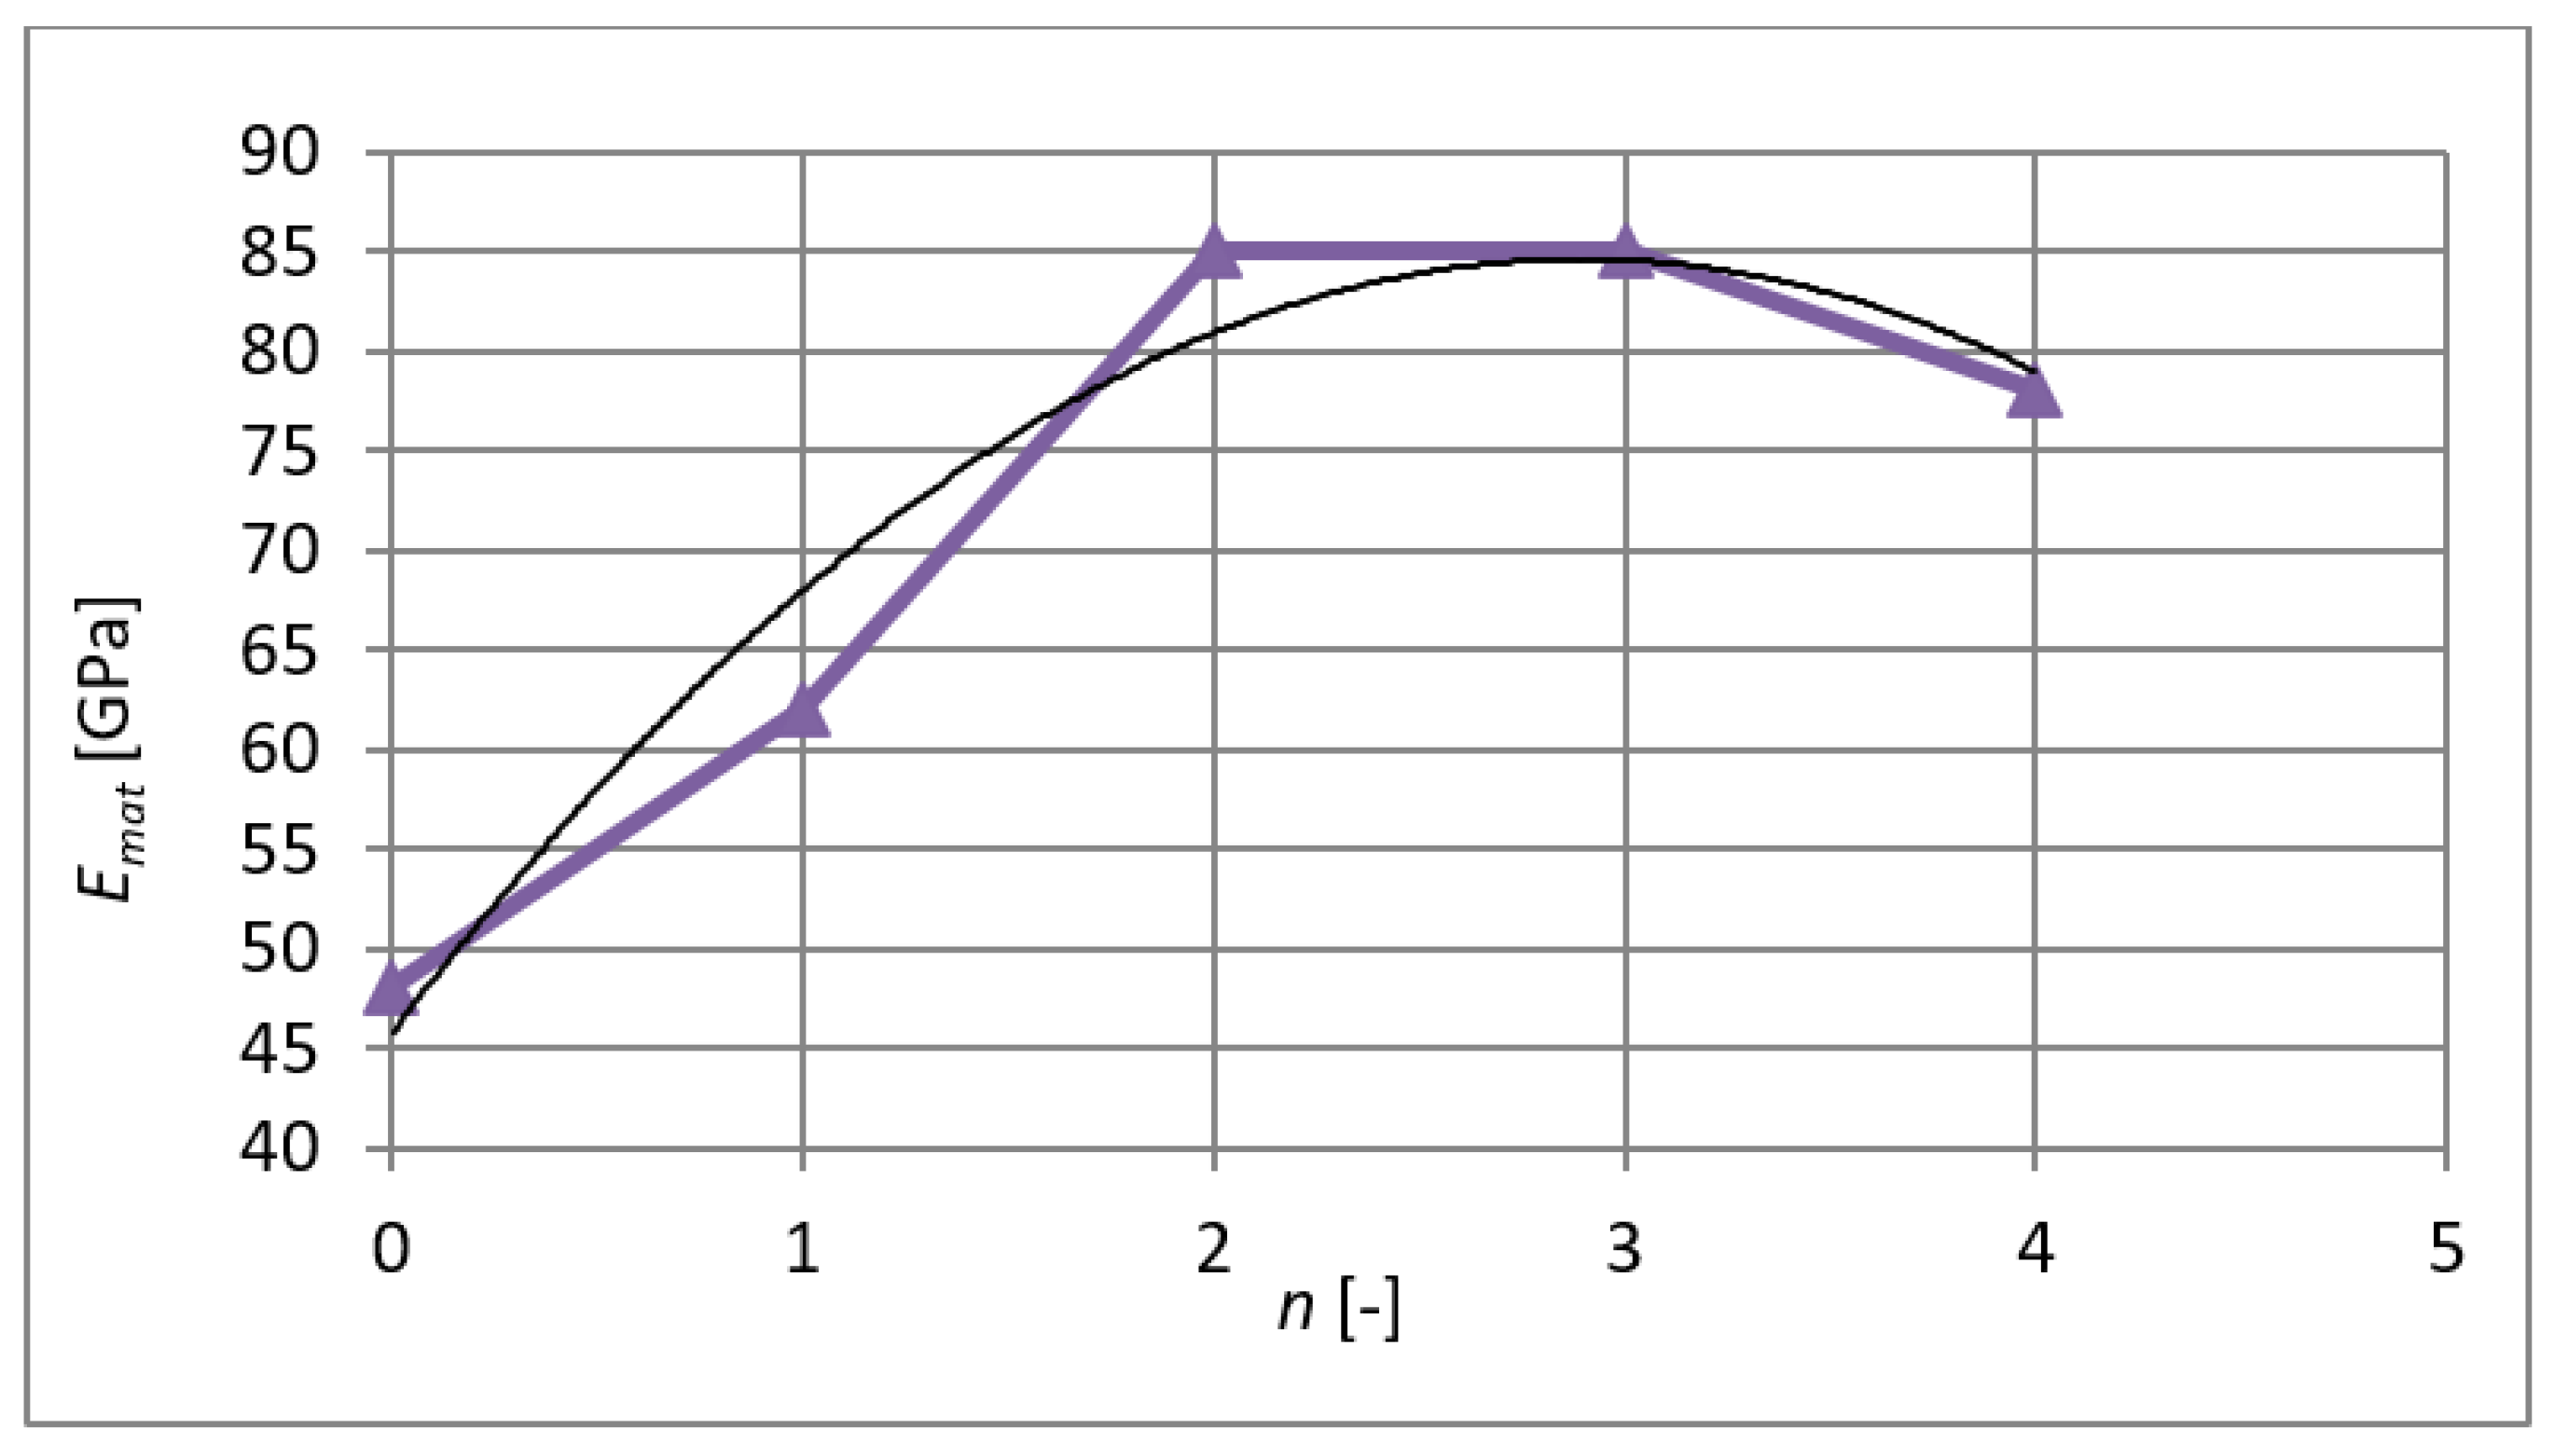
The modulus of elasticity during extrusions is shown in
Figure 14 with the regression curve, whose largest coefficient of determination in this case is
R2 = 0.9442. It can be seen that together with the values of yield stress and strength at the last pass through the die, there is also a slight decrease in the elasticity values. The polynomial regression curve is (8):
The quantity R expresses the tightness of the agreement according to the least-squares method to demonstrate extrusion trends, i.e., analytically (using a spreadsheet editor), the expression of the interleaved function and the objective, reproducible determination of the best match criterion is visible. The given regression equations were generated to determine the extrusion trend of a particular stressed material, not to predict material parameters in general.
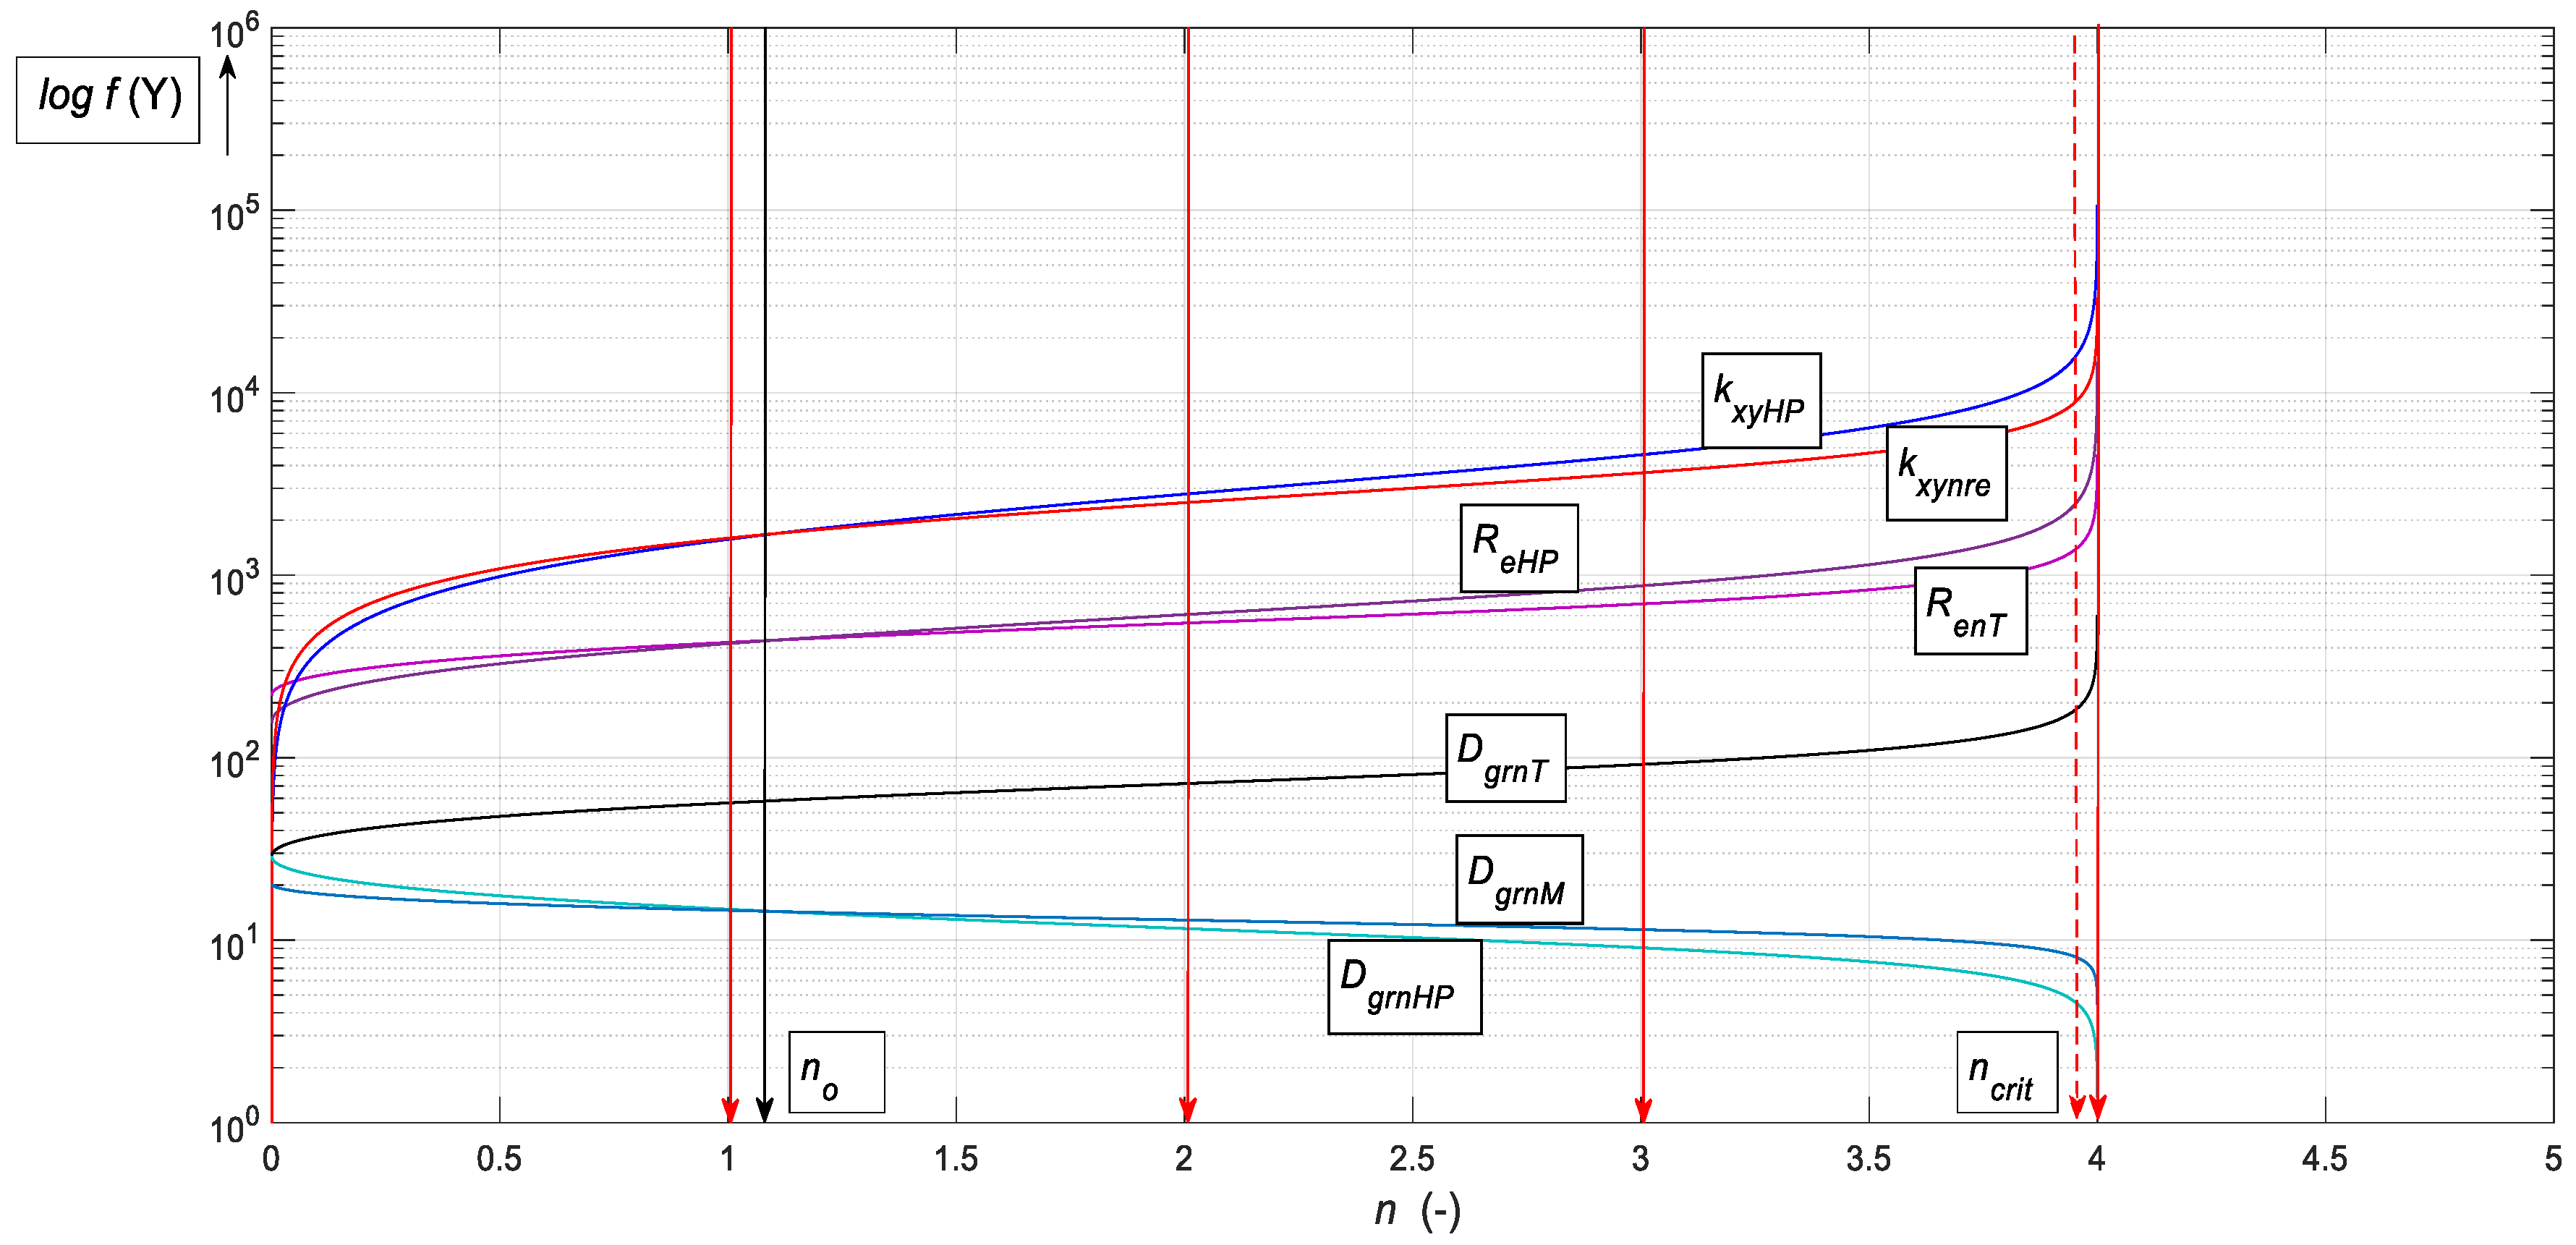
5. Verification by Hall–Petch Relation
Due to the importance and continuing widespread use in engineering practice, a detailed verification comparison was made to Equation (1) for the specific case of the presented experiment and the presented theory according to the Hall–Petch relation. It is graphically represented by the graph in
Figure 18.
On the neutral plane, the material constant kxy for the value determined by Re is equal to the material constant according to the Hall–Petch relation kxynreo = kxyhpno = 1.672, while the yield point according to Hall–Petch is equal to the yield point according to the relation determined by ReHPo = RenT = 219 MPa; thus, for the relative plastic deformation of the structural grains on the neutral level Ren, εnreo = 1 applies.
For the material constant on the neutral plane, Equation (31) applies:
For the transformed material constant, Equations (32) and (33) apply:
For the transformed material constant, which reflects the relative plastic deformation, Equations (34) and (35) apply:
As shown in the graph in
Figure 18, systematic differentiation results for all the functions are compared. It can be seen that identical values are obtained at the level of the neutral parameter
no. This systematic difference is related to the opinions of a number of experts who point out a certain inaccuracy of the calculations according to (1) in regions of a very small structural grain size compared to larger grain size.
One of the critics of the Hall–Petch relation (1) is Meshal Y. Alawadhi [
26]. Therefore, a comparison of the presented results according to [
26] in parameter
kxy from Equation (1) and also according to
kxynre by the authors’ equation (33) was also made. In the original [
20], one can also find support in the laboratory measurements in the plots in
Figure 8 and
Figure 9. All the results presented are correlated.
6. Conclusions
The aim of the presented publication was to investigate the structural and mechanical changes of the selected material, namely aluminium alloy EN AW 6060, after processing by the ECAP method. Based on the experimental results obtained, it is then possible to describe the physical–mechanical principle of the process for the exact design, measurement control, and strengthening of the material for applications in engineering practice analytically.
Due to its relative ductility at room temperature, the investigated aluminium alloy is ideal for channel extrusion using the ECAP method, namely through a rectangular extrusion channel. It has been confirmed that the chosen extrusion route C, where the sample is rotated 180° after each pass, can create a homogeneous fine-grained structure in the material and provide relatively uniform deformation throughout the sample volume. After metallographic investigation, changes in the grain size and shape were observed. The mean grain size decreased from a value of 28.9 µm in the original material to 4.63 µm after the fourth ECAP pass, with a corresponding decrease in ductility from 22.5% to 13.6% and an increase in strength from 210 MPa to 304 MPa.
This refinement of the microstructure after processing by the ECAP method is the reason for the changes in mechanical properties. After the first extrusion, it has been shown that there is already a significant improvement in strength and toughness and a significant reduction in ductility. After further extrusions, these values changed to only a small extent until the fourth extrusion, when the strength and flexibility of the material decreased slightly due to the appearance of micro-cracks.
By investigating the relationship between the development of a structural and mechanical material change during the extrusion of the AlMgSi0.5 alloy by ECAP with respect to the use of knowledge in the design phase, extrusion technology can be designed and controlled more effectively to achieve the desired grain size and material hardening based on the newly acquired knowledge.
In summary, the following results were achieved:
Regression equations were developed based on the tensile test measurements (5)–(8);
On the basis of the explicit Equation (9), mathematical functions for the analytical solution of the process were successively derived in order to predict (10)–(30);
Graphical comparisons of measured and theoretical values in decadic logarithms were performed (
Figure 15), showing an excellent consensus of the compared data, namely within 5%;
Verification comparison with the Hall–Petch relation was performed, from which new prediction Equations (31)–(35) were obtained.
Nanostructured metallic materials undoubtedly lead to new directions in the fabrication of complex-shaped micro components for microdevices. Aluminium alloys with a more ultrafine microstructure show enhanced static and cyclic strength, a higher strength-to-weight ratio, as well as more extensive application and multifunctional properties. For these reasons, they are increasingly in demand as structural and functional materials in various engineering sectors. Extensive current and future use areas continue to include aerospace, construction, automotive, military, and electronics.


 ,
, 


