
Experimental Investigation on the Breaching Process of Landslide Dams with Differing Materials under Different Inflow Conditions


Abstract
1. Introduction
2. Flume Tests on Landslide Dams
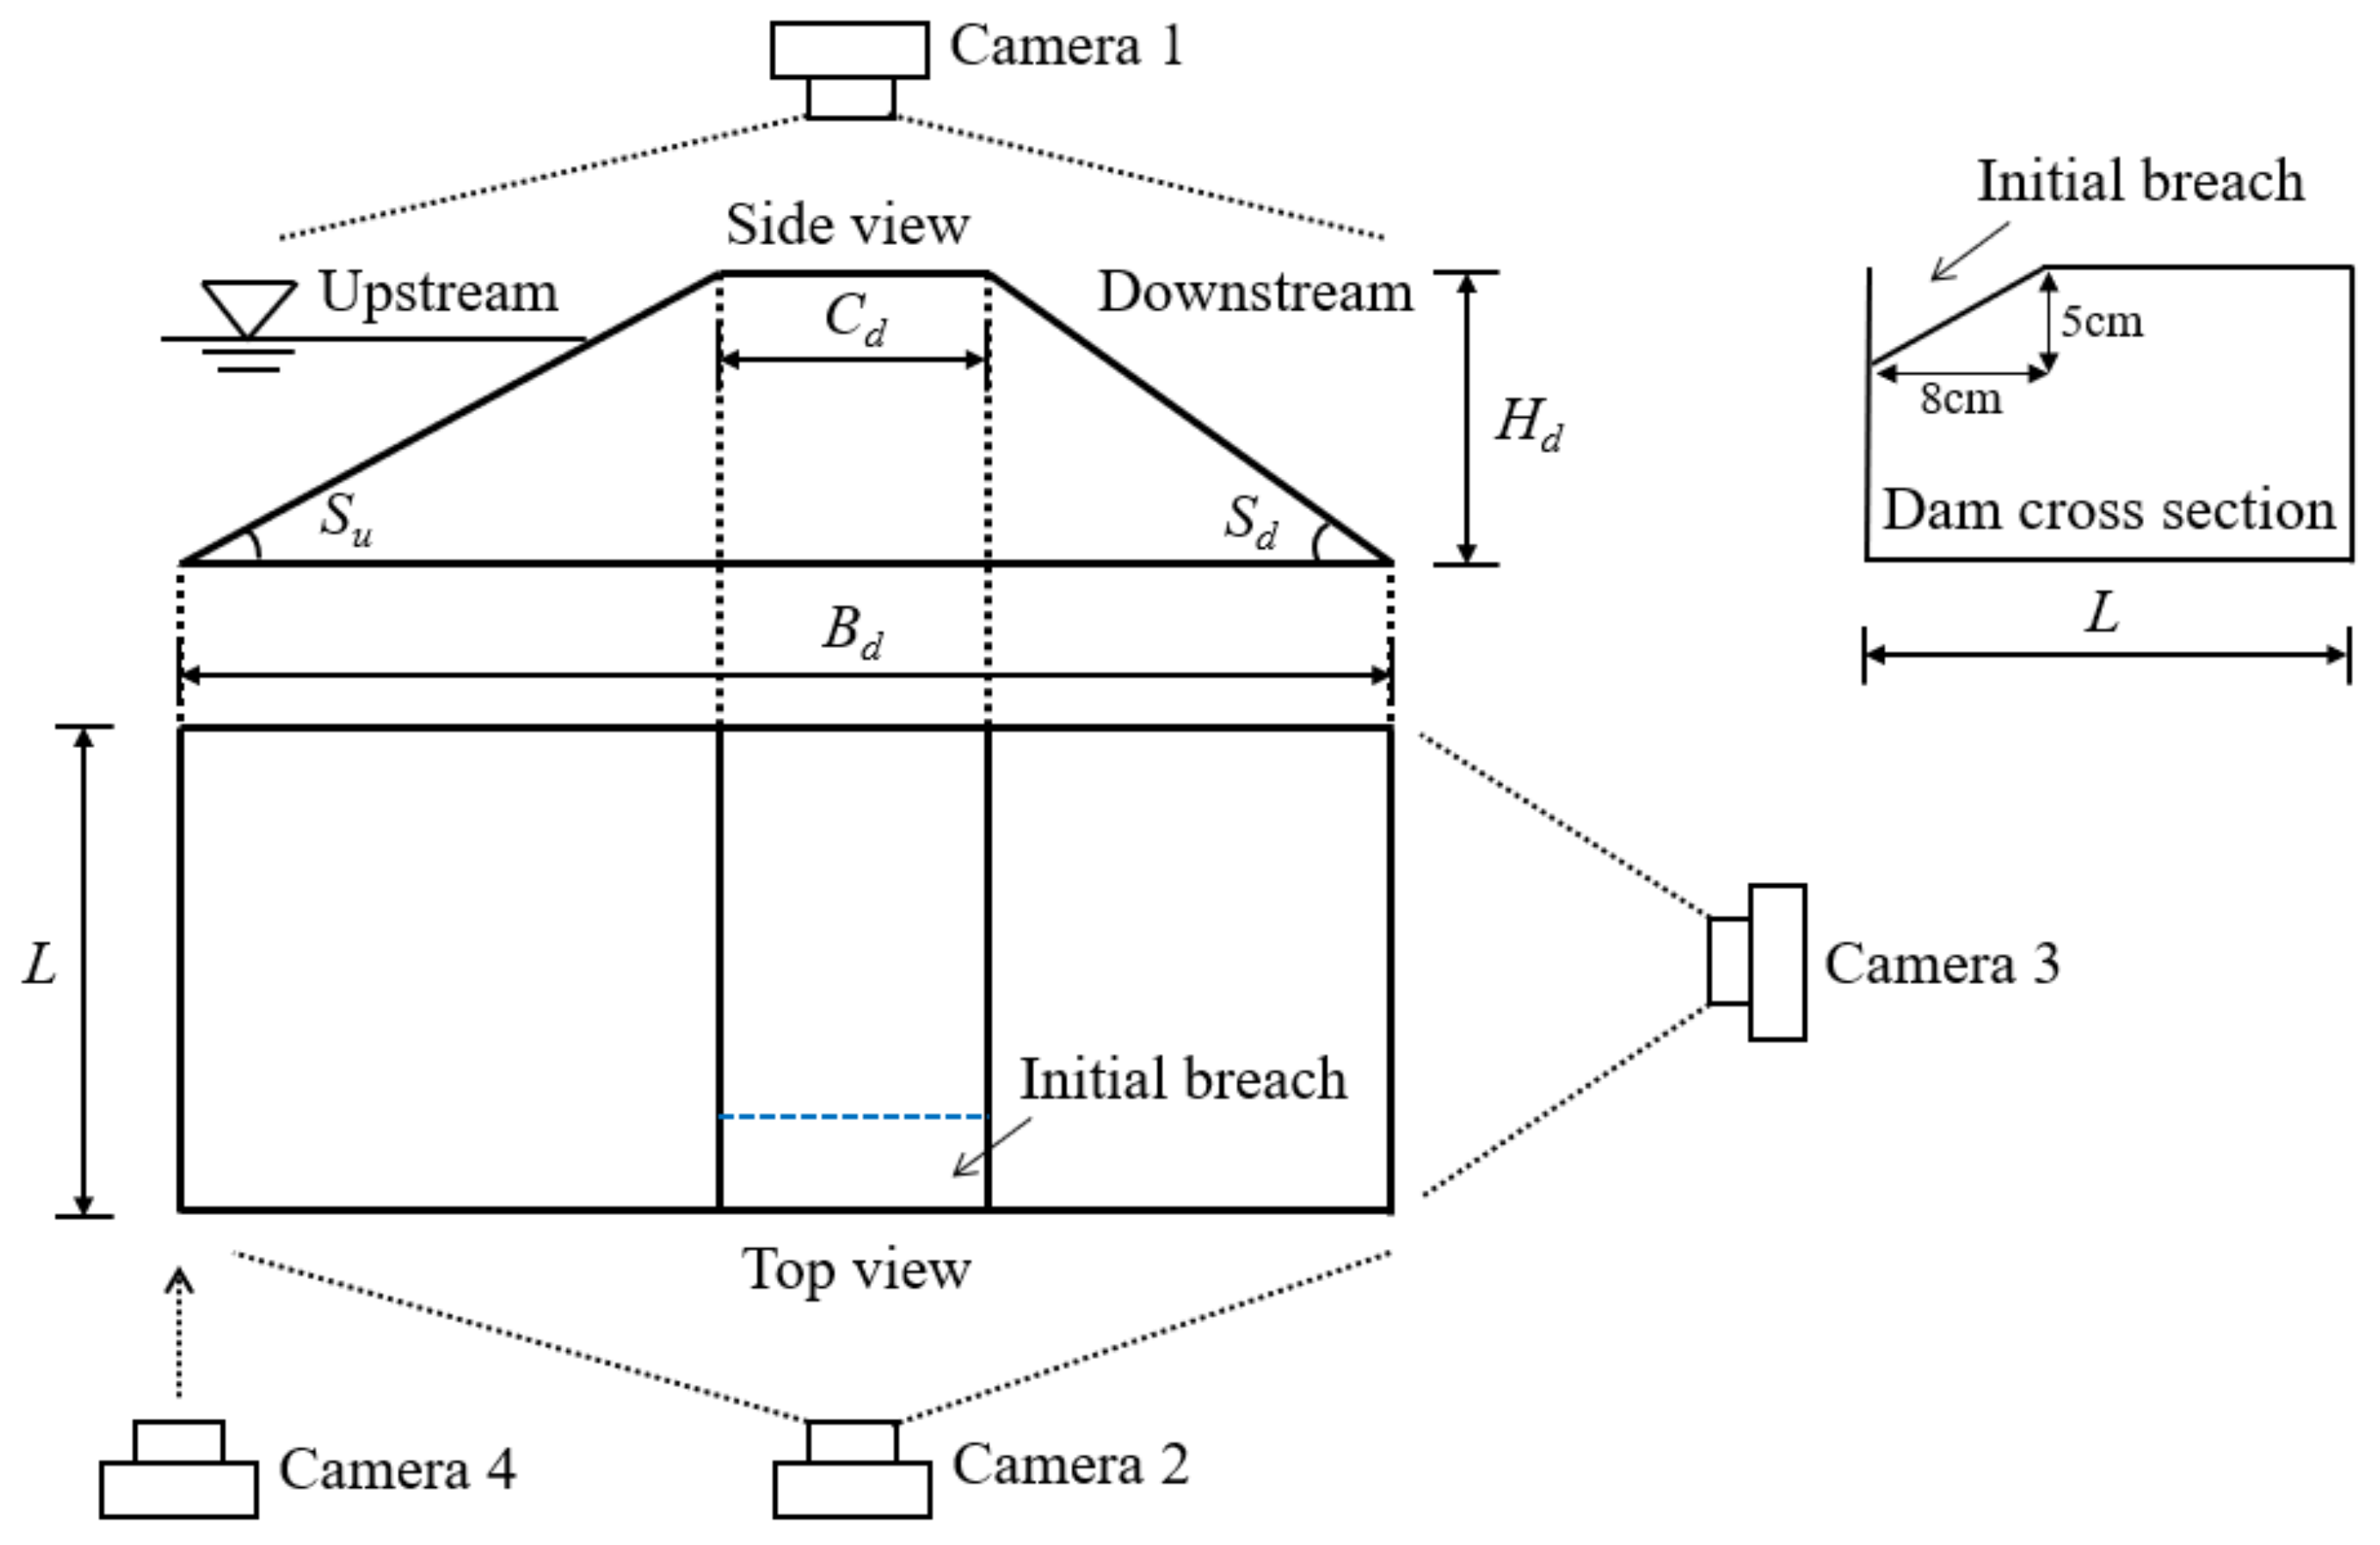
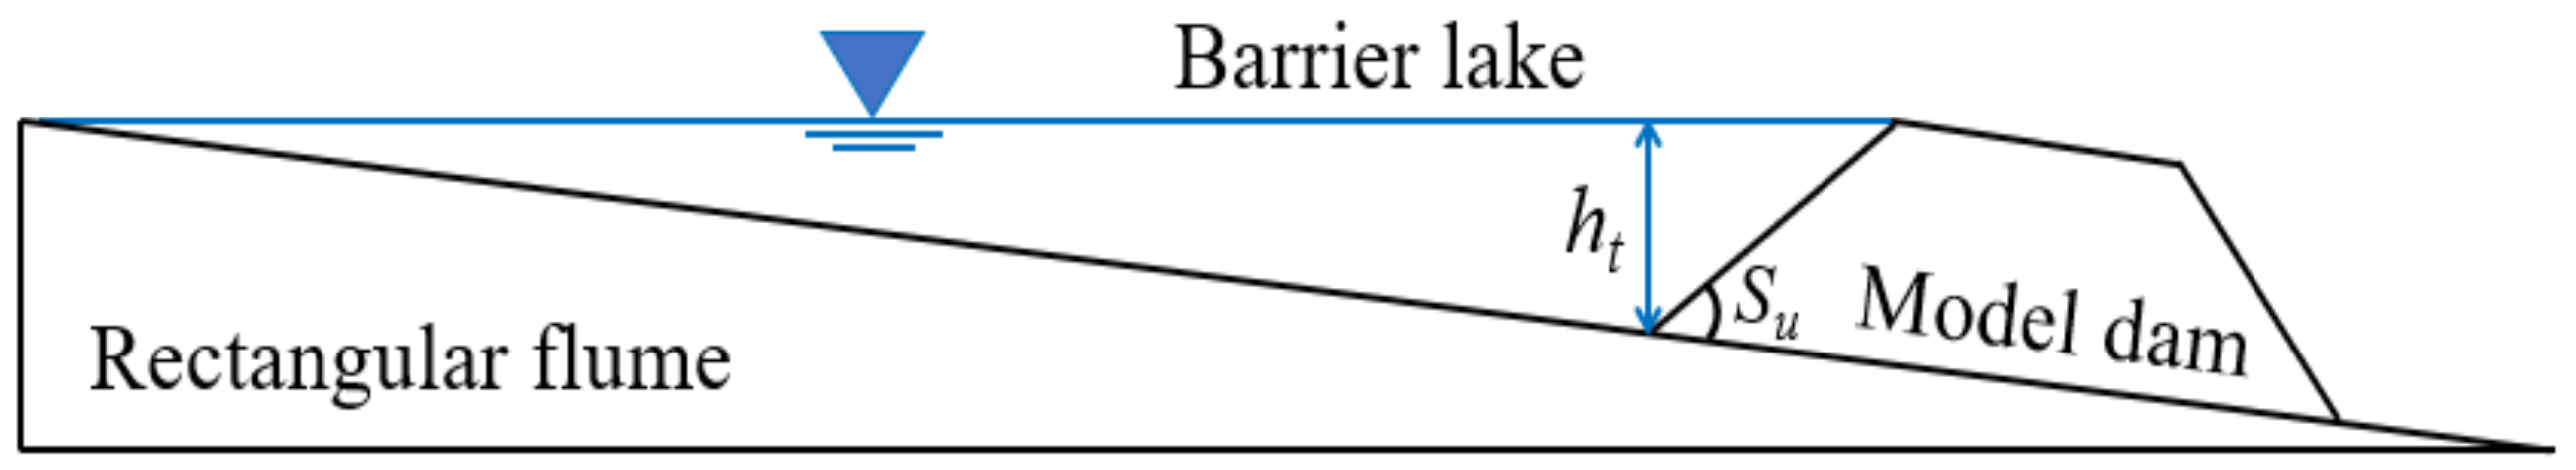
2.1. Experimental Setup
2.2. Model Dam
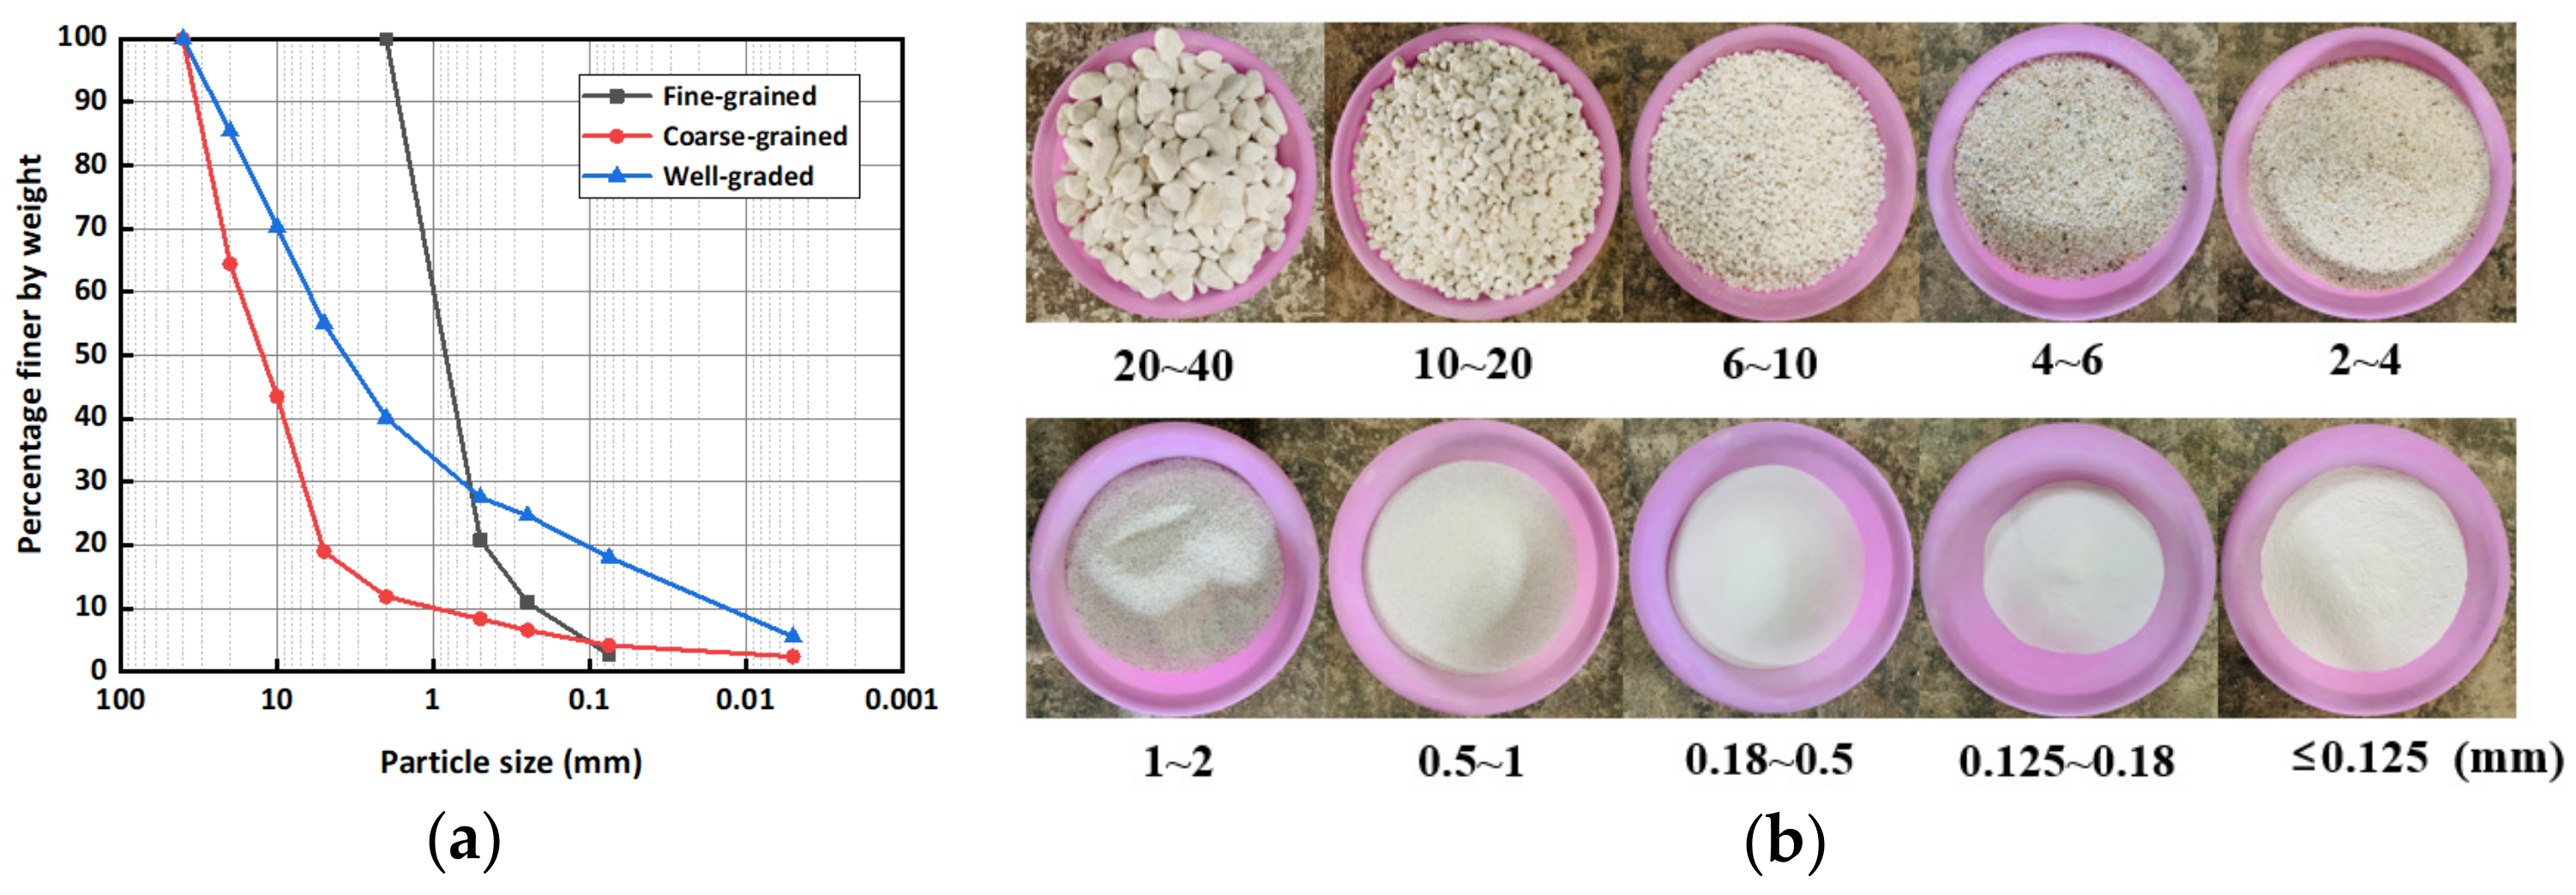
2.3. Dam Material
2.4. Measurements
2.5. Experimental Procedure
- (1)
- Experimental preparation. The dam outline and transparent grid were pasted on the flume sidewall according to the geometry of the predesigned dam.
- (2)
- Dam construction. The model dam was built in three layers based on the contour line with 8 cm thick in each floor by using a density control method (ρd = 1780 kg/m3). Every layer was fully compacted by slightly tapping to obtain the required dry density. After the model dam was constructed, the dam crest surface was carefully smoothed and leveled, and then, an initial breach was excavated adjacent to the flume sidewall.
- (3)
- Data capture. The digital cameras and steel rulers were installed at their specified positions. The videos and images collected by the four cameras were autosaved on a computer during each test.
- (4)
- Water inpouring. The water flooding pump operated after the reservoir was full of water. The inflow discharge was maintained at the predesigned rate during each test by means of the electromagnetic flowmeter.
- (5)
- Dam processing. After the dam either absolutely failed or remained stable for more than 1 h, the test was considered to be terminated. The flow supply device and cameras were stopped. The residual dam from the channel was fully removed, and a new model dam was constructed for the next test.
3. Experimental Results
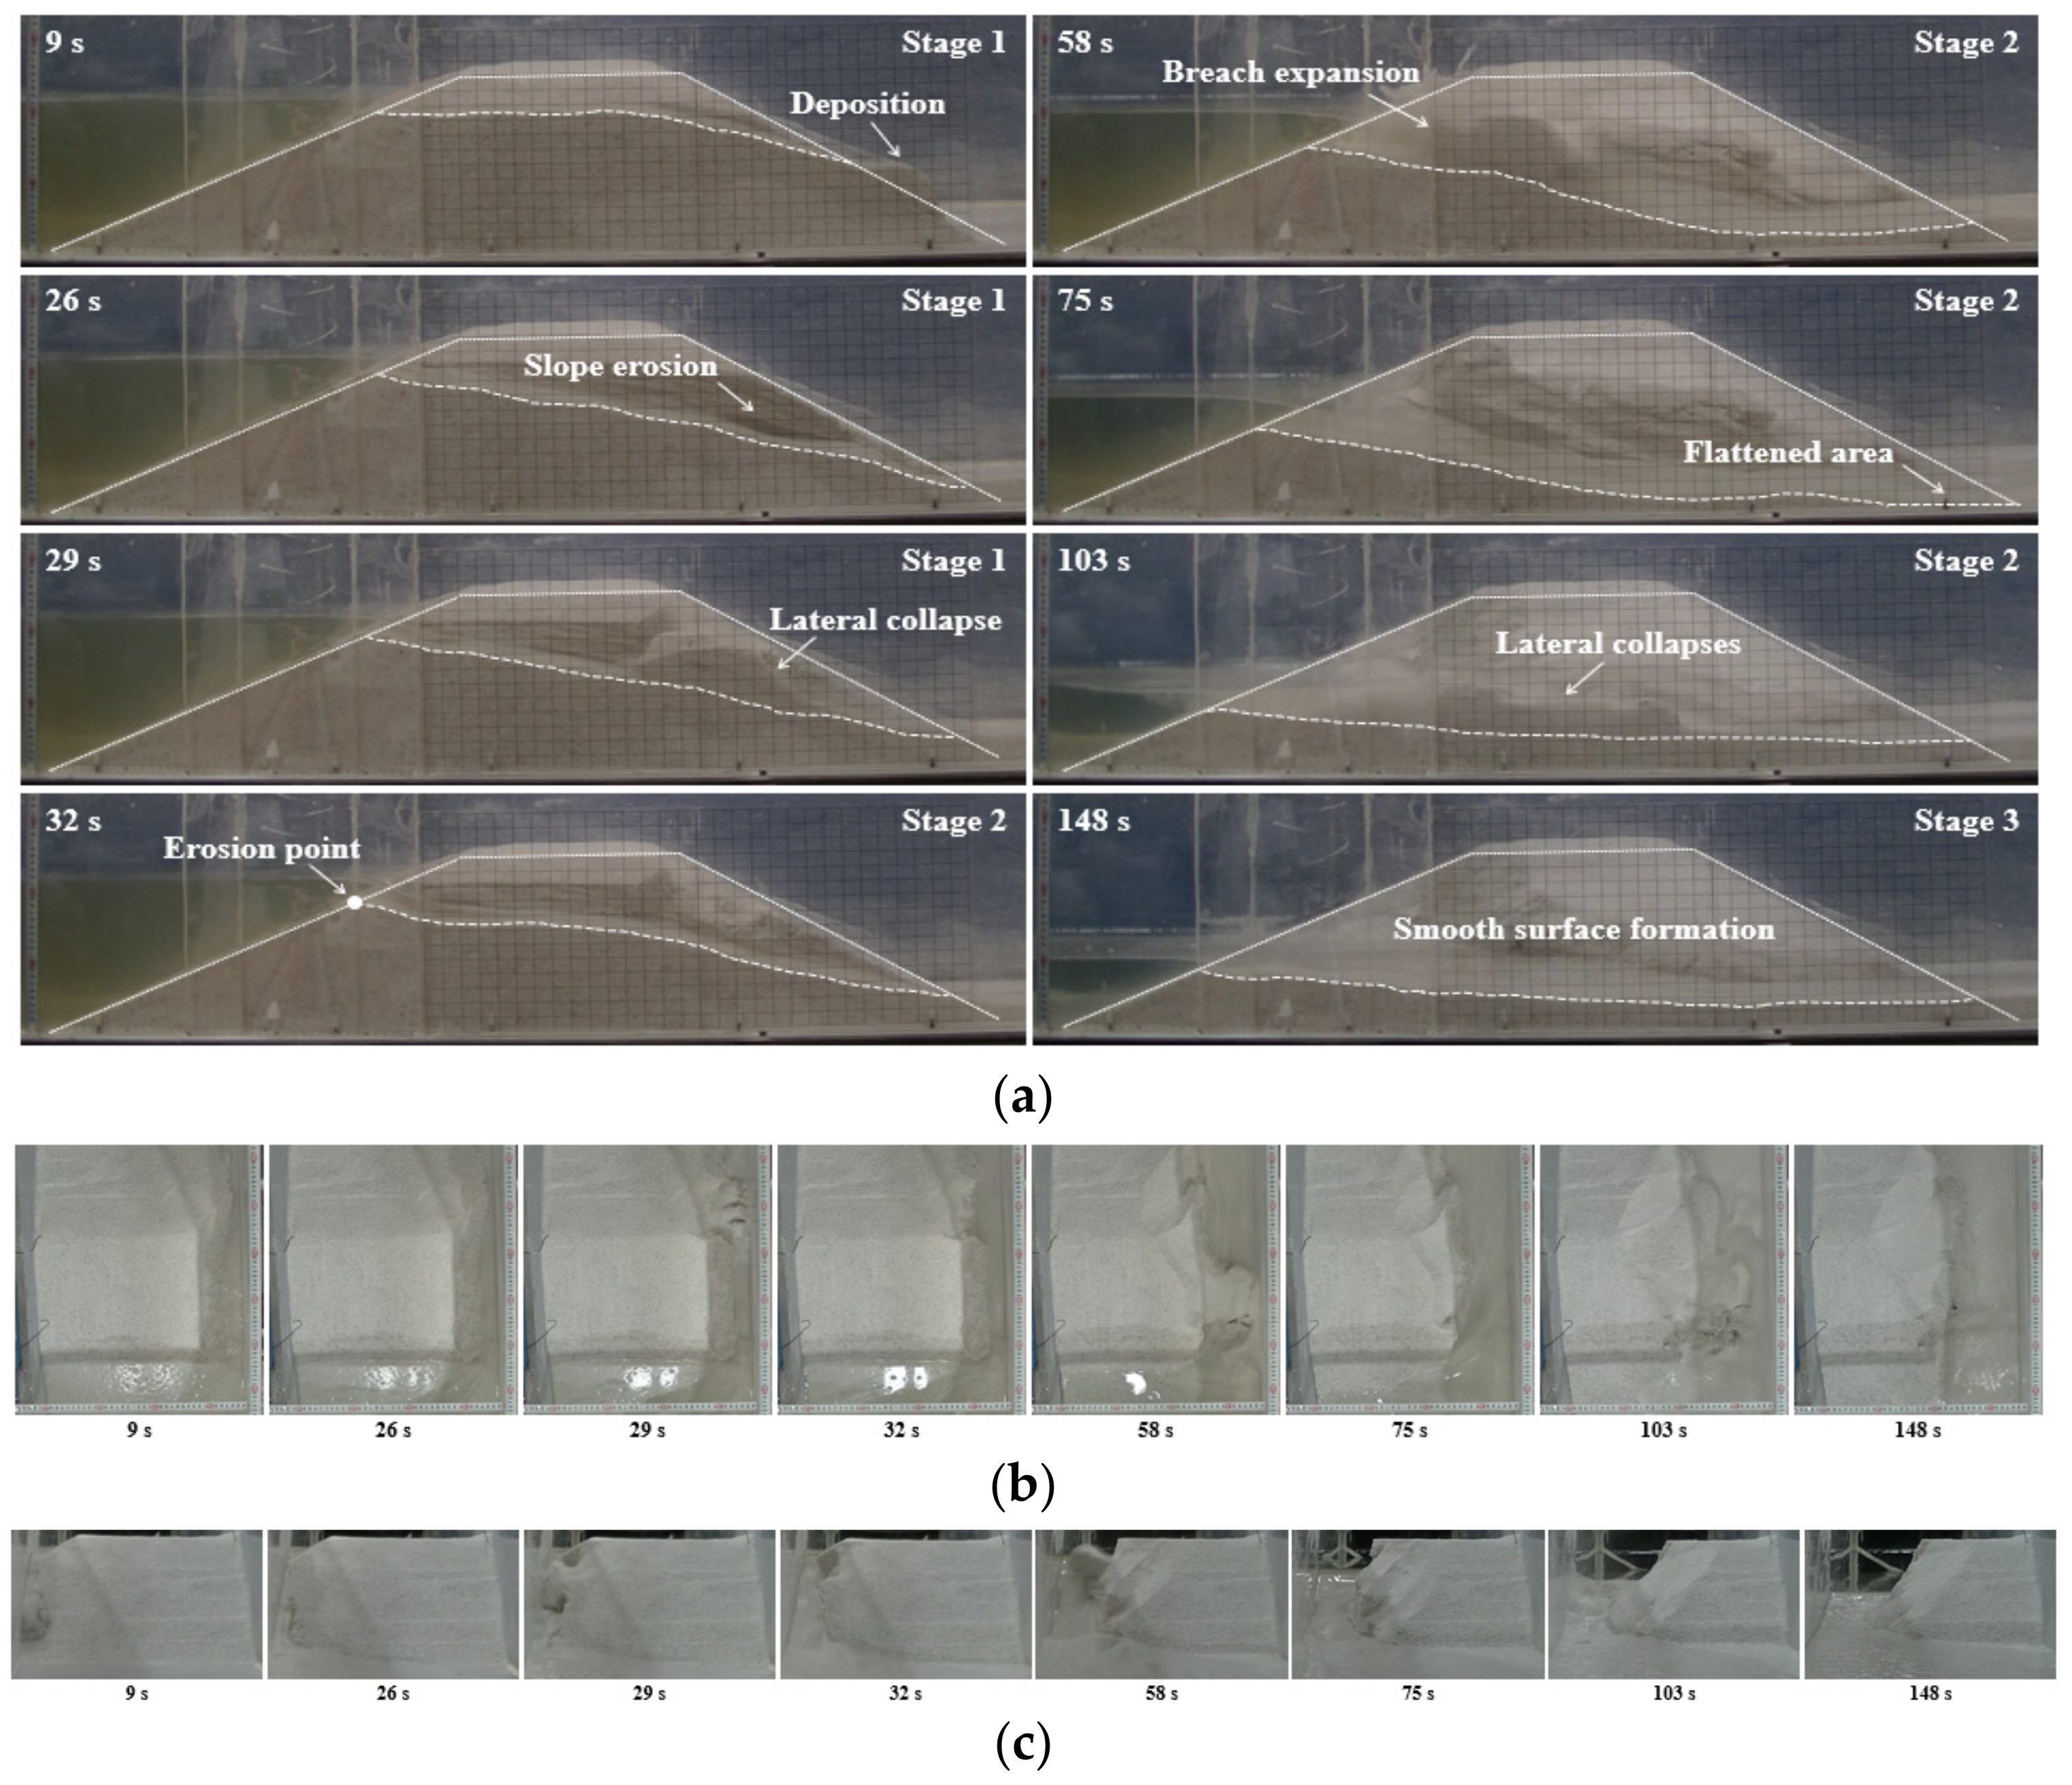
3.1. General Features
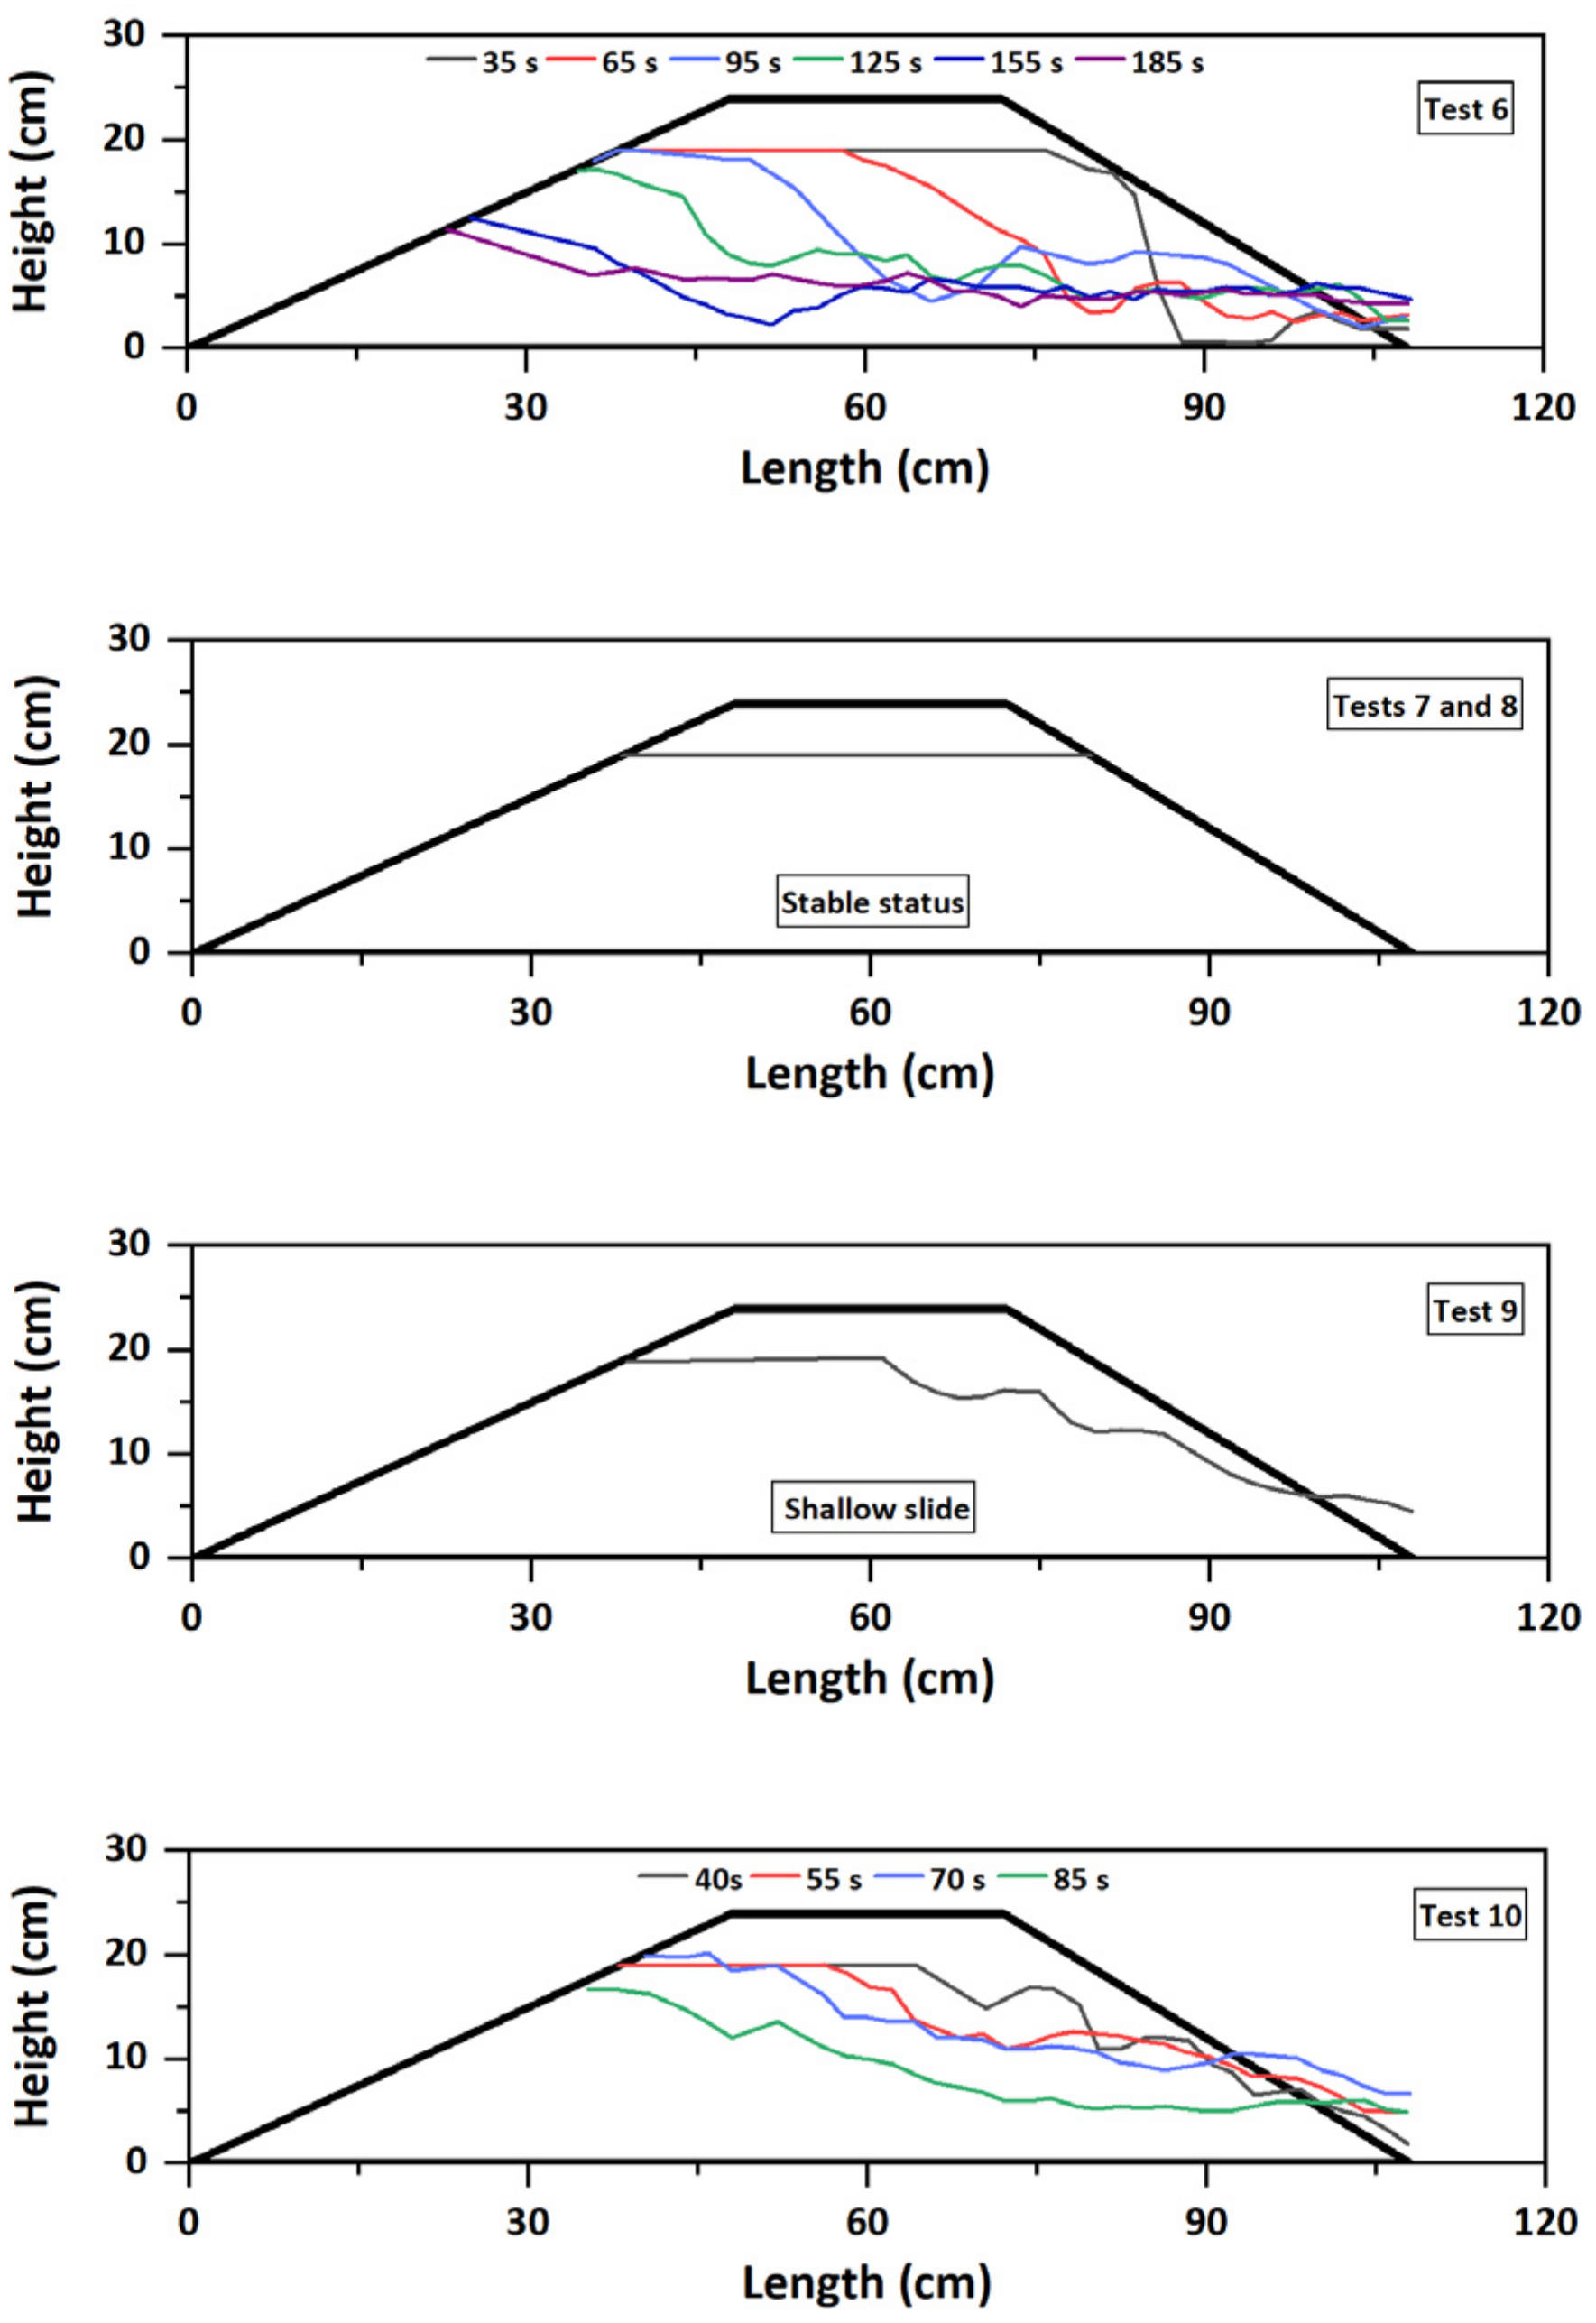
3.1.1. Fine-Grained Dams
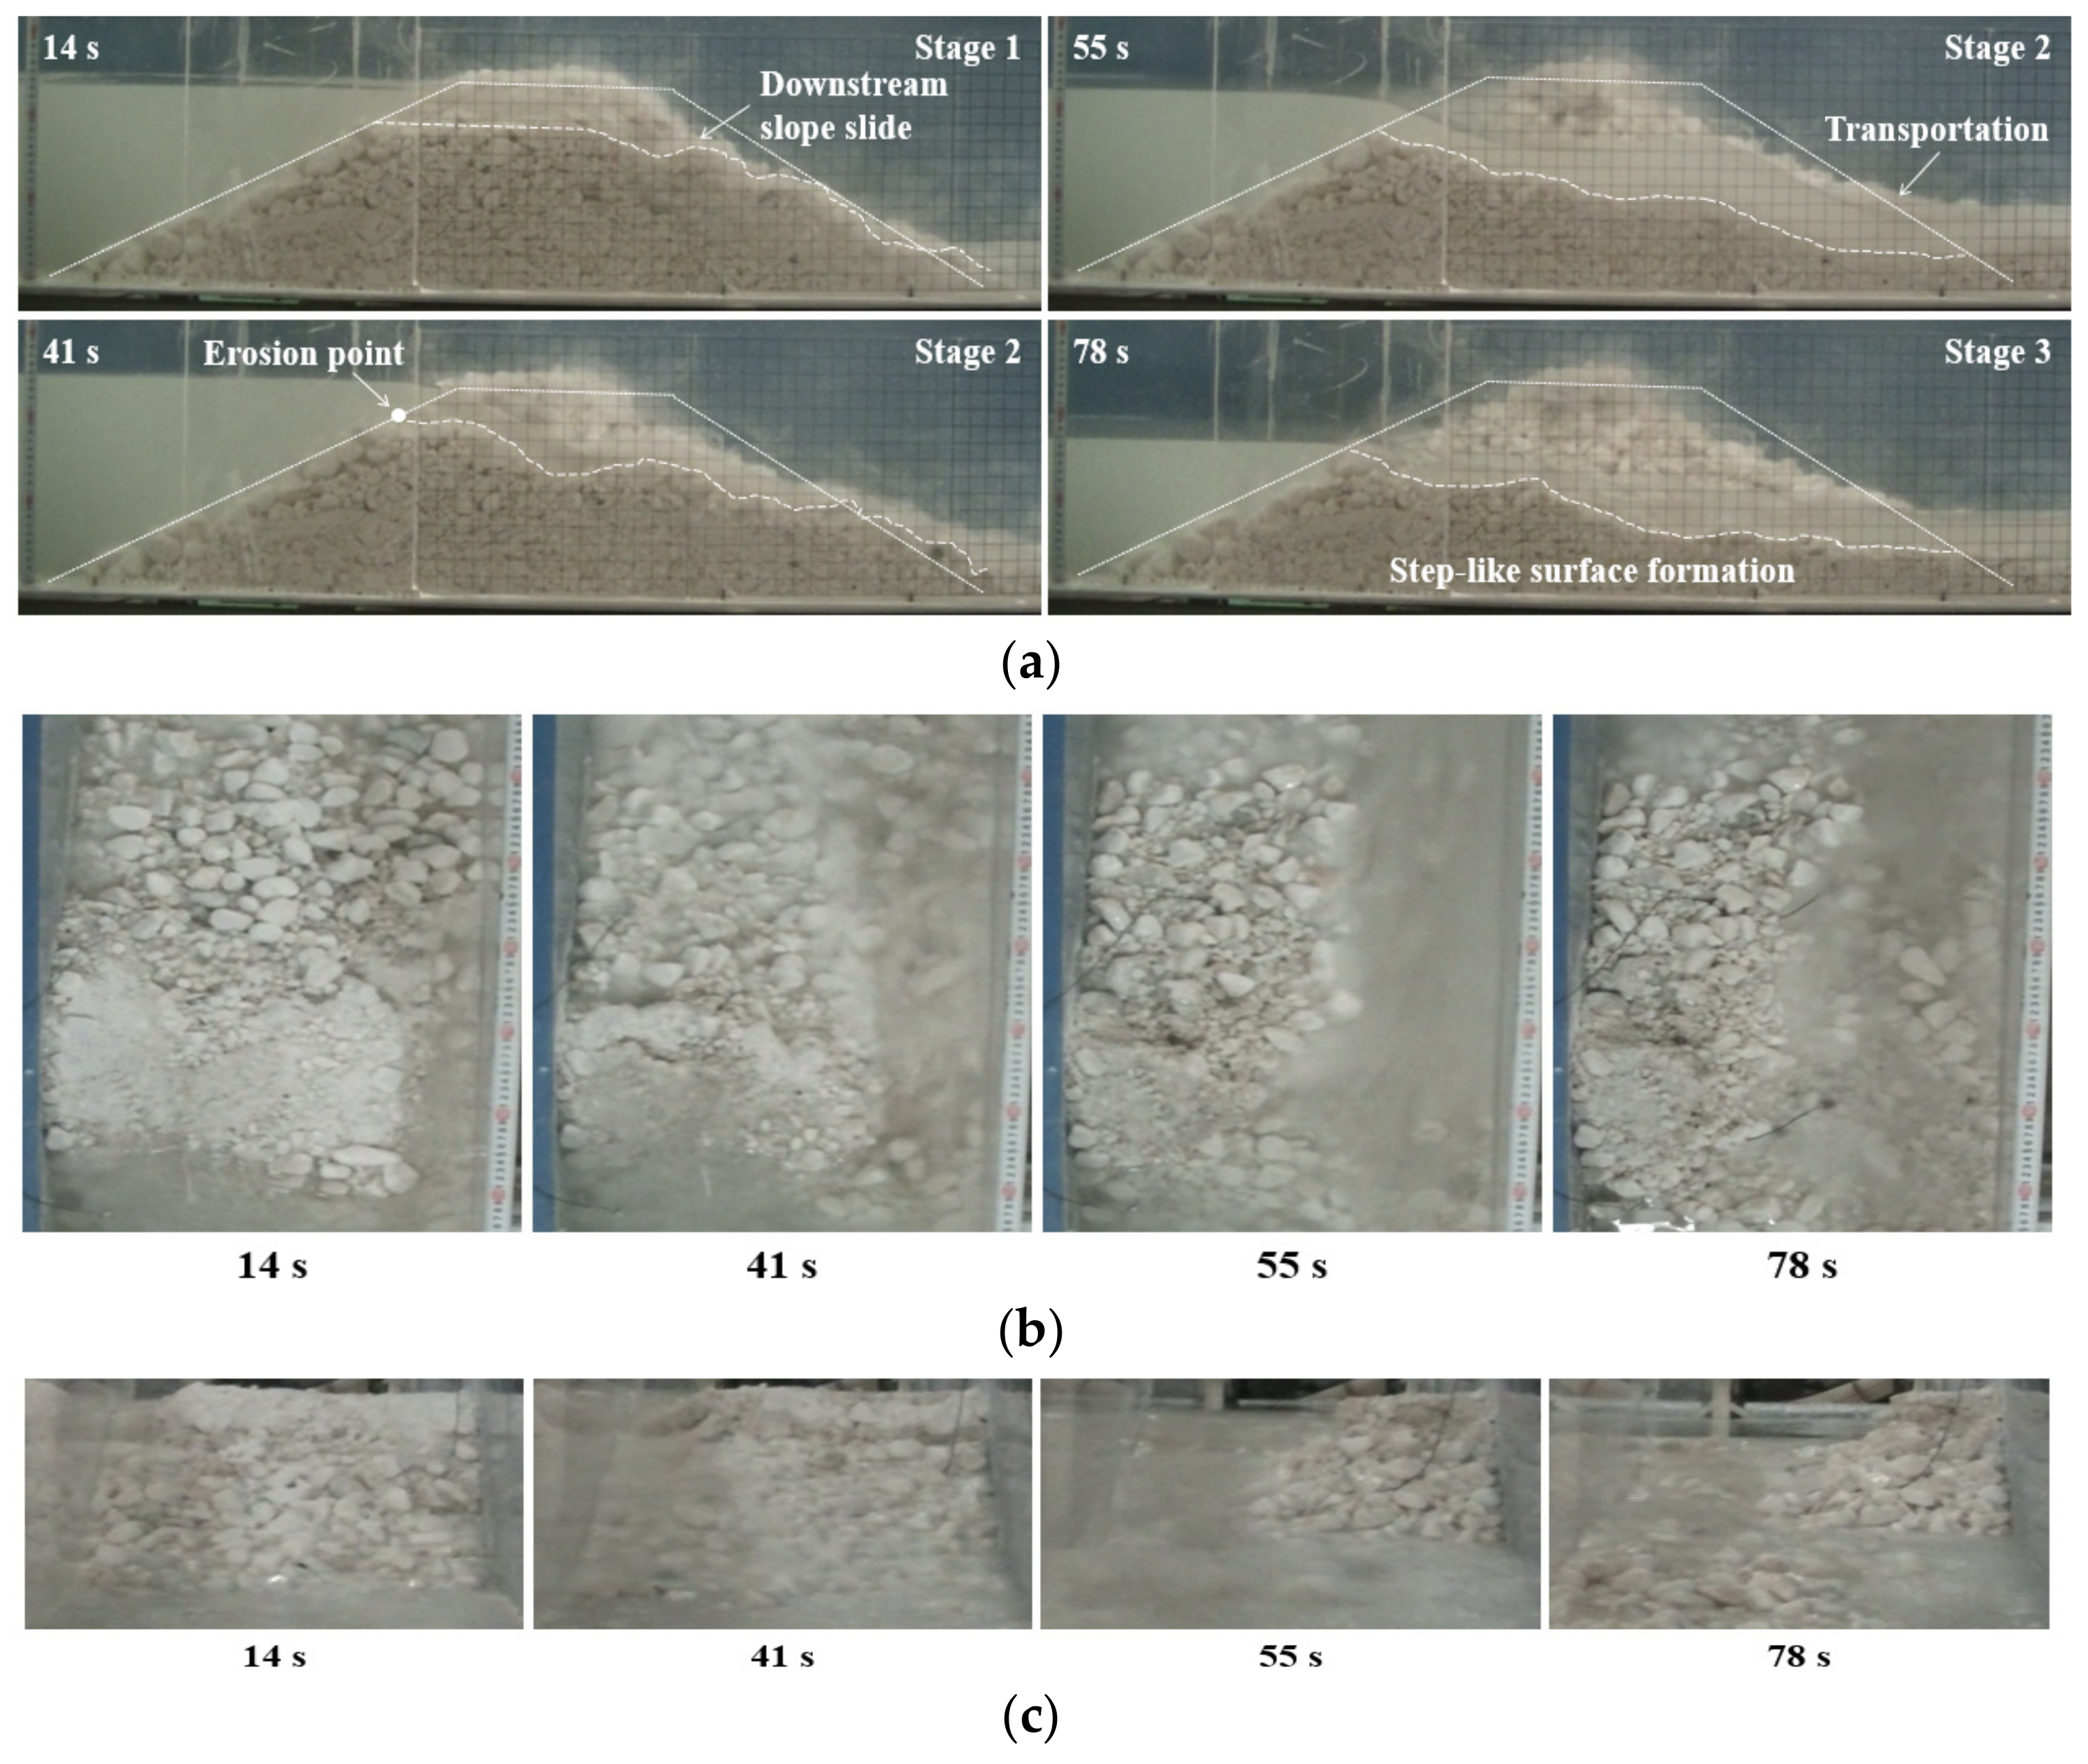
3.1.2. Well-Graded Dams
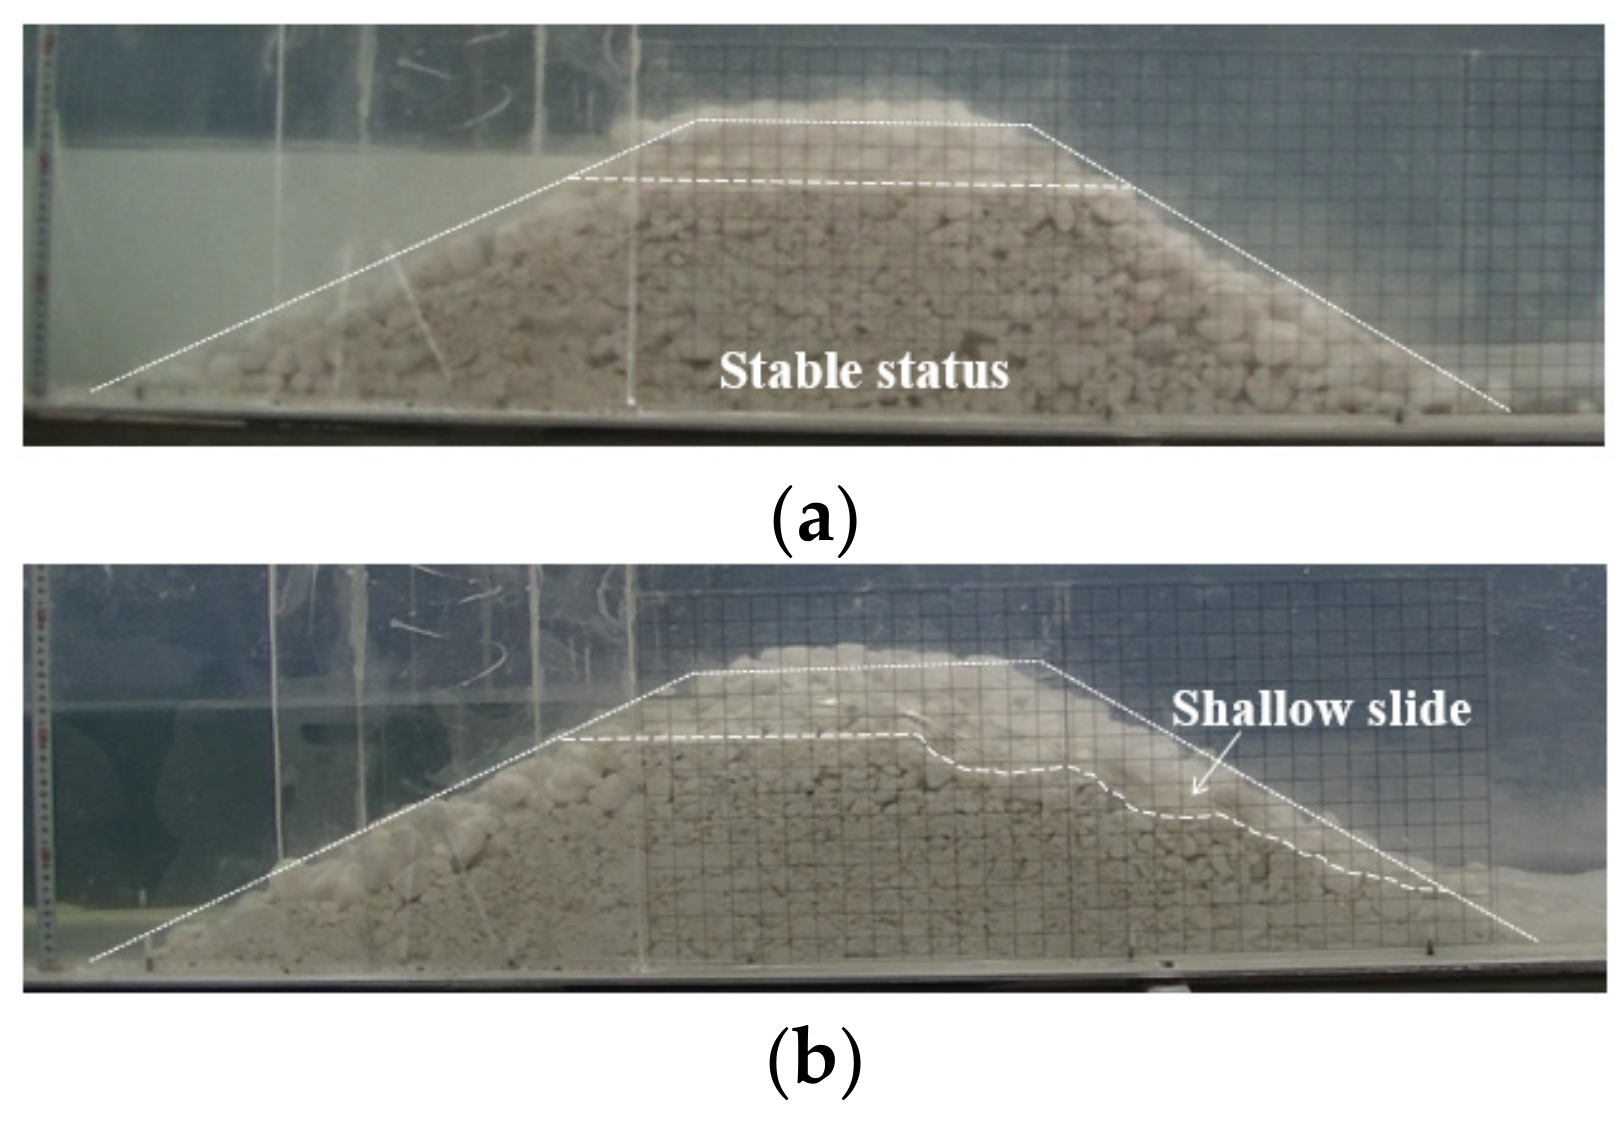
3.1.3. Coarse-Grained Dams
3.2. Comparison of the Failure Modes
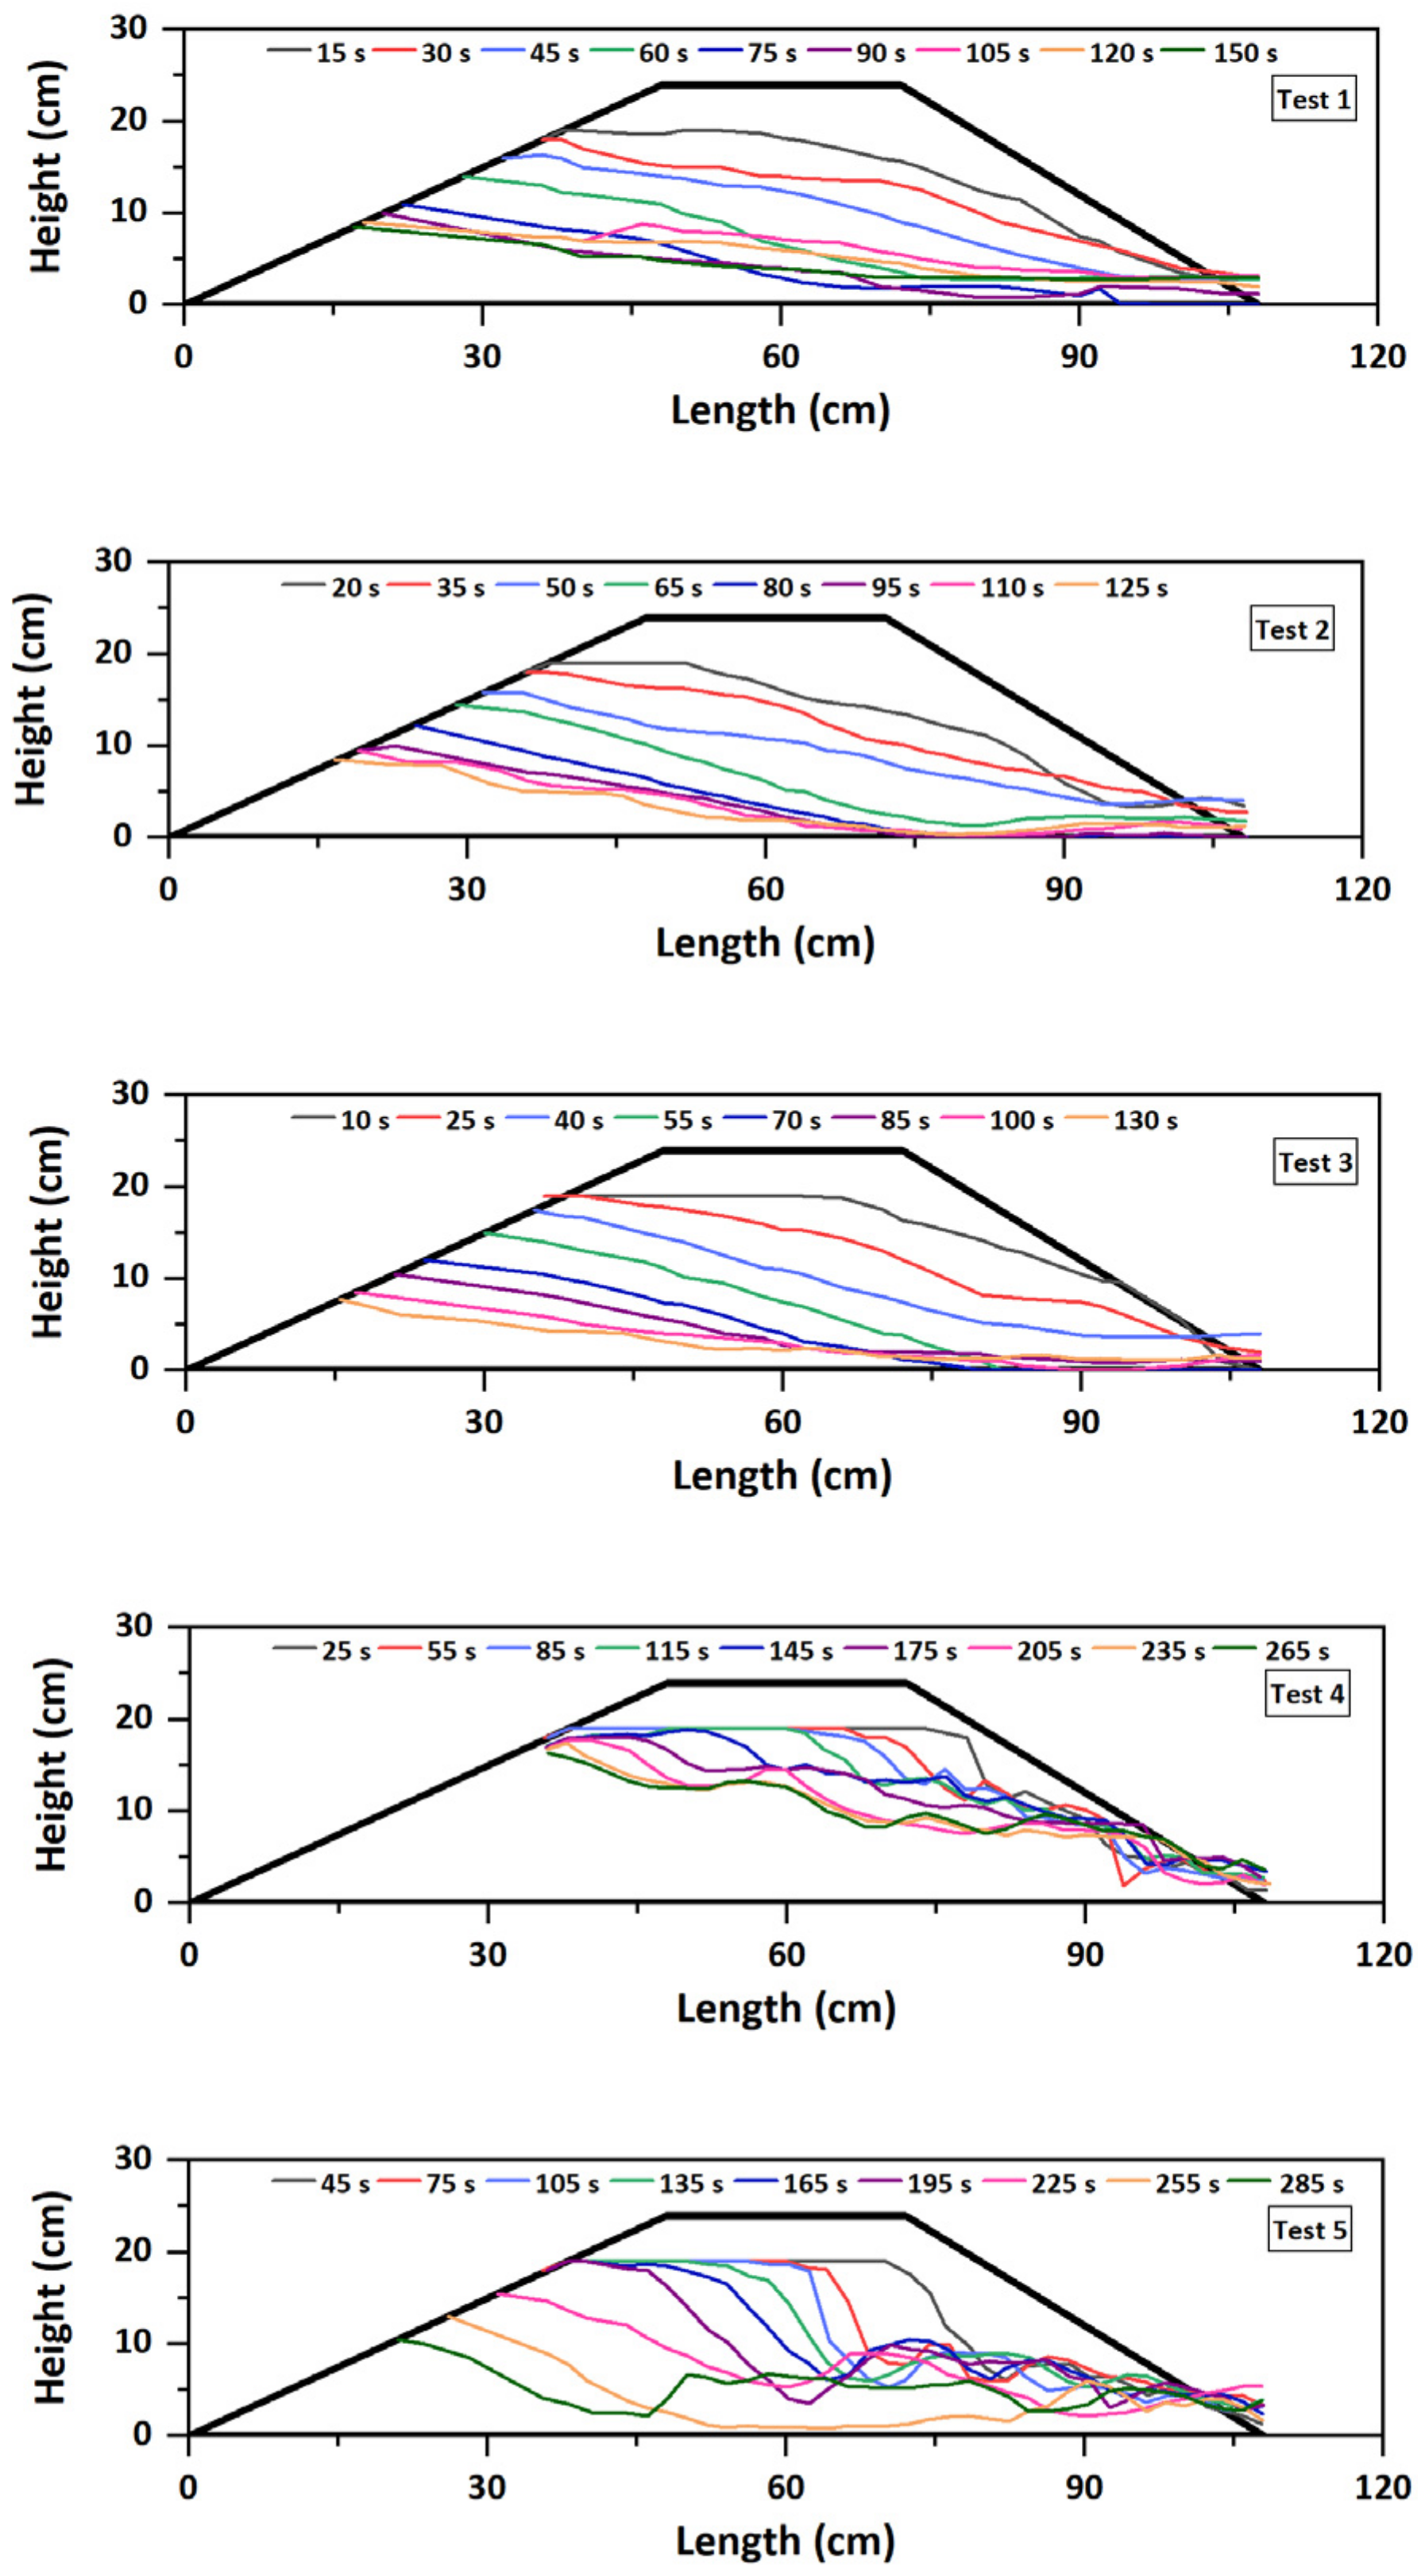
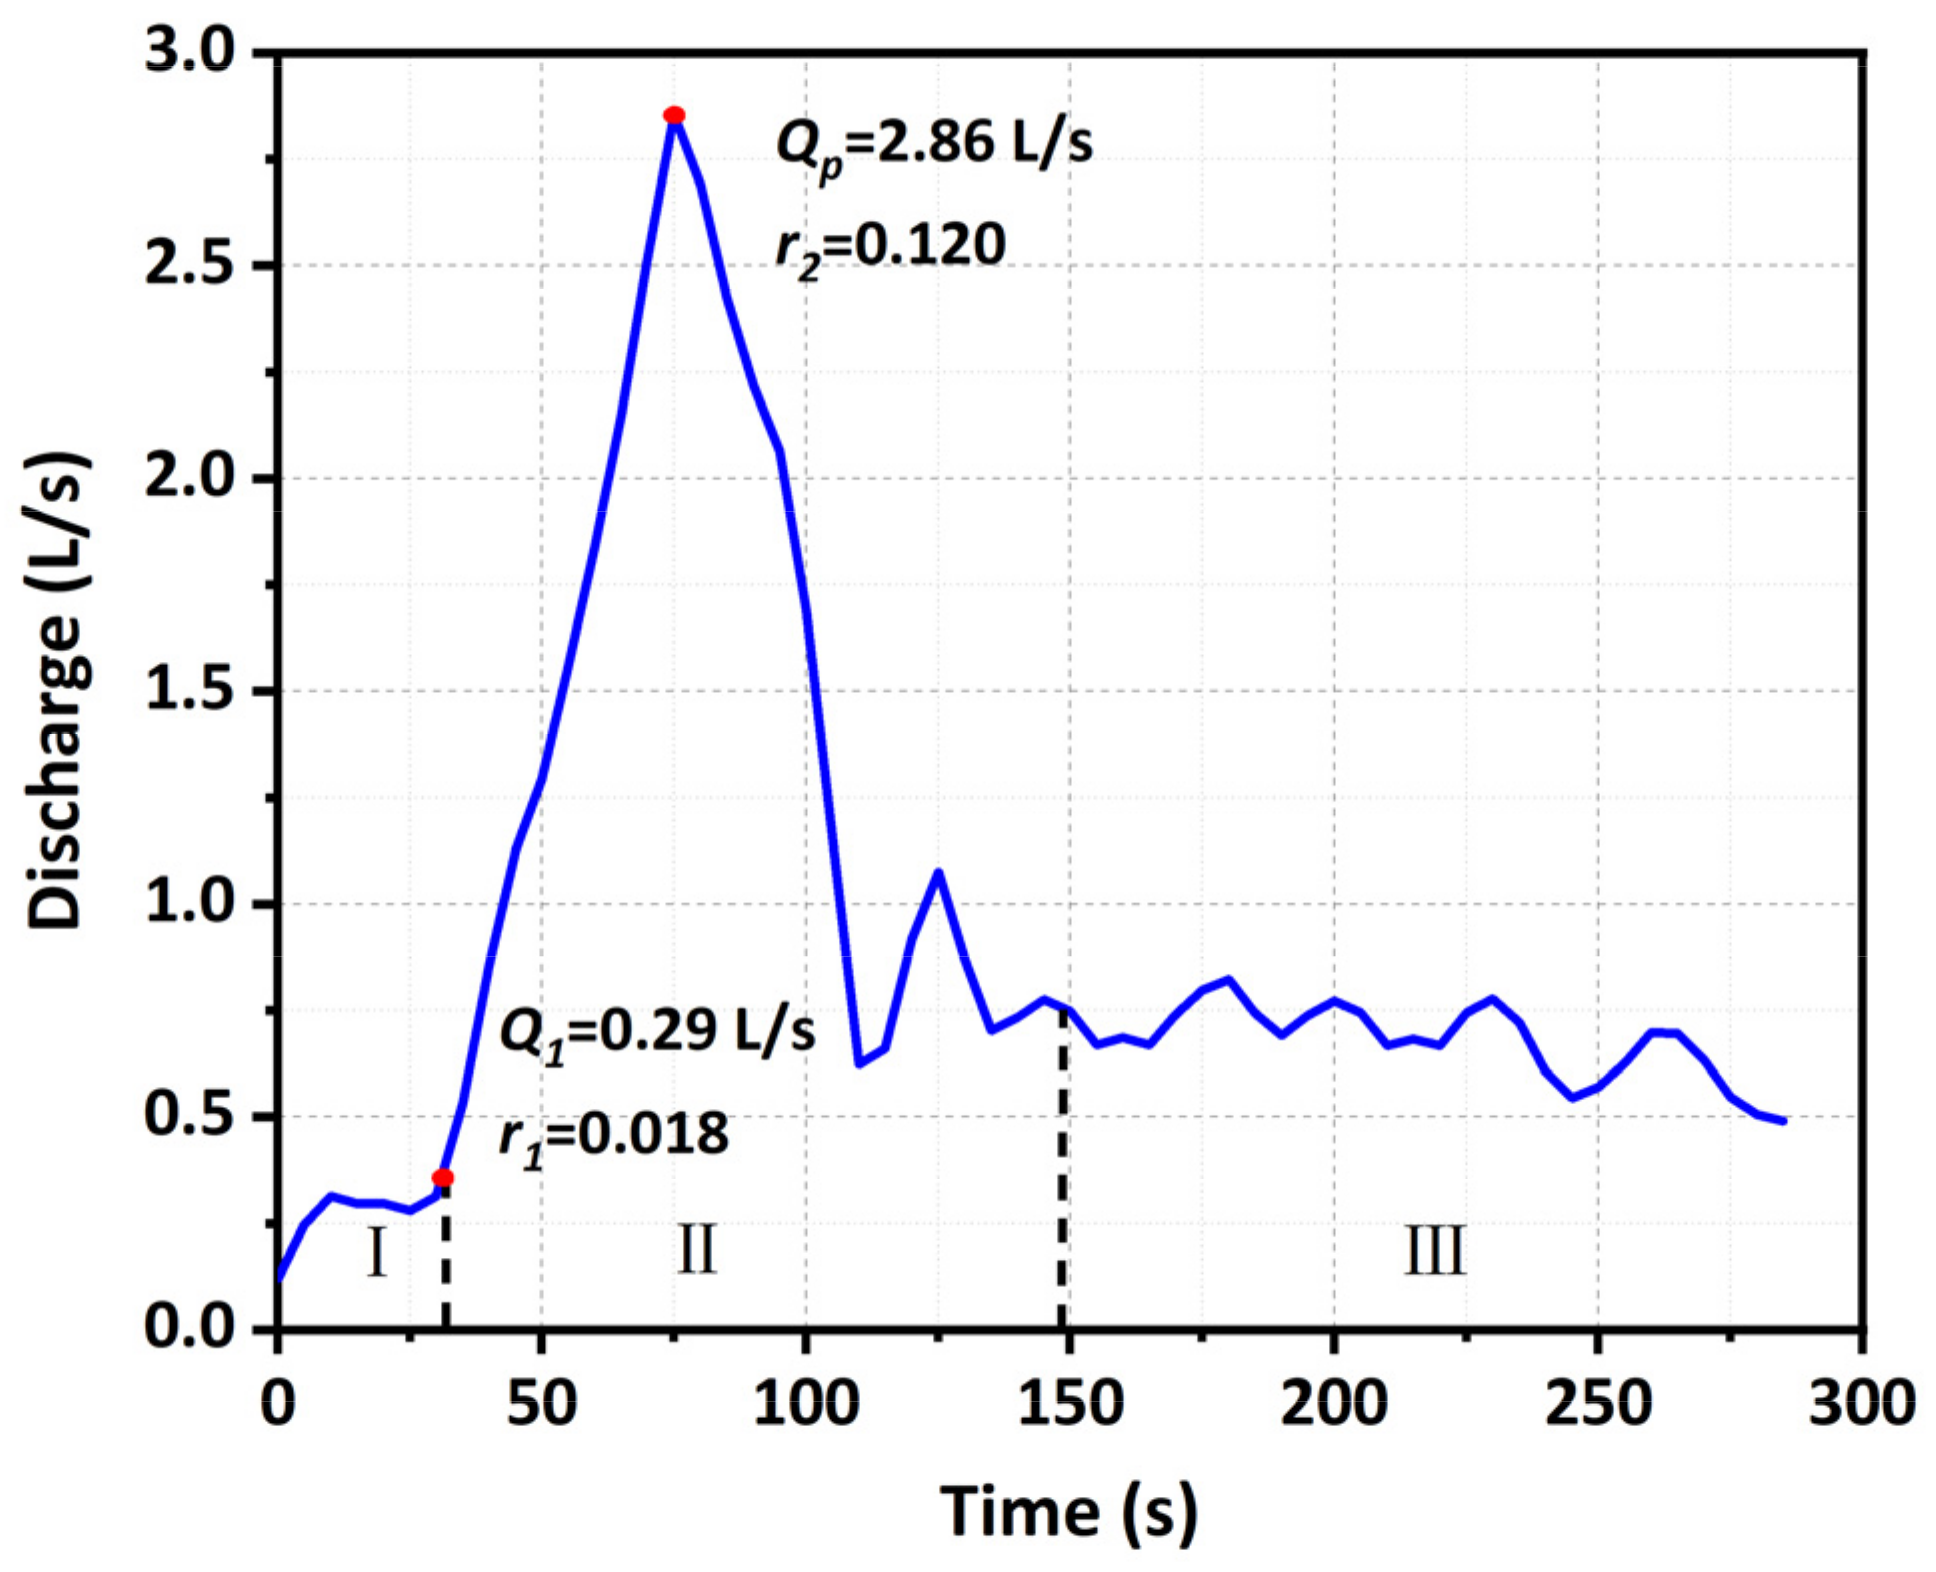
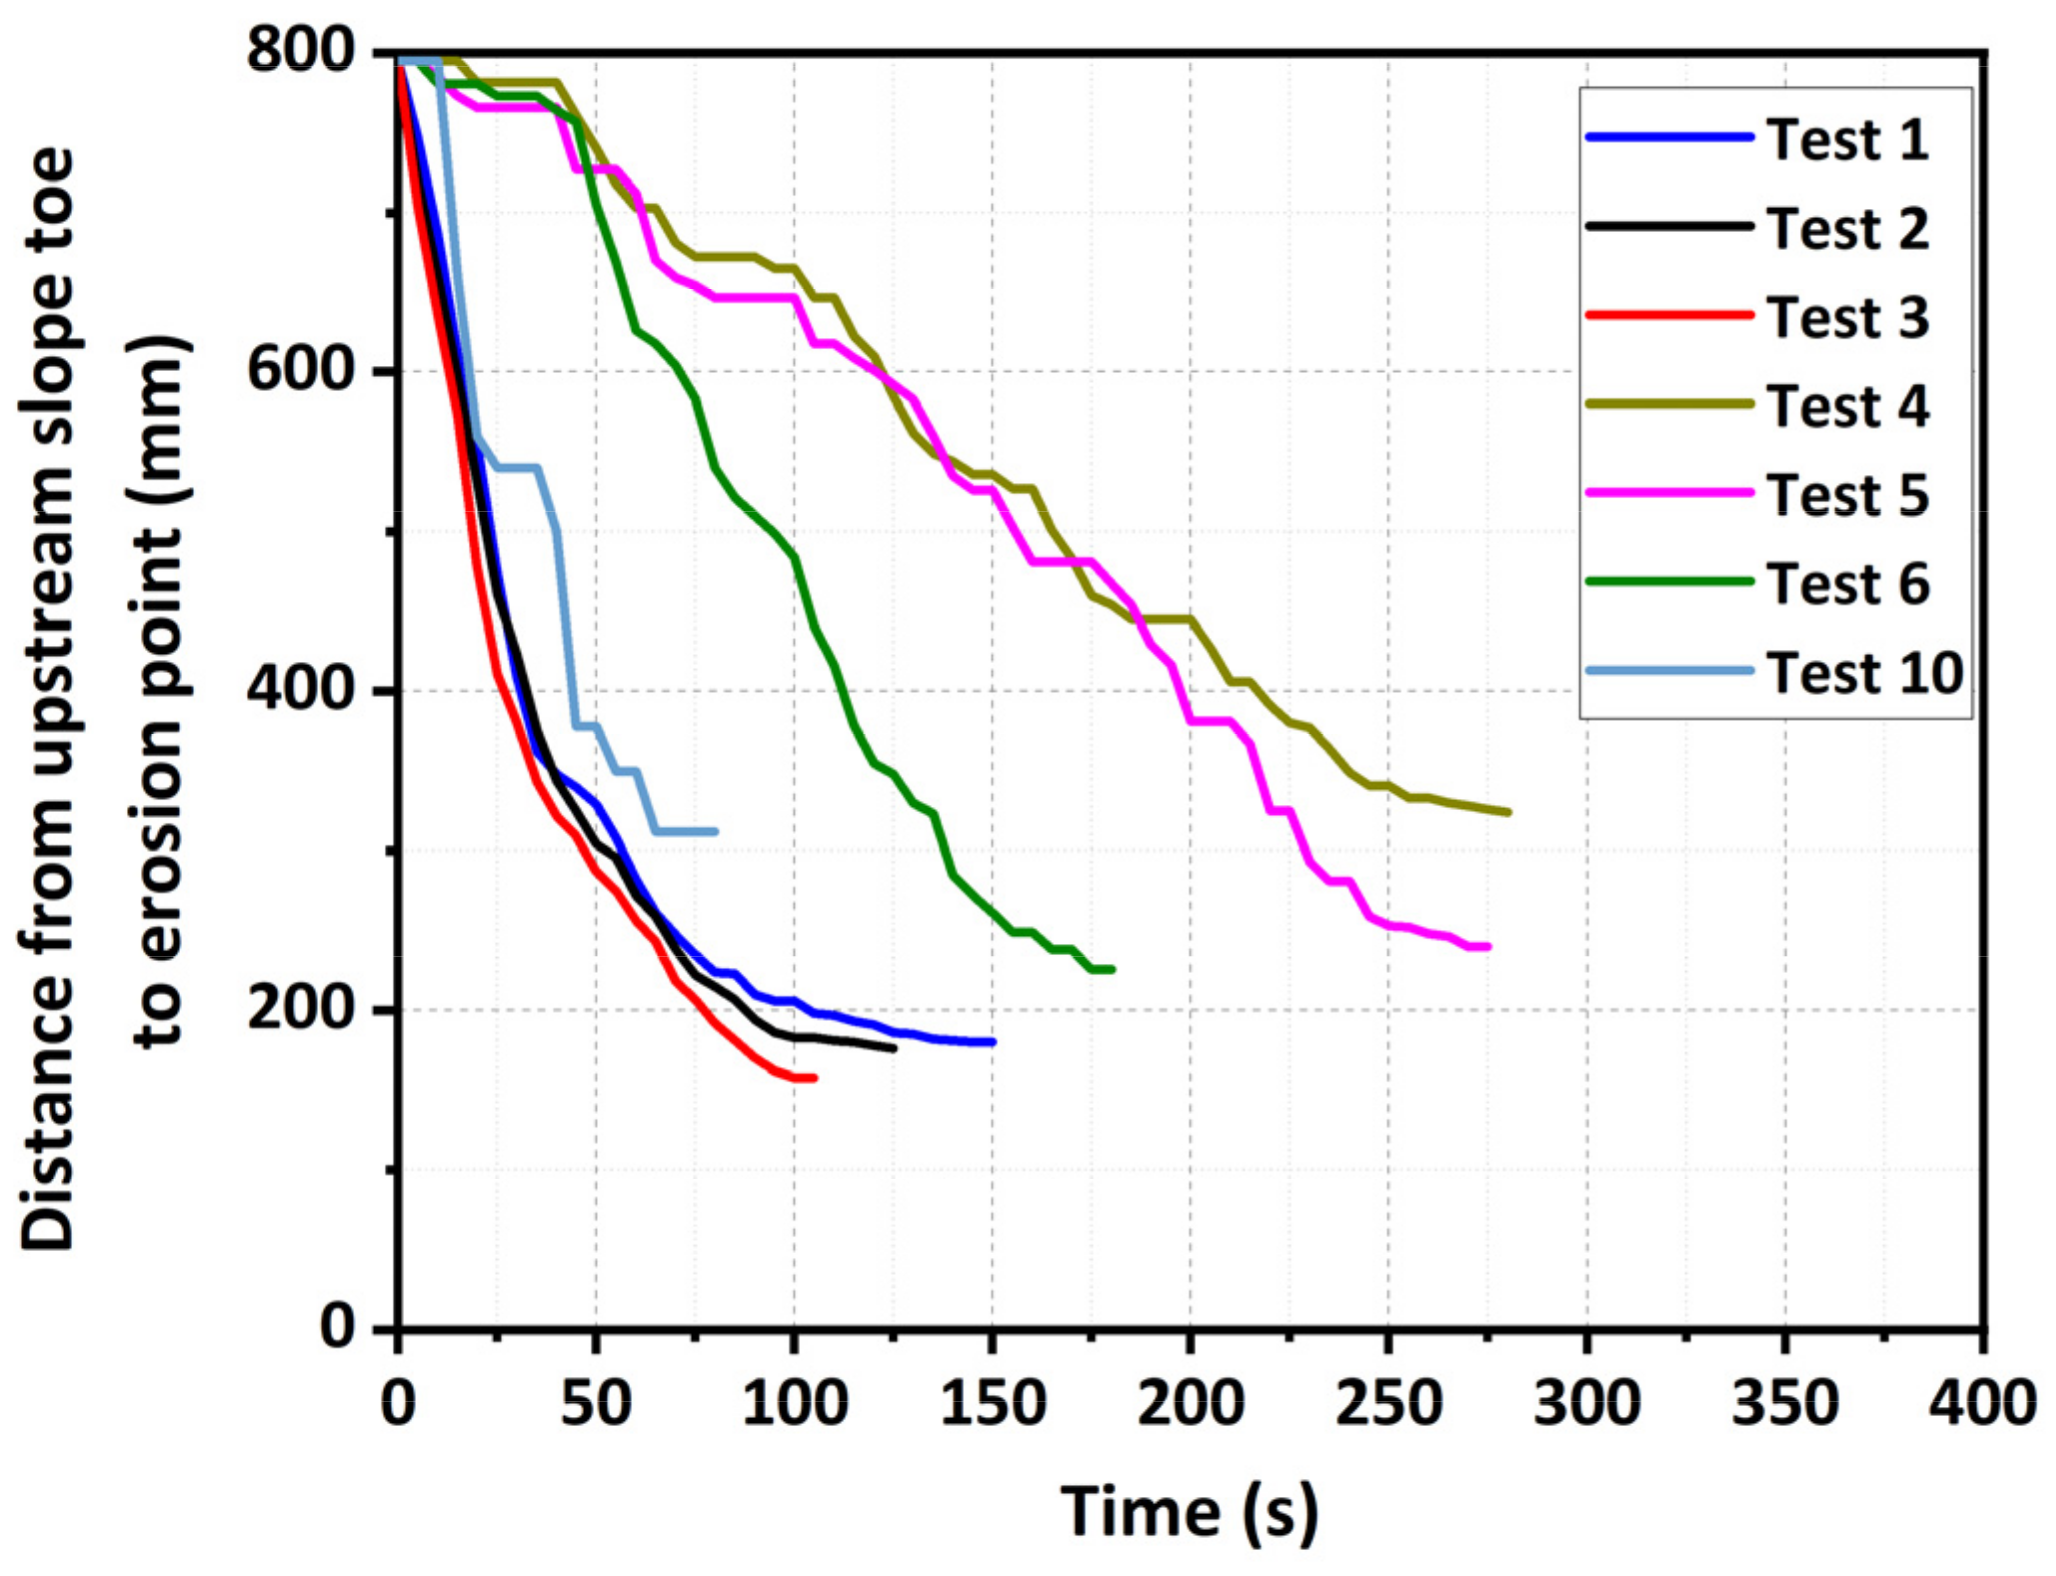
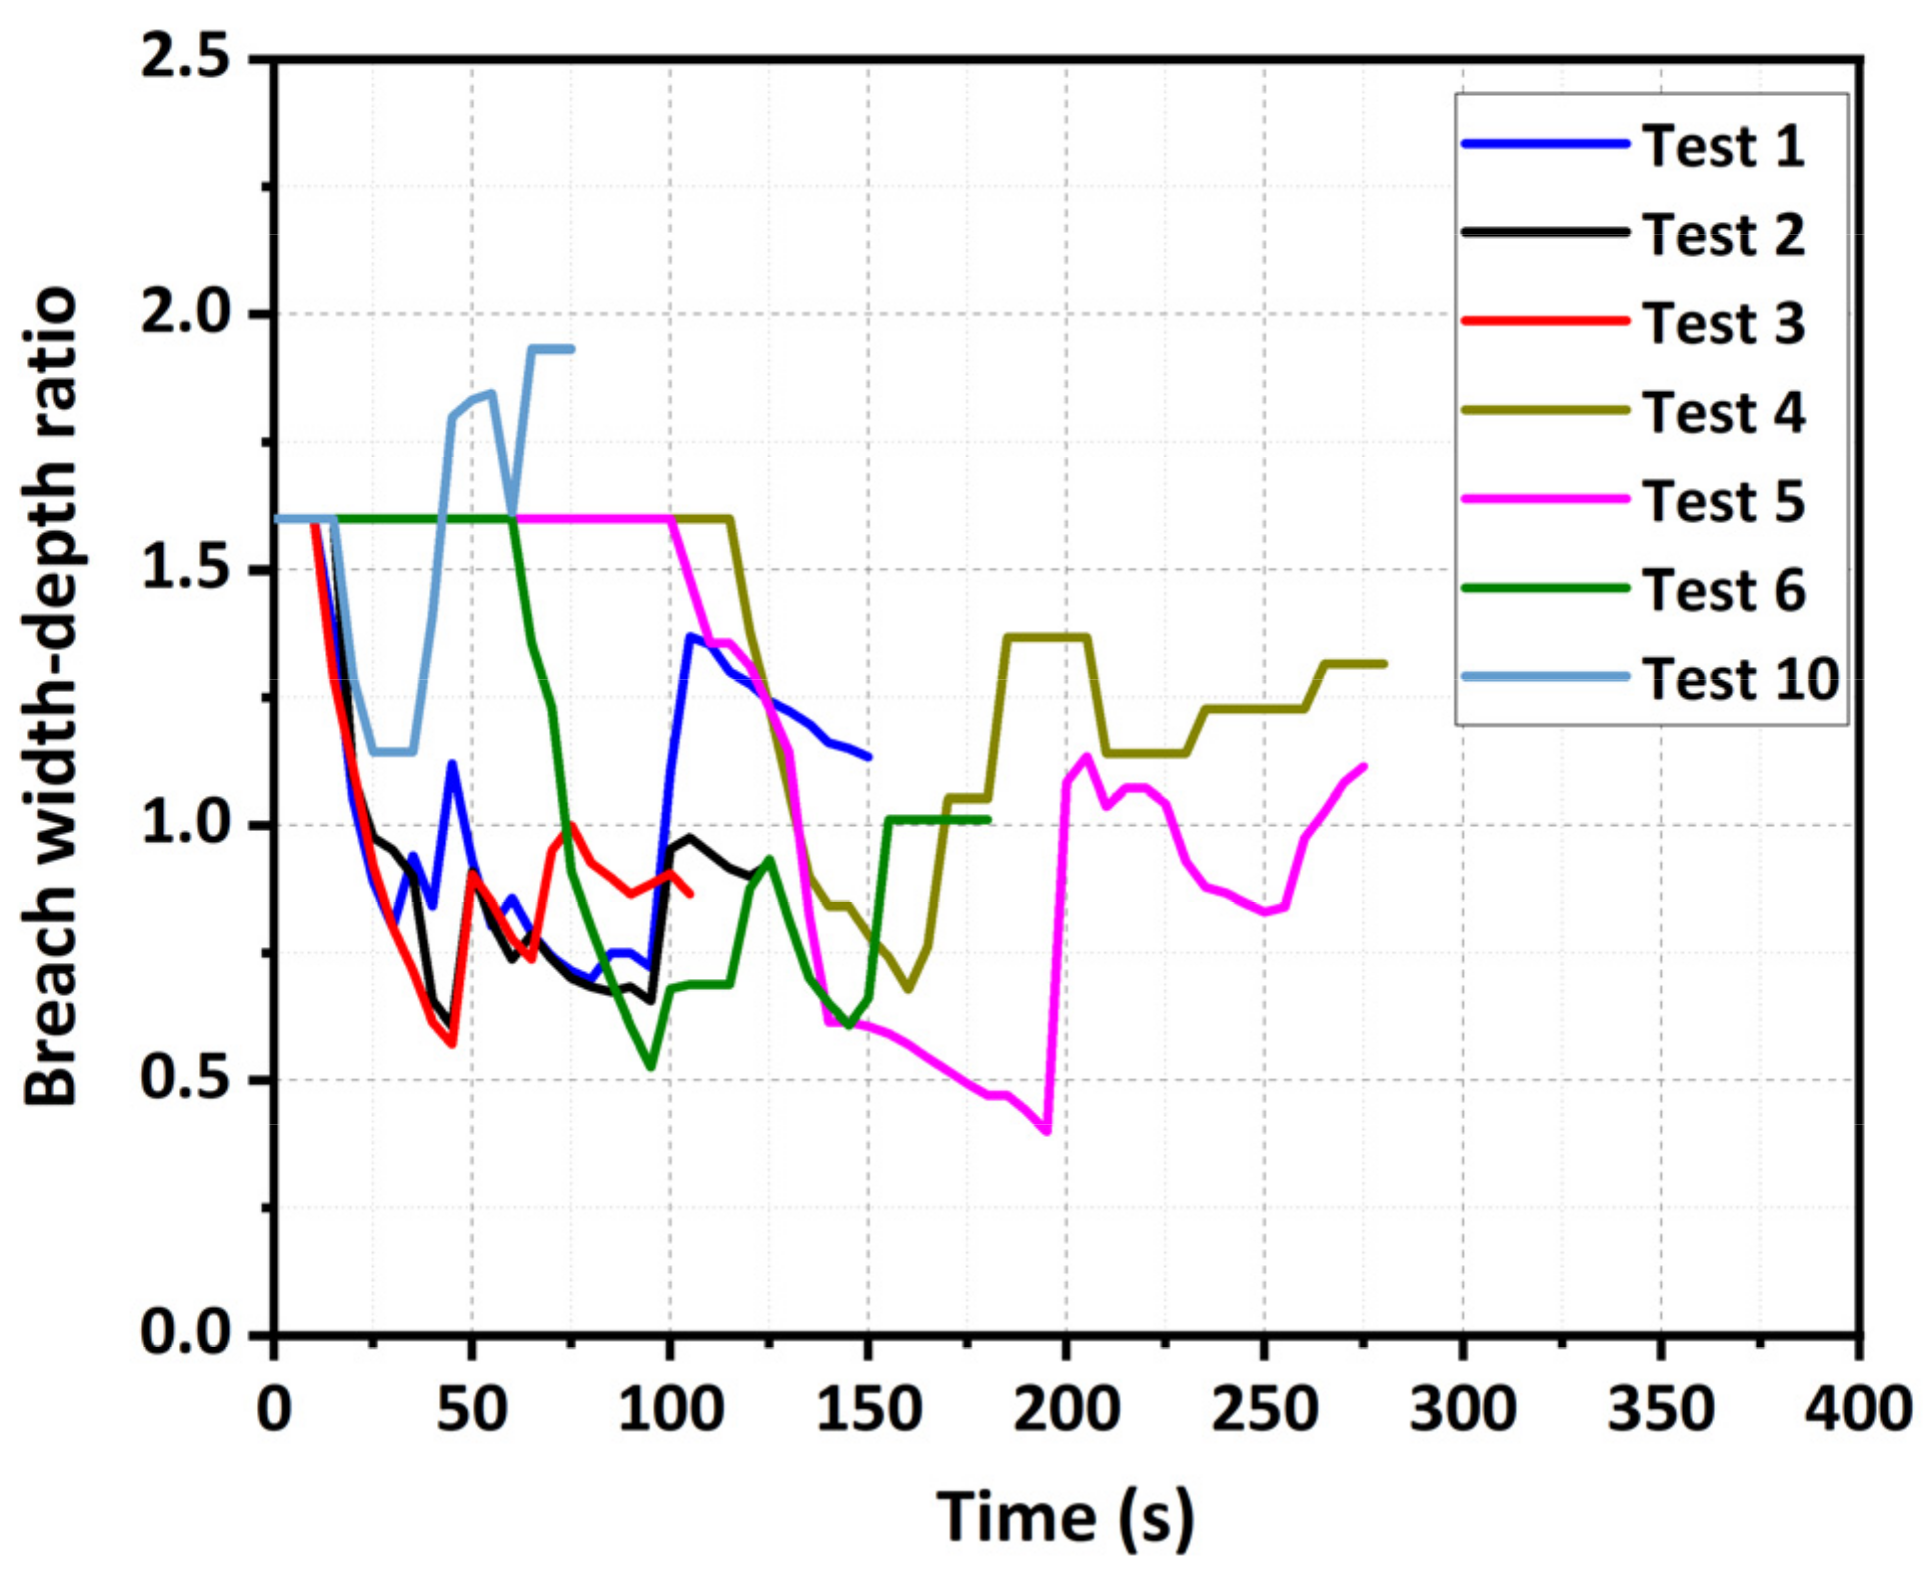
3.3. Breach Development and Erosion Rates
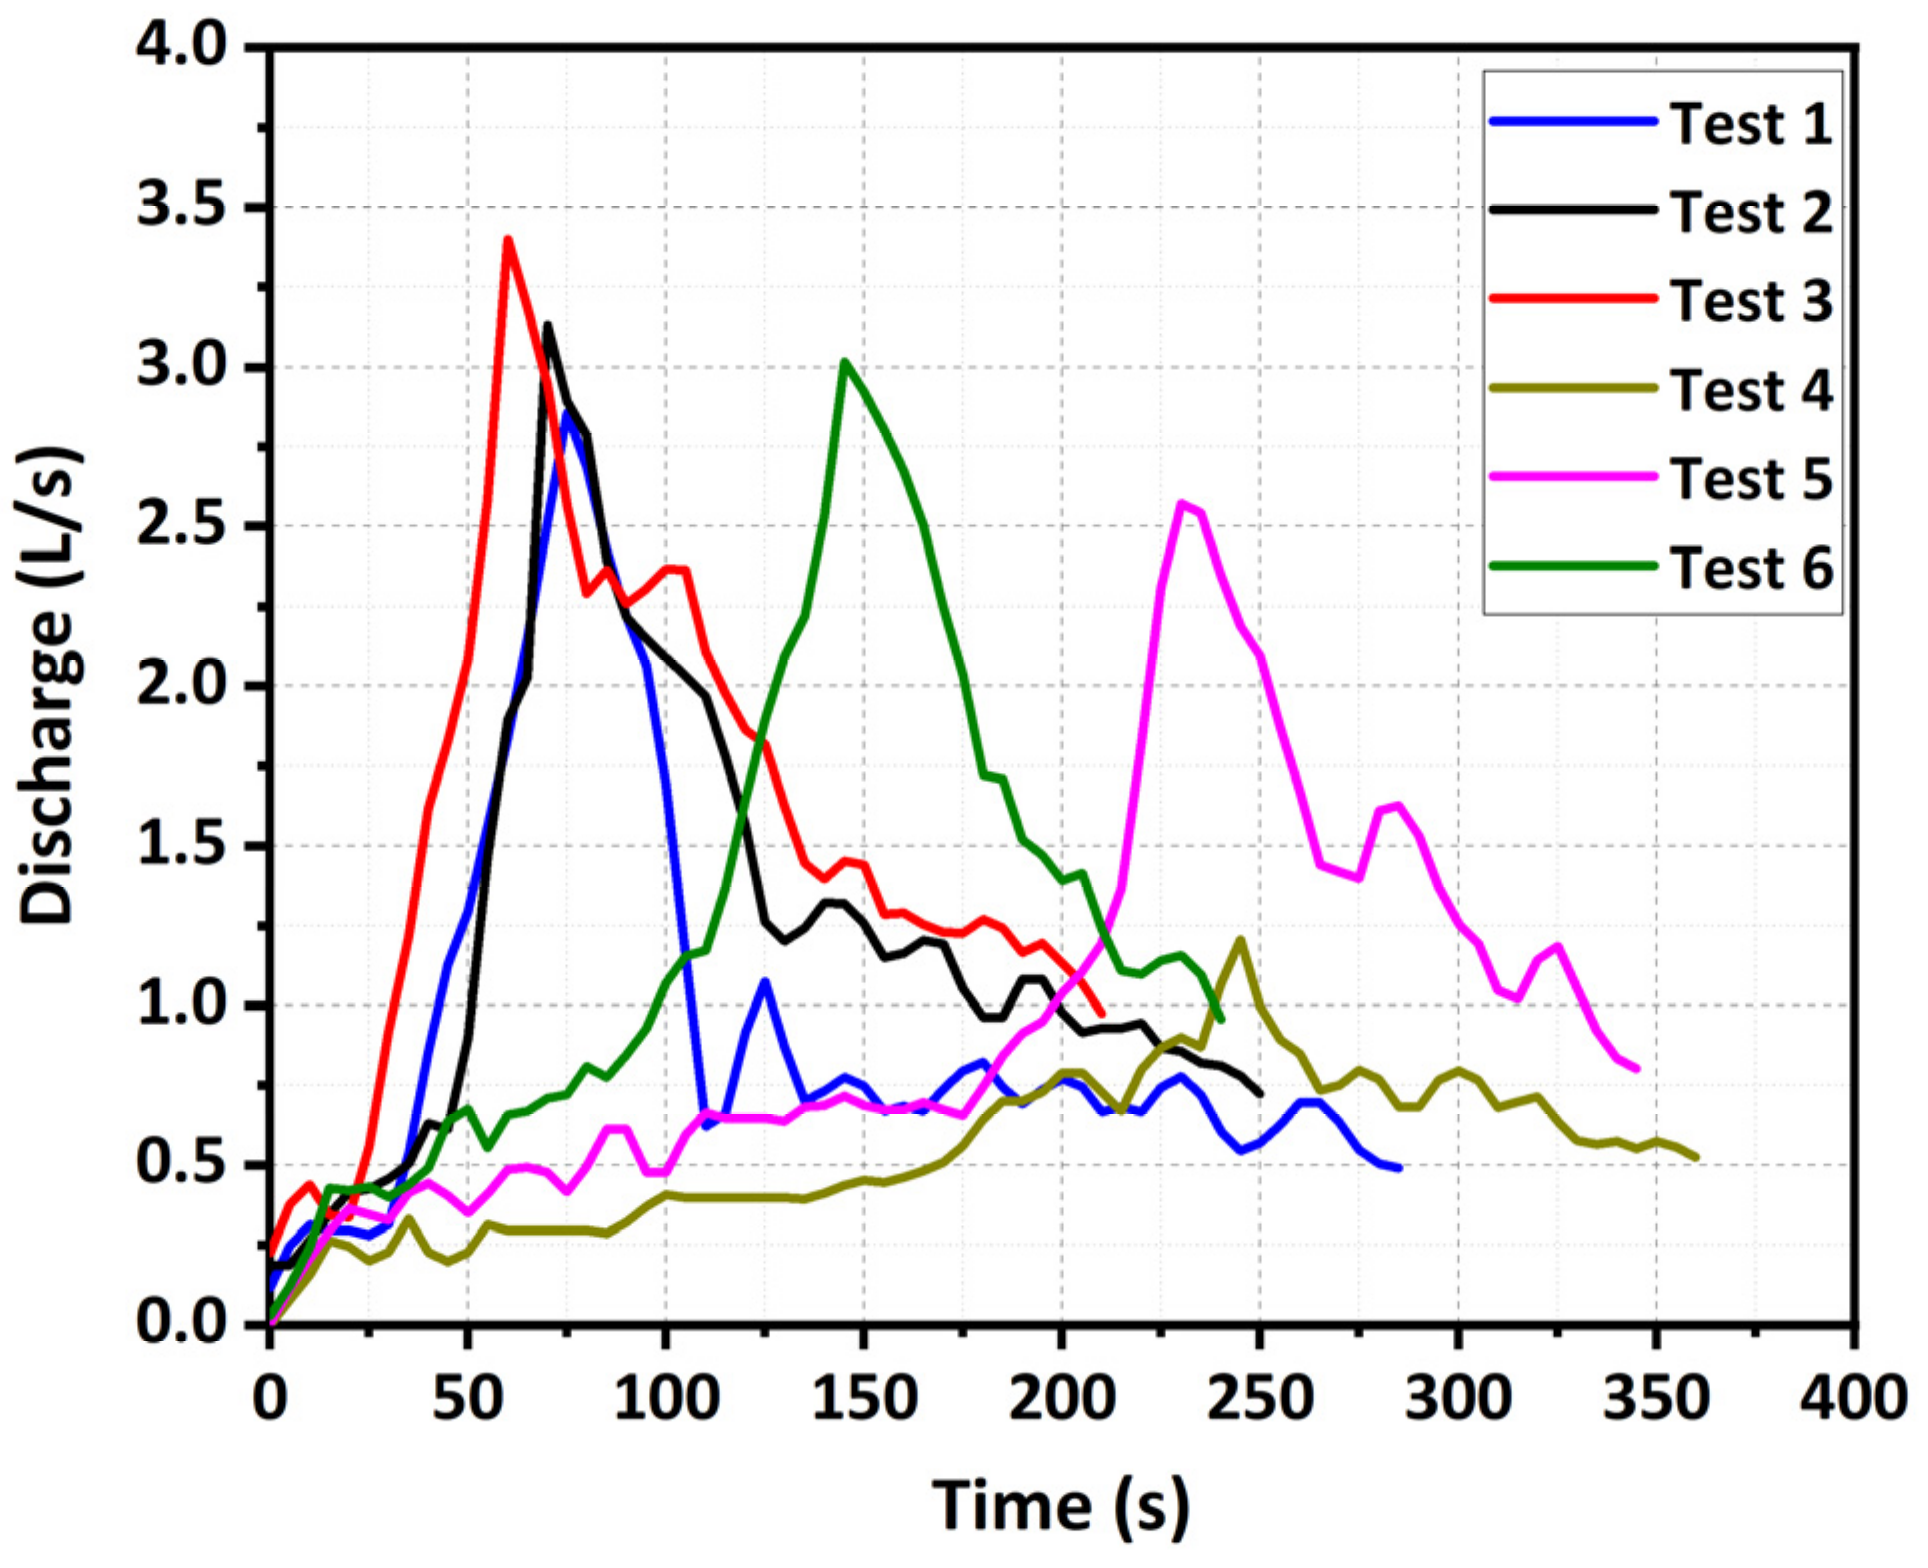
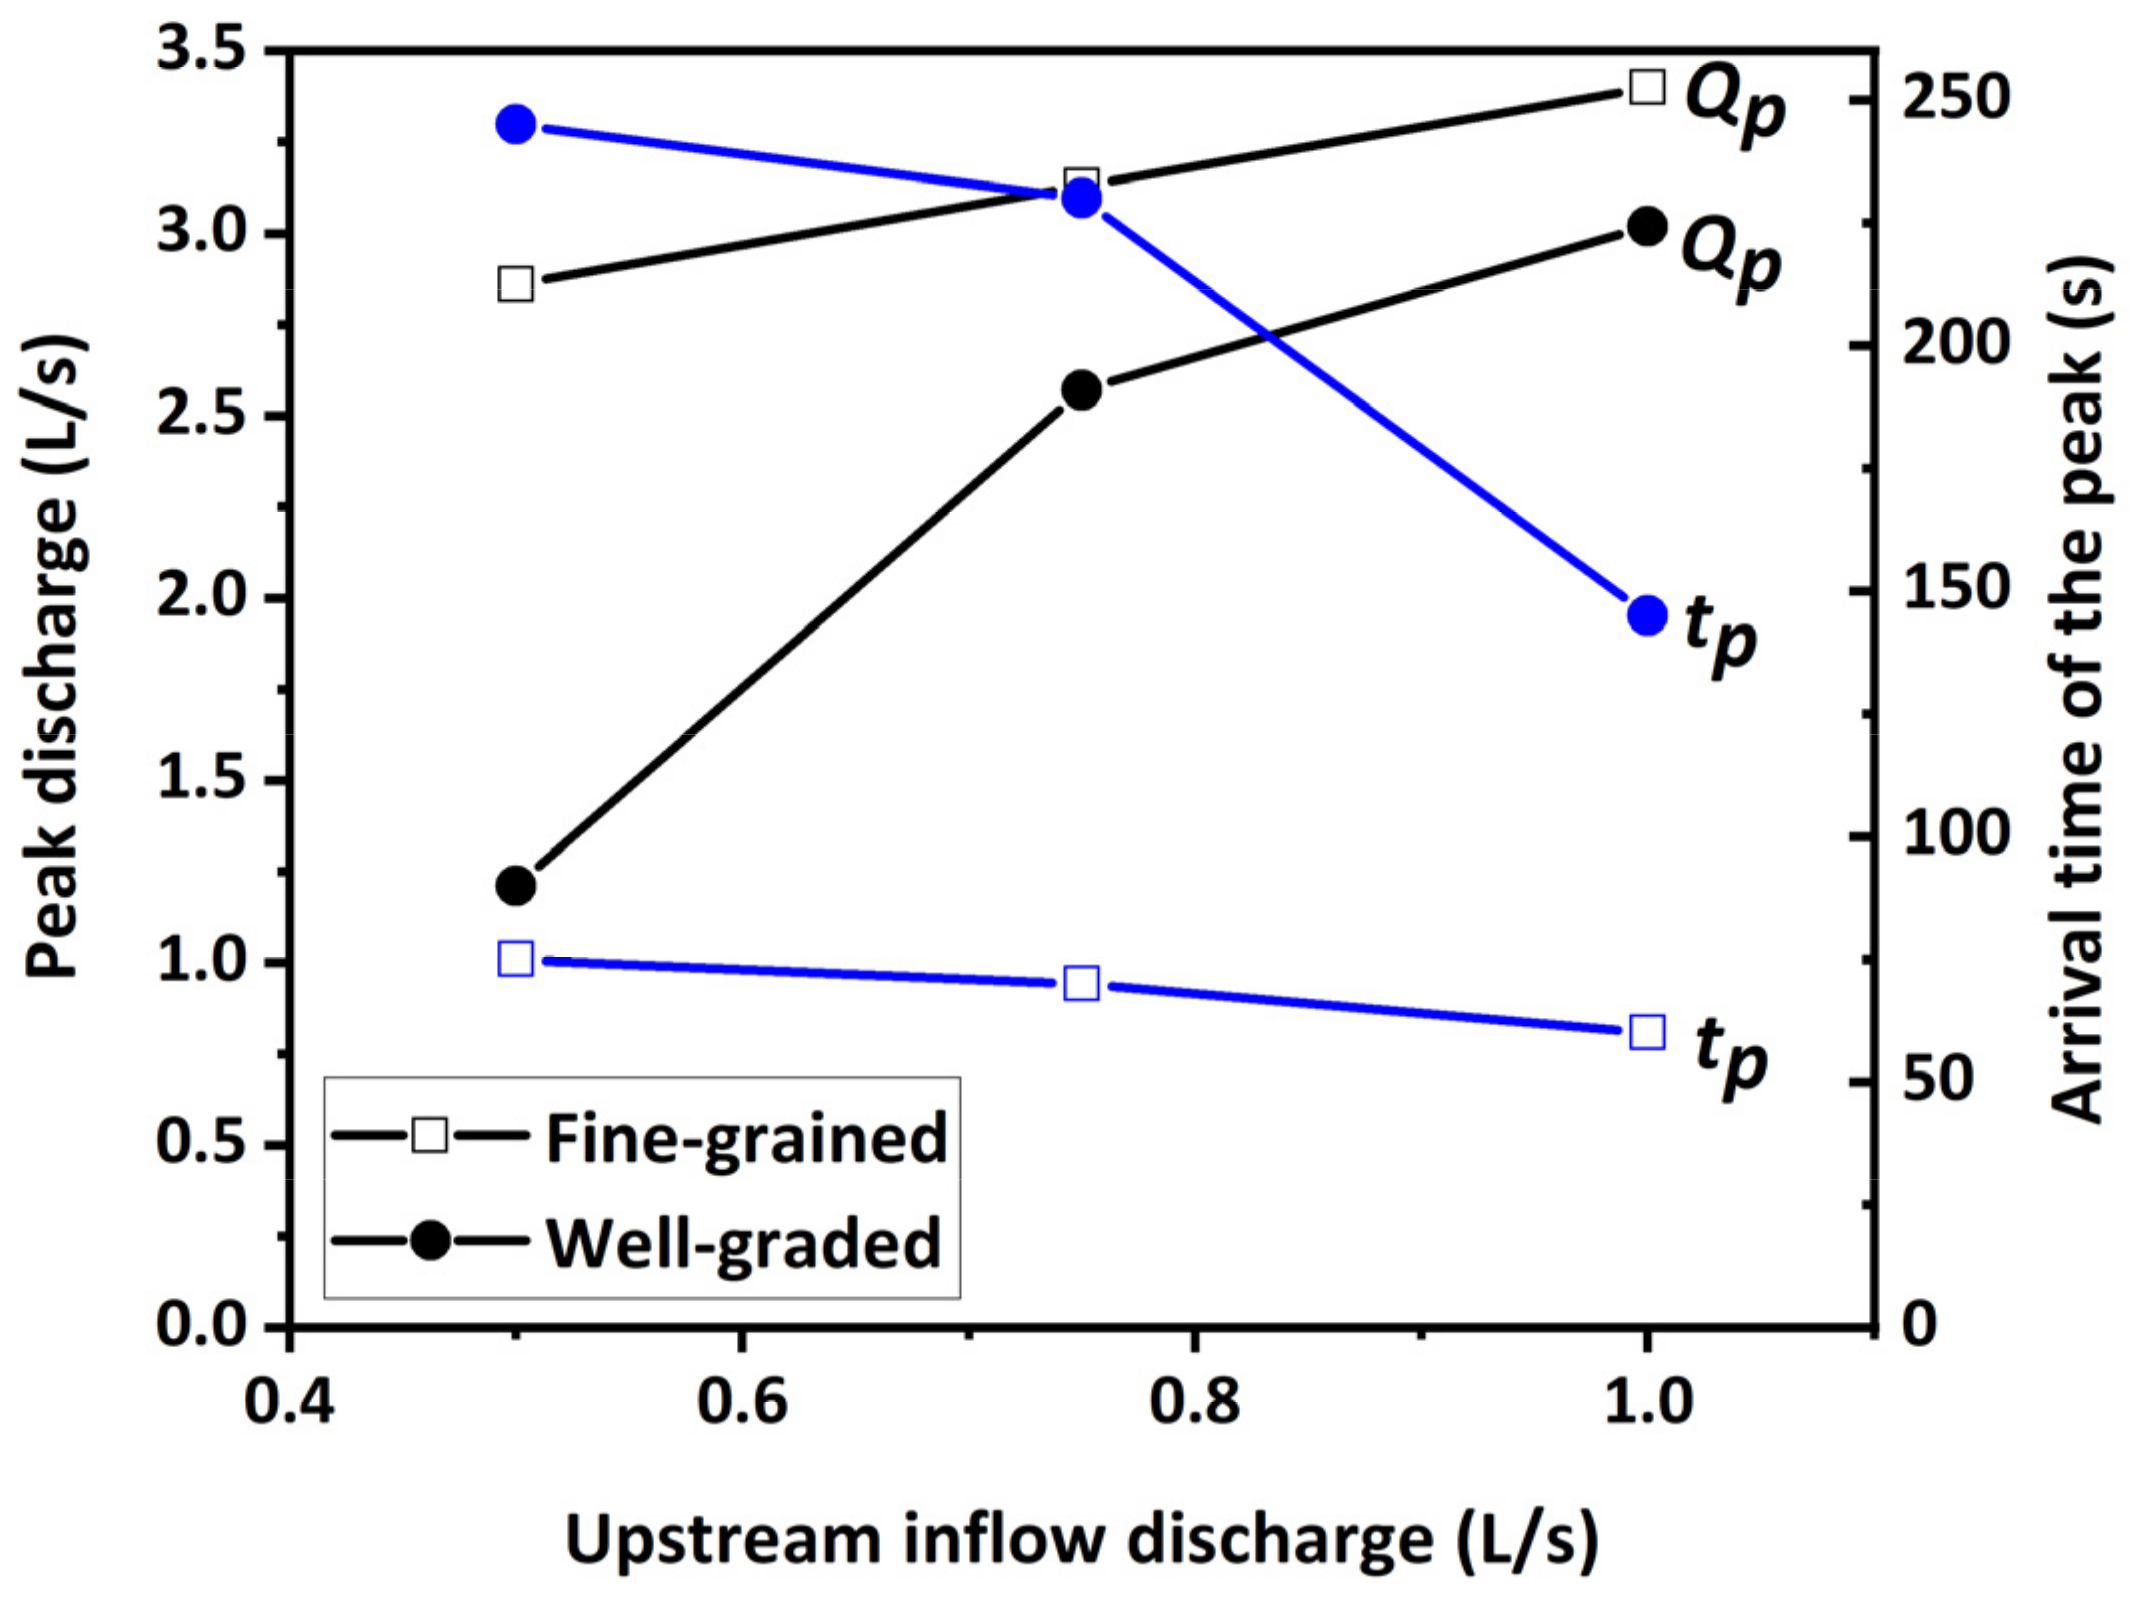
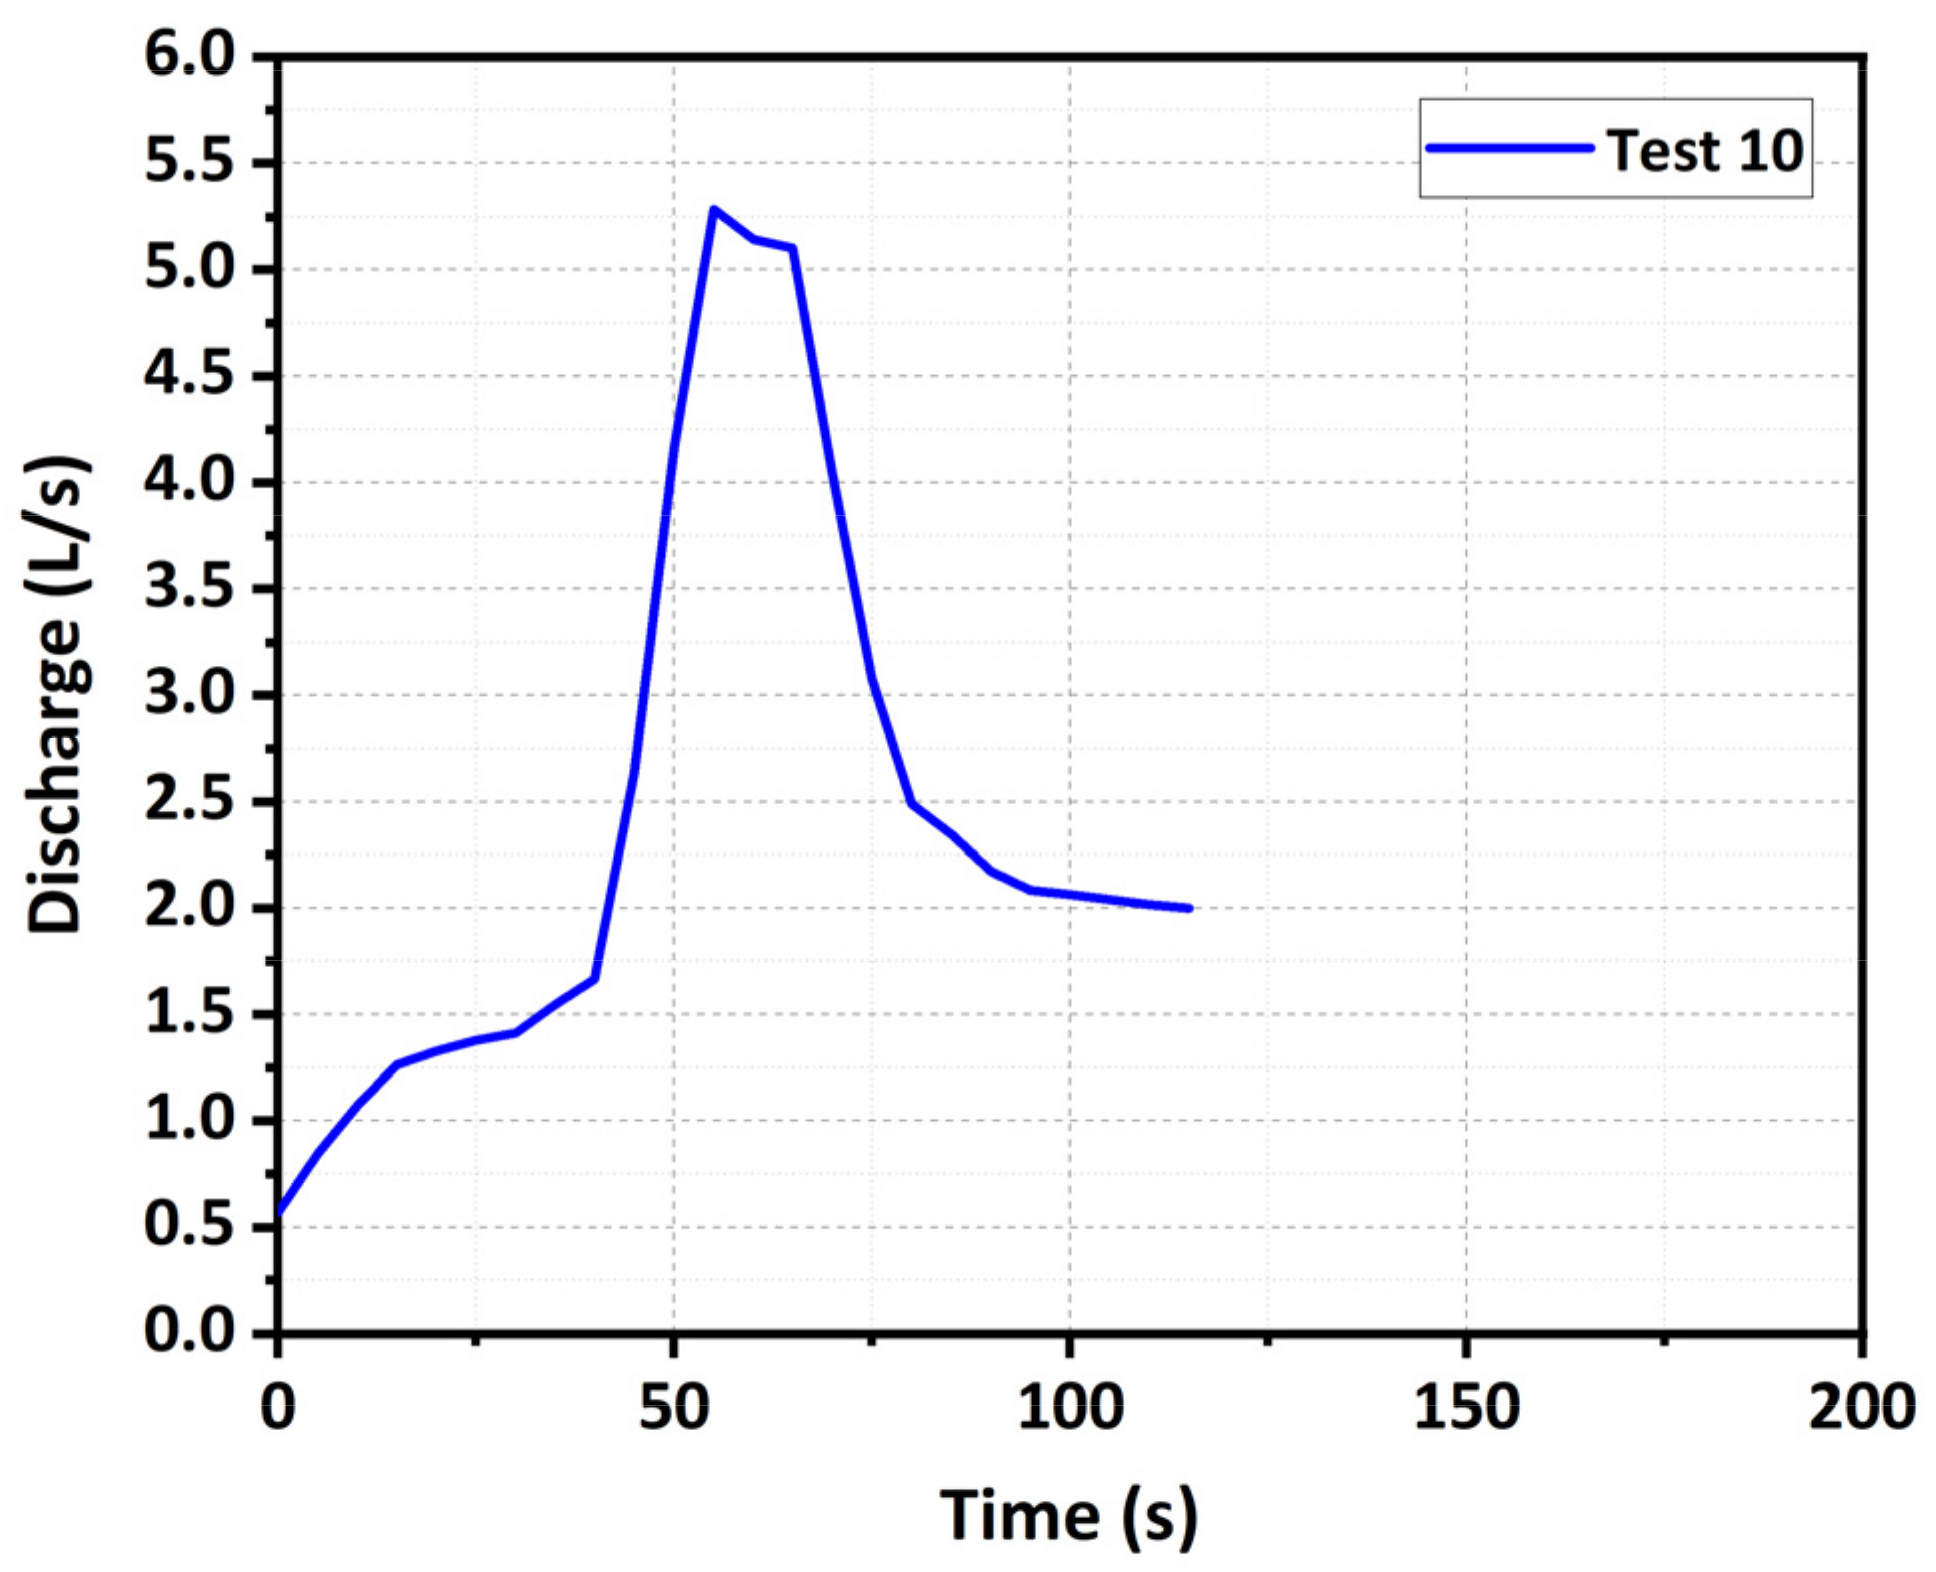
3.4. Hydrological Evolution
4. Discussion
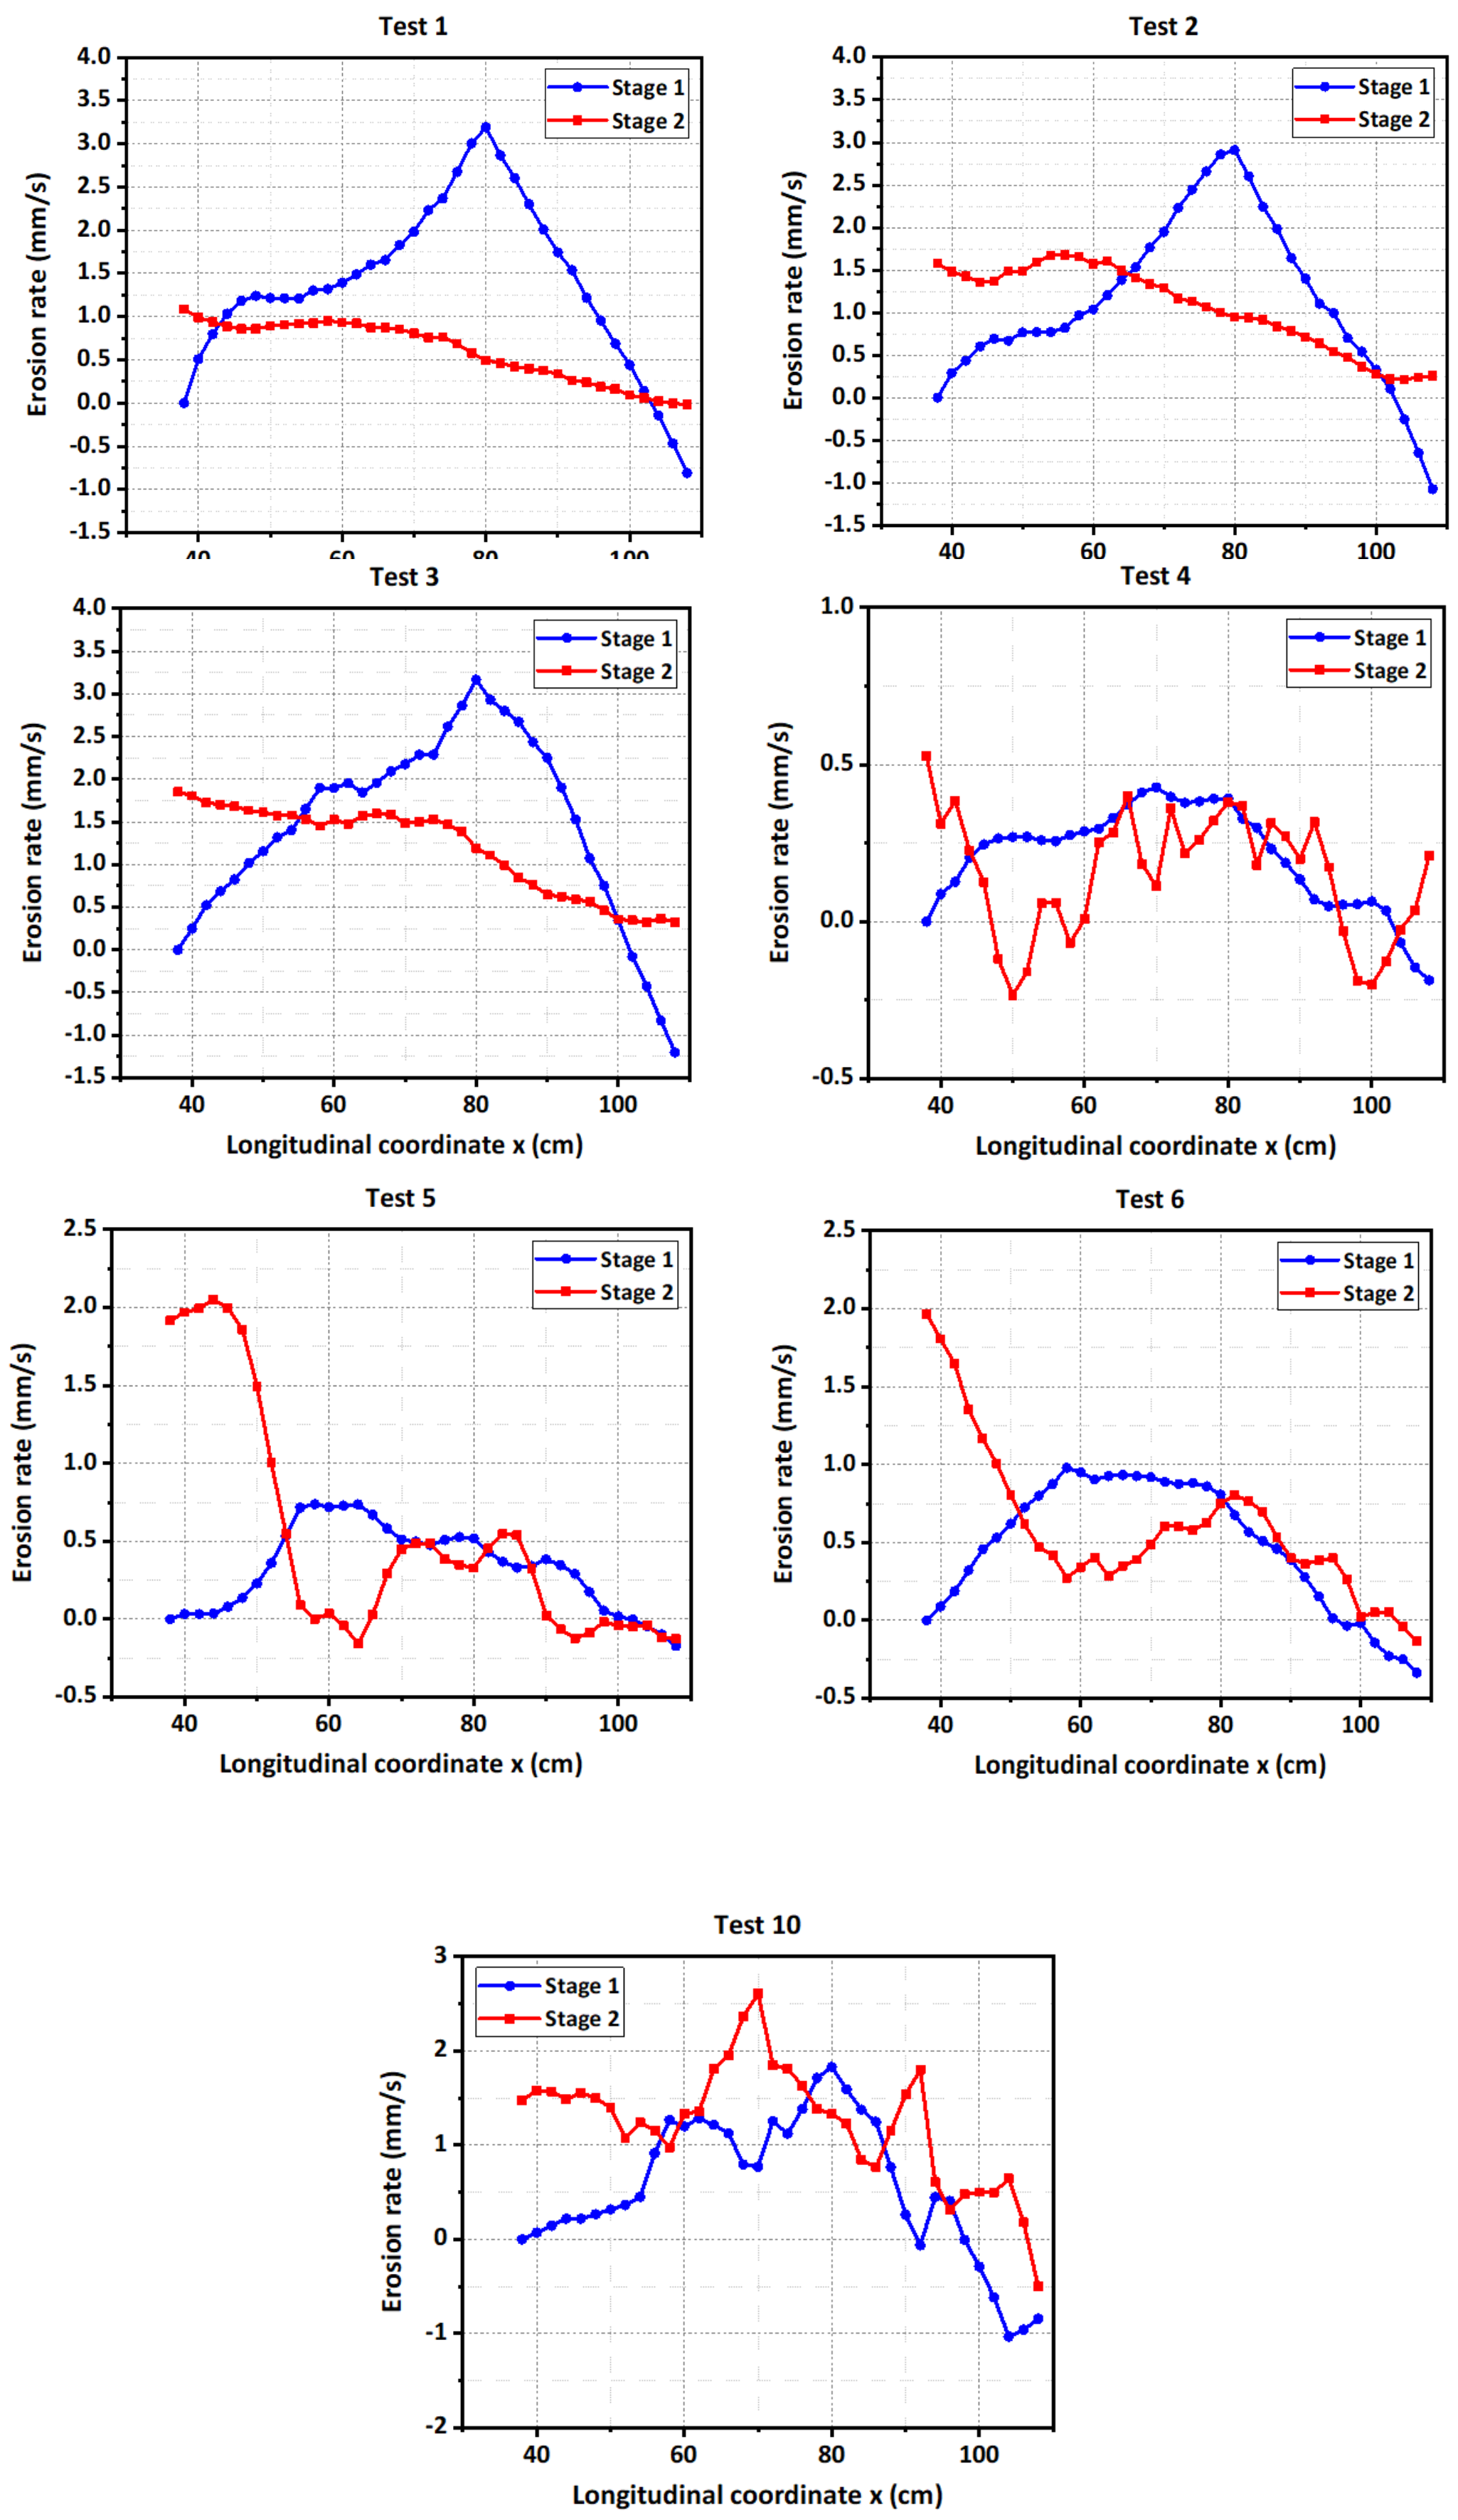
4.1. Erosion Rate Distribution along the Flow Direction
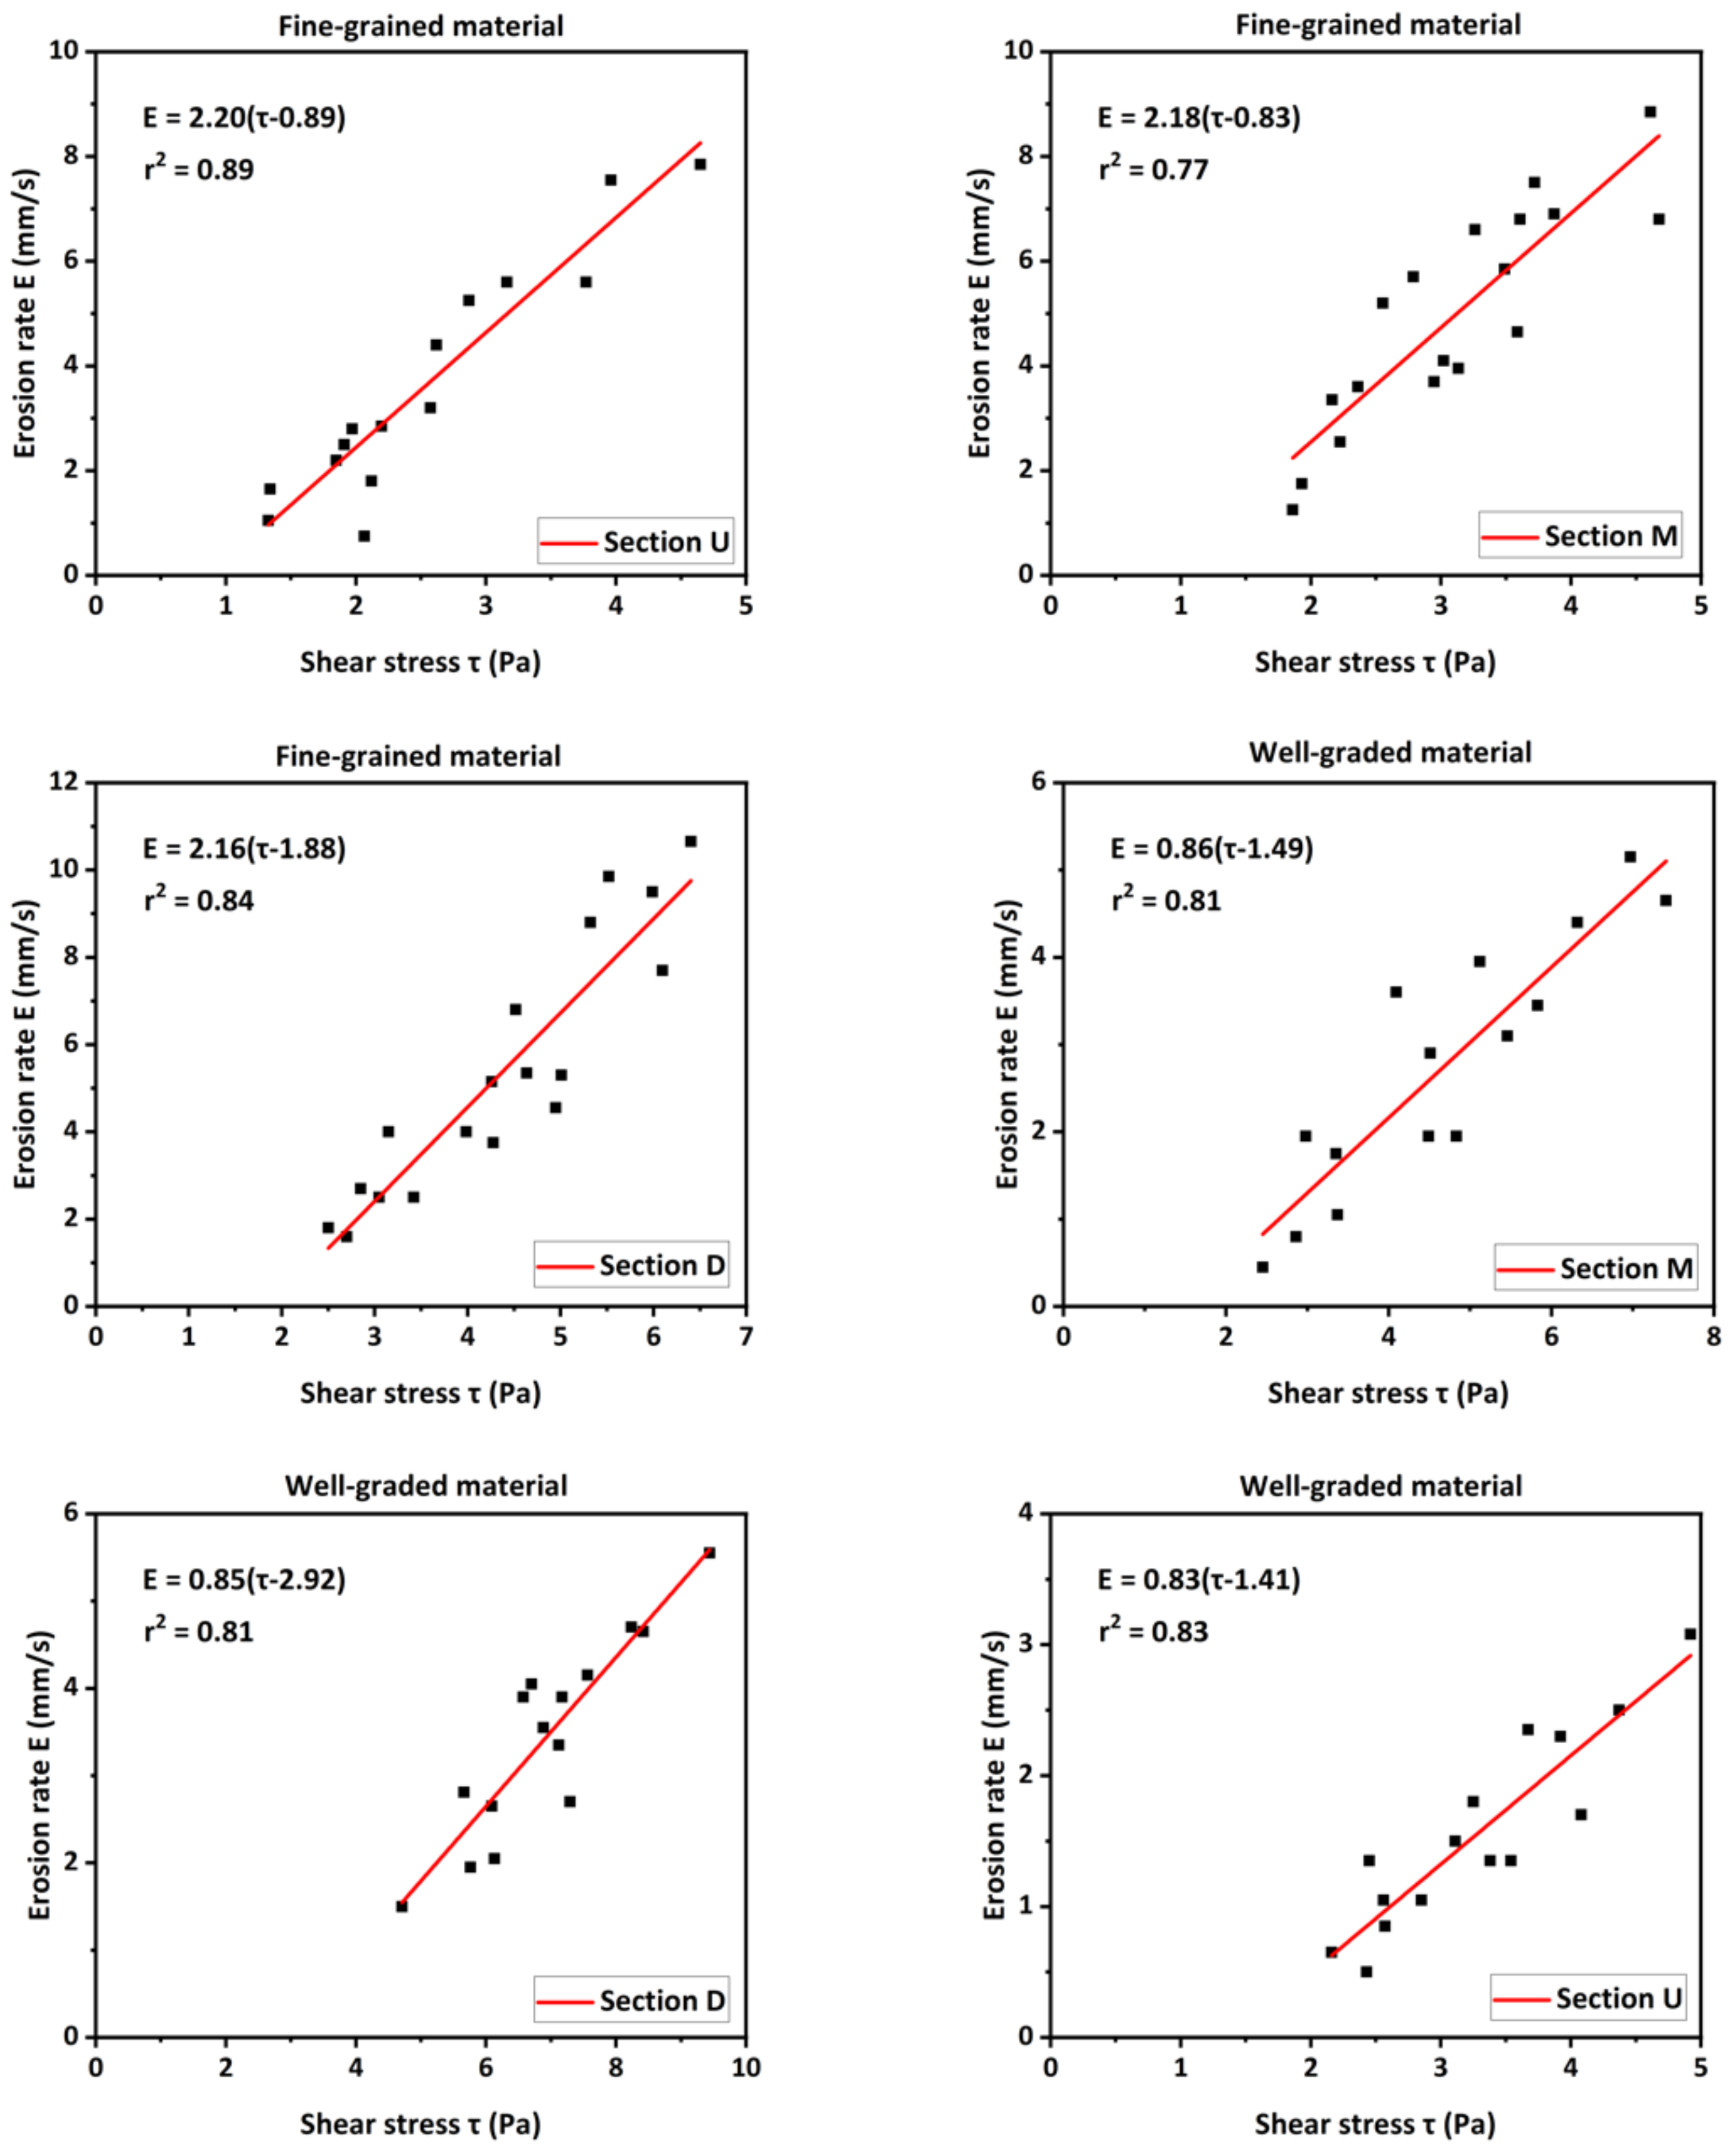
4.2. Erosion Resistance of Dam Materials
4.3. Effects of Dam Material on the Lateral Collapse
5. Conclusions
Author Contributions
Funding
Institutional Review Board Statement
Informed Consent Statement
Data Availability Statement
Conflicts of Interest
References
- Costa, J.E.; Schuster, R.L. Documented historical landslide dams from around the world. Open-File Rep. 1991, 91–239. [Google Scholar] [CrossRef]
- Casagli, N.; Ermini, L.; Rosati, G. Determining grain size distribution of the material composing landslide dams in the Northern Apennines: Sampling and processing methods. Eng. Geol. 2003, 69, 83–97. [Google Scholar] [CrossRef]
- Shen, D.; Shi, Z.; Peng, M.; Zhang, L.; Jiang, M. Longevity analysis of landslide dams. Landslides 2020, 17, 1797–1821. [Google Scholar] [CrossRef]
- Peng, M.; Jiang, Q.-L.; Zhang, Q.-Z.; Hong, Y.; Jiang, M.-Z.; Shi, Z.-M.; Zhang, L.-M. Stability analysis of landslide dams under surge action based on large-scale flume experiments. Eng. Geol. 2019, 259, 105191. [Google Scholar] [CrossRef]
- Chang, L.C. Investigation of Diexi Earthquake in Sichuan Province. Geol. Rev. 1938, 3, 251–292. (In Chinese) [Google Scholar]
- Liu, N.; Cheng, Z.L.; Cui, P.; Chen, N.S. Dammed Lake and Risk Management; Science Press: Beijing, China, 2013. (In Chinese) [Google Scholar]
- Hu, X.W.; Huang, R.Q.; Shi, Y.B.; Lu, X.P.; Zhu, H.Y.; Wang, X.R. Analysis of blocking river mechanism of Tangjiashan landslide and dam-breaking mode of its barrier dam. Chin. J. Rock Mech. Eng. 2009, 28, 181–189. (In Chinese) [Google Scholar]
- Fujita, Y.; Tamura, T. Enlargement of breaches in flood levees on alluvial plains. Nat. Disaster Sci. 1987, 9, 37–60. [Google Scholar]
- Coleman, S.E.; Andrews, D.P.; Webby, M.G. Overtopping Breaching of Noncohesive Homogeneous Embankments. J. Hydraul. Eng. 2002, 128, 829–838. [Google Scholar] [CrossRef]
- Spinewine, B.; Delobbe, A.; Elslander, L.; Zech, Y. Experimental investigation of the breach growth process in sand dikes. In Proceedings of the River Flow 2004; CRC Press: Boca Raton, FL, USA, 2004; pp. 983–991. [Google Scholar]
- Braun, A.; Cuomo, S.; Petrosino, S.; Wang, X.; Zhang, L. Numerical SPH analysis of debris flow run-out and related river damming scenarios for a local case study in SW China. Landslides 2017, 15, 535–550. [Google Scholar] [CrossRef]
- Peng, M.; Zhang, L.M. Breaching parameters of landslide dams. Landslides 2011, 9, 13–31. [Google Scholar] [CrossRef]
- Ermini, L.; Casagli, N. Prediction of the behaviour of landslide dams using a geomorphological dimensionless index. Earth Surf. Process. Landf. 2003, 28, 31–47. [Google Scholar] [CrossRef]
- Xu, F.-G.; Yang, X.-G.; Zhou, J.-W.; Hao, M.-H. Experimental Research on the Dam-Break Mechanisms of the Jiadanwan Landslide Dam Triggered by the Wenchuan Earthquake in China. Sci. World J. 2013, 2013, 272363. [Google Scholar] [CrossRef] [PubMed]
- Schmocker, L.; Frank, P.-J.; Hager, W.H. Overtopping dike-breach: Effect of grain size distribution. J. Hydraul. Res. 2014, 52, 559–564. [Google Scholar] [CrossRef]
- Yang, Y.; Cao, S.Y.; Yang, K.J.; Li, W.P. Experimental study of breach process of landslide dams by overtopping and its initiation mechanisms. J. Hydrodyn. 2015, 27, 872–883. [Google Scholar] [CrossRef]
- Zhao, W.; Chen, X.; You, Y.; Chen, J. Dam-break characteristics of landslide dams with different types of open channel discharge sections. Environ. Earth Sci. 2015, 74, 5331–5340. [Google Scholar] [CrossRef]
- Zhao, T.-L.; Chen, S.-S.; Fu, C.-J.; Zhong, Q.-M. Centrifugal model tests and numerical simulations for barrier dam break due to overtopping. J. Mt. Sci. 2019, 16, 630–640. [Google Scholar] [CrossRef]
- Zhou, G.G.; Zhou, M.; Shrestha, M.S.; Song, D.; Choi, C.; Cui, K.F.E.; Peng, M.; Shi, Z.; Zhu, X.; Chen, H. Experimental investigation on the longitudinal evolution of landslide dam breaching and outburst floods. Geomorphology 2019, 334, 29–43. [Google Scholar] [CrossRef]
- Schuster, R.L.; Costa, J.E. A Perspective on Landslide Dams. Landslide Dams, Processes, Risk and Mitigation. Geotechnical Special Publication. No. 3 ASCE; 1986; pp. 1–20. Available online: https://pubs.er.usgs.gov/publication/70015581 (accessed on 1 February 2022).
- Chang, D.S.; Zhang, L.M.; Xu, Y.; Huang, R.Q. Field testing of erodibility of two landslide dams triggered by the 12 May Wenchuan earthquake. Landslides 2011, 8, 321–332. [Google Scholar] [CrossRef]
- Schuster, R.L. Landslide dams in the western United State. In Proceedings of the IVth International Conference and Field Workshop on Landslides, Tokyo, Japan, 23–31 August 1985; pp. 411–418. [Google Scholar]
- Korup, O. Geomorphometric characteristics of New Zealand landslide dams. Eng. Geol. 2004, 73, 13–35. [Google Scholar] [CrossRef]
- Cui, P.; Zhu, Y.Y.; Han, Y.S.; Chen, X.Q.; Zhuang, J.Q. The 12 May Wenchuan earthquake-induced landslide lakes: Dis-tribution and preliminary risk evaluation. Landslides 2009, 6, 209–223. [Google Scholar] [CrossRef]
- Gorum, T.; Fan, X.; van Westen, C.J.; Huang, R.Q.; Xu, Q.; Tang, C.; Wang, G. Distribution pattern of earthquake-induced landslides triggered by the 12 May 2008 Wenchuan earthquake. Geomorphology 2011, 133, 152–167. [Google Scholar] [CrossRef]
- Hou, J.; Liang, Q.; Simons, F.; Hinkelmann, R. A 2D well-balanced shallow flow model for unstructured grids with novel slope source term treatment. Adv. Water Resour. 2013, 52, 107–131. [Google Scholar] [CrossRef]
- Pu, J.H.; Shao, S.; Huang, Y.; Hussain, K. Evaluations of SWEs and SPH Numerical Modelling Techniques for Dam Break Flows. Eng. Appl. Comput. Fluid Mech. 2013, 7, 544–563. [Google Scholar] [CrossRef]
- Pu, J.H.; Hussain, K.; Shao, S.-D.; Huang, Y.-F. Shallow sediment transport flow computation using time-varying sediment adaptation length. Int. J. Sediment Res. 2014, 29, 171–183. [Google Scholar] [CrossRef][Green Version]
- Singh, V.P.; Quiroga, C.A. A dam-breach erosion model: I. Formulation. Water Resour. Manag. 1987, 1, 177–197. [Google Scholar] [CrossRef]
- Fread, D.L. BREACH: An Erosion Model for Earth Dam Failures; Report NOAA; National Weather Service (NWS): Silver Spring, MD, USA, 1988. [Google Scholar]
- Mohamed, M.A.A. Embankment Breach Formation and Modeling Methods. Ph.D Thesis, Open University, London, UK, 2002. [Google Scholar]
- Wang, L.; Chen, Z.; Wang, N.; Sun, P.; Yu, S.; Li, S.; Du, X. Modeling lateral enlargement in dam breaches using slope stability analysis based on circular slip mode. Eng. Geol. 2016, 209, 70–81. [Google Scholar] [CrossRef]
- Chang, D.S.; Zhang, L. Simulation of the erosion process of landslide dams due to overtopping considering variations in soil erodibility along depth. Nat. Hazards Earth Syst. Sci. 2010, 10, 933–946. [Google Scholar] [CrossRef]
- Zhong, Q.M.; Chen, S.S.; Mei, S.A.; Cao, W. Numerical simulation of landslide dam breaching due to overtopping. Landslides 2017, 15, 1183–1192. [Google Scholar] [CrossRef]
- Gregoretti, C.; Maltauro, A.; Lanzoni, S. Laboratory Experiments on the Failure of Coarse Homogeneous Sediment Natural Dams on a Sloping Bed. J. Hydraul. Eng. 2010, 136, 868–879. [Google Scholar] [CrossRef]
- Cao, Z.; Yue, Z.; Pender, G. Landslide dam failure and flood hydraulics. Part I: Experimental investigation. Nat. Hazards 2011, 59, 1003–1019. [Google Scholar] [CrossRef]
- Chen, S.-C.; Lin, T.-W.; Chen, C.-Y. Modeling of natural dam failure modes and downstream riverbed morphological changes with different dam materials in a flume test. Eng. Geol. 2015, 188, 148–158. [Google Scholar] [CrossRef]
- Jiang, X.G.; Huang, J.H.; Wei, Y.W.; Niu, Z.P.; Chen, F.H.; Zou, Z.Y.; Zhu, Z.Y. The influence of materials on the breaching process of natural dams. Landslides 2018, 15, 243–255. [Google Scholar] [CrossRef]
- Zhu, X.; Peng, J.; Liu, B.; Jiang, C.; Guo, J. Influence of textural properties on the failure mode and process of landslide dams. Eng. Geol. 2020, 271, 105613. [Google Scholar] [CrossRef]
- Peng, M.; Zhang, L.; Chang, D.; Shi, Z. Engineering risk mitigation measures for the landslide dams induced by the 2008 Wenchuan earthquake. Eng. Geol. 2014, 180, 68–84. [Google Scholar] [CrossRef]
- Shi, Z.M.; Zhang, G.D.; Peng, M.; Ma, C.Y. Influence of dam geometry on the breaching process of landslide dams. In Proceedings of the IOP Conference Series: Earth and Environmental Science; IOP Publishing: Bristol, UK, 2021; Volume 861, p. 052026. [Google Scholar]
- Zheng, H.; Shi, Z.; Shen, D.; Peng, M.; Hanley, K.J.; Ma, C.; Zhang, L. Recent Advances in Stability and Failure Mechanisms of Landslide Dams. Front. Earth Sci. 2021, 9, 659935. [Google Scholar] [CrossRef]
- Pu, J. Velocity Profile and Turbulence Structure Measurement Corrections for Sediment Transport-Induced Water-Worked Bed. Fluids 2021, 6, 86. [Google Scholar] [CrossRef]
- Pu, J.H. Turbulent rectangular compound open channel flow study using multi-zonal approach. Environ. Fluid Mech. 2018, 19, 785–800. [Google Scholar] [CrossRef]
- Pu, J.H.; Wei, J.; Huang, Y. Velocity Distribution and 3D Turbulence Characteristic Analysis for Flow over Water-Worked Rough Bed. Water 2017, 9, 668. [Google Scholar] [CrossRef]
- Zheng, H.; Shi, Z.; Yu, S.; Fan, X.; Hanley, K.J.; Feng, S. Erosion Mechanisms of Debris Flow on the Sediment Bed. Water Resour. Res. 2021, 57, 030707. [Google Scholar] [CrossRef]
- Peng, M.; Ma, C.-Y.; Chen, H.-X.; Zhang, P.; Zhang, L.-M.; Jiang, M.-Z.; Zhang, Q.-Z.; Shi, Z.-M. Experimental study on breaching mechanisms of landslide dams composed of different materials under surge waves. Eng. Geol. 2021, 291, 106242. [Google Scholar] [CrossRef]
- Shi, Z.-M.; Wang, Y.-Q.; Peng, M.; Chen, J.-F.; Yuan, J. Characteristics of the landslide dams induced by the 2008 Wenchuan earthquake and dynamic behavior analysis using large-scale shaking table tests. Eng. Geol. 2015, 194, 25–37. [Google Scholar] [CrossRef]
- Yin, Y.; Wang, F.; Sun, P. Landslide hazards triggered by the 2008 Wenchuan earthquake, Sichuan, China. Landslides 2009, 6, 139–152. [Google Scholar] [CrossRef]
- Beyabanaki, S.A.R.; Bagtzoglou, A.C.; Liu, L. Applying disk-based discontinuous deformation analysis (DDA) to simulate Donghekou landslide triggered by the Wenchuan earthquake. Géoméch. Geoengin. 2015, 11, 177–188. [Google Scholar] [CrossRef]
- Li, X.; He, S.; Luo, Y.; Wu, Y. Simulation of the sliding process of Donghekou landslide triggered by the Wenchuan earthquake using a distinct element method. Environ. Earth Sci. 2011, 65, 1049–1054. [Google Scholar] [CrossRef]
- Zhang, L.; Xu, Y.; Huang, R.Q.; Chang, D.S. Particle flow and segregation in a giant landslide event triggered by the 2008 Wenchuan earthquake, Sichuan, China. Nat. Hazards Earth Syst. Sci. 2011, 11, 1153–1162. [Google Scholar] [CrossRef]
- Xu, Q.; Fan, X.-M.; Huang, R.-Q.; Van Westen, C. Landslide dams triggered by the Wenchuan Earthquake, Sichuan Province, south west China. Bull. Eng. Geol. Environ. 2009, 68, 373–386. [Google Scholar] [CrossRef]
- Chigira, M.; Wu, X.; Inokuchi, T.; Wang, G. Landslides induced by the 2008 Wenchuan earthquake, Sichuan, China. Geomorphology 2010, 118, 225–238. [Google Scholar] [CrossRef]
- Wu, L.; Zhu, S.; Wang, Y.; Wei, K.; Lu, C. A modified scale method based on fractal theory for rockfill materials. Eur. J. Environ. Civ. Eng. 2014, 18, 106–127. [Google Scholar] [CrossRef]
- Zhou, G.G.; Cui, P.; Tang, J.; Chen, H.; Zou, Q.; Sun, Q. Experimental study on the triggering mechanisms and kinematic properties of large debris flows in Wenjia Gully. Eng. Geol. 2015, 194, 52–61. [Google Scholar] [CrossRef]
- Zheng, H.; Shi, Z.; Peng, M.; Guan, S.; Hanley, K.J.; Feng, S. Amplification effect of cascading breach discharge of landslide dams. Landslides 2022, 19, 573–587. [Google Scholar] [CrossRef]
- Hanson, G.J.; Cook, K.R.; Hunt, S.L. Physical modeling of overtopping erosion and breach formation of cohesive embankments. Trans. Asae 2005, 48, 1783–1794. [Google Scholar] [CrossRef]
- Kuang, S.F.; Wang, X.G.; Huang, J.C.; Wei, Y.Q. Risk analysis and impact assessment of dam-break in landslide lake. Chin. Water Res. 2008, 16, 17–21. (In Chinese) [Google Scholar]
- Schuster, R.L. A worldwide perspective on landslide dams. In Usoi Landslide Dam and Lake Sarez—An Assessment of Hazard and Risk in the Pamir Mountains; ISDR Prevention Series 1; Tajikistan, UN: Dushanbe, Tajikistan, 2000; pp. 19–22. [Google Scholar]
- Temple, D.M. Estimating Flood Damage to Vegetated Deep Soil Spillways. Appl. Eng. Agric. 1992, 8, 237–242. [Google Scholar] [CrossRef]
- Bennett, S.J.; Casalí, J. Effect of initial step height on headcut development in upland concentrated flows. Water Resour. Res. 2001, 37, 1475–1484. [Google Scholar] [CrossRef]
- Mitchener, H.; Torfs, H. Erosion of mud/sand mixtures. Coast. Eng. 1996, 29, 1–25. [Google Scholar] [CrossRef]
- Annandale, G.W. Scour Technology: Mechanics and Engineering Practice; McGrawHill: New York, NY, USA, 2006. [Google Scholar]
- Singh, V.P.; Scarlatos, P.D. Analysis of Gradual Earth-Dam Failure. J. Hydraul. Eng. 1988, 114, 21–42. [Google Scholar] [CrossRef]
- Coleman, S.E.; Jack, R.C.; Melville, B.W. Overtopping breaching of noncohesive embankment dams. In Proceedings of the 27th Congress of the International Association for Hydraulic Research, San Francisco, CA, USA, 10–15 August 1997. [Google Scholar]
- Hanson, G.J.; Simon, A. Erodibility of cohesive streambeds in the loess area of the midwestern USA. Hydrol. Process. 2001, 15, 23–38. [Google Scholar] [CrossRef]
- Chen, Z.; Ma, L.; Yu, S.; Chen, S.; Zhou, X.; Sun, P.; Li, X. Back Analysis of the Draining Process of the Tangjiashan Barrier Lake. J. Hydraul. Eng. 2015, 141, 05014011. [Google Scholar] [CrossRef]
- Liu, W.; He, S. Dynamic simulation of a mountain disaster chain: Landslides, barrier lakes, and outburst floods. Nat. Hazards 2017, 90, 757–775. [Google Scholar] [CrossRef]
- Garcia-Castellanos, D.; O’connor, J.E. Outburst floods provide erodability estimates consistent with long-term landscape evolution. Sci. Rep. 2018, 8, 10573. [Google Scholar] [CrossRef]
- Chen, H.X.; Zhang, L.M. EDDA 1.0: Integrated simulation of debris flow erosion, deposition and property changes. Geosci. Model Dev. 2015, 8, 829–844. [Google Scholar] [CrossRef]
- Wu, W. Simplified Physically Based Model of Earthen Embankment Breaching. J. Hydraul. Eng. 2013, 139, 837–851. [Google Scholar] [CrossRef]
- Wang, Z.; Xu, Y. A study on channel scour rate of sediment laden flow and river bed inertia. J. Sediment Res. 1998, 2, 1–9. [Google Scholar]
- Smerdon, E.T.; Beasley, R.P. Critical tractive forces in cohesive soils. Agric. Eng. 1961, 42, 26–29. [Google Scholar]
- Amos, C.L.; Bergamasco, A.; Umgiesser, G.; Cappucci, S.; Cloutier, D.; DeNat, L.; Flindt, M.; Bonardi, M.; Cristante, S. The stability of tidal flats in Venice Lagoon—the results of in-situ measurements using two benthic, annular flumes. J. Mar. Syst. 2004, 51, 211–241. [Google Scholar] [CrossRef]


| Hd/Cd | Su | Sd | ||||
|---|---|---|---|---|---|---|
| Model dam | 1 | 26.6° | 33.7° | 0.22 | 1.66 | 2.53 |
| Natural landslide dams | 0.2–3.0 | 11–45° | 11–45° | 0.02–1 | 0.5–5 | 0.2–10 |
| Test No. | Dam Material | ρd (kg/m3) | d50 (mm) | p (%) | Qin (L/s) |
|---|---|---|---|---|---|
| 1 | Fine-grained | 1780 | 0.8 | 50.2 | 0.5 |
| 2 | 0.75 | ||||
| 3 | 1.0 | ||||
| 4 | Well-graded | 1780 | 3.8 | 33.5 | 0.5 |
| 5 | 0.75 | ||||
| 6 | 1.0 | ||||
| 7 | Coarse-grained | 1780 | 13.6 | 10.3 | 0.5 |
| 8 | 0.75 | ||||
| 9 | 1.0 | ||||
| 10 | 2.0 |
| Test No. | Failure Mode | Stage I | Stage II | Stage III | T (s) | |||||
|---|---|---|---|---|---|---|---|---|---|---|
| t1 (s) | Q1 (L/s) | r1 | t2 (s) | Qp (L/s) | tp (s) | r2 | t3 (s) | |||
| 1 | O | 32 | 0.29 | 0.018 | 116 | 2.86 | 75 | 0.120 | 139 | 287 |
| 2 | O | 34 | 0.55 | 0.022 | 87 | 3.13 | 70 | 0.096 | 128 | 249 |
| 3 | O | 31 | 0.80 | 0.026 | 73 | 3.40 | 60 | 0.090 | 107 | 211 |
| 4 | O | 221 | 0.70 | 0.006 | 58 | 1.21 | 245 | 0.043 | 83 | 362 |
| 5 | O | 197 | 0.97 | 0.007 | 76 | 2.57 | 230 | 0.065 | 72 | 345 |
| 6 | O | 114 | 1.21 | 0.011 | 64 | 3.02 | 145 | 0.058 | 63 | 241 |
| 7 | N | / | ||||||||
| 8 | N | / | ||||||||
| 9 | S/N | / | ||||||||
| 10 | O | 41 | 1.79 | 0.022 | 37 | 5.29 | 55 | 0.125 | 17 | 95 |
| Test No. | t1–2 (s) | Headward Erosion | Vertical Erosion | Lateral Erosion | ||||||
|---|---|---|---|---|---|---|---|---|---|---|
| d (mm) | Eh (mm/s) | Z (mm) | Ev (mm/s) | Bt (mm) | El (mm/s) | |||||
| 1 | 148 | 180 | 615 | 4.16 | 37 | 153 | 1.03 | 230 | 150 | 1.01 |
| 2 | 121 | 176 | 619 | 5.12 | 18 | 172 | 1.42 | 205 | 125 | 1.03 |
| 3 | 104 | 158 | 637 | 6.13 | 20 | 170 | 1.63 | 190 | 110 | 1.06 |
| 4 | 279 | 324 | 471 | 1.69 | 126 | 64 | 0.23 | 150 | 70 | 0.25 |
| 5 | 273 | 240 | 555 | 2.03 | 65 | 125 | 0.46 | 195 | 115 | 0.42 |
| 6 | 178 | 226 | 569 | 3.20 | 60 | 130 | 0.73 | 182 | 102 | 0.57 |
| 7–9 | No failure | |||||||||
| 10 | 78 | 312 | 483 | 6.19 | 91 | 99 | 1.27 | 288 | 208 | 2.67 |
| Dam Material | The Coefficient of Erodibility Kd (m3/N-s) | The Critical Shear Stress τc (Pa) | ||||
|---|---|---|---|---|---|---|
| Fine-grained | Experimental results | |||||
| ‘U’ | ‘M’ | ‘D’ | ‘U’ | ‘M’ | ‘D’ | |
| 2.20 | 2.18 | 2.16 | 0.89 | 0.83 | 1.88 | |
| Calculated results from empirical equations | ||||||
| 2.20 | 1.97 | |||||
| 0.69 | ||||||
| Well-graded | Experimental results | |||||
| ‘U’ | ‘M’ | ‘D’ | ‘U’ | ‘M’ | ‘D’ | |
| 0.83 | 0.86 | 0.85 | 1.41 | 1.49 | 2.92 | |
| Calculated results from empirical equations | ||||||
| 1.03 | 3.14 | |||||
| 1.22 | ||||||
| Test No. | Total Number | Spatial Distribution | Time Distribution | |||
|---|---|---|---|---|---|---|
| Upstream Slope | Dam Middle | Downstream Slope | Stage I | Stage II | ||
| 1 | 15 | 2 | 5 | 8 | 3 | 12 |
| 2 | 17 | 1 | 5 | 11 | 3 | 14 |
| 3 | 16 | 0 | 6 | 10 | 3 | 13 |
| 4 | 47 | 1 | 27 | 19 | 27 | 20 |
| 5 | 38 | 2 | 21 | 15 | 25 | 13 |
| 6 | 45 | 4 | 25 | 16 | 31 | 14 |
Publisher’s Note: MDPI stays neutral with regard to jurisdictional claims in published maps and institutional affiliations. |
© 2022 by the authors. Licensee MDPI, Basel, Switzerland. This article is an open access article distributed under the terms and conditions of the Creative Commons Attribution (CC BY) license (https://creativecommons.org/licenses/by/4.0/).
Share and Cite
Shi, Z.; Zhang, G.; Peng, M.; Zhang, Q.; Zhou, Y.; Zhou, M. Experimental Investigation on the Breaching Process of Landslide Dams with Differing Materials under Different Inflow Conditions. Materials 2022, 15, 2029. https://doi.org/10.3390/ma15062029
Shi Z, Zhang G, Peng M, Zhang Q, Zhou Y, Zhou M. Experimental Investigation on the Breaching Process of Landslide Dams with Differing Materials under Different Inflow Conditions. Materials. 2022; 15(6):2029. https://doi.org/10.3390/ma15062029
Chicago/Turabian StyleShi, Zhenming, Gongding Zhang, Ming Peng, Qingzhao Zhang, Yuanyuan Zhou, and Mingjun Zhou. 2022. "Experimental Investigation on the Breaching Process of Landslide Dams with Differing Materials under Different Inflow Conditions" Materials 15, no. 6: 2029. https://doi.org/10.3390/ma15062029
APA StyleShi, Z., Zhang, G., Peng, M., Zhang, Q., Zhou, Y., & Zhou, M. (2022). Experimental Investigation on the Breaching Process of Landslide Dams with Differing Materials under Different Inflow Conditions. Materials, 15(6), 2029. https://doi.org/10.3390/ma15062029