
Effects of Class C and Class F Fly Ash on Mechanical and Microstructural Behavior of Clay Soil—A Comparative Study


Abstract
:1. Introduction
2. Materials Characterization
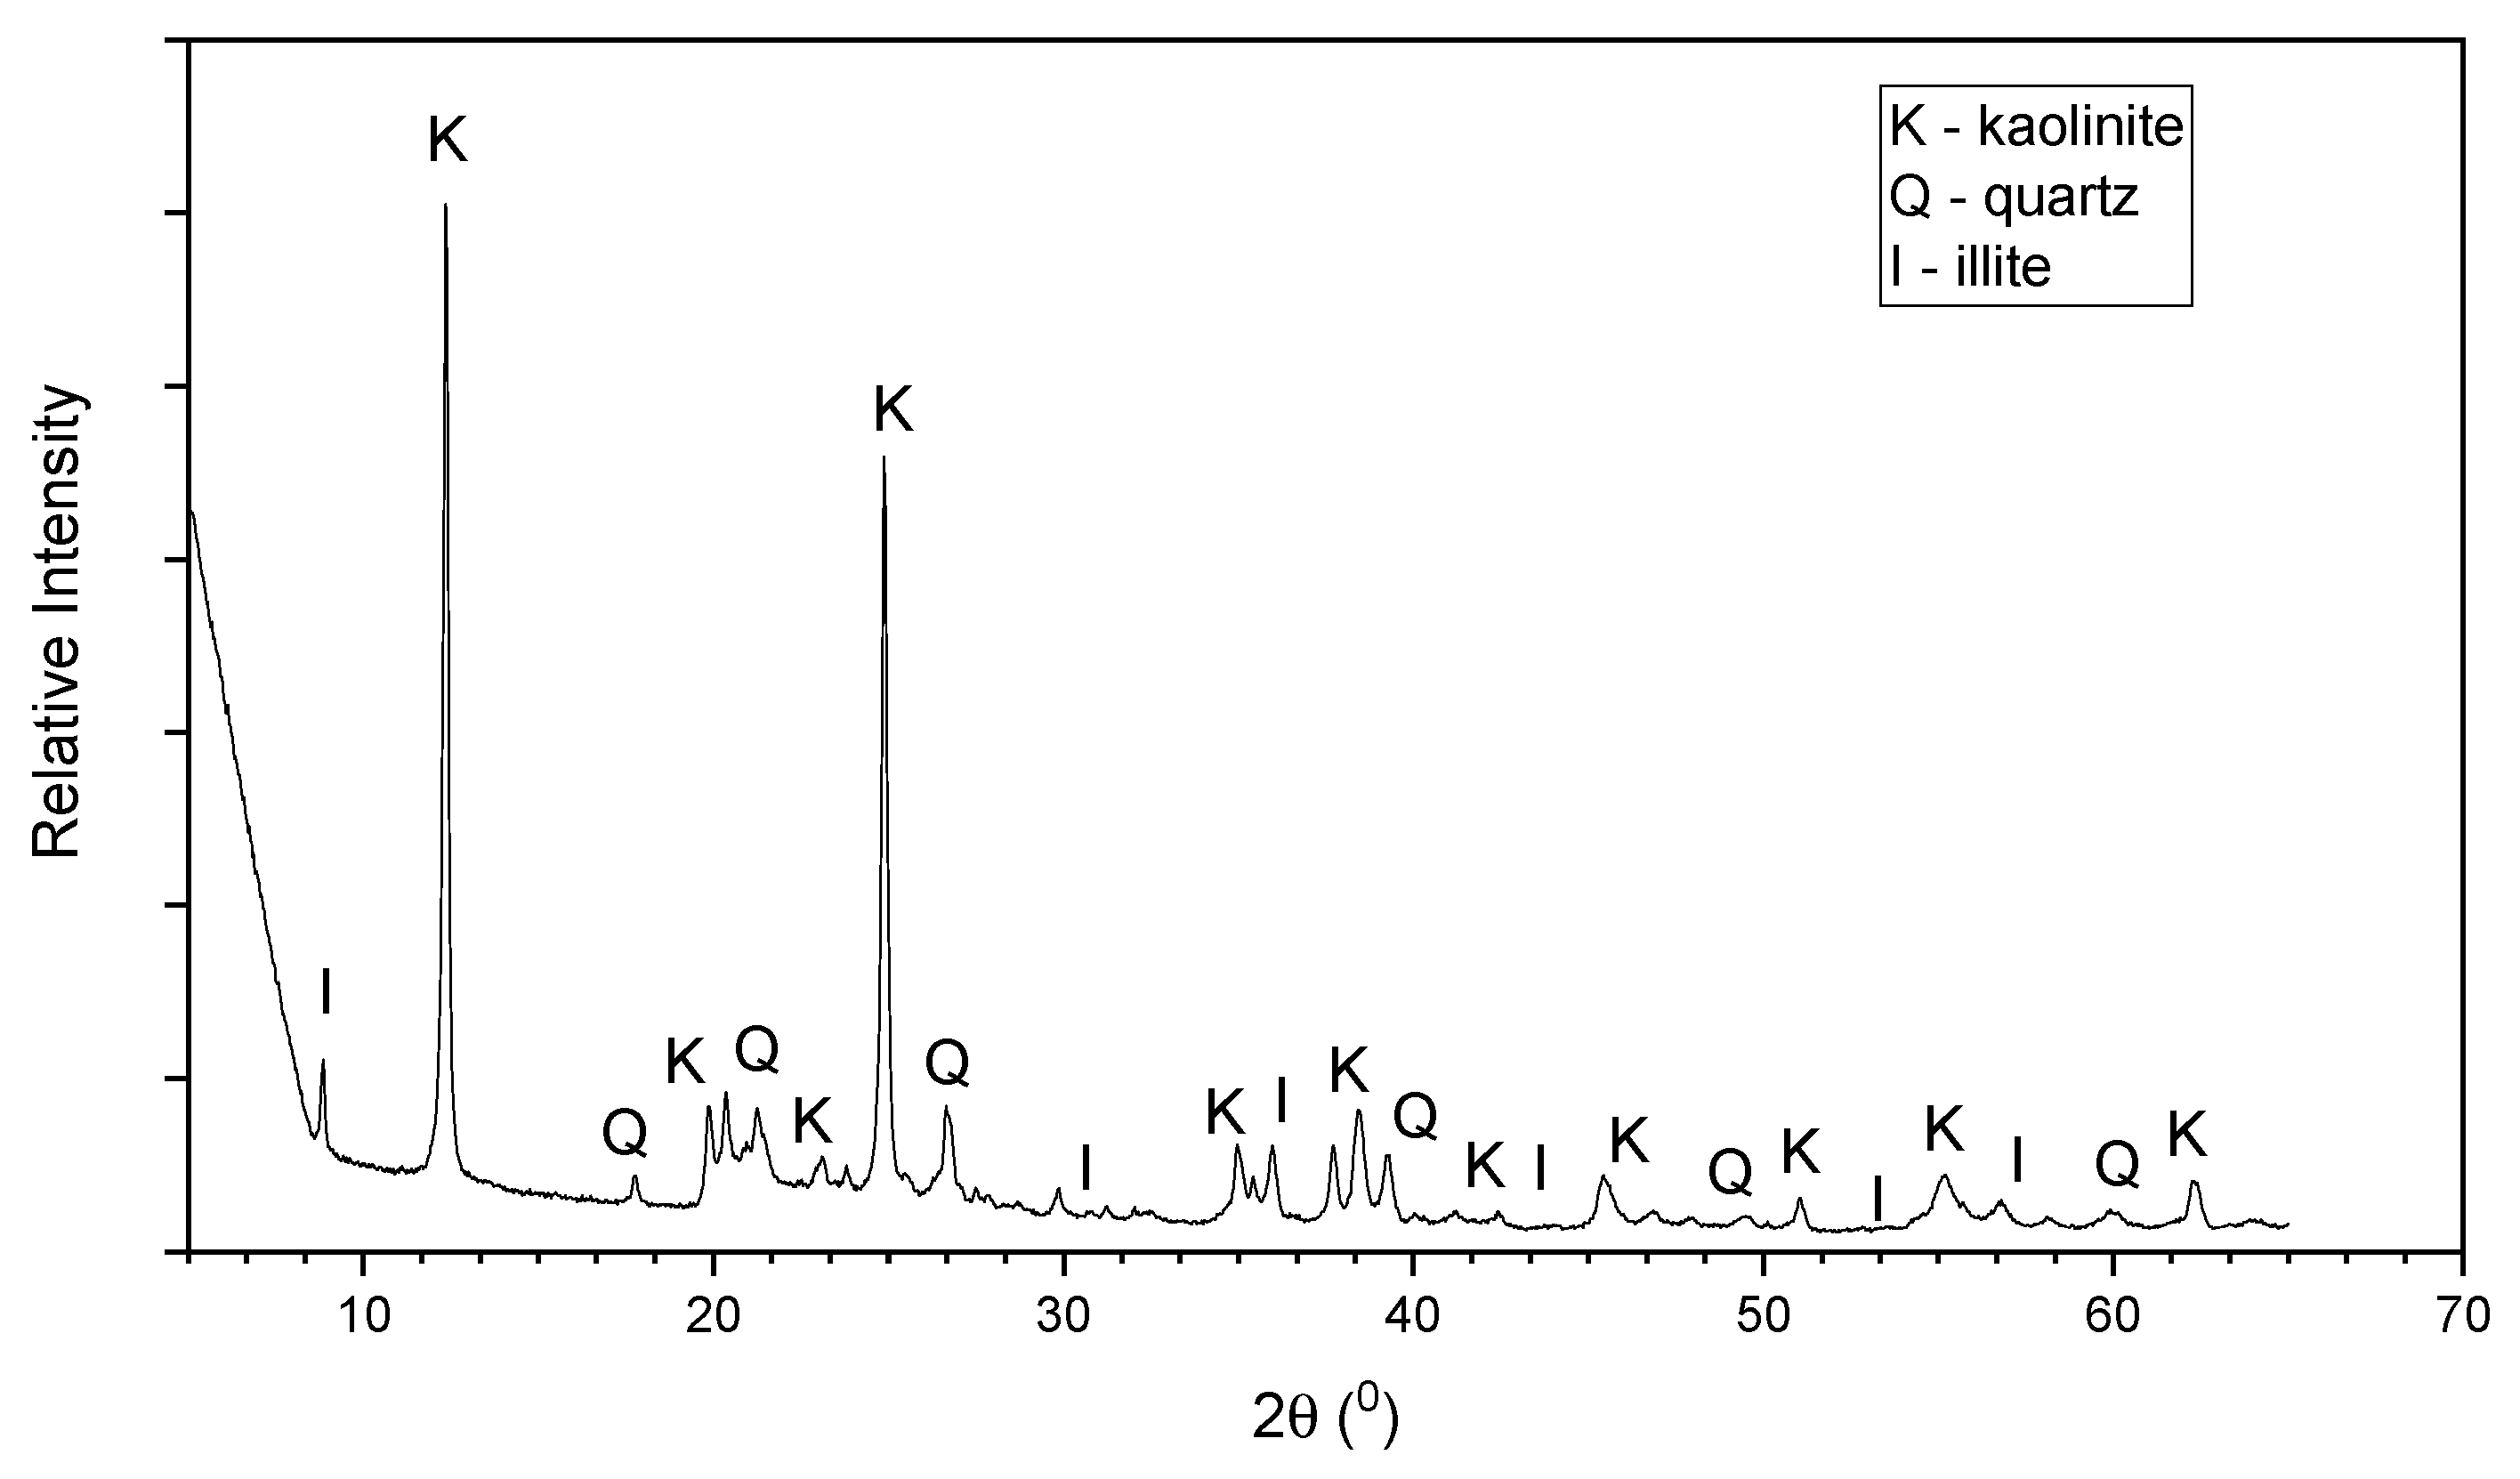
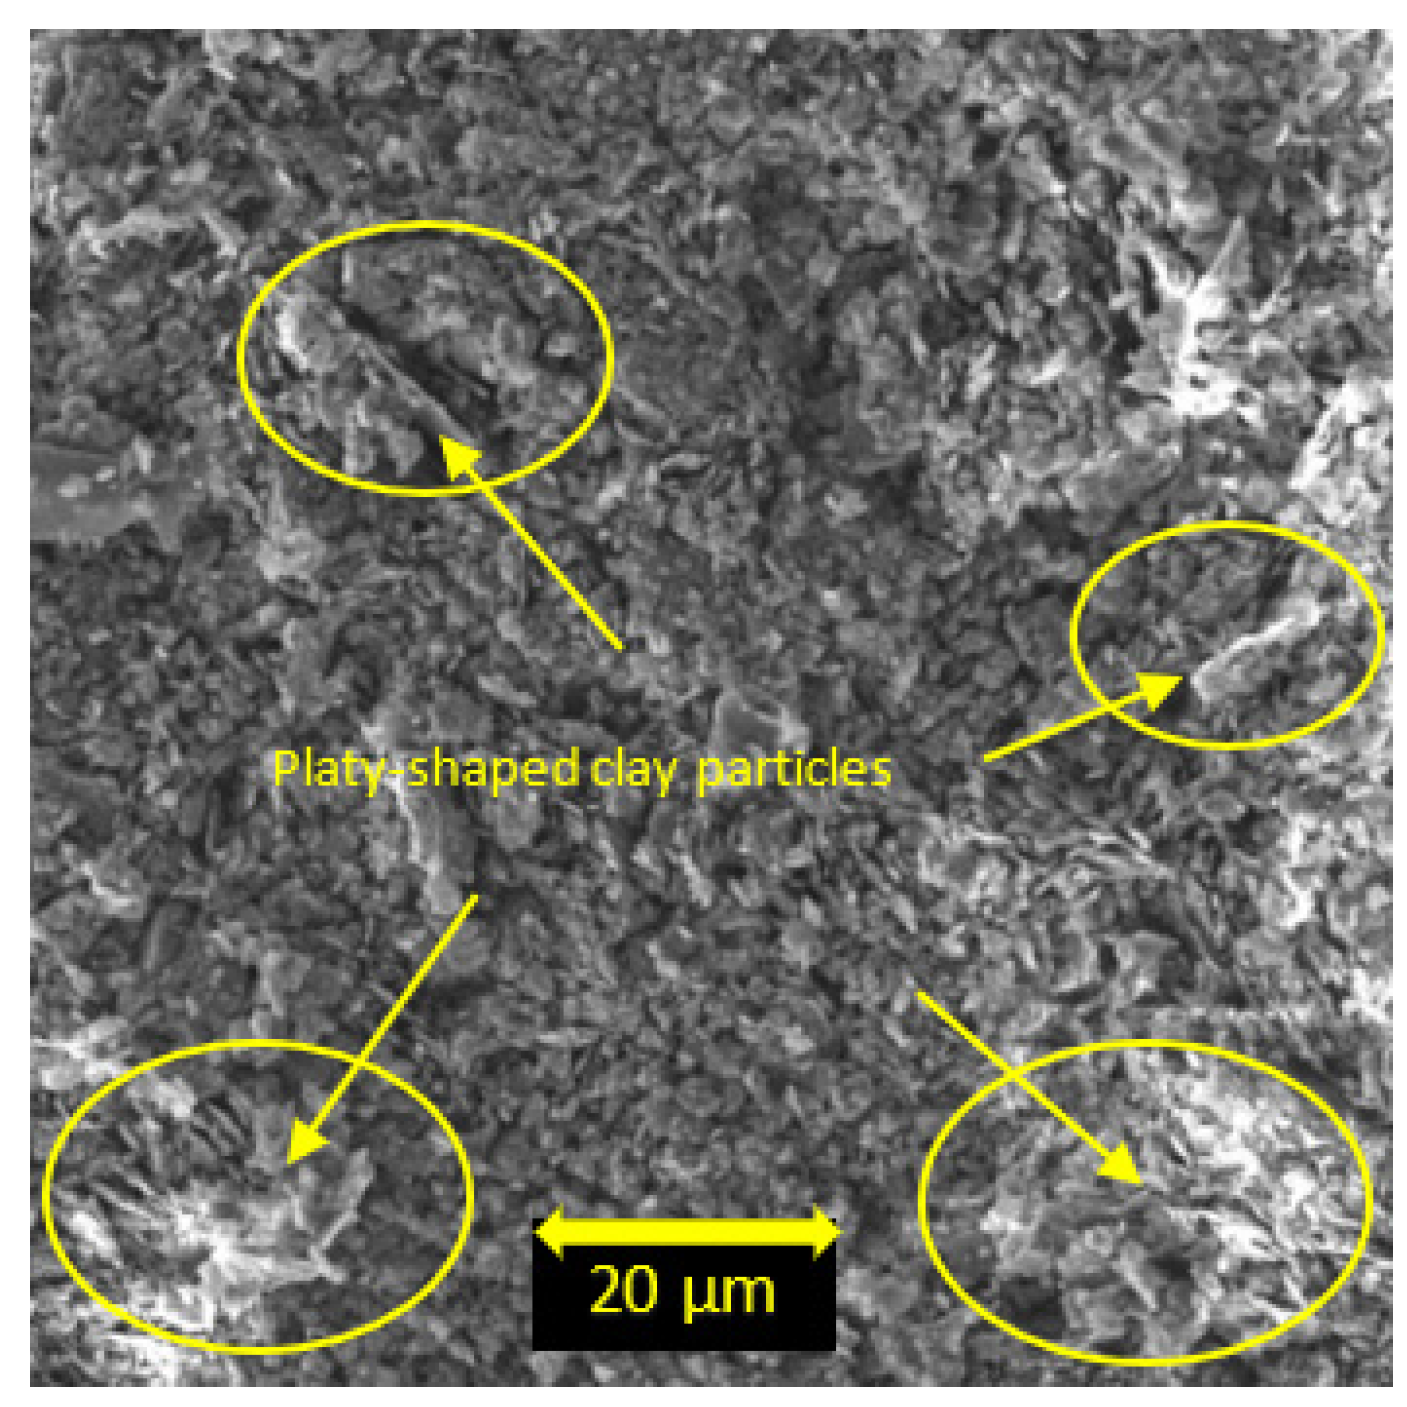
2.1. Soil
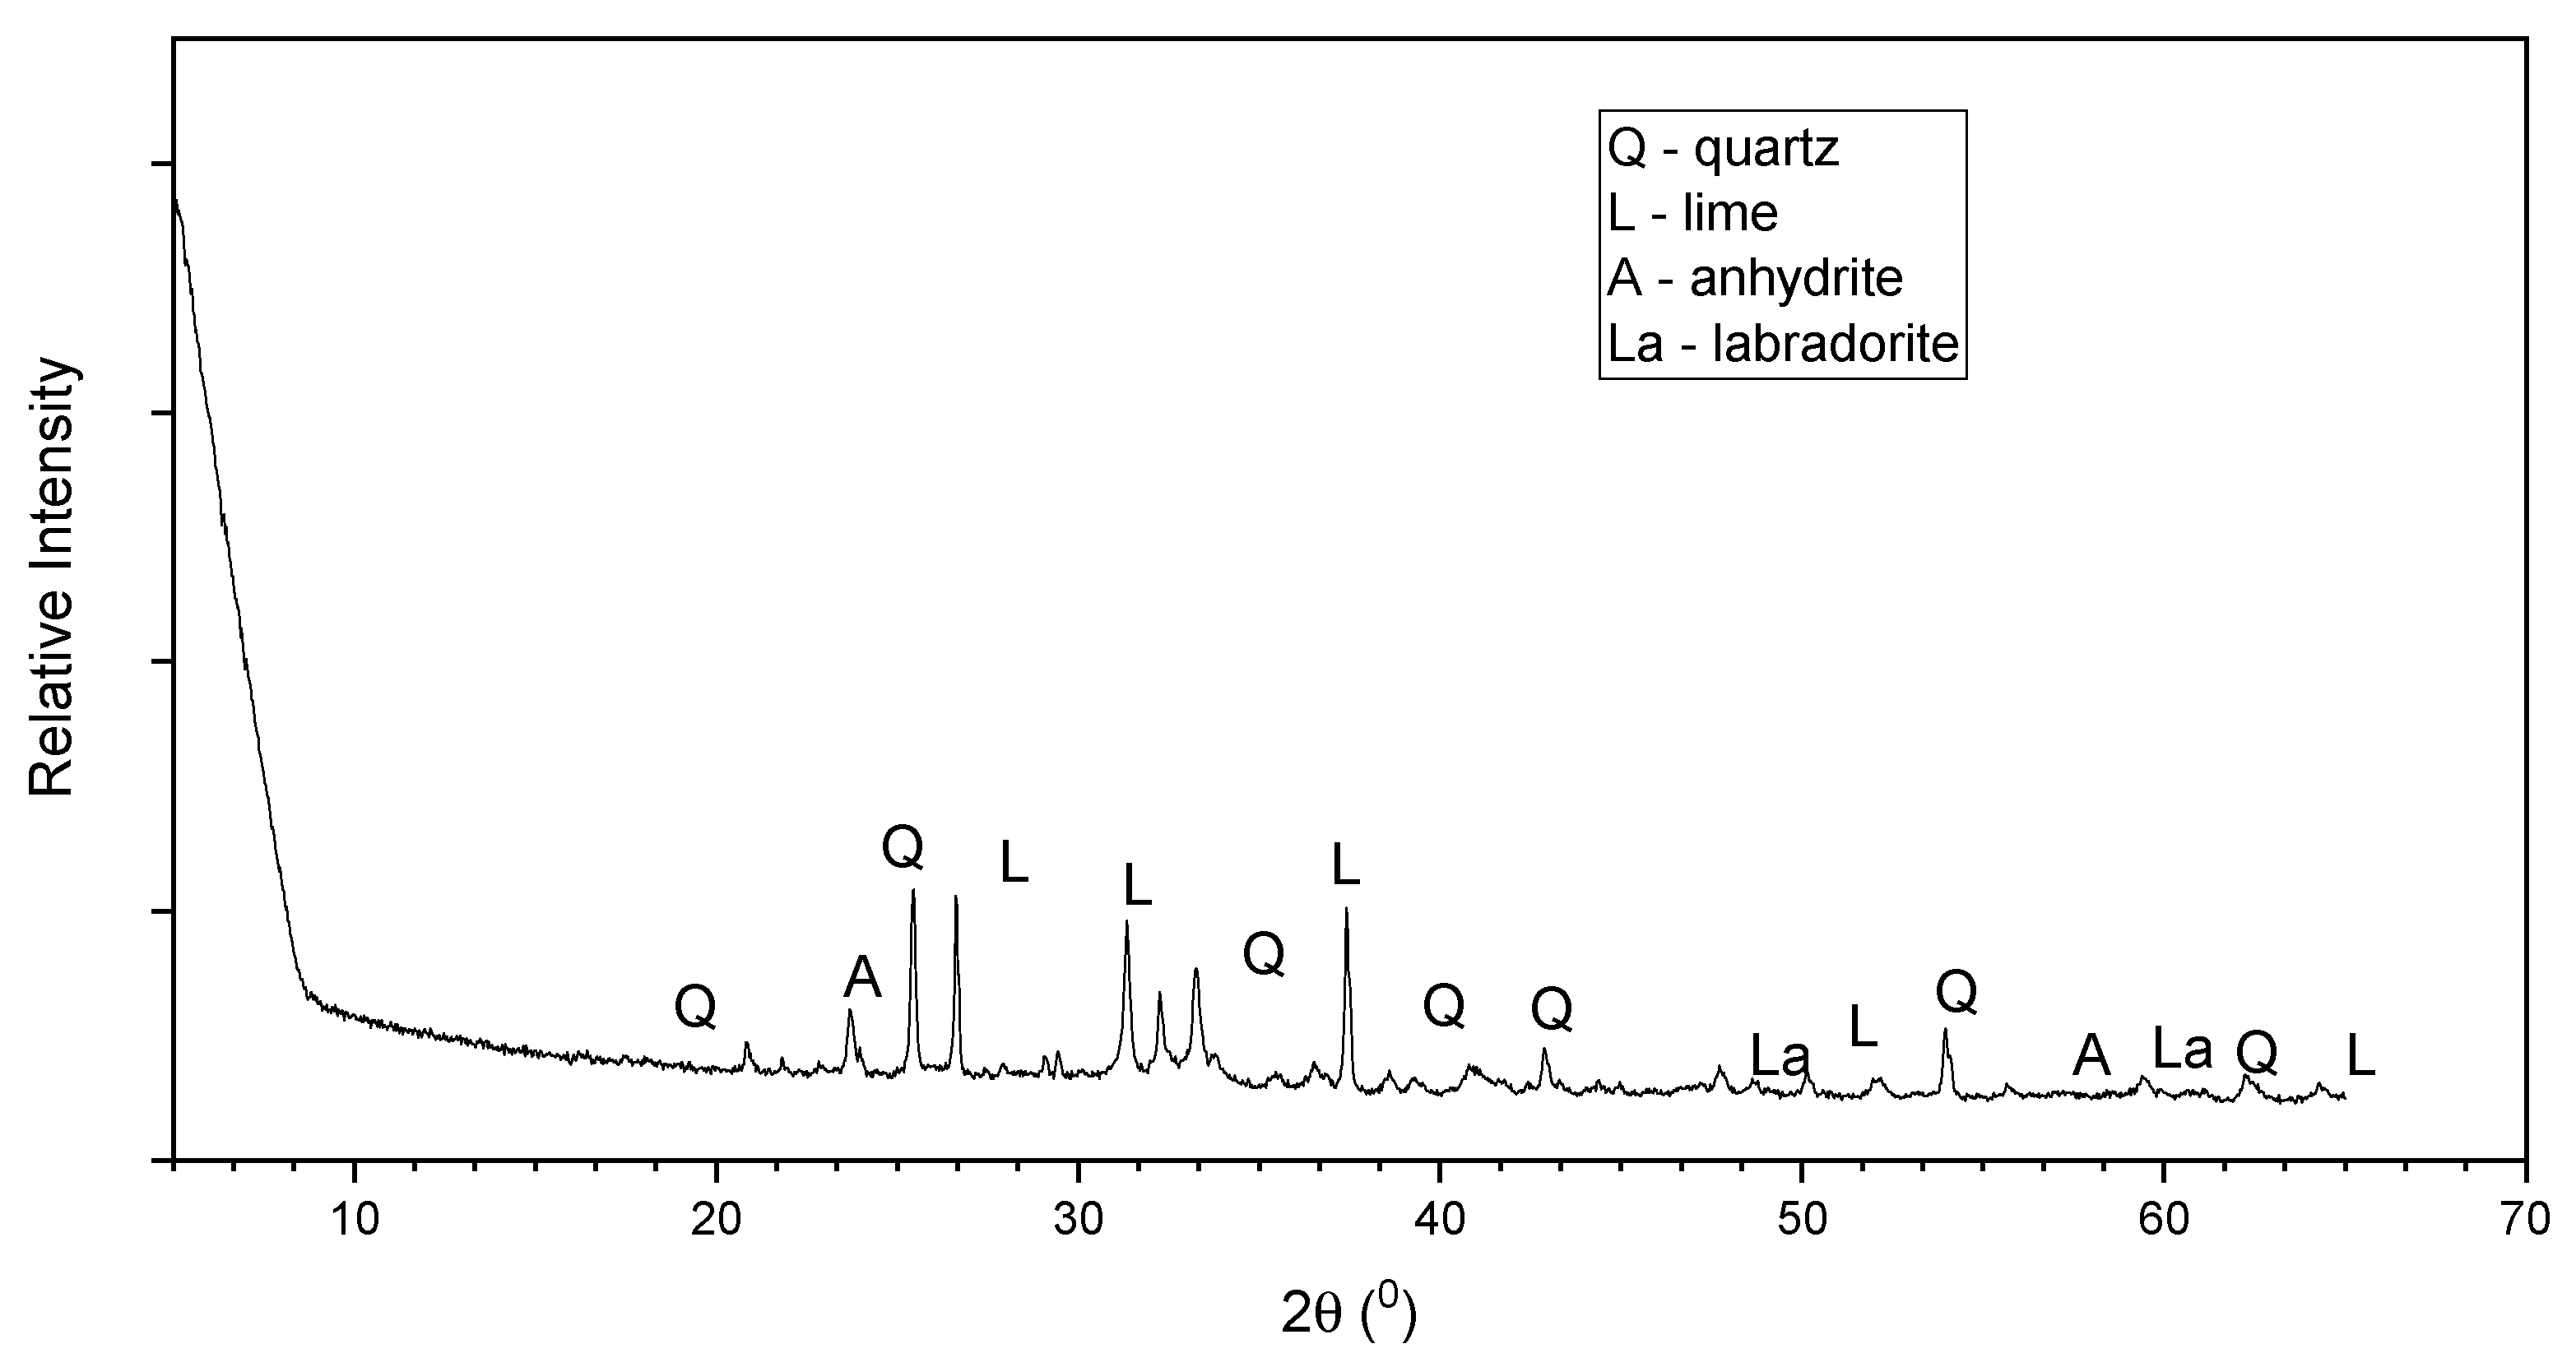
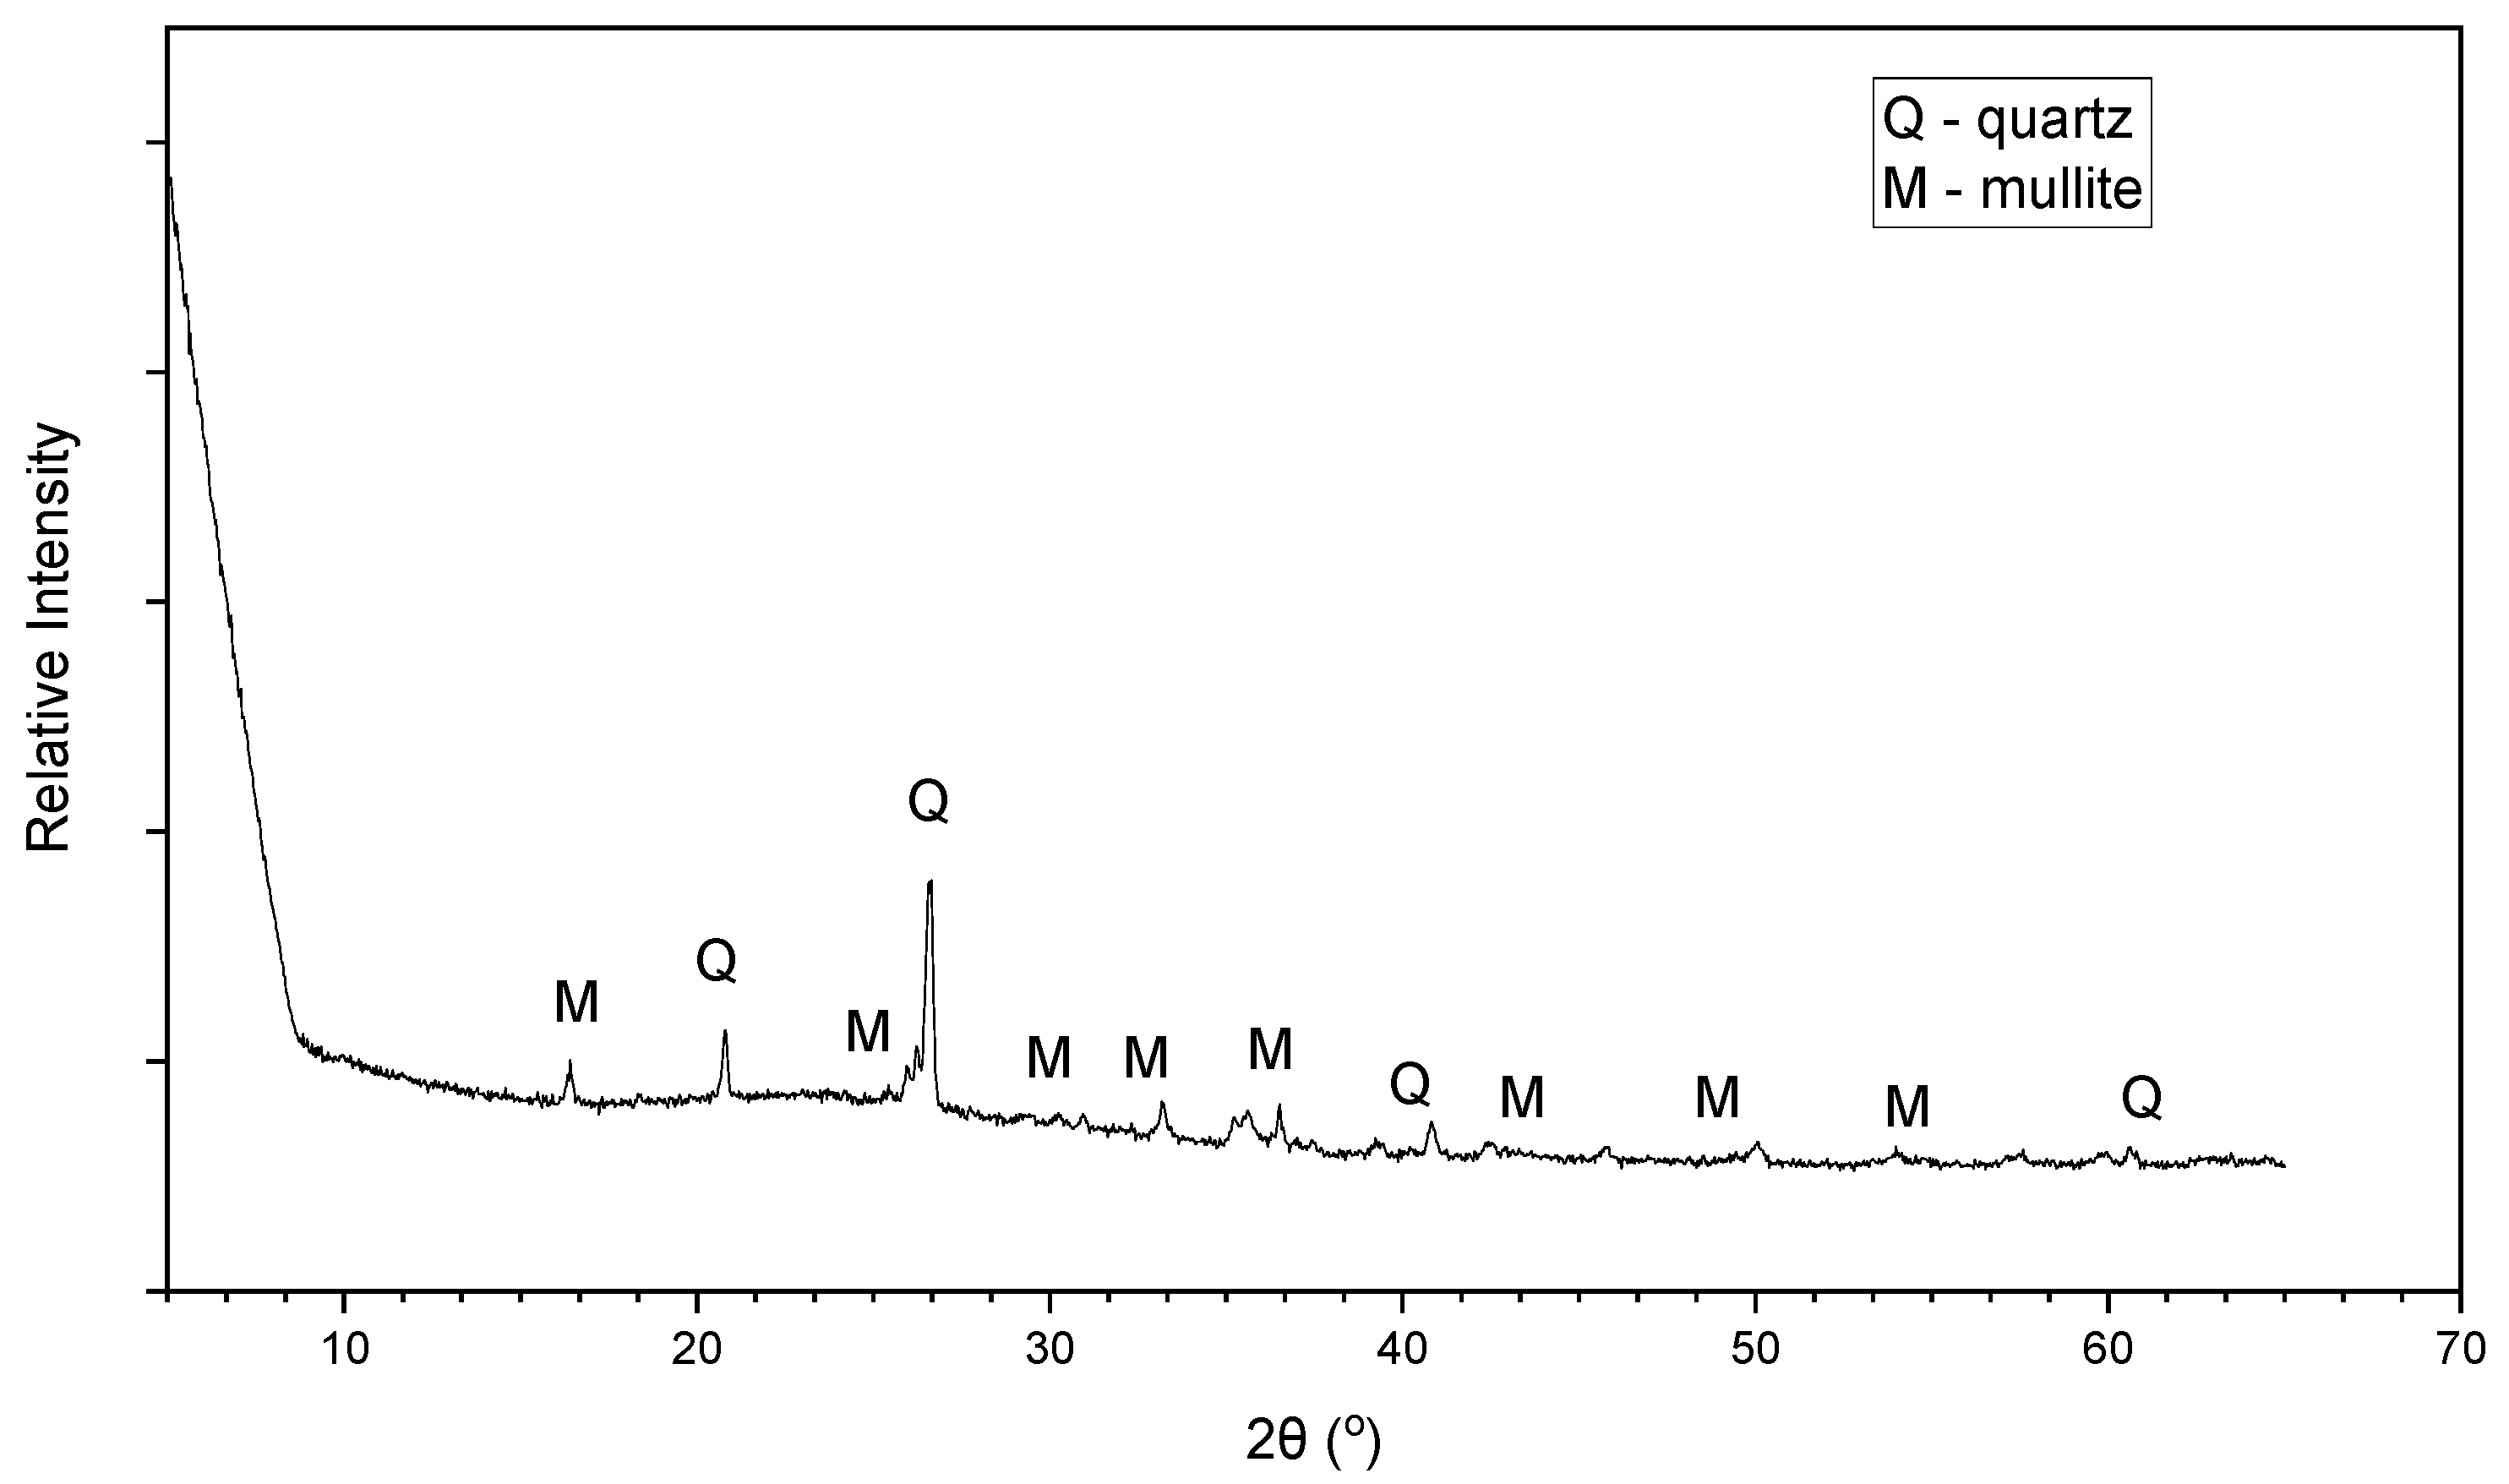
2.2. Fly Ashes
3. Sample Preparation
4. Experimental Program
4.1. Compaction Tests
4.2. Unconfined Compressive Strength Tests
4.3. Consolidated-Undrained Triaxial Tests
4.4. One-Dimensional Consolidation Tests
4.5. Scanning Electron Microscopy
5. Results and Discussion
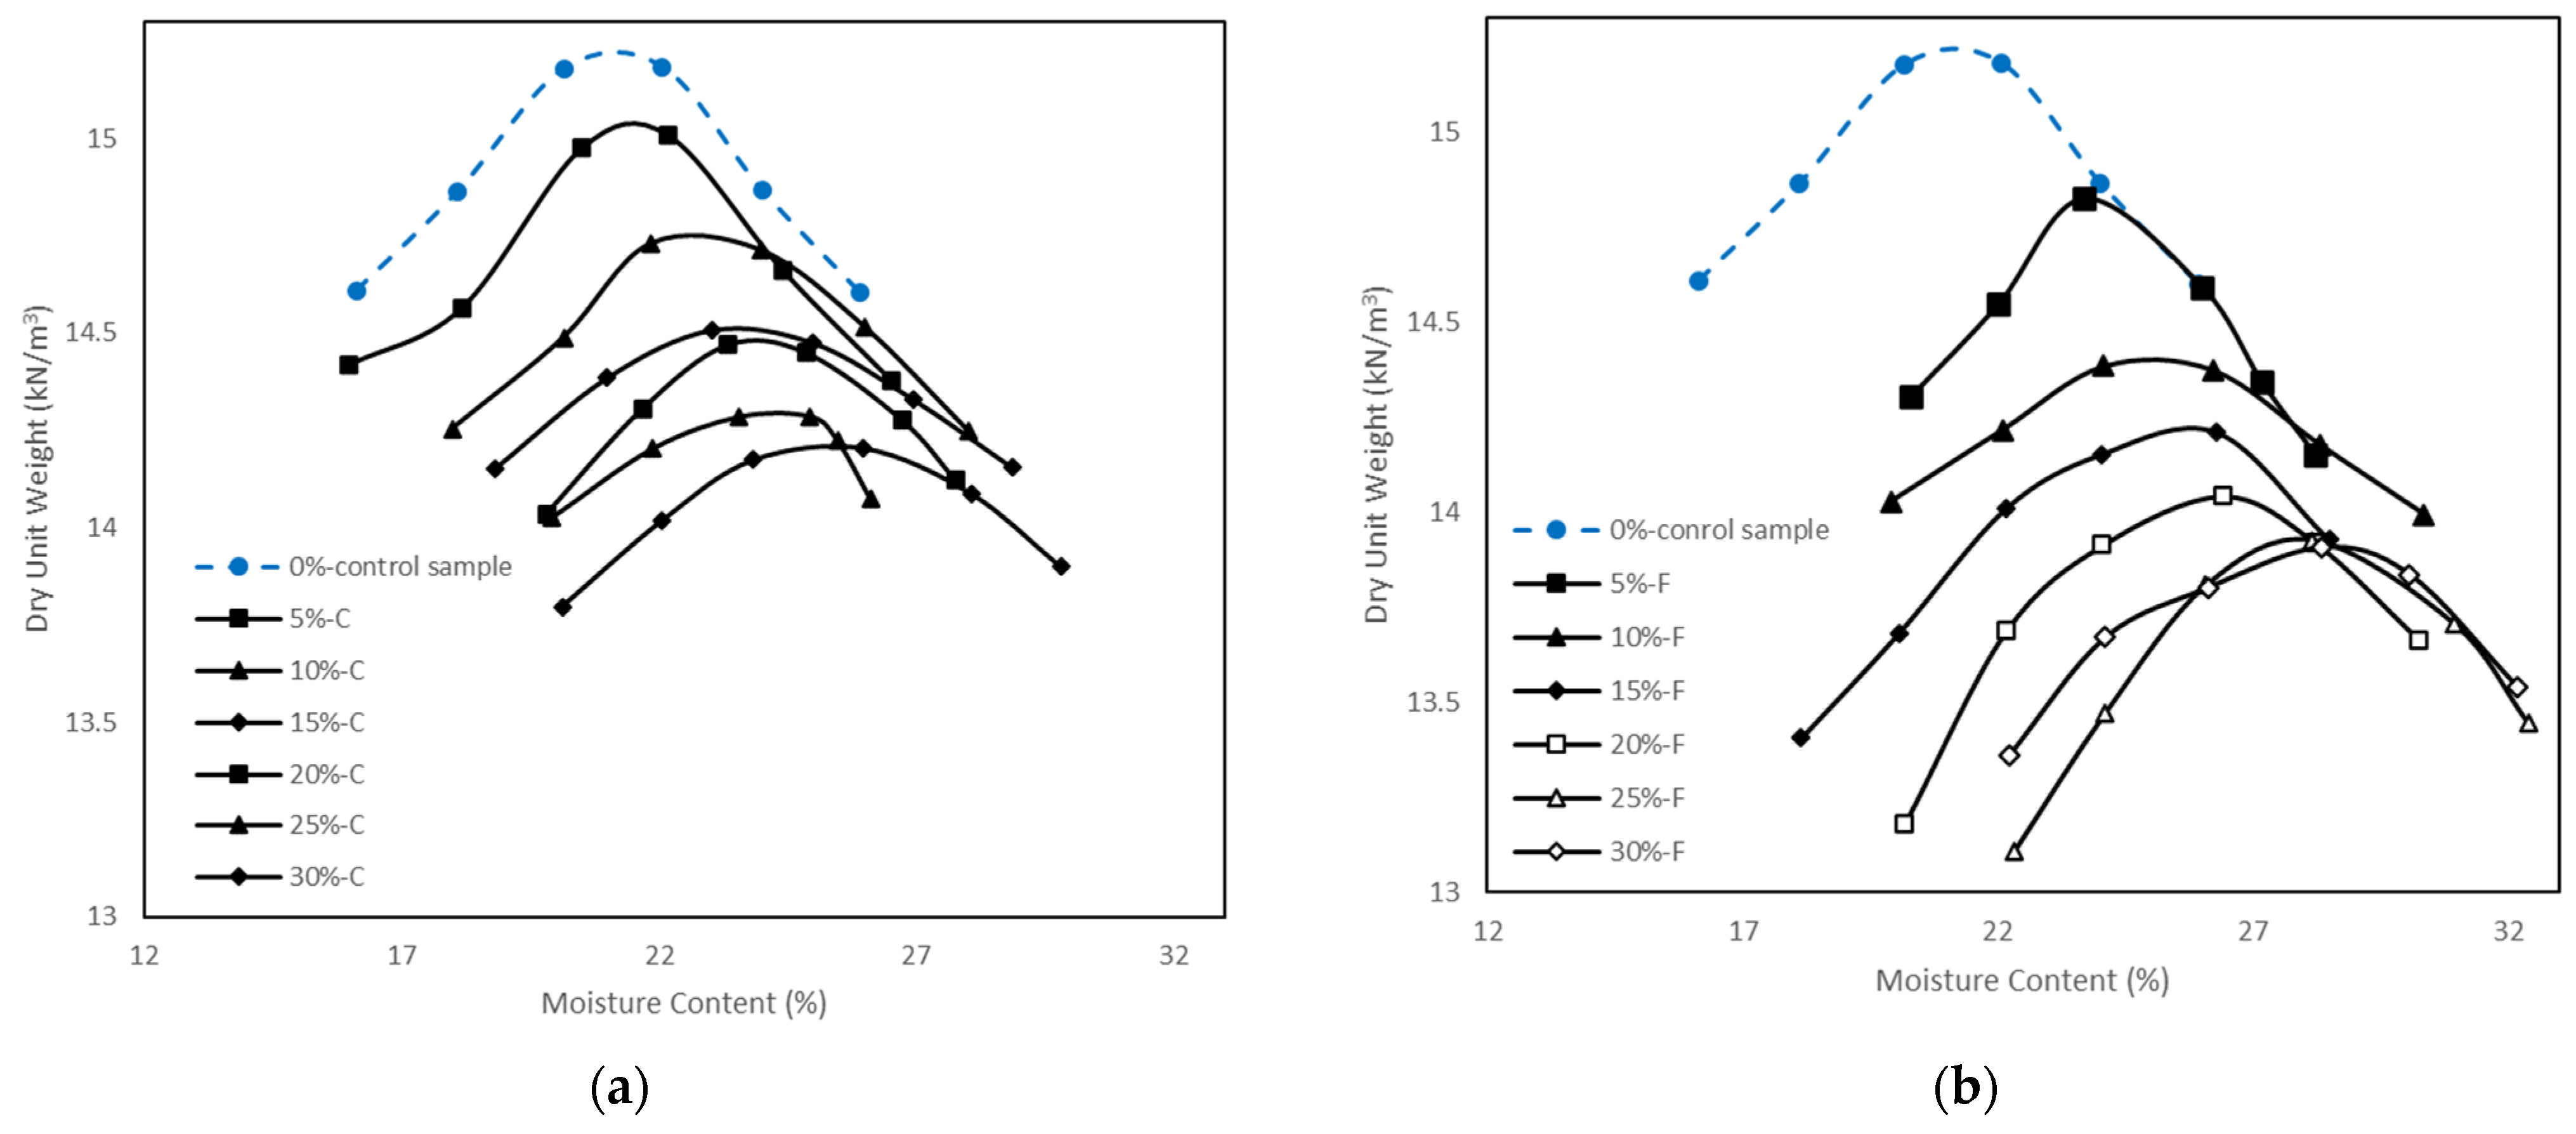
5.1. Compaction Tests
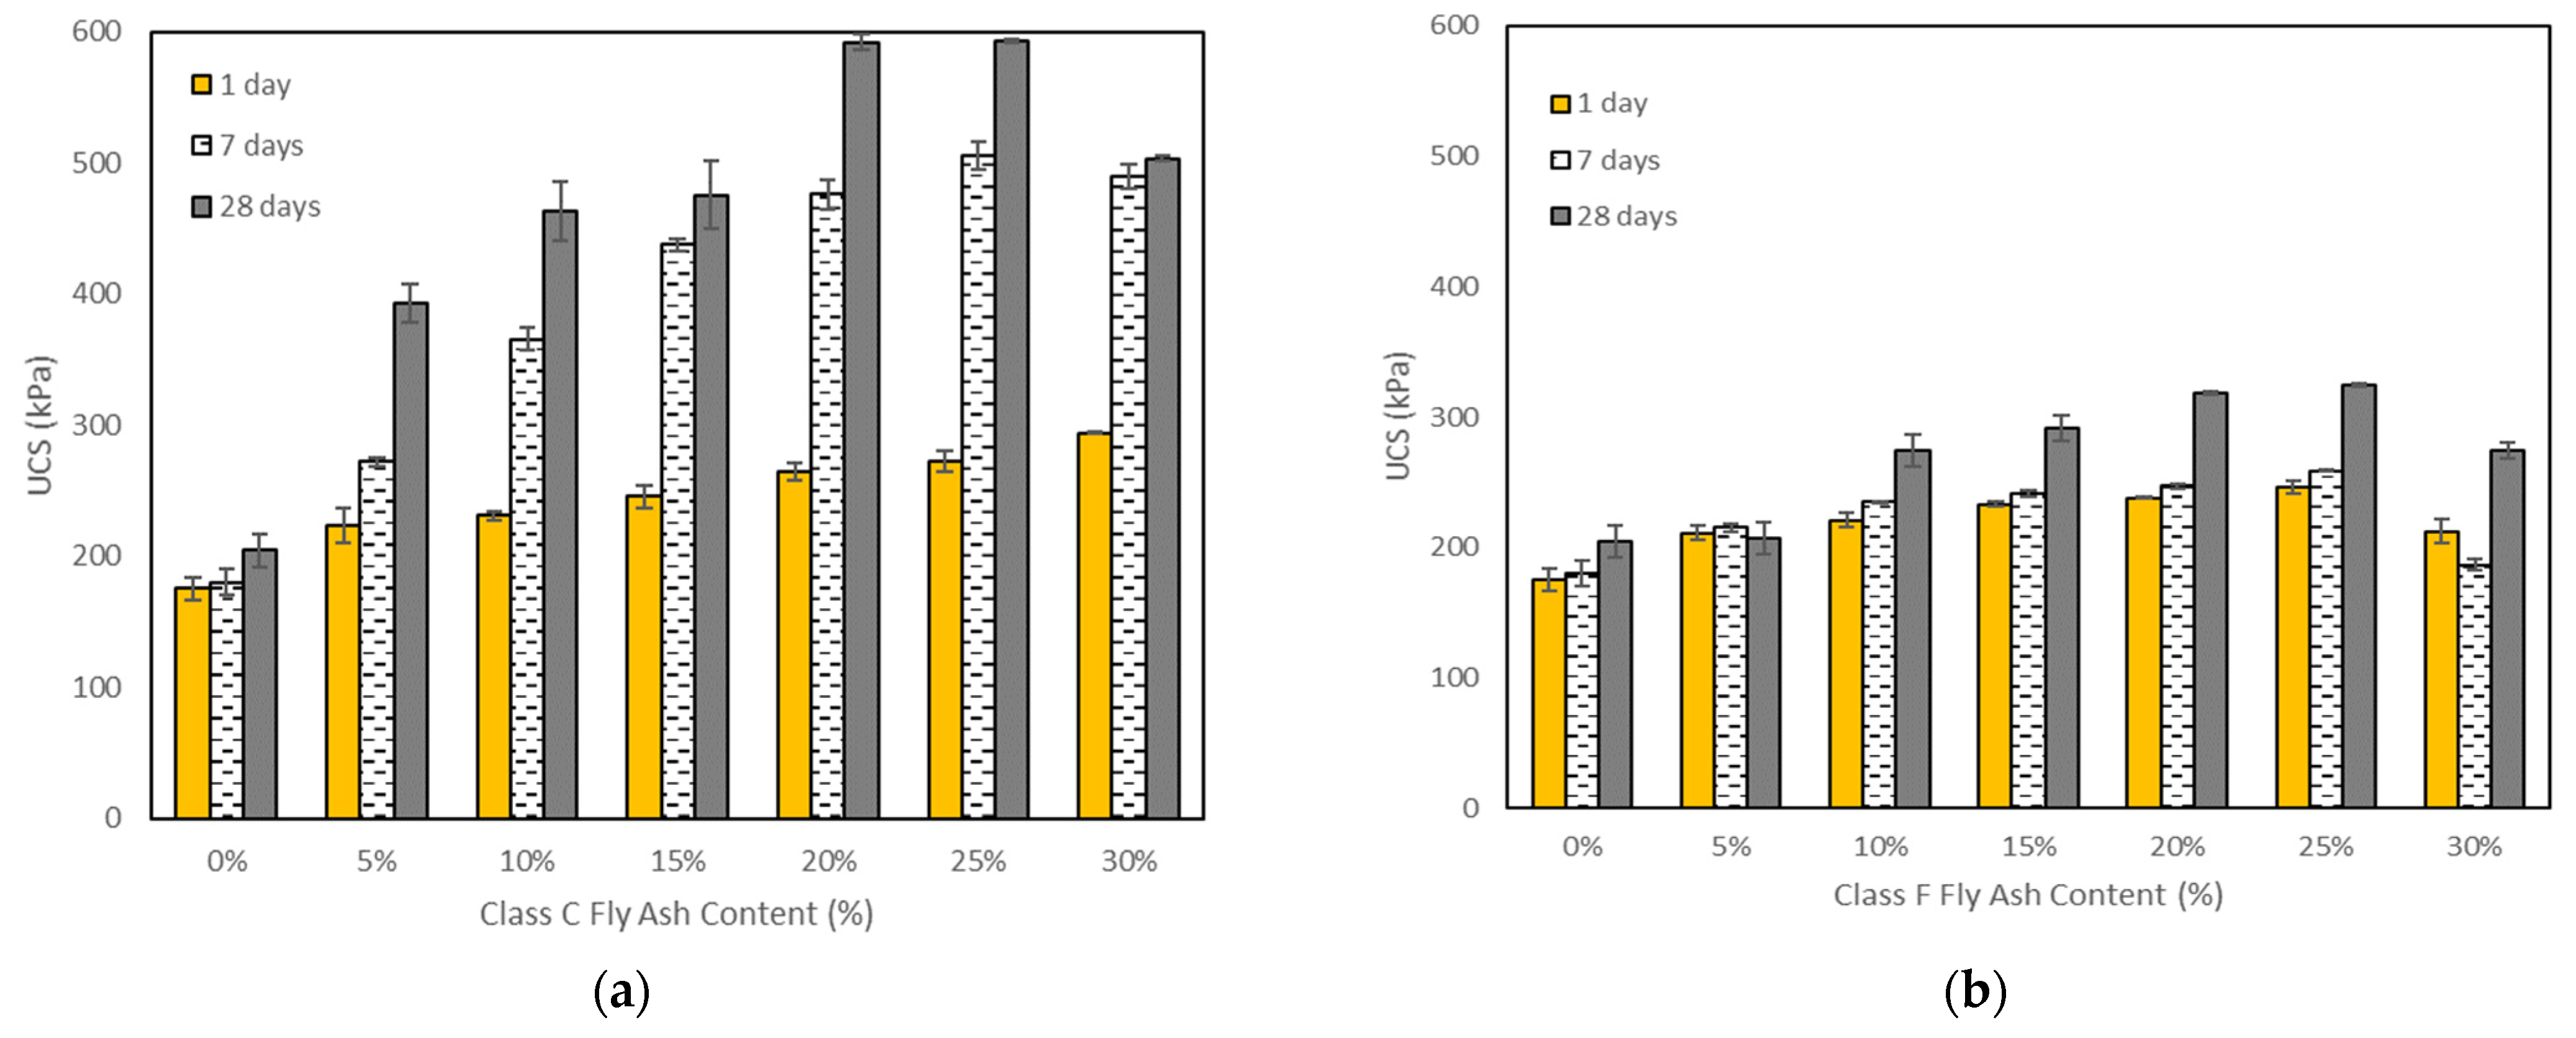
5.2. Unconfined Compressive Strength Tests
5.3. Triaxial Tests
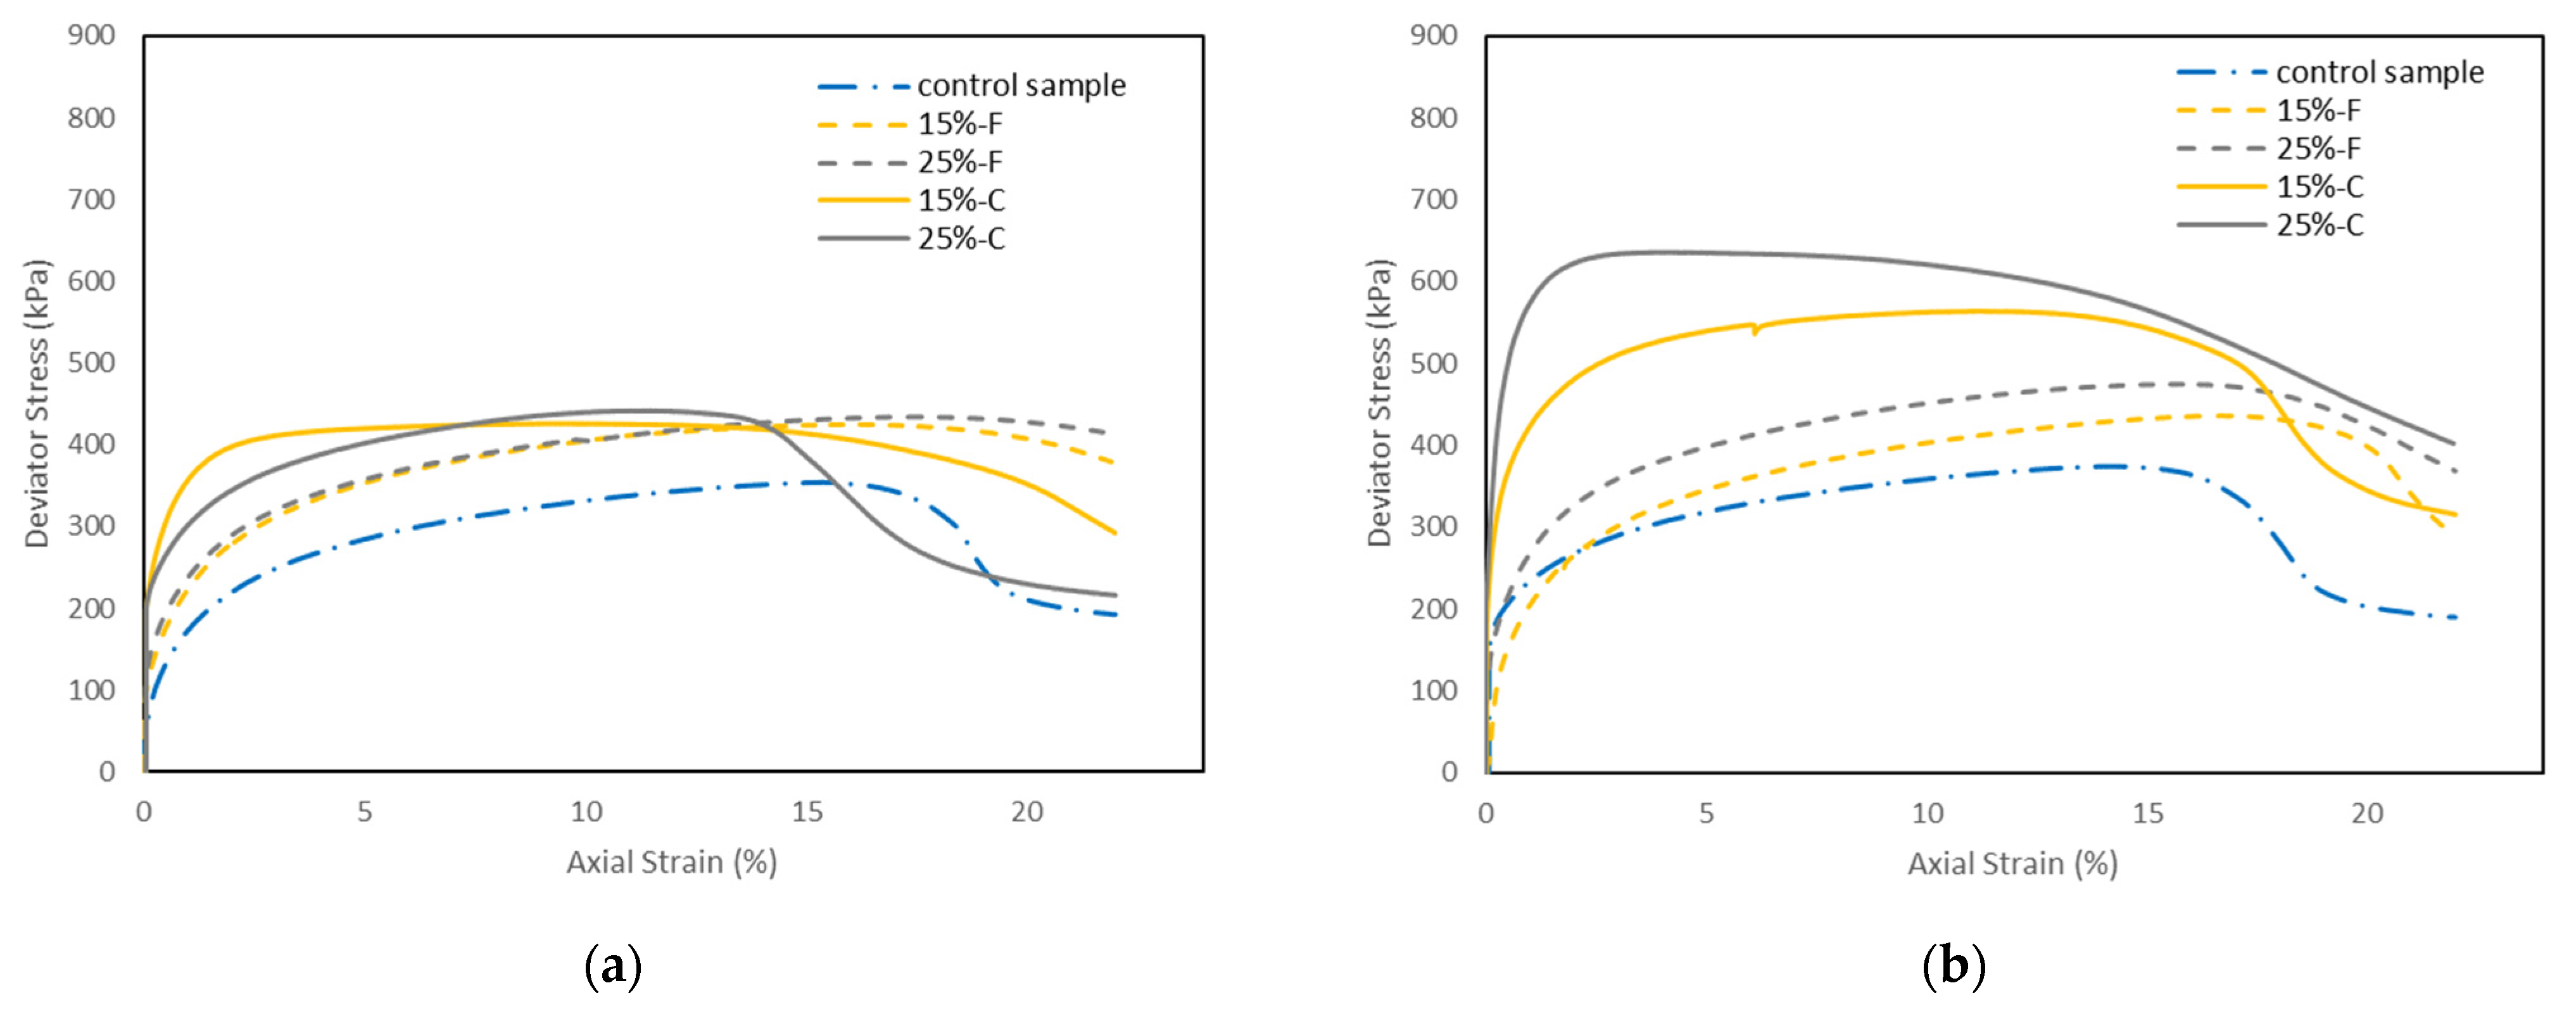
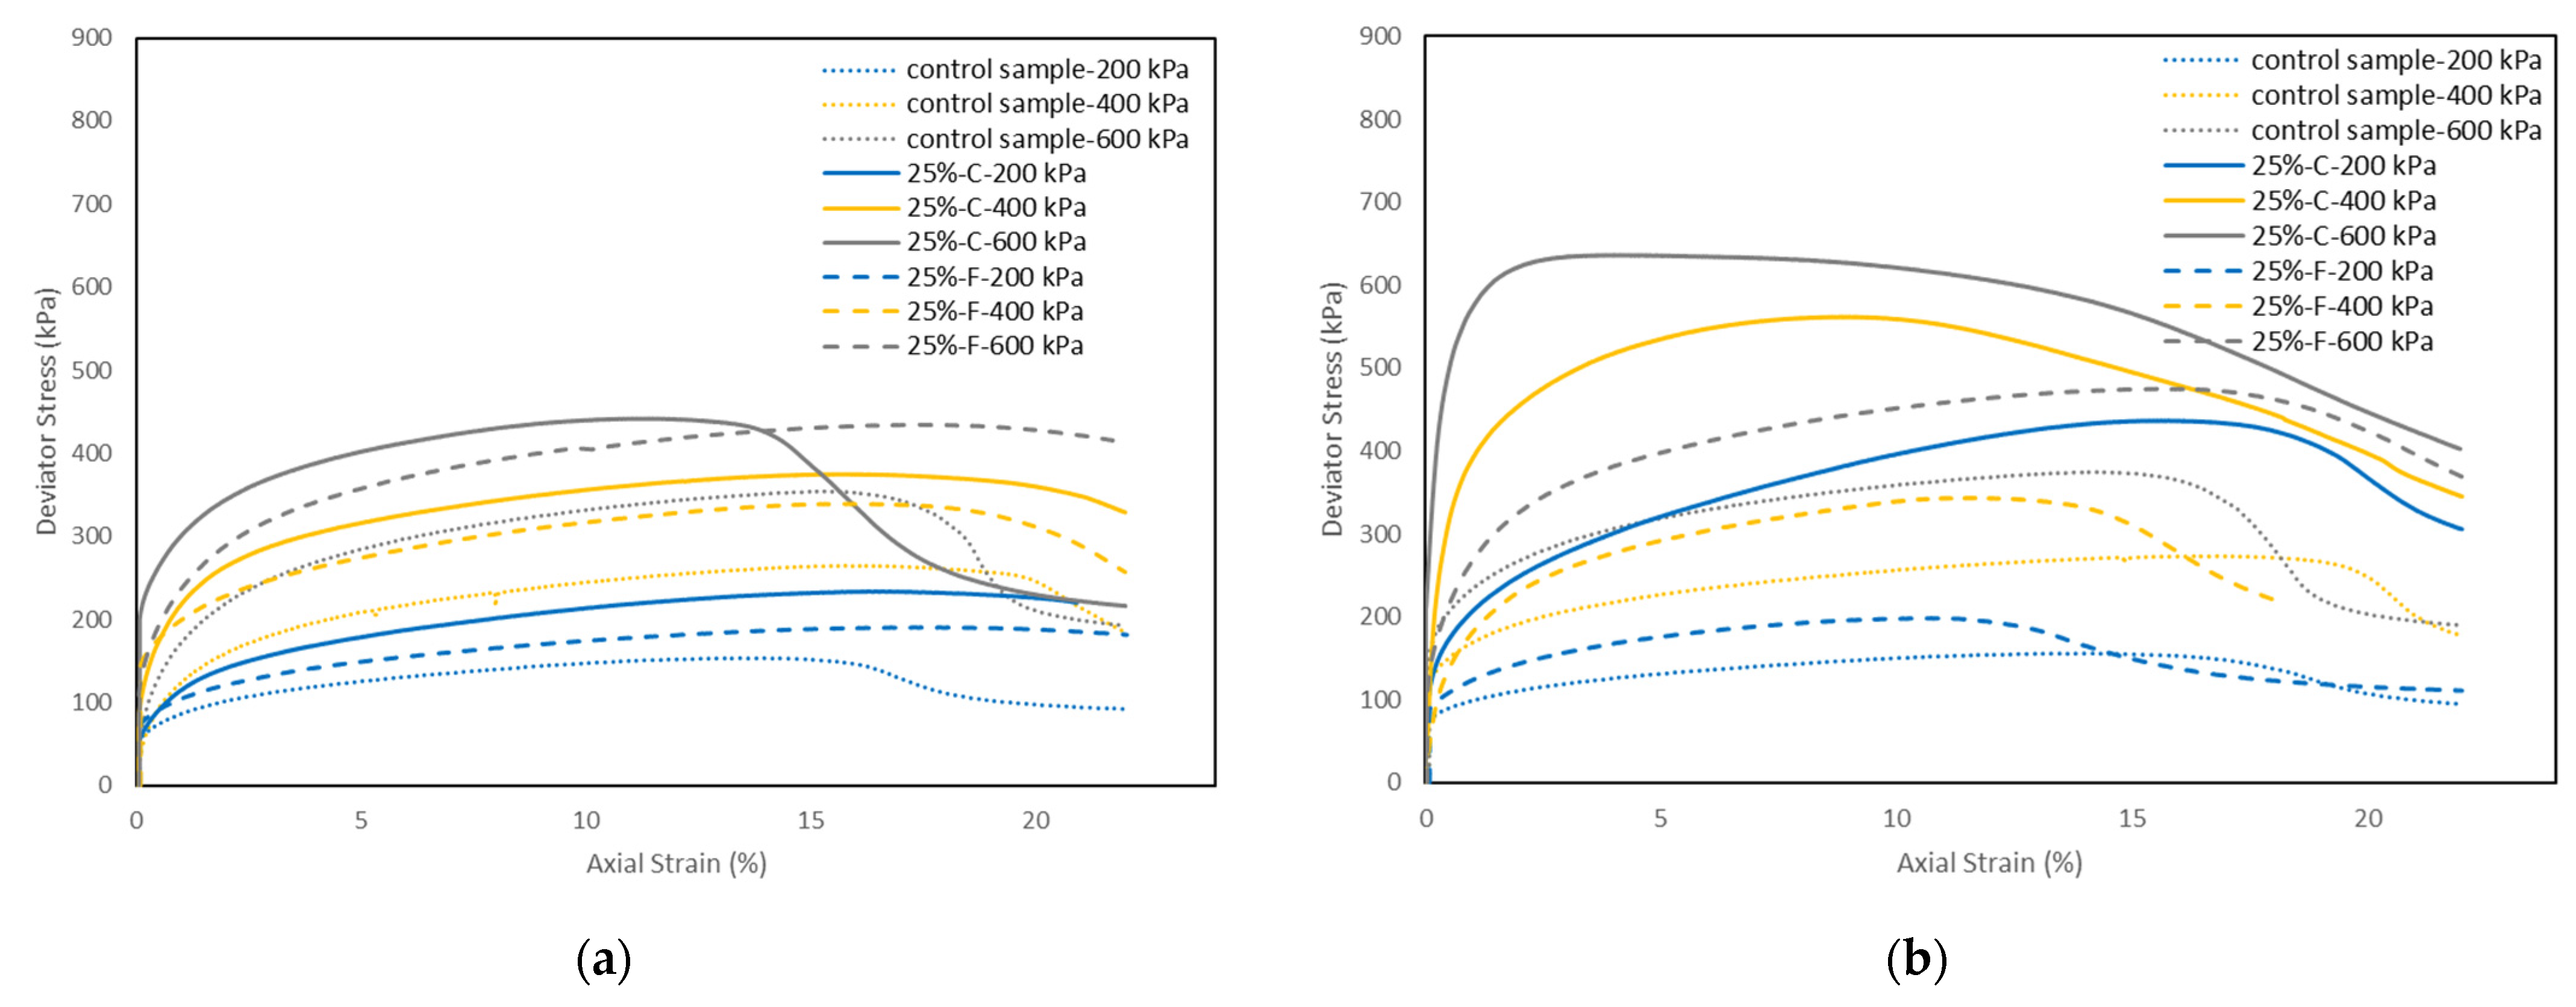
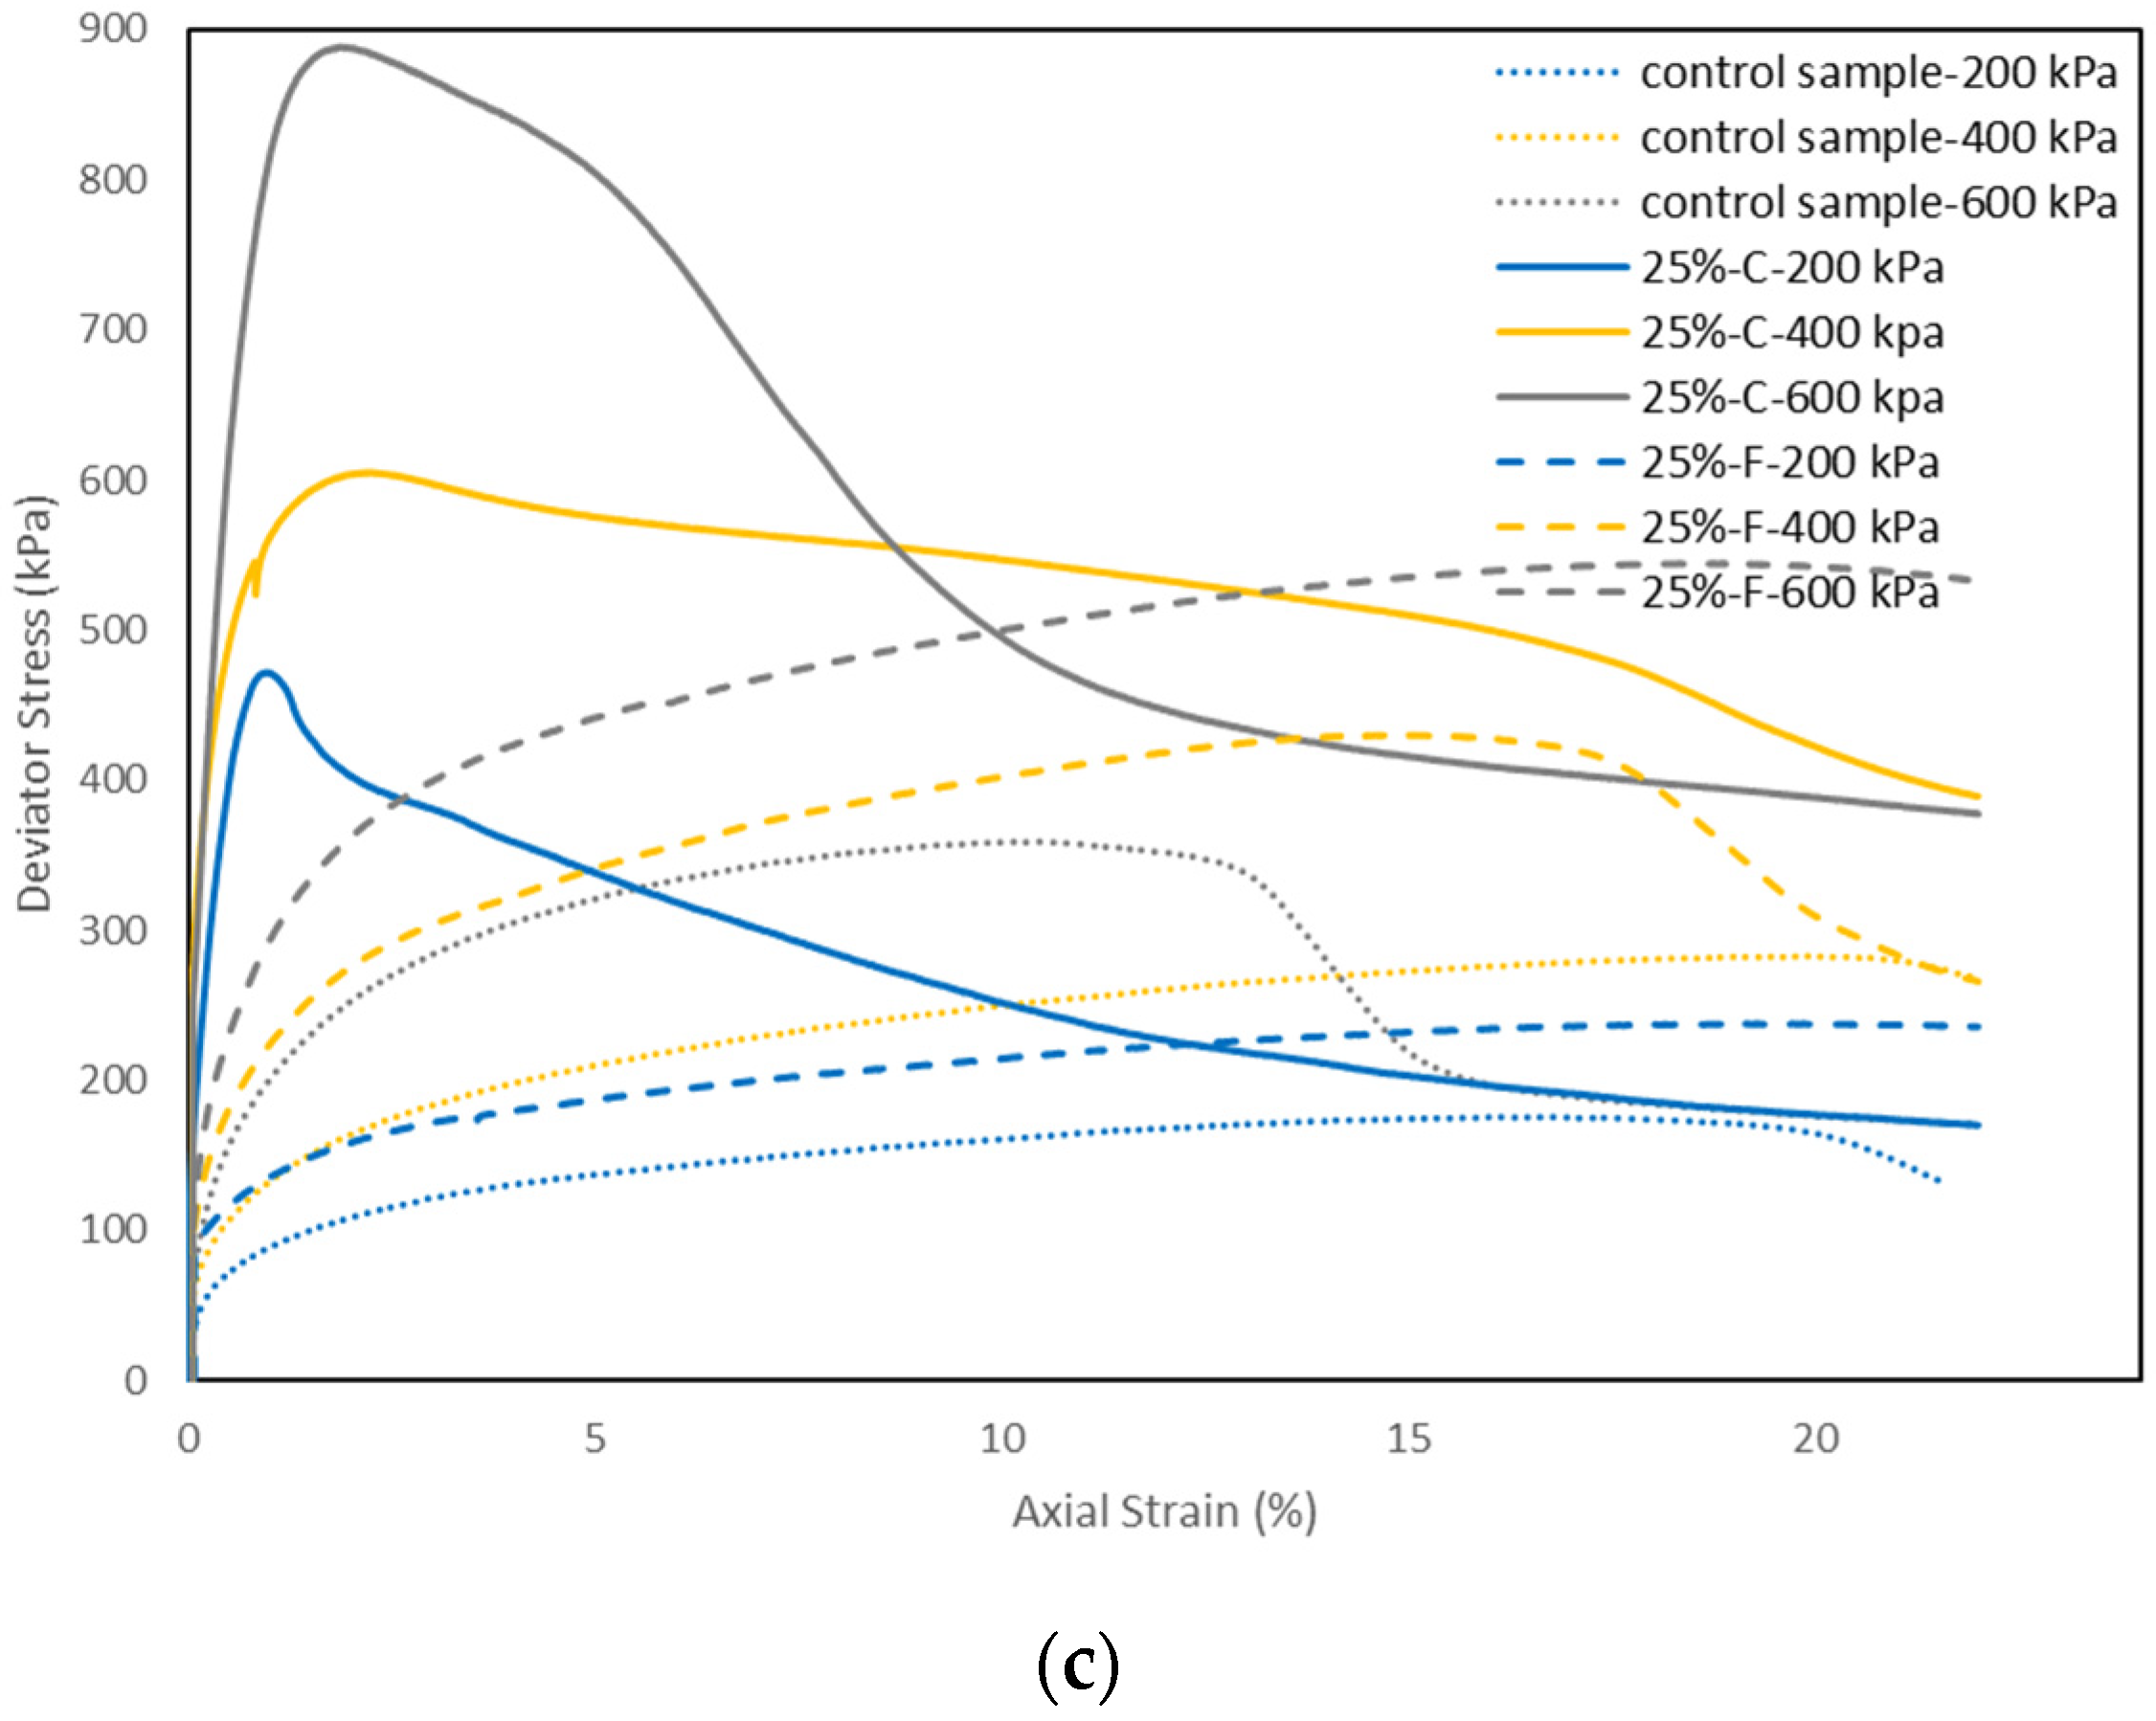
5.3.1. Effects of Fly Ash Content on the Stress-Strain Behavior
5.3.2. Effects of Fly Ash Content on Shear Behavior of the Soil
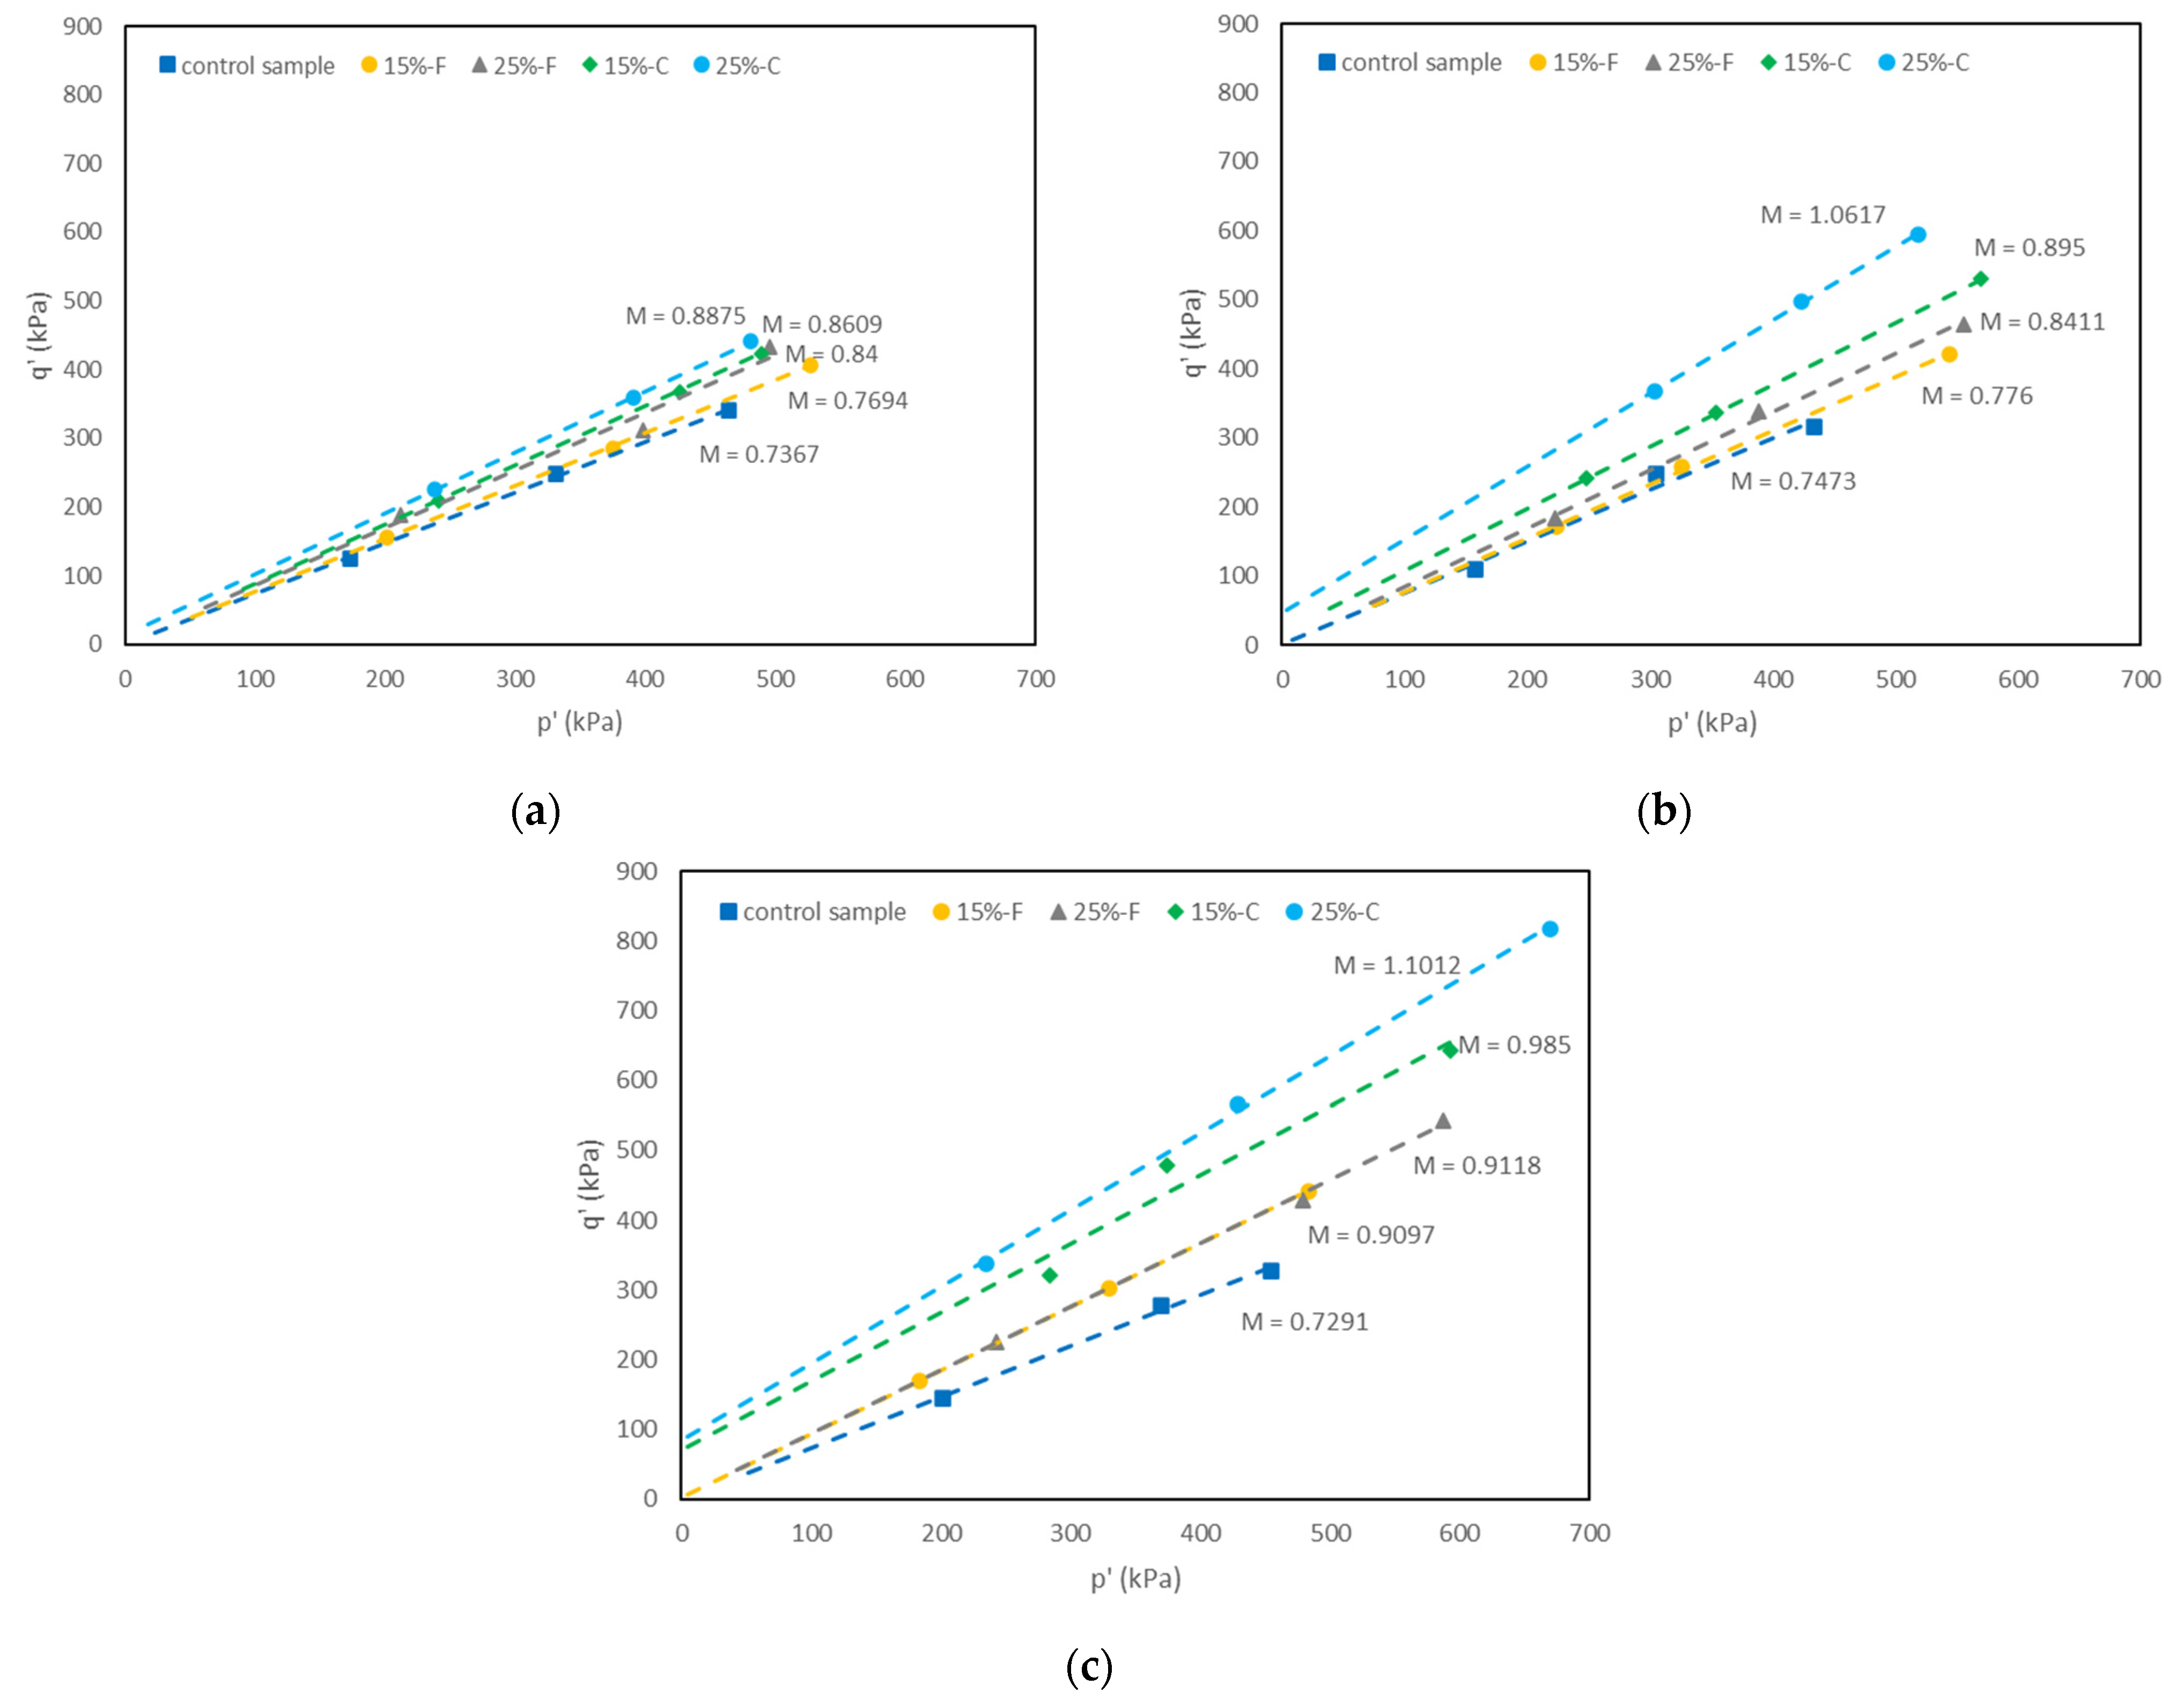
5.3.3. Effects of Fly Ash Content on Critical State Parameters
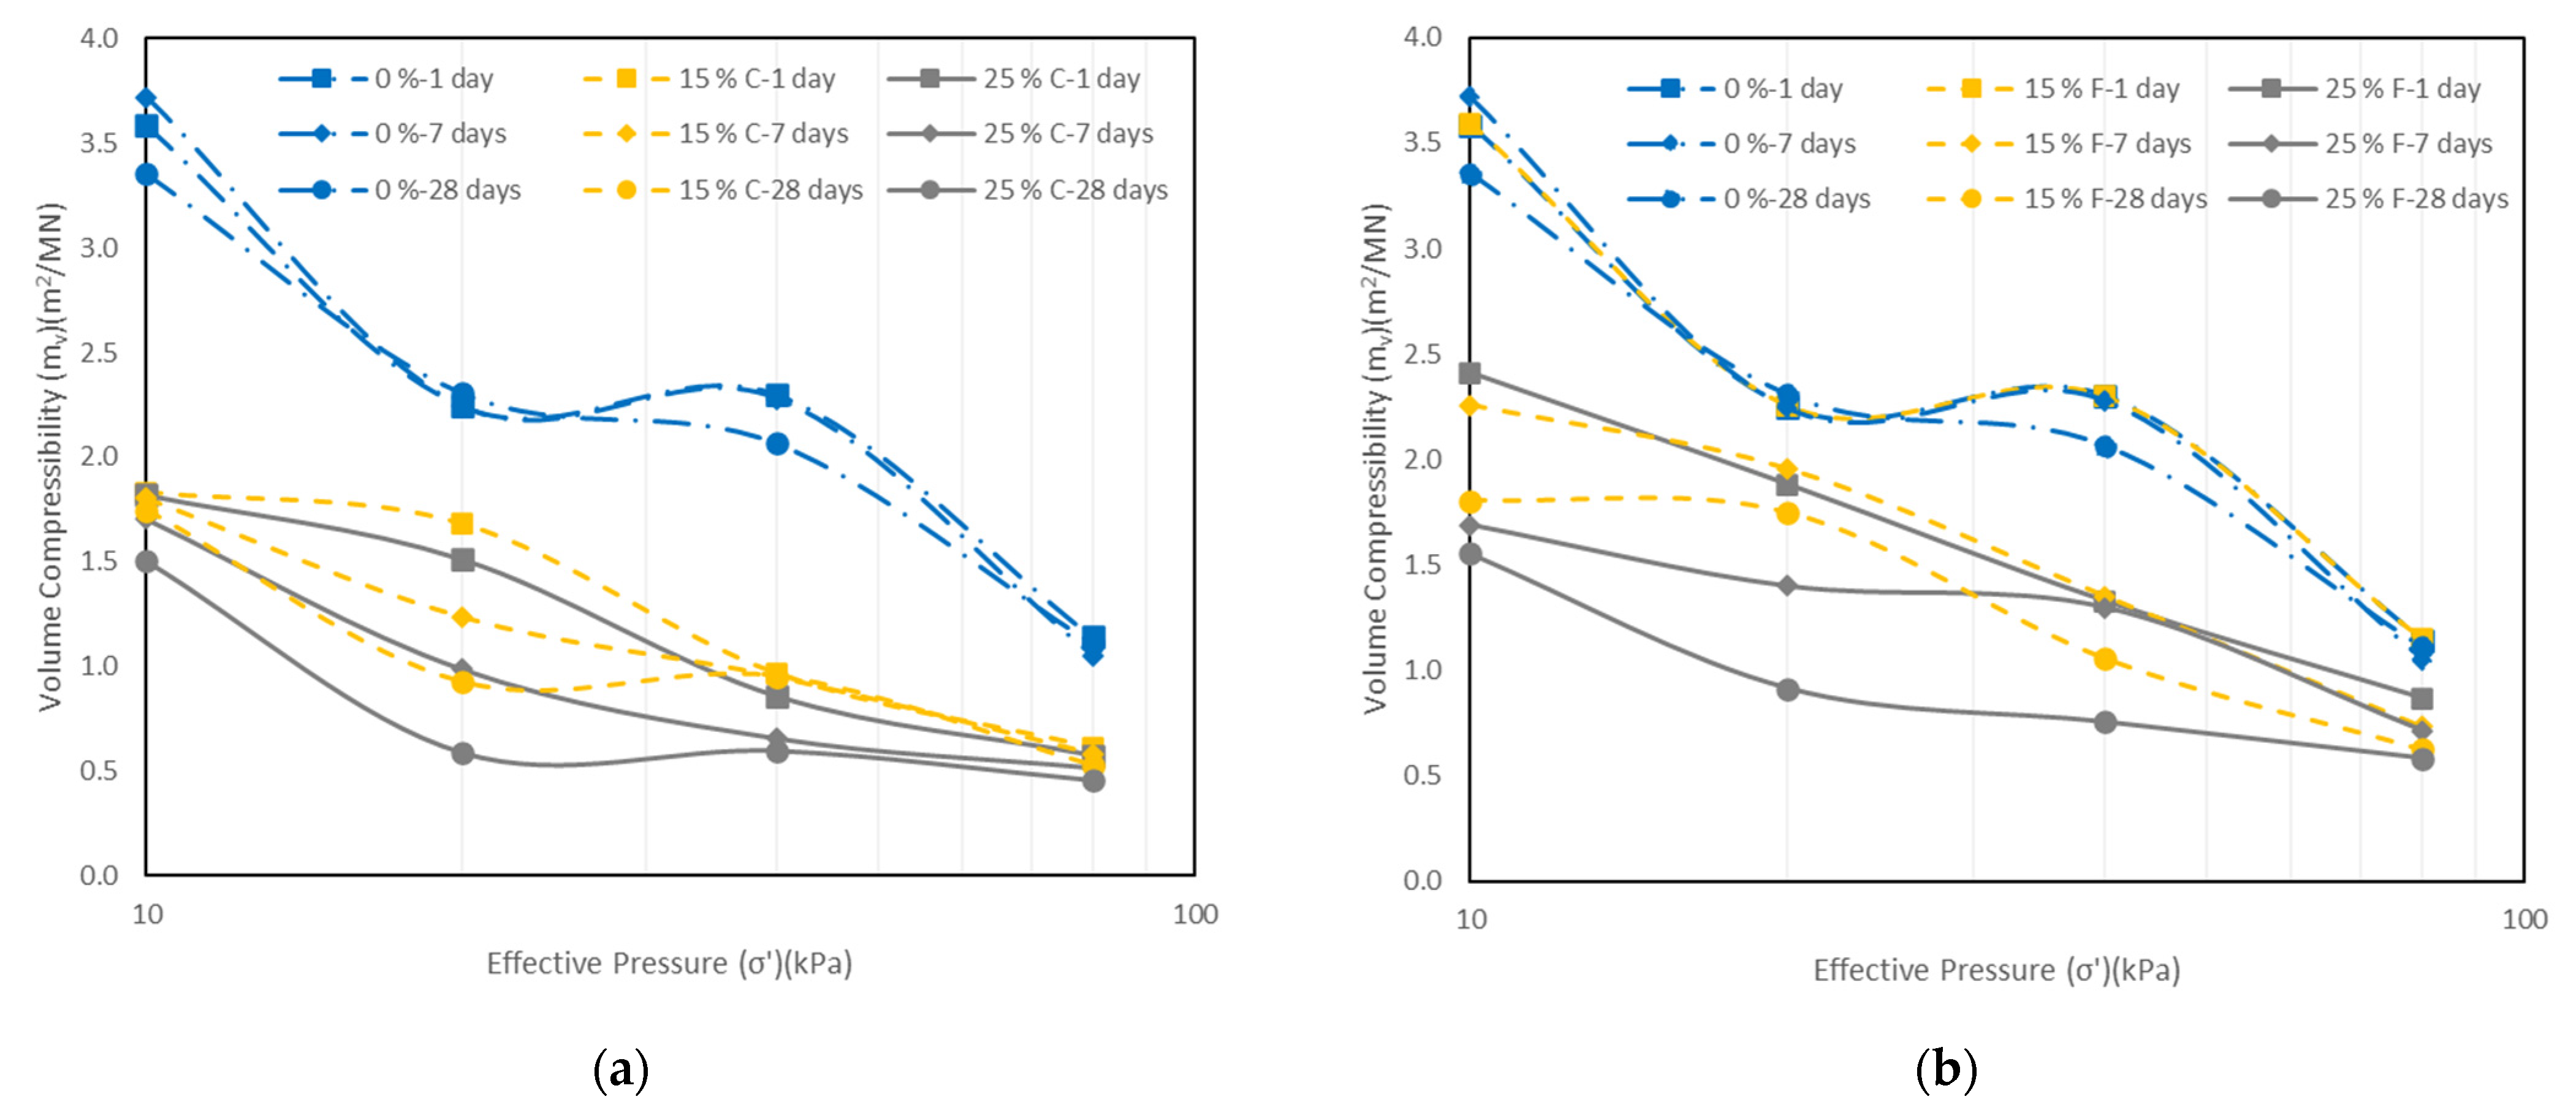
5.4. One-Dimensional Consolidation Tests
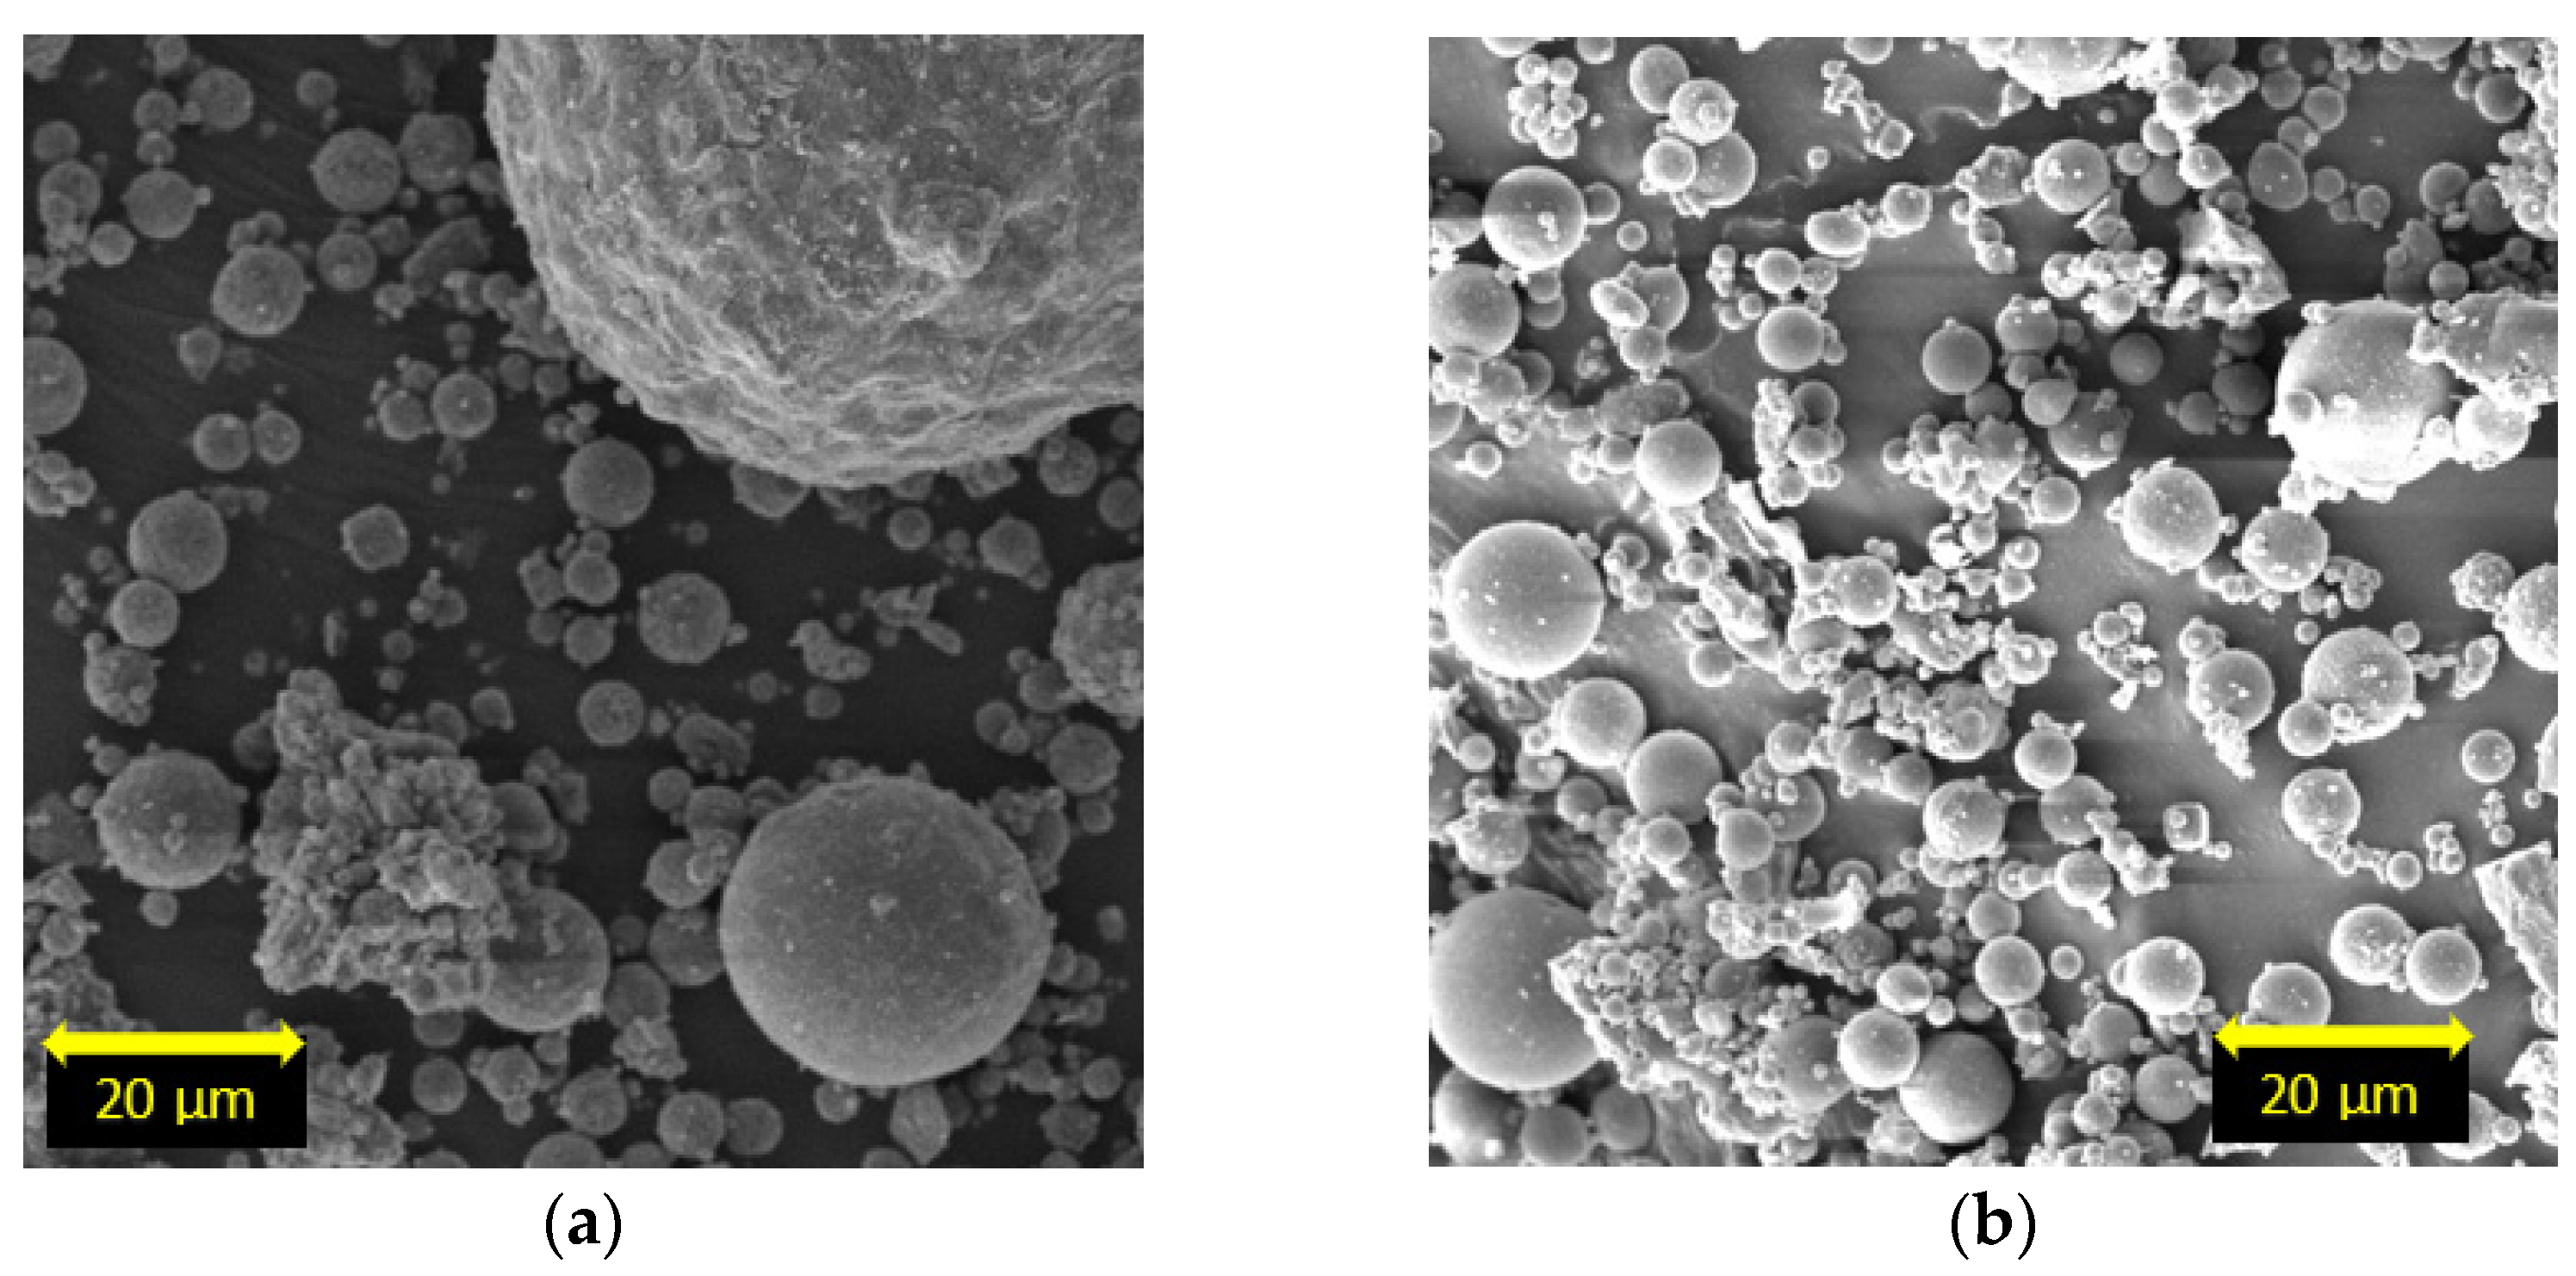
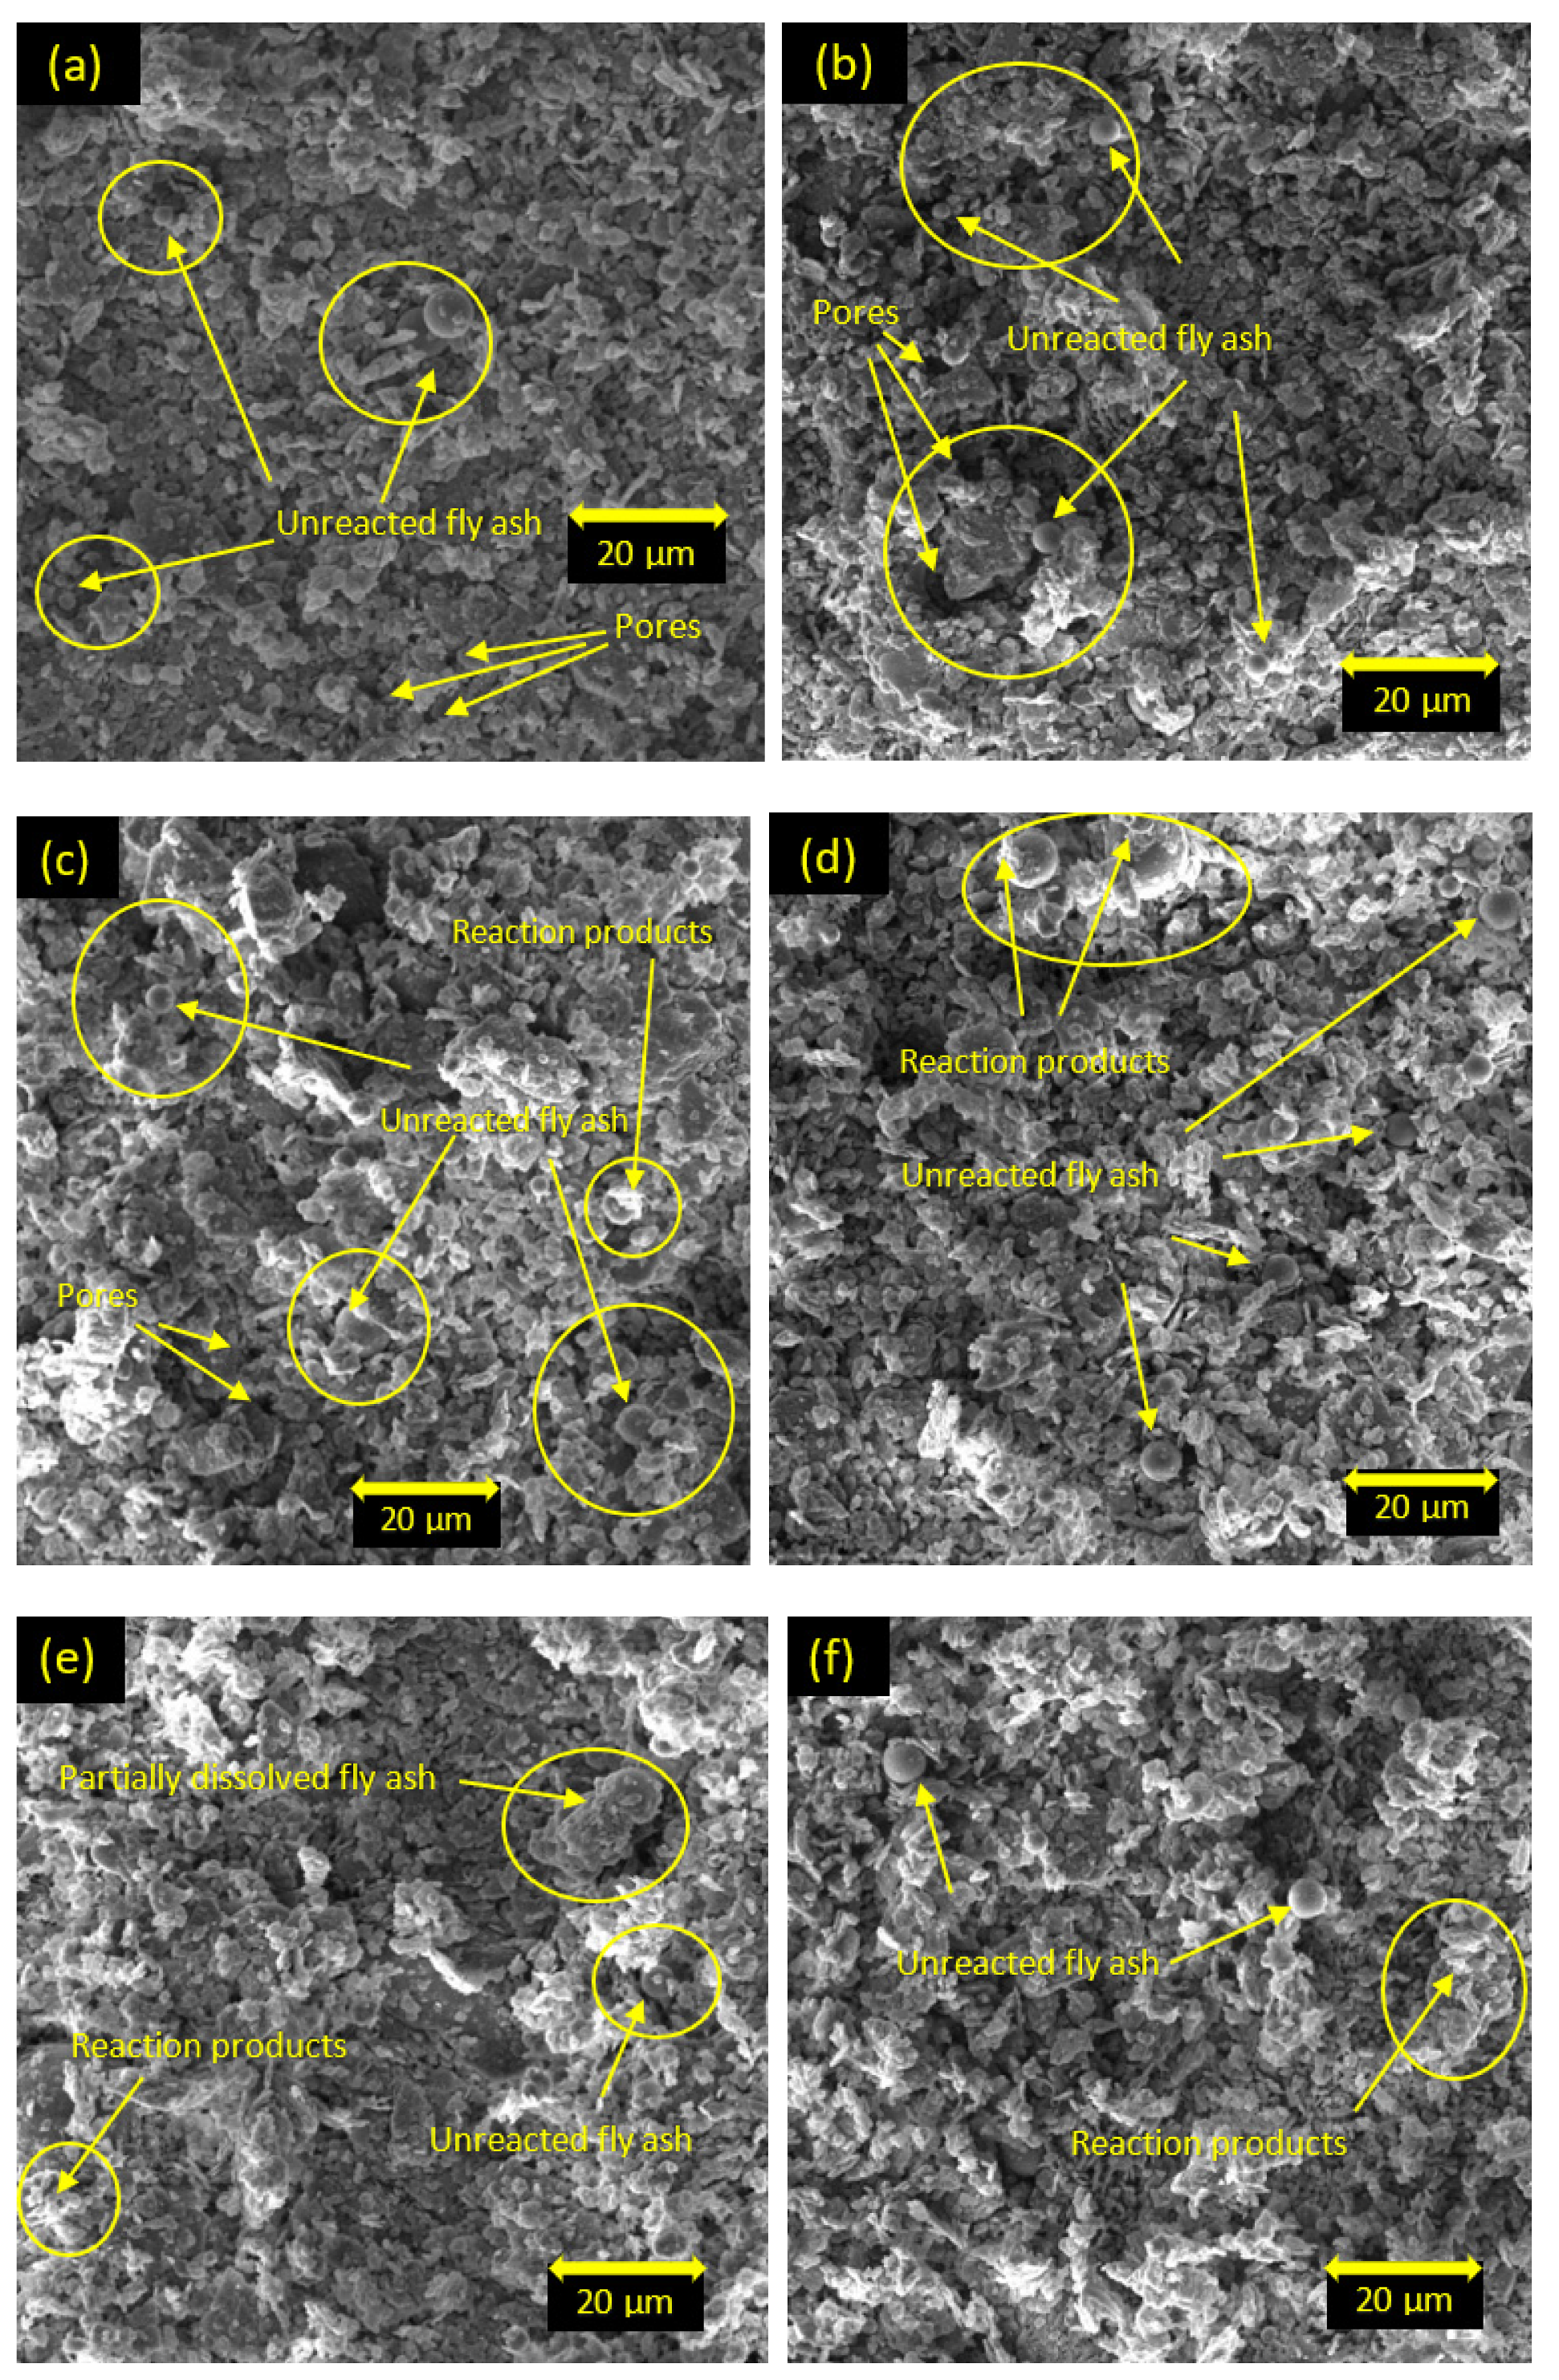
5.5. Scanning Electron Microscopy
6. Conclusions
- The maximum dry unit weight of the soil decreased, and the optimum moisture content increased with increasing percentages of both types of fly ash. The soil stabilized with class C fly ash had higher γdmax and lower wopt in comparison with the soil stabilized with class F fly ash.
- The compressive strength of the soil increased with the addition of both types of fly ash and with the curing time. However, when the fly ash content increased from 25% to 30%, the compressive strength of the stabilized soil slightly decreased for both types of fly ash and for different curing times. Therefore, the optimal fly ash content appears to be 25% for both types of fly ash. Also, class C fly ash was found to be much more effective in improving the compressive strength of the soil than class F fly ash. The elastic modulus of the soil increased with the addition of both types of fly ash up to 25% and with increasing the curing time.
- The results of the CU triaxial tests indicated an improvement in the angle of shearing resistance and cohesion intercept with the addition of class C fly ash, whereas the cohesion intercept of the soil stabilized with class F fly ash was lower than the control sample. The curing time was effective in improving the values of c’ and ϕ’ for both types of fly ash stabilized soil. The gradient of the critical state line increased with increasing the class C and class F fly ash contents and with increasing the curing time.
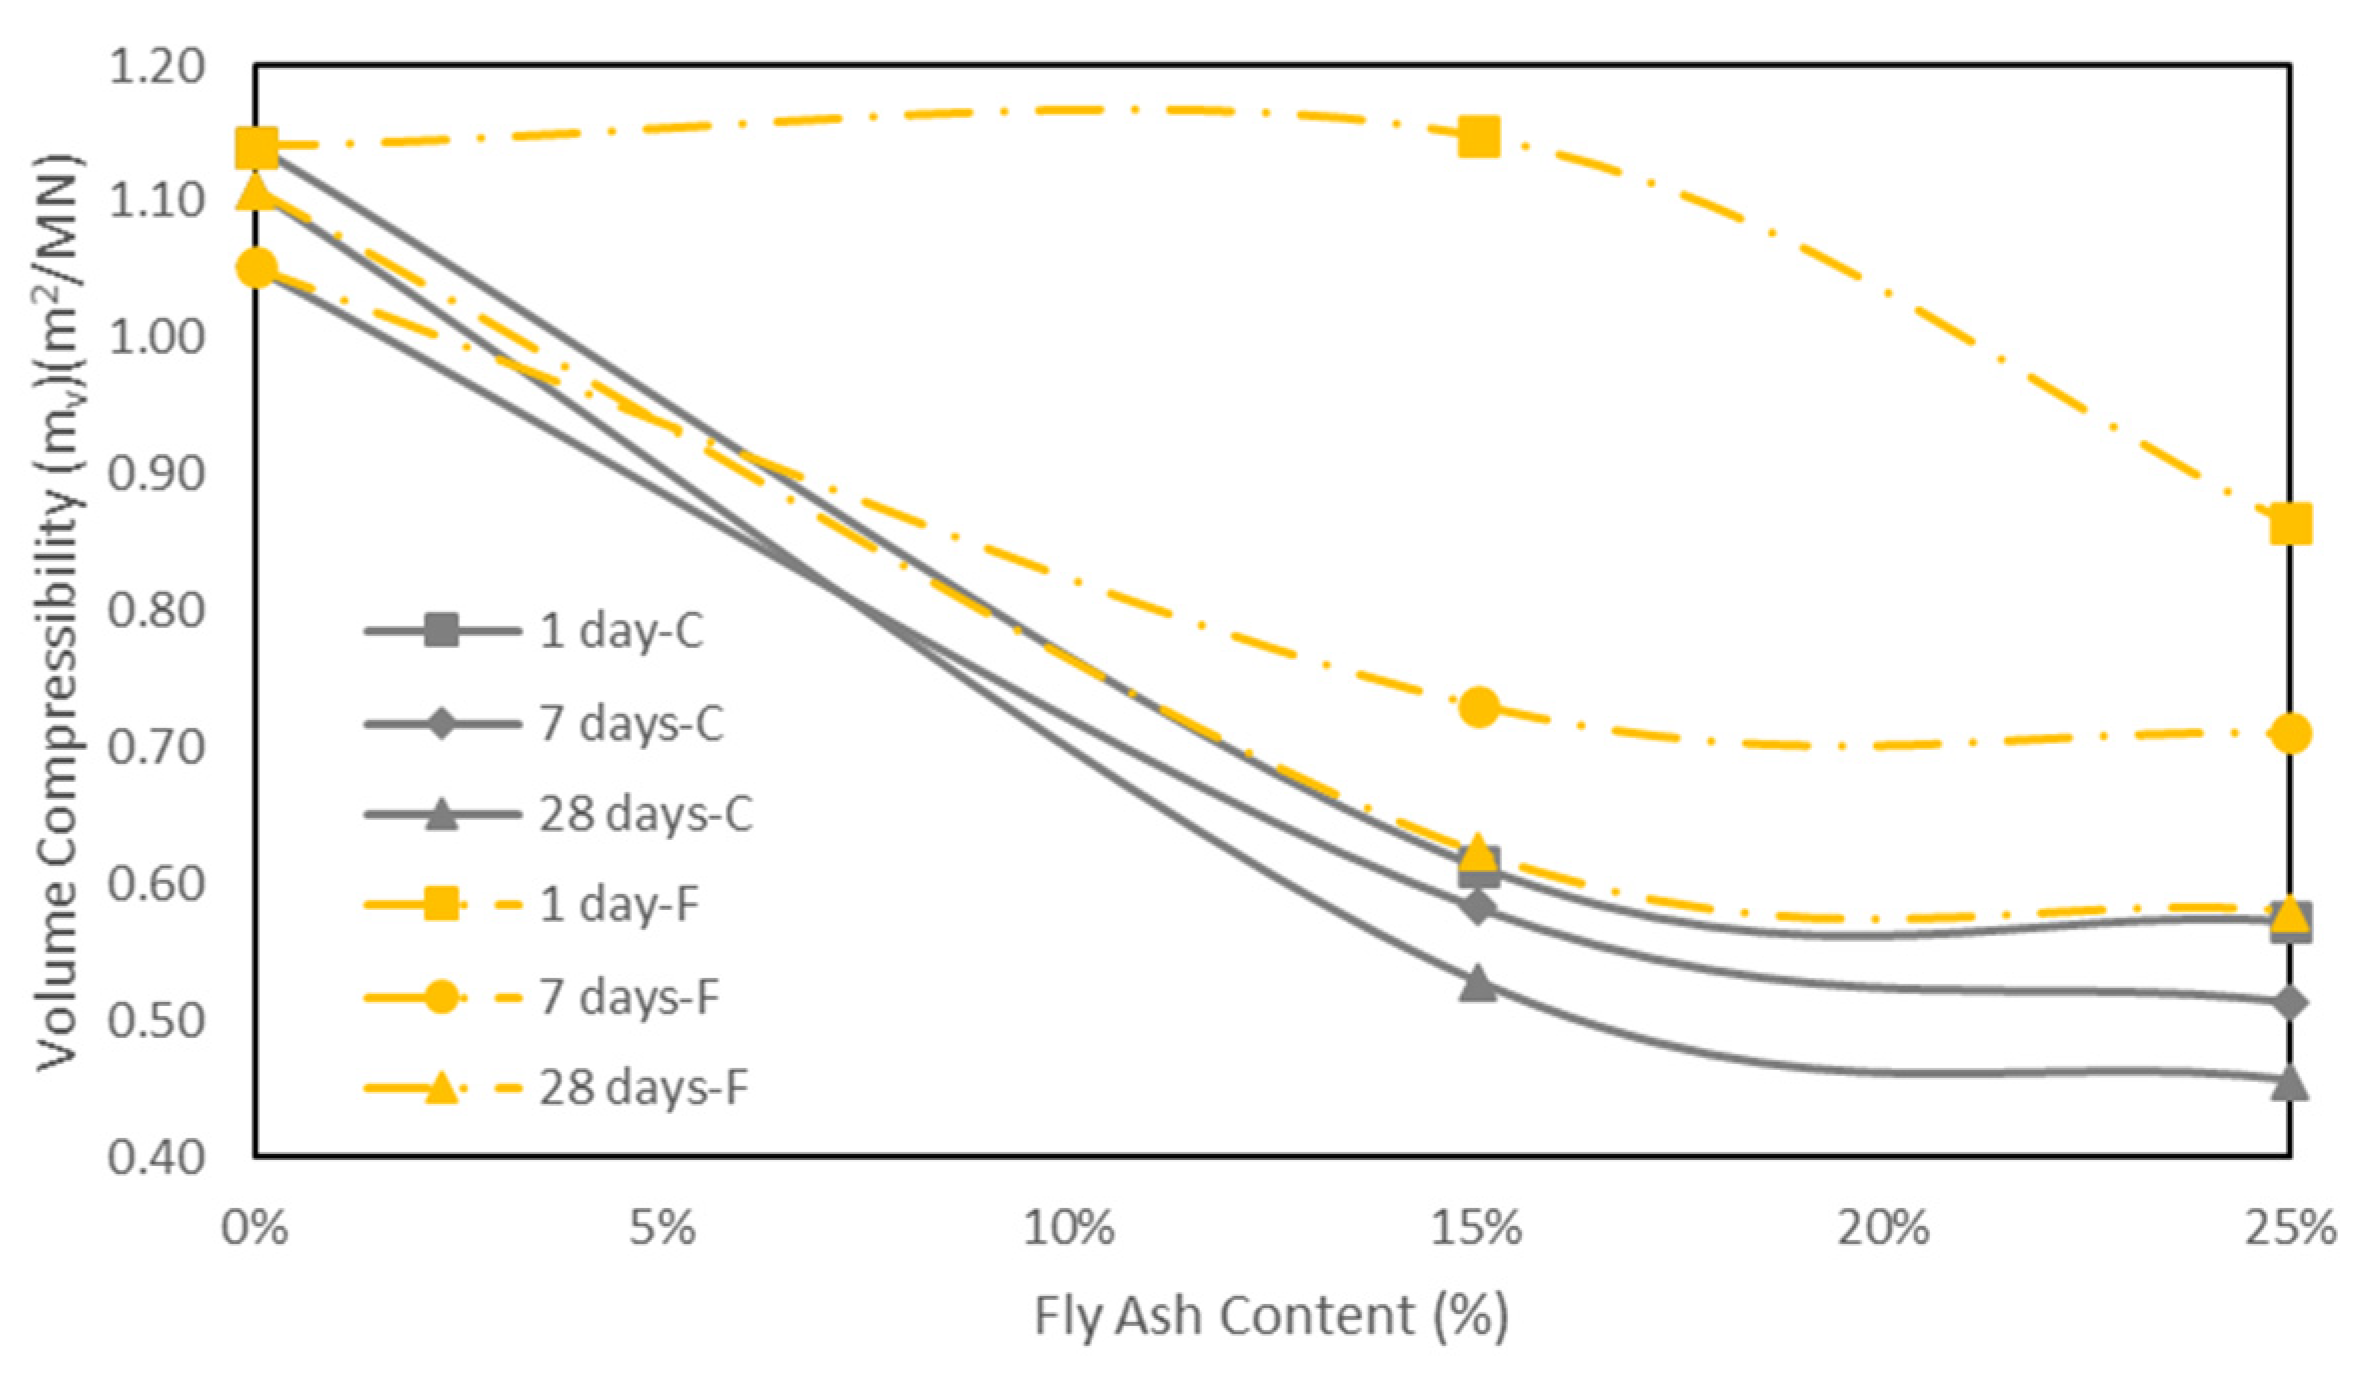
- The results from the one-dimensional consolidation tests indicated a decrease in the Cc of the soil stabilized with class C fly ash compared to the control sample. Furthermore, the Cc decreased with curing time for both types of fly ash. However, with class F fly ash, the Cc initially increased up to the particular fly ash content and thereafter decreased at one day of curing. The mv value showed a similar trend to the compression index. Cs decreased by the addition of the class C or class F fly ash. In addition, curing time was found to be an effective parameter in decreasing the swelling index.
- The values of cv and k increased with the addition of class C or class F fly ash. However, both cv and k decreased with increasing the curing time for fly ash stabilized soils.
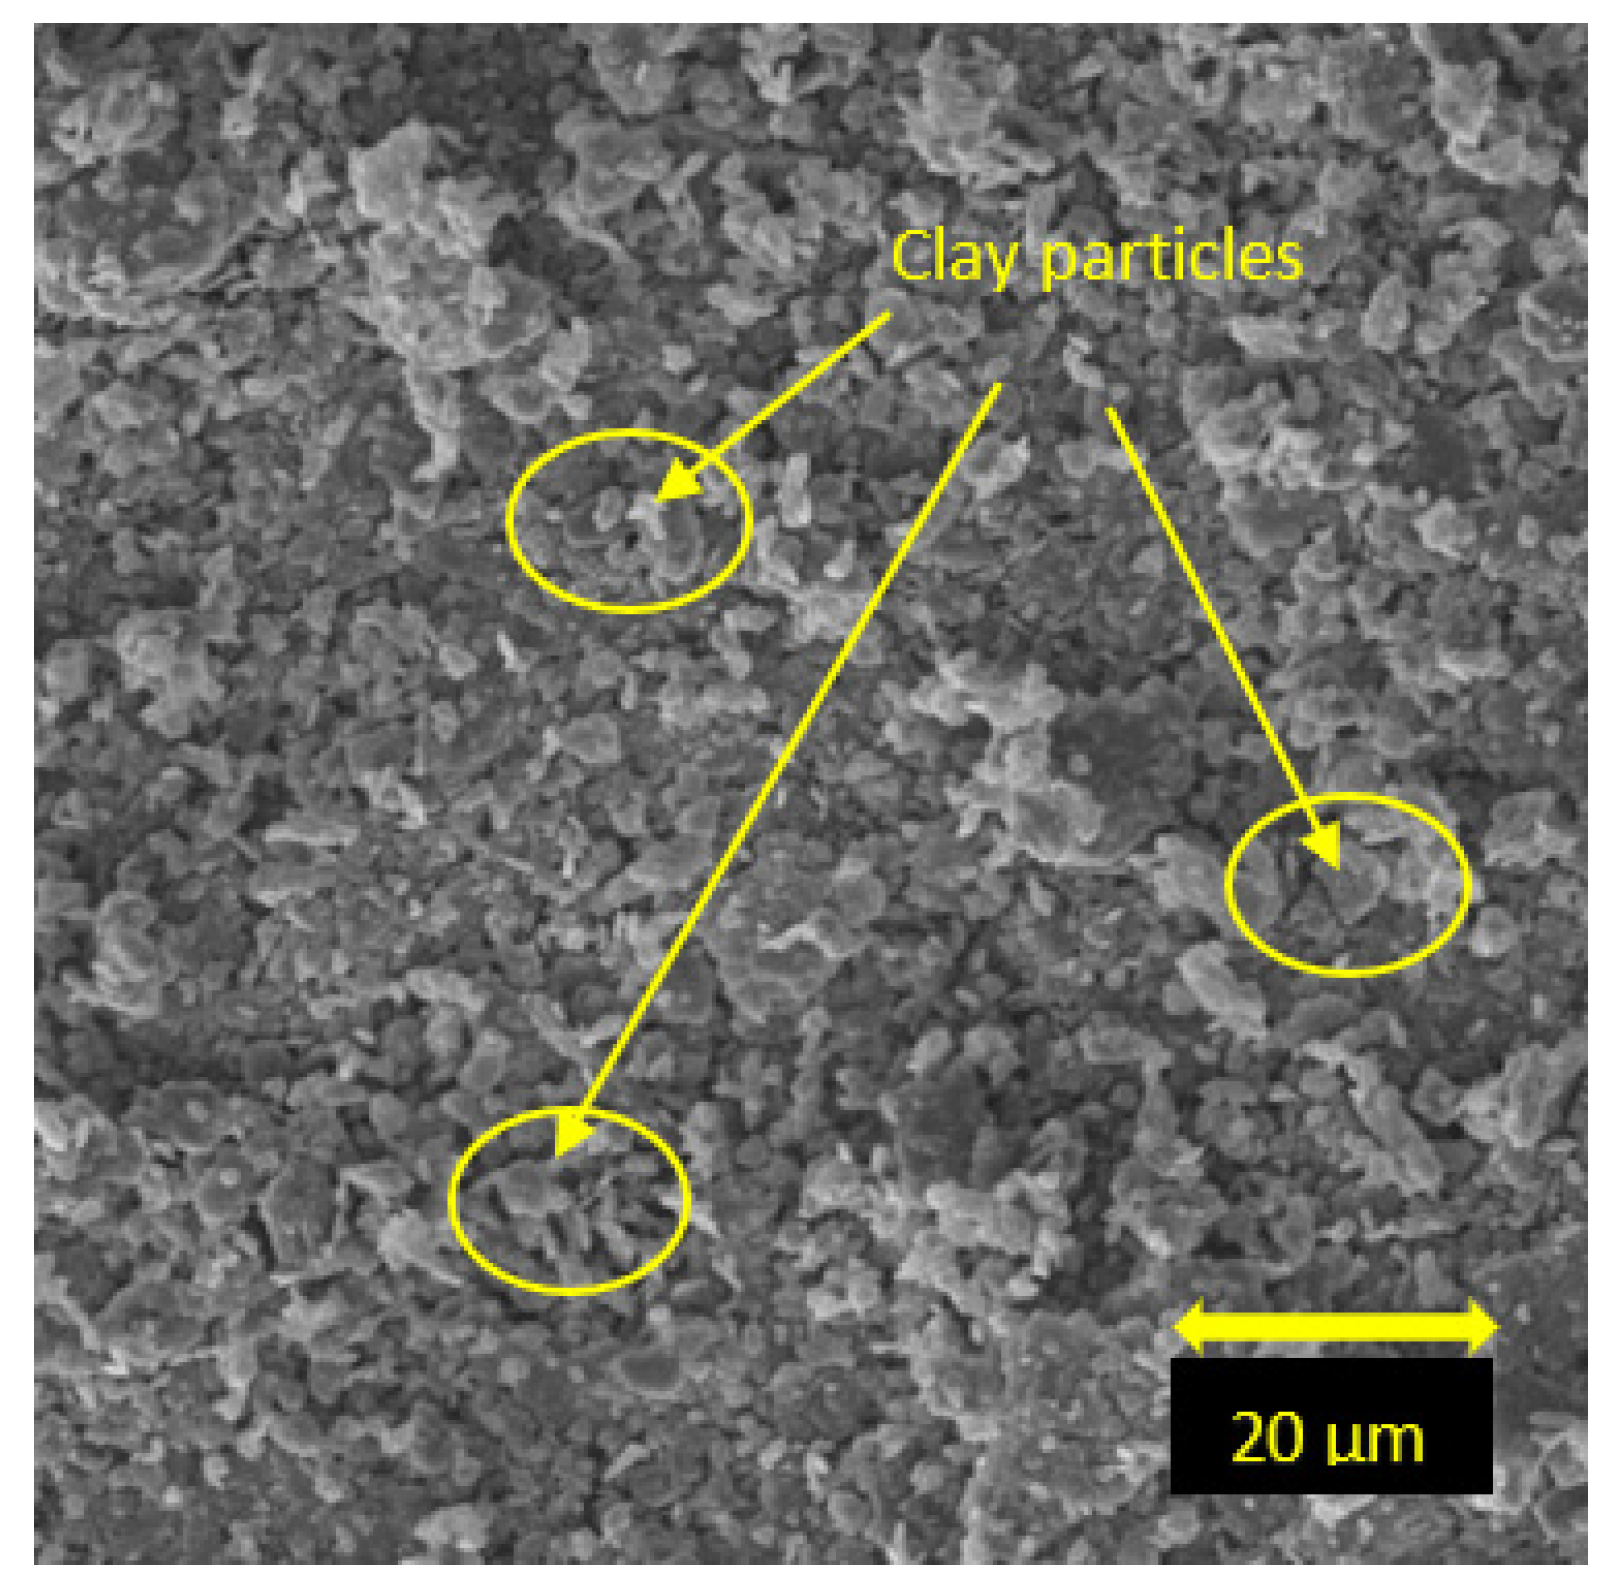
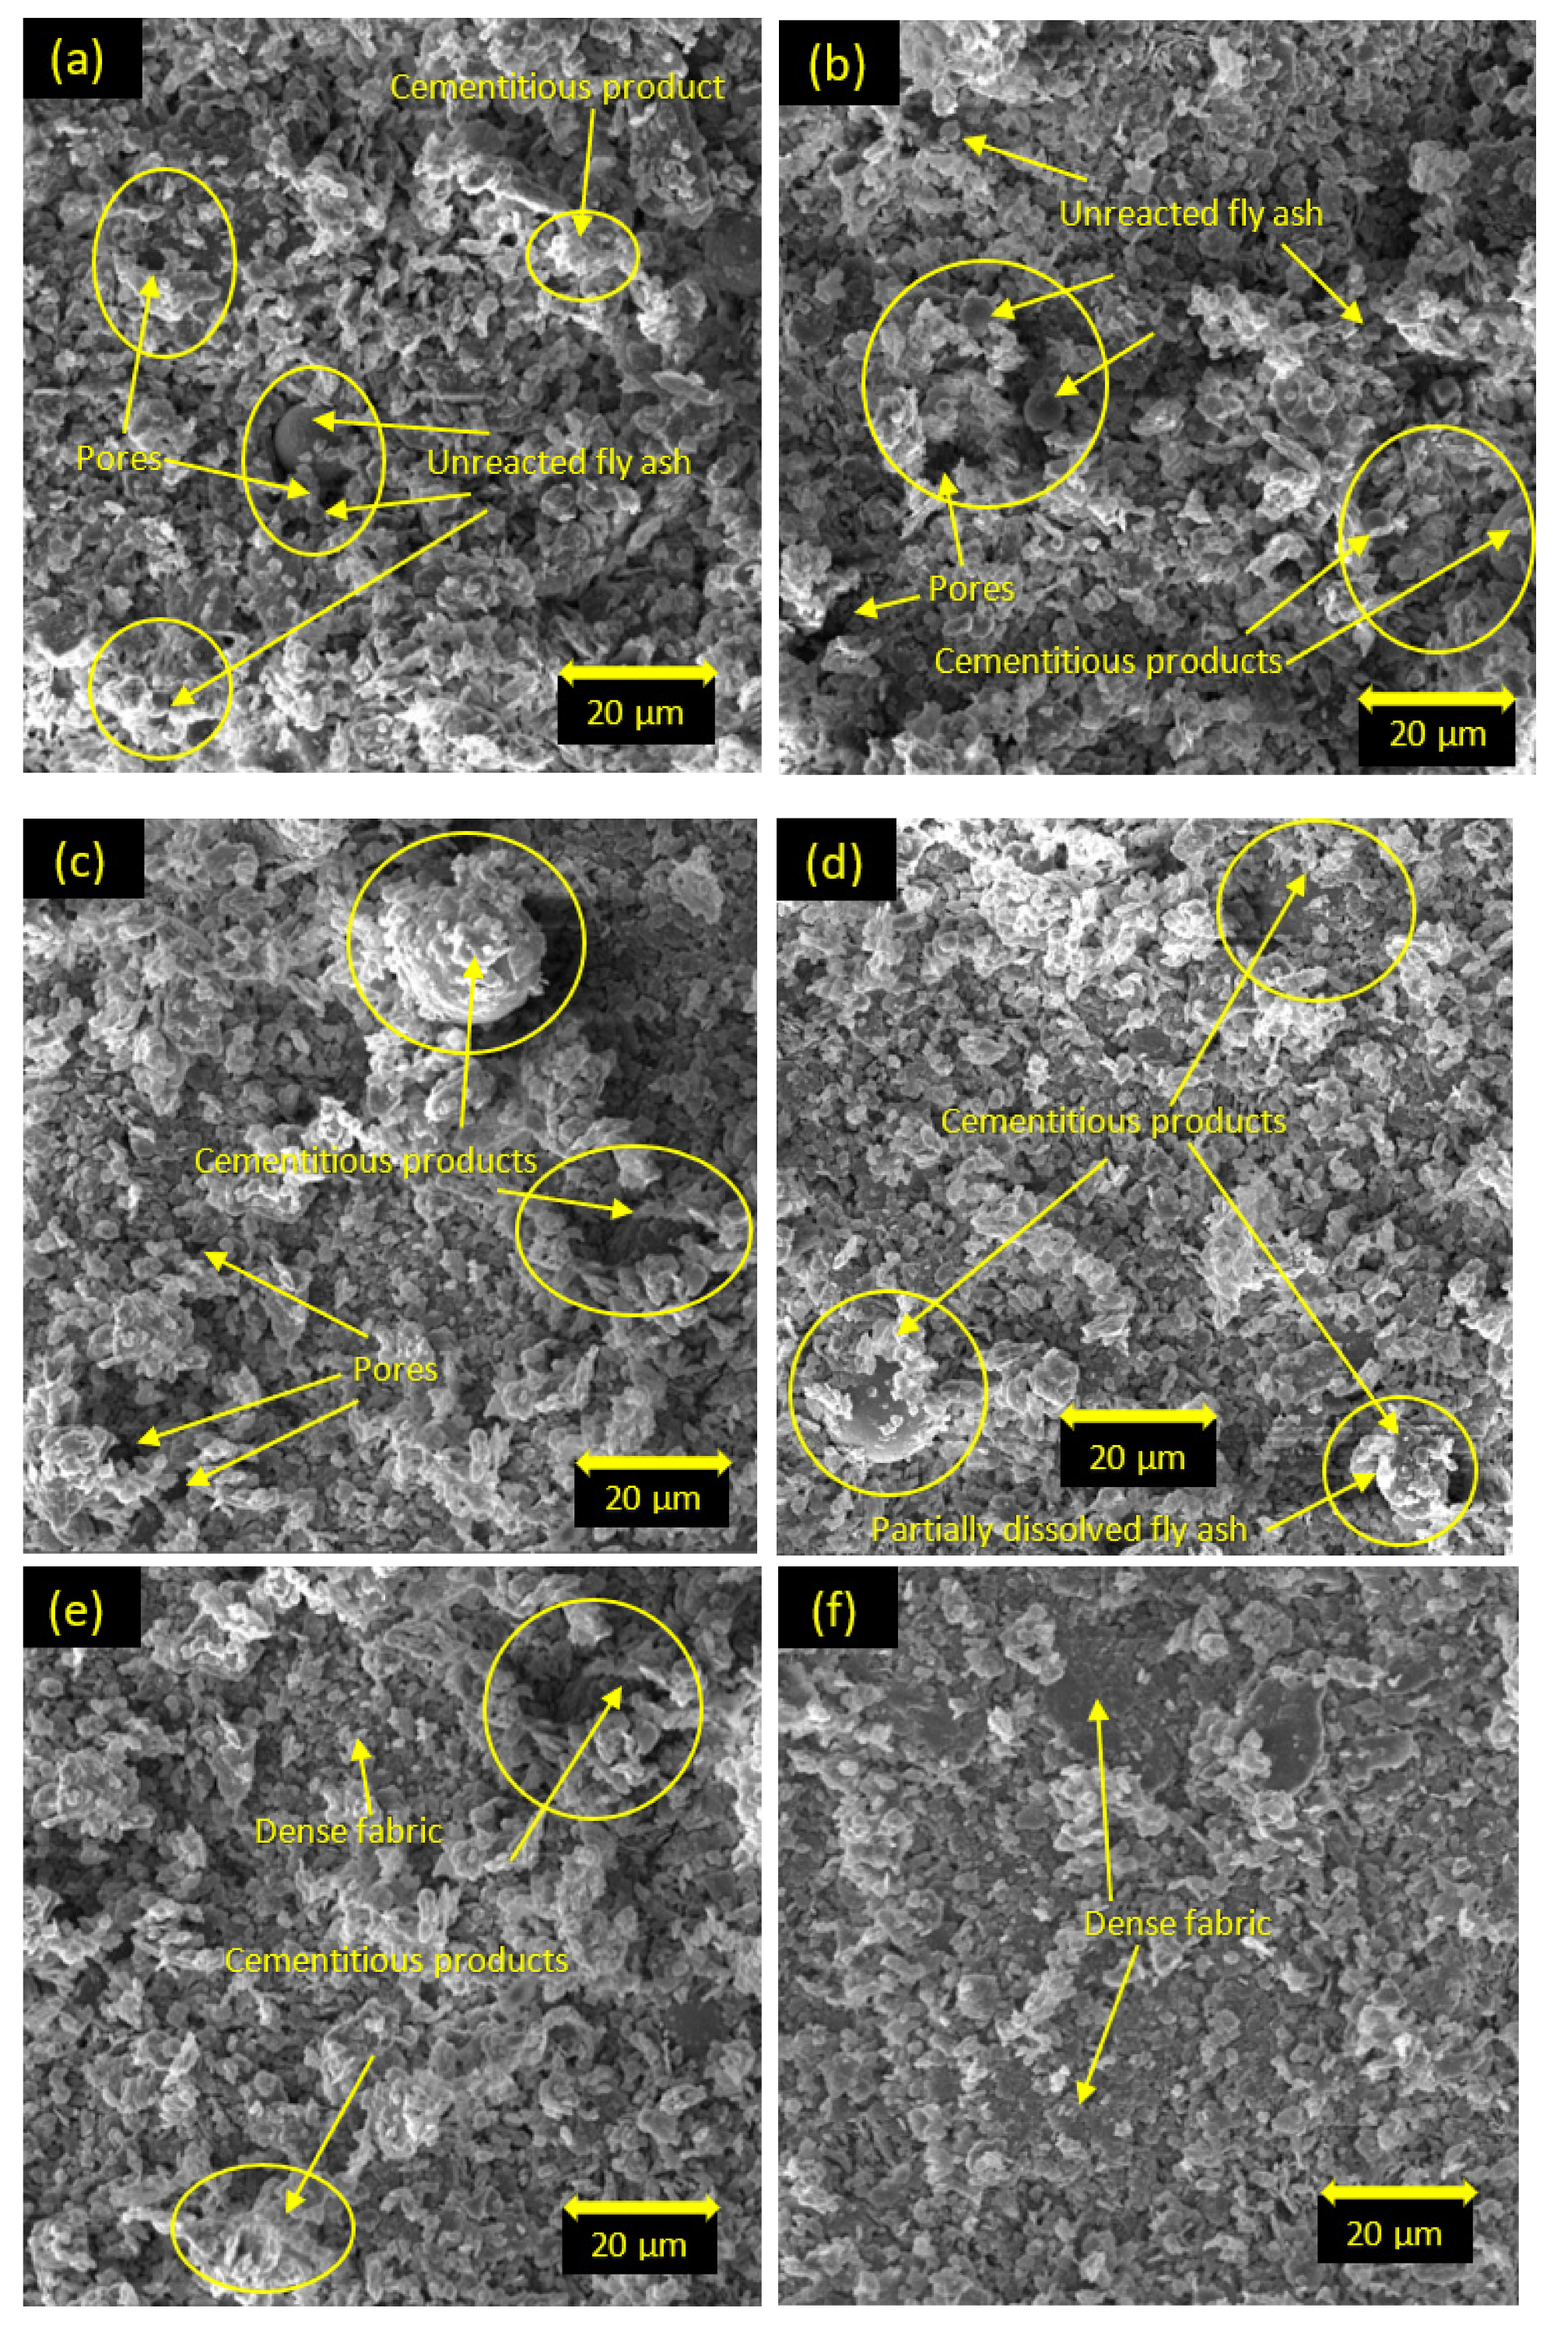
- The SEM analysis conducted on the soil stabilized with both class C and class F fly ash confirmed the gradual improvement in the soil properties and strength due to the formation of reaction products in the soil with the increase of curing time. However, the soil stabilized with class C fly ash had more reaction products and denser fabric than the soil stabilized with class F fly ash due to the better cementitious properties of class C fly ash. The results from the UCS, triaxial, and consolidation tests were found in agreement with the results from the SEM analysis.
Author Contributions
Funding
Institutional Review Board Statement
Informed Consent Statement
Data Availability Statement
Conflicts of Interest
References
- Ahmaruzzaman, M. A review on the utilization of fly ash. Prog. Energy Combust. Sci. 2010, 36, 327–363. [Google Scholar] [CrossRef]
- Indraratna, B.; Qi, Y.; Tawk, M.; Heitor, A.; Rujikiatkamjorn, C.; Navaratnarajah, S.K. Advances in ground improvement using waste materials for transportation infrastructure. Proc. Inst. Civ. Eng. Ground Improv. 2022, 175, 3–22. [Google Scholar] [CrossRef]
- Dahale, P.; Nagarnaik, P.; Gajbhiye, A. Engineering Behavior of Remolded Expansive Soil with Lime and Flyash. Mater. Today Proc. 2017, 4, 10581–10585. [Google Scholar] [CrossRef]
- Nawaz, I. Disposal and Utilization of Fly Ash to Protect the Environment. Int. J. Innov. Res. Sci. Eng. Technol. 2013, 2, 5259–5266. [Google Scholar]
- Yang, S.; Liu, W. The Effect of Changing Fly Ash Content on the Modulus of Compression of Stabilized Soil. Materials 2019, 12, 2925. [Google Scholar] [CrossRef] [PubMed] [Green Version]
- Deepak, M.; Rohini, S.; Harini, B.; Ananthi, G.B.G. Influence of fly-ash on the engineering characteristics of stabilised clay soil. Mater. Today Proc. 2021, 37, 2014–2018. [Google Scholar] [CrossRef]
- Çokça, E. Closure to Use of Class C Fly Ashes for the Stabilization of an Expansive Soil. J. Geotech. Geoenvironmen. Eng. 2002, 128, 966. [Google Scholar] [CrossRef]
- Prabakar, J.; Dendorkar, N.; Morchhale, R. Influence of fly ash on strength behavior of typical soils. Constr. Build. Mater. 2004, 18, 263–267. [Google Scholar] [CrossRef]
- Sezer, A.; Inan, G.; Yılmaz, H.R.; Ramyar, K. Utilization of a very high lime fly ash for improvement of Izmir clay. Build. Environ. 2006, 41, 150–155. [Google Scholar] [CrossRef]
- Kumar, B.R.P.; Sharma, R.S. Effect of Fly Ash on Engineering Properties of Expansive Soils. J. Geotech. Geoenvironmen. Eng. 2004, 130, 764–767. [Google Scholar] [CrossRef]
- Senol, A.; Edil, T.B.; Bin-Shafique, S.; Acosta, H.A.; Benson, C.H. Soft subgrades’ stabilization by using various fly ashes. Resour. Conserv. Recycl. 2006, 46, 365–376. [Google Scholar] [CrossRef]
- Edil, T.B.; Acosta, H.A.; Benson, C.H. Stabilizing Soft Fine-Grained Soils with Fly Ash. J. Mater. Civ. Eng. 2006, 18, 283–294. [Google Scholar] [CrossRef]
- Phanikumar, B.R.; Sharma, R.S. Volume Change Behavior of Fly Ash-Stabilized Clays. J. Mater. Civ. Eng. 2007, 19, 67–74. [Google Scholar] [CrossRef]
- Bin-Shafique, S.; Rahman, K.; Yaykiran, M.; Azfar, I. The long-term performance of two fly ash stabilized fine-grained soil subbases. Resour. Conserv. Recycl. 2010, 54, 666–672. [Google Scholar] [CrossRef]
- Brooks, R.M. Soil stabilization with Fly ash and Rice Husk Ash. Int. J. Res. Rev. Appl. Sci. 2009, 1, 209–217. [Google Scholar]
- Tastan, E.O.; Edil, T.B.; Benson, C.H.; Aydilek, A.H. Stabilization of Organic Soils with Fly Ash. J. Geotech. Geoenvironmen. Eng. 2011, 137, 819–833. [Google Scholar] [CrossRef] [Green Version]
- Seyrek, E. Engineering behavior of clay soils stabilized with class C and class F fly ashes. Sci. Eng. Compos. Mater. 2018, 25, 273–287. [Google Scholar] [CrossRef] [Green Version]
- Jose, J.; Jose, A.; Kurian, J.M.; Francis, K.J.; James, S.K. Stabilization of expansive soil using fly ash. Int. Res. J. Eng. Technol. 2018, 5, 3075–3078. [Google Scholar]
- BS 1377-Methods of Test for Soils for Civil Engineering Purposes. Classification Tests; BSI Standard Publications: London, UK, 1990. [Google Scholar]
- BS 1377-Methods of Test for Soils for Civil Engineering Purposes. Compaction-Related Tests; BSI Standard Publications: London, UK, 1990. [Google Scholar]
- British Standard Institution. BS Code of Practice for Site Investigations; British Standard Institution: London, UK, 1981. [Google Scholar]
- American Society for Testing Materials. ASTM C618-Standard Specification for Coal Fly Ash and Raw or Calcined Natural Pozzolan for Use in Concrete. Annual Book of ASTM Standards, Concrete and Aggregates; American Society for Testing Materials: West Conshohocken, PA, USA, 2015. [Google Scholar]
- Mahvash, S.; López-Querol, S.; Bahadori-Jahromi, A. Effect of class F fly ash on fine sand compaction through soil stabilization. Heliyon 2017, 3, e00274. [Google Scholar] [CrossRef] [Green Version]
- BS 1377-Methods of Test for Soils for Civil Engineering Purposes. Shear Strength Tests (Effective Stress); BSI Standard Publications: London, UK, 1990. [Google Scholar]
- BS 1377-Methods of Test for Soils for Civil Engineering Purposes. Compressibility, Permeability and Durability Tests; BSI Standard Publications: London, UK, 1990. [Google Scholar]
- Ji-Ru, Z.; Xing, C. Stabilization of expansive soil by lime and fly ash. J. Wuhan Univ. Technol. Sci. Ed. 2002, 17, 73–77. [Google Scholar] [CrossRef]
- Mir, B.A.; Sridharan, A. Physical and Compaction Behaviour of Clay Soil–Fly Ash Mixtures. Geotech. Geol. Eng. 2013, 31, 1059–1072. [Google Scholar] [CrossRef]
- Kolay, P.K.; Ramesh, K.C. Reduction of Expansive Index, Swelling and Compression Behavior of Kaolinite and Bentonite Clay with Sand and Class C Fly Ash. Geotech. Geol. Eng. 2015, 34, 87–101. [Google Scholar] [CrossRef]
- Savaş, H.; Türköz, M.; Seyrek, E.; Ünver, E. Comparison of the effect of using class C and F fly ash on the stabilization of dispersive soils. Arab. J. Geosci. 2018, 11, 612. [Google Scholar] [CrossRef]
- Shil, S.; Pal, S.K. Permeability and volume change behavior of soil stabilized with fly ash. Int. J. Eng. Res. Technol. (IJERT) 2015, 4, 840–846. [Google Scholar]
- Barišić, I.; Grubeša, I.N.; Dokšanović, T.; Marković, B. Feasibility of Agricultural Biomass Fly Ash Usage for Soil Stabilisation of Road Works. Materials 2019, 12, 1375. [Google Scholar] [CrossRef] [PubMed] [Green Version]
- Nath, B.D.; Molla, K.A.; Sarkar, G. Study on Strength Behavior of Organic Soil Stabilized with Fly Ash. Int. Sch. Res. Not. 2017, 2017, 5786541. [Google Scholar] [CrossRef]
- Zhang, M.; Guo, H.; El-Korchi, T.; Zhang, G.; Tao, M. Experimental feasibility study of geopolymer as the next-generation soil stabilizer. Constr. Build. Mater. 2013, 47, 1468–1478. [Google Scholar] [CrossRef]
- Abdullah, H.H.; Shahin, M.A.; Walske, M.L. Geo-mechanical behavior of clay soils stabilized at ambient temperature with fly-ash geopolymer-incorporated granulated slag. Soils Found. 2019, 59, 1906–1920. [Google Scholar] [CrossRef]
- Binal, A. The Effects of High Alkaline Fly Ash on Strength Behaviour of a Cohesive Soil. Adv. Mater. Sci. Eng. 2016, 2016, 3048716. [Google Scholar] [CrossRef] [Green Version]
- Bryson, L.S.; Mahmoodabadi, M.; Adu-Gyamfi, K. Prediction of Consolidation and Shear Behavior of Fly Ash–Soil Mixtures Using Mixture Theory. J. Mater. Civ. Eng. 2017, 29, 04017222. [Google Scholar] [CrossRef]
- Schofield, A.; Wroth, P. Critical State Soil Mechanics; McGraw-Hill: London, UK, 1968. [Google Scholar]
- Subramaniam, P.; Sreenadh, M.M.; Banerjee, S. Critical State Parameters of Dredged Chennai Marine Clay Treated with Low Cement Content. Mar. Georesources Geotechnol. 2015, 34, 603–616. [Google Scholar] [CrossRef]
- Robin, V. Analytical and Numerical Modelling of Artificially Structured Soils. Ph.D. Thesis, University of Exeter, Exeter, UK, 2014. [Google Scholar]
- Amiralian, S.; Chegenizadeh, A.; Nikraz, H. Laboratory Investigation on the Effect of Fly Ash on the Compressibility of Soil. In Proceedings of the International Conference on Civil and Architectural Applications, Phuket, Thailand, 18–19 December 2012. [Google Scholar]
- Ho, M.-H.; Chan, C.-M.; Bakar, I. One Dimensional Compressibility Characteristics of Clay Stabilised with Cement-Rubber Chips. Int. J. Sustain. Constr. Eng. Technol. 2010, 1, 91–104. [Google Scholar]
- Chew, S.H.; Kamruzzaman, A.H.M.; Lee, F.H. Physicochemical and Engineering Behavior of Cement Treated Clays. J. Geotech. Geoenvironmen. Eng. 2004, 130, 696–706. [Google Scholar] [CrossRef]
- Whitlow, R. Basic Soil Mechanics; Longman: Essex, UK, 1996. [Google Scholar]
- Wang, D.; Korkiala-Tanttu, L. 1-D compressibility behaviour of cement-lime stabilized soft clays. Eur. J. Environ. Civ. Eng. 2018, 24, 1013–1031. [Google Scholar] [CrossRef]
- Phanikumar, B.R. Effect of lime and fly ash on swell, consolidation and shear strength characteristics of expansive clays: A comparative study. Géoméch. Geoengin. 2009, 4, 175–181. [Google Scholar] [CrossRef]
- Mir, B.A.; Sridharan, A. Volume change behavior of clayey soil–fly ash mixtures. Int. J. Geotech. Eng. 2013, 8, 72–83. [Google Scholar] [CrossRef]
- Jaditager, M.; Sivakugan, N. Consolidation Behavior of Fly Ash-Based Geopolymer-Stabilized Dredged Mud. J. Waterw. Port, Coast. Ocean. Eng. 2018, 144, 06018003. [Google Scholar] [CrossRef]
- Kassim, K.A.; Chow, S.H. Consolidation characteristics of lime stabilised soil. J. Civ. Eng. 2000, 12, 31–42. [Google Scholar]
- Jaditager, M.; Sivakugan, N. Influence of Fly Ash–Based Geopolymer Binder on the Sedimentation Behavior of Dredged Mud. J. Waterw. Port Coast. Ocean. Eng. 2017, 143, 04017012. [Google Scholar] [CrossRef]
- Murmu, A.L.; Dhole, N.; Patel, A. Stabilisation of black cotton soil for subgrade application using fly ash geopolymer. Road Mater. Pavement Des. 2020, 21, 867–885. [Google Scholar] [CrossRef]
- Yoobanpot, N.; Jamsawang, P.; Horpibulsuk, S. Strength behavior and microstructural characteristics of soft clay stabilized with cement kiln dust and fly ash residue. Appl. Clay Sci. 2017, 141, 146–156. [Google Scholar] [CrossRef]
- Yoobanpot, N.; Jamsawang, P.; Poorahong, H.; Jongpradist, P.; Likitlersuang, S. Multiscale laboratory investigation of the mechanical and microstructural properties of dredged sediments stabilized with cement and fly ash. Eng. Geol. 2020, 267, 105491. [Google Scholar] [CrossRef]
- Abdila, S.; Abdullah, M.; Ahmad, R.; Rahim, S.; Rychta, M.; Wnuk, I.; Nabiałek, M.; Muskalski, K.; Tahir, M.; Isradi, M.; et al. Evaluation on the Mechanical Properties of Ground Granulated Blast Slag (GGBS) and Fly Ash Stabilized Soil via Geopolymer Process. Materials 2021, 14, 2833. [Google Scholar] [CrossRef] [PubMed]


| Reference | Type of Soil | Stabilization Agent | Test Carried Out | Main Results |
|---|---|---|---|---|
| Cokca [7] | Expansive soil | High calcium and low calcium fly ash (0–25%) | Atterberg limits, swelling potential | The classification of high calcium (25%) and low calcium (25%) fly ash changed from CH to ML, and CL, respectively, 65% and 68% decrease in swelling potential with high calcium and low calcium fly ash (25% content), respectively |
| Prabakar et al. [8] | CL, OL, MH | Fly ash (9–46%) | compaction, shear strength, free swell, CBR | 15–20% dry density reduction, nonlinear increase of shear strength, decrease of swelling behavior, increase in CBR value |
| Sezer et al. [9] | CH | High lime fly ash (0–15%) | Compaction, UCS, shear strength | Decrease in MDD and increase in OMC, improvement in cohesion, angle of friction, and UCS |
| Phanikumar and Sharma [10] | CH | Low calcium fly ash (0–20%) | Plasticity, shear strength, swelling, compaction | About 50% decrease in swelling potential and plasticity index, 27% increase in undrained shear strength, 25% decrease in OMC, 5% increase in MDD with 20% fly ash content |
| Senol et al. [11] | Clay | Class C fly ash (10–20%) | Compaction, UCS, CBR | Decrease in MDD, increase in OMC, increase in CBR values and UCS |
| Edil et al. [12] | CL, CH, OH | Class C fly ash (0–30%) | CBR | 4 and 8 times increase in CBR values with 10% and 18% fly ash content, respectively on CL and CH, insignificant improvement on OH |
| Phanikumar and Sharma [13] | CH | Class C fly ash (0–20%) | Oedometer, free swell | About 50% decrease in free swell index, significant decrease in compression index |
| Bin-Shafique et al. [14] | CH, CL | Class C fly ash (0–20%) | Plasticity index, UCS, and vertical swell test with wet-dry cycles and freeze-thaw cycles | 4 times increase in UCS on both soil types, about 75% decrease in swelling potential, about 50% decrease in plasticity with 20% fly ash content, no significant effect on test parameters with wet-dry cycles, small decrease in UCS with freeze-thaw cycles |
| Brooks [15] | CH | Class C fly ash (0–25%) | Swell-shrinkage, UCS | About 106% and 50% increase in failure stress and strain, respectively with 25% fly ash content, and decrease in swelling potential |
| Tastan et al. [16] | Organic clay | Class C and F fly ash (10–30%) | UCS | Increase in UCS with a decrease of organic content of soil, and an increase of Ca amount of fly ash |
| Seyrek [17] | CH, CL | Class C and F fly ash (0–30%) | Atterberg limits, swell pressure, UCS, compaction | Decrease in plasticity index up to addition of 20% of fly ash, decrease in swelling potential and increase in UCS up to 25% fly ash content, decrease in MDD, increase in OMC |
| Jose et al. [18] | Expansive soil | Class F fly ash (0–15%) | Atterberg limit, Free swell, UCS | About 36% decrease in liquid limit, 43% increase in compressive strength, and decrease in free swell index from 71% to 39% with 15% fly ash addition |
| Chemical Composition | Class C Fly Ash | Class F Fly Ash |
|---|---|---|
| SiO2 (%) | 28.3 | 48.6 |
| CaO (%) | 32.4 | 2.2 |
| Fe2O3 (%) | 6.6 | 9.2 |
| Al2O3 (%) | 15.8 | 22.5 |
| K2O (%) | 0.5 | 4.1 |
| MgO (%) | 4.2 | 1.3 |
| Na2O (%) | 0.3 | 0.9 |
| P2O5 (%) | 0.7 | 0.2 |
| SO3 (%) | 8.6 | 0.9 |
| TiO2 (%) | 0.9 | 1.1 |
| 1 Day Curing | 7 Days Curing | 28 Days Curing | |
|---|---|---|---|
| Fly Ash Content | Elastic Modulus (E) (MPa) | ||
| 0% (control sample) | 5.9 | 9.5 | 9.4 |
| 5% class C | 16.5 | 21.3 | 23.1 |
| 10% class C | 20.2 | 25.9 | 39.1 |
| 15% class C | 25.2 | 33.7 | 42.6 |
| 20% class C | 25.4 | 51.0 | 62.9 |
| 25% class C | 26.2 | 53.6 | 64.9 |
| 30% class C | 27.5 | 35.0 | 37.5 |
| 5% class F | 8.8 | 12.5 | 14.7 |
| 10% class F | 9.0 | 13.5 | 18.2 |
| 15% class F | 14.0 | 14.1 | 21.0 |
| 20% class F | 14.8 | 16.8 | 21.3 |
| 25% class F | 18.5 | 21.2 | 24.8 |
| 30% class F | 14.8 | 9.0 | 14.6 |
| Fly Ash Content (%) | Curing (Days) | c’ (kPa) | φ’ (Deg.) |
|---|---|---|---|
| 0% | 1 | 17.5 | 18.1 |
| 0% | 7 | 18.5 | 19.6 |
| 0% | 28 | 19.0 | 18.4 |
| 15% class C | 1 | 15.6 | 21.4 |
| 15% class C | 7 | 43.0 | 21.8 |
| 15% class C | 28 | 86.6 | 22.5 |
| 25% class C | 1 | 20.2 | 21.8 |
| 25% class C | 7 | 77.8 | 23.0 |
| 25% class C | 28 | 99.1 | 24.0 |
| 15% class F | 1 | 2.7 | 20.7 |
| 15% class F | 7 | 4.9 | 21.1 |
| 15% class F | 28 | 11.1 | 22.3 |
| 25% class F | 1 | 8.4 | 21.6 |
| 25% class F | 7 | 10.1 | 21.6 |
| 25% class F | 28 | 15.1 | 22.4 |
| Fly Ash Content (%) | Curing (Days) | Compression Index (Cc) | Swelling Index (Cs) |
|---|---|---|---|
| 0% (control sample) | 1 | 0.277 | 0.054 |
| 0% (control sample) | 7 | 0.256 | 0.046 |
| 0% (control sample) | 28 | 0.270 | 0.046 |
| 15% class C | 1 | 0.164 | 0.038 |
| 15% class C | 7 | 0.156 | 0.022 |
| 15% class C | 28 | 0.140 | 0.015 |
| 25% class C | 1 | 0.154 | 0.037 |
| 25% class C | 7 | 0.139 | 0.021 |
| 25% class C | 28 | 0.123 | 0.015 |
| 15% class F | 1 | 0.288 | 0.046 |
| 15% class F | 7 | 0.187 | 0.043 |
| 15% class F | 28 | 0.161 | 0.037 |
| 25% class F | 1 | 0.227 | 0.045 |
| 25% class F | 7 | 0.185 | 0.043 |
| 25% class F | 28 | 0.153 | 0.029 |
| Fly Ash Content (%) | Curing (Days) | Coefficient of Consolidation (Cv) (mm2/min) | Permeability (k) (m/min) |
|---|---|---|---|
| 0% (control sample) | 1 | 1.9 | 2.2 × 10⁻⁸ |
| 0% (control sample) | 7 | 2.3 | 2.3 × 10⁻⁸ |
| 0% (control sample) | 28 | 2.1 | 2.2 × 10⁻⁸ |
| 15% class C | 1 | 8.2 | 5.0 × 10⁻⁸ |
| 15% class C | 7 | 5.5 | 3.2 × 10⁻⁸ |
| 15% class C | 28 | 4.2 | 2.2 × 10⁻⁸ |
| 25% class C | 1 | 9.4 | 5.3 × 10⁻⁸ |
| 25% class C | 7 | 5.5 | 2.8 × 10⁻⁸ |
| 25% class C | 28 | 4.0 | 1.8 × 10⁻⁸ |
| 15% class F | 1 | 6.3 | 7.1 × 10⁻⁸ |
| 15% class F | 7 | 5.7 | 4.1 × 10⁻⁸ |
| 15% class F | 28 | 5.3 | 3.2 × 10⁻⁸ |
| 25% class F | 1 | 8.7 | 7.4 × 10⁻⁸ |
| 25% class F | 7 | 6.0 | 4.2 × 10⁻⁸ |
| 25% class F | 28 | 5.8 | 3.3 × 10⁻⁸ |
Publisher’s Note: MDPI stays neutral with regard to jurisdictional claims in published maps and institutional affiliations. |
© 2022 by the authors. Licensee MDPI, Basel, Switzerland. This article is an open access article distributed under the terms and conditions of the Creative Commons Attribution (CC BY) license (https://creativecommons.org/licenses/by/4.0/).
Share and Cite
Turan, C.; Javadi, A.A.; Vinai, R. Effects of Class C and Class F Fly Ash on Mechanical and Microstructural Behavior of Clay Soil—A Comparative Study. Materials 2022, 15, 1845. https://doi.org/10.3390/ma15051845
Turan C, Javadi AA, Vinai R. Effects of Class C and Class F Fly Ash on Mechanical and Microstructural Behavior of Clay Soil—A Comparative Study. Materials. 2022; 15(5):1845. https://doi.org/10.3390/ma15051845
Chicago/Turabian StyleTuran, Canan, Akbar A. Javadi, and Raffaele Vinai. 2022. "Effects of Class C and Class F Fly Ash on Mechanical and Microstructural Behavior of Clay Soil—A Comparative Study" Materials 15, no. 5: 1845. https://doi.org/10.3390/ma15051845
APA StyleTuran, C., Javadi, A. A., & Vinai, R. (2022). Effects of Class C and Class F Fly Ash on Mechanical and Microstructural Behavior of Clay Soil—A Comparative Study. Materials, 15(5), 1845. https://doi.org/10.3390/ma15051845