Article

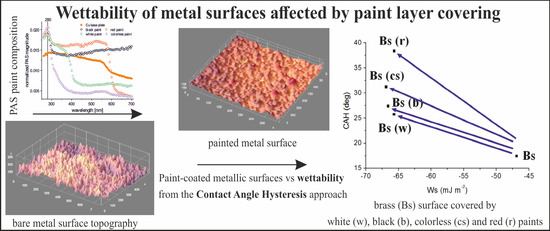
Wettability of Metal Surfaces Affected by Paint Layer Covering

by
Stanislaw Pogorzelski
1,
Katarzyna Boniewicz-Szmyt
2,
Maciej Grzegorczyk
1,3 and
Pawel Rochowski
1,*
1
Institute of Experimental Physics, Faculty of Mathematics, Physics and Informatics, University of Gdańsk, Wita Stwosza 57, 80-308 Gdansk, Poland
2
Department of Physics, Gdynia Maritime University, Morska 81-87, 81-225 Gdynia, Poland
3
MGE, Lipowa 7, 82-103 Stegna, Poland
*
Author to whom correspondence should be addressed.
Materials 2022, 15(5), 1830; https://doi.org/10.3390/ma15051830
Submission received: 7 February 2022 / Revised: 22 February 2022 / Accepted: 24 February 2022 / Published: 28 February 2022

Abstract

:
The aim of the work was to quantify the surface wettability of metallic (Fe, Al, Cu, brass) surfaces covered with sprayed paints. Wettability was determined using the contact angle hysteresis approach, where dynamic contact angles (advancing ΘA and receding ΘR) were identified with the inclined plate method. The equilibrium, ΘY, contact angle hysteresis, CAH = ΘA − ΘR, film pressure, Π, surface free energy, γSV, works of adhesion, WA, and spreading, WS, were considered. Hydrophobic water/solid interactions were exhibited for the treated surfaces with the dispersive term contribution to γSV equal to (0.66–0.69). The registered 3D surface roughness profiles allowed the surface roughness and surface heterogeneity effect on wettability to be discussed. The clean metallic surfaces turned out to be of a hydrophilic nature (ΘY < 90°) with high γSV, heterogeneous, and rough with a large CAH. The surface covering demonstrated the parameters’ evolution, ΘA, ΘR, γSV, WA, and WS, corresponding to the surface hydrophobization and exhibiting base substratum-specific signatures. The dimensionless roughness fluctuation coefficient, η, was linearly correlated to CAH. The CAH methodology based on the three measurable quantities, ΘA, ΘR, and liquid surface tension, γLV, can be a useful tool in surface-mediated process studies, such as lubrication, liquid coating, and thermoflow.

Graphical Abstract

1. Introduction

Surface preparation is an essential step to obtain specific substrates to be applied in several processes, such as corrosive layer deposition, lubrication, spreading rheology, liquid thermoflow control, etc. Solid material wettability is a fundamental property which reveals specific information on the surface chemical structure, component miscibility, and spatial heterogeneity, apart from the surface roughness morphology which is likely to be strongly correlated to the treatment process conditions (relative humidity, temperature, vibrations, process time scale, etc.). The aim of the study was to quantify the surface wettability signatures of metallic (Al, Fe, Cu, brass alloy) surfaces treated with a polymeric paint-coating process. Wetting measurements based on the contact angle (CA) determination are among the most sensitive and commonly realized surface-sensing techniques with an extremely low analysis depth of the order of nm [1]. The determination of solid surface free energy, γSV, and its components is realized by means of several theoretical approaches based on the so-called Young equilibrium contact angle, ΘY [2]. Recent experimental water wettability studies of metallic surfaces demonstrated that other kinds of metals (Ag, Au, Pd, Pt), apart from the ones studied here, possessed higher γSV (within the 40–58 mJ m−2 range) and lower CA being a of hydrophilic nature [3] in reference to polymers, wax layers, rubber, and gelatinous materials which stand for hydrophobic substrata of low γSV (18.9–25.7 mJ m−2) and high CA values [4]. In a typical experiment, the interfacial drop-surface system is forced to “relax” to the thermodynamically stable state by advancing and receding deformation modes, and then the equilibrium, ΘY, is recovered from dynamic CA measurements, as argued for heterogeneous, composite surfaces in [5]. During the course of this research, the contact angle hysteresis (CAH) routine was used and based on the three measurable quantities: dynamic Cas, advancing ΘA, and receding ΘR and probe liquid surface tension, γLV, to determine the solid substratum apparent surface free energy and additional interfacial interaction parameters, as demonstrated in [6]. Apart from the dynamic contact angles, the surface free energy, γSV, 2D adsorptive film pressure Π, works of adhesion, and spreading WA and WS were selected as condition level indicators of the studied metallic clean (reference) and polymeric paint-coated surfaces.
The axisymmetric drop shape analysis profile (ADSA-P) technique was adopted to determine CAs from the sessile drops, although the contact angle hysteresis was evaluated from the sessile drop shape studied with an inclined plate system, as described in [7,8]. The wettability evolution trend was followed with the distribution of experimental points in the CAH versus WS plane to distinguish between two surface processes simultaneously taking place, i.e., surface roughness smoothing and spatial mixing of the paint mixture components [9]. Confocal microscopy studies allowed the 3D surface architecture evaluations by means of the advanced image analysis programs [10] and to find correlations between the surface wettability parameters (CAH) and roughness fluctuation coefficient, η, and to further test CA-roughness theoretical models of Wenzel and Cassie–Baxter [11,12,13]. The adhesive properties of the surfaces were found to be closely correlated to CAH and ΘR attributed to surface paint components segregation [14]. The effect of relative humidity on CA and γSV was also addressed [15,16,17,18]. Generally, the paint-treated metallic surfaces revealed more hydrophobic surface properties compared to the untreated surfaces, i.e., ΘY, ΘA, ΘR, while CAH, Π, γSV , WA, and WS. The strength of dispersive interactions between water molecules and the substratum was rather strong, i.e., the γSVdSV values for the clean surfaces were equal to (0.74–0.77) and decreased to (0.62–0.69) after the surface treatment. The CAH methodology appears to be a sensitive tool for wettability studies of engineering interfacial systems treated in technological processes and can become useful in a long-term, low-cost assessment of surface characteristics under environmental pollution stress.

2. Solid Surface Wettability—Background Relations

Wettability of paint layer-coated solid surfaces can be expressed by static, Young CA measurements, whereas the physicochemical processes occurring at the interface and affecting the interaction energetic changes can be quantified in terms of the surface free energy.
The classical surface energy balance equation, known as the Young–Dupre relation (Equation (1)), defines the equilibrium CA in terms of the free interfacial energies of the system [19]:
γSV − γSL = γLV cos θY
where γSV, γSL, and γLV denote the solid/air, solid/water, and water/air interfacial free energies.
The Young equation is applicable only to the ideal solid surfaces, i.e., smooth, flat, chemically homogeneous, non-porous, non-deformable, and insoluble [20]. However, two different dynamic contact angles can be determined on the same solid substratum in contact with the same probe liquid, called the advancing ѲA and receding ѲR contact angles [21]. The difference between the advancing and receding CAs is defined as the contact angle hysteresis, CAH (=θA − θR), which can be of the kinetic and thermodynamics types [22]. As shown, the thermodynamic CAH results from the surface roughness or chemical heterogeneity of substrata and represents the surface characteristic property [1]. At least five reasons for CAH appearance can be pointed to: surface roughness, chemical microscopic heterogeneity, molecular reorientation, drop size effect, and the liquid penetration into the solid surface. A close correlation was found between the adhesive properties of the surfaces with water-receding CA and CAH, attributed to the liquid surface penetration or surface reconstruction [14].
The effect of surface roughness and its heterogeneity on the apparent contact angle can be expressed by the Wenzel and Cassie relations, respectively. The equation proposed by Wenzel [11]:
cos ѲW = Rf cos ѲY
quantifies the effect of the surface roughness. In this approach, the effect of increased surface area (so-called “effective” area) on CA is accounted for. The roughness factor (Rf) introduced is defined as the ratio of effective/projected areas (geometric/nominal areas); ѲW stands for the Wenzel angle (contact angle on rough surface actually measured), while ѲY represents the static Young angle evidenced for the corresponding “flat” surface.
The relation proposed by Cassie and Baxter [12]:
cos ѲC = F1 cos Ѳ1 + F2 cos Ѳ2
relates the apparent contact angle to the heterogeneity of the surface. Here, ѲC—the Cassie angle—is the weighted average of the CAs of the two phase-consisting surfaces, F1 and F2, corresponding to the fractions of the surface occupied by each phase, and Ѳ1 and Ѳ2 denote CAs of each phase. For very rough surfaces (in the range of CA 90° < θ < 180°), air is likely to be entrapped in capillaries between the liquid and solid substratum. Therefore, the apparent contact angle can be increased as a result of the remaining degree of air on the solid surface. The contact area between liquid and solid is reduced by the entrapped air (here θ2 = 180°), and, assuming the Cassie-Baxter approach, one obtains [23]:
cos θCB = FLS [cos (θY) + 1] − 1
where θCB is the apparent contact angle for the Cassie-Baxter state, and FLS is the fraction of the liquid–solid interface, where liquid is in contact with a solid surface as opposed to air; hence, 1—FLS is the fraction of the liquid–air interface, and θY is Young’s CA at a smooth surface.
In the case of chemically heterogeneous surfaces, ѲA corresponds to the low-energy component of the composite surface, and ѲR points to the high-energy one [1]. The following relation was formulated for heterogeneous surfaces with a particular patchwork geometry coverage [5]:
cos ѲC = ½ cos ѲA + ½ cos ѲR
Another equation was proposed where components are mixing approaches at the molecular level:
(1 + cos ΘC)2 = ½ (1 + cos ѲA)2 + ½ (1 + cos ѲR)2.
Solid surface free energy determination formalisms are mostly based on Young’s equation employing equilibrium CA data [2]. In contrast, by applying the CAH model developed by Chibowski [6], the relations allowed the solid surface free energy and the related parameters of liquid–solid surface interaction energetics to be evaluated from the three measurable quantities, the surface tension of probe liquid, γLV, and dynamic contact angles, ѲA and ѲR. The surface free energy of a solid, γSV, reads as follows [6]:
γSV = Π (1 + cos θA)2/[(1 + cos θR)2 − (1 + cos θA)2]
where the interfacial liquid film pressure, Π, is defined as:
Π = γLV (cos θR − cos θA).
It is supposed that the surface modified CAH is attributed to the work of spreading WS. Consequently, the wettability and the strength of adhesion are related by WS, which can be derived from the work of adhesion, WA, and the work of cohesion, WC:
WS = WAWC
where the components are defined as WA = γLV (1 + cos θA) and WC = 2 γLV [19] and allows one to characterize the competition between liquid/solid adhesions with a variety of liquids or substrata differing in their polarities [24].
It should be noted that for “non-hysteresis” systems (hardly to be found in nature), where CAH = 0 and ΘA = ΘR = ΘY, Equation (4) can be converted to [21]:
γSVtot = γLV (1 + cos θA)/2 = WA/2.
The surface free energy dispersive component, γSVd, is given by [21]:
γSVd = γLV (1 + cos θA)2/4.
Dispersion (London) interactions between molecules of water and apolar components appear to be relatively strong and essential.

3. Materials and Methods

The probe liquid surface tension, γLV; with the accuracy of 0.1 mN m−1, was controlled with the Wilhelmy plate technique using a filter paper plate connected to the force sensor arm (GM2 + UL5, Scaime, France). The pH measurements of the test liquid were performed with a microcomputer pH-meter (CP-315, Elmetron, Zabrze, Poland) with a universal electrode.
The axisymmetric drop shape analysis profile (ADSA-P) technique has been adopted to determine CAs from the sessile drops (2–3 mm in diameter) [25]. For each surface, 4-8 measurements were performed at different surface locations for the spatial homogeneity evaluation. The equilibrium CAs were measured after 20 s from water drop depositions. The ADSA-P setup was described in detail elsewhere [7]. A CCD monochrome TAYAMA 1/3” B/W CCD camera (Tayama, Tokyo, Japan) and an M501 magnifying microscope (Polypower, Taipei, Taiwan) horizontally oriented were used to acquire sessile drop side images. They were analyzed to derive CAs with ImageJ routine. The obtained CA measurement errors were within ±1°. The contact angle hysteresis was evaluated from the sessile drop shape studied with an inclined plate system, as described in [26]. Briefly, for a drop on a tilted plane (see Figure 1 in [8]), the contact angle of the advancing edge, ΘA, increases; simultaneously, the angle of the receding edge, ΘR, decreases. At a certain angle of inclination, the retentive force achieves a critical value; later on, the drop starts to move and that gives proper values of dynamic CAs for the studied system. More details on the experimental CAH measurement procedure can be found in [7].
Surface roughness (SR) profiles of the samples were registered with a confocal microscopy system (Axiovert 200M, Carl Zeiss, Jena, Germany), working in the reflection beam configuration [27] and contour GT optical profilometer (Bruker, Ettlingen, Germany). More detailed signatures of 3D sample architecture were derived by means of the image analysis programs (CMEIAS, ImageJ, PHLIP, COMSTAT, Helicon Focus), as demonstrated in [10]. In particular, ImageJ allows us to create image stacks (perpendicularly along vertical z axis) leading to 3D projections of the surface morphology. To standardize the surface roughness degree, surface roughness fluctuation dimensionless coefficient, η, was introduced here, defined as: η = SD/Rrms, where Rrms is the root-mean-square value of the vertical roughness distribution, and SD is the standard deviation from the mean.
Four model metal substrata measuring 76 mm × 30 mm × 3 mm were made of Cu, Al, Fe, and brass alloy. All the selected materials are easily available and commonly used in the manufacturing industry: aluminum (AA 7064 purchased from Durallium, JD, Jenho, Chino Hills, CA, USA); stainless steel (T8—a high carbon steel with 0.78–0.84% carbon from Baoshan Iron and Steel Co. Ltd., Shanghai, China); copper (CU-M-02-SAMP from American Elements, Los Angeles, CA, USA); brass alloy (CuZn36Pb3CW603N from Filto Profiles, Vallirana, Spain). Each test surface was used as received without any additional mechanical surface treatment; the surface roughness of the samples, Rrms, ranged from 2.3 to 5.6 μm. Prior to each test, the substrates were ultrasonically cleaned with acetone and ethanol.
First, CA determination was performed on untreated clean samples; later on, each of the surfaces was sprayed (as recommended by the producer) with paints: colorless (cs) finishing lacquer alkyd resin-based (Baufix, Holz & Bautechnik GMBH, Seelze, Germany); red (r) finishing lacquer alkyd resin-based (Baufix, Holz & Bautechnik GMBH, Seelze, Germany); black (b) multi-purpose-use paint base on polymeric substances (Bondo/Mar-Hyde Corporation, Atlanta, GA, USA); white (w) anticorrosive primer paint (Hirsh-Pol, Osielsko, Poland). Thicknesses of the paint layers, determined with optical microscopy working in a reflection mode, were contained in the range from 8 to 160 μm, depending on the particular substratum and paint applied, as summarized in Table 1.
In order to roughly estimate the chemical similarity between the paints being a mixture of constituents, the photoacoustic spectra (PAS) of the paint-covered metal surfaces were determined with a closed-type photoacoustic cell system, as described elsewhere [28]. Unlike the standard spectroscopic methods, photoacoustic-based modalities allow us to probe spectral characteristics of opaque materials without any need for special sample modifications. The exemplary PAS spectra for the Cu-coated surfaces, shown in Figure 1, revealed the presence of a common polymeric component for all of the paints studied, characterized by an absorption band around λ ~ 280 nm [29], with additional bands corresponding to pigments of particular colors.
As a probe liquid for CA measurements, distilled water with γLV = 71.7 ± 0.1 mN m−1 was taken from a water deionization apparatus (Millipore, conductivity 0.05 S cm−1) with pH 5.8 ± 0.1, at ambient temperature, T = 23 °C. Measurements were performed at relative humidity (RH) = 45%.

4. Results and Discussion

4.1. Equlibrium Contact Angle-System Themodynamic Stability

It should be pointed out that most solid surface energy quantification approaches based on Young’s equation employ the equilibrium CA, which cannot be obtained on practical surface-modified substrata, as addressed in [1]. The sessile drop technique-originating, so-called static CAs, are considered here. The above Equations (1) and (6) and for WA, i.e., the thermodynamic work of wetting, are valid for the system where phases are in the mutual equilibrium. In fact, the solid surface is said be in equilibrium with the saturated vapor pressure, p0, of the liquid at measurement temperature (at 100% relative humidity, RH). In addition, Decker and Garoff argued that CA can relax to a lower energy state (of lower CA value) if the applied external energy is high enough to partially force the three-phase contact line to overcome the energy barrier of the metastable state [30]. In order to do that, some novel experimental techniques for the “stable equilibrium” or “ideal equilibrium” CA determination based on the vibration of the system were developed [31]. The problem of wetting transitions on rough surfaces resulting from external stimuli was addressed in [32]. In this experiment, the interfacial drop-surface system was forced to “relax” to the thermodynamically stable state by the advancing and receding deformation modes. The static equilibrium, ѲY, contact angles measured directly and derived from CAH data, ѲC, i.e., from Equations (3b) and (3c), with the corresponding γSV derived from γSVa–c = ½ WA = ½ γLV (1 + cos θeq), are collected in Table 2.
As found for each of the studied surfaces, ѲY > ѲCb ~ ѲCc. The static CA difference ranges from 3.0 to 12.1°, which leads to lower γSV by 9–13 mJ m−2, for the direct measurement in reference to the CAH-derived ones. ѲCb and ѲCc values appeared to be in agreement with the reference data reported for metallic surfaces by others [33,34,35,36]. Since ѲCb ~ ѲCc are very close to each other (within 2–3°), the kind of mixing model of components in the composite surface is of secondary importance in determining ѲC. As a result, the dynamic contact angle hysteresis procedure can lead to realistic, equilibrium CAs corresponding to the thermodynamically stable state of the interfacial system. The studied surfaces were all of hydrophilic character (0 < ѲY < 90°). The paint-covered surfaces became more hydrophobic in reference to the original ones, where ѲY increased by 12–15°, and γSV decreased by 5.7–10.5 mJ m−2.

4.2. Relative Humidity Effect

The effect of humidity on CA and γSV was addressed in [15,16,17,18,37], for solid substrata of different polarity. Contact angles of aluminosilicate clays appeared slightly affected by RH between 19 and 75%, and a lower CA was detected at 100%, which likely resulted from the expansion of water film adsorption at the clay surface at RH = 100% [17]. Maximum apparent surface free energy of DPPC (dipalmitoylphosphatidylcholine) bilayer on glass was determined at 50% and 90% RH [16]. These changes in the DPPC bilayer wettability were interpreted as caused by water vapor adsorption. Metals and metal oxides are classified as high-energy solids [15], and the monotonic decrease of the total surface energy from around 70 to 47 mJ m−2 was reported with an increase of RH for the grid-blasted steel surface. The surface free energy of any clean, high-energy surface exposed to an atmosphere containing water vapor is dependent upon the surface concentration of adsorbed water, likely in a form of micrometer-sized water droplets [37]. Contact angle and the surface energy studies performed on original silicon wafers revealed CA and γSV dependence on RH only within the range of 10 to 40% [37]. However, for the oxidized silicon wafer CA and γSV, variability depended on RH, changing periodically with an increase of RH [18]. These changes can be attributed to water adsorption on the hydrophilic silicon surface. Our preliminary CA measurements performed on solid substrata enclosed in humidity-controlled chambers, where the variable humidity was maintained by using salt solutions, demonstrated a decrease of γSV with an increase of RH for the solid of hydrophilic character (quartz, poly(methyl metracrylate)—PMMA). The opposite trend was noticed for hydrophobic surfaces (paraffin wax, polytetrafluoroethylene—PTFE), whereas no significant effect was found for indium tin oxide (ITO) alloy and ruby (Al2O3-based crystal) surfaces, as depicted in Figure 2.

4.3. Wettability from Dynamic Contact Angles

The CAH approach allowed for the quantitative evaluations of interfacial interactions by means of wettability parameters, as collected in Table 3, for metallic surfaces free and coated with color spread paints.
As a matter of fact, CAH parameter variability referred to the clean, unaffected surface case rather than their absolute values and represent a useful monitoring tool for the metallic surface modification.
The metallic surface paint-covering effect revealed the following variability of the CAH parameters: θA, θR, CAH by a few percent (5–8%); Π exhibited high values (from 46.9 mN m−1) and decreased; γSV (for Al and Fe samples) and γSV (for Cu and brass samples) by several percent (11.3–30.0%); WA decreased by 5.6–11.3%, WS became more negative (changing from −46.6 to −68.9 mJ m−2). The surface energy parameters exhibited mainly hydrophobic water/solid surface interactions, i.e., the dispersive term, γSVd, of the surface free energy was equal to (0.74–0.77) γSV and decreased to (0.66–0.69) γSV for the coated surfaces. It can be stated that the strength of the dispersive interactions between the water molecules and model surfaces was rather weak in reference to hydrophobic polymer surfaces (PMMA), with γSVd equal to 0.89–0.90 γSV, whereas for hydrophilic surfaces, the dispersive term contribution was equal to 0.33 γSV (glass), 0.59 γSV (steel), and 0.42 γSV (silicon) [8]. The observed strong CAH on hydrophilic surfaces appeared as a result of the high energy barrier for interfacial liquid density fluctuations [13]. As demonstrated in [38], an increase in CAH leads to the stronger adhesion between the liquid and the substratum. The receding CA is actually the measurement most characteristic of the modified component of the surface, particularly for surfaces modified by adhesive layer deposition creating energy barriers [39]. As θR, the relative contribution of most hydrophilic components in the surface free energy increased according to Equation (4). On the other hand, for the same surface, θA is noticed, which points to the selection process of both less hydrophilic and most hydrophilic compounds occupying the outermost solid area in a complex way. There is the further problem of the solid surface free energy calculation, even for a given system with properly determined CA, because of the film pressure, Π—Equation (5) affects the apparent free energy of the solid surface [21]. Noting that the liquid does not spread completely over the solid surface, the so-called film pressure, Π, becomes positive, and the film increases the apparent surface energy. As a result, the Young–Dupre relation should take the modified form [21]: γSV − γSL − Π = γLV cos θY. The complex surface wettability of the metallic paint-covered surfaces evolution can be reflected in the spatial distribution of the experimental points placed in the 2D space of CAH plotted versus WS [8,9]. Such a plot constructed from the data of comprehensive measurements performed on differentiated model substrata (polymeric, metallic, natural–biological, and composite) obtained in previous authors’ studies ([4]) is presented in Figure 3. On the background data, the blue box covering area CAH (12.9–46.6 mN m−1) and WS (from −73.7 to −45.0 mJ m−2) corresponding the studied here surfaces coordinates is also included, for comparison.
The paint-covered surfaces stand for a complex interfacial system, where several processes, such as roughness smoothing and paint components spatial and temporal segregation take place simultaneously. Moreover, they are base substratum specific, as demonstrated in Figure 4A–D, for each of the surface-modified samples separately.
The experimental point coordinate evolution demonstrated the similarly smooth and homogeneous surfaces for the paint-treated Al surfaces: Al(b), Al(cs), and Al(r) as the reference Al (Figure 4A), since CAH laid in 27–29° (CAH ~ const.), but the component composition is widely distributed (WS was ranging from −60.6 to −55.4 mJ m−2). For Al(w) surface, CAH was close (46.6°) to the reference surface case (42.9°), but the makeup of the components was different as reflected in WS changing from −58.2 to −68.9 mJ m−2, and the increased contribution of more hydrophobic compounds (both θR and θA) pointing to the surface hydrophobization process.
The Fe surface treatment, for (w), (b), and (r) paint coverings demonstrated a similar evolution trend of wettability (Figure 4B). These painted surfaces became enriched with more hydrophobic components (both θR and θA), and WS became more negative from −46.6 to −73.7 (w) mJ m−2. Fe(cs) surface wettability appeared to be an exception; WA corresponded almost to the reference one (98.3 and 96.8 mJ m−2, respectively) but such a surface was smoother and more homogeneous (CAH drop from 27.7 to 12.8°).
For paint-covered Cu surfaces, similar component compositions can be noticed for (b), (cs), and (w) colors leading to surface hydrophobization with WS contained in the range of −67.6 to −65.4 mJ m−2 in reference to the clean Cu surface (Figure 4C). However, they represent surfaces of differentiated microroughness and spatial homogeneity reflected in large differences in CAH (from 24.7° (w), 30.6° (cs) to 33.0° (b)). The exceptional wetting signatures revealed the Cu(r)-painted surface, where both the surface roughness and its heterogeneity increase were likely to appear (CAH), and hydrophobicity progressed (WS more negative) compared to the reference Cu sample.
The smoothing effect of paints on roughness of the brass surface was evident from the data point distribution in Figure 4D. For all the painted surfaces, paint-forming components were of similar proportions and wetting properties (θA differed slightly from 85.2–86.2° as well as θR (54.9–59.5°)), and exhibited comparable adhesive strength, WA (76.5–77.7 mJ m−2), i.e., WS ~ const. Under such conditions, the smoothing effect was reflected in CAH variability directed parallel to CAH axis.

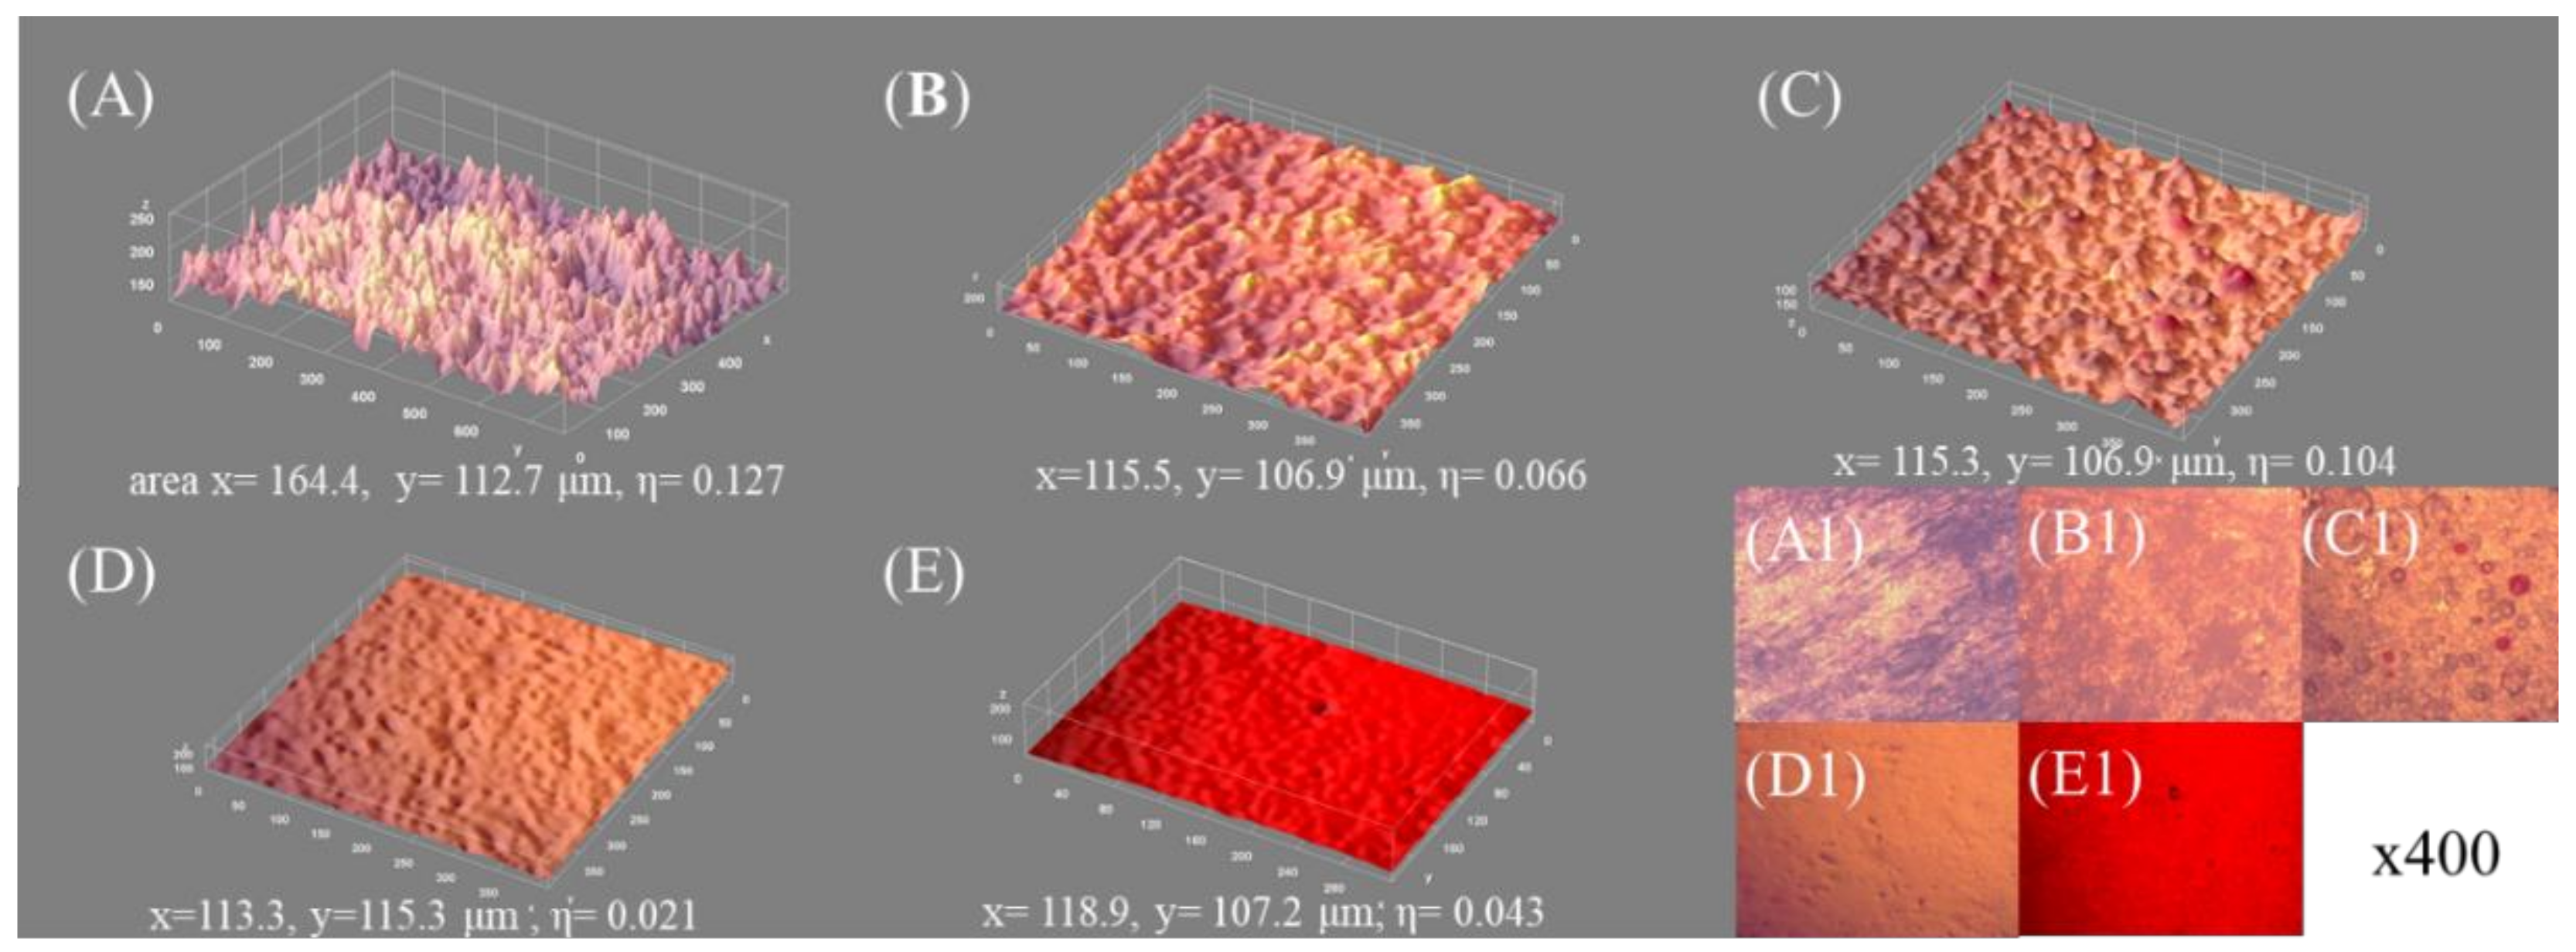
4.4. Surface Architecture versus Wettability

Surface morphology of the Al (ref) sample is shown in Figure 5A (the surface plot area covers 164.4 × 209.4 μm range); the surface profile along the line from Figure 5A is presented in Figure 5B, and 3D surface architecture is demonstrated in Figure 5C. The Rf parameter = 2.71, and Rrms = 3.5 ± 0.2 μm. As argued in [21], the apparent surface free energy decreases gradually with the increase of the roughness ratio, Rf. Moreover, for a very rough Al surface for which the undulation profile is shown in Figure 5B, the surface free energy evaluated from the water CA using the Wenzel approach (Equation (2)) is as low as 18 mJ m−2. Consequently, for large enough roughness (i.e., enough large ratios Rf = A/A0), the Cassie–Baxter state appears to be the thermodynamically stable state for the interfacial system [13]. The FLS fraction can be determined from Equation (3a): FLS = (cos ΘCB + 1)/(cos ΘY + 1). Since from the measurement, ΘCB = 56.6° and ΘY = 49.3° (for flat polished surface), FLS = 0.94, and the surface fraction is covered with the entrapped air under the liquid phase = 1 − FLS = 0.06.
By applying the simplified model (see Figure 6 in [13]), a pressure which has to applied to a cylindrical cavity to the droplet covering the cavity inlet area can be evaluated. The liquid tends to bend inwards the cavity if the pressure exceeds the critical Laplace capillary pressure pc = −2 γLV cos (Θ) R−1, where R is the radius of the cavity. In such a case, the liquid will be squeezed into the capillary. By analyzing the surface profile from Figure 5B, it was found that the mean capillary-like scratches had a cavity radius distribution with the mean R = (4.0 ± 2.5 μm). The required pressure is pc = 19,734 Pa (i.e., = 0.19 pa, where: pa is the normal ambient atmospheric pressure). In the framework of the presented model, if Θ < 90° (hydrophilic surface), pc < 0, and the liquid is supposed to fill out the cavity (as assumed in Wenzel state). On the other hand, for Θ > 90° (hydrophobic surface), pc > 0, and very high pressures must be applied to squeeze liquid into capillaries.
The vertical roughness profile, Rrms, better characterizes the rough surface wettability than the Rf parameter [21]. It was postulated that the water contact angle (in degrees) is almost linearly dependent on the average, Rrms (μm), for Al modified surfaces (polishing, sandblasting, chemical etching, laser ablation, etc.), and approximated with the function [33]: ΘY = −14 Rrms + 100. For the Al surface considered here, one obtains ΘY = 51.0° from the approach in reference to the measured CA value = 56.6°, which reveals a certain agreement with the model-predicted value.
The chemical composition, apart from the surface structure and hydrophobic/hydrophilic properties, affect the wettability [35]. Surfaces of metals and their alloys are coated with oxide films, which results in their hydrophilic properties with high surface energy. The final wettability depends on the history of the surface treatment when the surface processes induct adsorption, chemisorption, or chemical interaction of gases occurring in the ambient environment. Recently, several studies were performed on laser texturing of stainless steel, polymeric surfaces followed by surface modification with organic coating adapted to create composite surfaces with different surface roughness (Rf), morphologies, and wettability [40,41,42]. It is known that high energy surfaces (of hydrophilic character) are enriched in polar functional groups such as, –CO, –NH2, –OH, –COOH, whereas the hydrophobic surfaces contain non-polar groups (alkyl, fluoroalkyl, –SH, etc.). To conclude, assuming that the surface morphologies of all the surfaces are similar, the surface hydrophilicity should increase with an increase of oxygen content, and increased carbon content should lead to hydrophobic properties.
Microscopic registrations and 3D-studied surface micro architecture, for brass (free) and its paint-coated surfaces are depicted in Figure 6A–E. Generally, the metal surface paint-treatment was manifested by lowered Rrms and η values, the flattening of valleys, and closing of inter-grain regions, slits, and cracks.
CAH was found to be greater in the case of rough surfaces, but it is mainly attributed to chemical interactions and heterogeneities [36]. The relationship for CAH as a function of roughness, Rf, was already postulated [43]. For a homogeneous interface a roughness increase (high Rf) results in an increase of CA hysteresis (high CAH values). For a composite surface with regions of different wettability, it leads to both high CA and low CA hysteresis according to the relation: CAH = Rf [(cos ѲR0 − cos ѲA0)/(Rf cos Ѳeq + 1)1/2], where ѲR0, ѲA0, and Ѳeq (~ ѲY) are the receding, advancing, and equilibrium contact angles, respectively, derived for a smooth interface.
Values of η demonstrated the following trend: η(ref) > η(w) > η(cs) > η(r) > η(b), as given in each picture from Figure 6A–E. Generally, the linear relation between CAH and the roughness coefficient, η, was formulated in the form: CAH = A + Bη, where A = −20.45 ± 10.85, and B = 366.08 ± 74.17; correlation coefficient R = 0.78, valid for all the studied surfaces, as depicted in Figure 7.

5. Conclusions

The paint-coated treatment of originally high surface energy, hydrophilic metallic substrata changed the interfacial force balance due to different interactions, and the γSVdSV ratio originally being equal to (0.74–0.77) γSV decreased to (0.62–0.69) γSV. A set of the surface wettability energetics parameters revealed the general trend of their variability as follows: ΘY, ΘA, ΘR, CAH, γSV, WA, and WS less negative, characteristic for the surface hydrophobization. However, a spatial evolution of the data points distribution in the space of CAH versus WS made it possible to distinguish between the processes simultaneously taking place, i.e., micro-roughness smoothing, chemical paint components distribution and mixing at the outermost surface; they turned out to be base substratum specific. The surface wettability was mainly attributed to the compositional changes at the interface than to the surface roughness and homogeneity since CAH remained almost unchanged for both the reference and treated samples. An increase in both θR and θA for the treated surface confirms such a conceivable explanation. For rough surfaces (roughness parameter Rf >> 1), the stable thermodynamic state of the interface was obeyed by the Cassie–Baxter model rather than by the Wenzel one. The static, equilibrium CA can be derived from the dynamic contact angles approach as proposed here, leading to γSV values agreeing with the data reported by others for the studied model surfaces. High Π values are related to the organized water molecules at the interface mediated by relative humidity, RH. It seems that the surface treatment was affected by the interfacial organization of water molecules in the bulk phase because Π values were apparently higher (29.2–42.9 mN m−1) compared to (19.0–28.4 mN m−1) for the reference sample.
Large values of CAH were found that are characteristic for hydrophilic surfaces with a high energy barrier. Moreover, CAH appeared to be linearly dependant on the so-called surface roughness fluctuation dimensionless coefficient, which was introduced here as a universal measure applicable to any surface of a certain undulation degree. In this study, we were interested in the surface treatment wettability modifications important from a practical point of view, i.e., for practical applications in lubrication, surface rheology, adhesive layer coating, liquid themoflow, painting, and printing. The presented CAH methodology turned out to an effective tool for the wettability monitoring and quantification of surface-treated solid substrata also exposed to pollution stress pressure seen in natural environment assessments.

Author Contributions

S.P.: conceptualization, methodology, investigation, formal analysis, validation, resources, writing—original draft, supervision; K.B.-S.: methodology, investigation, formal analysis, resources; M.G.: software, data curation; P.R.: investigation (PAS and γSV vs. RH), review and editing. All authors have read and agreed to the published version of the manuscript.

Funding

The work has been partially supported by the National Science Centre Miniatura-4 project (grant number: 2020/04/X/ST5/01503).

Institutional Review Board Statement

Not applicable.

Informed Consent Statement

Not applicable.

Data Availability Statement

The data reported can be shared on demand after contacting the corresponding authors.

Conflicts of Interest

The authors declare no conflict of interest.

References

  1. Strobel, M.; Lyons, C.S. An Essay on Contact Angle Measurements. Plasma Process. Polym. 2011, 8, 8–13. [Google Scholar] [CrossRef]
  2. Gindl, M.; Sinn, G.; Gindl, W.; Reiterer, A.; Tschegg, S. A comparison of different methods to calculate the surface free energy of wood using contact angle measurements. Colloids Surf. A Physicochem. Eng. Asp. 2001, 181, 279–287. [Google Scholar] [CrossRef]
  3. Gim, S.; Cho, K.J.; Lim, H.-K.; Kim, H. Structure, Dynamics, and Wettability of Water at Metal Interfaces. Sci. Rep. 2019, 9, 14805. [Google Scholar] [CrossRef] [Green Version]
  4. Boniewicz-Szmyt, K.; Pogorzelski, S.J. Surface energy of solids: Selection of effective substrates for bioadhesion in aqueous media. Sci. J. Gdynia Marit. Univ. 2019, 112, 7–22. [Google Scholar] [CrossRef]
  5. Israelachvili, J.N.; Gee, M.L. Contact angles on chemically heterogeneous surfaces. Langmuir 1989, 5, 288–289. [Google Scholar] [CrossRef]
  6. Chibowski, E. Surface free energy of a solid from contact angle hysteresis. Adv. Colloid Interface Sci. 2003, 103, 149–172. [Google Scholar] [CrossRef]
  7. Mazurek, A.Z.; Pogorzelski, S.J.; Boniewicz-Szmyt, K. Adsorption of natural surfactants present in sea waters at surfaces of minerals: Contact angle measurements. Oceanologia 2009, 51, 377–403. [Google Scholar] [CrossRef] [Green Version]
  8. Pogorzelski, S.J.; Berezowski, Z.; Rochowski, P.; Szurkowski, J. A novel methodology based on contact angle hysteresis approach for surface changes monitoring in model PMMA-Corega Tabs system. Appl. Surf. Sci. 2012, 258, 3652–3658. [Google Scholar] [CrossRef]
  9. Pogorzelski, S.J.; Rochowski, P.; Szurkowski, J. Pinus sylvestris L. needle surface wettability parameters as indicators of atmospheric environment pollution impacts: Novel contact angle hysteresis methodology. Appl. Surf. Sci. 2014, 292, 857–866. [Google Scholar] [CrossRef]
  10. Grzegorczyk, M.; Pogorzelski, S.J.; Pospiech, A.; Boniewicz-Szmyt, K. Monitoring of Marine Biofilm Formation Dynamics at Submerged Solid Surfaces with Multitechnique Sensors. Front. Mar. Sci. 2018, 5, 363. [Google Scholar] [CrossRef]
  11. Wenzel, R.N. Resistance of solid surfaces to wetting by water. Ind. Eng. Chem. 1936, 28, 988–994. [Google Scholar] [CrossRef]
  12. Cassie, A.B.D.; Baxter, S. Wettability of porous surfaces. Trans. Faraday Soc. 1944, 40, 546. [Google Scholar] [CrossRef]
  13. Yang, C.; Tartaglino, U.; Persson, B.N.J. Nanodroplets on rough hydrophilic and hydrophobic surfaces. Eur. Phys. J. E 2008, 25, 139–152. [Google Scholar] [CrossRef]
  14. Schmidt, D.L.; Brady, R.F.; Lam, K.; Schmidt, D.C.; Chaudhury, M.K. Contact Angle Hysteresis, Adhesion, and Marine Biofouling. Langmuir 2004, 20, 2830–2836. [Google Scholar] [CrossRef] [PubMed]
  15. Gledhill, R.A.; Kinloch, A.J.; Shaw, S.J. Effect of Relative Humidity on the Wettability of Steel Surfaces. J. Adhes. 1977, 9, 81–85. [Google Scholar] [CrossRef]
  16. Chibowski, E.; Terpilowski, K.; Holysz, L. Effect of Relative Humidity on Contact Angle and its Hysteresis on Phospholipid DPPC Bilayer Deposited on Glass. In Advances in Contact Angle, Wettability and Adhesion; John Wiley & Sons, Inc.: Hoboken, NJ, USA, 2013; pp. 329–346. [Google Scholar]
  17. Shang, J.; Flury, M.; Harsh, J.B.; Zollars, R.L. Contact angles of aluminosilicate clays as affected by relative humidity and exchangeable cations. Colloids Surf. A Physicochem. Eng. Asp. 2010, 353, 1–9. [Google Scholar] [CrossRef]
  18. Alam, A.U.; Howlader, M.M.R.; Deen, M.J. The effects of oxygen plasma and humidity on surface roughness, water contact angle and hardness of silicon, silicon dioxide and glass. J. Micromech. Microeng. 2014, 24, 035010. [Google Scholar] [CrossRef]
  19. Adamson, A.W.; Gast, A.P. Physical Chemistry of Surfaces, 6th ed.; Wiley and Sons: New York, NY, USA, 1997; ISBN 0471148733. [Google Scholar]
  20. Tavana, H.; Lam, C.N.C.; Grundke, K.; Friedel, P.; Kwok, D.Y.; Hair, M.L.; Neumann, A.W. Contact angle measurements with liquids consisting of bulky molecules. J. Colloid Interface Sci. 2004, 279, 493–502. [Google Scholar] [CrossRef]
  21. Chibowski, E. On some relations between advancing, receding and Young’s contact angles. Adv. Colloid Interface Sci. 2007, 133, 51–59. [Google Scholar] [CrossRef]
  22. Terpiłowski, K.; Hołysz, L.; Chodkowski, M.; Clemente Guinarte, D. What Can You Learn about Apparent Surface Free Energy from the Hysteresis Approach? Colloids Interfaces 2021, 5, 4. [Google Scholar] [CrossRef]
  23. Yuan, Y.; Hays, M.P.; Hardwidge, P.R.; Kim, J. Surface characteristics influencing bacterial adhesion to polymeric substrates. RSC Adv. 2017, 7, 14254–14261. [Google Scholar] [CrossRef] [Green Version]
  24. Rodríguez-Valverde, M.; Cabrerizo-Vílchez, M.; Rosales-López, P.; Páez-Dueñas, A.; Hidalgo-Álvarez, R. Contact angle measurements on two (wood and stone) non-ideal surfaces. Colloids Surf. A Physicochem. Eng. Asp. 2002, 206, 485–495. [Google Scholar] [CrossRef]
  25. Pogorzelski, S.J.; Mazurek, A.Z.; Szczepanska, A. In-situ surface wettability parameters of submerged in brackish water surfaces derived from captive bubble contact angle studies as indicators of surface condition level. J. Mar. Syst. 2013, 119–120, 50–60. [Google Scholar] [CrossRef]
  26. Extrand, C.W.; Kumagai, Y. Liquid Drops on an Inclined Plane: The Relation between Contact Angles, Drop Shape, and Retentive Force. J. Colloid Interface Sci. 1995, 170, 515–521. [Google Scholar] [CrossRef]
  27. Inaba, T.; Ichihara, T.; Yawata, Y.; Toyofuku, M.; Uchiyama, H.; Nomura, N. Three-dimensional visualization of mixed species biofilm formation together with its substratum. Microbiol. Immunol. 2013, 57, 589–593. [Google Scholar] [CrossRef] [PubMed]
  28. Rochowski, P.; Niedziałkowski, P.; Pogorzelski, S.J. The benefits of photoacoustics for the monitoring of drug stability and penetration through tissue-mimicking membranes. Int. J. Pharm. 2020, 580, 119233. [Google Scholar] [CrossRef]
  29. Arangdad, K.; Yildirim, E.; Detwiler, A.; Cleven, C.D.; Burk, C.; Shamey, R.; Pasquinelli, M.A.; Freeman, H.S.; El-Shafei, A. Influence of UV stabilizers on the weathering of PETG and PCTT films. J. Appl. Polym. Sci. 2019, 136, 48198. [Google Scholar] [CrossRef]
  30. Decker, E.L.; Garoff, S. Using Vibrational Noise To Probe Energy Barriers Producing Contact Angle Hysteresis. Langmuir 1996, 12, 2100–2110. [Google Scholar] [CrossRef]
  31. Marmur, A.; Della Volpe, C.; Siboni, S.; Amirfazli, A.; Drelich, J.W. Contact angles and wettability: Towards common and accurate terminology. Surf. Innov. 2017, 5, 3–8. [Google Scholar] [CrossRef] [Green Version]
  32. Bormashenko, E. Progress in understanding wetting transitions on rough surfaces. Adv. Colloid Interface Sci. 2015, 222, 92–103. [Google Scholar] [CrossRef]
  33. Torrisi, L.; Scolaro, C. Treatment techniques on aluminum to modify the surface wetting properties. Acta Phys. Pol. A 2015, 128, 48–53. [Google Scholar] [CrossRef]
  34. Nishioka, M.; Yamabe, Y.; Hisatsune, K.; Fujii, H. Influence of Polishing of Denture Base Resin and Metal Surfaces on Wettability with Water and Saliva. Dent. Mater. J. 2006, 25, 161–165. [Google Scholar] [CrossRef] [Green Version]
  35. Žemaitis, A.; Mimidis, A.; Papadopoulos, A.; Gečys, P.; Račiukaitis, G.; Stratakis, E.; Gedvilas, M. Controlling the wettability of stainless steel from highly-hydrophilic to super-hydrophobic by femtosecond laser-induced ripples and nanospikes. RSC Adv. 2020, 10, 37956–37961. [Google Scholar] [CrossRef]
  36. Kubiak, K.J.; Wilson, M.C.T.; Mathia, T.G.; Carval, P. Wettability versus roughness of engineering surfaces. Wear 2011, 271, 523–528. [Google Scholar] [CrossRef] [Green Version]
  37. Hołysz, L.; Mirosław, M.; Terpiłowski, K.; Szcześ, A. Influence of relative humidity on the wettability of silicon wafer surfaces. Ann. UMCS Chem. 2008, 63, 223–239. [Google Scholar] [CrossRef] [Green Version]
  38. Gao, L.; McCarthy, T.J. Contact Angle Hysteresis Explained. Langmuir 2006, 22, 6234–6237. [Google Scholar] [CrossRef] [PubMed]
  39. Long, J.; Chen, P. On the role of energy barriers in determining contact angle hysteresis. Adv. Colloid Interface Sci. 2006, 127, 55–66. [Google Scholar] [CrossRef] [PubMed]
  40. Conradi, M.; Sever, T.; Gregorčič, P.; Kocijan, A. Short- and Long-Term Wettability Evolution and Corrosion Resistance of Uncoated and Polymer-Coated Laser-Textured Steel Surface. Coatings 2019, 9, 592. [Google Scholar] [CrossRef] [Green Version]
  41. Abbas, M.; Mehran, M.T.; Moon, M.-W.; Byun, J.Y.; Kim, S.H. Wettability control of modified stainless steel surfaces for oxide catalyst carrier slurry coating. J. Ind. Eng. Chem. 2020, 91, 330–339. [Google Scholar] [CrossRef]
  42. Jia, X. Wettability of Rough Polymer, Metal and Oxide Surfaces as Well as of Composite Surfaces. J. Adhes. Sci. Technol. 2008, 22, 1893–1905. [Google Scholar] [CrossRef]
  43. Nosonovsky, M.; Bhushan, B. Hierarchical roughness optimization for biomimetic superhydrophobic surfaces. Ultramicroscopy 2007, 107, 969–979. [Google Scholar] [CrossRef] [PubMed]
Figure 1. Normalized (with respect to carbon black) photoacoustic spectra for metallic Cu substrata-coated with spread paints; modulation frequency 120 Hz. The spectral band around λ ~ 280 nm points to the presence of a common polymeric component for all the paints investigated, while additional bands show a certain contribution of supplementary pigments.
Materials 15 01830 g001
Figure 2. Surface free energy, γSV, versus relative humidity, RH, for solid surfaces of different hydrophobicity.
Materials 15 01830 g002
Figure 3. Contact angle hysteresis (CAH) as a function of work of spreading WS for a variety of solid substrata in contact with water; denotations and data from [4] with the blue box area comprising data for the studied paint-covered surfaces.
Materials 15 01830 g003
Figure 4. Contact angle hysteresis, CAH, as a function of work of spreading, WS, for metallic surfaces: (A) Al, (B) Fe, (C) Cu, and (D) brass alloy, clean-reference, and coated with color paints: w—white, b—black, r—red, and cs—colorless (transparent). The data evolution was indicated with the arrows in reference to the clean surface case.
Materials 15 01830 g004
Figure 5. Microscopic images (magnification 400×) of Al (ref) surface architecture (A), (B) 2D surface profile along the line from (A), and (C) 3D surface morphology derived with ImageJ procedure; covered area x = 164.4 and y = 209.4 μm, distance scale 36 pixels = 10 μm, roughness fluctuation coefficient η = 0.163.
Materials 15 01830 g005
Figure 6. 3D surface morphology and microscopic images (magnification 400×) of brass (clean) (A and A1, respectively) and covered with paints of different kinds: (B,B1) colorless, (C,C1) white, (D,D1) black, (E,E1) red; distance scale: 36 pixels = 10 μm; image-covered surface areas and surface roughness fluctuation coefficients, η, are given underneath.
Materials 15 01830 g006
Figure 7. Contact angle hysteresis, CAH, versus surface roughness fluctuation coefficient, η, for metallic clean and paint-coated substrata. The ±2.0° CAH error bars were omitted to enhance the data presentation.
Materials 15 01830 g007
Table 1. Thickness of paint layers at metallic surfaces [μm]; mean (standard deviation).
Metallic SubstratumColorlessWhiteBlackRed
Al44 (2)24 (3)44 (2)8 (2)
Fe20 (2)14 (3)8 (3)10 (2)
Brass40 (3)8 (2)104 (6)16 (3)
Cu56 (6)84 (5)8 (2)160 (8)
Table 2. Static equilibrium contact angles, θeq, and corresponding γSV for metallic free (ref.) and coated with spread paint surfaces; probe liquid, γLV = 71.7 mN m−1 at 23 °C. The experimental uncertainties and standard deviations are given in brackets.
SubstratumΘY aγSV aΘC bγSV bΘC cγSV c
[deg][mJ m−2][deg][mJ m−2][deg][mJ m−2]
Al ref.67.1 (1)33.4 (1.5)58.9 (2.3)54.3 (1.7)56.6 (1.8)55.6 (2.1)
Al (w)85.4 (1)28.1 (1.4)68.2 (2.4)49.2 (1.6)65.6 (2.2)50.6 (2.0)
Al (b)75.2 (1)36.7 (1.6)63.6 (2.3)51.8 (1.7)62.4 (2.1)52.4 (2.0)
Al (r)74.8 (1)37.1 (1.6)63.2 (2.3)51.9 (1.7)62.1 (2.1)52.6 (2.0)
Al (cs)79.1 (1)34.7 (1.5)67.9 (2.4)49.4 (1.6)66.8 (2.2)49.9 (2.0)
Fe ref.68.0 (1)42.2 (1.6)56.8 (2.2)55.5 (1.8)55.9 (1.8)55.9 (2.2)
Fe (w)83.9 (1)27.2 (1.4)75.8 (2.5)44.6 (1.6)74.1 (3.1)45.6 (1.8)
Fe (b)78.2 (1)35.1 (1.5)62.3 (2.3)52.5 (1.7)60.7 (2.0)53.4 (2.1)
Fe (r)77.6 (1)34.4 (1.5)69.2 (2.4)48.6 (1.6)68.2 (2.7)49.2 (1.9)
Fe (cs)63.7 (1)45.9 (1.7)61.9 (2.3)52.7 (1.7)61.7 (2.2)52.8 (2.1)
Cu ref.70.2 (1)39.0 (1.6)61.5 (2.3)52.9 (1.7)60.6 (1.9)53.4 (2.1)
Cu (w)81.6 (1)33.0 (1.5)72.7 (2.5)46.5 (1.6)71.7 (2.9)47.1 (1.8)
Cu (b)83.9 (1)30.2 (1.4)71.0 (2.5)47.5 (1.6)69.4 (2.8)48.4 (1.9)
Cu (r)70.8 (1)36.4 (1.5)62.2 (2.3)52.5 (1.7)59.8 (1.9)53.9 (2.2)
Cu (cs)79.9 (1)31.7 (1.4)70.5 (2.4)47.8 (1.7)69.1 (2.8)48.6 (1.9)
brass ref.64.0 (1)43.9 (1.7)61.4 (2.3)52.9 (1.7)61.0 (2.1)53.2 (2.2)
brass (w)79.1 (1)32.5 (1.5)72.8 (2.5)46.4 (1.6)71.8 (3.0)47.1 (1.8)
brass (b)77.8 (1)31.7 (1.4)72.9 (2.5)46.5 (1.6)71.6 (3.0)47.2 (1.8)
brass (r)73.4 (1)30.4 (1.4)67.4 (2.4)49.6 (1.6)65.4 (2.6)50.7 (2.0)
brass (cs)72.3 (1)30.9 (1.4)71.3 (2.5)47.3 (1.6)69.8 (2.8)48.2 (1.8)
a CA directly measured. b CA derived from CAH data (Equation (3b)). c CA derived from CAH data (Equation (3c)). γSVa–c = ½ WA = ½ γLV (1 + cos θeq) (Equation (7)).
Table 3. Wettability parameters derived from dynamic contact angles for metallic surfaces coated with spread paints; water probe liquid, γLV = 71.7 mN m−1, WC = 143.4 mJ m−2 at T = 23 °C. Denotations: ref.—paint free surface; paint color: w—white, b—black, r—red, cs—colorless (transparent). The experimental uncertainties and standard deviations are given in brackets.
Substratum θAθRCAHπγSVWAWSγSVdγSVdSV
[°][°][°][mN m−1][mJ m−2][mJ m−2][mJ m−2][mJ m−2][-]
Al ref.79.2
(1)
32.5
(1)
46.6
(2)
46.9
(1.5)
33.4
(1.5)
85.2
(2.5)
−58.2
(2.7)
25.3
(0.5)
0.76
(0.4)
Al (w)87.8
(1)
44.9
(1)
42.9
(2)
48.0
(1.5)
28.1
(1.4)
74.4
(2.1)
−68.9
(2.3)
19.3
(0.4)
0.69
(0.3)
Al (b)77.5
(1)
47.6
(1)
29.9
(2)
32.8
(1.2)
36.7
(1.6)
87.2
(2.6)
−56.1
(2.8)
26.5
(0.5)
0.72
(0.4)
Al (r)76.9
(1)
47.5
(1)
29.4
(2)
32.2
(1.2)
37.1
(1.6)
87.9
(2.6)
−55.4
(2.8)
26.9
(0.5)
0.73
(0.4)
Al (cs)81.1
(1)
53.2
(1)
27.9
(2)
31.9
(1.2)
34.7
(1.5)
82.8
(2.4)
−60.6
(2.6)
23.9
(0.5)
0.69
(0.4)
Fe ref.69.5
(1)
41.8
(1)
27.7
(2)
28.4
(1.1)
42.2
(1.6)
96.8
(2.8)
−46.6
(3.0)
32.7
(0.6)
0.77
(0.5)
Fe (w)91.7
(1)
58.9
(1)
32.8
(2)
39.1
(1.4)
27.2
(1.4)
69.6
(1.8)
−73.7
(2.0)
16.9
(0.3)
0.62
(0.3)
Fe (b)78.6
(1)
42.9
(1)
35.6
(2)
38.3
(1.4)
35.1
(1.5)
85.9
(2.6)
−57.5
(2.8)
25.7
(0.5)
0.73
(0.4)
Fe (r)81.9
(1)
55.2
(1)
26.7
(2)
30.9
(1.2)
34.4
(1.5)
81.7
(2.4)
−61.6
(2.6)
23.3
(0.5)
0.68
(0.4)
Fe (cs)68.2
(1)
55.3
(1)
12.9
(2)
14.1
(0.8)
45.9
(1.7)
98.3
(2.8)
−45.0
(3.0)
33.7
(0.6)
0.74
(0.4)
Cu ref.74.5
(1)
46.7
(1)
27.8
(2)
29.9
(1.1)
39.0
(1.6)
90.9
(2.7)
−52.5
(2.9)
28.8
(0.5)
0.74
(0.4)
Cu (w)84.6
(1)
59.9
(1)
24.7
(2)
29.2
(1.1)
33.0
(1.5)
78.4
(2.3)
−64.9
(2.5)
21.4
(0.4)
0.65
(0.3)
Cu (b)86.7
(1)
53.6
(1)
33.1
(2)
38.4
(1.4)
30.2
(1.4)
75.8
(2.1)
−67.6
(2.3)
20.0
(0.4)
0.66
(0.3)
Cu (r)76.9
(1)
42.5
(1)
34.4
(2)
36.6
(1.4)
36.4
(1.5)
87.9
(2.6)
−55.5
(2.8)
26.9
(0.5)
0.74
(0.4)
Cu (cs)85.1
(1)
54.5
(1)
30.6
(2)
35.5
(1.4)
31.7
(1.4)
77.8
(2.3)
−65.5
(2.5)
21.1
(0.4)
0.67
(0.3)
brass ref.69.8
(1)
52.3
(1)
17.5
(2)
19.0
(0.9)
43.9
(1.7)
96.5
(2.8)
−46.9
(3.0)
32.5
(0.6)
0.74
(0.4)
brass (w)85.2
(1)
59.5
(1)
25.8
(2)
30.4
(1.2)
32.5
(1.5)
77.7
(2.3)
−65.7
(2.5)
21.1
(0.4)
0.65
(0.3)
brass (b)85.9
(1)
58.6
(1)
27.4
(2)
32.3
(1.2)
31.7
(1.4)
76.8
(2.3)
−66.6
(2.5)
20.6
(0.4)
0.65
(0.3)
brass (r)85.2
(1)
46.9
(1)
38.3
(2)
42.9
(1.4)
30.4
(1.4)
77.7
(2.3)
−65.7
(2.5)
21.1
(0.4)
0.69
(0.4)
brass (cs)86.2
(1)
54.9
(1)
31.2
(2)
36.4
(1.4)
30.9
(1.4)
76.5
(2.3)
−66.9
(2.5)
20.4
(0.4)
0.66
(0.3)
Publisher’s Note: MDPI stays neutral with regard to jurisdictional claims in published maps and institutional affiliations.

