Article

The Effect of Y3+ Addition on Morphology, Structure, and Electrical Properties of Yttria-Stabilized Tetragonal Zirconia Dental Materials

1
Department of Fixed Prosthodontics, School of Dental Medicine, University of Zagreb, Gundulićeva 5, 10000 Zagreb, Croatia
2
Ruđer Bošković Institute, P.O. Box 180, 10000 Zagreb, Croatia
3
Faculty of Chemical Engineering and Technology, University of Zagreb, Marulićev trg 19, 10000 Zagreb, Croatia
4
Department of Physics, Faculty of Science, University of Zagreb, Bijenička, c. 32, 10000 Zagreb, Croatia
*
Author to whom correspondence should be addressed.
Materials 2022, 15(5), 1800; https://doi.org/10.3390/ma15051800
Submission received: 9 February 2022 / Revised: 18 February 2022 / Accepted: 22 February 2022 / Published: 27 February 2022
(This article belongs to the Special Issue Bioactive Materials in Dentistry)

Abstract

:
Zirconia (ZrO2), a widely known material with an extensive range of applications, is especially suitable for dental applications. This kind of dental material is produced in the form of blocks or discs (mostly discs—depending on CAD/CAM machines) by cold isostatic pressing (CIP). Such discs are subsequently milled by CAM/CAD technology into a desirable form. Due to the application of CIP, the resulting discs consist of different yttria-stabilized tetragonal zirconia polycrystal (Y-TZP) powders, additives and pigments. The diverse composition of the discs (e.g., different Y3+ content) governs material properties, such as hardness, toughness and translucence. The aim of this work was to investigate the impact of Y3+ addition on the grains and grain boundaries, on the ZrO2 phases lattice parameter values and on the electrical equivalent circuit parameters of the prepared Y-TZP samples. The disc-shaped samples were prepared by using CAM/CAD technology. It was observed that the grain size and the grain density were increased by Y3+ addition. The sample with the lowest Y3+ content was characterized by the highest portion of the tetragonal phase, whilst the disc with the highest Y3+ addition consisted mainly of the cubic phase. It was also observed that at the higher Y3+ ion concentrations, these ions mainly incorporated the tetragonal phase. Furthermore, conductivity investigations showed that the resistivity of the grains in the samples with the higher Y3+ concentrations was decreased as these ions were mainly trapped in the grain boundary. On the other hand, the Y3+ trapping increased the capacitance of the grain boundary.

1. Introduction

Zirconia (ZrO2) is a well-known stable material with different ranges of applications, varying from clinical applications [1] and dental materials [2] to fuel cells [3]. Therefore, it has been a focus of numerous scientific papers that involve both in vitro [4] and in vivo [5] studies. ZrO2 is accessible and attractive for dental applications [2] due to the fact that it can be processed by computer-aided manufacturing (CAD/CAM) technology [2]. In addition, there is a wide range of different dental ceramic materials with clinical applications [6] that can be shaped by CAD/CAM technology. The application of this technology facilitates the development and investigations of ZrO2 as it is possible to both shape and prepare this material in numerous ways [7].
Previous studies showed [8,9] that some aspects of the electrical and structural properties of dental materials (including zirconia) have not been thoroughly tested yet. It is known that Y3+ stabilizes the tetragonal form at room temperature and it boosts zirconia’s mechanical properties [2]. However, the impact of higher Y3+ content on both the phase composition and lattice parameter values of new yttria-stabilized tetragonal zirconia polycrystal (Y-TZP) materials should be constantly revisited. After all, by using CAD/CAM technology, samples and experiments can be more easily designed.
It is a well-known fact that the properties and structure of zirconia have been thoroughly tested [10,11,12]; however, having said that, the impact of different amounts of Y3+ on the electrical properties has not been fully illuminated for new dental Y-TZP materials yet. The amount of Y3+ is also responsible for both the oxygen vacancies amount and the oxygen ion conductivity [3]. Although there is a myriad of studies that have addressed, e.g., the impact of sandblasting on ZrO2 [8,13,14,15], it seems that Impedance Spectroscopy (IS) has not yet been fully exploited when dealing with the dental Y-TZP material(s).
The electrical properties of ZrO2-based materials can be more rigorously examined when using the electrical equivalent circuit (EEC) model as a diagnostic tool [16,17,18,19]. For example, by studying EEC parameter trend(s), it should be possible to gain a deeper insight related to the location of the Y3+ ions within the material. However, one should be aware of the fact that nowadays, an EEC model-free approach to analyze IS data is gaining prominence [20,21,22]. Nevertheless, EEC analysis still offers a fair amount of data; thus, it should be used more frequently while investigating this sort of material (see, e.g., [8]). For example, by using EECs, it is possible to monitor intra-grain and inter-grain resistivity [23,24].
These sorts of studies are also significant because they can point out defects in the material, e.g., holes, cracks and chipping [8,25] that could be outcomes of the CAM/CAD processing. Therefore, it is of common interest to study the impact of processing (e.g., milling) on new dental materials with the intention to predict clinical implications such as an increased risk of fracture or accelerated aging. Y-TZP materials are stabilized at room temperature by Y3+ addition [26,27] but these materials can be easily transformed from the tetragonal to the monoclinic phase [28], even with the sandblasting energy. This transformation is currently well investigated as its impact on the volume and stability of Y-TZP is substantial.
Herein, we intend to investigate several different Y-TZP samples with various amounts of Y3+. Y3+ addition has several vital implications for clinical restoration; hence, we tested some of the material(s) properties, such as structural, morphological and electrical properties. Above all, the impact of Y3+ on the surface morphology and structure was thoroughly inspected by scanning electron microscopy (SEM) and Powder X-ray Diffraction (PXRD).
This study aimed to investigate several discs with different Y3+ content. One of the main aims was to observe the impact of Y3+ on the ZrO2 phase composition and on the lattice parameter values. The study also focused on the impact of Y3+ on the grain size and grain boundaries, and on the EEC parameter values. The fact that distinguishes this study from the existing ones is the application of IS as it revealed additional insights related to the impact of Y3+ ions on the electrical properties of the zirconia-based dental materials.

2. Materials and Methods

2.1. Sample Preparation

Yttria-stabilized tetragonal zirconia polycrystal (Y-TZP) discs with gradually ascending Y3+ content were prepared from one IPS e.max® ZirCAD Prime block/disc (Ivoclar Vivadent, Shaan, Liechtenstein) (Scheme 1). The discs, with a thickness of 1 mm and a diameter of 10 mm (Table 1), were prepared in an ordinary dental laboratory. Preparation was conducted by utilizing a dental milling device (Cerec, MCX 5, Dentsply Sirona, Bensheim, Germany).
Then, the discs were sintered at 1500 °C by using a heating ramp recommended by the manufacturer. The samples were prepared without post-processing, i.e., there were no additional surface treatments. It was decided that the disc shape be used since this specific profile can be analyzed by all the experimental techniques utilized in this study.
The sample with the lowest Y3+ content is named S1 (3Y-TZP; 3 mol% Y2O3), while the specimen with the highest Y3+ addition is designated as S9 (5Y-TZP; 5 mol% Y2O3). The exact chemical composition of the Y-TZP block (Scheme 1) applied in this work is not known, but according to the manufacturer documentation, it is mainly composed of ZrO2, Y2O3, HfO2, Al2O3 and other oxides, additives and pigments. However, the trend in the Y3+ added in the prepared discs is known (Table 1) due to the applied milling procedure.

2.2. Method for Surface Investigation

The prepared Y-TZP samples’ morphologies were investigated by scanning electron microscopy (SEM). Herein, SEM images were collected by a thermal field emission scanning microscope (FE SEM, model JSM-7000F, JEOL Ltd., Akishima, Japan) operating at 3 kV.

2.3. Method for Structural Identification

Powder X-ray Diffraction (PXRD) data were collected by applying a Bruker Discover D8 diffractometer (Karlsruhe, Germany) supplied with a LYNXEYE XE-T detector. Measurements were taken in Bragg–Brentano geometry (1D) applying CuKα radiation (1.54 Å). The angular range 2θ varied from 10 to 70. The data were obtained by using a step size of 0.02 and measuring time of 27 s/step. Rietveld structure refinement was conducted by using the HighScore Xpert Plus program 3.0 (Malvern Panalytical, Almelo, The Netherlands).

2.4. Electrical Properties

The SC7620 sputter coater (Quorum Technologies Ltd., Laughton, East Sussex, UK) was utilized to deposit gold electrodes (7 mm in diameter). The gold was sputtered onto both sides of the sample discs. The impedance response was recorded by applying an impedance analyzer (Novocontrol Alpha-AN dielectric spectrometer, Novocontrol Technologies GmbH&Co. KG, Hundsangen, Germany). The frequency range was in the 0.01 Hz–1 MHz interval and the applied temperature range varied from 303 to 483 K ( ± 0.5 K).

3. Results and Discussion

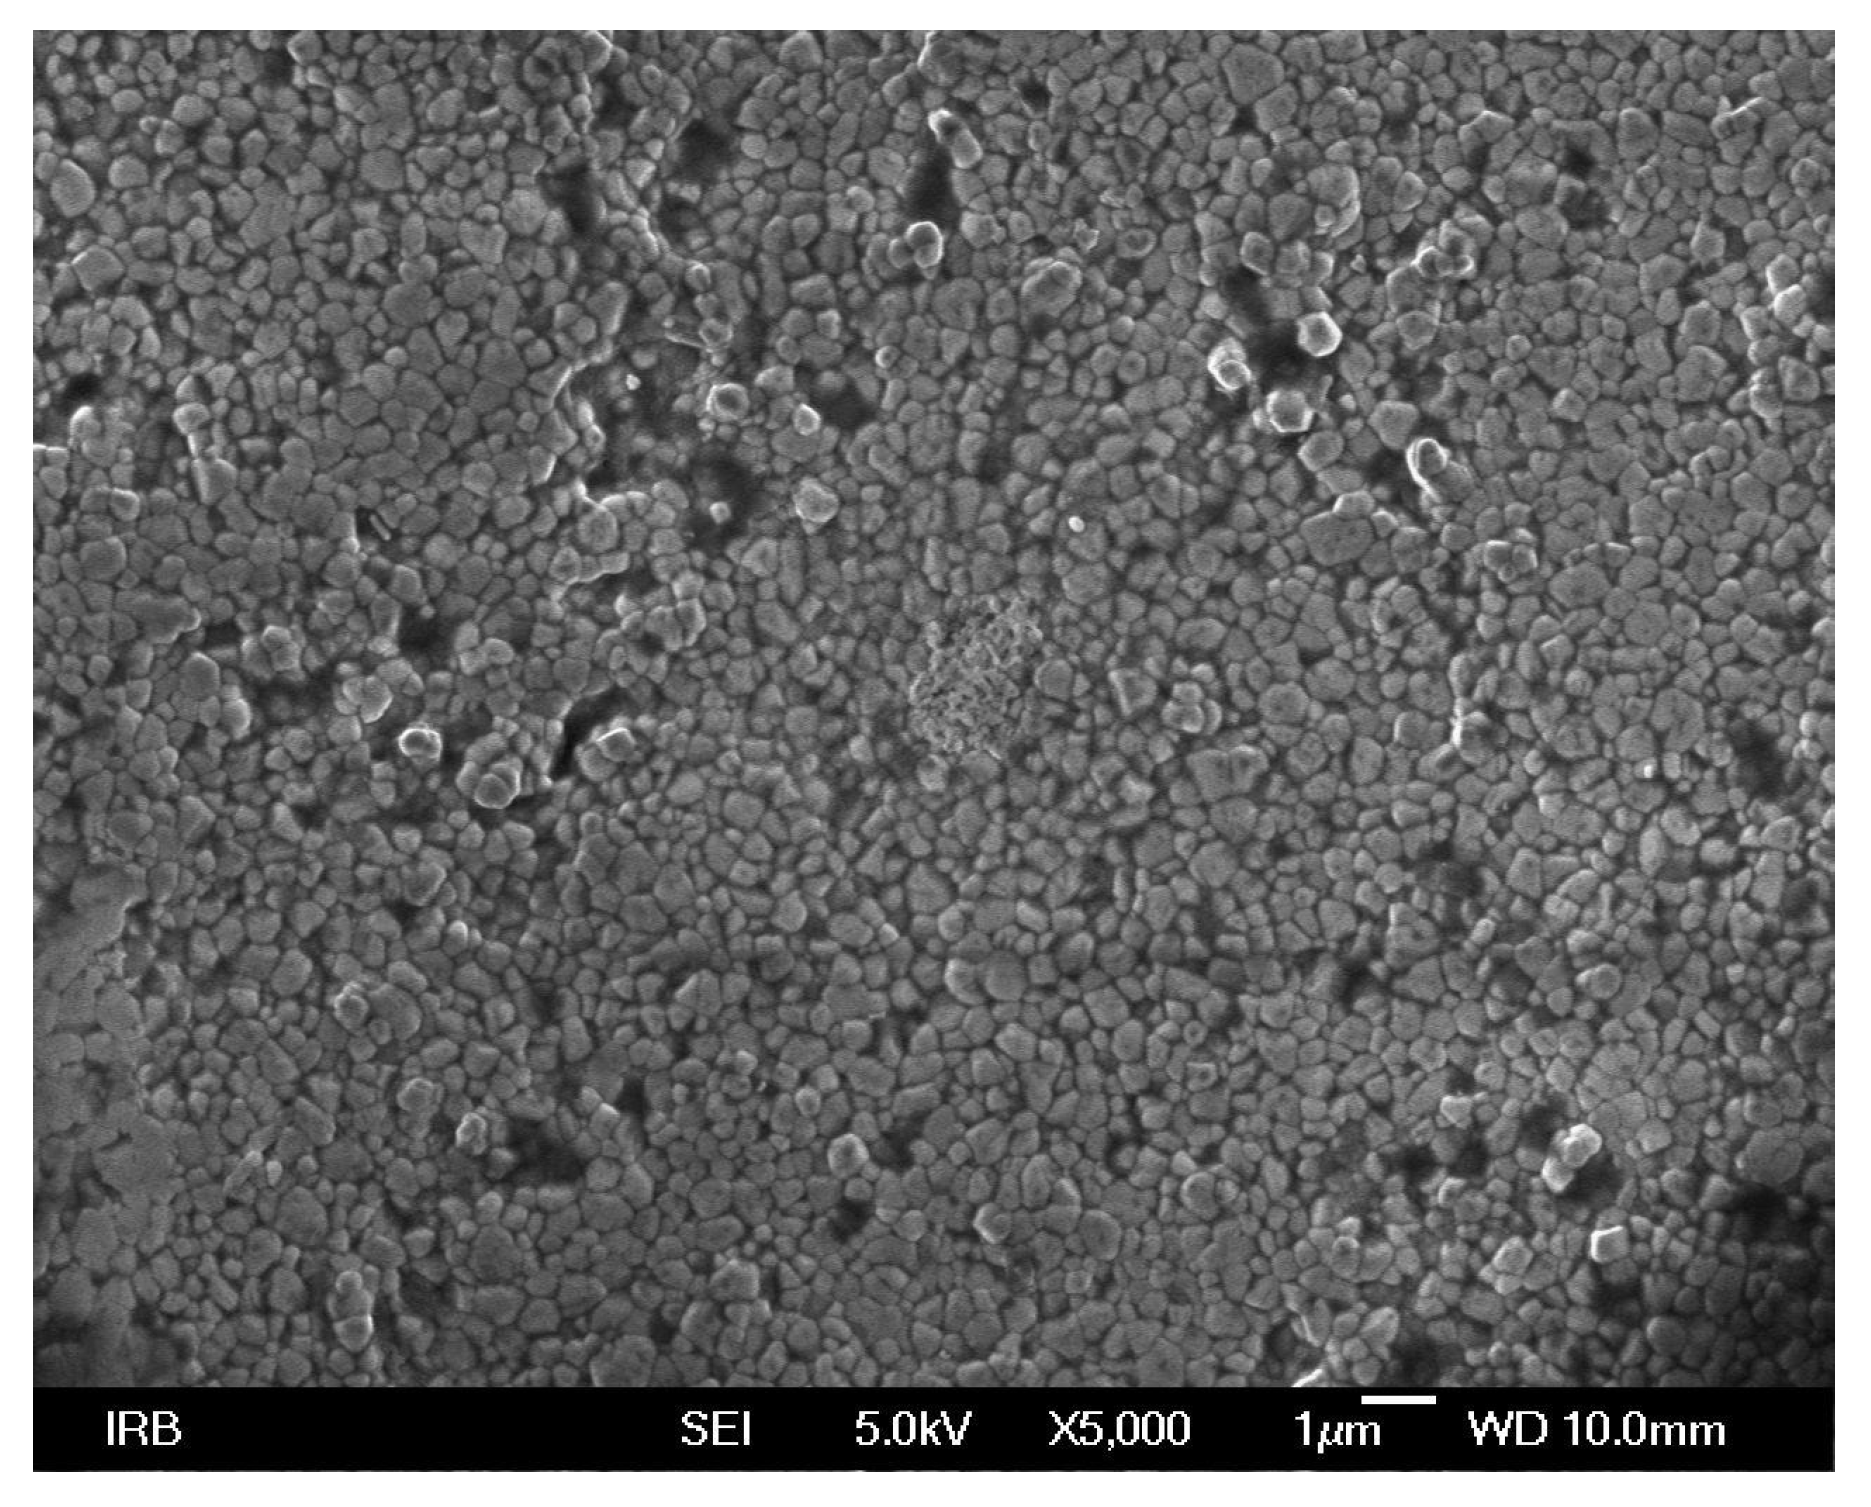
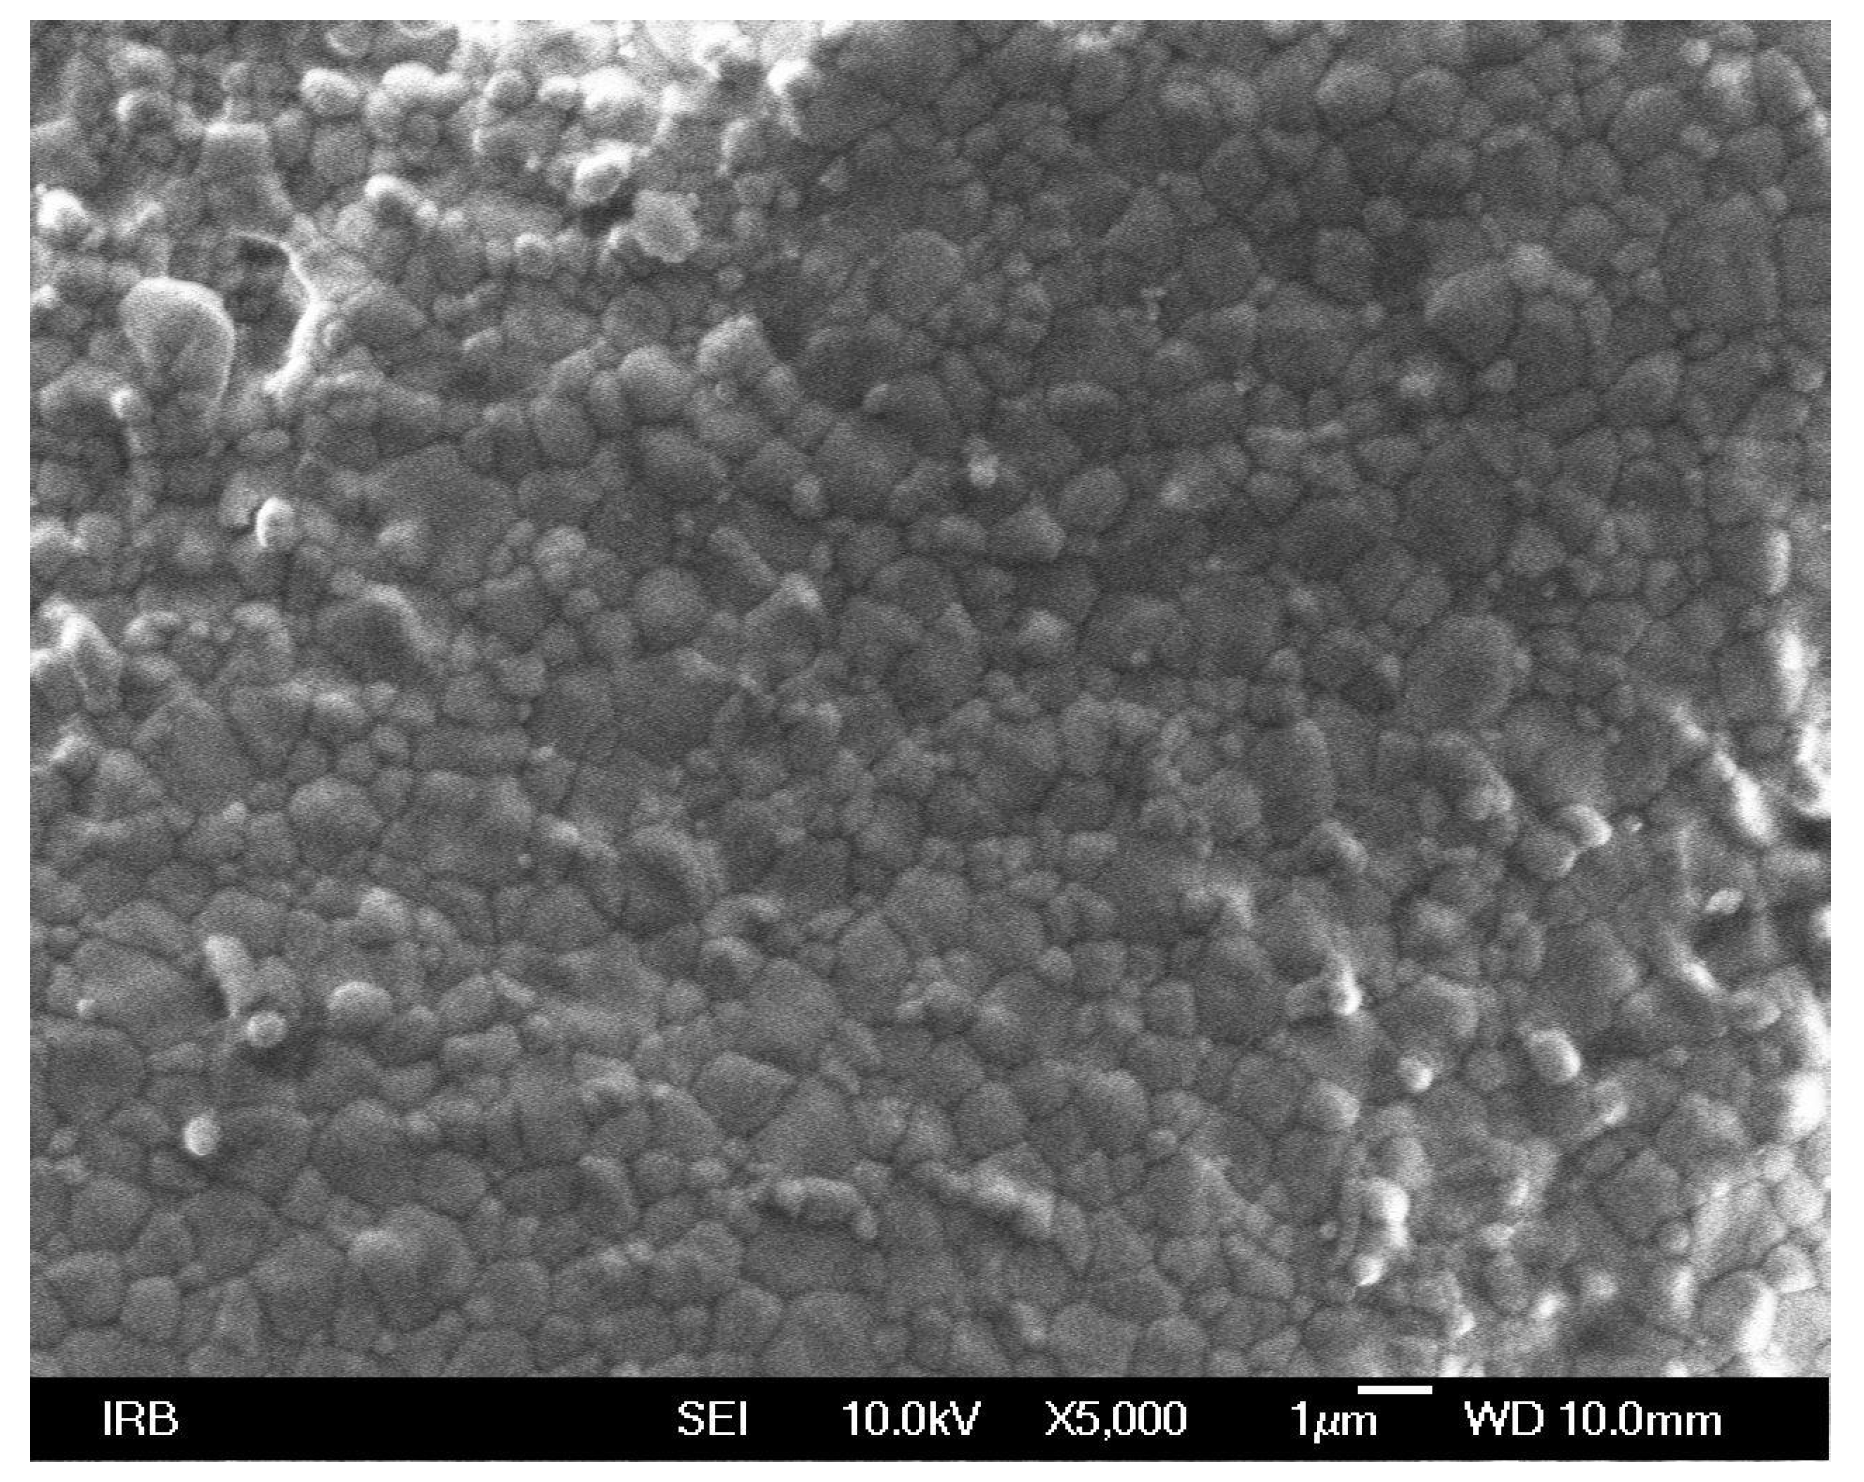
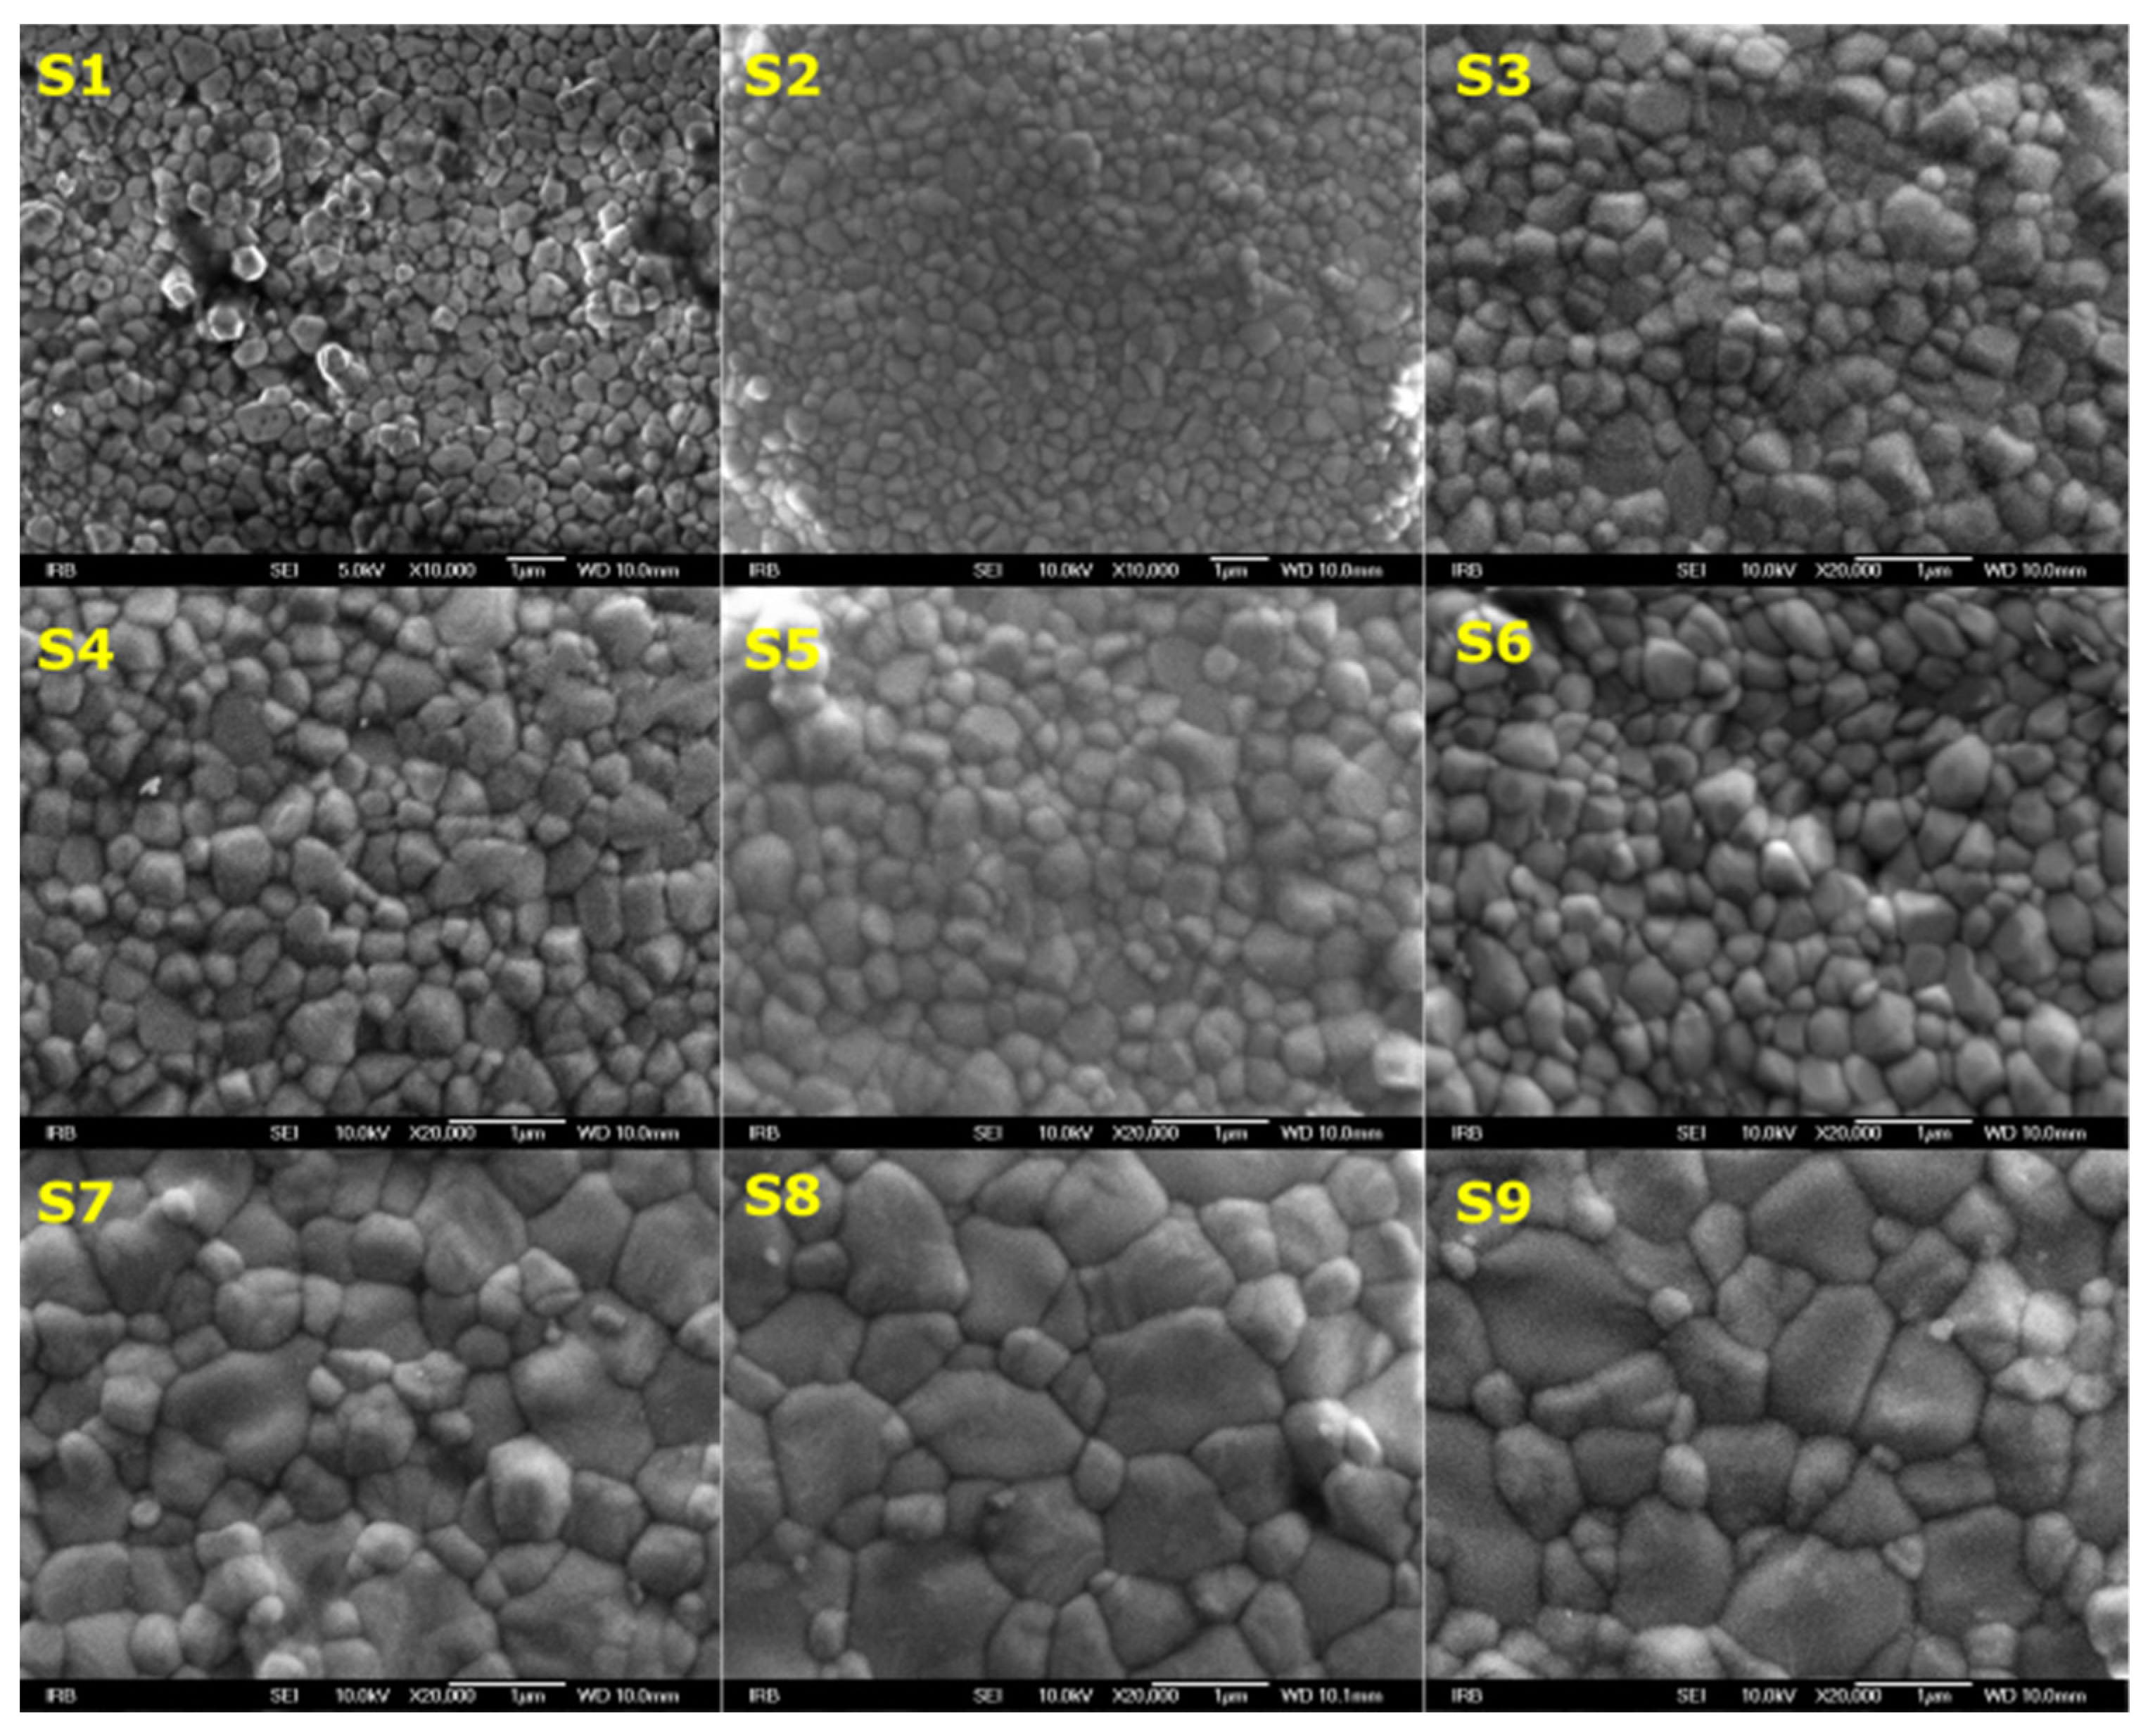
3.1. Morphology Investigation

The morphology of the investigated S1–S9 samples is presented in Figure 1. These samples show typical morphology of the sintered yttria-stabilized tetragonal zirconia polycrystal (Y-TZP) materials (i.e., grains and grain boundaries). The observed morphology indicates that these samples were not sandblasted, which usually precedes the dental application. To clarify, the crowns are generally sandblasted in the dental laboratory for cleaning purposes. In addition, the sandblasting damages the specific Y-TZP morphology [25]; thus, the sandblasted samples do not show grains and grain boundaries.
Figure 1 clearly suggests that the grain size of the discs is gradually increasing with Y3+ addition, i.e., S9 has the highest Y3+ content and the biggest grain size. A higher Y3+ content would further increase the grain size, which in turn could compromise the material stability. However, nowadays there have been improvements in Y-TZP production technology which resulted in dental materials with an even higher Y3+ (>5 mol%) content.
The sample S1 (Figure 2) demonstrates a less dense morphology in comparison to the sample S9 (Figure 3). Although samples S1–S9 were prepared (i.e., sintered) by using the same temperature heating ramp, the effect of sintering on the morphology and density is different in this study. To elaborate, these materials are fabricated by cold isostatic pressing (CIP) [29], which is a method for preparing compact powder materials. However, these powder materials may consist of various additives to ensure better densification during the sintering process.
The densification of the CIP-processed Y-TZP materials can be promoted by using densification additives [30]. These kinds of materials assist densification through liquid sintering, which in turn facilitates ion diffusion. The diffusion of Y3+ within the CIP-processed Y-TZP material during the sintering stage is inevitable, which can promote the grain(s) growth and the phase transformation(s). It should be mentioned that densification can be conducted by using different sintering techniques [31], but densification without an additional grain growth is one of the main tasks during the sintering process [32].
Next, the less dense morphology of the sample S1 can be explained as follows. Firstly, the added 3Y-TZP powder (prior to sintering) is tougher and harder to compress (Figure 2), and secondly, the quantity of the densification promoters may be lower [30]. On the other hand, the morphology of the sample S9 is denser (Figure 3) as 5Y-TZP powder is less hard and there may be more additives for densification. The Y-TZP materials studied in this work contain diverse compounds and additives that are not specified by the manufacturer. Thus, at this point of the study, it is hard to distinguish the impact of densification additives, ion diffusion during the sintering process, and the Y-TZP powders’ hardness on the morphology and density of the samples S1–S9.
The impact of the milling process can be observed in sample S1 as there is damage (i.e., voids) in the material’s surface (Figure 2). On the other hand, such defects are not detected in sample S9 (Figure 3). The lack of imperfections in the sample S9 can be explained by a more dense morphology that increased the material’s toughness. This boosted toughness may be assigned to the presence of the densification additives and/or promoted ion diffusion during the sintering process.
Please note that defects, such as in the sample S1, can be easily removed by surface processing such as, e.g., sandblasting which is accompanied by both the phase transformation and volume ingress (3–5%). Therefore, this transformation can “seal up” defects at the surface (see, e.g., [8]) although this transformation decreases the material’s fractural resistance. These imperfections can act as centers for aging, and for this reason, the material is commonly sandblasted. However, it should be mentioned that there are different approaches for surface processing, for instance, laser treatment [33], which is not usual in dental practice.

3.2. Structural Investigation

Since zirconia-based powder materials are well crystalline, Powder X-ray Diffraction (PXRD) is a perfect tool for studying both the crystallinity and structure of ZrO2-based materials [34,35,36]. The PXRD patterns of the S1–S9 samples are presented in Figure 4 and they show the presence of the tetragonal and cubic phases identified by the Inorganic Crystal Structure Database (ICSD) card no. 164862-ICSD and card no. 185125-ICSD. The tetragonal zirconia phase at room temperature is stabilized by the Y3+ ions [2]. Figure 4 shows that an increased Y3+ content (see Table 1) yields a higher portion of the cubic phase. To rephrase, the cubic phase portion is lowest in the case of the sample S1 and highest in the case of the sample S9. However, to offer a more precise PXRD study, the fraction of both phases was determined by using the Rietveld refinement method, and the results are given in Table 2 and Figure 4 (right).
Table 2 shows that Y3+ is responsible for the formation of the cubic phase in the investigated S1–S9 Y-TZP samples. Samples S1–S5 have the lowest Y3+ content and the highest portion (>70%) of the tetragonal phase. It should also be mentioned that the tetragonal phase lattice parameters (a and c) in samples S1–S5 do not show any specific trend (Table 2). As these Y-TZP materials are prepared by the CIP method (i.e., several types of powders are added before the pressing step [29]), there might be some imperfections. In this study, these imperfections can be observed in the lack of the phase composition trend in the samples S1–S5, which may be responsible for the similar morphology (Figure 1).
Furthermore, as the Y3+ content is heightened, the fraction of the cubic phase is enlarged, which decreases the hardness and toughness of the material, but at the same time, it also increases translucence. The Y-TZP samples in this work are partially cubic (22–70%) which is a finding that corresponds well to the literature [37]. To be more specific, the cubic fraction amount (22%) in 3Y-TZP (sample S1) agrees well with the cubic fraction quantity (23.2%) in the 2.4Y-TZP sample investigated in [38]. The phase composition is of vital importance for dental applications and restorations, and according to Table 2, the composition is controlled by the Y3+ content. On the other hand, the grain size in the samples S6–S9 gradually increases and, in parallel, the tetragonal phase lattice parameter a shows an ascending trend (Table 2). This ascending trend suggests that when Y3+ addition is higher, Y3+ mainly incorporates the tetragonal structure.
Next, sample S9 (see Figure 1 and Figure 3) is characterized by two different grain size distributions. The origin of these size distributions can be assigned to the fact that the manufacturer produces the Y-TZP block (Scheme 1) by adding two different powders (3Y-TZP and 5Y-TZP) prior to the CIP pressing step. However, the impact of diverse densification additives on the grain growth process should also be considered [32]. According to the SEM (Figure 1) and PXRD (Figure 4 and Table 2) studies, it is safe to say that the smaller grains are mostly composed of the tetragonal phase, whilst the bigger grains are mainly defined by the cubic phase.

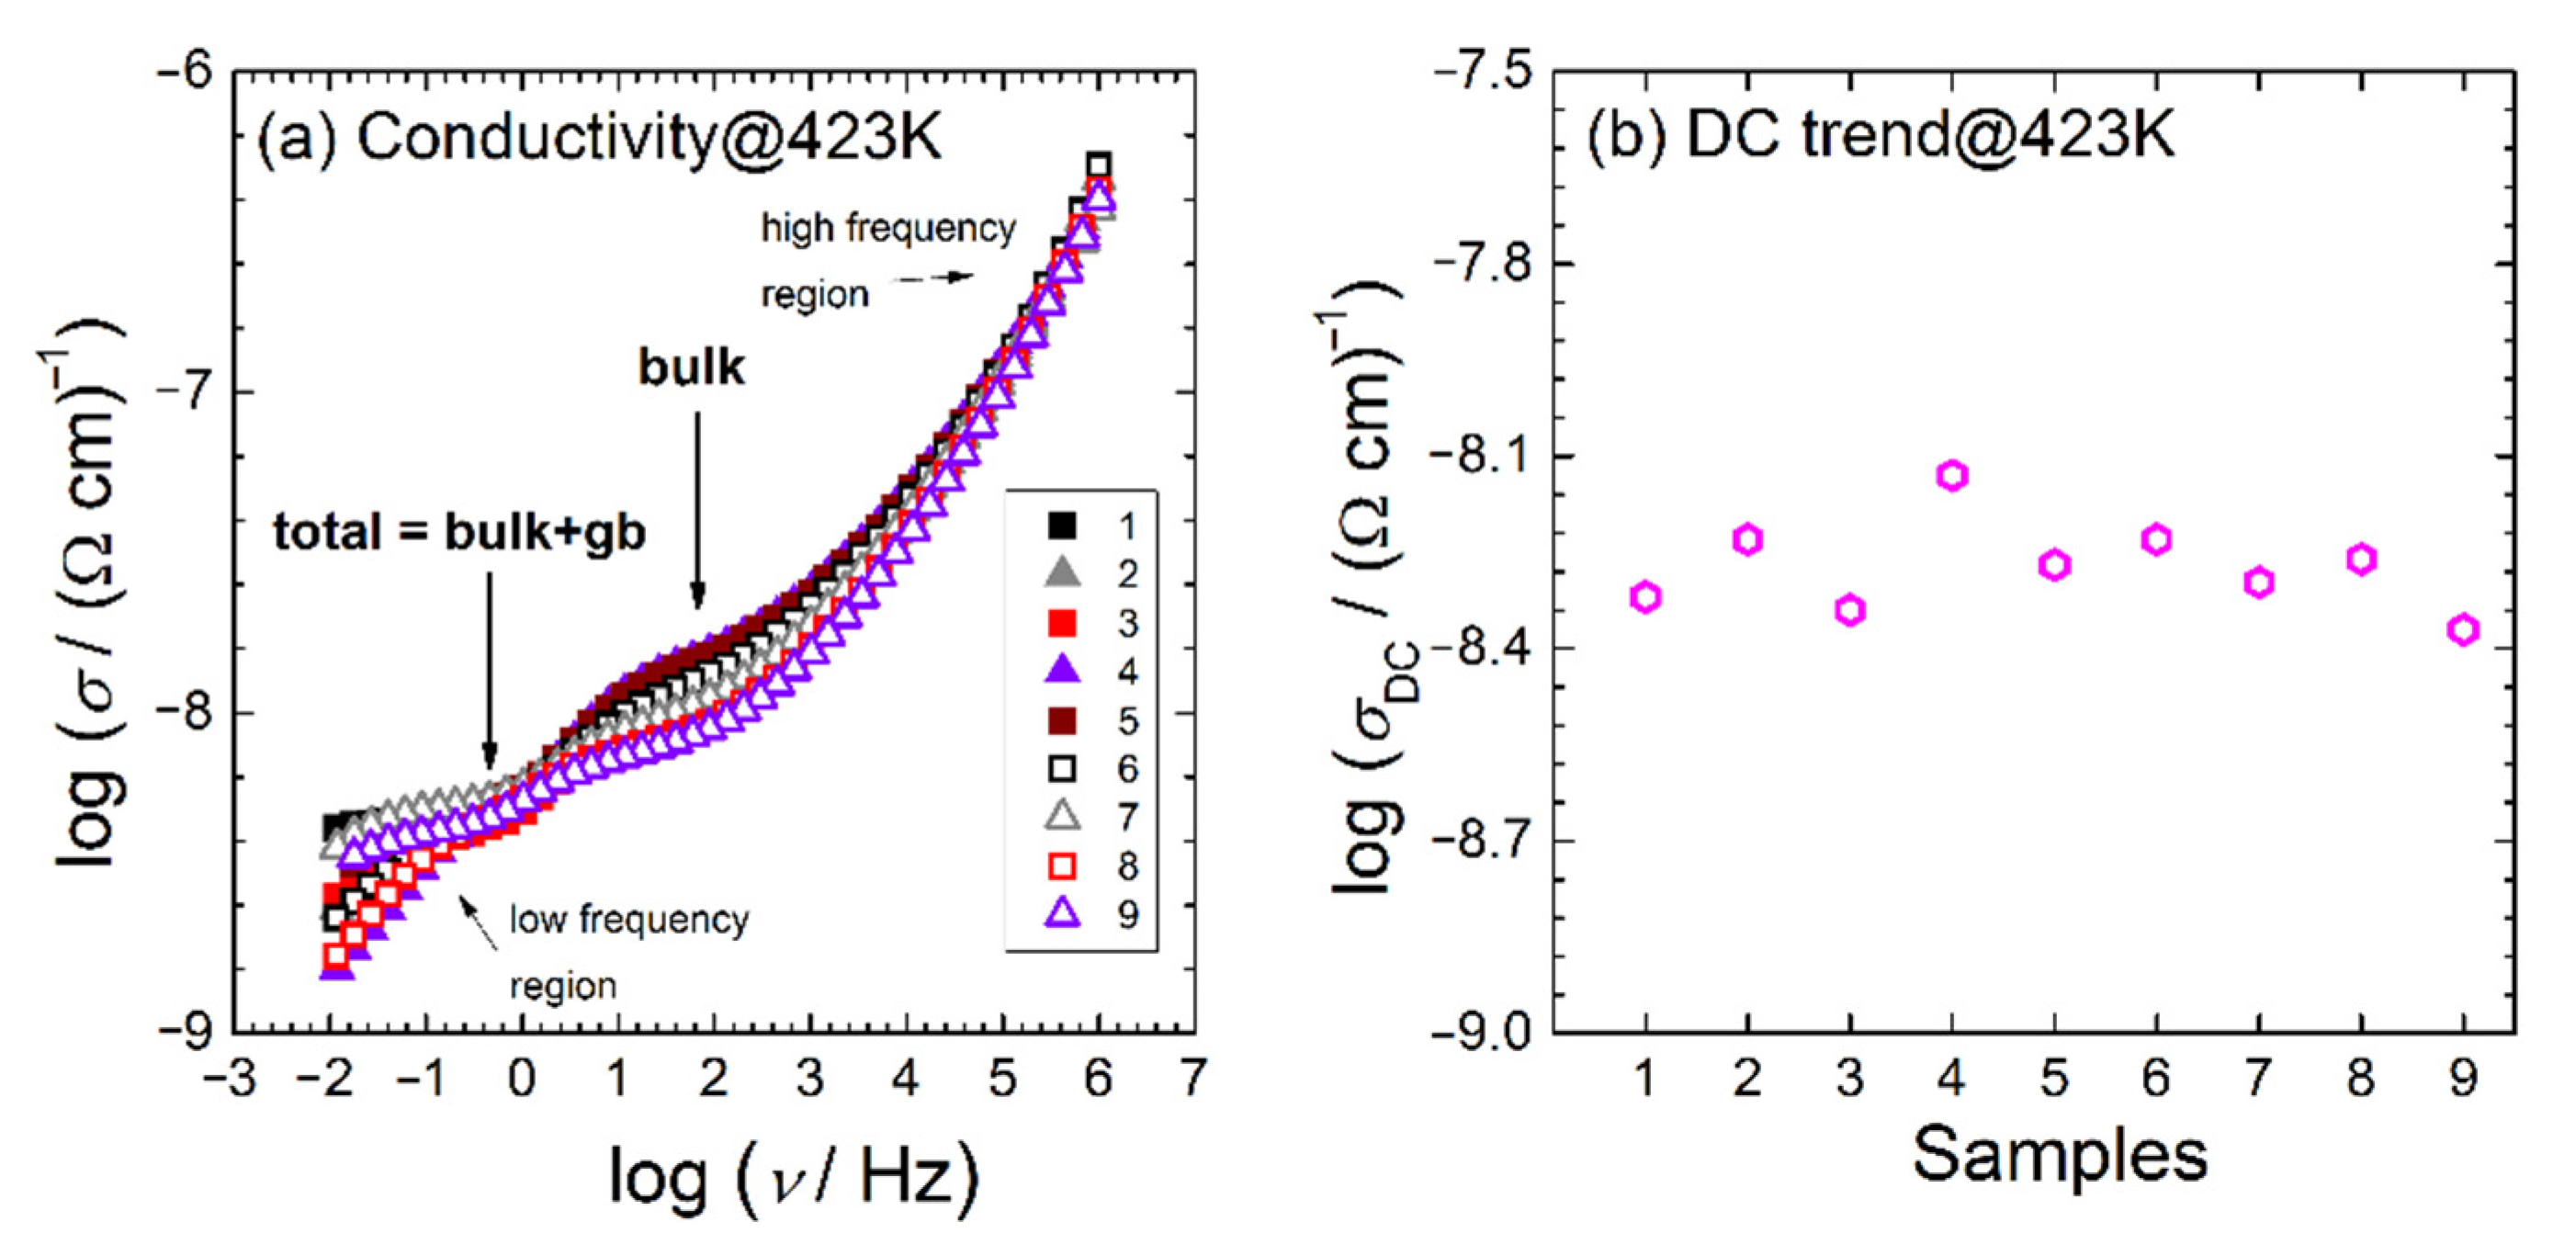
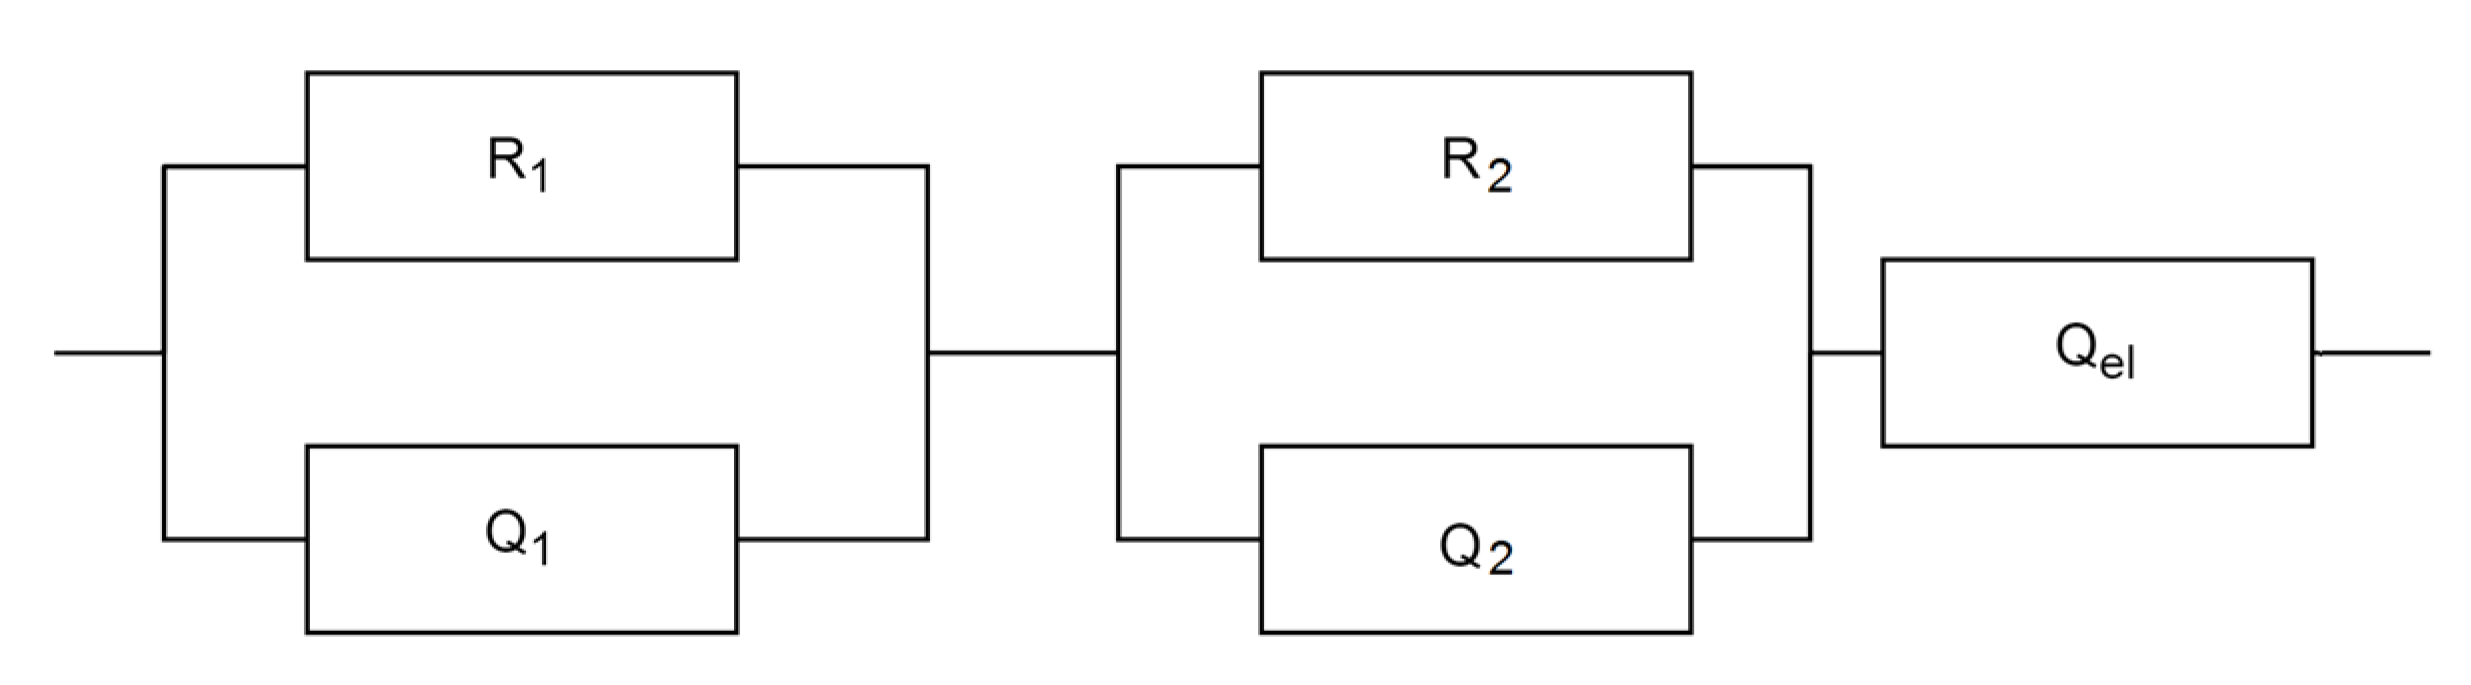
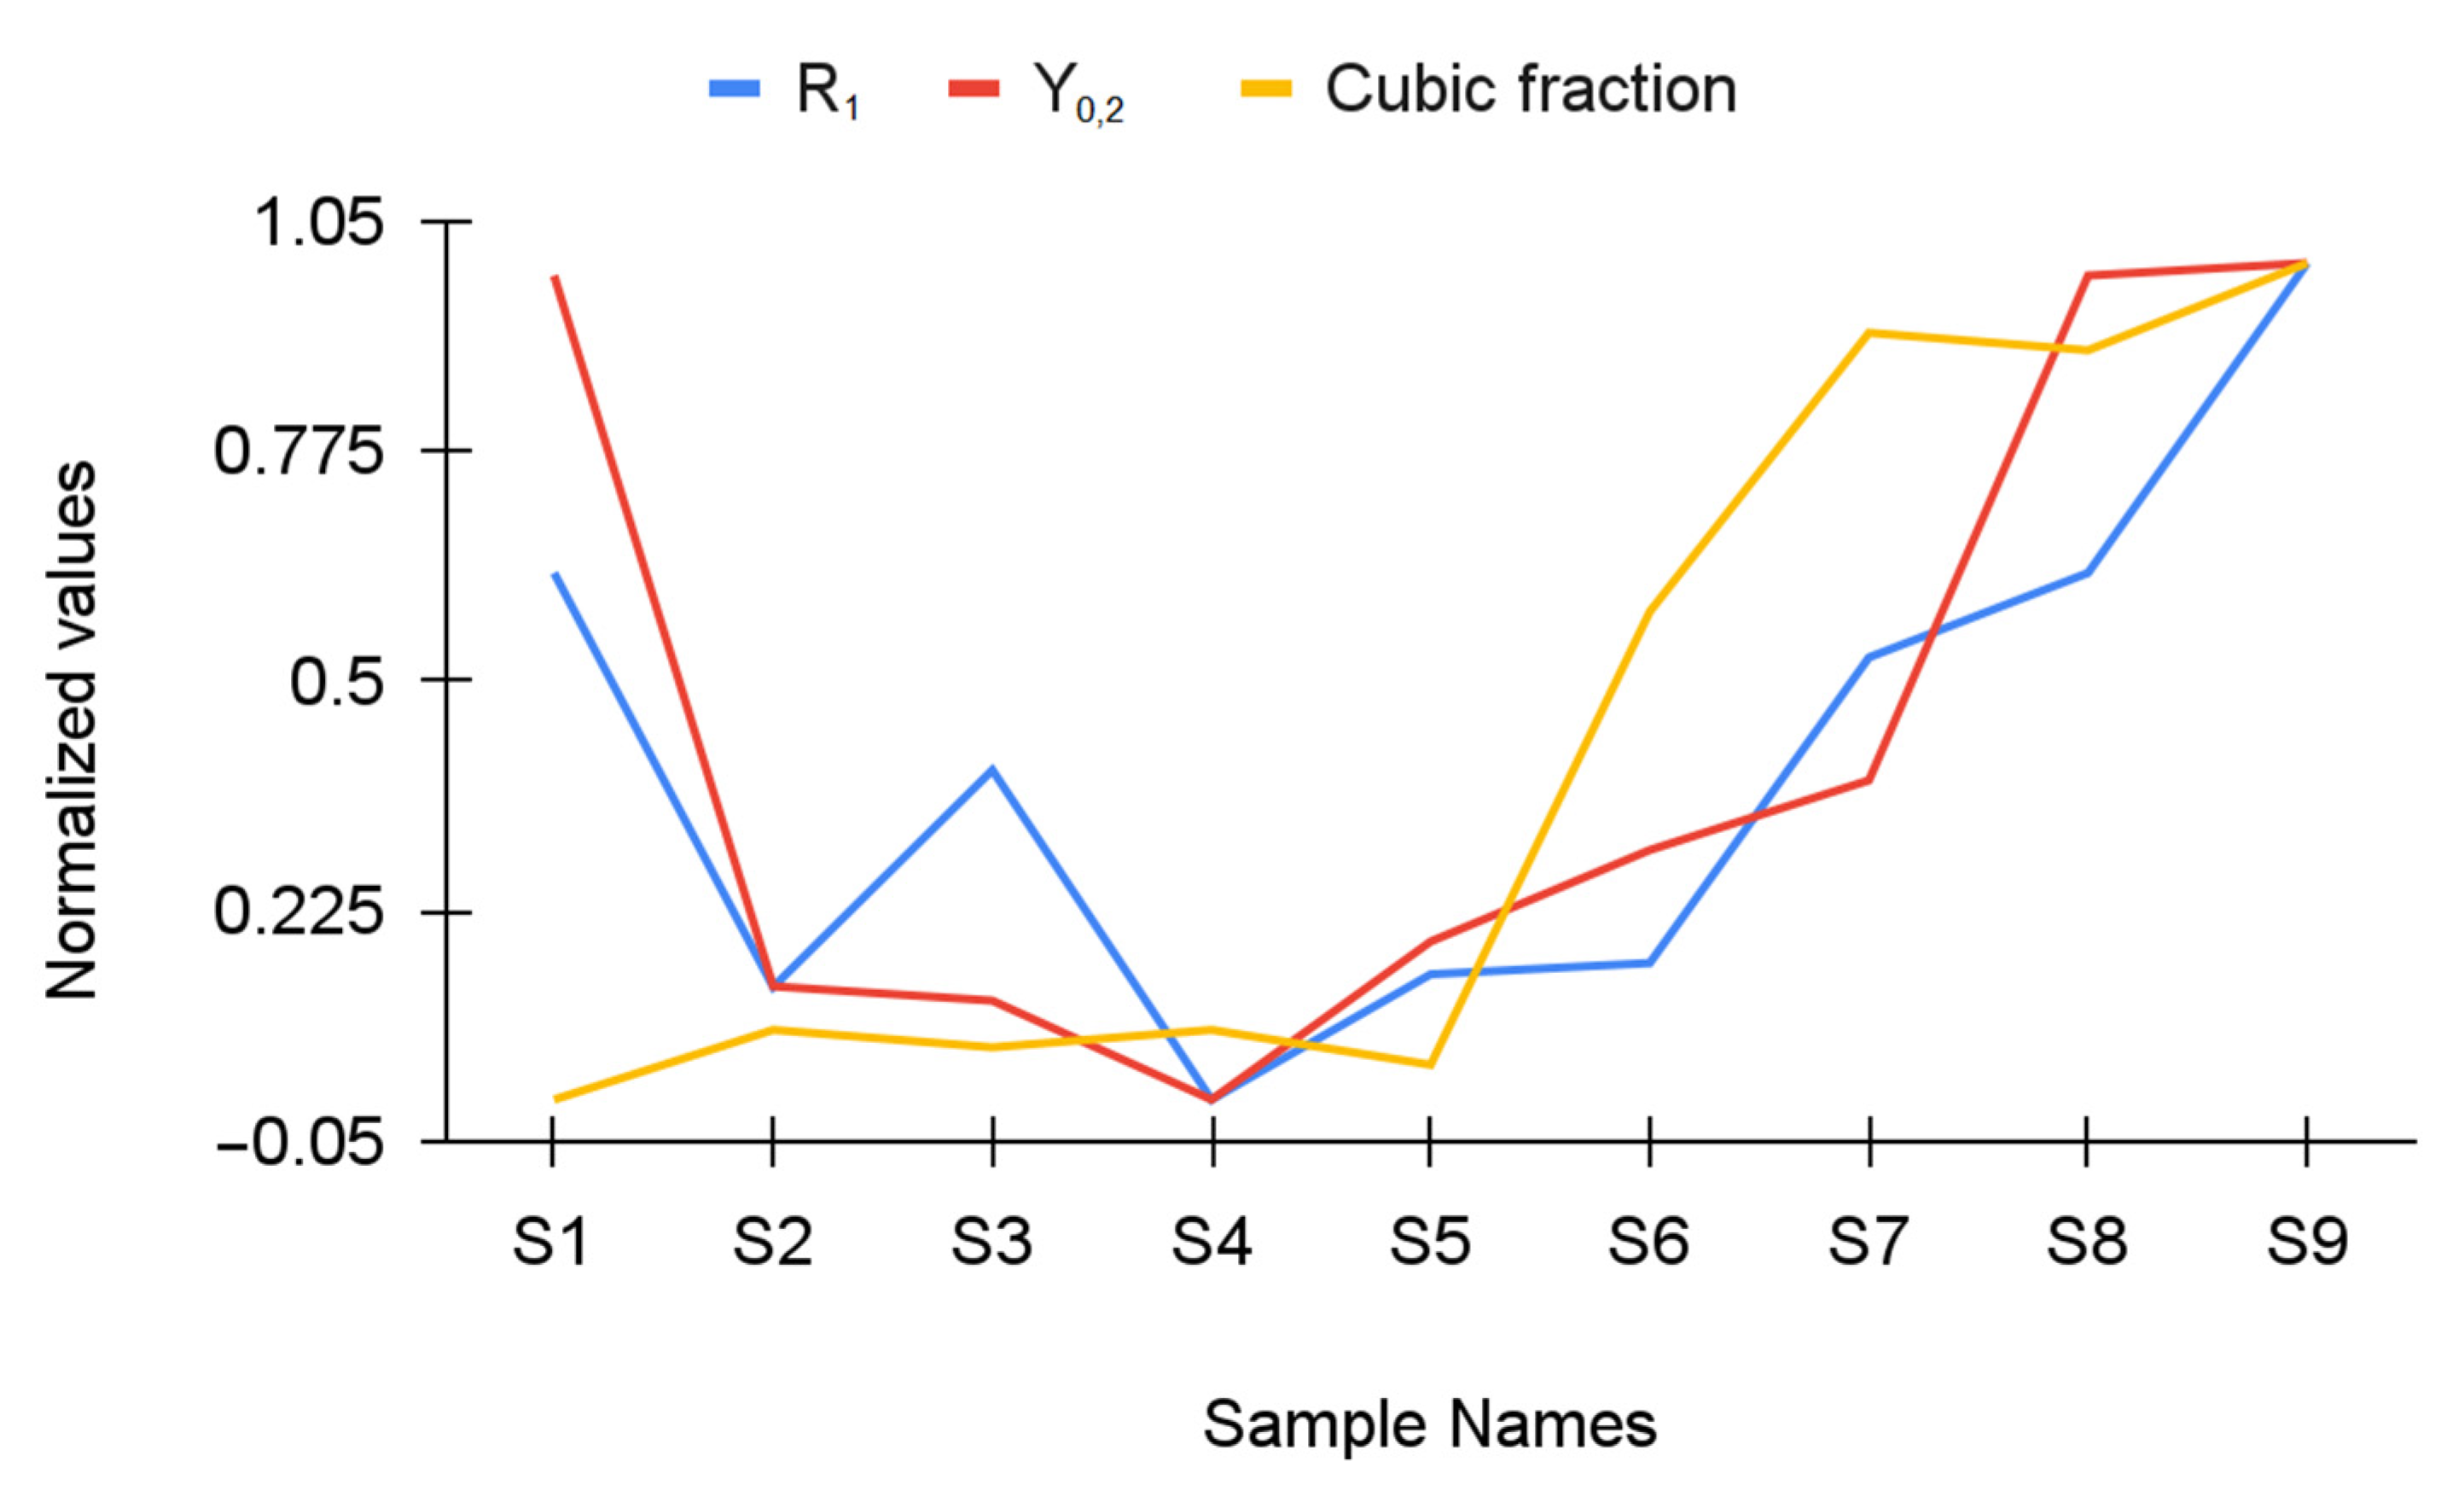
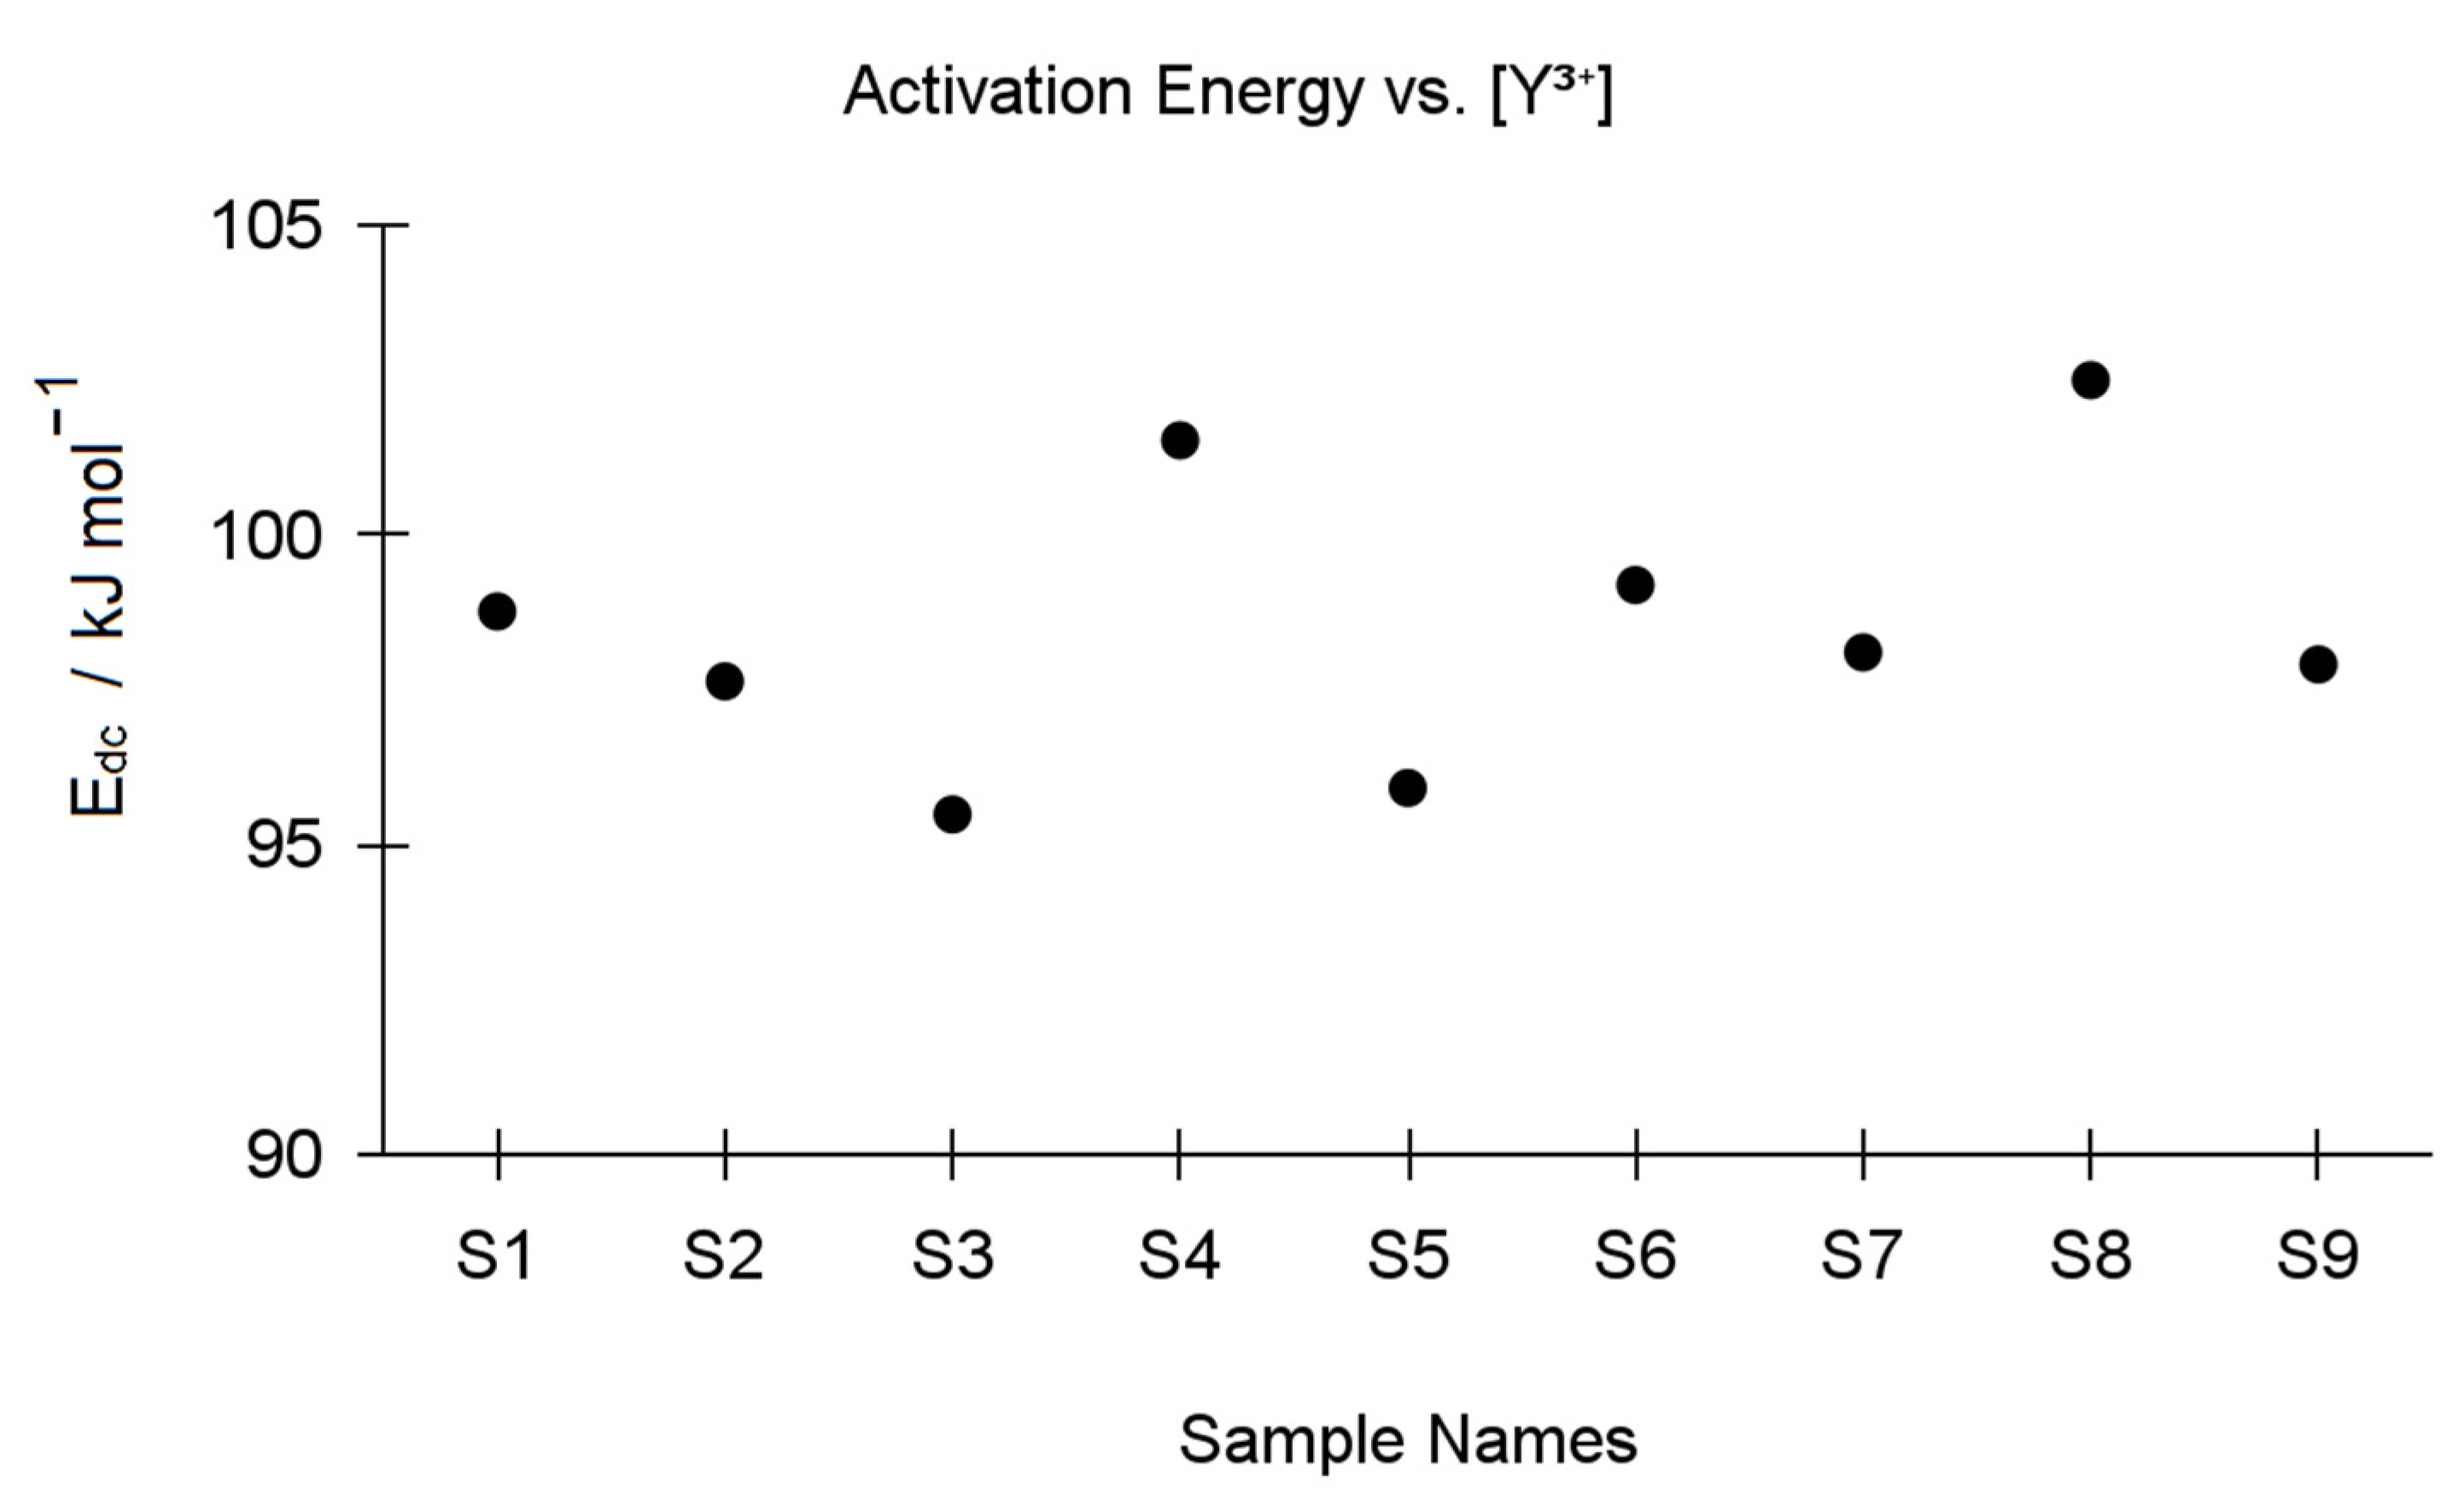
3.3. Electrical Investigation

Y-TZP materials are oxygen ion conductive electrolytes [39,40] and they also have a wide application in, e.g., solid oxide fuel cells (SOFC) [23,41]. These materials are applied in SOFC due to their high chemical (and electrical) stability and low costs [41], which are properties that are essential for dental applications. Furthermore, SOFC performances highly rely on both the preparation method and porosity of the Y-TZP materials which can also be studied by Impedance Spectroscopy (IS) [42].
The total electrical resistivity of most of the ceramic electrolyte systems (e.g., Y-TZP), can be assigned to both the migration of the oxygen ions within the grains (i.e., intra-grain) and to the blocking of the migrating oxygen ions at grain boundaries (i.e., inter-grain) [39]. Thus, the complex impedance spectra of polycrystalline solid ion conductors (e.g., Y-TZP) are usually characterized by at least three depressed semicircles (i.e., arcs) that can be assigned to grains and grain boundaries, and polarization at the electrode interface [43]. However, these arcs might not all be observable at high temperatures [43].
Figure 5a shows the conductivity spectra of the investigated S1–S9 discs and there are several details that should be commented on. First, the impedance response of Y-TZP samples is governed by the content of oxygen vacancies which is controlled by the Y3+ concentration. Second, all samples have diverse behavior in the low-frequency region, which is governed by electrical polarization at the electrode surface. Third, the “mid” frequency region is defined by the blocking of the migrating oxygen ions at grain boundaries, and the conductivity in this region increases by Y3+ addition. This suggests that some Y3+ ions were unable to diffuse into the grains (bulk) during the sintering process. Forth, the impedance response in the high-frequency region is controlled by the migration of the oxygen ions within the grains (Figure 5a). It appears that the conductivity in this region is decreasing with Y3+ content, which also suggests that these ions may be “trapped” in the grain boundary during the sintering process. Finally, the total DC conductivity of the samples does not show any specific trend. This observation may be explained by the fact that these samples consist of different additives and pigments that prevent the formation of a conductivity trend.
Nowadays, one popular approach to investigate impedance spectra is to apply an Equivalent Electrical Circuit (EEC) [42]. Firstly, it is important to choose an EEC that mimics the physical behavior of the system under investigation. However, this might be a daunting task, as one semi-depressed semicircle can be formed by several ones. Nevertheless, there are model-free approaches such as the Distribution Function of Relaxation Times [20,21] that can be applied to extract the number of electrical/electrochemical processes in the system under investigation.
In this study, an EEC consisting of two parallel circuits was applied as each circuit can be assigned to one physical process that occurs within the samples (Figure 6). The first R1Q1 parallel circuit reflects the oxygen ion migration within the grains (i.e., intra-grain), and is characterized by a resistor (R1) and a constant-phase element (Q1). The second R2Q2 parallel circuit imitates blocking of the migrating oxygen ions through the grain boundaries. Finally, at the end, the electrode polarization at the sample surfaces is modeled by Qel.
The EEC displayed in Figure 6 can also be represented in the form of the transfer function:
Z ( ω ) = 1 1 / R 1 + ( i ω Y 0 , 1 ) n 1 + 1 1 / R 2 + ( i ω Y 0 , 2 ) n 2 + ( i ω Y 0 , e l ) n 3 ,  
where R, i, ω and (iωY0)n are the resistance, the imaginary unit, the angular frequency (2πf) and the admittance of the constant phase element. The impedance data of the S1–S9 samples were fitted by using (1) and the Levenberg–Marquardt algorithm [44,45], and the extracted EEC parameters are displayed in Table 3.
At first sight the values in Table 3 do not show any specific trend, which can be assigned to the diversity in the grain size, porosity (Figure 1), phase content (Table 2), additives and Y3+ addition (Table 1). However, a quick analysis of Table 3 suggests that the R1 and Y0,2 values show the same trend as the ascending trend of both the cubic phase fraction and Y3+ addition. Since the R1, Y0,2 and cubic fraction values differ by several orders of magnitude, the corresponding values were normalized to fall in the range between 0 and 1 by the following formulation:
x n o r m a l i z e d = x x m i n i m u m x m a x i m u m x m i n i m u m ,
and the normalized values are given in Figure 7.
Figure 7 shows the ascending trend of R1 (i.e., intra-grain resistivity) values obtained for samples S4–S9. The ascending R1 trend is accompanied by the increasing Y3+ ion content in the S4–S9 samples (Table 1), which suggests that the Y3+ content within the grains is lower. To elaborate, according to Figure 1, the samples with a higher Y3+ content are denser, which suggests that a more compact grain boundary was formed. As grain boundary ion diffusion is the dominant densification mechanism [46], Y3+ ions may be trapped within this boundary which additionally decreased the grain conductivity (Figure 5a).
The second ascending trend is detected for the Y0,2 values of the samples S5–S9 (Figure 7). Since the corresponding n2 values are > 0.8 (Table 3), Y0,2 can be commented on in terms of pseudocapacitance. According to Figure 7, the ascending trend of the Y0,2 values is also accompanied by heightened Y3+ content. It is fair to say that as more Y3+ ions are trapped within the grain boundary, the higher oxygen vacancies content increases both the pseudocapacitance and Y0,2 values.
As the conductivity of the Y-TZP samples is governed by the portion of Y3+ ions, it was decided that the activation energy (Edc) for DC conduction be determined. Edc was computed from the slope log σdc vs. 1/T by using the following expression [47,48]:
σ d c = σ 0 e x p ( E d c k b T ) .
According to Figure 8, there is no clear trend in the Edc values (vs. Y3+ addition), which corresponds to data in Figure 5a. The lack of an Edc trend indicates that there is no apparent loss in the ionic component of CD conductivity which can be assigned to the different content of the Y-TZP samples. However, the Edc values presented in Figure 8 correspond well to values obtained for, e.g., different lithium borate glasses [47,48].
If the aforementioned quick analyses are taken into consideration, then the EEC values (R1 and Y0,2) can be utilized to monitor Y3+ (i.e., oxygen vacancies) content in the grains and grain boundaries of the Y-TZP materials studied in this work.

4. Conclusions

In this study, the effect of Y3+ addition on different yttria-stabilized tetragonal zirconia polycrystal (Y-TZP) samples was investigated. The Y-TZP samples were prepared as discs by using CAM/CAD technology. The morphology of the discs and their structural and electrical properties were studied by diverse techniques.
It was demonstrated that a higher Y3+ content increased the grain size and yielded a denser Y-TZP sample morphology. The analyses showed that the samples with the lowest and highest [Y3+] were characterized by the smallest and highest grain size, respectively.
Furthermore, an increase in the Y3+ content enlarged the fraction of the cubic phase of the Y-TZP samples. Herein, the detailed Rietveld analysis showed that Y3+ ions mainly incorporated the tetragonal phase when the ion concentration was higher.
The investigation of EEC parameter trends revealed that an increase in Y3+ content decreased the conductivity of the grains and increased the pseudocapacitance of the grain boundary. It was explained that Y3+ ions that were trapped within the grain boundary were responsible for the observed EEC parameter trends.
Overall, several findings from this work should be emphasized. First, it should be stressed that the grain size in the investigated Y-TZP materials was governed by Y3+ addition. Second, holes were only detected in the disc with the lowest grain density, which implies that densification promotes the materials’ endurance in CAM/CAD processing. Third, according to the Rietveld analysis, the content of the cubic phase was increased with Y3+ ion addition, but then these ions mainly incorporated the tetragonal phase. Finally, the results in this work suggest that the R1 value can be used to monitor the Y3+ (i.e., oxygen ion vacancy) content within the grains, whilst the Y0,2 value (i.e., pseudocapacitance) can be used to observe changes in both the grain boundary thickness and Y3+ content.

Author Contributions

Conceptualization, M.J. and M.Ž.; formal analysis, L.P., Ž.S. and M.Ž.; investigation, M.J., T.K., Ž.S., A.B. and L.P.; methodology, M.J. and M.Ž.; software, T.K., Ž.S., A.B. and L.P.; supervision, M.J. and M.Ž.; writing—original draft, M.Ž.; writing—review & editing, M.J. and M.Ž. All authors have read and agreed to the published version of the manuscript.

Funding

This research received no external funding.

Institutional Review Board Statement

Not applicable.

Informed Consent Statement

Not applicable.

Data Availability Statement

Data sharing is not applicable to this article.

Acknowledgments

Ž.S. gratefully acknowledges the support of project CeNIKS co-financed by the Croatian Government and the European Union through the European Regional Development Fund—Competitiveness and Cohesion Operational Programme (Grant No. KK.01.1.1.02.0013).

Conflicts of Interest

The authors declare no conflict of interest.

References

  1. Manicone, P.F.; Rossi Iommetti, P.; Raffaelli, L. An Overview of Zirconia Ceramics: Basic Properties and Clinical Applications. J. Dent. 2007, 35, 819–826. [Google Scholar] [CrossRef] [PubMed]
  2. Denry, I.; Kelly, J.R. State of the Art of Zirconia for Dental Applications. Dent. Mater. 2008, 24, 299–307. [Google Scholar] [CrossRef] [PubMed]
  3. Ahamer, C.; Opitz, A.K.; Rupp, G.M.; Fleig, J. Revisiting the Temperature Dependent Ionic Conductivity of Yttria Stabilized Zirconia (YSZ). J. Electrochem. Soc. 2017, 164, F790–F803. [Google Scholar] [CrossRef]
  4. Al-baadani, A.; Sherief, R.; Kheireldean, A. Evaluation of internal adaptation of full contour zirconia crowns versus veneered zirconia crowns – in vitro study. Egypt. Dent. J. 2016, 62, 717–719. [Google Scholar] [CrossRef]
  5. Cotič, J.; Kocjan, A.; Panchevska, S.; Kosmač, T.; Jevnikar, P. In Vivo Ageing of Zirconia Dental Ceramics—Part II: Highly-Translucent and Rapid-Sintered 3Y-TZP. Dent. Mater. 2021, 37, 454–463. [Google Scholar] [CrossRef]
  6. Conrad, H.J.; Seong, W.-J.; Pesun, I.J. Current Ceramic Materials and Systems with Clinical Recommendations: A Systematic Review. J. Prosthet. Dent. 2007, 98, 389–404. [Google Scholar] [CrossRef]
  7. Mörmann, W.H. State of the Art of CAD/CAM Restorations: 20 Years of CEREC; Quintessence Publishing Company: New Malden, UK, 2006; ISBN 9781850971641. [Google Scholar]
  8. Jakovac, M.; Klaser, T.; Radatović, B.; Bafti, A.; Skoko, Ž.; Pavić, L.; Žic, M. Impact of Sandblasting on Morphology, Structure and Conductivity of Zirconia Dental Ceramics Material. Materials 2021, 14, 2834. [Google Scholar] [CrossRef]
  9. Jakovac, M.; Klaser, T.; Radatović, B.; Skoko, Ž.; Pavić, L.; Žic, M. Surface Characterization and Conductivity of Two Types of Lithium-Based Glass Ceramics after Accelerating Ageing. Materials 2020, 13, 5632. [Google Scholar] [CrossRef]
  10. Wokaun, C. XRD and Raman Identification of the Zirconia Modifications in Copper/zirconia and Palladium/zirconia Catalysts Prepared from Amorphous Precursors. J. Catal. 1991, 130, 657–661. [Google Scholar] [CrossRef]
  11. Kurpaska, L. Structural Properties of Zirconia – in-Situ High Temperature XRD Characterization. J. Mol. Struct. 2018, 1163, 287–293. [Google Scholar] [CrossRef]
  12. Jouili, M.; Andrieux, M.; Gallet, I.; Prud’Homme, N.; Ji, V. Texture and Residual Stress Analysis by XRD on Metastable Tetragonal Zirconia Films Obtained by MOCVD. ECS Trans. 2009, 25, 413–420. [Google Scholar] [CrossRef]
  13. Kim, H.-K.; Ahn, B. Effect of AlO Sandblasting Particle Size on the Surface Topography and Residual Compressive Stresses of Three Different Dental Zirconia Grades. Materials 2021, 14, 610. [Google Scholar] [CrossRef]
  14. Pereira, P.C.; Tango, R.N. Do the Different Sandblasting Protocols Influence on Flexural Strength of Zirconia Ceramic? Dent. Mater. 2013, 29, e22. [Google Scholar] [CrossRef]
  15. Tammam, R. Effect of sandblasting of zirconia abutment on surface roughness and bacterial adhesion. Egypt. Dent. J. 2017, 63, 1827–1831. [Google Scholar] [CrossRef]
  16. Žic, M. An Alternative Approach to Solve Complex Nonlinear Least-Squares Problems. J. Electroanal. Chem. 2016, 760, 85–96. [Google Scholar] [CrossRef]
  17. Žic, M. Solving CNLS Problems by Using Levenberg-Marquardt Algorithm: A New Approach to Avoid off-Limits Values during a Fit. J. Electroanal. Chem. 2017, 799, 242–248. [Google Scholar] [CrossRef]
  18. Žic, M.; Subotić, V.; Pereverzyev, S.; Fajfar, I. Solving CNLS Problems Using Levenberg-Marquardt Algorithm: A New Fitting Strategy Combining Limits and a Symbolic Jacobian Matrix. J. Electroanal. Chem. 2020, 866, 114171. [Google Scholar] [CrossRef]
  19. Boukamp, B. A Nonlinear Least Squares Fit Procedure for Analysis of Immittance Data of Electrochemical Systems. Solid State Ion. 1986, 20, 31–44. [Google Scholar] [CrossRef] [Green Version]
  20. Žic, M.; Pereverzyev, S., Jr.; Subotić, V.; Pereverzyev, S. Adaptive Multi-Parameter Regularization Approach to Construct the Distribution Function of Relaxation Times. GEM 2020, 11, 2. [Google Scholar] [CrossRef] [Green Version]
  21. Wan, T.H.; Saccoccio, M.; Chen, C.; Ciucci, F. Influence of the Discretization Methods on the Distribution of Relaxation Times Deconvolution: Implementing Radial Basis Functions with DRTtools. Electrochim. Acta 2015, 184, 483–499. [Google Scholar] [CrossRef]
  22. Žic, M.; Vlašić, L.; Subotic, V.; Pereverzyev, S.; Fajfar, I.; Kunaver, M. Extraction of Distribution Function of Relaxation Times by Using Levenberg-Marquardt Algorithm: A New Approach to Apply a Discretization Error Free Jacobian Matrix. J. Electrochem. Soc. 2022. [Google Scholar] [CrossRef]
  23. Badwal, S. Zirconia-Based Solid Electrolytes: Microstructure, Stability and Ionic Conductivity. Solid State Ionics 1992, 52, 23–32. [Google Scholar] [CrossRef]
  24. Chen, X.J.; Khor, K.A.; Chan, S.H.; Yu, L.G. Influence of Microstructure on the Ionic Conductivity of Yttria-Stabilized Zirconia Electrolyte. Mater. Sci. Eng. A Struct. Mater. 2002, 335, 246–252. [Google Scholar] [CrossRef]
  25. Strasser, T.; Preis, V.; Behr, M.; Rosentritt, M. Roughness, Surface Energy, and Superficial Damages of CAD/CAM Materials after Surface Treatment. Clin. Oral Investig. 2018, 22, 2787–2797. [Google Scholar] [CrossRef] [PubMed]
  26. Kelly, J.R.; Denry, I. Stabilized Zirconia as a Structural Ceramic: An Overview. Dent. Mater. 2008, 24, 289–298. [Google Scholar] [CrossRef] [PubMed]
  27. Kosmač, T.; Oblak, C.; Jevnikar, P.; Funduk, N.; Marion, L. The Effect of Surface Grinding and Sandblasting on Flexural Strength and Reliability of Y-TZP Zirconia Ceramic. Dent. Mater. 1999, 15, 426–433. [Google Scholar] [CrossRef]
  28. Chevalier, J.; Gremillard, L.; Virkar, A.V.; Clarke, D.R. The Tetragonal-Monoclinic Transformation in Zirconia: Lessons Learned and Future Trends. J. Am. Ceram. Soc. 2009, 92, 1901–1920. [Google Scholar] [CrossRef]
  29. Koizumi, M.; Nishihara, M. Isostatic Pressing: Technology and Applications; Springer Science & Business Media: Berlin/Heidelberg, Germany, 1991; ISBN 9781851665969. [Google Scholar]
  30. Li, K.; Rao, J.; Ning, C. Optimized Sintering and Mechanical Properties of Y-TZP Ceramics for Dental Restorations by Adding Lithium Disilicate Glass Ceramics. J. Adv. Ceram. 2021, 10, 1326–1337. [Google Scholar] [CrossRef]
  31. Dahl, P.; Kaus, I.; Zhao, Z.; Johnsson, M.; Nygren, M.; Wiik, K.; Grande, T.; Einarsrud, M.-A. Densification and Properties of Zirconia Prepared by Three Different Sintering Techniques. Ceram. Int. 2007, 33, 1603–1610. [Google Scholar] [CrossRef]
  32. Manière, C.; Lee, G.; McKittrick, J.; Chan, S.; Olevsky, E.A. Modeling Zirconia Sintering Trajectory for Obtaining Translucent Submicronic Ceramics for Dental Implant Applications. Acta Mater. 2020, 188, 101–107. [Google Scholar] [CrossRef]
  33. da Silva, B.T.F.; Trevelin, L.T.; Schroeter, A.C.; Willers, A.E.; Cesar, P.F.; Matos, A.B. Effect of Silica Coating and Laser Treatment on the Flexural Strength, Surface Characteristics, and Bond Strength of a Dental Zirconia. Eur. J. Oral Sci. 2021, 129, e12754. [Google Scholar] [CrossRef]
  34. Kwon, S.-M.; Min, B.K.; Kim, Y.K.; Kwon, T.-Y. Influence of Sandblasting Particle Size and Pressure on Resin Bonding Durability to Zirconia: A Residual Stress Study. Materials 2020, 13, 5629. [Google Scholar] [CrossRef] [PubMed]
  35. Piconi, C.; Maccauro, G. Zirconia as a Ceramic Biomaterial. Biomaterials 1999, 20, 1–25. [Google Scholar] [CrossRef]
  36. Garvie, R.C.; Nicholson, P.S. Structure and Thermomechanical Properties of Partially Stabilized Zirconia in the CaO-ZrO2 System. J. Am. Ceram. Soc. 1972, 55, 152–157. [Google Scholar] [CrossRef]
  37. Belli, R.; Hurle, K.; Schürrlein, J.; Petschelt, A.; Werbach, K.; Peterlik, H.; Rabe, T.; Mieller, B.; Lohbauer, U. A Revised Relationship between Fracture Toughness and Y2O3 Content in Modern Dental Zirconias. ChemRxiv 2021. [Google Scholar] [CrossRef]
  38. Camposilvan, E.; Leone, R.; Gremillard, L.; Sorrentino, R.; Zarone, F.; Ferrari, M.; Chevalier, J. Aging Resistance, Mechanical Properties and Translucency of Different Yttria-Stabilized Zirconia Ceramics for Monolithic Dental Crown Applications. Dent. Mater. 2018, 34, 879–890. [Google Scholar] [CrossRef]
  39. Badwal, S.P.S.; Ciacchi, F.T. Oxygen-Ion Conducting Electrolyte Materials for Solid Oxide Fuel Cells. Ionics 2000, 6, 1–21. [Google Scholar] [CrossRef]
  40. Subbarao, E.; Maiti, H. Solid Electrolytes with Oxygen Ion Conduction. Solid State Ion. 1984, 11, 317–338. [Google Scholar] [CrossRef]
  41. Jiang, S. An Electrode Kinetics Study of H2 Oxidation on Ni/Y2O3âZrO2 Cermet Electrode of the Solid Oxide Fuel Cell. Solid State Ion. 1999, 123, 209–224. [Google Scholar] [CrossRef]
  42. Barsoukov, E.; Ross Macdonald, J. Impedance Spectroscopy: Theory, Experiment, and Applications; John Wiley & Sons: Hoboken, NJ, USA, 2005; ISBN 9780471716228. [Google Scholar]
  43. Yamamoto, O.; Takeda, Y.; Kanno, R.; Kohno, K. Electrical Conductivity of Tetragonal Stabilized Zirconia. J. Mater. Sci. 1990, 25, 2805–2808. [Google Scholar] [CrossRef]
  44. Levenberg, K. A Method for the Solution of Certain Non-Linear Problems in Least Squares. Quart. Appl. Math. 1944, 2, 164–168. [Google Scholar] [CrossRef] [Green Version]
  45. Marquardt, D.W. An Algorithm for Least-Squares Estimation of Nonlinear Parameters. J. Soc. Ind. Appl. Math. 1963, 11, 431–441. [Google Scholar] [CrossRef]
  46. Palmour, H., III; Davis, R.F.; Hare, T.M. (Eds.) Processing of Crystalline Ceramics; Springer: New York, NY, USA, 2012; ISBN 9781468433807. [Google Scholar]
  47. Moguš-Milanković, A.; Pavić, L.; Srilatha, K.; Srinivasa Rao, C.; Srikumar, T.; Gandhi, Y.; Veeraiah, N. Electrical, Dielectric and Spectroscopic Studies on MnO Doped LiI–AgI–B2O3 Glasses. J. Appl. Phys. 2012, 111, 013714. [Google Scholar] [CrossRef] [Green Version]
  48. Boora, M.; Malik, S.; Kumar, V.; Bala, M.; Arora, S.; Rohilla, S.; Kumar, A.; Dalal, J. Investigation of Structural and Impedance Spectroscopic Properties of Borate Glasses with High Li+ Concentration. Solid State Ion. 2021, 368, 115704. [Google Scholar] [CrossRef]
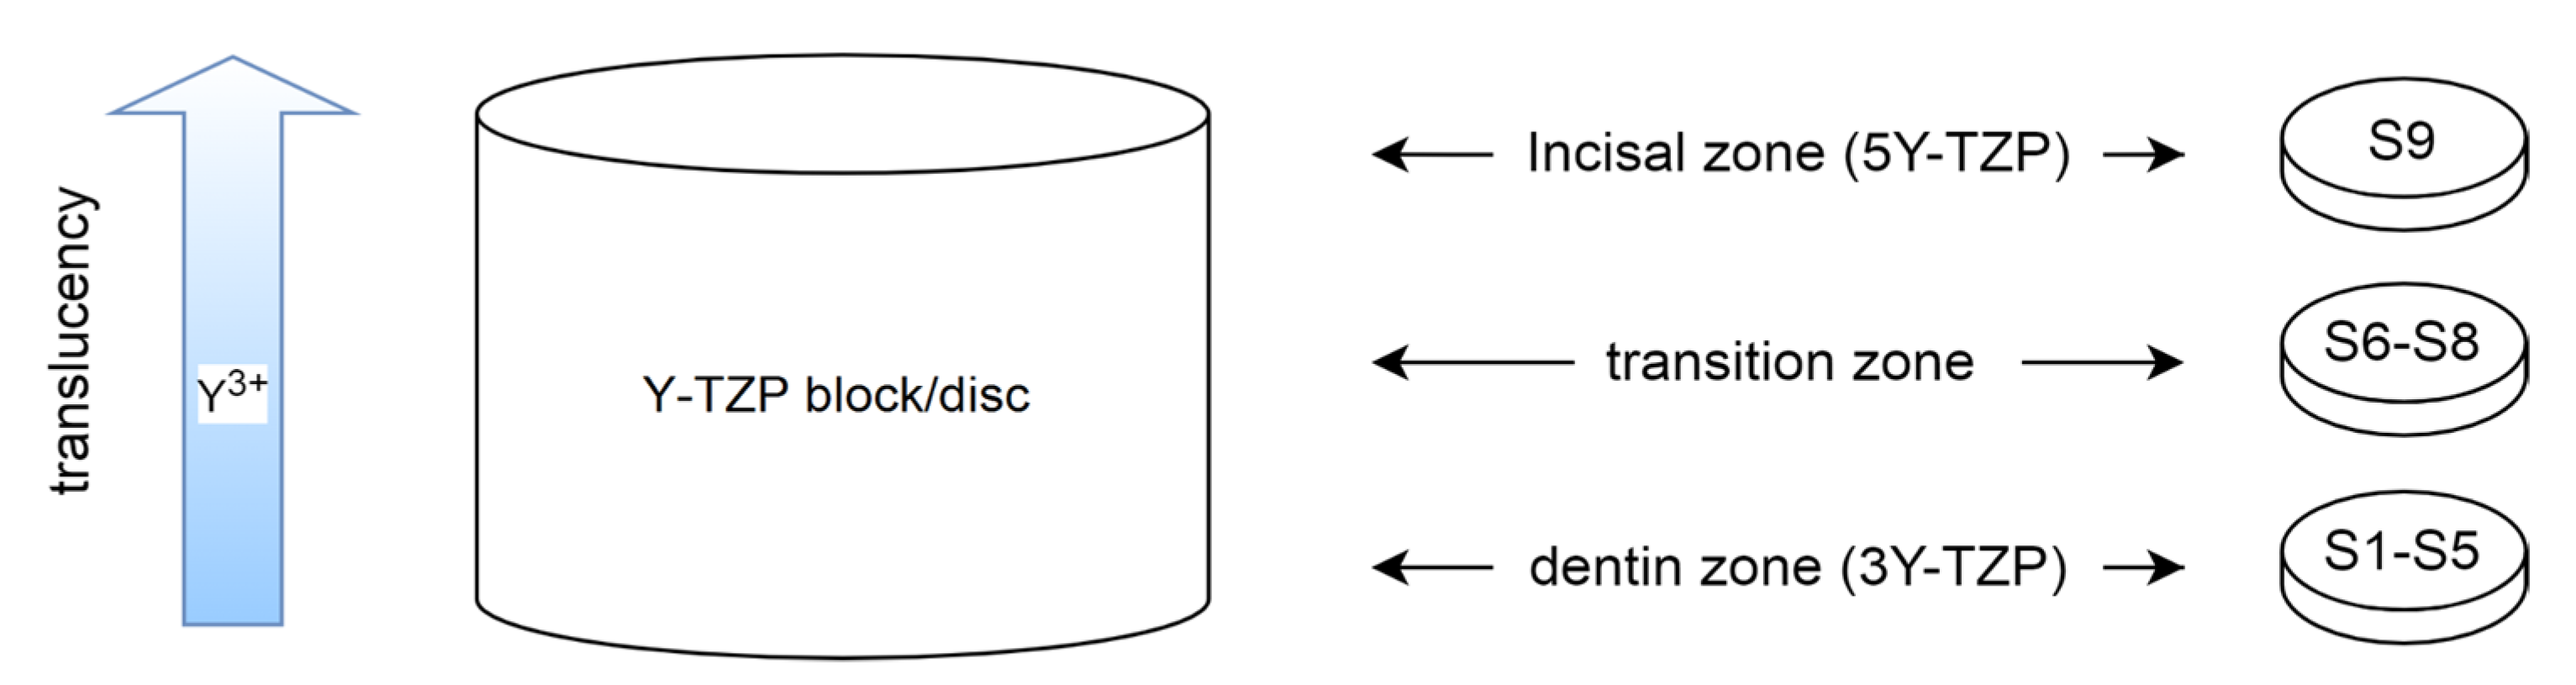
Scheme 1. Schematic presentation of Y-TZP block/disc (IPS e.max® ZirCAD Prime) and S1–S9 samples used in this work. Samples S1–S5 are assigned to the dentin zone of the Y-TZP block due to similar tetragonal phase content, whilst the sample S9 is assigned to the incisal zone on account of having the highest Y3+ content.
Materials 15 01800 sch001
Figure 1. SEM images (×10,000) of different Y-TZP discs (S1S9) investigated in this work. The discs are characterized by different Y3+ content. Sample S1 with the lowest Y3+ content shows the smallest grain size, whilst sample S9 with the highest Y3+ content shows the biggest grain size.
Materials 15 01800 g001
Figure 2. SEM image (×5000) of the sample S1. The morphology is characterized by the typical Y-TZP structure (grains and grain boundaries). The defects/voids are a result of the milling process.
Materials 15 01800 g002
Figure 3. SEM image (×5000) of the sample S9. The morphology is characterized by the typical Y-TZP structure (grains and grain boundaries). The morphology is free of defects/voids.
Materials 15 01800 g003
Figure 4. (1) PXRD patterns of the investigated Y-TZP S1-S9 samples. (2) Rietveld refinement results (eh) for selected PXRD peaks of samples S9 (a,b) and S1 (c,d).
Materials 15 01800 g004
Figure 5. (a) Conductivity spectra of S1–S9 samples collected at 423 K and their (b) DC data.
Materials 15 01800 g005
Figure 6. EEC applied to extract EEC parameter values from the S1–S9 impedance data.
Materials 15 01800 g006
Figure 7. Normalized R1, Y0,2 and cubic phase fraction values. Values are normalized to fall in the range between 0 and 1. An ascending trend is detected for the samples S5–S9. The samples S1 and S9 have the lowest and highest Y3+ amounts, respectively.
Materials 15 01800 g007
Figure 8. The variation in the activation energy (Edc) with the amount of Y3+ added. The samples S1 and S9 have the lowest and highest Y3+ amounts, respectively.
Materials 15 01800 g008
Table 1. Names of the Y-TZP samples characterized by the content of Y3+. The trend in the Y3+ content in discs is known due to the milling procedure (i.e., block processing).
Y-TZP Sample Names
S1S2S3S4S5S6S7S8S9
Materials 15 01800 i001
Materials 15 01800 i002
Table 2. The effect of Y3+ addition on the phase composition of sintered yttria-stabilized tetragonal zirconia polycrystal (Y-TZP) samples (S1–S9). The content of the tetragonal phase is decreasing and the content of the cubic phase is increasing with a higher Y3+ content (see Table 1). The phase composition was determined by utilizing the Rietveld refinement method.
SampleTetragonal PhaseCubic Phase
a(Å)c(Å)%a(Å)%
S13.6033(2)5.1778(3)785.1334(2)22
S23.6036(2)5.1781(3)745.1338(3)26
S33.6035(2)5.1783(3)755.1333(3)25
S43.6032(2)5.1786(3)745.1329(3)26
S53.6032(2)5.1781(3)765.1326(3)24
S63.6034(2)5.1768(3)505.1305(3)50
S73.6036(2)5.1742(3)345.1294(3)66
S83.6063(2)5.1730(3)355.1292(3)65
S93.6120(2)5.1713(3)305.1301(3)70
Table 3. EEC parameters obtained by fitting S1–S9 impedance spectra collected at 483 K.
SampleR1 (Ω)Y0,1 (S secn cm−1)n1R2 (Ω)Y0,2 (S secn cm−1)n2Y0,el (S secn cm−1)n3
S11.21 × 1061.15 × 10−100.873.00 × 1051.88 × 10−80.953.11 × 10−70.38
S29.16 × 1051.50 × 10−100.858.52 × 1057.38 × 10−90.884.74 × 10−70.40
S31.07 × 1062.06 × 10−100.821.25 × 1067.15 × 10−90.836.97 × 10−70.46
S48.36 × 1051.35 × 10−100.874.14 × 1055.56 × 10−91.031.78 × 10−70.43
S59.25 × 1051.66 × 10−100.849.52 × 1058.10 × 10−90.857.27 × 10−70.44
S69.33 × 1051.42 × 10−100.866.64 × 1059.57 × 10−90.874.33 × 10−70.35
S71.15 × 1061.80 × 10−100.825.95 × 1051.07 × 10−80.861.12 × 10−60.44
S81.21 × 1061.15 × 10−100.873.00 × 1051.88 × 10−80.953.11 × 10−70.38
S91.43 × 1061.66 × 10−100.837.46 × 1051.90 × 10−80.839.70 × 10−70.57
Publisher’s Note: MDPI stays neutral with regard to jurisdictional claims in published maps and institutional affiliations.

