Abstract
Ti-Cu alloys have broad application prospects in the biomedical field due to their excellent properties. The properties of Ti-Cu alloys are strongly dependent on Cu content, microstructures, its Ti2Cu phase and its preparation process. The aim of this work is to investigate the effect of Cu content on the precipitation behaviors, mechanical and corrosion properties of the as-cast Ti-Cu alloys. The microstructures and phase evolution were characterized by SEM and TEM, and the properties were studied by tensile and electrochemical test. The results show that the volume fraction of Ti2Cu phase increases with the increase of Cu content. The Ti2Cu phase presents a variety of microscopic morphologies with different Cu content, such as rod, granular, lath and block shaped. The crystal orientation relationships between the Ti2Cu and α-Ti matrix in Ti-4Cu and Ti-10Cu alloys are (103)Ti2Cu//(0[111)α-Ti, [01]Ti2Cu//[20]α-Ti, and (103)Ti2Cu//(0002)α-Ti, [31]Ti2Cu//[110]α-Ti, respectively. The tensile strength, Vickers hardness and Young’s modulus of the Ti-Cu alloys increase with the increase of Cu content, whereas the elongation decreases. The fracture morphologies of these alloys reveal ductile, ductile-brittle hybrid, and cleavage brittle mode, respectively. The corrosion resistance of the Ti-Cu alloys in SBF solution can be described as: Ti-4Cu alloy > Ti-10Cu alloy > Ti-7Cu alloy. The volume fraction of Ti2Cu phases and the “protective barrier” provided by the fine lath Ti2Cu phases strongly affected the electrochemical performances of the alloys.
1. Introduction
Titanium alloys are widely used in the biomedical field due to their light weight, high strength, good biocompatibility and corrosion resistance [1,2,3]. However, due to the lack of antibacterial function of titanium, the CP-Ti and TC4 alloys implanted in clinical use are prone to bacterial infection during or after surgeries [4,5]. To date, much attention has been paid to the antibacterial properties of the titanium alloys, and the formation of Ti-Cu alloy by adding Cu element to pure titanium has been proven to be an effective method to improve the antibacterial properties of materials [6,7]. Ti-Cu alloy has good antibacterial properties and can effectively inhibit the formation of bacteria on the surface of the alloy, thereby significantly improving the success rate of joint prosthesis and dental implant surgeries [8]. It is also found that the Ti-Cu alloy can form a good osseointegration with bones, and has a lower bone absorption rate compared with CP-Ti by animal experiments [9]. The excellent antibacterial properties of Ti-Cu alloy can be attributed to the Cu2+ released from the Ti2Cu phase during the galvanic corrosion process [10]. However, very little information is available on the precipitation mechanism of the Ti2Cu phase. Therefore, it is necessary to investigate the precipitation behavior of the alloys.
Cu is an active eutectoid β stabilizer element in titanium alloys, and the melting temperature of the Ti-Cu alloy decreases with the increase of Cu content [11,12]. The addition of Cu element to titanium can favor casting and improve the mechanical properties of the products [13]. In addition to mechanical properties, corrosion resistance is an important consideration for the biomedical materials. Liu et al. found that Ti-Cu alloys had better corrosion resistance than CP-Ti in NaCl solution [14]. However, Osório et al. observed that the increase in Cu content significantly decreased the electrochemical performance of Ti-Cu alloys [15]. Therefore, there are still many controversies concerning the corrosion resistance of the Ti-Cu alloys, and the effect of microstructure, especially the precipitation of the Ti2Cu phase on the corrosion performance, needs to be studied in depth.
In this present work, the effects of Cu content (4, 7, 10 wt.%) on the microstructure, mechanical and corrosion properties of as-cast Ti-Cu alloys were systematically investigated. The morphology and formation mechanism of the Ti2Cu phase were examined, and the corresponding fracture mechanism and corrosion mechanism were also discussed.
2. Materials and Methods
The Ti-xCu alloys with 4, 7, 10 wt.% Cu, respectively, were prepared by a vacuum induction electromagnetic levitation melting furnace with a water-cooled copper crucible. TA1 pure titanium rods (99.95 wt.%) and electrolytic copper (99.99 wt.%) were chosen as the raw materials. The melting stocks weighing 1 kg were melted in an evacuated chamber backfilled with controlled atmosphere of dry high purity argon (99.99%) maintained at 103 Pa. After the raw materials were completely melted, the melt was held for 1 min. Then the power was turned off and the melt was cooled to room temperature in the crucible. Each ingot was flipped and smelted three times to prevent the composition segregation, and the photographs of the ingot are shown in Figure 1a.
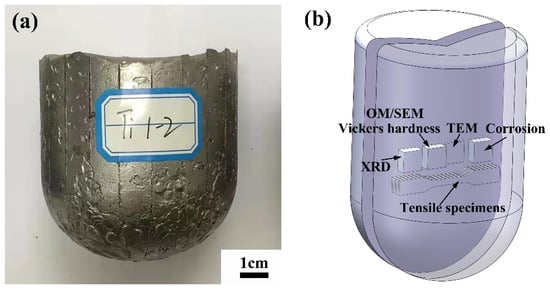
Figure 1.
(a) Ti-Cu alloy ingot and (b) schematic of the sampling locations for microstructure observations, tensile and corrosion testing.
The specimens for microstructure observations and performance tests were cut by wire-cut electrical discharge machining (WEDM), and the schematic of the sampling locations is shown in Figure 1b. The phases of the as-cast alloys were characterized by Smartlab (9 kW) X-ray diffractometer (XRD, Rigaku, Akishima, Japan) with monochromatic Cu Kα radiation, and the scanning speed is 6°/min. The microstructure observations and composition analysis were performed by DSX 510 optical microscope (OM, Olympus, Tokyo, Japan), JSM 7610F field emission scanning electron microscope (SEM, JEOL, Tokyo, Japan), Tecnai G2 F30 transmission electron microscope (TEM, FEI, Amsterdam, The Netherland) and X-ray energy dispersive spectroscopy (EDS). Specimens for OM and SEM observations were polished and etched with a mixed solution of 10 mL HF, 50 mL HNO3 and 60 mL C3H8O3 for 10 s. Specimens for TEM observations were ground down to 50 μm, punched to Φ 3 mm discs and ion milled. The surface potentials of the as-cast alloys were measured through the atomic force microscope (AFM, Agilent 5500, Santa Clara, CA, USA) in the KPFM mode. Before the AFM experiment, specimens were mechanically polished, and subsequently ultrasonic cleaned with acetone.
Tensile tests were performed at room temperature on an Instron-5848 (Boston, MA, USA) tensile testing machine in air, with a stretching rate of 1 mm/min, according to the ASTM: E8/E8M-16 standard. An extensometer with 10 mm gauge length was used to measure the strain and to exclude the elastic strain of the grips. Young’s modulus was obtained from the slope of the stress-strain curve. The geometric shape of the tensile specimen with 1 mm thickness is shown in Figure 2. Three specimens in each condition were tested, and the statistically averaged values were obtained to analyze the tensile results. The Vickers microhardness was evaluated on an HMV-2000 Vickers hardness tester with a load of 1.918 N and holding time of 20 s. More than ten indentations were performed on each specimen to obtain the mean value.
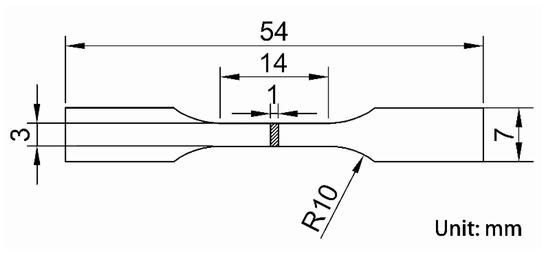
Figure 2.
Geometric dimension of the tensile specimen.
The electrochemical tests of the specimens were conducted on a beaker containing simulated human body fluid (SBF) solutions at 37 ± 1 °C using the CHI660D three-electrode electrochemical workstation: a platinum electrode as the counter electrode, a saturated calomel electrode (SCE) as the reference electrode, and the testing specimen as the working electrode. The surfaces of the test specimens were polished and then ultrasonically cleaned with acetone. The test geometric area is 1 cm2, and the rest is coated with 703 silica gel for insulation. The chemical composition of SBF solution is shown in Table 1. After the components of SBF are fully dissolved, the pH was adjusted 7.4 ± 0.1 using 0.5 mol/L C4H11NO3 (TRIS) and 0.1 mol/L HCl. Before the test starts running, the specimen was placed in the SBF solution and soaked for 24 h to make it passivate naturally. During the potentiodynamic measurements, the electrode was firstly left stabilizing at open circuit potential (OCP) for 1800 s. Afterwards, the electrochemical impedance spectroscopy (EIS) was carried out at an OCP with a 5 mV amplitude sine wave potential and a frequency range of 10−2–105 Hz. Finally, the polarization curves were obtained at a scanning range of −0.5–0.15 V (relative to OCP) and the scanning speed was 1 mV/s. Zview software package was used to analyze the impedance data. In order to ensure the accuracy of the experiment, three specimens were measured at each condition.

Table 1.
Chemical composition of the simulated body fluid (SBF) solution (g/L) [16].
3. Results and Discussion
3.1. Microstructure
Figure 3 shows the XRD spectra of the as-cast Ti-xCu (x = 4, 7, 10) alloys. It can be seen that the as-cast Ti-Cu alloys are mainly composed of two phases, α-Ti and Ti2Cu phase, and no β phase is detected. A previous paper reported that Ti-Cu alloys with low Cu content underwent β → α-Ti + Ti2Cu eutectoid transformation, and β phase was difficult to retain at the room temperature, even after quenching [12]. The intensity of the diffraction peaks of the Ti2Cu phase gradually increases, indicating that the volume fraction of the Ti2Cu phase increases with the increase of Cu content. It can also be observed that the increase of Cu content will promote the α-Ti peaks to shift toward low angle orientations. According to the Bragg’s equation, the deflection of peaks causes the expansion of the α-Ti phase lattice.
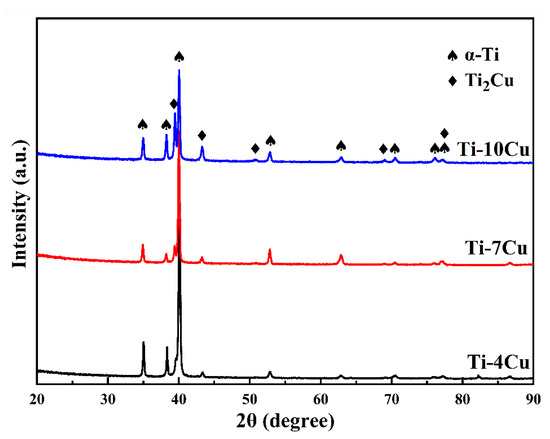
Figure 3.
XRD patterns of the as-cast Ti-xCu alloys.
Figure 4 shows the OM and SEM microstructures of the as-cast Ti-xCu alloys. It can be seen that the OM microstructure of the Ti-4Cu alloy is a Widmanstätten structure, which consists of equiaxed prior β grains and lamellar α-Ti phase (Figure 4a). With the increase of Cu content, the OM microstructure of the Ti-7Cu alloy changes to a mixed microstructure of eutectoid structure and Widmanstätten structure with typical basket weave features (Figure 4c), and the Ti-10Cu alloy is typical eutectoid structure (Figure 4e). Figure 4b shows the SEM microstructure of the Ti-4Cu alloy. It can be seen that lamellar α-Ti and some rod-shaped phases are precipitated at the grain boundaries of the lamellar structures. However, some fine granular particles were formed in the internal grains. EDS of the precipitate and the analysis result is presented in Table 2. According to the EDS and XRD (Figure 3) analysis, the rod-shaped and granular precipitates can be confirmed to be the Ti2Cu phase. Similarly, the Ti2Cu phases in Ti-7Cu and Ti-10Cu alloys can also be identified. However, the morphologies of the Ti2Cu phase are different with the differences of Cu content. In the Ti-7Cu alloy, the Ti2Cu phase exhibits both lath and rod morphologies, and some fine granular precipitates were also found inside the α-Ti phase grains (Figure 4d), while it exhibits both lath and block morphologies in the Ti-10Cu alloy (Figure 4f). From the above SEM microstructures, it can also be inferred that the Ti2Cu phases increases with the increase of Cu content.
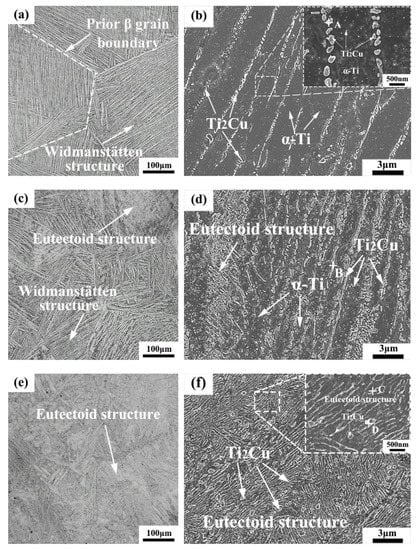
Figure 4.
OM and SEM microstructures of the as-cast Ti-xCu alloys: (a,b) Ti-4Cu alloy; (c,d) Ti-7Cu alloy; (e,f) Ti-10Cu alloy.

Table 2.
EDS analysis results of the precipitated Ti2Cu phase marked in Figure 4 (at.%).
Figure 5 shows the section of Ti-Cu phase diagram and schematic views of the microstructure transformation of Ti-xCu alloys during the solidification process. According to the Ti-Cu binary alloy equilibrium phase diagram [17], the Ti-4Cu, Ti-7Cu and Ti-10Cu alloys correspond to the hypo-eutectoid, near eutectoid and hyper-eutectoid regions, respectively. Solidification occurs by the formation of primary β-Ti grains, and the Ti-Cu alloys are composed of β-Ti single-phase region at the high temperature. Then, the microstructure transformations of Ti-Cu alloys are different with the differences of Cu content, and the schematic views of the microstructures are shown in Figure 5. For the Ti-4Cu alloy, the lamellar pro-eutectoid α-Ti phases precipitate along the prior β-Ti grain boundaries and grow into the grains to form the Widmanstätten structure. As the temperature drops to 790 °C, the residual β-Ti phase undergoes eutectoid transformation into the α-Ti and rod-shaped Ti2Cu phase. Due to the difference in the precipitation sequences, more Cu elements are dissolved in the pro-eutectoid α-Ti phases than in the eutectoid α-Ti phases. When the temperature continues to decrease, the pro-eutectoid α-Ti phase will precipitate finely dispersed granular phases due to the oversaturated Cu. As a near-eutectoid alloy, the amount of pro-eutectoid α phases and the temperature interval of the (β+α) two-phase region of the Ti-7Cu alloy are smaller than those of the Ti-4Cu alloy. Therefore, Ti-7Cu alloy contains the Widmanstätten and eutectoid structure, and the Ti2Cu phases formed by the eutectoid reaction exhibit both lath and rod morphologies. Due to the presence of more supersaturated Cu in the eutectoid α-Ti phases of the Ti-7Cu alloy, more dispersed fine granular phases will be precipitated in the eutectoid α-Ti phase during the subsequent cooling to room temperature. The Ti-10Cu alloy is a hyper-eutectoid alloy, and it can be seen that the pro-eutectoid block Ti2Cu phases are precipitated at the prior β grain boundaries, or internal grains. As the temperature decreases, the β phase undergoes eutectoid transformation, and the α-Ti and lath Ti2Cu phases in the eutectoid structure present a layered distribution.
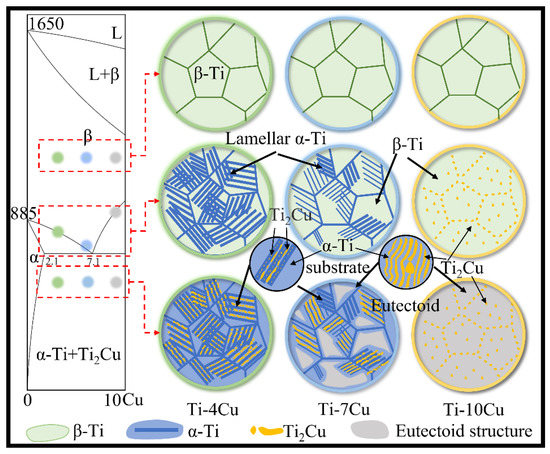
Figure 5.
Section of Ti-Cu phase diagram and schematic views of microstructure transformation of Ti-xCu alloys during solidification.
3.2. Ti2Cu Precipitation
The TEM images of the as-cast Ti-4Cu alloy are shown in Figure 6. It can be seen that the rod-shaped and granular precipitates are distributed in the α-Ti matrix (Figure 6a). Figure 6b shows the selected area electron diffraction (SAED) pattern of the rod-shaped phase in Figure 6a, and the corresponding EDS quantitative analysis result (Area 1) is presented in Table 3. The analysis indicates that the rod-shaped precipitate is Ti2Cu phase, which presents a tetragonal structure (a = 0.29438 nm, c = 1.0786 nm) [18,19]. Figure 6c presents the complex SAED pattern of the rod-shaped Ti2Cu and α-Ti phase, and the orientation relationship between the Ti2Cu phase and α-Ti matrix can be described as (103)Ti2Cu//(011)α-Ti, [01]Ti2Cu//[20]α-Ti. The same orientation relationship has been reported in the literature [19] by Sun et al. The magnified bright field TEM image of the granular phase is shown in Figure 6d. It can be seen that the size of the particle is about 100 nm. Combined with the EDS analysis result (Area 3) presented in Table 3, the granular precipitate can also be identified as Ti2Cu phase. Figure 6e shows the complex SAED pattern of the granular Ti2Cu and α phase, and a new orientation relationship between the Ti2Cu phase and α-Ti matrix can be described as (0)Ti2Cu//(011)α-Ti, [31]Ti2Cu//[012]α-Ti. The orientation relationship between the Ti2Cu phase and the α-Ti phase was further analyzed using the polar stereographic projection technique [20], as shown in Figure 6f. It can be seen that (103)Ti2Cu//(011)α-Ti orientation relationship is fixed on the outer circumference, and another orientation relationship ((0)Ti2Cu//(011)α-Ti) also appears on the outer circumference. According to the rotational symmetry of the crystal, (103)Ti2Cu//(011)α-Ti, [01]Ti2Cu//[20]α-Ti and (0)Ti2Cu//(011)α-Ti, [31]Ti2Cu//[012]α-Ti orientation relationships are equivalent.
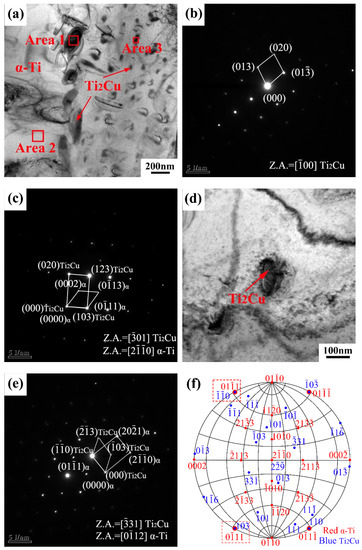
Figure 6.
(a) Bright field TEM image of the as-cast Ti-4Cu alloy; (b) SAED pattern taken from the area 1 in (a); (c) the complex SAED pattern of the rod-shaped Ti2Cu and α phase; (d) bright field TEM image of the granular Ti2Cu phase; (e) the complex SAED pattern of the granular Ti2Cu and α phase taken from in (d); (f) stereogram showing the parallel planes of Ti2Cu and α.

Figure 7 shows the TEM images of the as-cast Ti-10Cu alloy. The microstructure of the Ti-10Cu alloy is composed of pro-eutectoid block and lath precipitates, as shown in Figure 7a. The pro-eutectoid block precipitate can be identified as Ti2Cu phase according to the SAED pattern (Figure 7b) and EDS (Table 3) analysis. Figure 7c shows the eutectoid microstructure of the Ti-10Cu alloy. It can be seen that the black lath precipitate is the Ti2Cu phase, and the matrix is the α-Ti phase, according to the EDS analysis. The complex SAED pattern of the lath Ti2Cu phase and α phase is shown in Figure 7d, and the orientation relationship between the Ti2Cu phase and α-Ti matrix is established as (103)Ti2Cu//(0002)α-Ti, [31]Ti2Cu//[110]α-Ti. Williams et al. also found this crystal orientation relationship in Ti-Cu alloys [21].
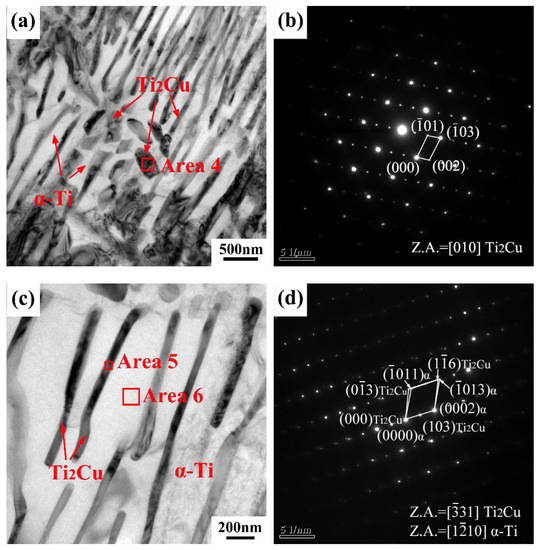
Figure 7.
(a,c) bright field TEM images of as-cast Ti-10Cu alloy; (b) SAED pattern taken from the area 4 in (a); (d) the complex SAED pattern of the lath Ti2Cu (Area 5) and α phase taken from in (c).
3.3. Mechanical Properties
Figure 8 shows the tensile engineering stress-strain curves of the as-cast Ti-xCu alloys, and the values of the mechanical properties are listed in Table 4. It can be seen that the ultimate tensile strength (UTS) and yield strength (YS) of the alloys increase with the increase of Cu content, whereas the elongation decreases. The UTS and YS of the Ti-10Cu alloy are 902.7 MPa and 749.5 MPa, which are 25.6% and 22.4% higher than that of Ti-4Cu alloy, respectively. However, the elongation with 2.6%, is 61.2% lower than that of Ti-4Cu alloy. The Vickers hardness and Young’s modulus of the alloys also increase with the increase of Cu content, as seen in Table 4. The strengthening effect of Cu addition to titanium alloys has been reported in many literatures, and solid solution strengthening and precipitation of intermetallic compounds strengthening mechanisms were proposed [7]. With the increase of Cu content in Ti-Cu alloys, both the solid solution Cu element in α-Ti matrix and the precipitated Ti2Cu phase increase. As a result, the UTS, YS, and microhardness are increased, and the elongation is decreased. It is known that the Young’s modulus of the alloys is dependent on the alloy phase, and intermetallic compounds generally have higher elastic modulus than the constituting elements. Therefore, the Young’s modulus of Ti-Cu alloys also increases with the increase of Cu content. This result is in good agreement with that reported by Kikuchi et al. [22], which showed that Cu increased the Young’s modulus of titanium by 20% when its content was 30 wt.%.
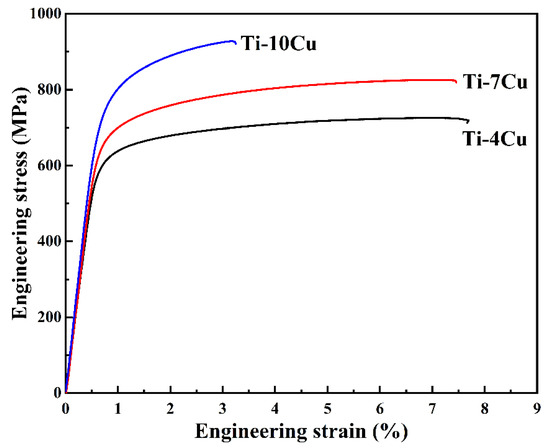
Figure 8.
Tensile stress-strain curves of the as-cast Ti-xCu alloys.

Table 4.
Mechanical properties of the as-cast Ti-xCu alloys.
Figure 9 shows the tensile fracture features of the as-cast Ti-Cu alloys at room temperature. It can be seen that the fracture surfaces of the Ti-4Cu alloy are a mixed morphology formed by lots of dimples with different sizes, finer flat cleavage facets, as well as numerous tearing ridges, corresponding to good plasticity of the as-cast Ti-4Cu alloy (Figure 9a). The fracture features of the Ti-7Cu alloy are similar to those of Ti-4Cu alloy, as seen in Figure 9b. However, the smaller number of dimples and the larger number and size of cleavage facets confirm that it is a ductile-brittle hybrid fracture mechanism. The fracture morphology of the Ti-10Cu alloy is entirely composed of cleavage surfaces caused by the brittle behavior of the Ti2Cu intermetallic phases, and few tearing ridges appear, as shown in Figure 9c. The fracture mechanism of the Ti-10Cu alloy can be determined as a cleavage fracture mode, showing the lowest plasticity.
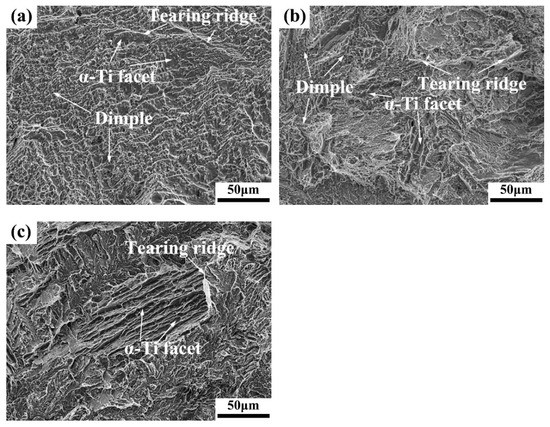
Figure 9.
SEM fractographs of the tensile test specimens: (a) Ti-4Cu alloy; (b) Ti-7Cu alloy; (c) Ti-10Cu alloy.
3.4. Electrochemical Properties
In order to analyze the effect of Cu content on the corrosion properties of the as-cast Ti-xCu alloys, the electrochemical tests of the specimens were carried out in SBF solutions. Figure 10 shows the polarization curves of the alloys. It can be seen that all the alloys show significant activation-passivation characteristics. In the cathodic polarization zone, below the self-corrosion potential, the current density on the surface of the alloy decreases with the increase of the applied voltage, and oxygen absorption corrosion occurs. In the active dissolution zone, when the corrosion current density reaches the minimum value, the corresponding potential is the self-corrosion potential (Ecorr) [23]. As the corrosion potential continues to increase, the corrosion current increases substantially linearly, and the alloys undergo rapid active dissolution within this interval. The cathodic polarization zone and the active dissolution zone basically conform to the characteristics of the Tafel curve. The polarization curves show a linear relationship in the “Tafel area”, and the slope, which is the corrosion current density (icorr), can be obtained by fitting the Tafel curve [23]. After the anodic polarization curve has experienced a small active dissolution zone, the corrosion potential reaches a certain value, and the alloy quickly enters the passivation zone. With the continuous increase of the potential, the corrosion current appears to be basically unchanged or increase slightly and slowly. During this process, the passive film on the surface of the alloy tends to be in a stable state, and the corrosion rate is extremely small. Compared with Ti-4Cu alloy, Ti-7Cu and Ti-10Cu alloys have an over passivation zone. In the over passivation zone, as the applied potential continues to increase, the current density begins to increase rapidly, the surface of the alloy begins to enter the active dissolution state from the passivation state, and the corrosion rate of the alloy increases rapidly again.
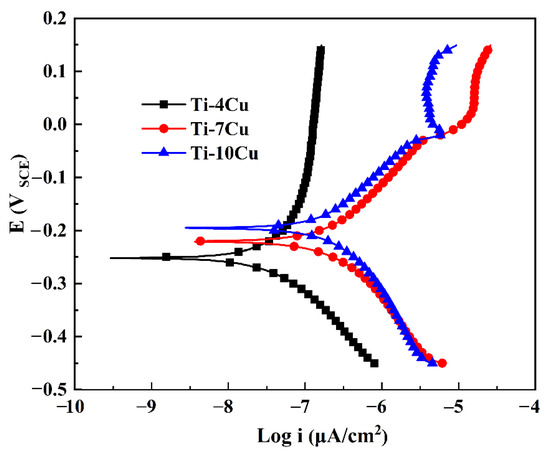
Figure 10.
Polarization curves of the as-cast Ti-xCu alloys in SBF solution.
The values of the icorr and Ecorr of the Ti-Cu alloys calculated from the polarization curves (Figure 10) are shown in Table 5. The icorr represents the corrosion rate of the material during the corrosion process. A smaller value of icorr indicates that the alloy is more resistant to corrosion. The Ecorr reflects the thermodynamic tendency of the electrode. The more positive the value of Ecorr, the smaller the tendency for corrosion to occur. The Ecorr values of the Ti-Cu alloys with different Cu content are relatively close, while the icorr value of Ti-4Cu alloy (0.043 μA/cm2) is smaller than that of Ti-10Cu alloy (0.276 μA/cm2) and Ti-7Cu alloy (0.413 μA/cm2), as shown in Table 5. Therefore, the corrosion resistance of the Ti-Cu alloys in SBF solution can be described as: Ti-4Cu alloy > Ti-10Cu alloy > Ti-7Cu alloy. Compared with the results of the electrochemical property of commercially pure titanium in the SBF solution reported by Yetim, the values of Ecorr and icorr of CP titanium are −0.491 V and 2.0 μA/cm2, respectively, which showed the Ti-Cu alloys had better corrosion resistance than CP-Ti in the SBF solution [24].

Table 5.
Electrochemical parameters of the as-cast Ti-xCu alloys.
The EIS curves of the as-cast Ti-Cu alloys are shown in Figure 11. Figure 11a shows the Nyquist diagram. It can be seen that the curves of the as-cast Ti-Cu alloys with different Cu content are all circular or arc-shaped. The semicircle represents the capacitive reactance arc created by the parallel circuit of the capacitor and the charge transfer resistor. The diameter of the curve represents the corrosion resistance of the Ti-Cu alloys. The larger the diameter of the curve, the better the corrosion resistance of the alloy [25]. The diameter of the Ti-4Cu alloy test curve is larger than that of the Ti-10Cu alloy curve, indicating that the corrosion resistance of Ti-4Cu alloy is stronger than that of Ti-10Cu alloy. Similarly, the corrosion resistance of Ti-10Cu alloy is stronger than that of Ti-7Cu alloy. Figure 11b shows the Bode plots of the as-cast Ti-Cu alloys. The Bode plot is the curve of the impedance modulus (|Z|) as a function of the disturbance frequency. Generally, the larger the value of |Z| in the low frequency region (<10 Hz), the better the corrosion resistance [26]. The Ti-4Cu alloy has the largest |Z| value at 10 mHz in the low frequency region, showing the strongest corrosion resistance. This is consistent with the previous analysis. Figure 11c shows the Bode phase angle plots of the as-cast alloys. The Bode phase angle plot is the curve of the phase angle as a function of the disturbance frequency. It can be seen that the phase angles of the alloys with different Cu content have no negative values in the low frequency region, indicating that the surfaces of the three alloys can form stable passivation films. Ti-4Cu alloy has the best corrosion resistance due to the largest phase angle peak and peak width, whereas Ti-7Cu alloy has the worst corrosion resistance. Once again, the corrosion resistance of Ti-4Cu alloy > Ti-10Cu alloy > Ti-7Cu is proved. In order to quantitatively characterize the corrosion resistance of the specimens, the equivalent circuit is established by fitting the EIS curves with Zview software, as shown in Figure 11d. The corresponding electrochemical parameters are shown in Table 6. It can be seen that the solution resistance (Rs) values are at the same order, while the values of the charge transfer resistance (Rct) are significantly different. The larger the Rct value, the better the corrosion resistance [27]. The Rct value of Ti-4Cu alloy is 0.537 MΩ·cm2, which is ten times that of Ti-7Cu alloy and five times that of Ti-10Cu alloy, indicating that its corrosion resistance is the best. Compared with the Rct value of the CP-Ti presented in Ref. [28], the Ti-Cu alloys also showed better corrosion resistance than the CP-Ti in the SBF solution.
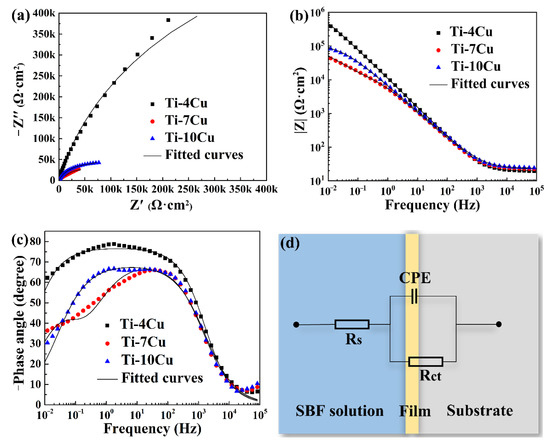
Figure 11.
Electrochemical impedance spectrum (EIS) plots of the as-cast Ti-xCu alloys: (a) Nyquist plots, (b) Bode plots, (c) Bode phase angle plots, (d) equivalent circuits used for fitting the EIS.

Table 6.
Electrochemical parameters of the fitting equivalent circuit.
In order to clarify the corrosion mechanism, the surface volt potential maps of the as-cast Ti-4Cu and Ti-10Cu alloys are acquired by AFM in the KPFM mode, as indicated in Figure 12. It can be seen that the Ti2Cu phases show more active potential than the α-Ti matrix. Undoubtedly, a number of micro-galvanic corrosion are formed and the α-Ti matrix would act as micro-anode to erode preferentially. In Ti-10Cu and Ti-7Cu alloys, more Ti2Cu phases were formed than in the Ti-4Cu alloy (Figure 4), which considerably increased the galvanic corrosion effect and decreased the general corrosion resistance (Figure 11). Similar results were also obtained by Pina et al. [29] when studying the electrochemical and tribo-electrochemical characterization of titanium-copper biomedical alloys. Although it contains more Ti2Cu phase in Ti-10Cu alloy than in Ti-7Cu alloy, its corrosion performance is better than that of Ti-7Cu alloy. This can be attributed to the uniform distribution and smaller inter phase spacing of the lath Ti2Cu phase. It would provide an “protective barrier” modifying the cathode/anode area ratio between the Ti2Cu and α-Ti phases which could minimize the galvanic effects and improve the corrosion resistance [30,31].
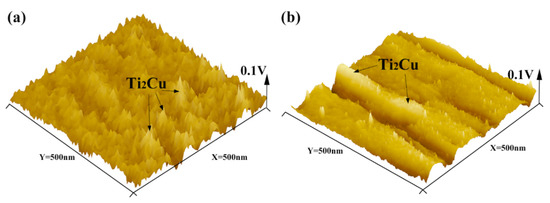
Figure 12.
The 3D AFM images and surface potentials of the as-cast Ti-xCu alloys: (a) Ti-4Cu alloy, (b) Ti-10Cu alloy.
4. Conclusions
(1) The as-cast Ti-Cu alloys are mainly composed of α-Ti and Ti2Cu phase. The volume fraction of Ti2Cu phase increases with the increase of Cu content;
(2) The microstructures of the as-cast alloys are Widmanstätten structure, eutectoid and Widmanstätten mixed structure, and eutectoid structure, respectively. The morphologies of the Ti2Cu phases change from (rod + granular), (lath + rod + granular) to (lath + block) shaped, with the increase of Cu content;
(3) The orientation relationship between the Ti2Cu phase and α-Ti matrix of the Ti-4Cu alloy can be identified as (103)Ti2Cu//(011)α-Ti, [01]Ti2Cu//[20]α-Ti. However, in the Ti-10Cu alloy, the orientation relationship between the two phases is established as (103)Ti2Cu//(0002)α-Ti, [31]Ti2Cu//[110]α-Ti;
(4) The UTS, YS, Vickers hardness and Young’s modulus of the Ti-Cu alloys increase with the increase of Cu content, whereas the elongation decreases. The fractographic analyses indicated that the fracture mode changed from ductile, ductile-brittle hybrid to cleavage brittle fracture, with the increase of Cu content;
(5) The corrosion resistance of the Ti-Cu alloys in SBF solution can be described as: Ti-4Cu alloy > Ti-10Cu alloy > Ti-7Cu alloy. The difference in the electrochemical performance can be attributed to the volume fraction of Ti2Cu phases and the “protective barrier” provided by the fine lath structure and uniform distribution of Ti2Cu phases.
Author Contributions
Conceptualization, B.F. and Y.W.; methodology, B.F.; validation, Z.W., T.D. and G.L.; formal analysis, J.L. (Jingkun Li) and X.Z.; data curation, J.L. (Jingkun Li), Z.W. and G.Z.; writing—original draft preparation, Z.W. and T.D.; writing—review and editing, B.F., Y.W. and J.L. (Jinhai Liu); supervision, J.L. (Jinhai Liu) and G.L.; project administration, X.Z. and G.Z.; funding acquisition, B.F. All authors have read and agreed to the published version of the manuscript.
Funding
This work was financially supported by the National Natural Science Foundation of China (NSFC) under Grant No. 51601054, and the Central Government Guides Local Science and Technology Development Fund Projects under Grant No. 206Z1005G.
Institutional Review Board Statement
Not applicable.
Informed Consent Statement
Not applicable.
Data Availability Statement
The data presented in this study are available on request from the corresponding author.
Conflicts of Interest
The authors declare no conflict of interest.
References
- Liu, T.-Y.; Zhu, Z.-H.; Zhang, S.; Min, X.-H.; Dong, C. Design for Ti-Al-V-Mo-Nb alloys for laser additive manufacturing based on a cluster model and on their microstructure and properties. China Foundry 2021, 18, 424–432. [Google Scholar] [CrossRef]
- Li, Y.; Yang, C.; Zhao, H.; Qu, S.; Li, X.; Li, Y. New Developments of Ti-Based Alloys for Biomedical Applications. Materials 2014, 7, 1709–1800. [Google Scholar] [CrossRef] [PubMed]
- Li, C.-Z.; Fu, B.-G.; Dong, T.-S.; Liu, J.-H.; Song, Y.-J.; Zhao, X.-B.; Li, G.-L. Microstructure and dry sliding wear behavior of as-cast TiCp/Ti-1100-0.5Nb titanium matrix composite at elevated temperatures. China Foundry 2020, 17, 455–463. [Google Scholar] [CrossRef]
- Liu, H.; Tang, Y.; Zhang, S.; Liu, H.; Wang, Z.; Li, Y.; Wang, X.; Ren, L.; Yang, K.; Qin, L. Anti-infection mechanism of a novel dental implant made of titanium-copper (TiCu) alloy and its mechanism associated with oral microbiology. Bioact. Mater. 2021, 8, 381–395. [Google Scholar] [CrossRef] [PubMed]
- Geetha, M.; Singh, A.K.; Asokamani, R.; Gogia, A.K. Ti based biomaterials, the ultimate choice for orthopaedic implants—A review. Prog. Mater. Sci. 2009, 54, 397–425. [Google Scholar] [CrossRef]
- Javadhesari, S.M.; Alipour, S.; Akbarpour, M. Biocompatibility, osseointegration, antibacterial and mechanical properties of nanocrystalline Ti-Cu alloy as a new orthopedic material. Colloids Surf. B Biointerfaces 2020, 189, 110889. [Google Scholar] [CrossRef]
- Liu, X.; Chen, S.; Tsoi, J.K.; Matinlinna, J.P. Binary titanium alloys as dental implant materials—A review. Regen. Biomater. 2017, 4, 315–323. [Google Scholar] [CrossRef]
- Zhang, E.; Wang, X.; Chen, M.; Hou, B. Effect of the existing form of Cu element on the mechanical properties, bio-corrosion and antibacterial properties of Ti-Cu alloys for biomedical application. Mater. Sci. Eng. C 2016, 69, 1210–1221. [Google Scholar] [CrossRef]
- Liu, R.; Tang, Y.; Zeng, L.; Zhao, Y.; Ma, Z.; Sun, Z.; Xiang, L.; Ren, L.; Yang, K. In vitro and in vivo studies of anti-bacterial copper-bearing titanium alloy for dental application. Dent. Mater. 2018, 34, 1112–1126. [Google Scholar] [CrossRef]
- Zhang, E.L.; Li, F.B.; Wang, H.Y.; Liu, J.; Wang, C.M.; Li, M.Q.; Yang, K. A new antibacterial titanium-copper sintered alloy: Preparation and antibacterial property. Mater. Sci. Eng. C 2013, 33, 4280–4287. [Google Scholar] [CrossRef]
- Tsao, L.-C. Effect of Heat Treatment Conditions on the Mechanical Properties and Machinability of Ti15SnxCu Alloys. Mater. Res. 2020, 23, 20190574. [Google Scholar] [CrossRef]
- Campo, K.; Lopes, E.; Parrish, C.; Caram, R. Rapid quenching of semisolid Ti-Cu alloys: Insights into globular microstructure formation and coarsening. Acta Mater. 2017, 139, 86–95. [Google Scholar] [CrossRef]
- Xu, Y.; Jiang, J.; Yang, Z.; Zhao, Q.; Chen, Y.; Zhao, Y. The Effect of Copper Content on the Mechanical and Tribological Properties of Hypo-, Hyper- and Eutectoid Ti-Cu Alloys. Materials 2020, 13, 3411. [Google Scholar] [CrossRef] [PubMed]
- Liu, J.; Li, F.; Liu, C.; Wang, H.; Ren, B.; Yang, K.; Zhang, E. Effect of Cu content on the antibacterial activity of titanium–copper sintered alloys. Mater. Sci. Eng. C 2014, 35, 392–400. [Google Scholar] [CrossRef]
- Osório, W.R.; Cremasco, A.; Andrade, P.N.; Garcia, A.; Caram, R. Electrochemical behavior of centrifuged cast and heat treated Ti–Cu alloys for medical applications. Electrochim. Acta 2010, 55, 759–770. [Google Scholar] [CrossRef]
- Dridi, A.; Riahi, K.Z.; Somrani, S. Mechanism of apatite formation on a poorly crystallized calcium phosphate in a simulated body fluid (SBF) at 37 °C. J. Phys. Chem. Solids 2021, 156, 110122. [Google Scholar] [CrossRef]
- Yao, X.; Sun, Q.; Xiao, L.; Sun, J. Effect of Ti2Cu precipitates on mechanical behavior of Ti–2.5Cu alloy subjected to different heat treatments. J. Alloys Compd. 2009, 484, 196–202. [Google Scholar] [CrossRef]
- Donthula, H.; Vishwanadh, B.; Alam, T.; Borkar, T.; Contieri, R.; Caram, R.; Banerjee, R.; Tewari, R.; Dey, G.; Banerjee, S. Morphological evolution of transformation products and eutectoid transformation(s) in a hyper-eutectoid Ti-12 at% Cu alloy. Acta Mater. 2019, 168, 63–75. [Google Scholar] [CrossRef]
- Sun, Q.; Yu, Z.; Zhu, R.; Gu, H. Mechanical behavior and deformation mechanisms of Ti–2.5Cu alloy reinforced by nano-scale precipitates at 293 and 77 K. Mater. Sci. Eng. A 2004, 364, 159–165. [Google Scholar] [CrossRef]
- Fu, B.; Wang, H.; Zou, C.; Wei, Z. The influence of Zr content on microstructure and precipitation of silicide in as-cast near α titanium alloys. Mater. Charact. 2015, 99, 17–24. [Google Scholar] [CrossRef]
- Williams, J.C.; Taggart, R.; Polonis, D.H. An electron microscopy study of modes of intermetallic precipitation in Ti-Cu alloys. Met. Mater. Trans. A 1971, 2, 1139–1148. [Google Scholar] [CrossRef]
- Kikuchi, M.; Takahashi, M.; Okuno, O. Elastic moduli of cast Ti-Au, Ti-Ag, and Ti-Cu alloys. Dent. Mater. 2006, 22, 641–646. [Google Scholar] [CrossRef] [PubMed]
- Gudić, S.; Vrsalović, L.; Kvrgić, D.; Nagode, A. Electrochemical Behaviour of Ti and Ti-6Al-4V Alloy in Phosphate Buffered Saline Solution. Materials 2021, 14, 7495. [Google Scholar] [CrossRef] [PubMed]
- Yetim, T. Corrosion Behavior of Ag-doped TiO2 Coatings on Commercially Pure Titanium in Simulated Body Fluid Solution. J. Bionic Eng. 2016, 13, 397–405. [Google Scholar] [CrossRef]
- Bao, M.; Liu, Y.; Wang, X.; Yang, L.; Li, S.; Ren, J.; Qin, G.; Zhang, E. Optimization of mechanical properties, biocorrosion properties and antibacterial properties of wrought Ti-3Cu alloy by heat treatment. Bioact. Mater. 2018, 3, 28–38. [Google Scholar] [CrossRef]
- Siddiqui, M.A.; Ullah, I.; Kolawole, S.K.; Peng, C.; Wang, J.; Ren, L.; Yang, K.; Macdonald, D.D. Study the existing form of copper (p-type oxide/segregation) and its release mechanism from the passive film of Ti-7Cu alloy. Corros. Sci. 2021, 190, 109693. [Google Scholar] [CrossRef]
- Socorro-Perdomo, P.P.; Florido-Suárez, N.R.; Mirza-Rosca, J.C.; Saceleanu, M.V. EIS Characterization of Ti Alloys in Relation to Alloying Additions of Ta. Materials 2022, 15, 476. [Google Scholar] [CrossRef]
- Singh, A.; Singh, B.P.; Wani, M.R.; Kumar, D.; Singh, J.K.; Singh, V. Effect of anodization on corrosion behaviour and biocompatibility of Cp-titanium in simulated body fluid. Bull. Mater. Sci. 2013, 36, 931–937. [Google Scholar] [CrossRef][Green Version]
- Pina, V.G.; Amigó, V.; Muñoz, A.I. Microstructural, electrochemical and tribo-electrochemical characterization of titanium-copper biomedical alloys. Corros. Sci. 2016, 109, 115–125. [Google Scholar] [CrossRef]
- Wang, J.; Zhang, S.; Sun, Z.; Wang, H.; Ren, L.; Yang, K. Optimization of mechanical property, antibacterial property and corrosion resistance of Ti-Cu alloy for dental implant. J. Mater. Sci. Technol. 2019, 35, 2336–2344. [Google Scholar] [CrossRef]
- Zhang, E.; Ren, J.; Li, S.; Yang, L.; Qin, G. Optimization of mechanical properties, biocorrosion properties and antibacterial properties of as-cast Ti–Cu alloys. Biomed. Mater. 2016, 11, 065001. [Google Scholar] [CrossRef] [PubMed]
Publisher’s Note: MDPI stays neutral with regard to jurisdictional claims in published maps and institutional affiliations. |
© 2022 by the authors. Licensee MDPI, Basel, Switzerland. This article is an open access article distributed under the terms and conditions of the Creative Commons Attribution (CC BY) license (https://creativecommons.org/licenses/by/4.0/).