
Study of the Microstructure and Corrosion Properties of a Ni-Based Alloy Coating Deposited onto the Surface of Ductile Cast Iron Using High-Speed Laser Cladding

 , ,
, ,
Abstract
:1. Introduction
2. Materials and Methods
2.1. Material
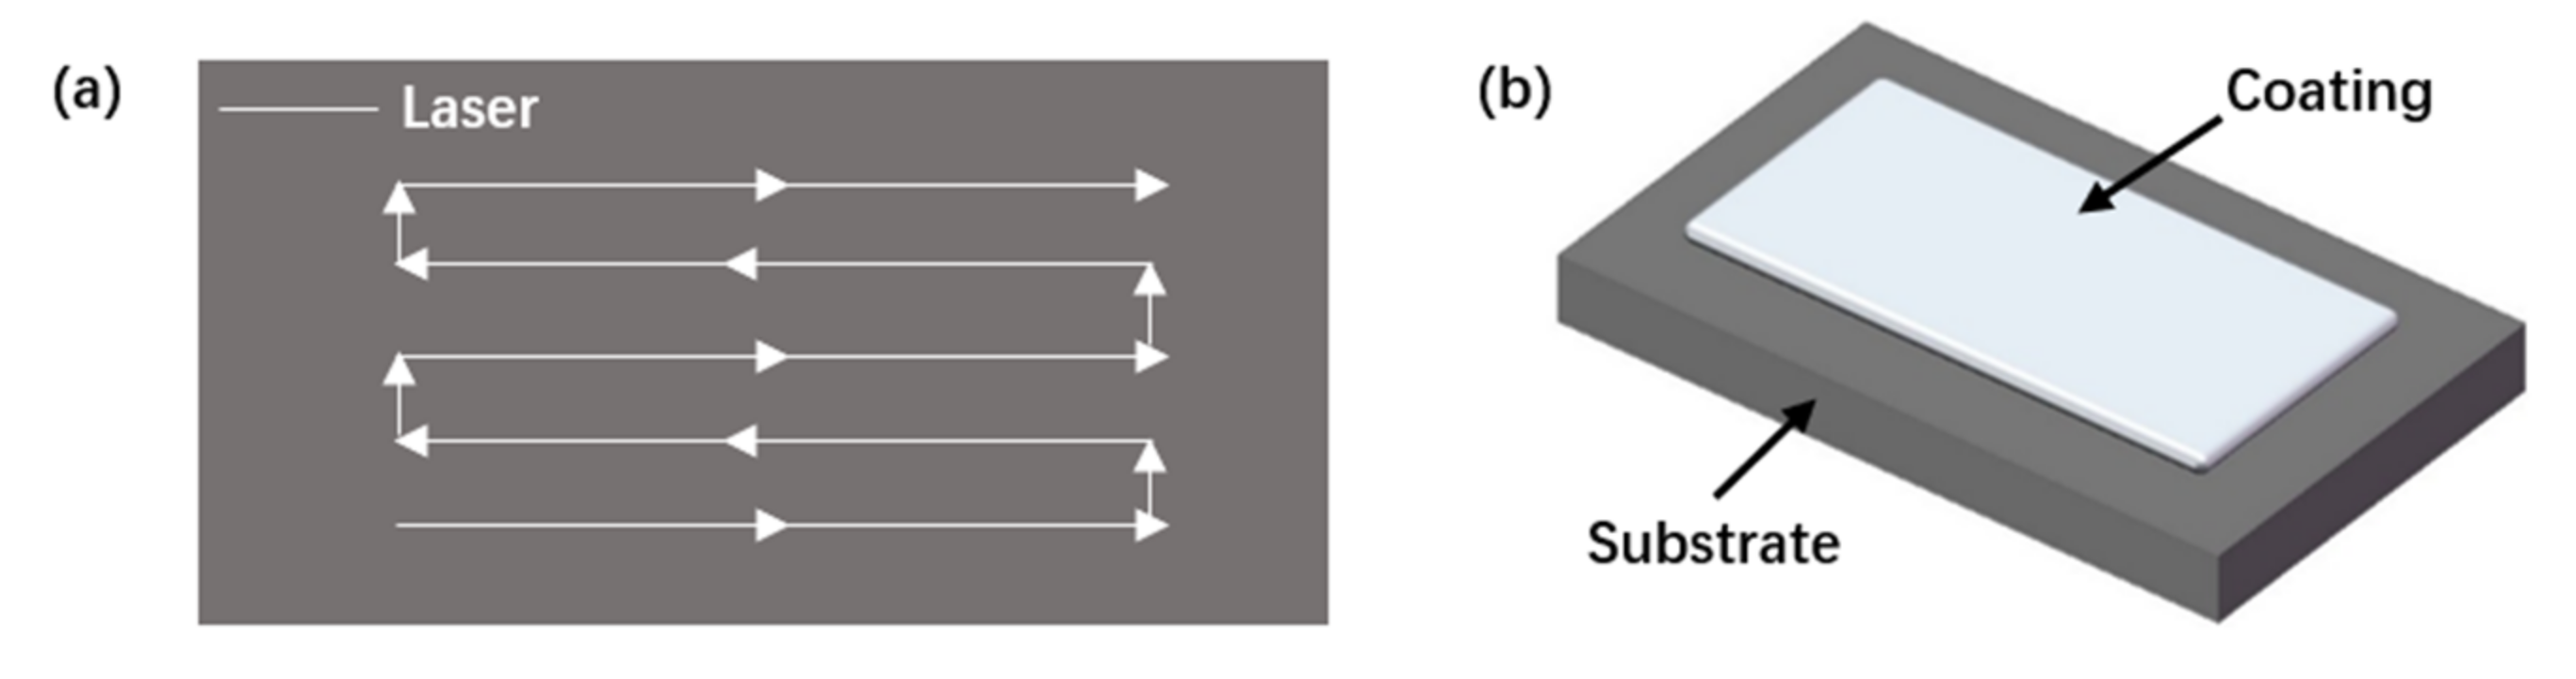
2.2. Laser Cladding Process
2.3. Test Method
3. Results and Discussion
3.1. XRD Phase Analysis
3.2. Microstructures
3.2.1. Surface Microstructure
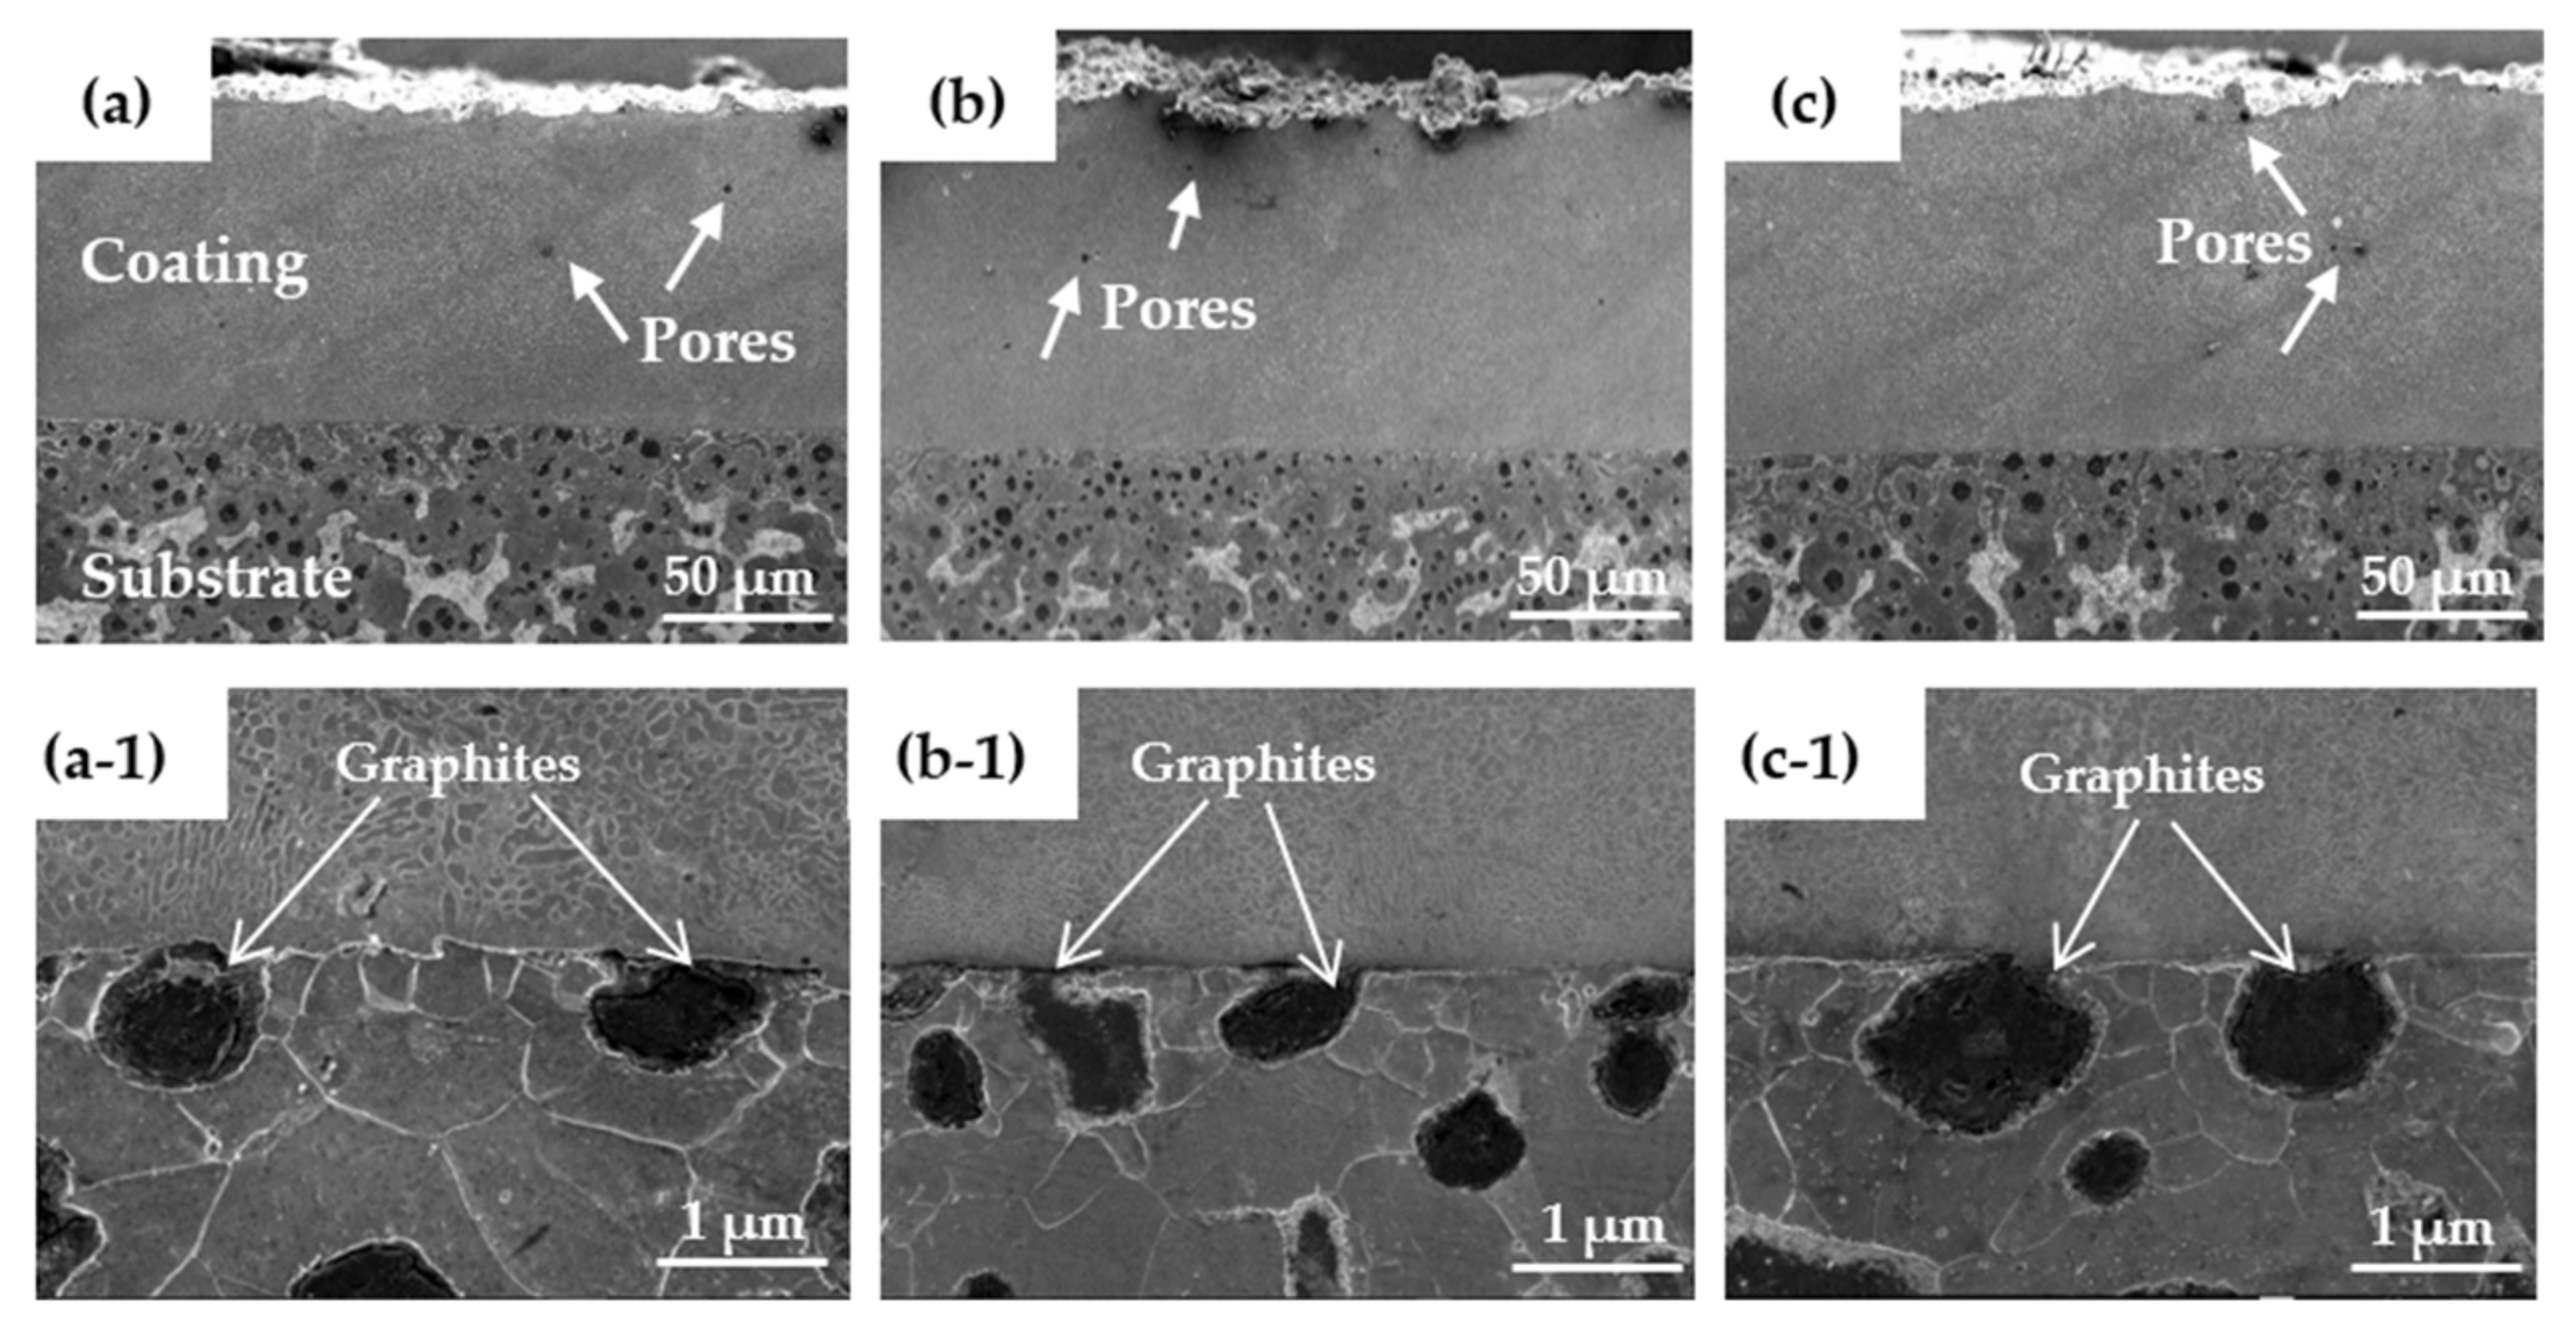
3.2.2. Section Microstructure
3.3. Electrochemical Corrosion
3.4. Corrosion Mechanism
4. Conclusions
- (1)
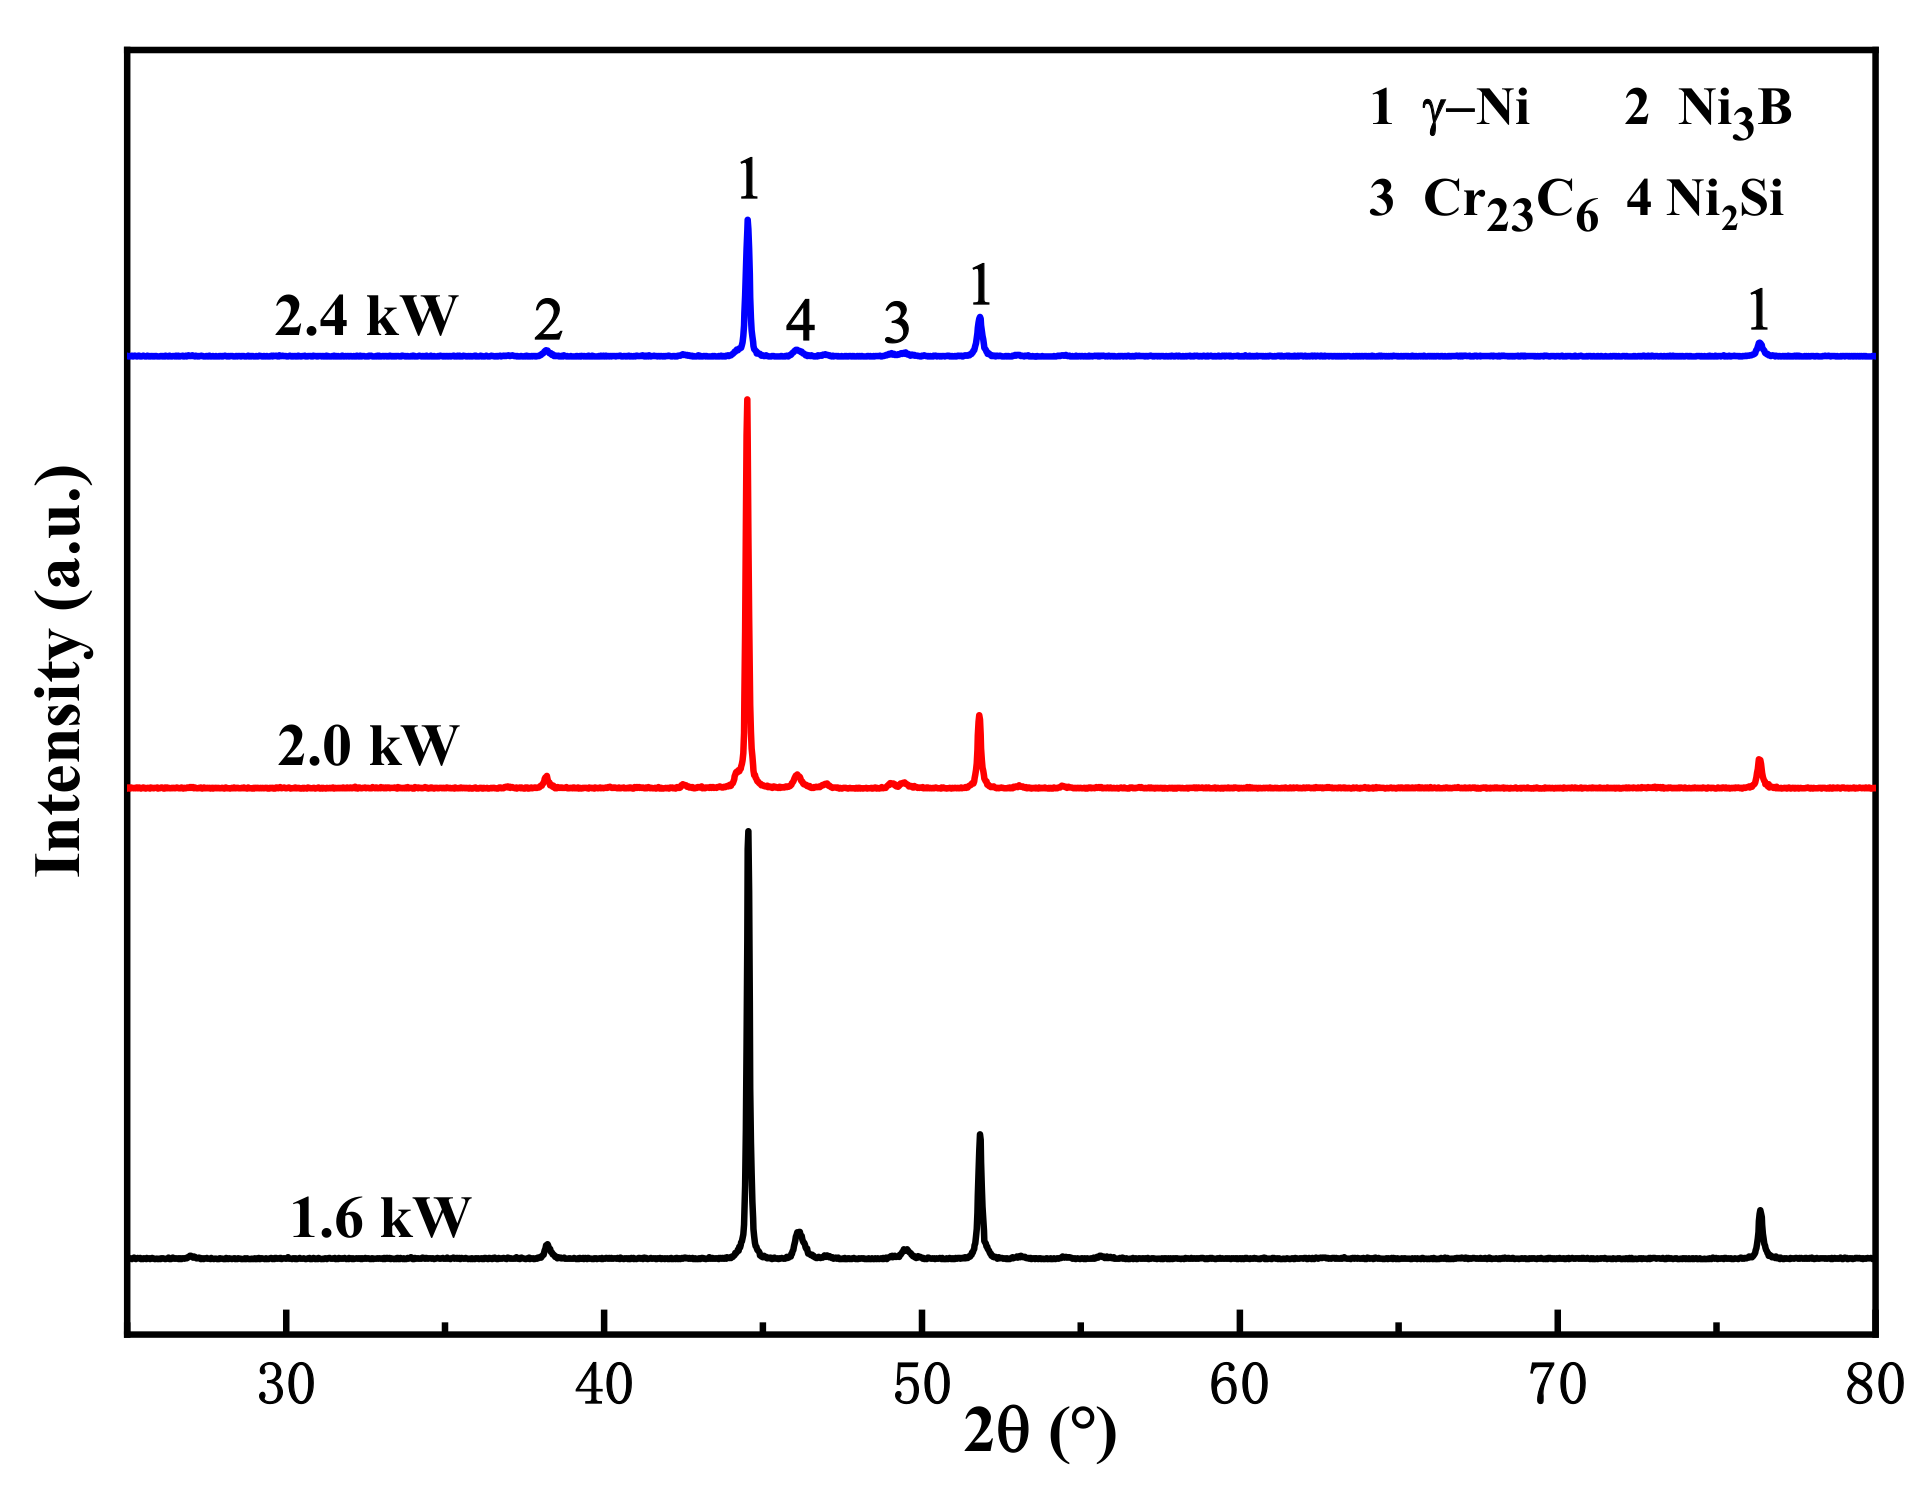
- The coatings were mainly composed of solid solution γ-Ni, boride Ni3B, silicide Ni2Si, and carbide Cr23C6 phases, which did not change with the variation in the laser power used to prepare the coatings.
- (2)
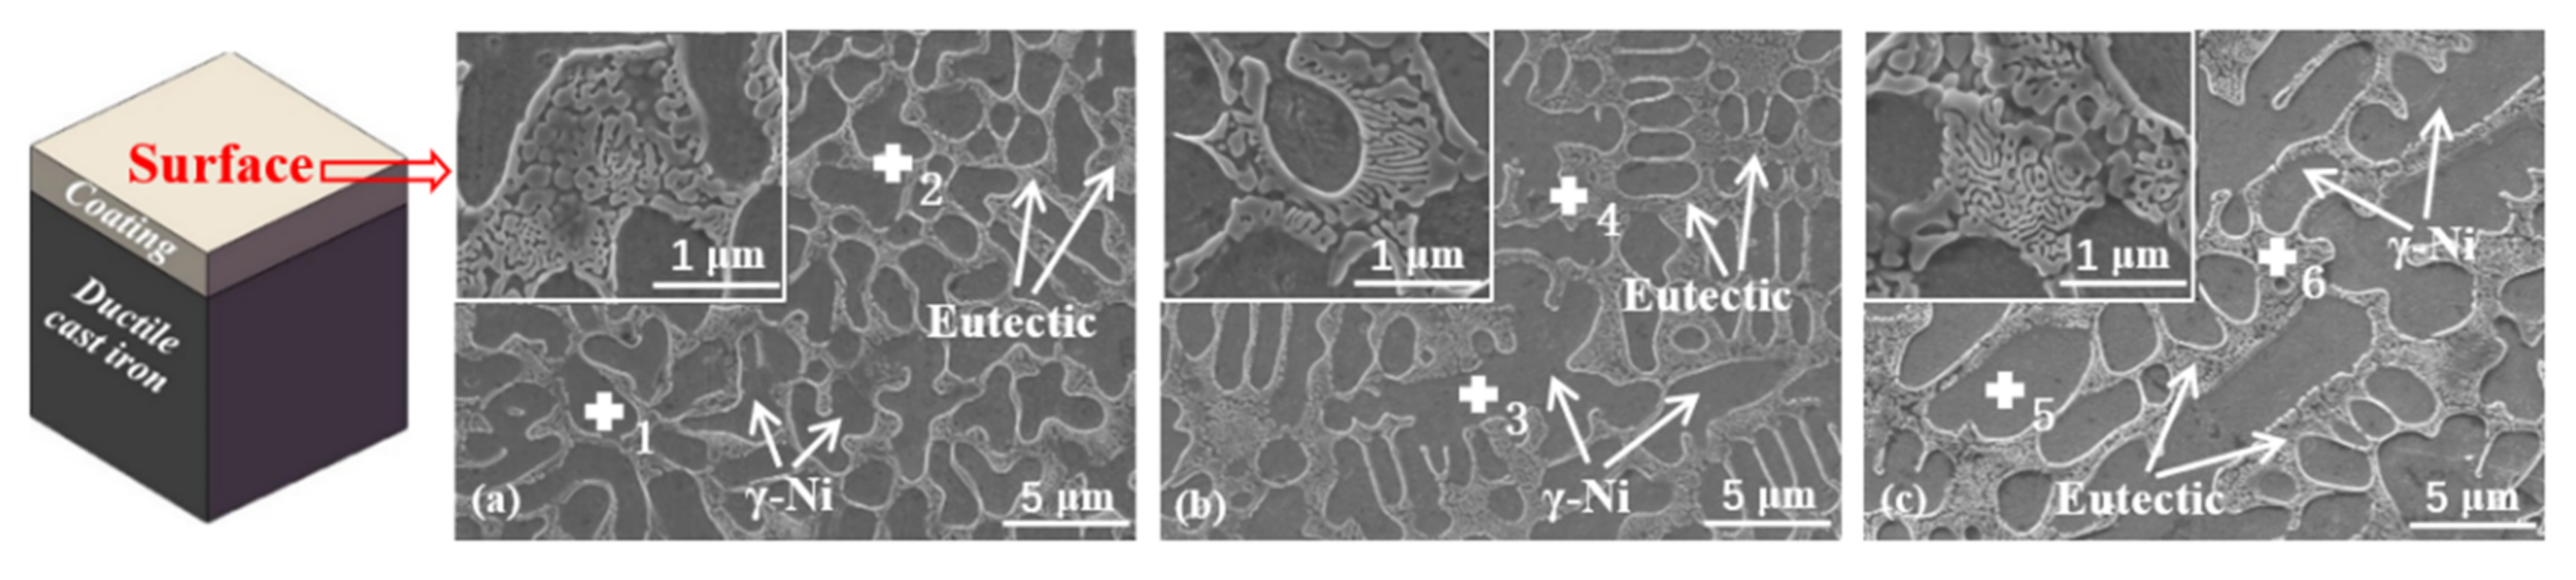
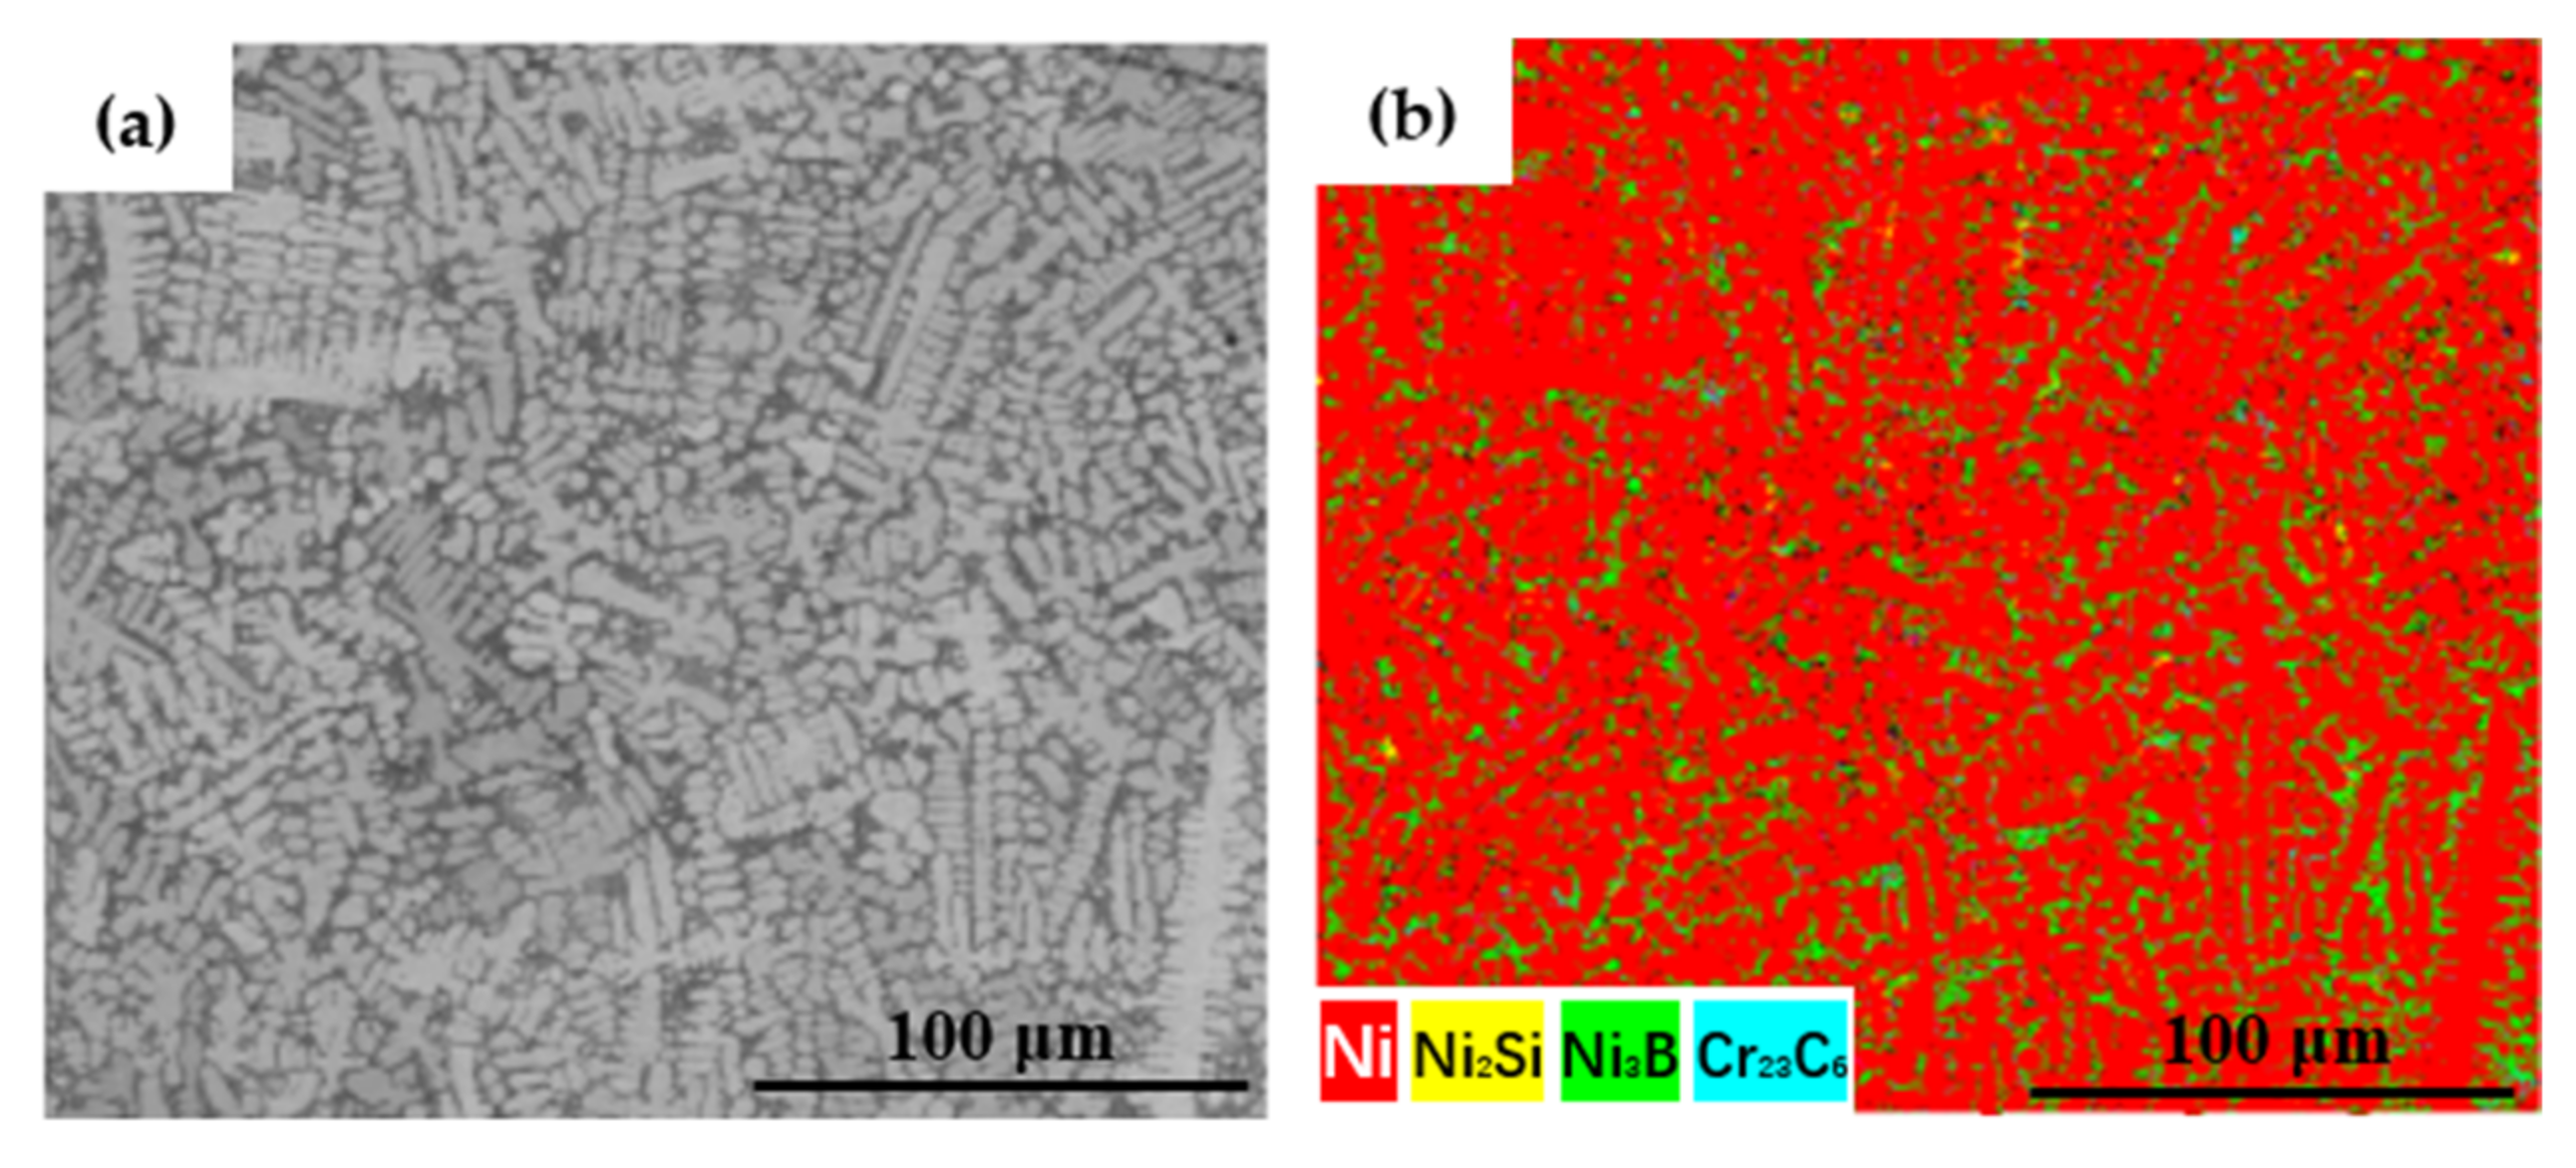
- The microstructure of the cladding layer crystallized in the shape of dendrites and was mainly composed of a bright white eutectic structure and a dark-gray primary solid solution phase. The eutectic structure mainly occurred between dendrites, and the primary solid solution mainly appeared in the dendrites. With an increase in the laser power, the degree of segregation in the coating decreased, sufficient melting between elements was achieved, and the composition became more uniform. As the laser power increased, more energy was injected into the cladding layer, allowing adequate growth of tissue and a continuous increase in the size of dendrites. The coatings prepared using three levels of laser power showed little change and less dilution at the interface area.
- (3)
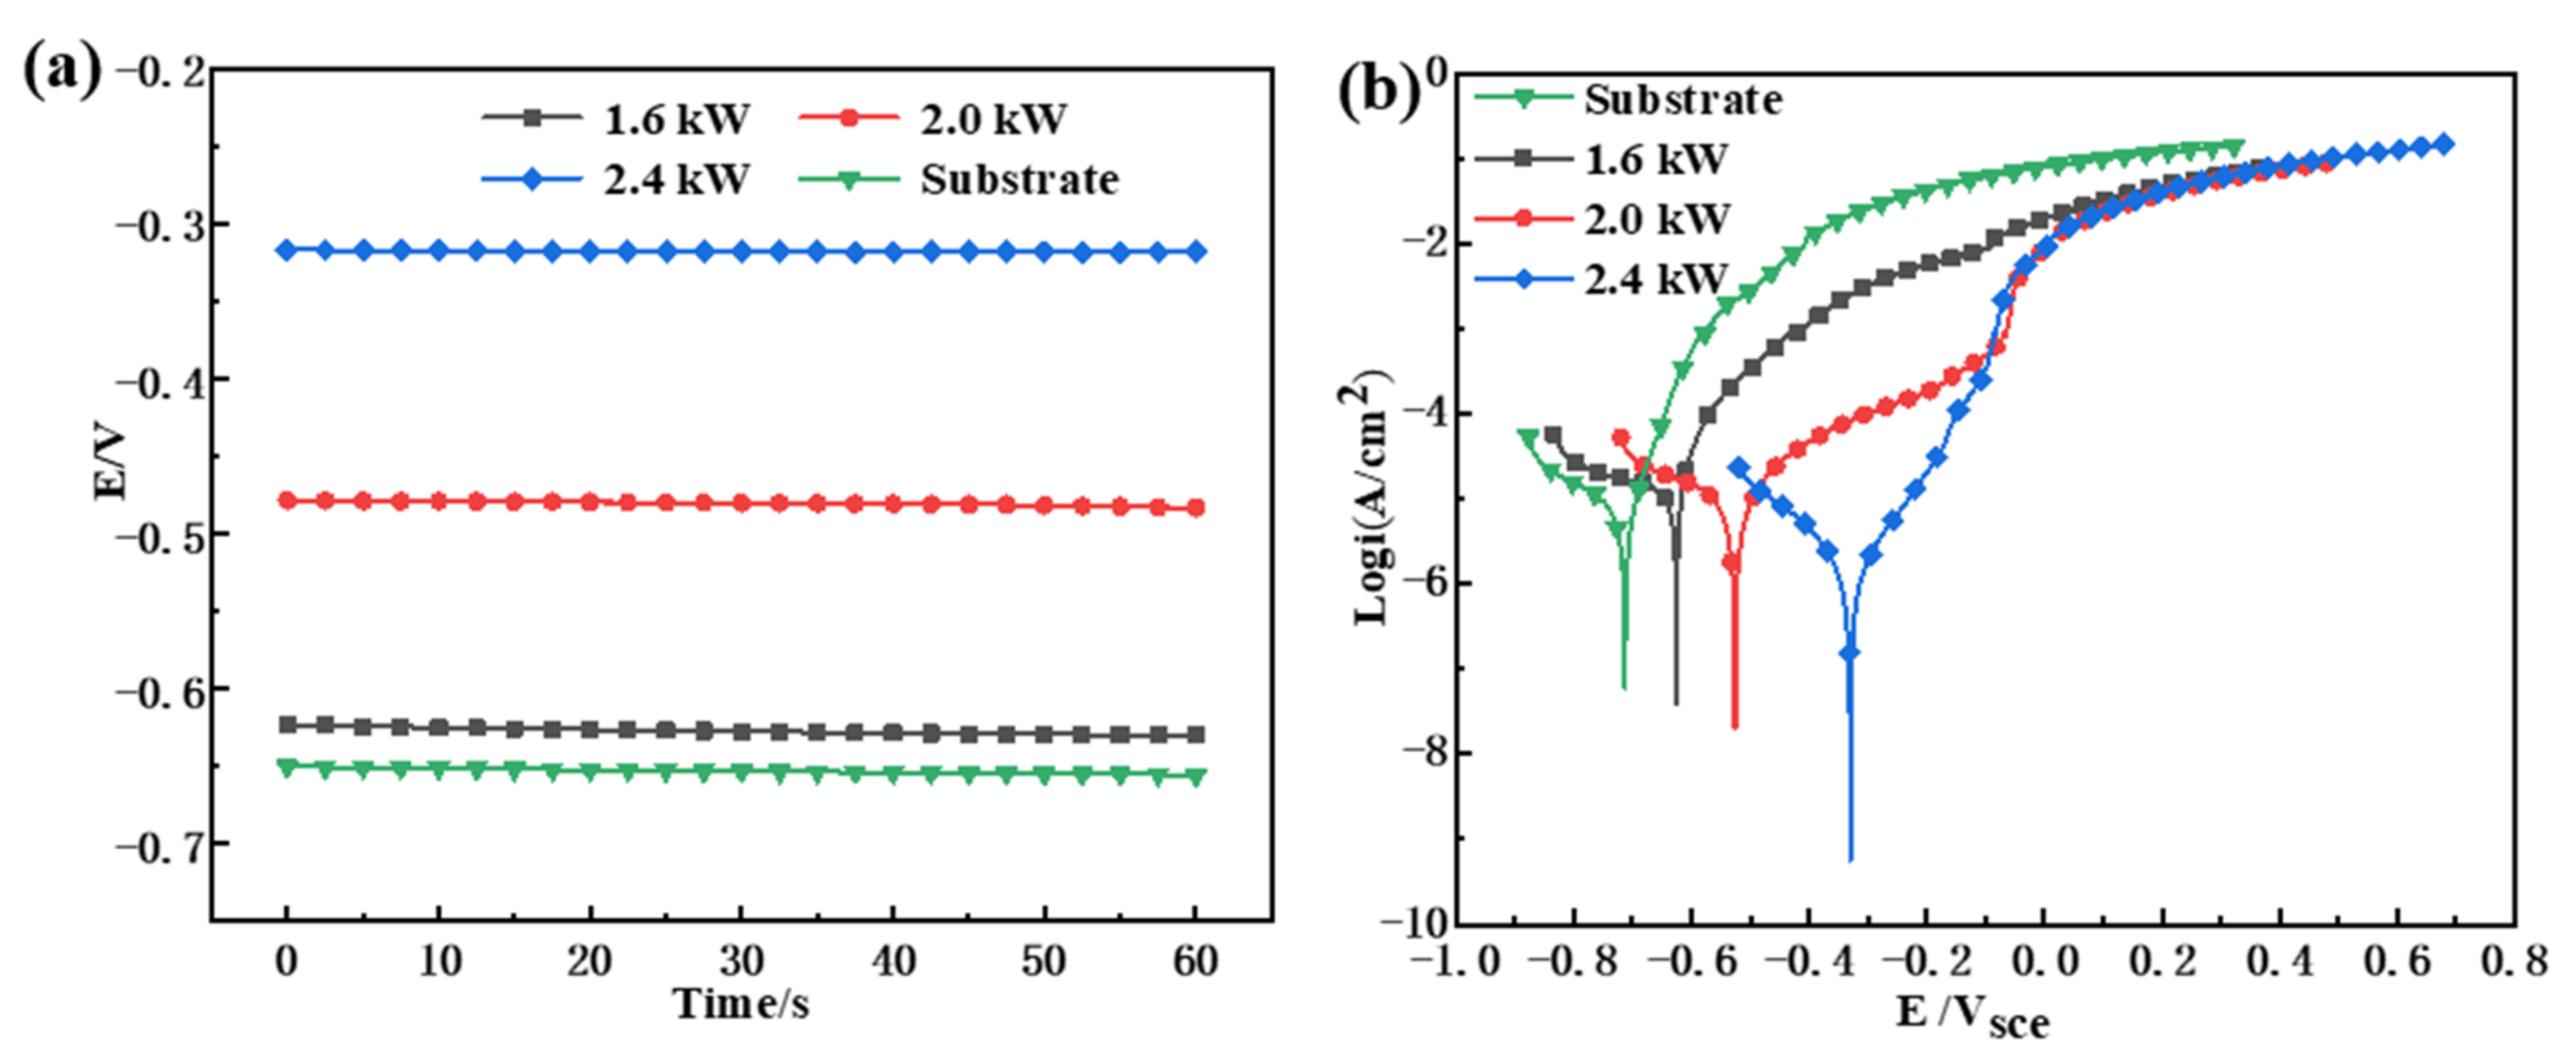
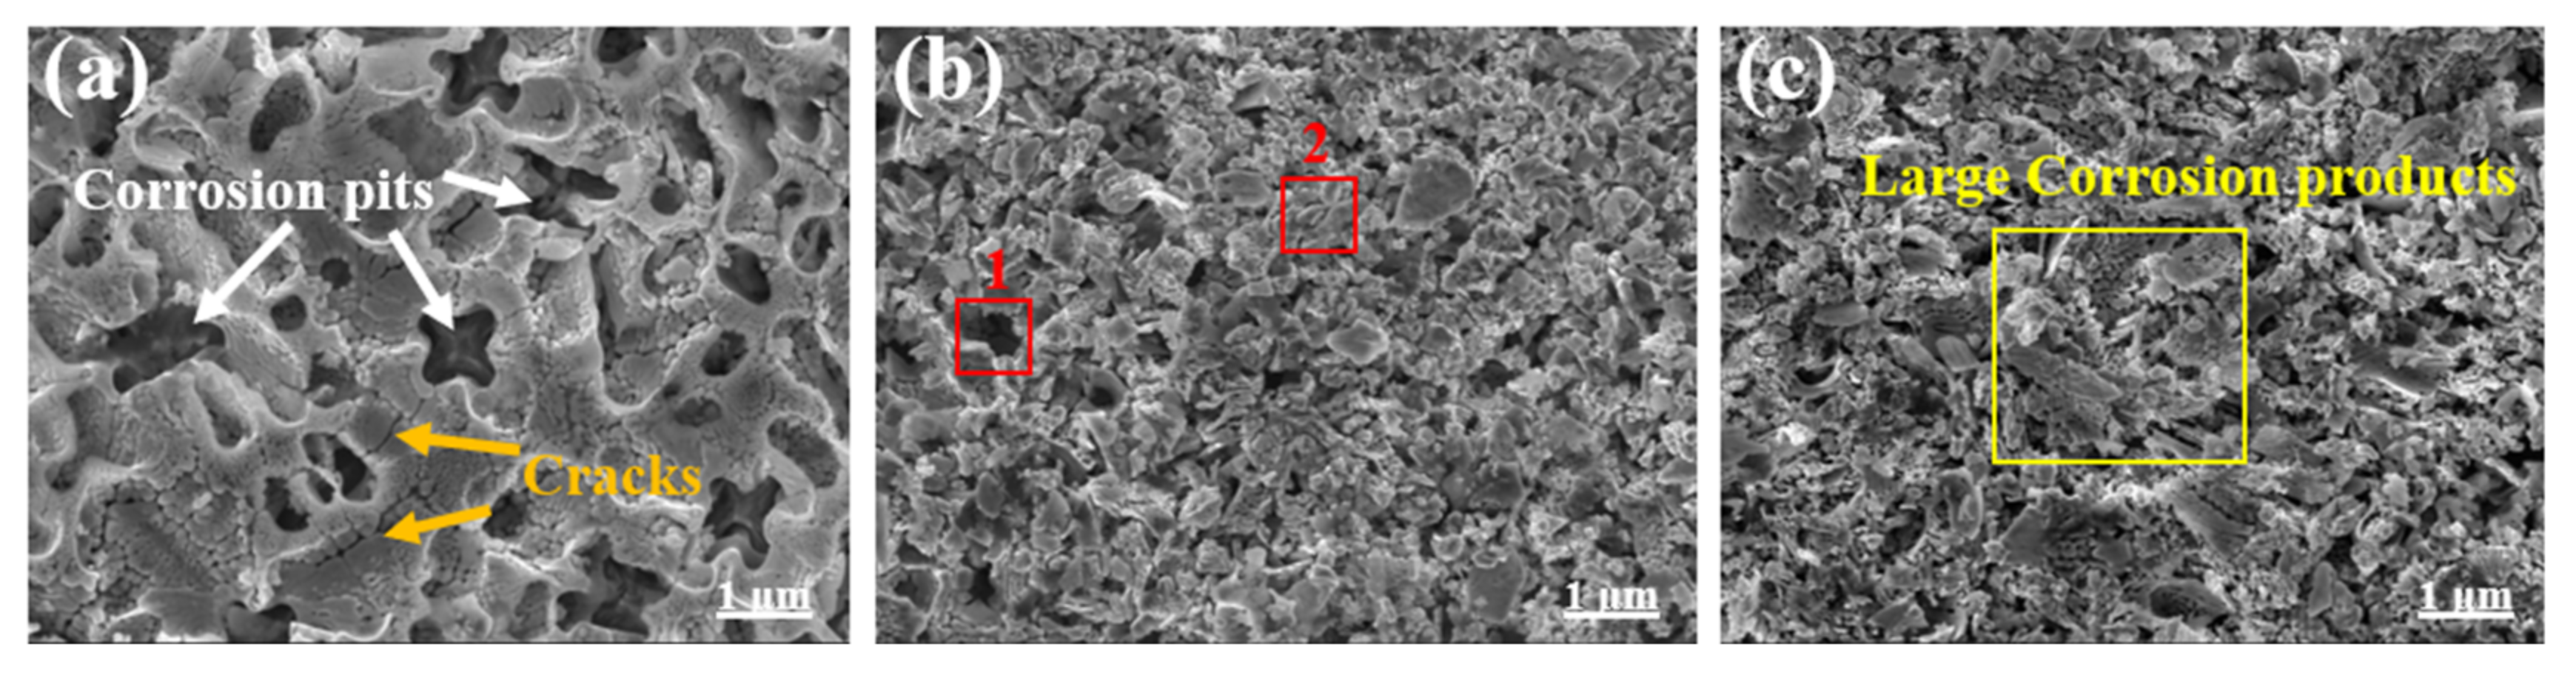
- The self-corrosion potential of the 2.4 kW coating was −335.7 mV, and the annual average corrosion rate was 0.00699 mm·a−1. The coating fabricated at 2.4 kW had the highest corrosion resistance compared with the cladding layers prepared using the two other laser power levels. The surface corrosion of the 2.4 kW coating was mainly in the form of sizeable continuous structures, with a light degree of corrosion and superior corrosion resistance.
Author Contributions
Funding
Institutional Review Board Statement
Informed Consent Statement
Data Availability Statement
Acknowledgments
Conflicts of Interest
References
- José, A.; Wisley, F.; Wilson, L.; Álisson, R. Machinability of rectangular bars of nodular cast iron produced by continuous casting. Int. J. Adv. Manuf. Technol. 2018, 98, 2505–2517. [Google Scholar]
- Nadal, R.; Roca, A.; Fals, H.; Zoqui, E. Mechanical properties of thixoformed hypoeutectic gray cast iron. J. Mater. Process. Technol. 2015, 226, 146–156. [Google Scholar] [CrossRef]
- Erić, O.; Rajnović, D.; Zec, S.; Sidjanin, L.; Jovanović, M. Microstructure and fracture of alloyed austempered ductile iron. Mater. Charact. 2006, 57, 211–217. [Google Scholar] [CrossRef]
- Abboud, J.; Benyounis, K.; Olabi, A.; Hashmi, M. Laser surface treatments of iron-based substrates for automotive application. J. Mater. Process. Technol. 2007, 182, 427–431. [Google Scholar] [CrossRef]
- Dong, S.; Yan, S.; Xu, B.; Wang, Y.; Fang, J.; Ren, W. Microstructure and Mechanical Property of NiCuFeBSi Alloy with Laser Cladding on Substrate of Gray Cast Irons. Chin. J. Lasers 2012, 39, 73–79. [Google Scholar]
- Zhang, K.; Han, H.; Yang, C.; Cui, P.; Li, Z.; Yang, H. Microstructures and Properties of Hastelloy C276 on Cast Iron Surface by Laser Cladding. Surf. Technol. 2021, 50, 109–115. [Google Scholar]
- Yang, D.; Ning, Y.; Zhao, Y.; Zhu, G.; Xu, X. Influence of Processing Parameter on Microstructure Wear-resistance and Corrosion-resistance of Laser Cladding Ni-based Alloy on the Surface of 304 Stainless Steel. Mater. Rep. 2017, 31, 133–140. [Google Scholar]
- Nie, J.; Li, Y.; Liu, S.; Zhang, H.; Duan, R.; Wei, S.; Cai, J.; Guan, Q. Evolution of microstructure of Al particle-reinforced NiCoCrAlY coatings fabricated on 304 stainless steel using laser cladding. Mater. Lett. 2021, 289, 129431. [Google Scholar] [CrossRef]
- Li, Y.; Dong, S.; He, P.; Yan, S.; Li, E.; Liu, X.; Xu, B. Microstructure characteristics and mechanical properties of new-type FeNiCr laser cladding alloy coating on nodular cast iron. J. Mater. Process. Technol. 2019, 269, 163–171. [Google Scholar] [CrossRef]
- Liu, Y.; Weng, F.; Bi, G.; Chew, Y.; Liu, S.; Ma, G.; Moon, S. Characterization of wear properties of the functionally graded material deposited on cast iron by laser-aided additive manufacturing. Int. J. Adv. Manuf. Technol. 2019, 105, 4097–4105. [Google Scholar] [CrossRef]
- Zhu, L.; Liu, Y.; Li, Z.; Zhou, L.; Li, Y.; Xiong, A. Microtructure and properties of Cu-Ti-Ni composite coatings on gray cast iron fabricated by laser cladding. Opt. Laser Technol. 2020, 122, 105879. [Google Scholar] [CrossRef]
- Sun, G.; Zhou, R.; Li, P.; Feng, A.; Zhang, Y. Laser surface alloying of C-B-W-Cr powders on nodular cast iron rolls. Surf. Coat. Technol. 2011, 205, 2747–2754. [Google Scholar] [CrossRef]
- Zhang, D.; Li, Z.; Fan, H.; Rui, H.; Gao, F. Microstructure and Tribological Properties of Fe-Based Laser Cladding Layer on Nodular Cast Iron for Surface Remanufacturing. Coatings 2021, 11, 974. [Google Scholar] [CrossRef]
- Li, Y.; Dong, S.; Liu, X.; He, P.; Ren, X.; Yan, S.; Xu, B. Interface phase evolution during laser cladding of Ni-Cu alloy on nodular cast iron by powder pre-placed method. Opt. Laser Technol. 2021, 135, 106684. [Google Scholar] [CrossRef]
- Li, Y.; Dong, S.; Yan, S.; He, P.; Xu, B. Phase evolution of ductile iron during laser cladding processing. Surf. Coat. Technol. 2018, 339, 37–47. [Google Scholar] [CrossRef]
- Pouranvari, M. On the weldability of grey cast iron using nickel based filler metal. Mater. Des. 2010, 31, 3253–3258. [Google Scholar] [CrossRef]
- Sun, Y.; Hao, M. Statistical analysis and optimization of process parameters in Ti6Al4V laser cladding using Nd:YAG laser. Opt. Lasers Eng. 2012, 50, 985–995. [Google Scholar] [CrossRef]
- Yuan, W.; Li, R.; Chen, Z.; Gu, J.; Tian, Y. A comparative study on microstructure and properties of traditional laser cladding and high-speed laser cladding of Ni45 alloy coatings. Surf. Coat. Technol. 2020, 405, 126582. [Google Scholar] [CrossRef]
- Yang, J.; Bai, B.; Ke, H.; Cui, Z.; Liu, Z.; Zhou, Z.; Xu, H.; Xiao, J.; Liu, Q.; Li, H. Effect of metallurgical behavior on microstructure and properties of FeCrMoMn coatings prepared by high-speed laser cladding. Opt. Laser Technol. 2021, 144, 107431. [Google Scholar] [CrossRef]
- Hong, C.; Gu, D.; Dai, D.; Cao, S.; Alkhayat, M.; Jia, Q.; Gasser, A.; Weisheit, A.; Kelbassa, I.; Zhong, M.; et al. High-temperature oxidation performance and its mechanism of TiC/Inconel 625 composites prepared by laser metal deposition additive manufacturing. J. Laser Appl. 2014, 27, 285–293. [Google Scholar]
- Dyshel, D.; Yeremina, L.; Tel’nikov, E.; Rud’, B. Compositions without noble metals for thick film gas sensor heater fabrication. Sens. Actuators B Chem. 1996, 35, 244–246. [Google Scholar] [CrossRef]
- Behzad, H.; Ghulam, H.; Mohammed, B. Development of a TiC/Cr23C6 Composite Coating on a 304 Stainless Steel Substrate through a Tungsten Inert Gas Process. Coatings 2017, 7, 80. [Google Scholar]
- Bowen, C.R.; Derby, B. Selfpropagating high temperature synthesis of ceramic materials. Br. Ceram. Trans. 1997, 96, 25–31. [Google Scholar]
- Jiao, X.; Wang, J.; Wang, C.; Gong, Z.; Pang, X.; Xiong, S. Effect of laser scanning speed on microstructure and wear properties of T15M cladding coating fabricated by laser cladding technology. Opt. Lasers Eng. 2018, 110, 163–171. [Google Scholar] [CrossRef]
- Zhou, Y.; Chen, S.; Chen, X.; Liang, J.; Liu, C.; Wang, M. The effect of laser scanning speed on microstructural evolution during direct laser deposition 12CrNi2 alloy steel. Opt. Laser Technol. 2020, 125, 106041. [Google Scholar] [CrossRef]
- Nie, M.; Zhang, S.; Wang, Z.; Zhang, C.; Chen, H.; Chen, J. Effect of laser power on microstructure and interfacial bonding strength of laser cladding 17-4PH stainless steel coatings. Mater. Chem. Phys. 2022, 275, 125236. [Google Scholar] [CrossRef]
- Irvine, D.; Marzari, N. Fundamentals of Materials Science; Springer: Berlin/Heidelberg, Germany, 2005; p. 24. [Google Scholar]
- Guo, Y.; Li, Z.; Hosseini, S.; Wang, M. Effect of chemical segregation on nanobainitic transformation in laser cladded coatings. Mater. Des. 2015, 88, 781–789. [Google Scholar] [CrossRef]
- He, X.; Kong, D.J.; Song, R.G. Influence of power on microstructure and properties of Laser Cladding Al-Tic-CeO2 composite coatings. Rare Met. Mater. Eng. 2019, 48, 3634–3642. [Google Scholar]
- Wang, L.; Huang, Y.; Yuan, Y.; Jia, C.; Yang, L. Microstructure, wear and oxidation resistance of Al-doped Ti–Si3N4 coatings by laser cladding. Surf. Coat. Technol. 2022, 429, 127942. [Google Scholar] [CrossRef]
- Hu, G.; Yang, Y.; Qi, K.; Lu, X.; Li, J. Investigation of the Microstructure and Properties of NiCrBSi Coating Obtained by Laser Cladding with Different Process Parameters. Trans. Indian Inst. Met. 2020, 73, 2623–2634. [Google Scholar] [CrossRef]
- Arias-González, F.; Comesaña, R.; Penide, J.; Lusquiños, F.; Quintero, F.; Riveiro, A.; Boutinguiza, M.; Pou, J. Fiber laser cladding of nickel-based alloy on cast iron. Appl. Surf. Sci. 2016, 374, 197–205. [Google Scholar] [CrossRef]
- Tong, W.; Zhao, Z.; Zhang, X.; Wang, J.; Guo, X.; Duan, X.; Liu, Y. Microstructure and Properties of TiC/Co-Based Alloy by Laser Cladding on the Surface of Nodular Graphite Cast Iron. Acta Metall. Sin. 2017, 53, 472–478. [Google Scholar]
- Shu, F.; Wang, B.; Zhang, S.; Sui, S.; Zhang, X.; Zhao, J. Microstructure, High-Temperature Wear Resistance, and Corrosion Resistance of Laser Cladded Co-Based Coating. J. Mater. Eng. Perform. 2021, 30, 3370–3380. [Google Scholar] [CrossRef]
- Cheng, S.; Tian, J.; Chen, S.; Lei, Y.; Chang, X.; Liu, T.; Yin, Y. Microbially influenced corrosion of stainless steel by marine bacterium Vibrio natriegens: (I) Corrosion behavior. Mater. Sci. Eng. C 2008, 29, 751–755. [Google Scholar] [CrossRef]
- Wong, P.; Kwok, C.; Man, H.; Cheng, F. Laser surface alloying (LSA) of copper for electrical erosion resistance. In Laser Surface Modification of Alloys for Corrosion and Erosion Resistance; Woodhead Publishing: Sawston, UK, 2012; pp. 288–319. [Google Scholar]
- Zhao, W.; Kong, D. Effects of laser power on immersion corrosion and electrochemical corrosion performances of laser thermal sprayed amorphous AlFeSi coatings. Appl. Surf. Sci. 2019, 481, 161–173. [Google Scholar] [CrossRef]
- Feng, K.; Zhang, Y.; Li, Z.; Yao, C.; Yao, L.; Fan, C. Corrosion properties of laser cladded CrCoNi medium entropy alloy coating. Surf. Coat. Technol. 2020, 397, 126004. [Google Scholar] [CrossRef]
- Prakash, M.; Shekhar, S.; Moon, A.; Mondal, K. Effect of machining configuration on the corrosion of mild steel. J. Mater. Process. Technol. 2015, 219, 70–83. [Google Scholar] [CrossRef]
- Zhao, Z.; Chen, J.; Guo, S.; Tan, H.; Lin, X.; Huang, W. Influence of α/β interface phase on the tensile properties of laser cladding deposited Ti–6Al–4V titanium alloy. J. Mater. Sci. Technol. 2017, 33, 675–681. [Google Scholar] [CrossRef]


| Samples | C | Mn | B | Cr | Si | P | S | Fe | Ni |
|---|---|---|---|---|---|---|---|---|---|
| Ductile cast iron | 3.72 | 0.20 | ― | 0.12 | 2.67 | 0.05 | 0.02 | Bal | 0.47 |
| Ni-based alloy powder | 0.08 | ― | 1.36 | 1.42 | 2.42 | ― | ― | 0.41 | Bal |
| Laser Power (kW) | Powder Feeding (r·min−1) | Scanning Speed/ (m·s−1) | Shielding Gas Flow/(L·s−1) | Carrier Gas Flow /(L·s−1) | Overlap Rate (%) | LED/ (J·mm−3) | |
|---|---|---|---|---|---|---|---|
| 1.6 2.0 2.4 | 2.5 | 0.03 | 0.2 | 0.13 | 66.7 | 10.86 13.58 16.30 |
| Laser Power (kW) | EDS Point | Composition (at.%) | |||||
|---|---|---|---|---|---|---|---|
| B | C | Si | Cr | Fe | Ni | ||
| 1.6 | 1 | 1.4 | 1.5 | 2.4 | 0.6 | 0.3 | 93.8 |
| 2 | 10.4 | 2.8 | 1.6 | 0.4 | 0.1 | 84.7 | |
| 2.0 | 3 | 2.0 | 1.8 | 2.3 | 0.5 | 0.2 | 93.2 |
| 4 | 6.9 | 2.1 | 1.6 | 0.3 | 0.1 | 89.0 | |
| 2.4 | 5 | 1.4 | 7.3 | 2.4 | 0.1 | 0.3 | 88.5 |
| 6 | 6.9 | 6.6 | 1.1 | 0.3 | 0.3 | 84.8 | |
| Samples | Ecorr (mV/SCE) | icorr (µA/cm2) | ia (µA/cm2) | ic (µA/cm2) | Corrosion Rate (mm·y−1) |
|---|---|---|---|---|---|
| 1.6 kW | −625.7 | 8.0440 | 12.039 | 8.273 | 0.12999 |
| 2.0 kW | −526.5 | 3.1560 | 3.634 | 4.050 | 0.03924 |
| 2.4 kW | −335.7 | 0.6763 | 0.647 | 0.726 | 0.00699 |
| Substrate | −713.5 | 8.535 | 13.265 | 8.965 | 0.46062 |
| Laser Power (kW) | R1 (Ω·cm2) | R2 (Ω·cm2) | CPE1 | |
|---|---|---|---|---|
| Q0 (sn/Ω·cm2) | n | |||
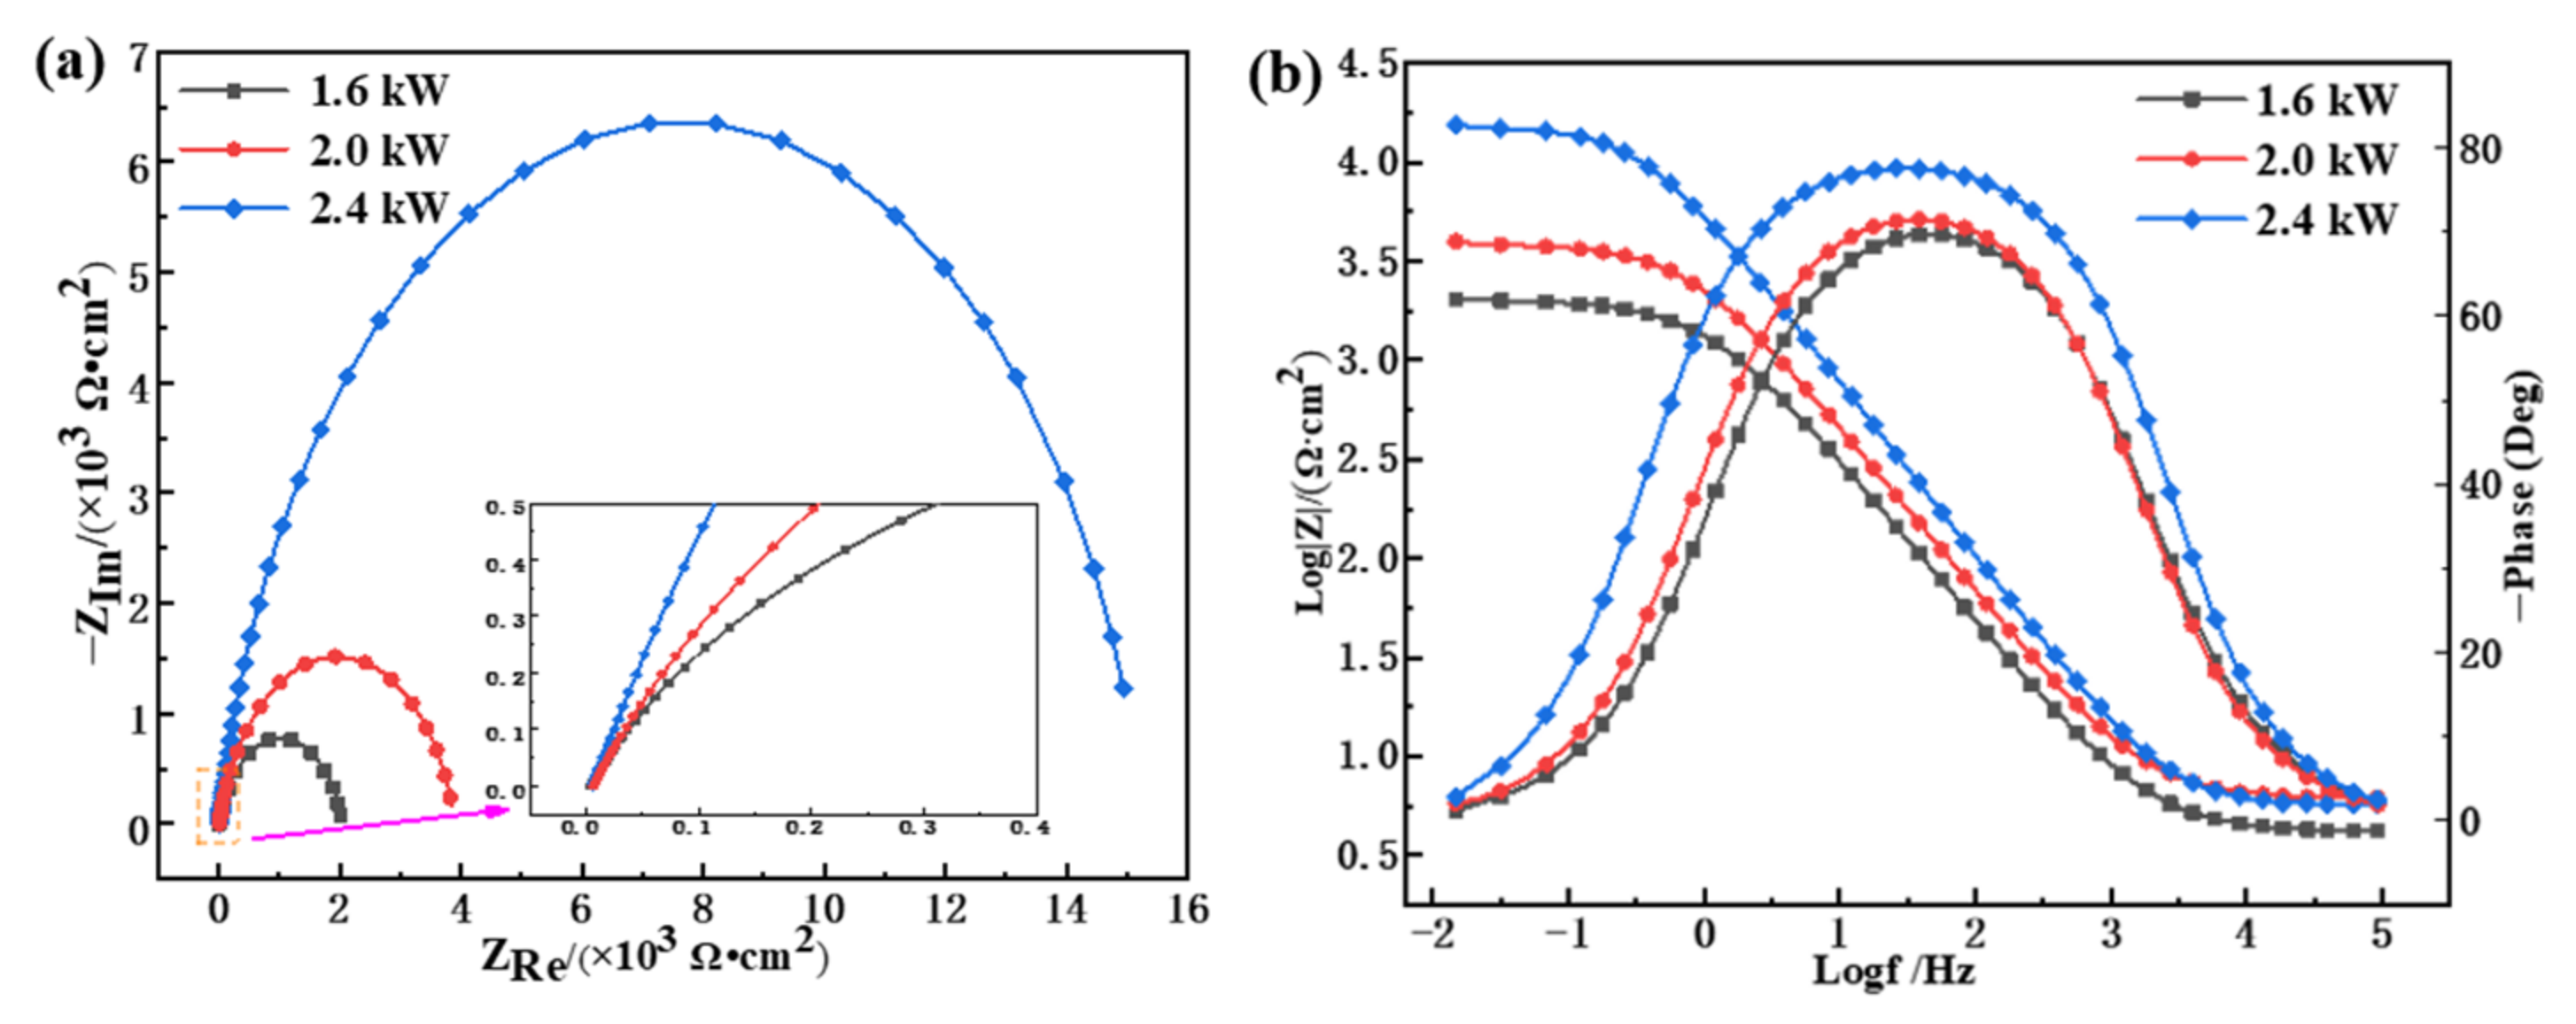
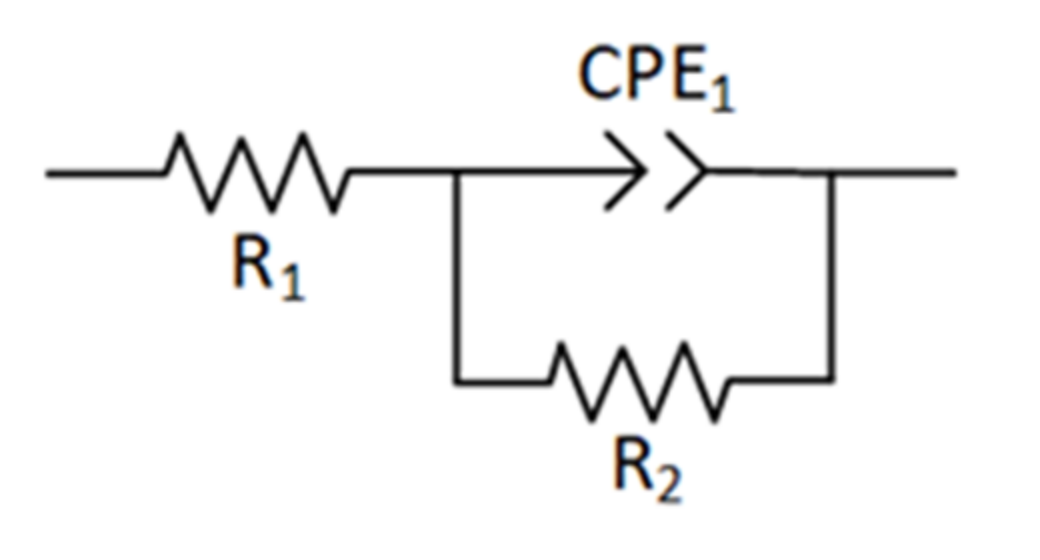
| 1.6 | 4.136 | 2029 | 9.9965 × 10⁻⁵ | 0.829 |
| 2.0 | 6.084 | 3910 | 6.5416 × 10⁻⁵ | 0.842 |
| 2.4 | 5.619 | 15268 | 3.2613 × 10⁻⁵ | 0.885 |
| EDS Point | Composition (at. %) | ||||||
|---|---|---|---|---|---|---|---|
| B | C | Si | Cr | Fe | Ni | O | |
| 1 | 1.1 | 0.9 | 0.3 | 0.2 | 0.2 | 96.8 | 0.4 |
| 2 | 6.8 | 3.4 | 0.2 | 0.1 | 0.2 | 88.8 | 0.4 |
| Samples (Coating) | 1.6 kW | 2.0 kW | 2.4 kW |
|---|---|---|---|
| Corrosion degree | Severe | Average | Light |
| Corrosion morphology | Pits and corrosion holes | Clustered and broken granular | Block-like continuous structure |
| Results of corrosion | Severe segregation with atom-rich and atom-poor regions | Segregation less than at 1.6 kW | Little segregation and more uniform element distribution |
Publisher’s Note: MDPI stays neutral with regard to jurisdictional claims in published maps and institutional affiliations. |
© 2022 by the authors. Licensee MDPI, Basel, Switzerland. This article is an open access article distributed under the terms and conditions of the Creative Commons Attribution (CC BY) license (https://creativecommons.org/licenses/by/4.0/).
Share and Cite
Wang, R.; Ouyang, C.; Li, Q.; Bai, Q.; Zhao, C.; Liu, Y. Study of the Microstructure and Corrosion Properties of a Ni-Based Alloy Coating Deposited onto the Surface of Ductile Cast Iron Using High-Speed Laser Cladding. Materials 2022, 15, 1643. https://doi.org/10.3390/ma15051643
Wang R, Ouyang C, Li Q, Bai Q, Zhao C, Liu Y. Study of the Microstructure and Corrosion Properties of a Ni-Based Alloy Coating Deposited onto the Surface of Ductile Cast Iron Using High-Speed Laser Cladding. Materials. 2022; 15(5):1643. https://doi.org/10.3390/ma15051643
Chicago/Turabian StyleWang, Rui, Changyao Ouyang, Qihang Li, Qiaofeng Bai, Chunjiang Zhao, and Yingliang Liu. 2022. "Study of the Microstructure and Corrosion Properties of a Ni-Based Alloy Coating Deposited onto the Surface of Ductile Cast Iron Using High-Speed Laser Cladding" Materials 15, no. 5: 1643. https://doi.org/10.3390/ma15051643
APA StyleWang, R., Ouyang, C., Li, Q., Bai, Q., Zhao, C., & Liu, Y. (2022). Study of the Microstructure and Corrosion Properties of a Ni-Based Alloy Coating Deposited onto the Surface of Ductile Cast Iron Using High-Speed Laser Cladding. Materials, 15(5), 1643. https://doi.org/10.3390/ma15051643