Abstract
Lead zirconate titanate (PZT)-based ceramics are used in numerous advanced applications, including sensors, displays, actuators, resonators, chips; however, the poor mechanical characteristics of these materials severely limits their utility in composite materials. To address this issue, we herein fabricate transgranular type PZT ceramic nanocomposites by a novel method. Thermodynamically metastable single perovskite-type Pb0.99(Zr0.52+xTi0.48)0.98Nb0.02O3+1.96x powders are prepared from a citrate precursor before both monoclinic and tetragonal ZrO2 nanoparticles ranging from 20 to 80 nm are precipitated in situ at a sintering temperature of 1260 °C. The effects of ZrO2 content on the microstructure, dielectric, and piezoelectric properties are investigated and the mechanism, by which ZrO2 toughened PZT is analyzed in detail. The ZrO2 nanoparticles underwent a tetragonal to monoclinic phase transition upon cooling. The fracture mode changed from intergranular to transgranular with increasing ZrO2 content. The incorporation of ZrO2 nanoparticles improved the mechanical and piezoelectric properties. The optimized piezoelectric properties (εT33/ε0 = 1398, tan δ = 0.024 d33 = 354 pC N−1, kp = 0.66 Qm = 78) are obtained when x = 0.02. Tc initially increased and subsequently decreased with increasing ZrO2 content. The highest Tc = (387 °C) and lowest εT33/ε0 was obtained at x = 0.01.
1. Introduction
Lead zirconate titanate (PZT)-based ceramics are commonly used in a wide variety of applications, including transformers, transducers, speakers, electric resonators, filters, memory chips, and tactile displays, among others. [1]. However, these materials typically possess poor mechanical properties, i.e., low flexural strength (σf) and low fracture toughness (KIC). This becomes particularly problematic in compositions near the morphotropic phase boundary (MPB), which exhibits excellent piezoelectric properties. High σf and KIC are highly sought after in piezoelectric ceramics for high frequency and high-power applications and for situations involving complex mechanical processing [2,3].
In the past few years, several secondary phases have been added to PZT-based ceramics to improve their mechanical properties by adding a secondary phase. These phases can be classified into three types: (1) metal particles such as Ag [4]; (2) fiber-like materials including ZrO2 fibers [5,6] and SiC whiskers [7]; (3) oxide particles such as ZrO2 [8,9], CuO [3], Bi4Ti3O12, [10] and ZnO [11]. Although these composites significantly improved the mechanical properties of PZT-based ceramics, an unavoidable deterioration in their piezoelectric properties was also observed.
Nanocomposites have recently received significant attention owing to their superior mechanical properties [12]. Reinforcement by second phase particles for PZT was put forward and studied by Niihara and his coworkers [13,14,15,16], and this is an effective way to change from inter-granular fracture to trans-granular fracture in a PZT matrix. The microstructure of a nanocomposite contains a secondary phase, in which nanoparticles are dispersed within the matrix and the grain boundaries. Zirconia nanoparticles are frequently employed as a toughening secondary phase in ceramic matrices. The phase transformation of pure zirconia from the tetragonal (t)-phase to the monoclinic (m)-phase occurs at approximately 950 °C, accompanied by a volume expansion of 4%, [17] which generates dilatational and shear stresses that impede crack propagation. Thus, the σf and KIC of nanocomposites are higher than those of monolithic ceramics [18]. Furthermore, zirconia particles below a critical size stabilize the t-phase at room temperature [19]. The existence of nano-sized metastable t-phase ZrO2 toughens and strengthens ceramics. Nanocomposites with refined microstructures are widely obtained by the in-situ formation of secondary phases.
Moreover, the macroscopic properties of ceramics are directly related to their phase composition, grain size, homogeneity, and microstructure, which are significantly influenced by the method of preparation and the precursor materials. Conventional fabrication techniques typically produce ceramics having coarse and agglomerated particles with a broad particle size distribution resulting in compositional fluctuations and structural inhomogeneities. PZT synthesized via the polymeric precursor method exhibits few compositional fluctuations and very fine monophasic particles with high surface area and crystallinity [20,21].
In this study, by citrate precursor route, Pb0.99(Zr0.54+xTi0.46)0.98Nb0.02O3+1.96x (PZTN) of which Zr/Ti near MPB was chosen to prepare PZT-based transgranular type nanocomposites embedded with both monoclinic and tetragonal ZrO2 via in-situ precipitation. The PZT/ZrO2 nanocomposites exhibited superior mechanical properties in comparison to monolithic PZT. Moreover, a modest improvement in the piezoelectric properties of PTZ/ZrO2 was achieved using an optimal amount of ZrO2 nanoparticles. The role of residual stress and other possible reinforcement mechanisms on the mechanical responses of the nanocomposites was also studied.
2. Materials and Methods
2.1. Sample Preparation
The compositions of the fabricated nanocomposites were Pb0.99(Zr0.54+xTi0.46)0.98Nb0.02O3+1.96x (x = 0.00, 0.01, 0.015, 0.02, 0.03, and 0.04). The (Zr0.54Ti0.44)0.98Nb0.02O2.01 (ZT) precursor was prepared by dissolving C16H36O4Ti, ZrOCl2·8H2O (99.999%; Sinopharm Chemical Reagent Co. Ltd., Beijing, China) in ethylene glycol. The solution was then mixed with custom-made niobium solutions and heated at 120 °C until viscous transparent sols were obtained. The ZT polymeric precursors thus obtained were baked at 100 °C for 10 days before being calcined in air to obtain white powders, and the polymeric precursors calcined at 740 °C for 4 h to get white ZT powders. Fine PbCO3 powder (99.999%) was mixed with the ZT in a molar ratio of 0.99:1 (PbCO3:ZT). The mixtures were then ball-milled for 10 h using agate balls and distilled water as the grinding and dispersing medium, respectively. After milling, the slurry was air-dried at 100 °C and calcined at 740 °C for 4 h. The obtained powders were mixed with 7 wt.% poly (vinyl alcohol) (PVA) and die-pressed at 100 MPa. After burning away the binder in a furnace at 740 °C, the green bodies were sintered at 1260 °C for 2 h in closed alumina crucibles containing powders of the same chemical composition to minimize lead volatilization. The sintered bodies were machined into the required dimensions for the analysis of their properties. Electrodes were formed by applying silver paste to both sides of the disc samples (diameter, 20 mm; thickness, 1 mm), which were then fired at 820 °C for 15 min. Poling was performed in silicon oil at 120 °C for 30 min with an electric field of 3.0 kV mm−1. All electrical measurements were taken 24 h after polishing.
2.2. Characterization
The bulk density of the samples was determined in distilled water using the Archimedes method. The crystalline phases in the sintered samples were examined using X-ray diffraction (XRD, D/MAX-2500X, Japan Science Corporation, Tokyo, Japan) with Cu Kα1 radiation in the 2θ range of 20–70°. The morphology of the nanocomposites was observed by scanning electron microscopy (SEM, XL30E, Phillips, Amsterdam, The Netherlands). Elemental analysis of the nanocomposites was performed using energy-dispersive X-ray spectroscopy (EDS, Linkisis-300). Detailed microstructural characteristics were examined using transmission electron microscopy (TEM, Tecnai G2 F20, Phillips, Amsterdam, The Netherlands).
The dielectric properties were obtained by measuring the capacitance and dielectric loss at 1 kHz at room temperature using an LCR meter (HP 4294A). The Curie temperature (Tc) was determined from a plot of the temperature vs. dielectric constant at 1 kHz. The piezoelectric constant (d33) was measured using a quasi-static piezoelectric d33 meter (ZJ-3d, Institute of Acoustics Academic Sinica, Beijing, China). Using the LCR meter, the electromechanical coupling coefficient (Kp) and mechanical quality factor (Qm) were calculated using the resonance–antiresonance method based on IEEE standards and the following equations [22]:
where fa is the anti-resonant frequency, fr is the resonant frequency, fs1 is the first overtone resonant frequency, Rf is the resonant impedance (Ω), C is the electrical capacitance (F), σE is Poisson’s ratio (superscript “E” indicated short-circuited boundary conditions), and η1 is the frequency constant of a disk resonator. The impedance vs. frequency spectra of the ceramics were obtained at room temperature with a sweeping frequency ranging from 150 Hz to 215 kHz.
η1 = 1.867 + 0.6054σE
3. Results
3.1. PZT/ZrO2 Nanocomposite Ceramics
3.1.1. ZT Precursor with Pb Vacancies
The ZT oxide solid solution of B-site ions within perovskite-type PZT was first synthesized using the precursor method [16,18]. The A-sites were vacant at this stage (Figure 1). The positions and heights of the peaks in the XRD patterns of the ZT precursor powders (Figure 2) were consistent with those of the standard JCPDS XRD data for ZrTiO4 (JCPDS card No. 84-1018), confirming the successful synthesis of monophasic precursor powders with the ZrTiO4 structure.
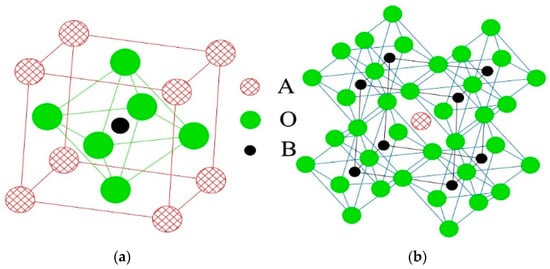
Figure 1.
Perovskite-type crystal structure: (a) Cubic unit cell; (b) Oxygen octahedral structure.

Figure 2.
XRD patterns of ZT powders synthesized at 740 °C.
The synthesis of perovskite-type PZT powder is typically achieved by a solid-phase reaction; however, intermediate reactions and PbO volatilization tend to occur during this process. Consequently, fluctuations and inhomogeneity in the chemical composition of the PZT powder are often observed owing to the presence of small amounts of intermediate phase PT or PZ, which impact the electrical properties of the PZT ceramic. Additionally, PZT powder synthesized via a solid-phase reaction typically contains large agglomerates and exhibits low sinterability. The modified B-site precursor method adopted in this study overcame these shortcomings and enabled the preparation of monophasic ZT solid solutions with various Z/T ratios [20,21].
3.1.2. Metastable Perovskite-Type PZT Solid Solutions
Perovskite-type PZTN solid solutions with the formula Pb0.99(Zr0.54+xTi0.46)0.98Nb0.02O3+1.96x (x = 0–0.04) were synthesized using ZT as the B-site precursor in a solid-phase reaction with PbCO3. A significantly lower temperature of 740 °C was employed using this approach.
The XRD patterns of the ceramic powders synthesized from the PZTN powders at 740 °C for 4 h (Figure 3) reveal the existence of a ferroelectric rhombohedral phase. The patterns were consistent with the standard JCPDS XRD data for PZT with the formula Pb(Zr0.58Ti0.42)O3 (JCPDS card No. 73–2022), indicating that the PZT ceramic powders synthesized at 740 °C were monophasic without any PbO impurities, PbTiO3, or PbZrO3 intermediate phases.
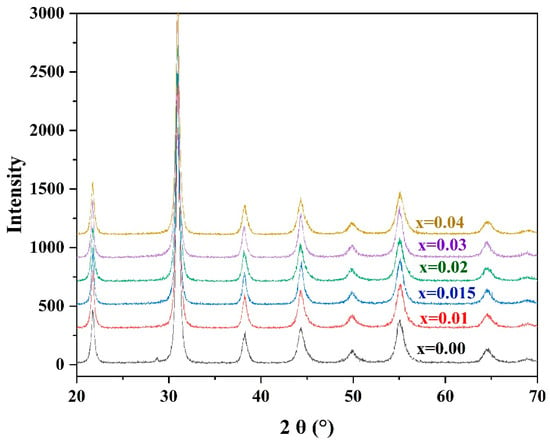
Figure 3.
XRD patterns of PZTN powders synthesized at 740 °C for 4 h.
As the radius of Zr4+ (7.9 nm) is greater than that of Ti4+ (6.8 nm), an increase in the Zr4+ content of the unit cell should increase the size of the unit cell. Bragg’s law (2dsinθ = λ) indicates that the diffraction peak should be shifted towards smaller angles; however, no such shift was observed in the peak characteristic of PZT with an increasing ZrO2 content (Figure 2). This indicates that the size of the prepared metastable perovskite-type unit cells did not increase with the addition of ZrO2. Such a phenomenon can be explained by the fact that the number of Pb vacancies increases with increasing ZrO2 content, which usually reduces the size of the unit cell.
Using the procedure described in Section 2.1, single-phase perovskite-structured PZT solid solutions with an A-site: B-site stoichiometric ratio of 1:1 was synthesized at temperatures as low as 725 °C. Although the synthesis of perovskite solid solutions with Pb vacancies required a temperature of 740 °C, this is significantly lower than that required using traditional solid-phase reactions (850 °C) [23] or the organic polymer synthesis method (800 °C) [24] used in the synthesis of monophasic PZT powders. This reduction in temperature significantly reduces the extent of PbO volatilization during the procedure.
3.1.3. Intragranular PZT/ZrO2 Nanocomposite Ceramics
A non-stoichiometric A-site: B-site ratio of less than 1 was observed in the perovskite lattice of the Pb0.99(Zra+xTi1-a)0.98Nb0.02O3 solid solution. The relevant phase diagram [25] shows that the solid solution of such a composition is thermodynamically unstable and thus a more stable phase (PZT + ZrO2) is formed through the following reaction at higher sintering temperatures:
PbZr1−x+aTixO3 → PbZr1−xTixO3 + aZrO2
The ceramic sintering temperature varies according to the particle size, composition, and the state of the formed powder. The temperature of martensitic transformation (t-ZrO2→m-ZrO2) is 1170 °C, so the sintering temperature must be higher than 1170 °C, the sintering compactness of PZT ceramics should also be considered. In this study, the sintered temperature of 1260 °C was determined by sintering tests with the density measurement of the specimen. A high temperature ramp rate from 900–1000 °C enabled faster grain growth and grain boundary movement, which favored the encapsulation of smaller modified oxide grains by PZT grains to form intragranular grains. As these grains significantly influence the mechanical properties and internal stress of the material, the temperature ramp rate will therefore affect the mechanical properties of the samples to a certain extent. A ramp rate of 7 °C min−1 from 900–1000 °C was adopted during the sintering process to form more intragranular structures.
3.2. SEM Analysis of PZT/ZrO2 Nanocomposite Ceramics
3.2.1. SEM Analysis of Natural Surfaces
SEM images of the natural surfaces of PZTN composite ceramics sintered at 1260 °C for 2 h show that the sample obtained without ZrO2 (x = 0) had a mean grain size of <2.5 μm and exhibited plump, spherical grains (Figure 4a). The grains obtained at x = 0.01 were significantly smaller and more tightly bound to one another than those obtained at x = 0 (Figure 4b), which is consistent with the results reported by Malic et al. [8] and can be explained by the fact that the addition of ZrO2 inhibited the matrix grain growth via the Zener pinning effect [26].
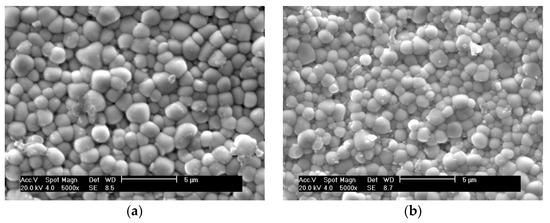

Figure 4.
SEM images of the natural surfaces of PZTN nanocomposite ceramics with (a) x = 0, (b) x = 0.01, (c) x = 0.015, (d) x = 0.02, (e) x = 0.03, (f) x = 0.04.
The grain size increased gradually when increasing amounts of ZrO2. These results are not consistent with those reported in the literature [8], nor with the theory that grain growth is inhibited by the pinning effect produced in the matrix by the precipitation of nanoparticles in the secondary phase. This discrepancy is attributed to the presence of Pb vacancies in the metastable perovskite-type PZT powders, which increased with increasing amounts of ZrO2. As the A-site vacancies in the lattice aid in dispersion and promote sintering, further addition of ZrO2 caused substantial grain growth. The pinning effect exerted by the precipitated nanoparticles favored a reduction in the glass phase and reduced the number of pores, thereby strengthening the grain boundaries. The absence of impurities and the glass phase among the grains led to stronger grain bonding after the addition of ZrO2 (Figure 4b–f), thereby toughening the matrix. We believe that the joint action of the two effects described above contributed positively to the sintering of PZT/ZrO2 nanocomposite ceramics.
The determination of fracture modes and locations (i.e., intragranular or intergranular) of dispersed secondary-phase particles in the ceramic samples required further analysis of fracture morphologies and energy spectra.
3.2.2. SEM Analysis of Fractured Surfaces
SEM images of the fractured surfaces of PZTN nanocomposite ceramics with various ZrO2 contents sintered at 1260 °C for 2 h show that an increase in the ZrO2 content changed the fracture mode from transgranular fracture to intergranular fracture (Figure 5), with the fracture mode being essentially transgranular when x = 0.04 (Figure 5d). This indicates that nanocomposite ceramics containing ZrO2 exhibit reinforced grain boundaries compared to pure PZT ceramics, significantly increasing both the fracture strength and toughness. The SEM images revealed that large amounts of intergranular impurities and glass phase content were absent, which is in agreement with the SEM images of the natural surfaces. ZrO2 particles were almost completely absent between the grain boundaries of the PZT matrix, which differs from the reported observations of previous studies that found dispersed ZrO2 particles between grain boundaries [27,28,29,30]. These results indicate that the prepared materials were intragranular nanocomposite ceramics.
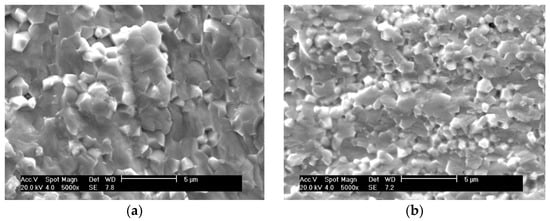
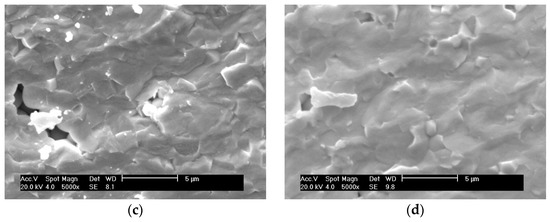
Figure 5.
SEM images of the fractured surfaces of PZTN composite ceramics sintered at 1260 °C for 2 h with (a) x = 0, (b) x = 0.01, (c) x = 0.03, and (d) x = 0.04.
As the increasing of ZrO2 addition, the amount of ZrO2 particles dispersed in PZT matrix increased.
Due to the stress field generated by the second phase ZrO2 particles in the PZT ceramic matrix, the PZT matrix will be toughened by residual stress. The residual stress introduced by the ZrO2 became stronger and stronger, this residual stress can effectively absorb the energy and increase the crack extends resistance [28,29,30], which reduced the sensitivity toward crack and weakened the tense concentration effect around the point of the crack, resulting in the fracture morphology change of transgranular fracture to intergranular fracture, and the intergranular fracture meaning the improvement of the cracking resistance
3.3. TEM and EDS Analyses
3.3.1. Nanosized ZrO2 Particles
TEM images of the PZTN (x = 0.04) nanocomposite ceramic sintered at 1260 °C for 2 h and subsequently subjected to particle thinning reveal the presence of monoclinic (m-ZrO2) and tetragonal (t-ZrO2) intragranular ZrO2 nanospheres (Figure 6), with m-ZrO2 being smaller (diameter < 50 nm) than t-ZrO2 (~100 nm). A martensitic transformation can be observed on one t-ZrO2 sphere, whereas a smaller t-ZrO2 sphere next to the larger one did not undergo a phase transition during the cooling process (Figure 6a). Zr4+ ions tend to form monoclinic structures (coordination number < 8) at low temperatures, whereas cubic and tetragonal forms with Zr-O8 coordination structures can are only stable at high temperatures owing to vibrational equilibrium. The t-ZrO2→m-ZrO2 transition is a martensitic transformation characterized by a first-order phase transition, thermal hysteresis (i.e., the phase transition occurs within a certain temperature range),) a change in volume of approximately 3–5%, and a change in shear strain of 1–7% during phase transition. The tetragonal phase is maintained by the smaller particle size and the compressive stress exerted by the PZT matrix. This is a necessary condition for the phase transition of ZrO2 and matrix toughening in PZT/ZrO2 nanocomposite ceramics. Stress spots formed by the exertion of forces by monoclinic ZrO2 on the matrix and martensitic transformation stripes on t-ZrO2 are clearly visible in the dark-field image of ZrO2 nanoparticles (Figure 6c). The presence of stress spots around a single monoclinic ZrO2 sphere (Figure 6c) and ZrO2 spheres (diameter ~100 nm) with clear outward-propagating stress stripes (Figure 6d) will affect the macroscopic fracture mode of ceramic materials.
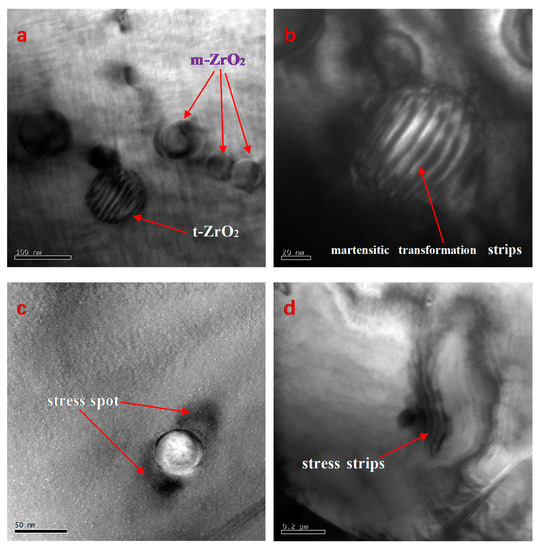
Figure 6.
TEM images of the PZTN (x = 0.04) composite ceramic sintered at 1260 °C for 2 h. (a) Intragranular monoclinic and tetragonal ZrO2 spheres; (b) Dark-field image of martensitic transformation (striped pattern); (c) Stress spots around a ZrO2 sphere; (d) Stress stripes around a ZrO2 nanoparticle.
Residual stress in PZT/ZrO2 composite ceramics is generated via the following mechanism: a martensitic transformation occurs in the t-ZrO2 particles, causing a thermal mismatch between the ZrO2 particles and PZT, leading to residual stress within the PZT matrix and ZrO2 particles. A comparison of the TEM images in Figure 6c,d reveals that volume expansion caused by the martensitic transformation in t-ZrO2 during the cooling process resulted in significantly greater stress between the two phases of the material. Energy is effectively absorbed by the residual stress, thereby inhibiting crack propagation. The reduction in sensitivity toward cracks and weakening of the stress concentration effect at crack tips are key mechanisms, by which ceramic materials are toughened.
3.3.2. Ferroelectric Domains in PZT/ZrO2 Nanocomposite Ceramics
In ferroelectric materials, the spontaneous polarization in each domain is oriented in the same direction. The type of ferroelectric domain structure is primarily determined by the symmetry of the crystal structure before the ferroelectric phase transition and the orientation of spontaneous polarization [31]. The most common domain configurations in ferroelectric ceramics are the 90° and 180° domains. TEM images of the ferroelectric domains in the PZT/ZrO2 nanocomposite ceramics sintered at 1260 °C for 2 h show that an in-plane 90° domain is formed when adjacent polarization directions are perpendicular to each other (Figure 7a,b); when they are antiparallel to each other, an out-of-plane 180° domain is formed (Figure 7c,d). 90° and 180° domains are known to be situated on different crystal surfaces: 90° domains appear as a linear striped contrast pattern often with herringbone or dagger-like morphology [32], whereas 180° domains manifest as an irregular water mark-like or sinuous stripe contrast pattern [31].
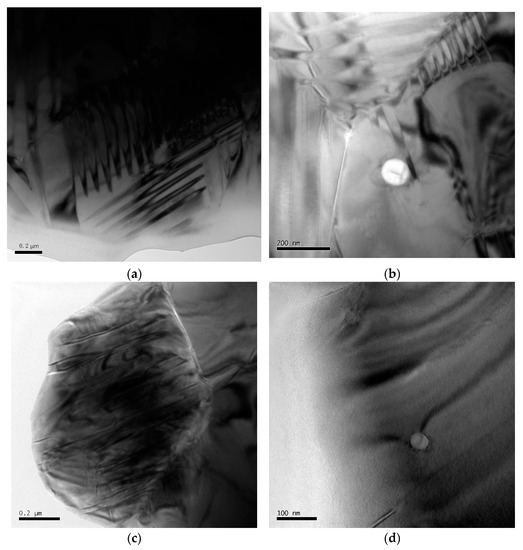
Figure 7.
TEM images of ferroelectric domains in PZT/ZrO2 (PZTN, x = 0.04) nanocomposite ceramics sintered at 1260 °C for 2 h. (a) 90° domain; (b) Effects of ZrO2 on 90° domain; (c) 180° domain; (d) Effects of ZrO2 on 180° domain.
The piezoelectric properties of PZT ceramics are determined by ferroelectric domain inversion during the polarization process. As PZT piezoelectric ceramics have a lower KIC, cyclic electric field loading on the material during its use can lead to microcrack formation and stable crack propagation visible to the naked eye. This can ultimately lead to the fracture, deterioration, and destruction of the material properties, owing mainly to structural changes in the ferroelectric ceramics induced by repeated domain inversion (i.e., domain switching) under the effects of an externally applied alternating electric field [32,33]. Therefore, methods that inhibit crack propagation and enhance toughness are imperative to preserve the properties and prolong the service life of PZT ceramics. Secondary-phase ZrO2 nanoparticles can effectively inhibit crack propagation (Section 3.3.2), while the phase transition of metastable tetragonal ZrO2 also provides toughening effects. As the size of ferroelectric domains is of the order of nanometers or submicron-sized domains, ZrO2 nanoparticles dispersed within the PZT matrix will undoubtedly exert a significant influence on the domains in the material. The effects of ZrO2 nanospheres on the domains include domain truncation (Figure 7b) and deflection (Figure 7b,c), which absorb and reduce the energy that causes domain inversion. Therefore, dispersed ZrO2 nanoparticles can concurrently inhibit crack propagation and directly prevent potential domain inversions caused by crack formation [34].
Figure 8 shows the EDS analysis of nano-sized ZrO2 spheres during the above TEM analysis. As shown in Figure 8, the peak of the Zr element is the strongest. The qualitative results are shown in Table 1. The atomic content of zirconium accounts for 88.81 wt% of the total metal atoms, which shows that these spheres (shown in Figure 6) are indeed ZrO2 particles. Using field emission transmission electron microscope to observe the existing position and the state of ZrO2 is a common method in the study of nano multiphase ceramics with ZrO2 as toughening phase [28,35,36,37].
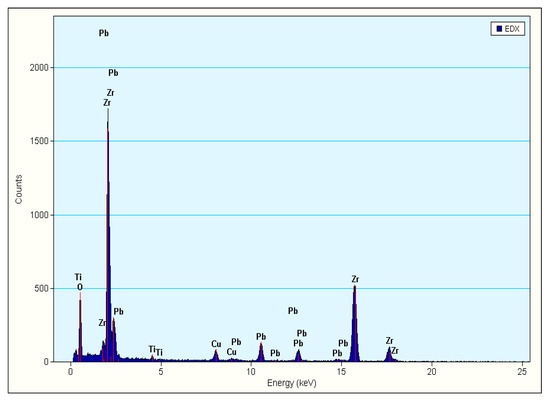
Figure 8.
EDS of TEM of the PZTN (x = 0.04) sintered at 1260 °C for 2 h.

Table 1.
Elements analysis by EDS of the PZTN (x = 0.04) sintered at 1260 °C for 2 h.
3.4. Measured and Relative Densities
The theoretical densities of the PZT matrix and ZrO2 are 8.00 kg m−3 and 5.83 kg m−3, respectively [8]. The measured density of the PZT matrix (7.78 kg m−3 at x = 0) decreased with increasing ZrO2 content, reaching a value of 7.53 kg m−3 at x = 0.04 owing mainly to the lower density of the secondary-phase ZrO2 compared to the matrix. Precipitated ZrO2 with a higher m-ZrO2 content would cause a greater reduction in the measured density. All sintered samples had relative densities of at least 95%, demonstrating that sintering at 1260 °C for 2 h afforded optimum mechanical, dielectric, and piezoelectric properties [36].
The electrical properties of ceramics are closely related to the compactness of ceramics, high density in sintered ceramics effectively reduces internal frictional losses and enhances volume resistivity, which greatly improves their dielectric and piezoelectric properties.
3.5. Dielectric Properties
3.5.1. Dielectric Constant and Dielectric Loss
Figure 9 shows the variation in dielectric constant and tan δ as a function of ZrO2 content in PZTN composite ceramics sintered at 1260 °C for 2 h. Tan δ initially increased as the ZrO2 content increased to 0.02, and subsequently decreased with increasing ZrO2 content. The maximum tan δ of approximately 0.026 was recorded at x = 0.02. The dielectric constant exhibited an overall downward trend with increasing ZrO2 content. Both the dielectric constant and tan δ are related to ceramic density, with denser ceramics exhibiting higher dielectric constants. Tan δ is widely thought to be related to domain wall movement. Inter-domain wall, domain wall–lattice, and domain wall–defect interactions occur upon application of an external electric field, causing energy losses during domain wall movement. A lower density typically results in increased losses during domain wall movement. Grain growth increases the sizes of the 180° and 90° domains, generating appreciable stress owing to a change in the orientation of the 90° domain, thereby increasing dielectric loss. In addition, an increase in the content of secondary-phase ZrO2 increases the generated internal stress and direct effects of ZrO2 particles on the domains (Figure 7), which also contributes to high stresses during changes in domain orientation.

Figure 9.
Variation in εT33/ε0 and tan δ with ZrO2 content in PZTN nanocomposite ceramics sintered at 1260 °C for 2 h.
3.5.2. Temperature Stability and Curie Temperature
Figure 10 shows the variation in εT33/ε0 (at 1 kHz) with in PZTN ceramics with various ZrO2 contents as a function of temperature. The Curie temperature (Tc) of the ceramics initially increased and subsequently decreased with increasing ZrO2 content. At x = 0.01, the highest Tc value of 387 °C, along with the lowest εT33/ε0 was obtained at x = 0.01. At x = 0.03, the lowest Tc value of 340.7 °C was obtained; however, the highest εT33/ε0 value was achieved. The peak εT33/ε0 values of the PZTN ceramics were in the range of 12,000–25,000.
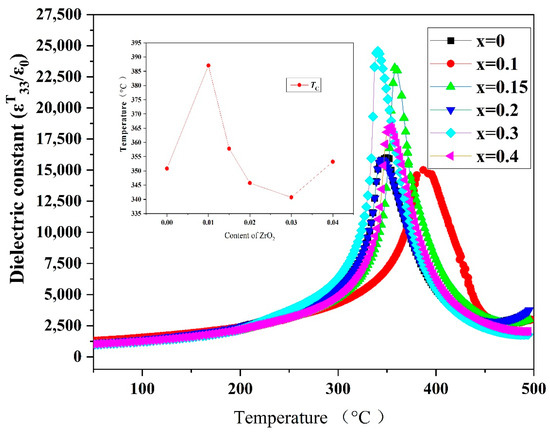
Figure 10.
Dielectric thermograms (1 kHz) of PZTN ceramics sintered at 1260 °C for 2 h.
The variation in the εT33/ε0 of ferroelectric materials with temperature is mainly caused by the influence of temperature on spontaneous polarization. Piezoelectric ceramics exhibit ferroelectricity and paraelectricity below and above Tc, respectively. The dielectric constant of a material typically peaks at the ferroelectric-paraelectric phase transition point (Curie point). At temperatures below Tc, the dielectric constant decreases with temperature in the absence of any phase transition. At temperatures below the Curie point, the dielectric constant increased with increasing temperature (Figure 10).
Ferroelectricity in piezoelectric ceramics is characterized by an increase in the dielectric constant with temperature. When the temperature surpasses a certain value, a ferroelectric to paraelectric phase transition occurs, causing a sharp reduction in the dielectric constant. The corresponding phase transition temperature is known as the Curie temperature (Tc), whose magnitude is critical in high-temperature piezoelectric materials.
The variation in the reciprocal of ε with T − Tm in all samples of PZTN ceramics sintered at 1260 °C for 2 h, followed the relationship: (1/ε) − (1/εm) = K(T − Tm)γ, with ε values being higher than those at Tc (Figure 11). All γ values (Table 2) were higher than that in the Curie-Weiss law for normal ferroelectrics (γ = 1.0) and smaller than that in the Curie-Weiss law for relaxor ferroelectrics, such as PMN (γ = 2.0) [37]. The γ values initially decreased, then increased and decreased again with increasing ZrO2 content.
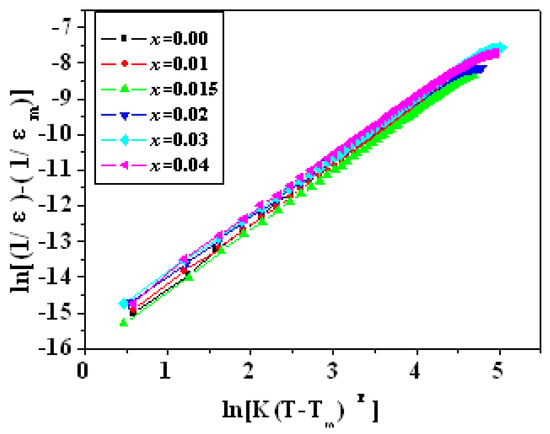
Figure 11.
Variation in the reciprocal of ε with T − Tm in PZTN ceramics sintered at 1260 °C for 2 h.

Table 2.
Diffusion coefficients (γ) of PZTN ceramics sintered at 1260 °C for 2 h.
3.5.3. Dielectric Loss at Different Temperature
A plot of the variations in tan δ (at 1 kHz) in PZTN ceramic samples sintered at 1260 °C for 2 h as a function of temperature (Figure 12) reveals that tan δ initially decreased with increasing temperature owing to the absorption of moisture by the samples exposed to an open-air environment. The maximum value of tan δ was achieved near Tc, similar to ε.

Figure 12.
Variations in dielectric loss (1 kHz) with temperature in PZTN ceramics sintered at 1260 °C for 2 h.
Dielectric loss arises from conductivity and relaxation polarization. In piezoelectric ferroelectrics, conductivity loss is negligible and dielectric loss is mainly caused by relaxation polarization. At low temperatures, the dipole moment remains essentially unchanged with changes to an external electric field, leading to a small relaxation loss. As the temperature increases, increased thermal motion of the dipole moment induces higher dielectric loss. In ferroelectric ceramics, dielectric loss is also related to domain wall movement. Elevated temperatures increase domain wall movement, thereby increasing dielectric loss [36].
3.6. Piezoelectric Properties
Figure 13 shows the variations in d33, Kp, and Qm with ZrO2 content in PZTN ceramics sintered at 1260 °C for 2 h. The Kp and Qm of all samples containing ZrO2 were higher than those of the samples without ZrO2. Kp reached a maximum value of 0.66 at x = 0.02, whereas Qm reached a maximum of 90 value at x = 0.01. d33 exhibited an overall downward trend, with a relatively high value of 363 pC N−1 at x = 0.02. Qm reached a minimum value of approximately 80 when d33 and Kp reached their maximum values. Qm decreased with increasing porosity because it is determined by the relaxation loss of the domain walls, which is primarily caused by domain wall movement (especially during polarization). The presence of an internal bias field is not conducive to changes in the domain wall orientation and makes polarization difficult, thereby favoring high Qm values. Sn increase in Kp and d33 typically leads to a reduction in Qm.
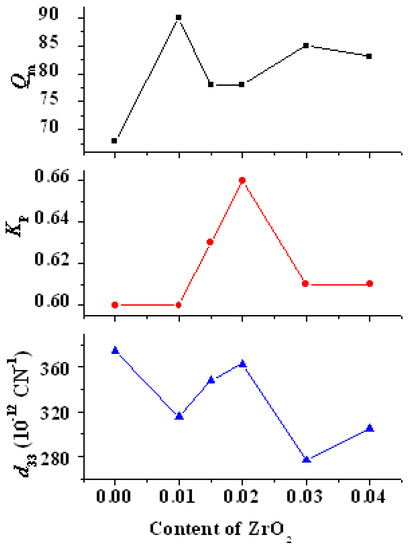
Figure 13.
Variations in d33, Kp, and Qm with ZrO2 content in PZTN ceramics.
The results depicted in Figure 13 show that the piezoelectric properties of PZTN ceramics did not strictly decrease with increasing ZrO2 content as reported in the literature [23], with Kp, Qm, and K31 showing both increasing to various extents. In addition, d33 at x = 0.02 is very similar to that at x = 0.
4. Conclusions
A ZT oxide solid solution of B-site ions was synthesized within perovskite-type PZT via a precursor method. The temperature required by this procedure was significantly reduced to 740 °C from the 1000 °C required by traditional solid-phase reactions. The synthesized solid solution was subsequently employed as the B-site precursor in the synthesis of metastable PZT powders with Pb vacancies at the A-sites via a solid-phase reaction with PbCO3. XRD analysis of the PZT powders revealed monophasic perovskite structures, which yielded PZT/ZrO2 piezoelectric ceramics upon sintering. The intragranular niobium-doped PZT/ZrO2 nanocomposite structure of the fabricated PZT/ZrO2 ceramics was confirmed by XRD, SEM, and TEM analyses.
The fracture mode of the nanocomposite ceramics changed from intergranular to transgranular fracture with increasing ZrO2 content, while grain size showed an initial reduction followed by an increase. The temperature ramp rate during sintering was increased to enable the precipitation of PZT unit cells for the preparation of PZT/ZrO2 nanocomposite ceramics. TEM analysis revealed the presence of both tetragonal and monoclinic ZrO2 phases in the nanocomposite ceramics. TEM images also showed that secondary-phase ZrO2 nanoparticles primarily existed within the PZT grains and grain boundaries, while tetragonal ZrO2 particles measuring < 50 nm were present within the PZT/ZrO2 nanocomposite ceramics. Additionally, ZrO2 exerted truncating and deflecting effects on ferroelectric domains.
The piezoelectric properties of the nanocomposites increased to various extents with increasing ZrO2 content. The optimal piezoelectric properties of PZTN nanocomposite ceramics (εT33/ε0 = 1398, tan δ = 0.024 d33 = 354 pC N−1, kp = 0.66 Qm = 78) are obtained when x = 0.02. Tc increased and subsequently decreased with increasing ZrO2 content, with the highest value of Tc (387 °C) and the lowest value of εT33/ε0 (15010) being obtained at x = 0.01.
Funding
This research was funded by the National Natural Science Foundation of China, grant number 50472065, China Postdoctoral Science Foundation, grant number 2016M591050, Key Research and Development Program of He Bei Province, grant number 21370302D and Key Project of the People’s Police University of China, grant number 2019sycxpd005.
Institutional Review Board Statement
Not applicable.
Informed Consent Statement
Not applicable.
Data Availability Statement
The data used to support the findings of this study are included within the manuscript.
Conflicts of Interest
The authors declare no conflict of interest.
References
- Lay, R.; Deijsabc, G.S.; Malmström, J. The Intrinsic Piezoelectric Properties of Materials—A Review with a Focus on Biological Materials. RSC Adv. 2021, 49, 30657–30673. [Google Scholar] [CrossRef]
- Ding, W.J.; Xu, W.W.; Dong, Z.J.; Liu, Y.Q.; Wang, Q.; Shiotani, T. Piezoelectric Properties and Microstructure of Ceramicrete-Based Piezoelectric Composites. Ceram. Int. 2021, 47, 29681–29687. [Google Scholar] [CrossRef]
- Li, S.; Fu, J.; Zuo, R.Z. Middle-Low Temperature Sintering and Piezoelectric Properties of CuO and Bi2O3 Doped PMS-PZT Based Ceramics for Ultrasonic Motors. Ceram. Int. 2021, 47, 20117–20125. [Google Scholar] [CrossRef]
- Chen, H.; Xing, J.; Xi, J.W.; Pu, T.; Liu, H.; Zhu, J.G. Origin of High Piezoelectricity in Low-Temperature Sintering PZT-Based Relaxor Ferroelectric Ceramics. J. Alloys Compd. 2021, 860, 157930. [Google Scholar] [CrossRef]
- Hwang, H.J.; Watari, K.; Sando, M.; Toriyama, M.; Niihara, K. Low-Temperature Sintering and High-Strength Pb(Zr,Ti)O3-Matrix Composites Incorporating Silver Particles. J. Am. Ceram. Soc. 1997, 80, 791–793. [Google Scholar] [CrossRef]
- Takahashi, M.; Fujiwara, T.; Hayashi, H. Mechanical and Electromechannical Properties of Monoclinic ZrO2 Fiber/PZT Composites. J. Ceram. Soc. Jpn. 1994, 102, 63–68. [Google Scholar] [CrossRef][Green Version]
- Yamamoto, T.; Igarashi, H.; Okazaki, K. Electrical and Mechanical Properties of SiC Whisker Reinforced PZT Ceramic. Ferroelectrics 1985, 63, 281–288. [Google Scholar] [CrossRef]
- Malič, B.; Kosec, M.; Kosmač, T. Mechanical and Electric Properties of PZT-ZrO2 Composites. Ferroelectrics 1992, 129, 147–155. [Google Scholar] [CrossRef]
- Chua, B.W.; Lu, L.; Lai, M.O.; Wong, G.H.L. Effects of Complex Additives on Toughness and Electrical Properties of PZT Ceramics. J. Alloys Compd. 2004, 381, 272–277. [Google Scholar] [CrossRef]
- Lin, H.B.; Cao, M.S.; Zhao, Q.L.; Shi, X.L.; Wang, D.; Wang, F. Mechanical Reinforcement and Piezoelectric Properties of Nanocomposites Embedded with ZnO Nanowhiskers. Scr. Mater. 2008, 59, 780–783. [Google Scholar] [CrossRef]
- Ghasemi, P.; Sharifi, M.J. Optoelectronic Memory Capacitor Based on Manipulation of Ferroelectric Properties. ACS Appl. Mater. Interfaces 2021, 13, 53067–53072. [Google Scholar] [CrossRef] [PubMed]
- Long, L.H.; Zhang, F.M.; Chen, L.; Chen, L.D.; Chang, J. Preparation and Properties of β-CaSiO3/ZrO2 (3Y) Nanocomposites. J. Eur. Ceram. Soc. 2008, 28, 2883–2887. [Google Scholar] [CrossRef]
- Niihara, K. New design concept of structural ceramics nanocomosites. J. Ceram. Soc. Jpn. 1990, 99, 974–982. [Google Scholar] [CrossRef]
- Nawa, M.; Yamazaki, K.; Sekino, T.; Niihara, K. Microstructure and mechanical behavior of 3Y-TZP/Mo nanocomposites processing a novel interpenetrated intragranular microstructure. J. Mater. Sci. 1996, 31, 2849–2858. [Google Scholar] [CrossRef]
- Sekino, T.; Niihara, K. Fabrication and mechanical properties of fine-tungsten-dispersed alumina-based composites. J. Mater. Sci. 1997, 32, 3943–3949. [Google Scholar] [CrossRef]
- Tajima, K.; Hwang, H.J.; Sando, M.; Niihara, K. PZT nanocomposites reinforced by small amount of oxides. J. Eur. Ceram. Soc. 1999, 19, 1179–1182. [Google Scholar] [CrossRef]
- Hannink, R.H.J.; Kelly, P.M.; Muddle, B.C. Transformation Toughening in Zirconia-Containing Ceramics. J. Am. Ceram. Soc. 2000, 83, 461–487. [Google Scholar] [CrossRef]
- Awaji, H.; Choi, S.M.; Yagi, E. Mechanisms of Toughening and Strengthening in Ceramic-Based Nanocomposites. Mech. Mater. 2002, 34, 411–422. [Google Scholar] [CrossRef]
- Yar, A.A.; Montazerian, M.; Abdizadeh, H.; Baharvandi, H.R. Microstructure and Mechanical Properties of Aluminum Alloy Matrix Composite Reinforced with Nano-Particle MgO. J. Alloys Compd. 2009, 484, 400–404. [Google Scholar] [CrossRef]
- Li, J.H. Characterization of ZrO2/PZT Nanocomposites Ceramics Prepared by the Citrate Precursor Route. Mater. Sci. Forum. 2016, 852, 407–410. [Google Scholar] [CrossRef]
- Bianco, A.; Paci, M.; Freer, R. Zirconium Titanate: From Polymeric Precursors to Bulk Ceramics. J. Eur. Ceram. Soc. 1998, 18, 1235–1243. [Google Scholar] [CrossRef]
- The Institute of Electrical and Electronics Engineers (IEEE). Standards on Piezoelectricity, American National Standards Institute, ANSI/IEEE Std.; The Institute of Electrical and Electronics Engineers (IEEE): NewYork, NY, USA, 1987; Volume 176. [Google Scholar]
- Yamamoto, T. Optimum Preparation Methods for Piezoelectric Ceramics and Their Evaluation. Ceram. Bull. 1992, 71, 978–984. [Google Scholar]
- Jha, P.; Arya, P.R.; Ganguli, A.K. Dielectric Properties of Lead Zirconium Titanates with Nanometer Size Grains Synthesized by the Citrate Precursor Route. Mater. Chem. Phys. 2003, 82, 355–361. [Google Scholar] [CrossRef]
- Levin, E.M.; Robbins, C.R.; McMurdie, H.F. Phase Diagram for Ceramist 1975 Supplemen1t; Reser, M.K., Ed.; American Ceramic Society: Columbus, OH, USA, 1975. [Google Scholar]
- Sternitzke, M.J. Structural Ceramic Nanocomposites. J. Eur. Ceram. Soc. 1997, 17, 1061–1082. [Google Scholar] [CrossRef]
- Senda, T.; Bradt, R.C. Grain Growth in Sintered ZnO and ZnO-Bi2O3 Ceramics. J. Am. Ceram. Soc. 1990, 73, 106–114. [Google Scholar] [CrossRef]
- Malic, B.; Bernard, J.; Bencan, A.; Kosec, M. Influence of Zirconia Addition on the Microstructure of K0.5Na0.5NbO3 Ceramics. J. Eur. Ceram. Soc. 2008, 28, 1191–1196. [Google Scholar] [CrossRef]
- Tuan, W.H.; Chen, R.Z.; Wang, T.C.; Cheng, C.H.; Kuo, P.S. Mechanical Properties of Al2O3/ZrO2 Composites. J. Eur. Ceram. Soc. 2002, 22, 2827–2833. [Google Scholar] [CrossRef]
- Liu, G.J.; Qiu, H.B.; Todd, R.; Brook, R.J.; Guo, J.K. Processing and Mechanical Behavior of Al2O3/ZrO2 Nanocomposites. Mater. Res. Bull. 1998, 33, 281–288. [Google Scholar] [CrossRef]
- Chou, J.Y.; Lin, M.; Lu, H.Y. Ferroelectric Domains in Pressureless-Sintered Barium Titanate. Acta Mater. 2000, 48, 3569–3579. [Google Scholar] [CrossRef]
- Xiang, Y.; Chen, C.W.; Tang, L.; Qin, L.; Zhu, H.; Cao, W. Dielectric, Elastic and Piezoelectric Properties of Single Domain Pb(Zn1/3Nb2/3)O3–6.5%PbTiO3 Single Crystal with 3m Symmetry Measured Using One Sample. Scr. Mater. 2021, 194, 113634. [Google Scholar] [CrossRef]
- Tan, X.L.; Xu, Z.K.; Shang, J.K. In-Situ Transmission Electron Microscopy Observations of Electric-Field-Induced Domain Switching and Microcracking in Ferroelectric Ceramics. Mater. Sci. Eng. 2001, A314, 157–161. [Google Scholar] [CrossRef]
- Fang, F.; Yang, W.; Zhu, T. Crack Tip 90° Domain Switching in Tetragonal Lanthanum-Modified Lead Zirconate Titanate Under an Electric Field. J. Mater. Res. 1999, 14, 2940–2944. [Google Scholar] [CrossRef][Green Version]
- Kaya, C.; Butler, E.G. Zirconia-toughened alumina ceramics of helical spring shape with improved properties from extruded sol-derived pastes. Scr. Mater. 2003, 48, 359–364. [Google Scholar] [CrossRef]
- Jaffe, B.; Cook, W.R.; Jaffe, H. Piezoelectric Ceramics; Academic Press: London, UK; New York, NY, USA, 1971. [Google Scholar]
- Kirillov, V.V.; Isupov, V.A. Relaxation Polarization of Pb(Mg1/3Nb2/3)O3(PMN)-A Ferroelectric with a Diffused Phase Transition. Ferroelectrics 1973, 5, 3–9. [Google Scholar] [CrossRef]
Publisher’s Note: MDPI stays neutral with regard to jurisdictional claims in published maps and institutional affiliations. |
© 2022 by the author. Licensee MDPI, Basel, Switzerland. This article is an open access article distributed under the terms and conditions of the Creative Commons Attribution (CC BY) license (https://creativecommons.org/licenses/by/4.0/).