
Enhancement of Room Temperature Ethanol Sensing by Optimizing the Density of Vertically Aligned Carbon Nanofibers Decorated with Gold Nanoparticles

 , ,
, ,  and
and 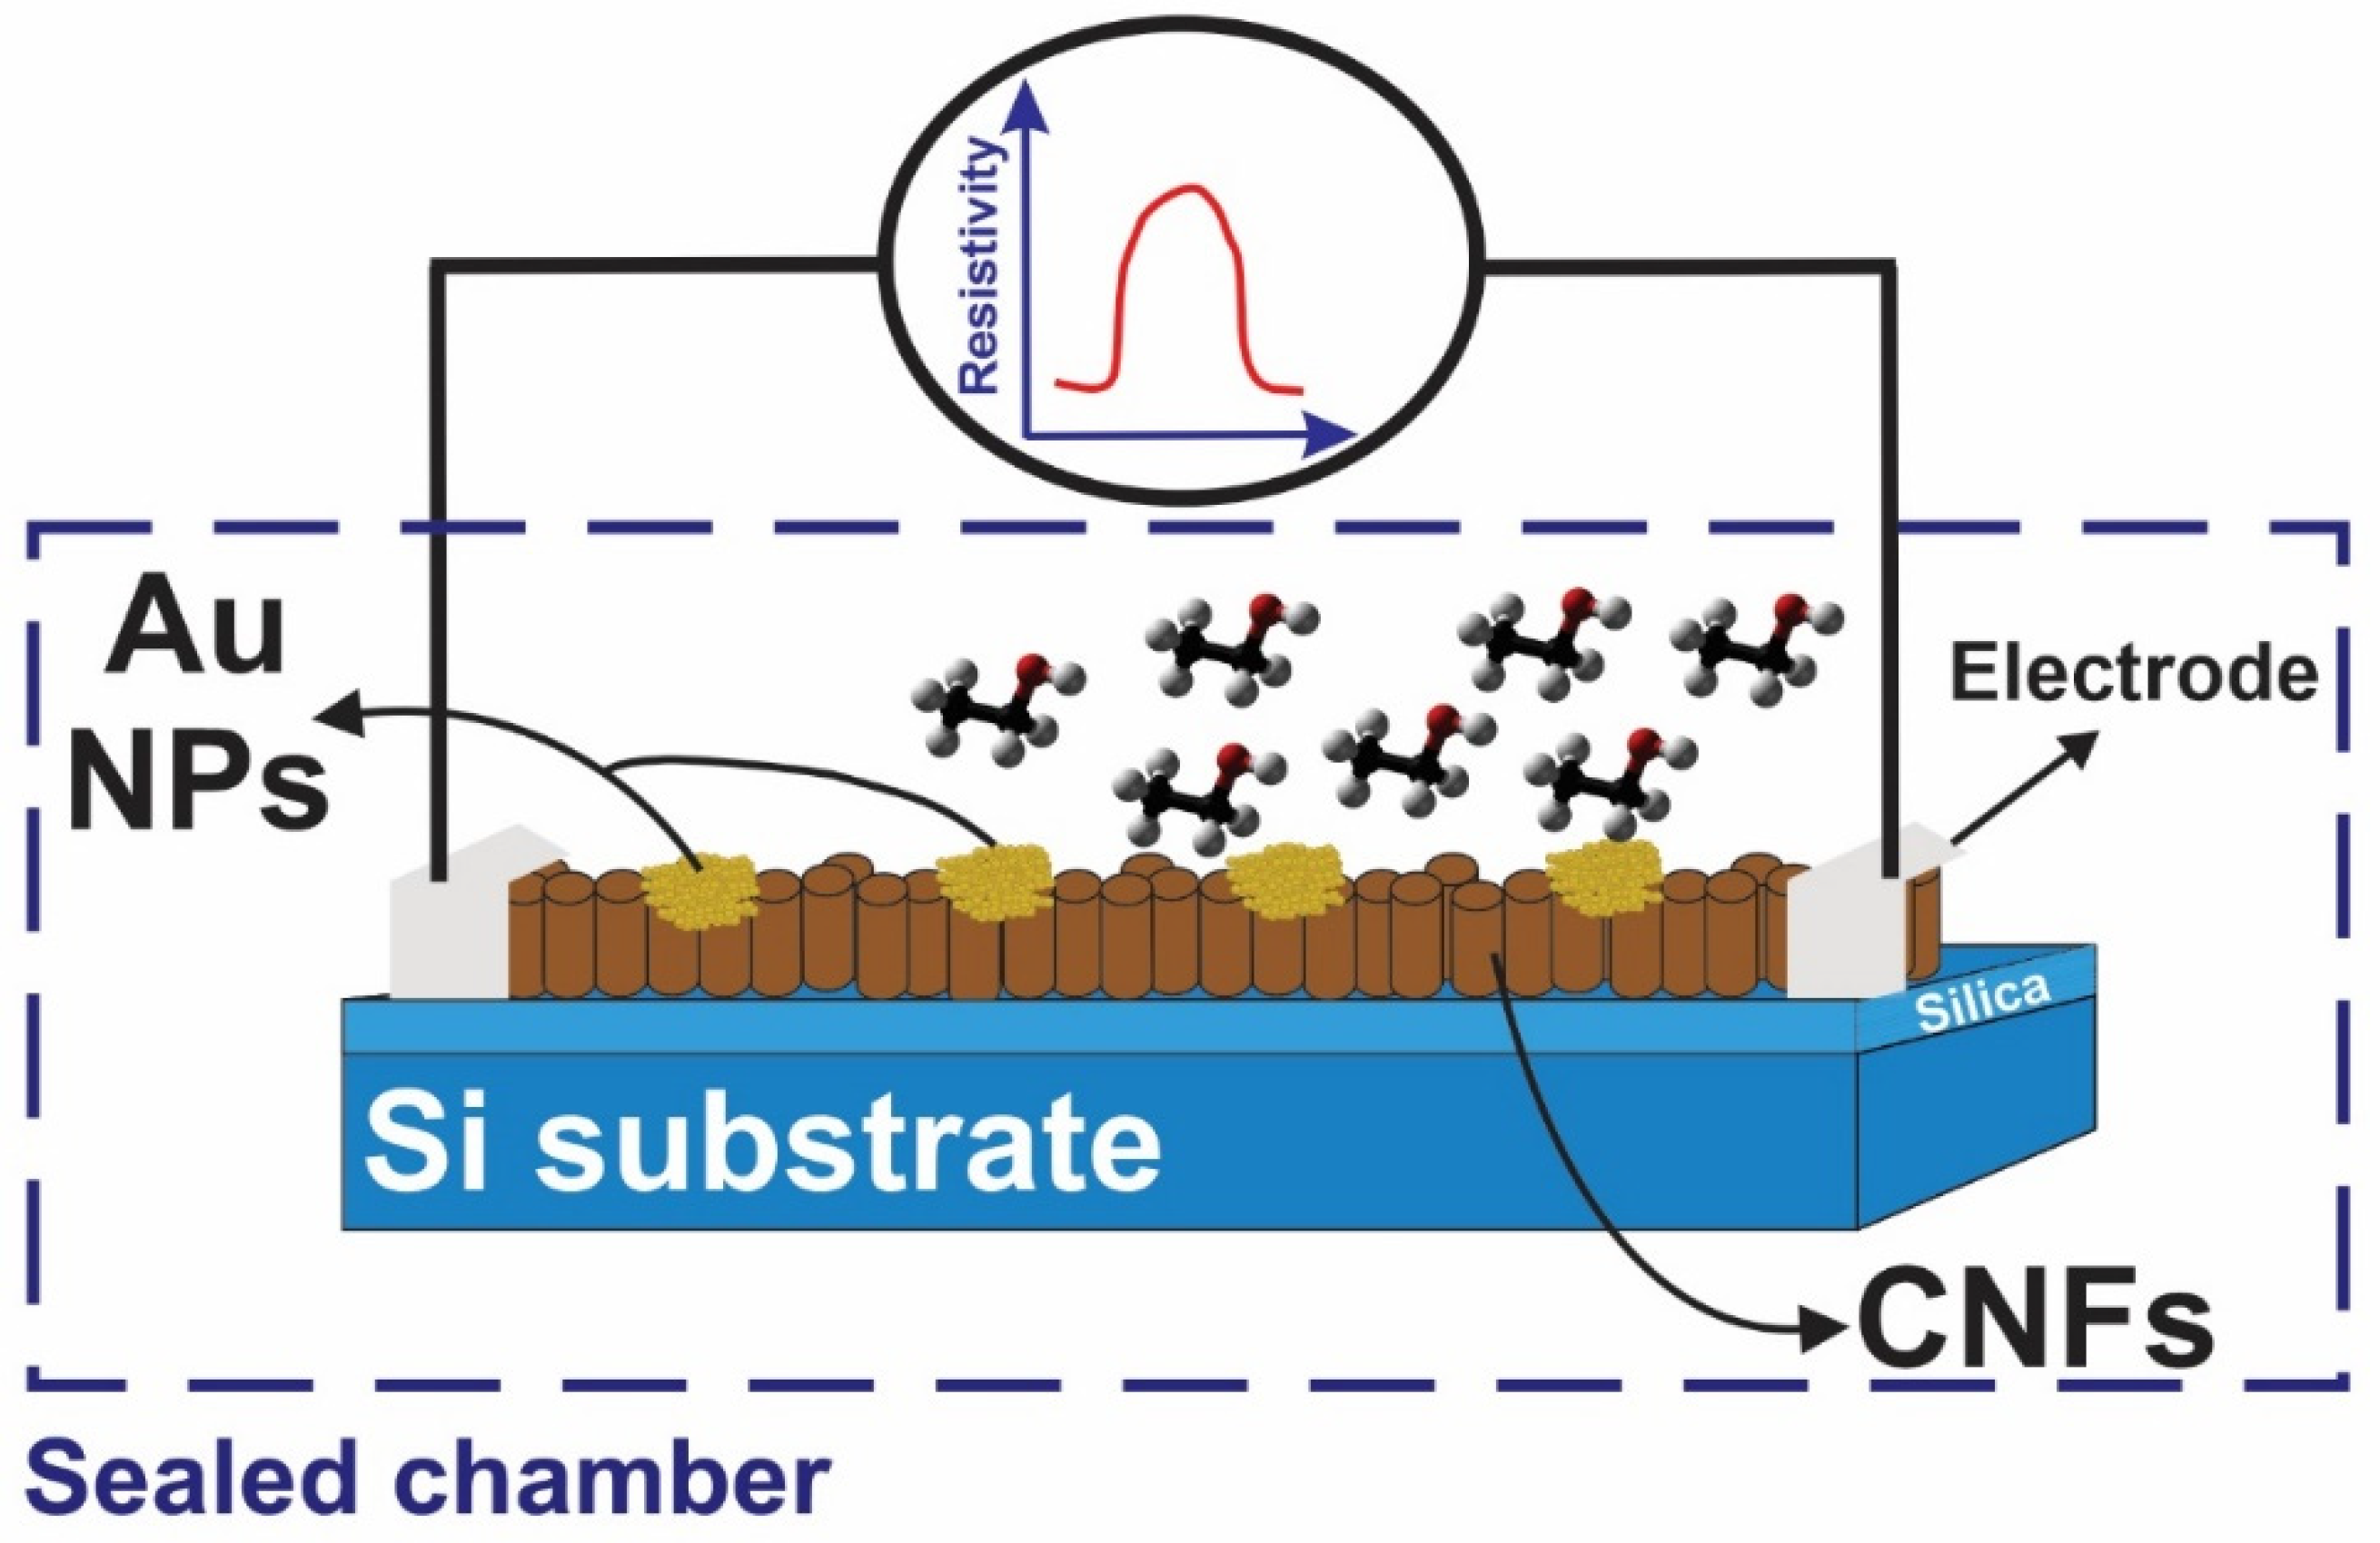
Abstract
:1. Introduction
2. Experimental
2.1. CNF Growth
2.2. Gold Nanoparticle Decoration
2.3. Measurement Setup
3. Results and Discussion
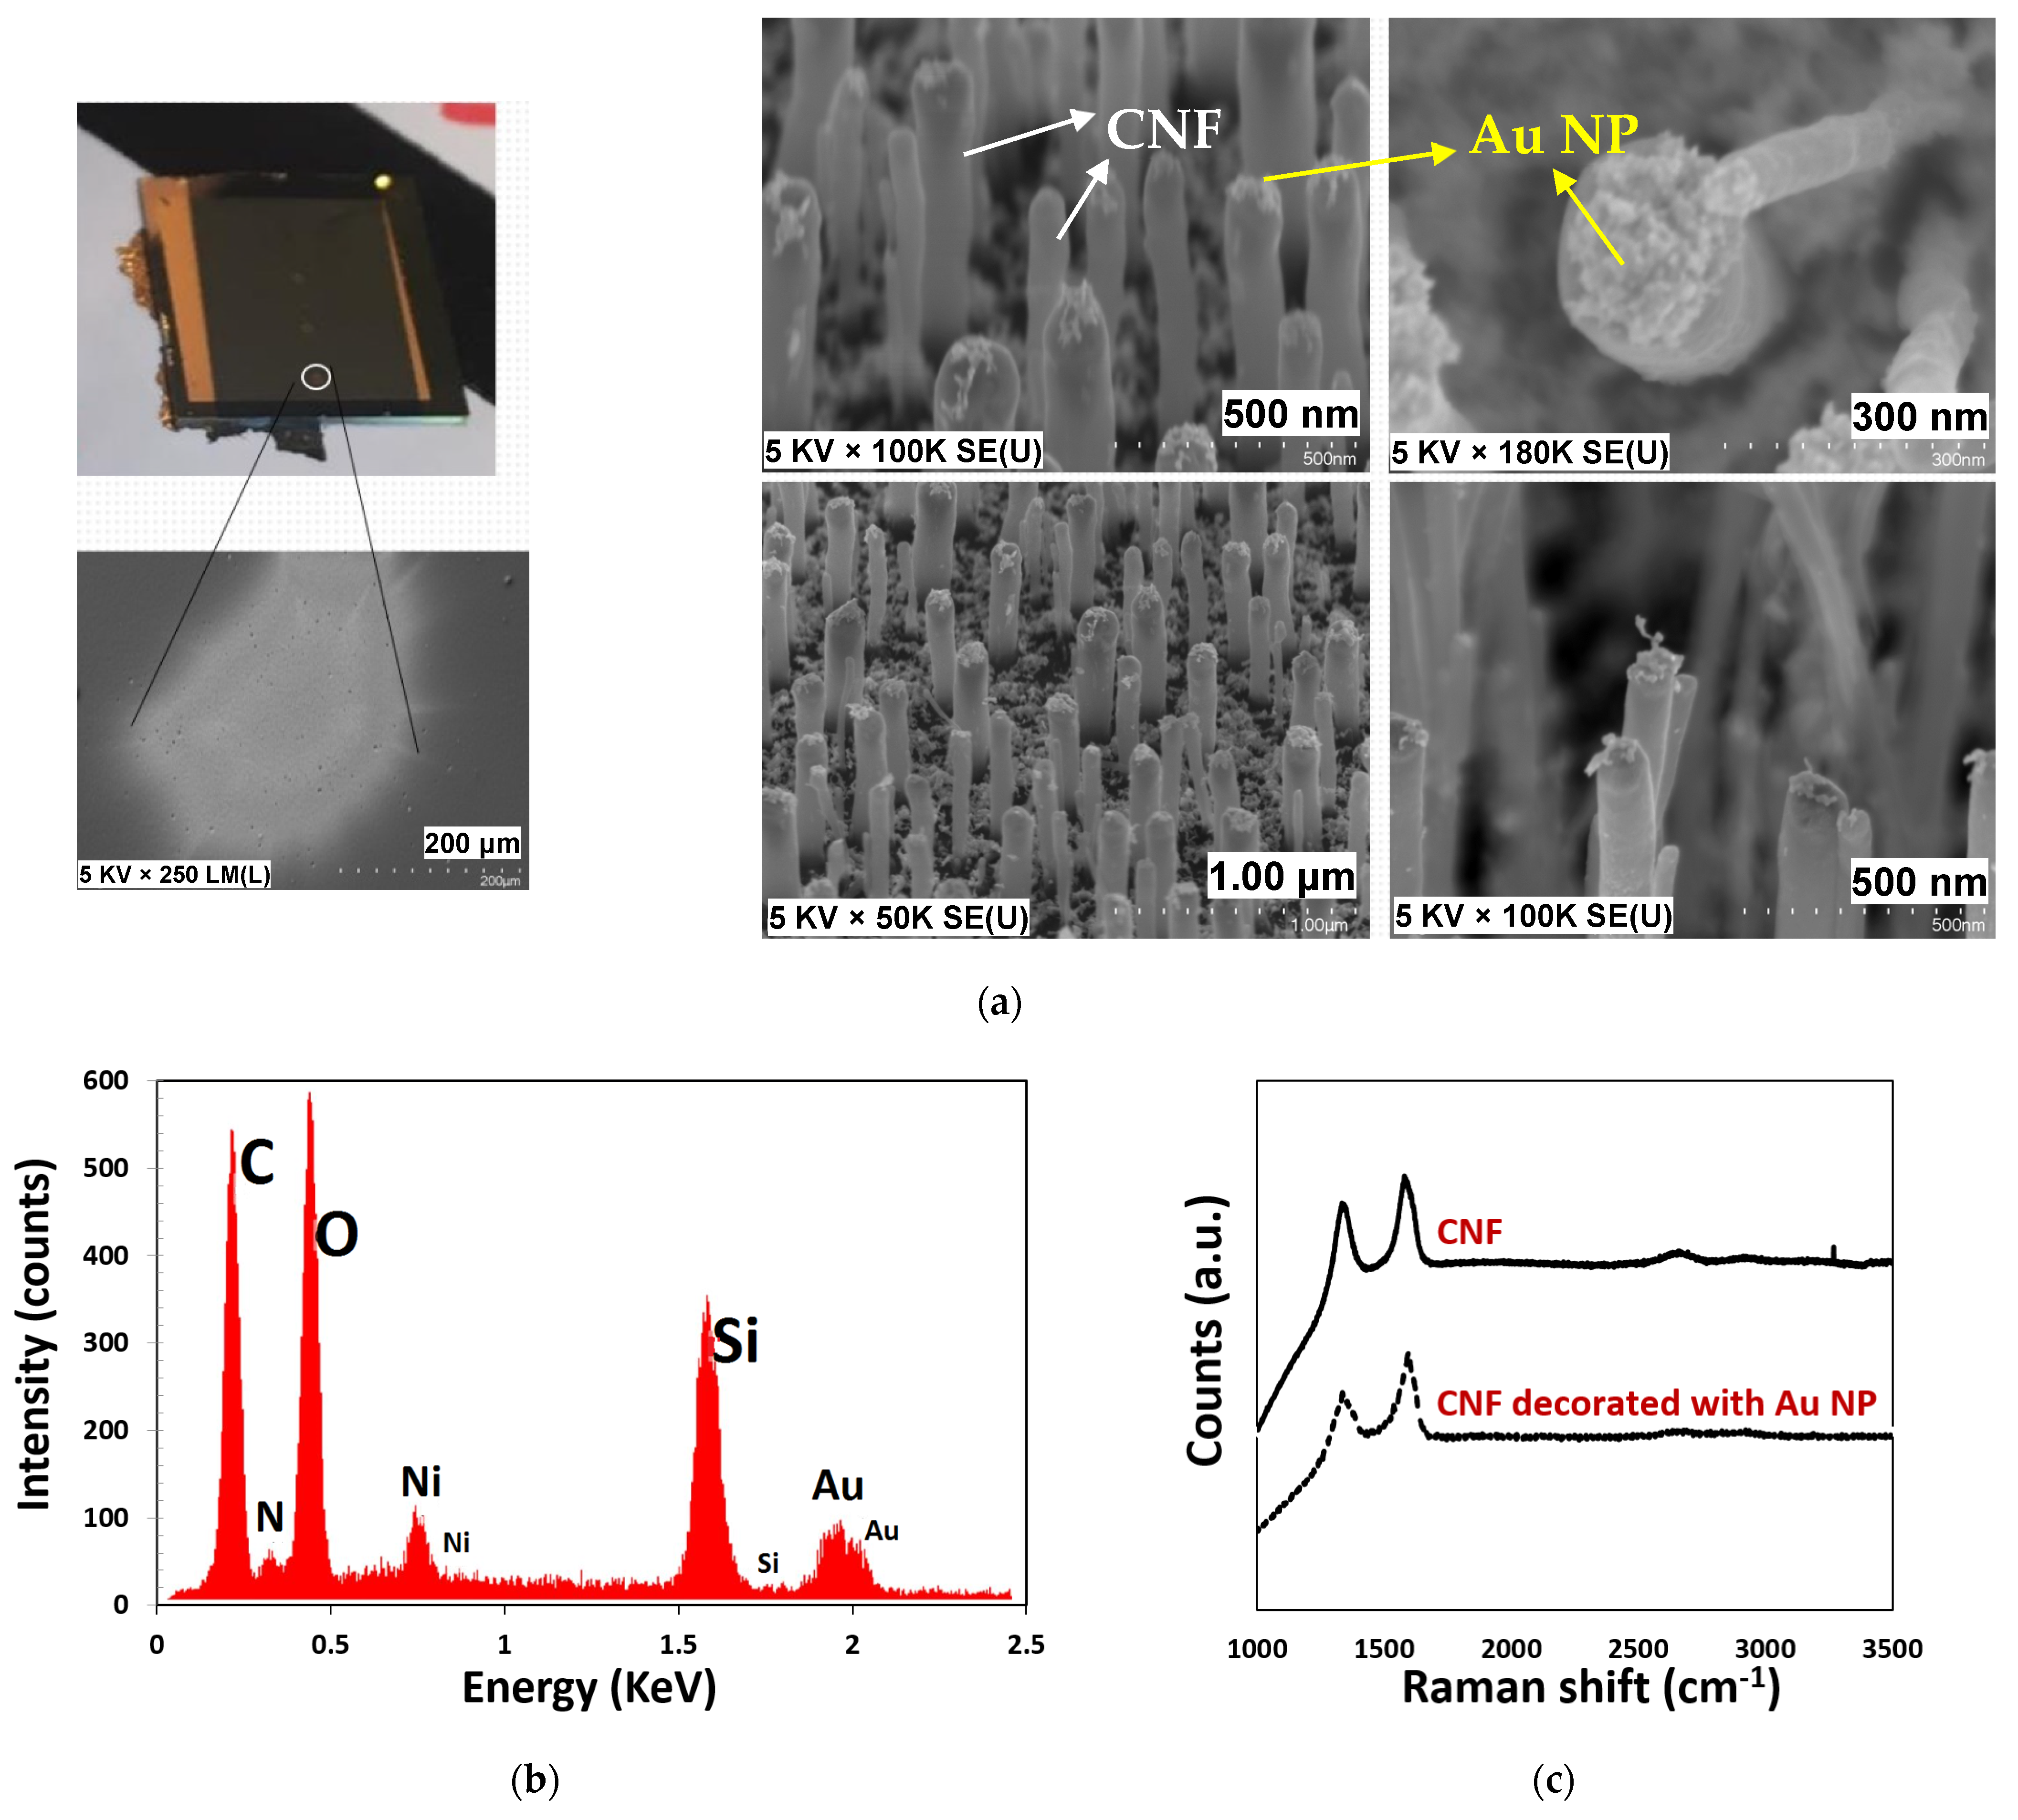
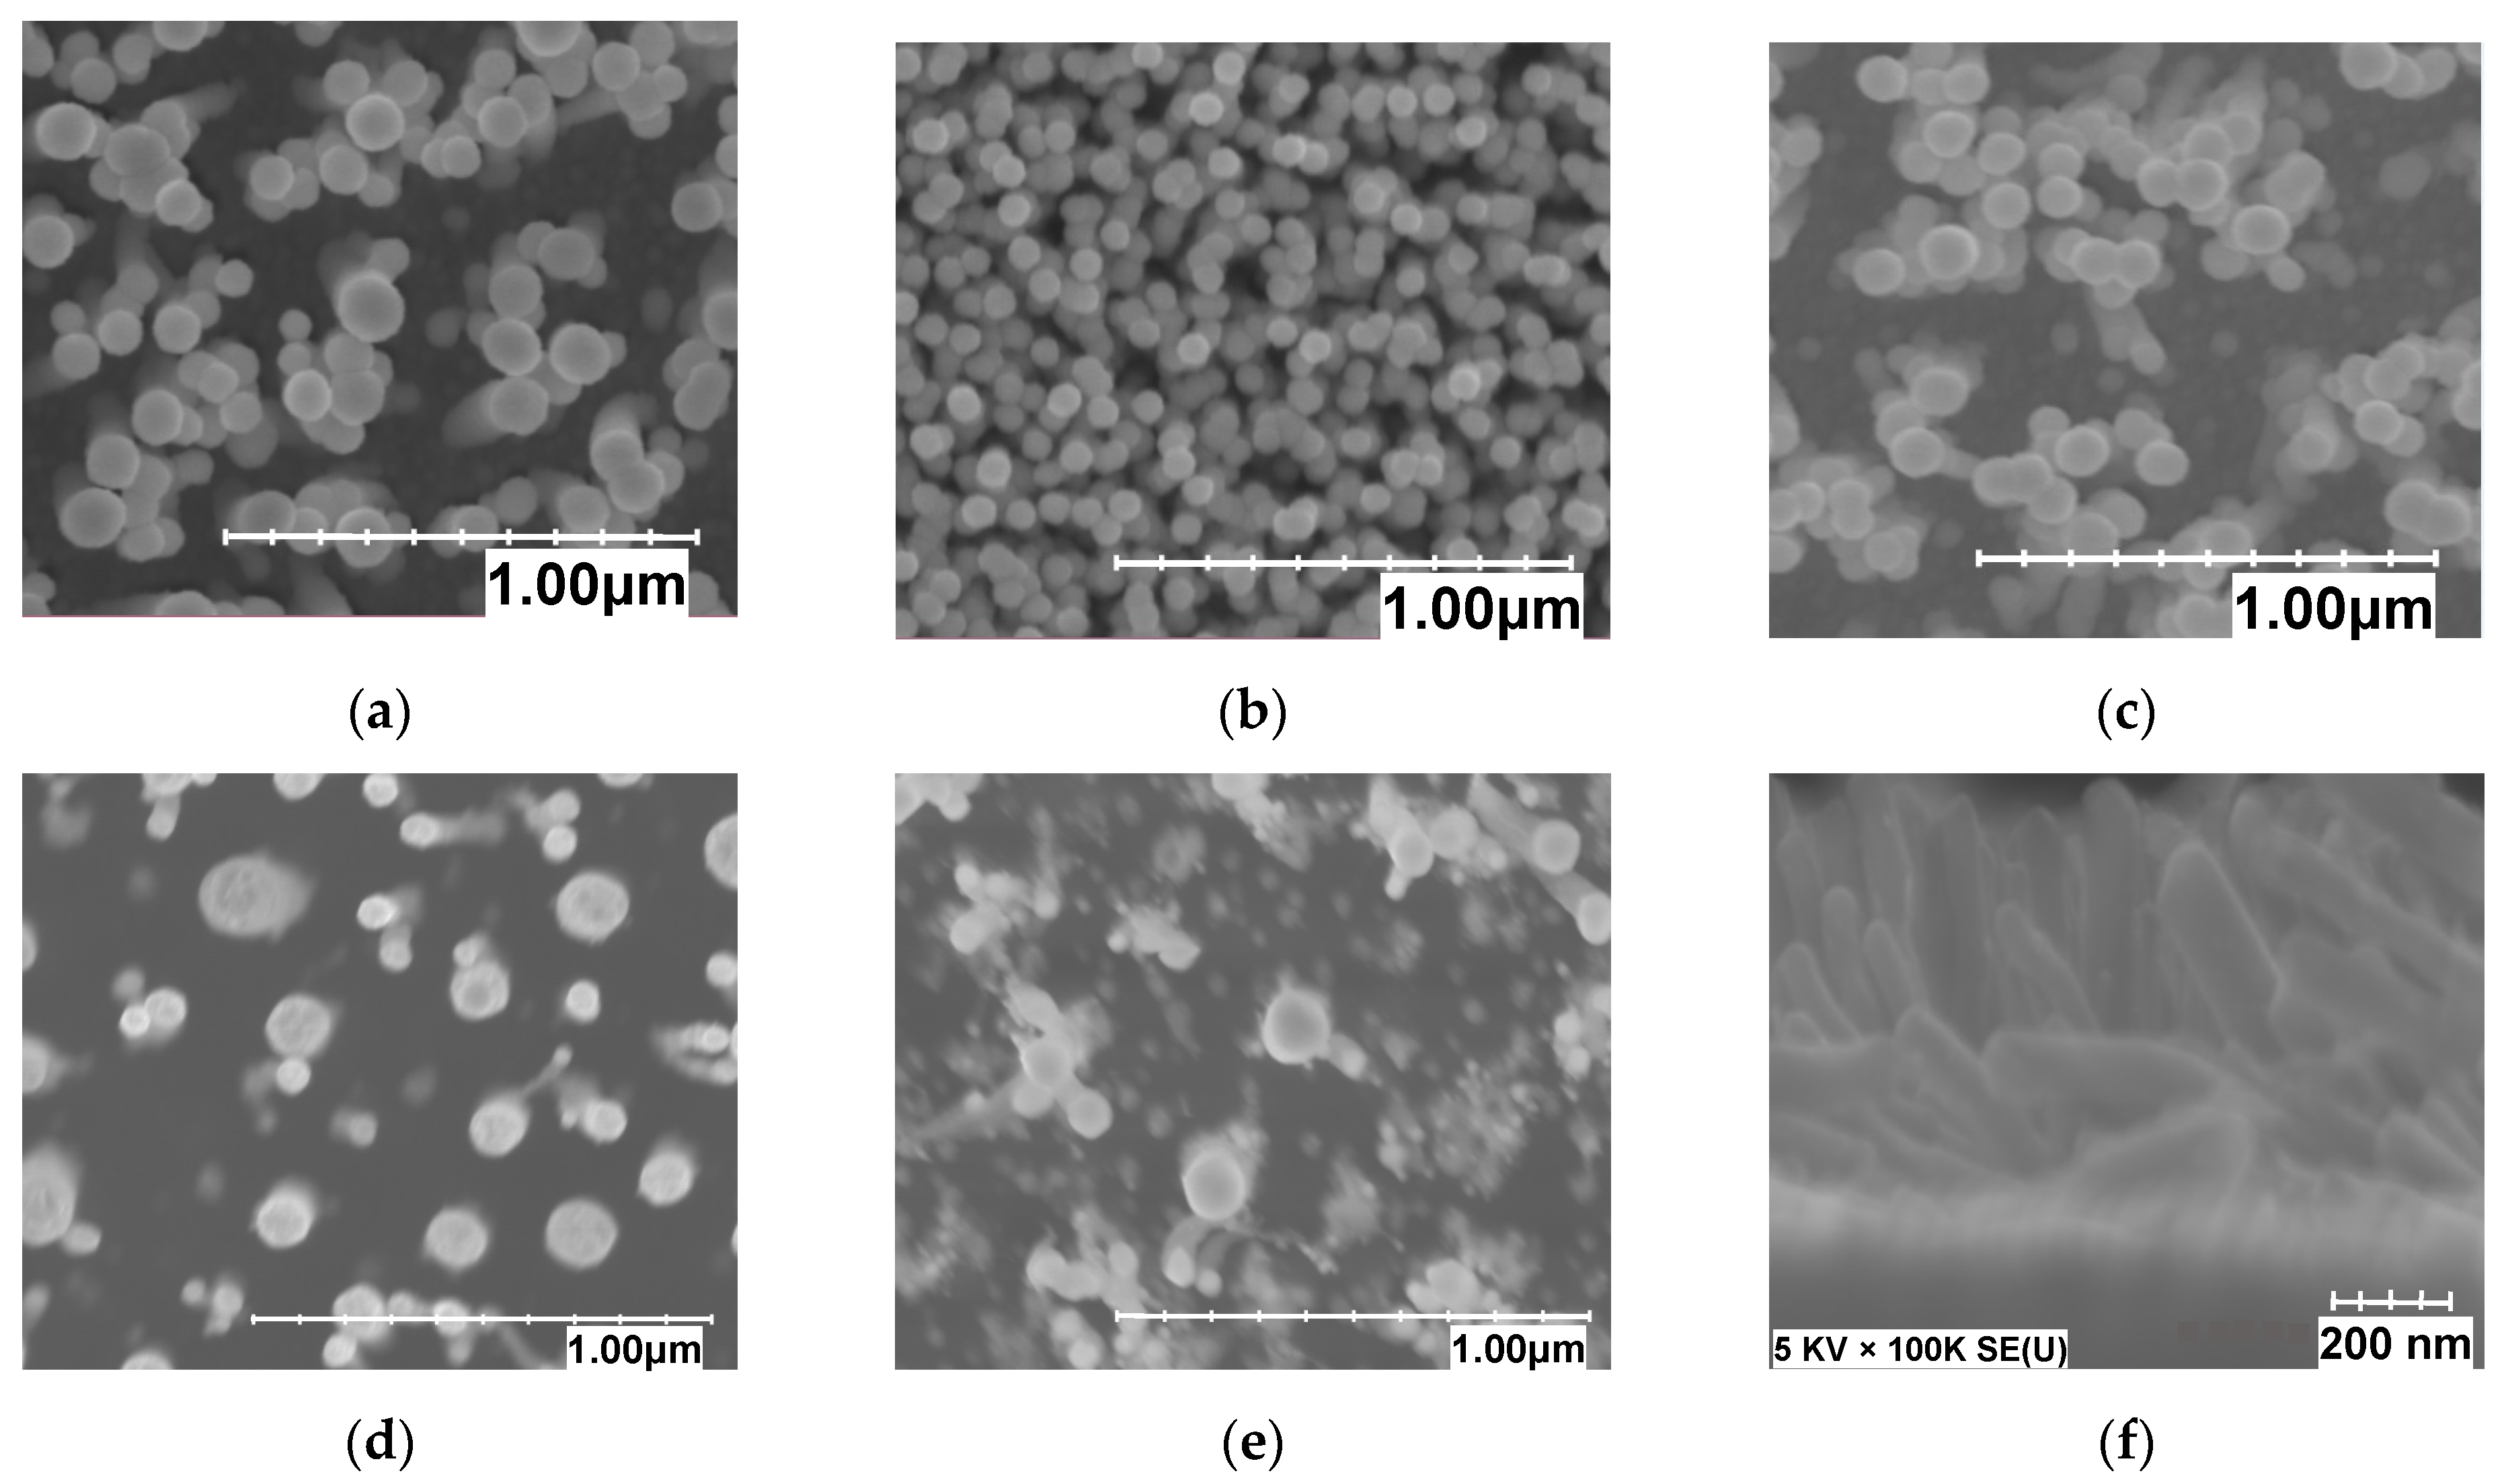
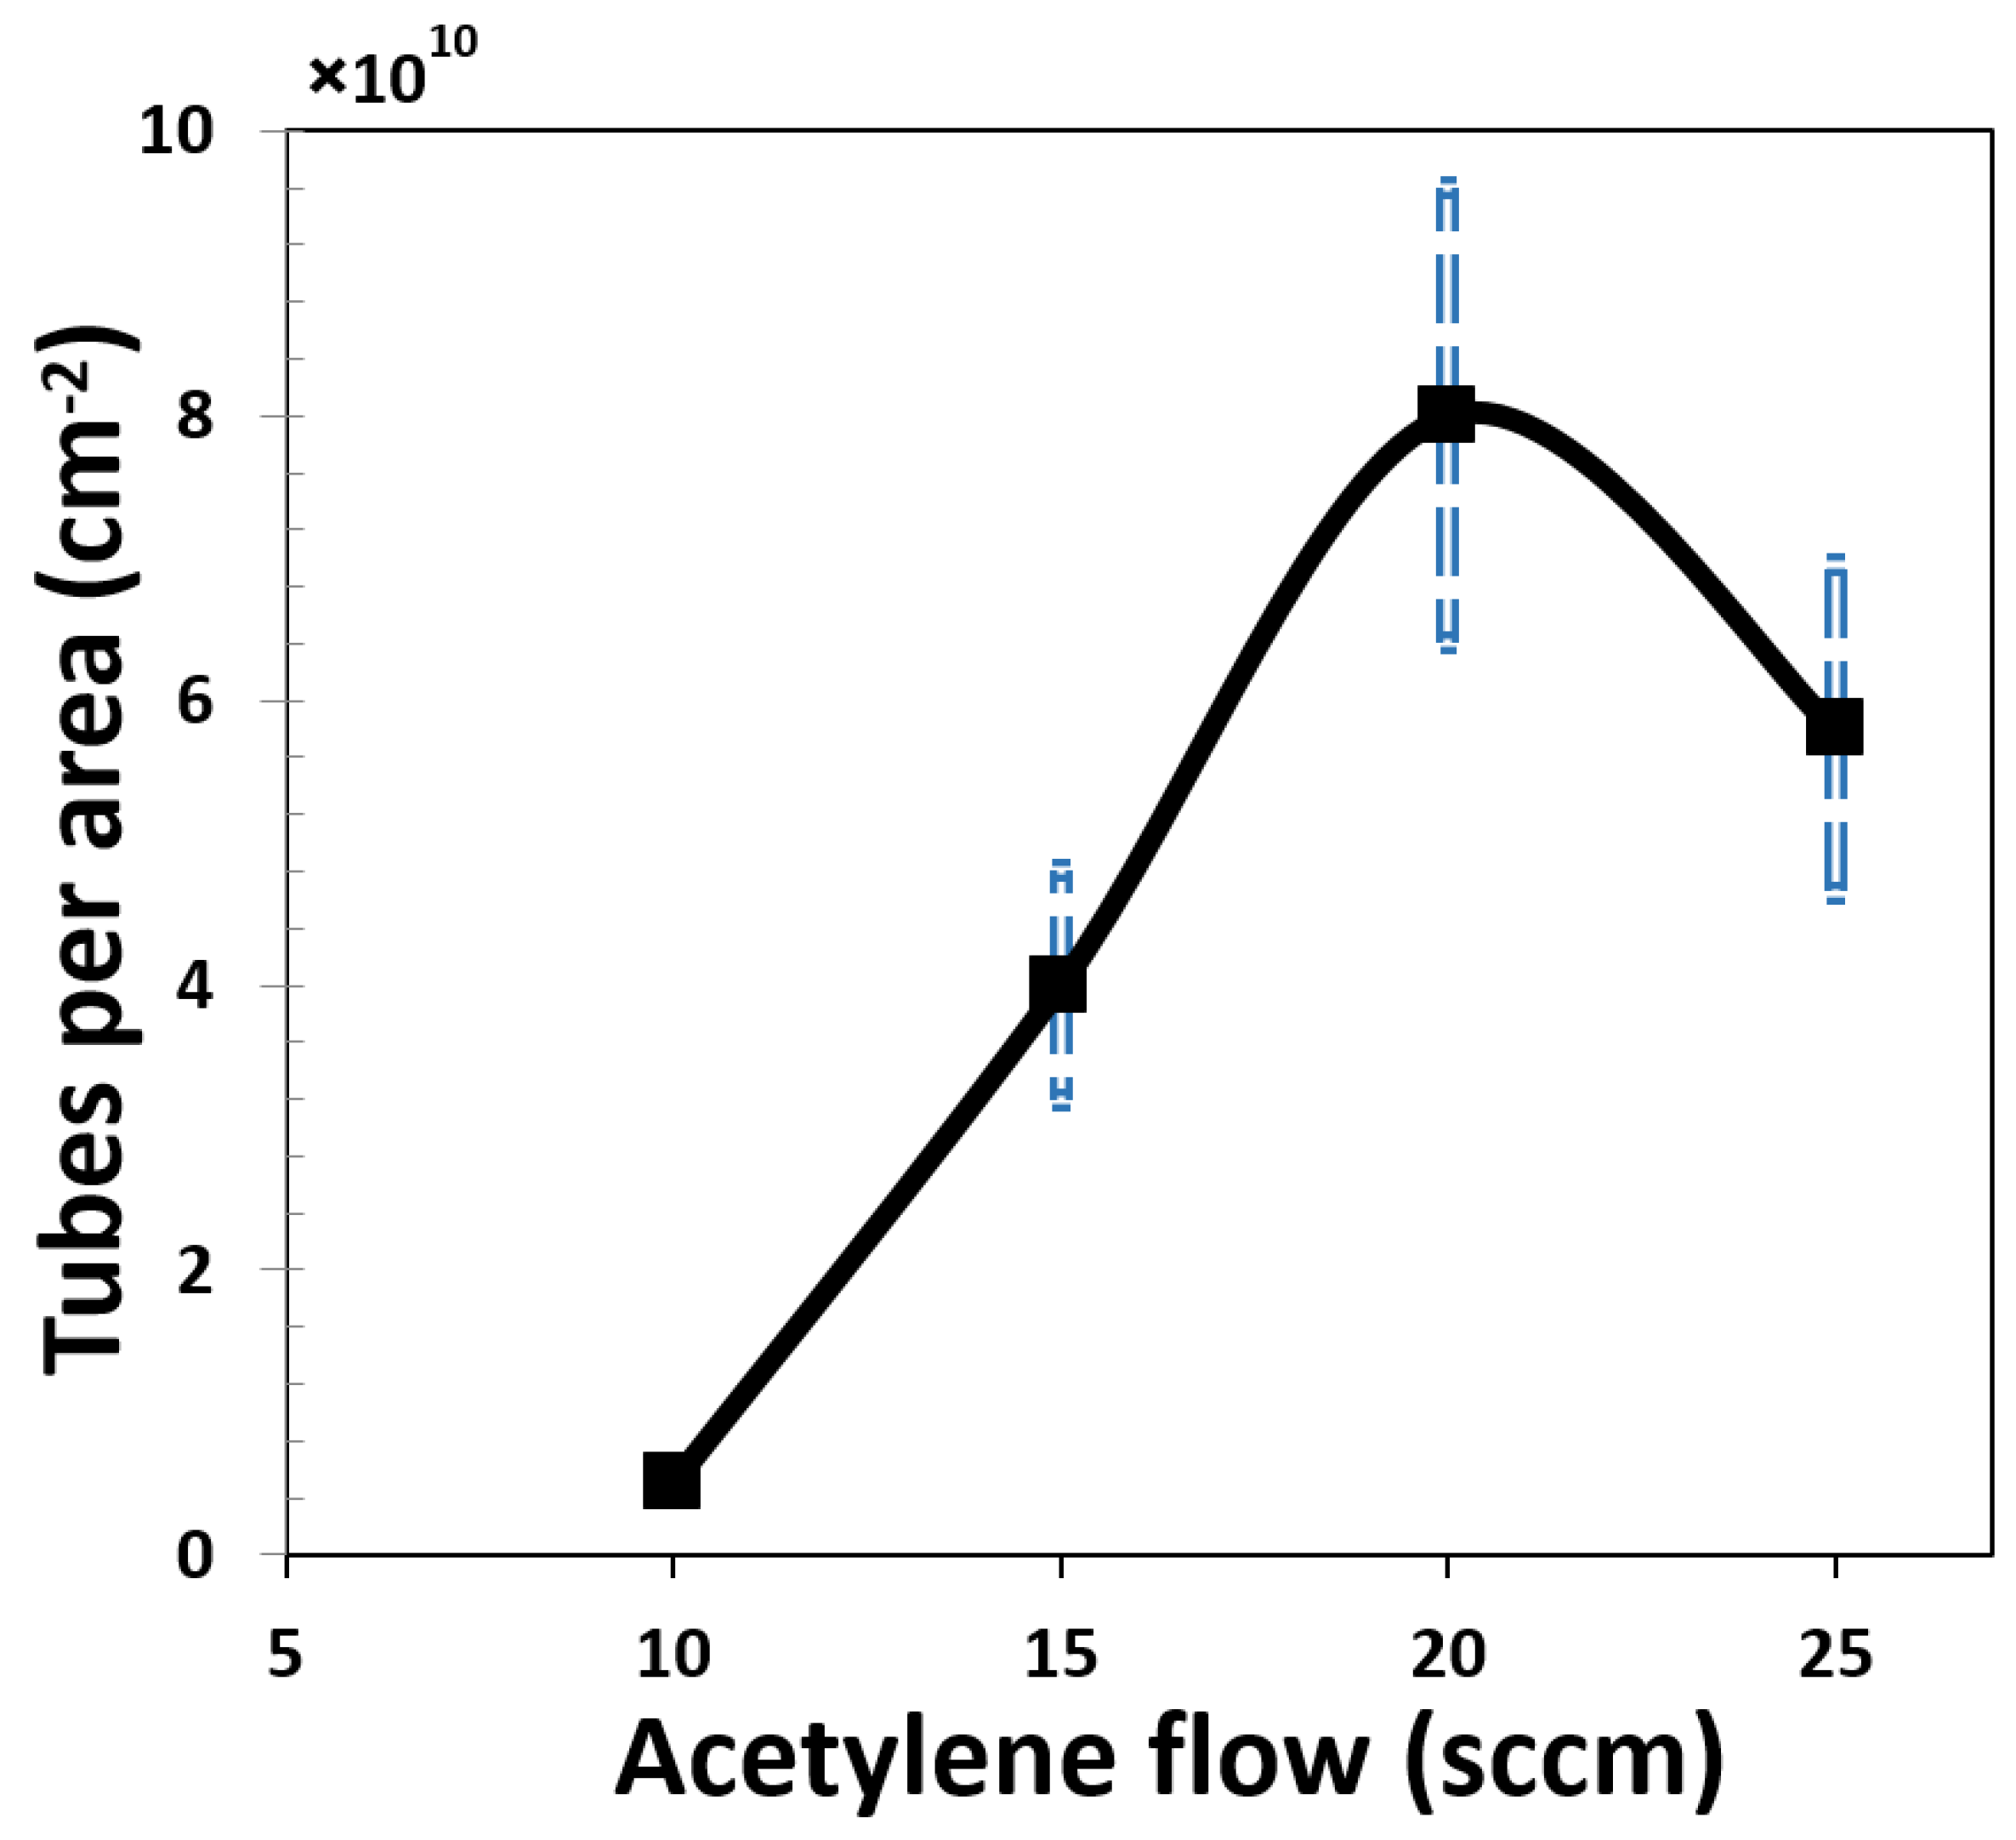
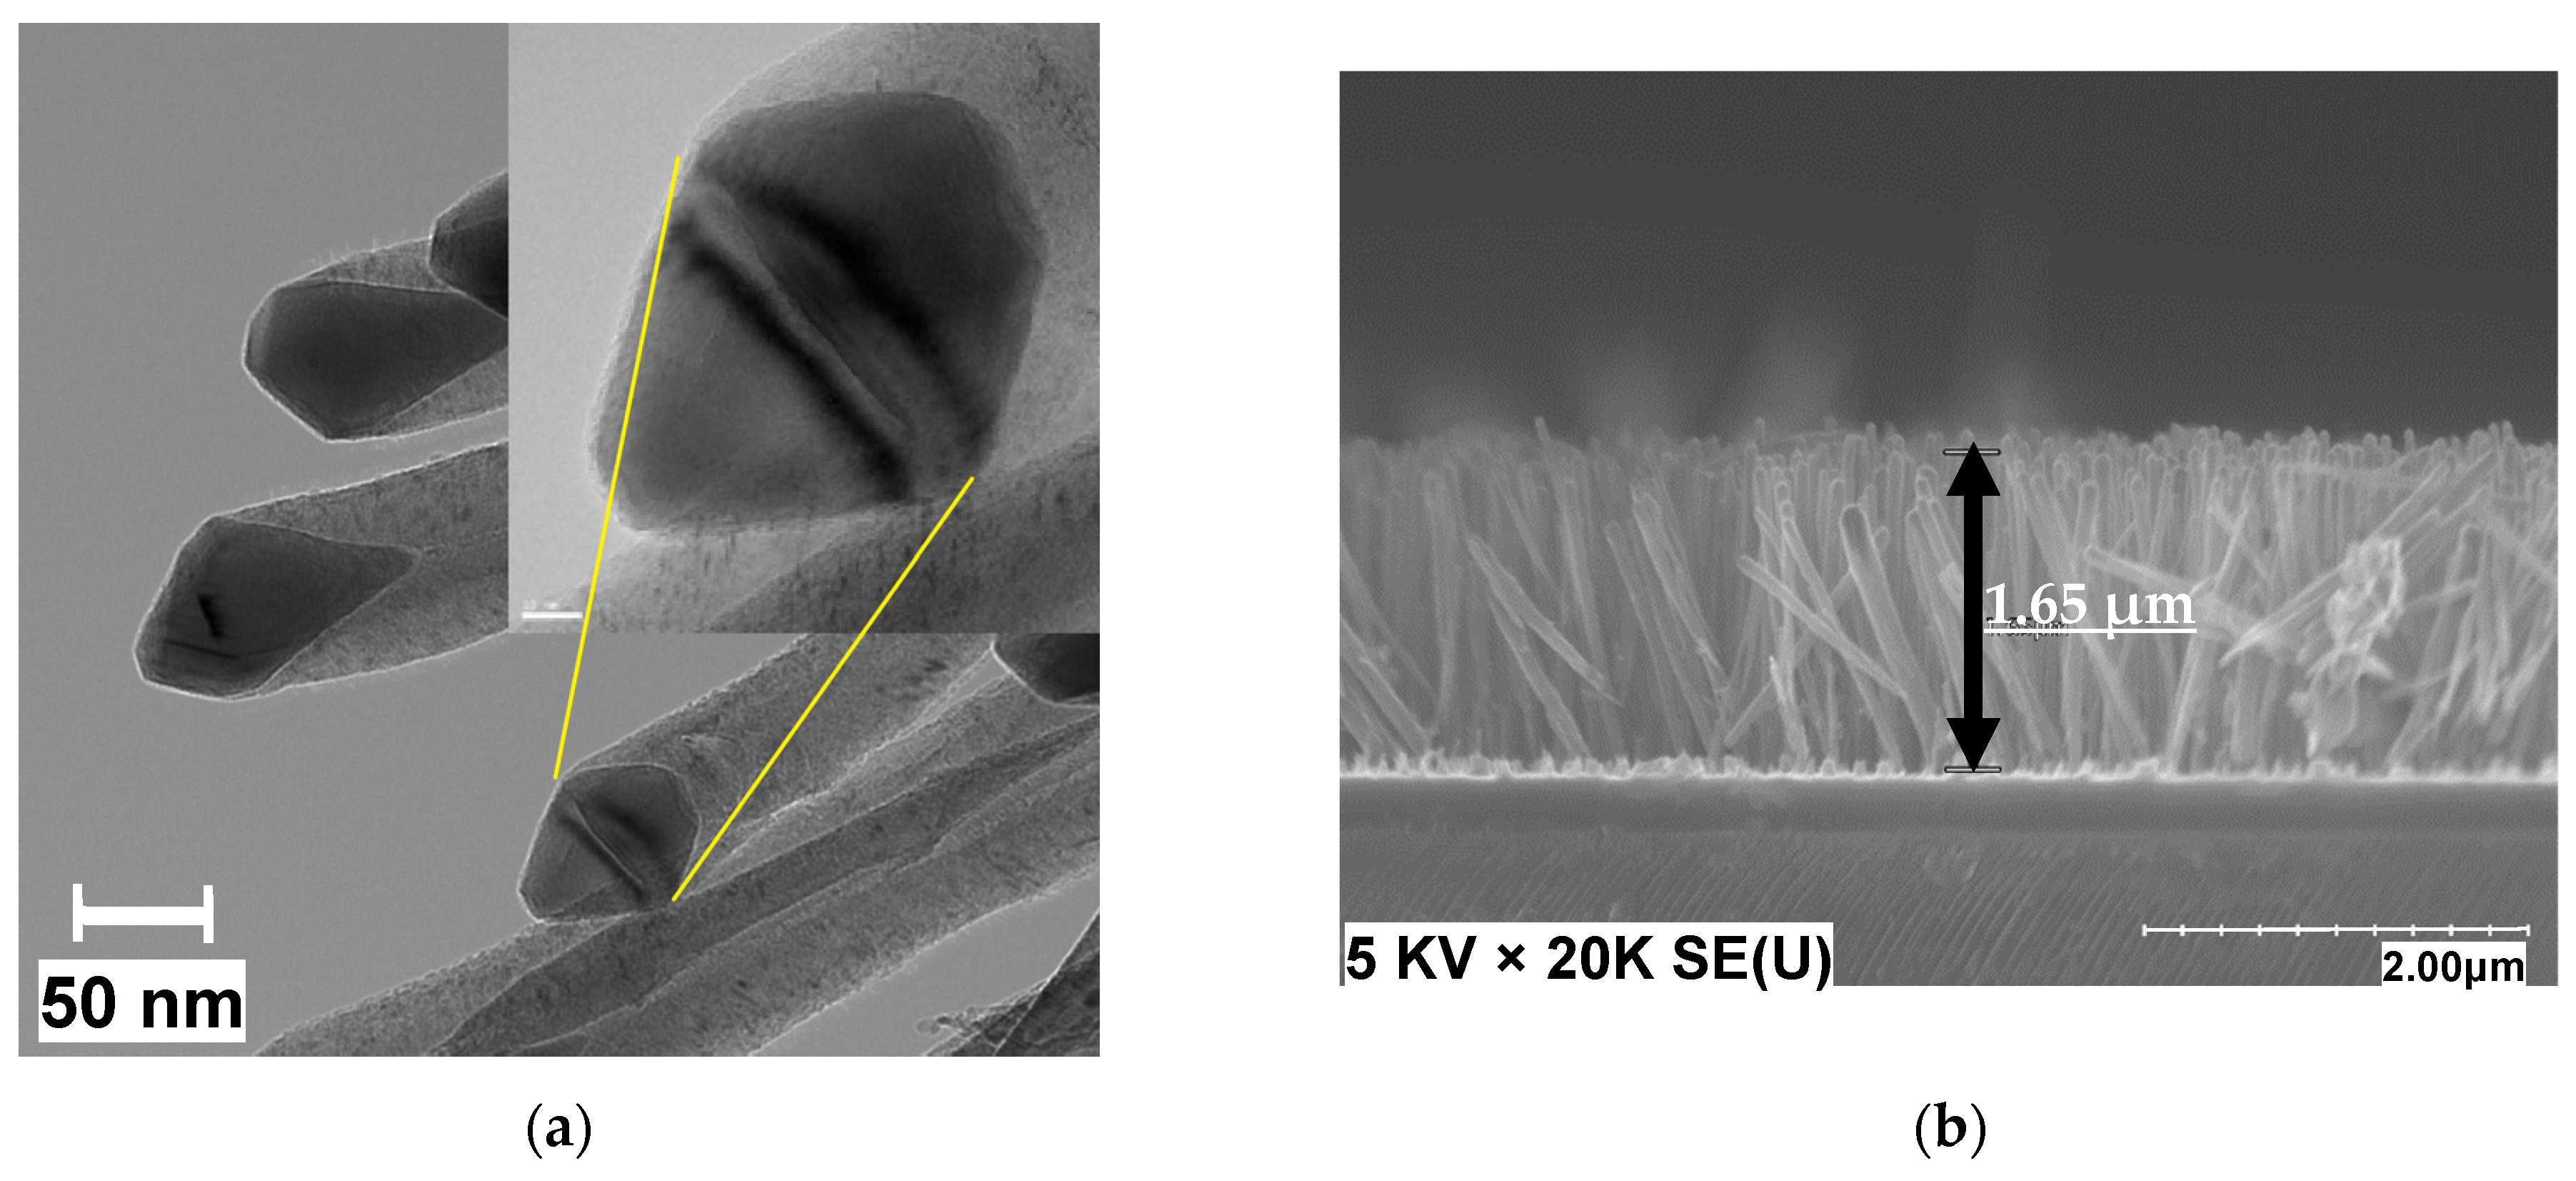
3.1. Characterization
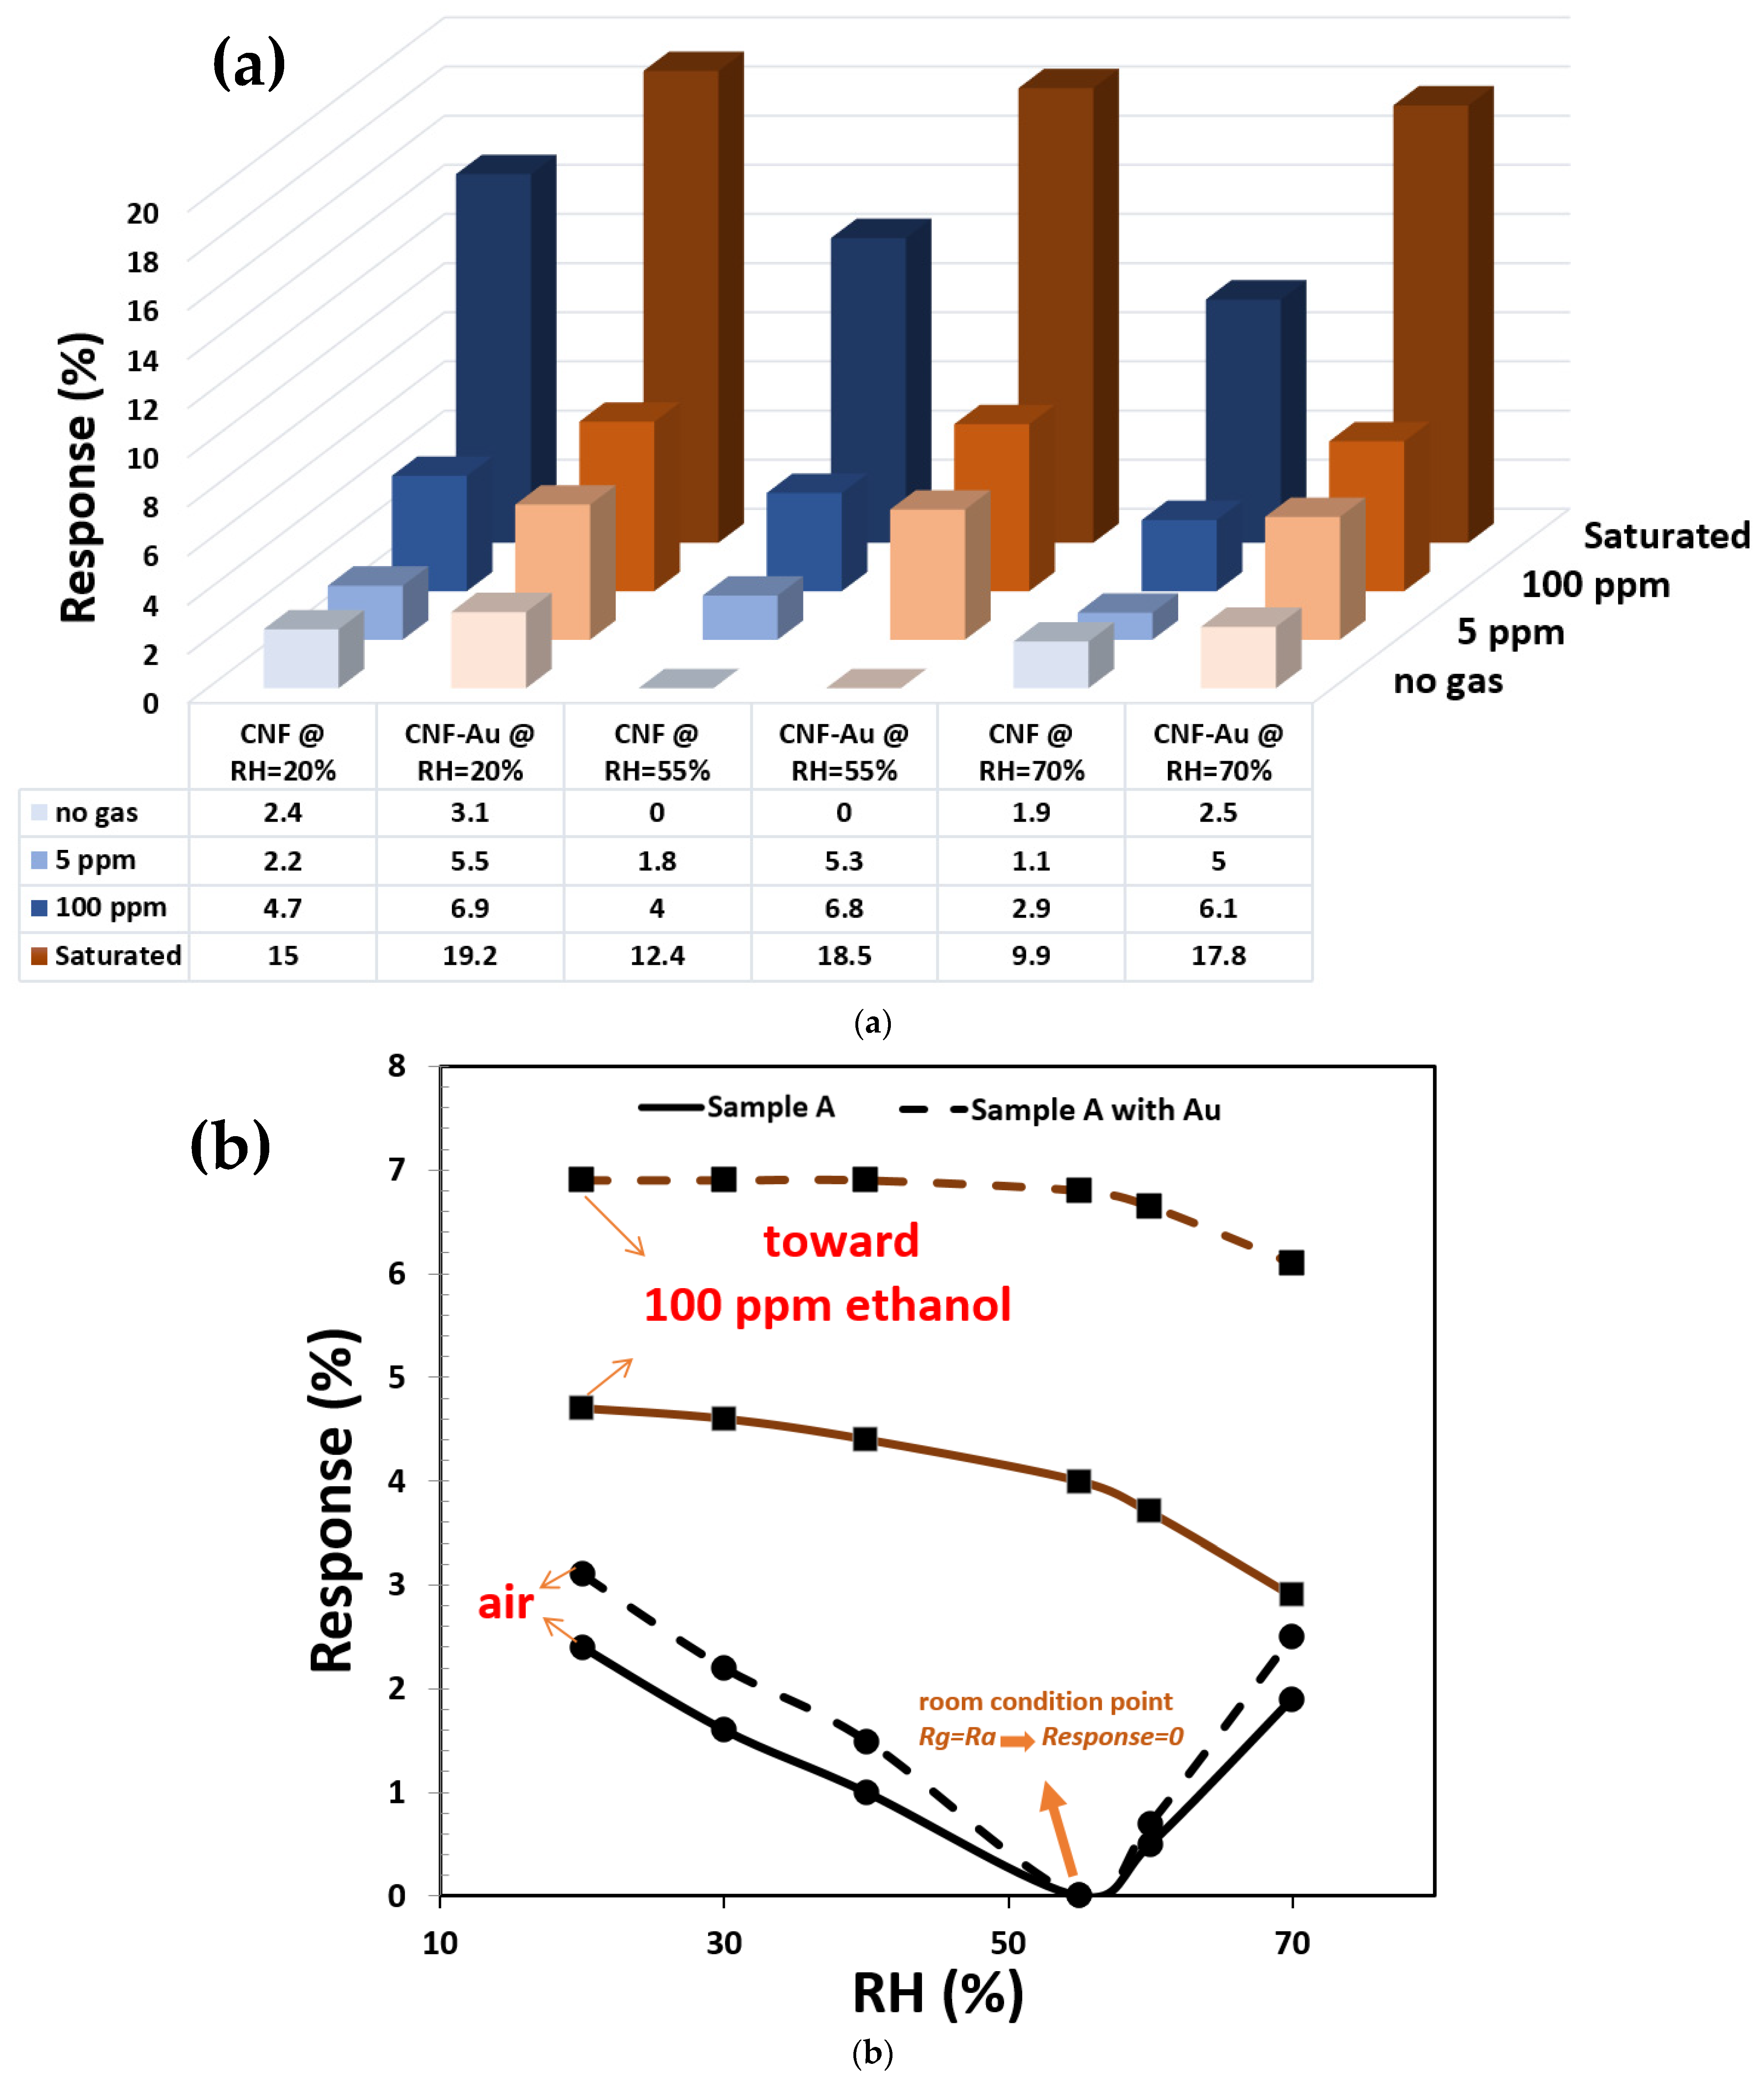
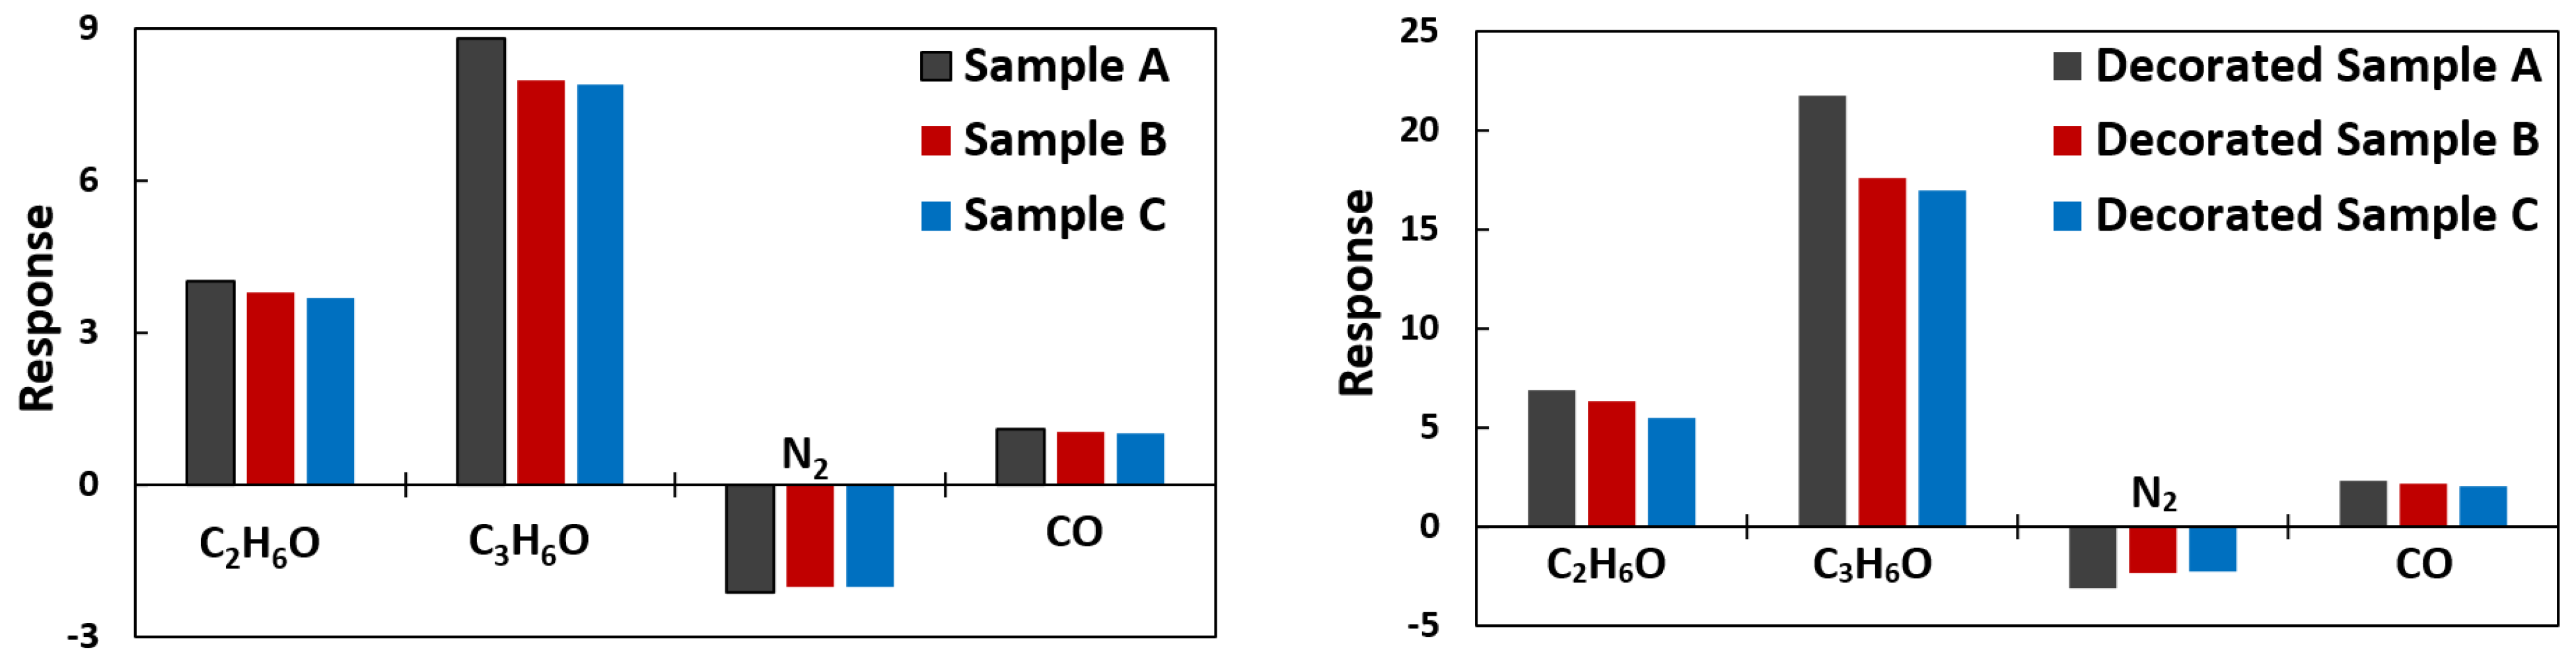
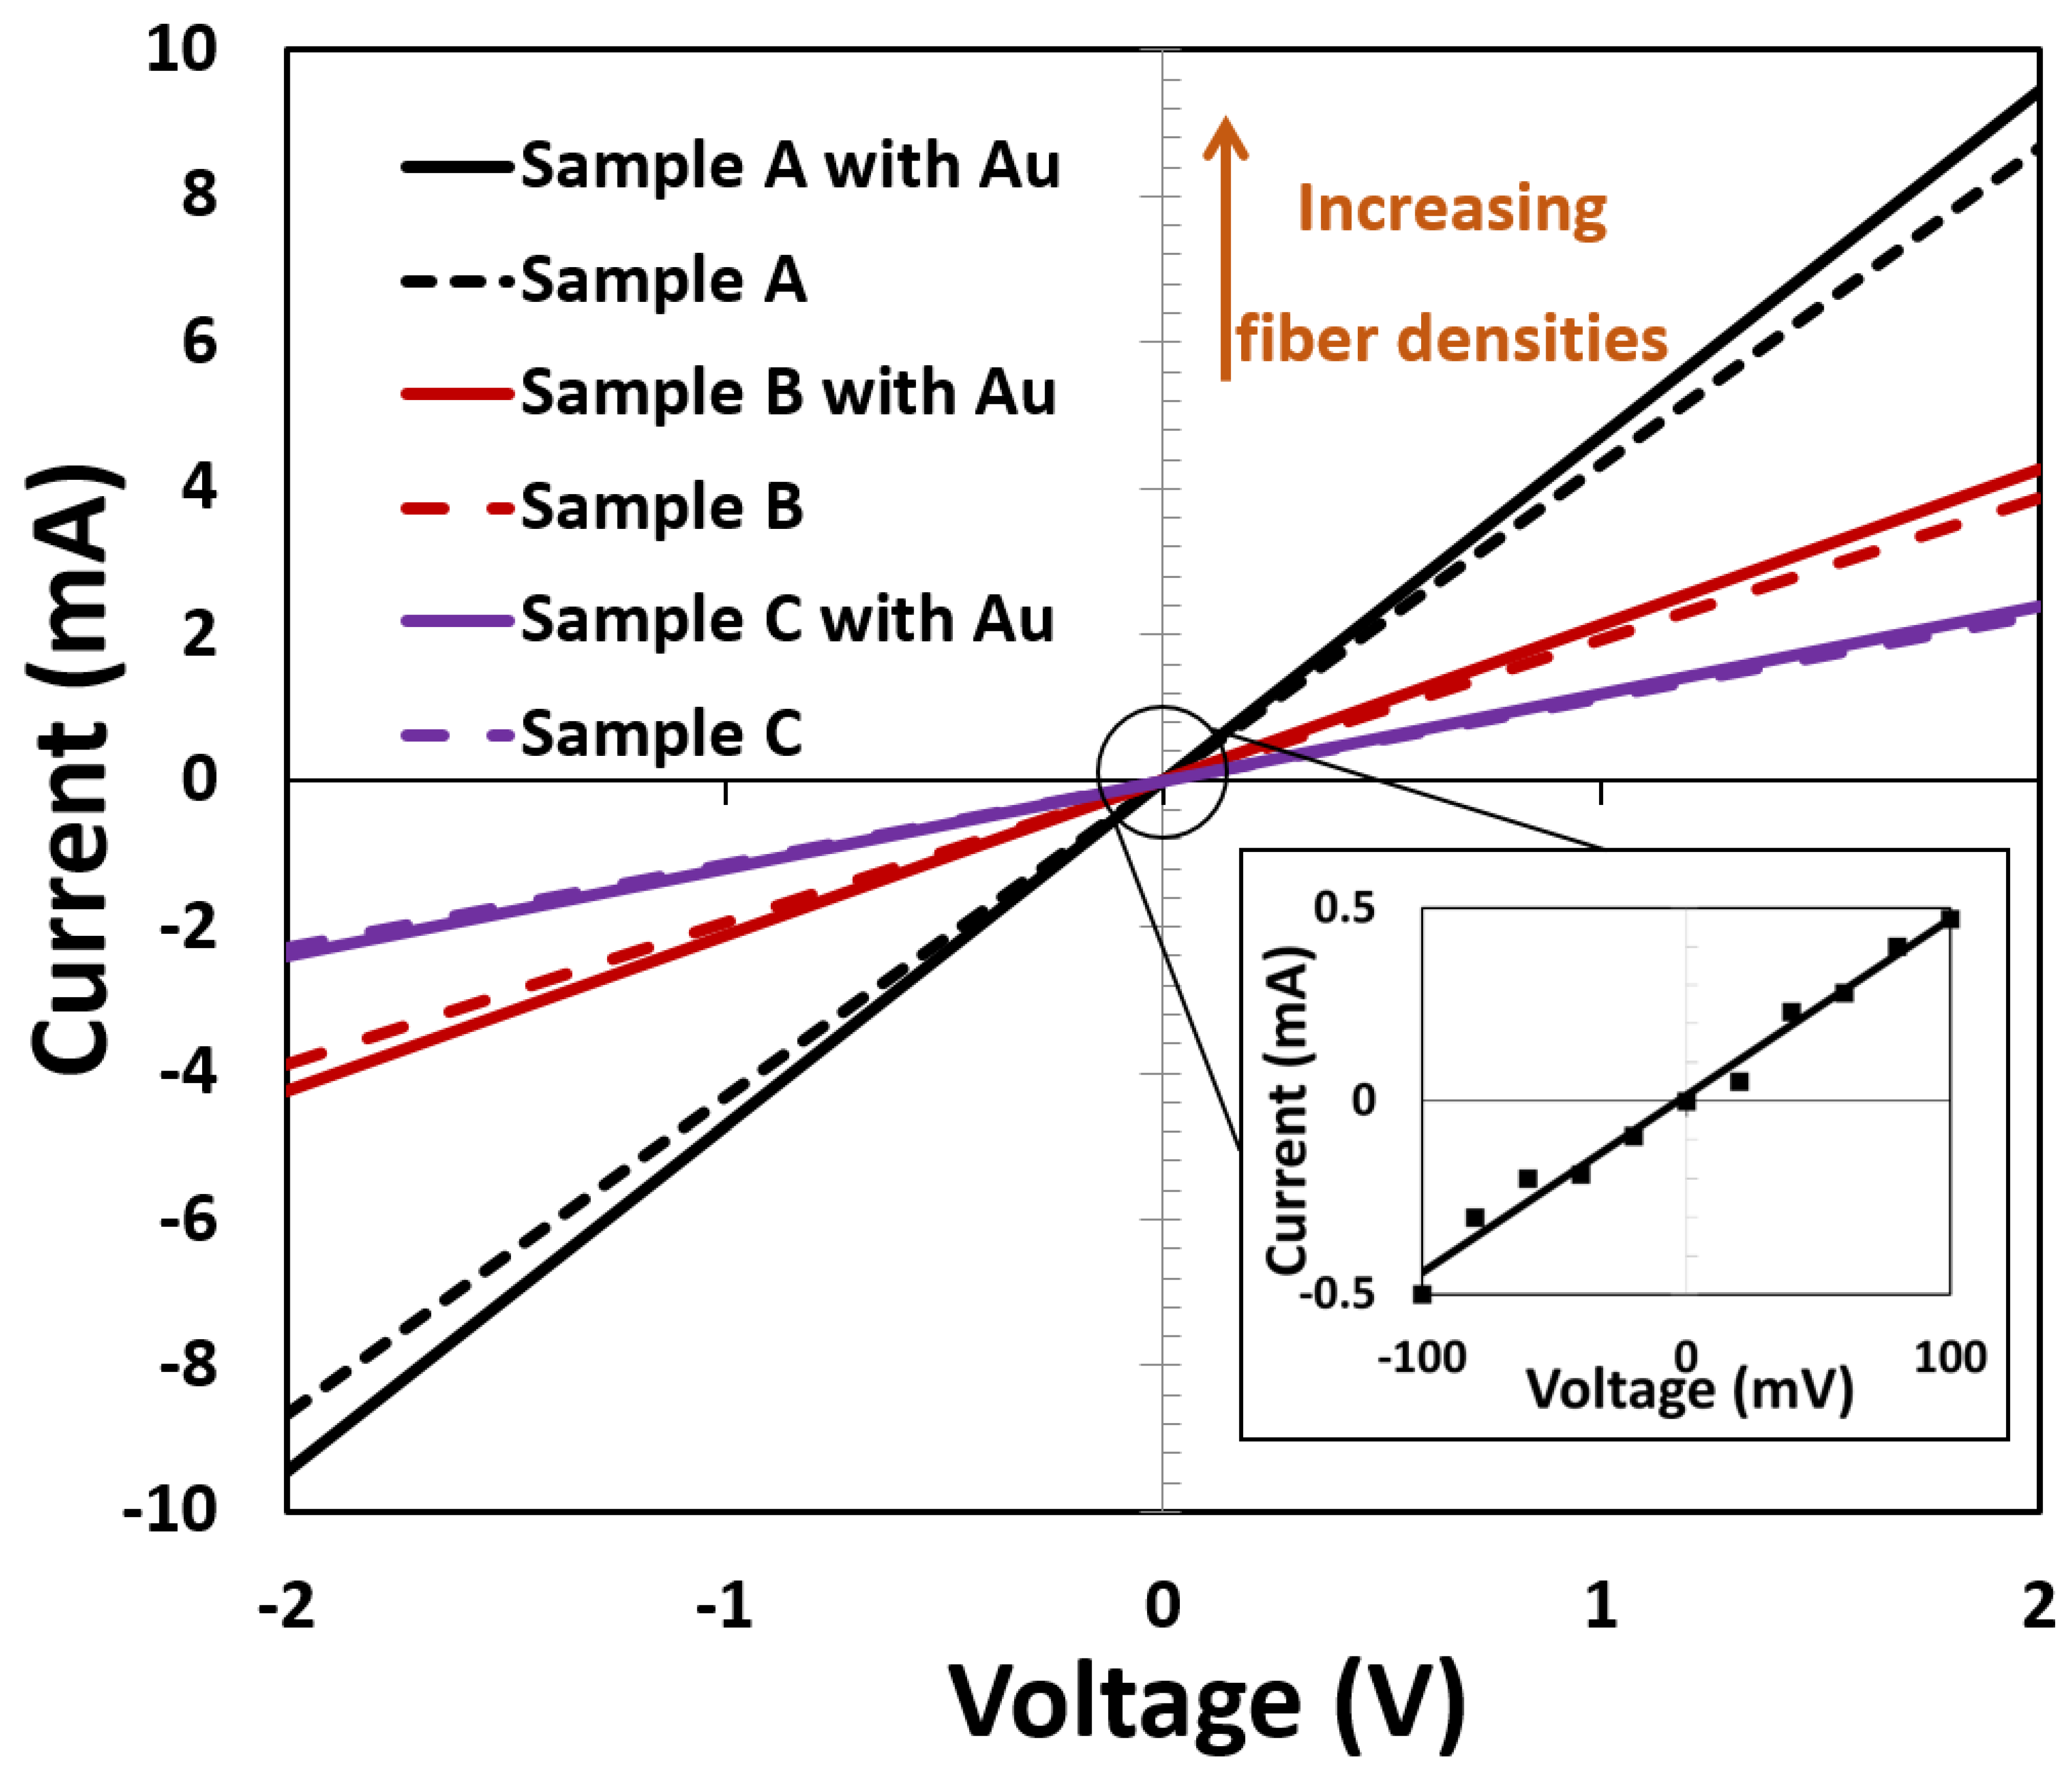
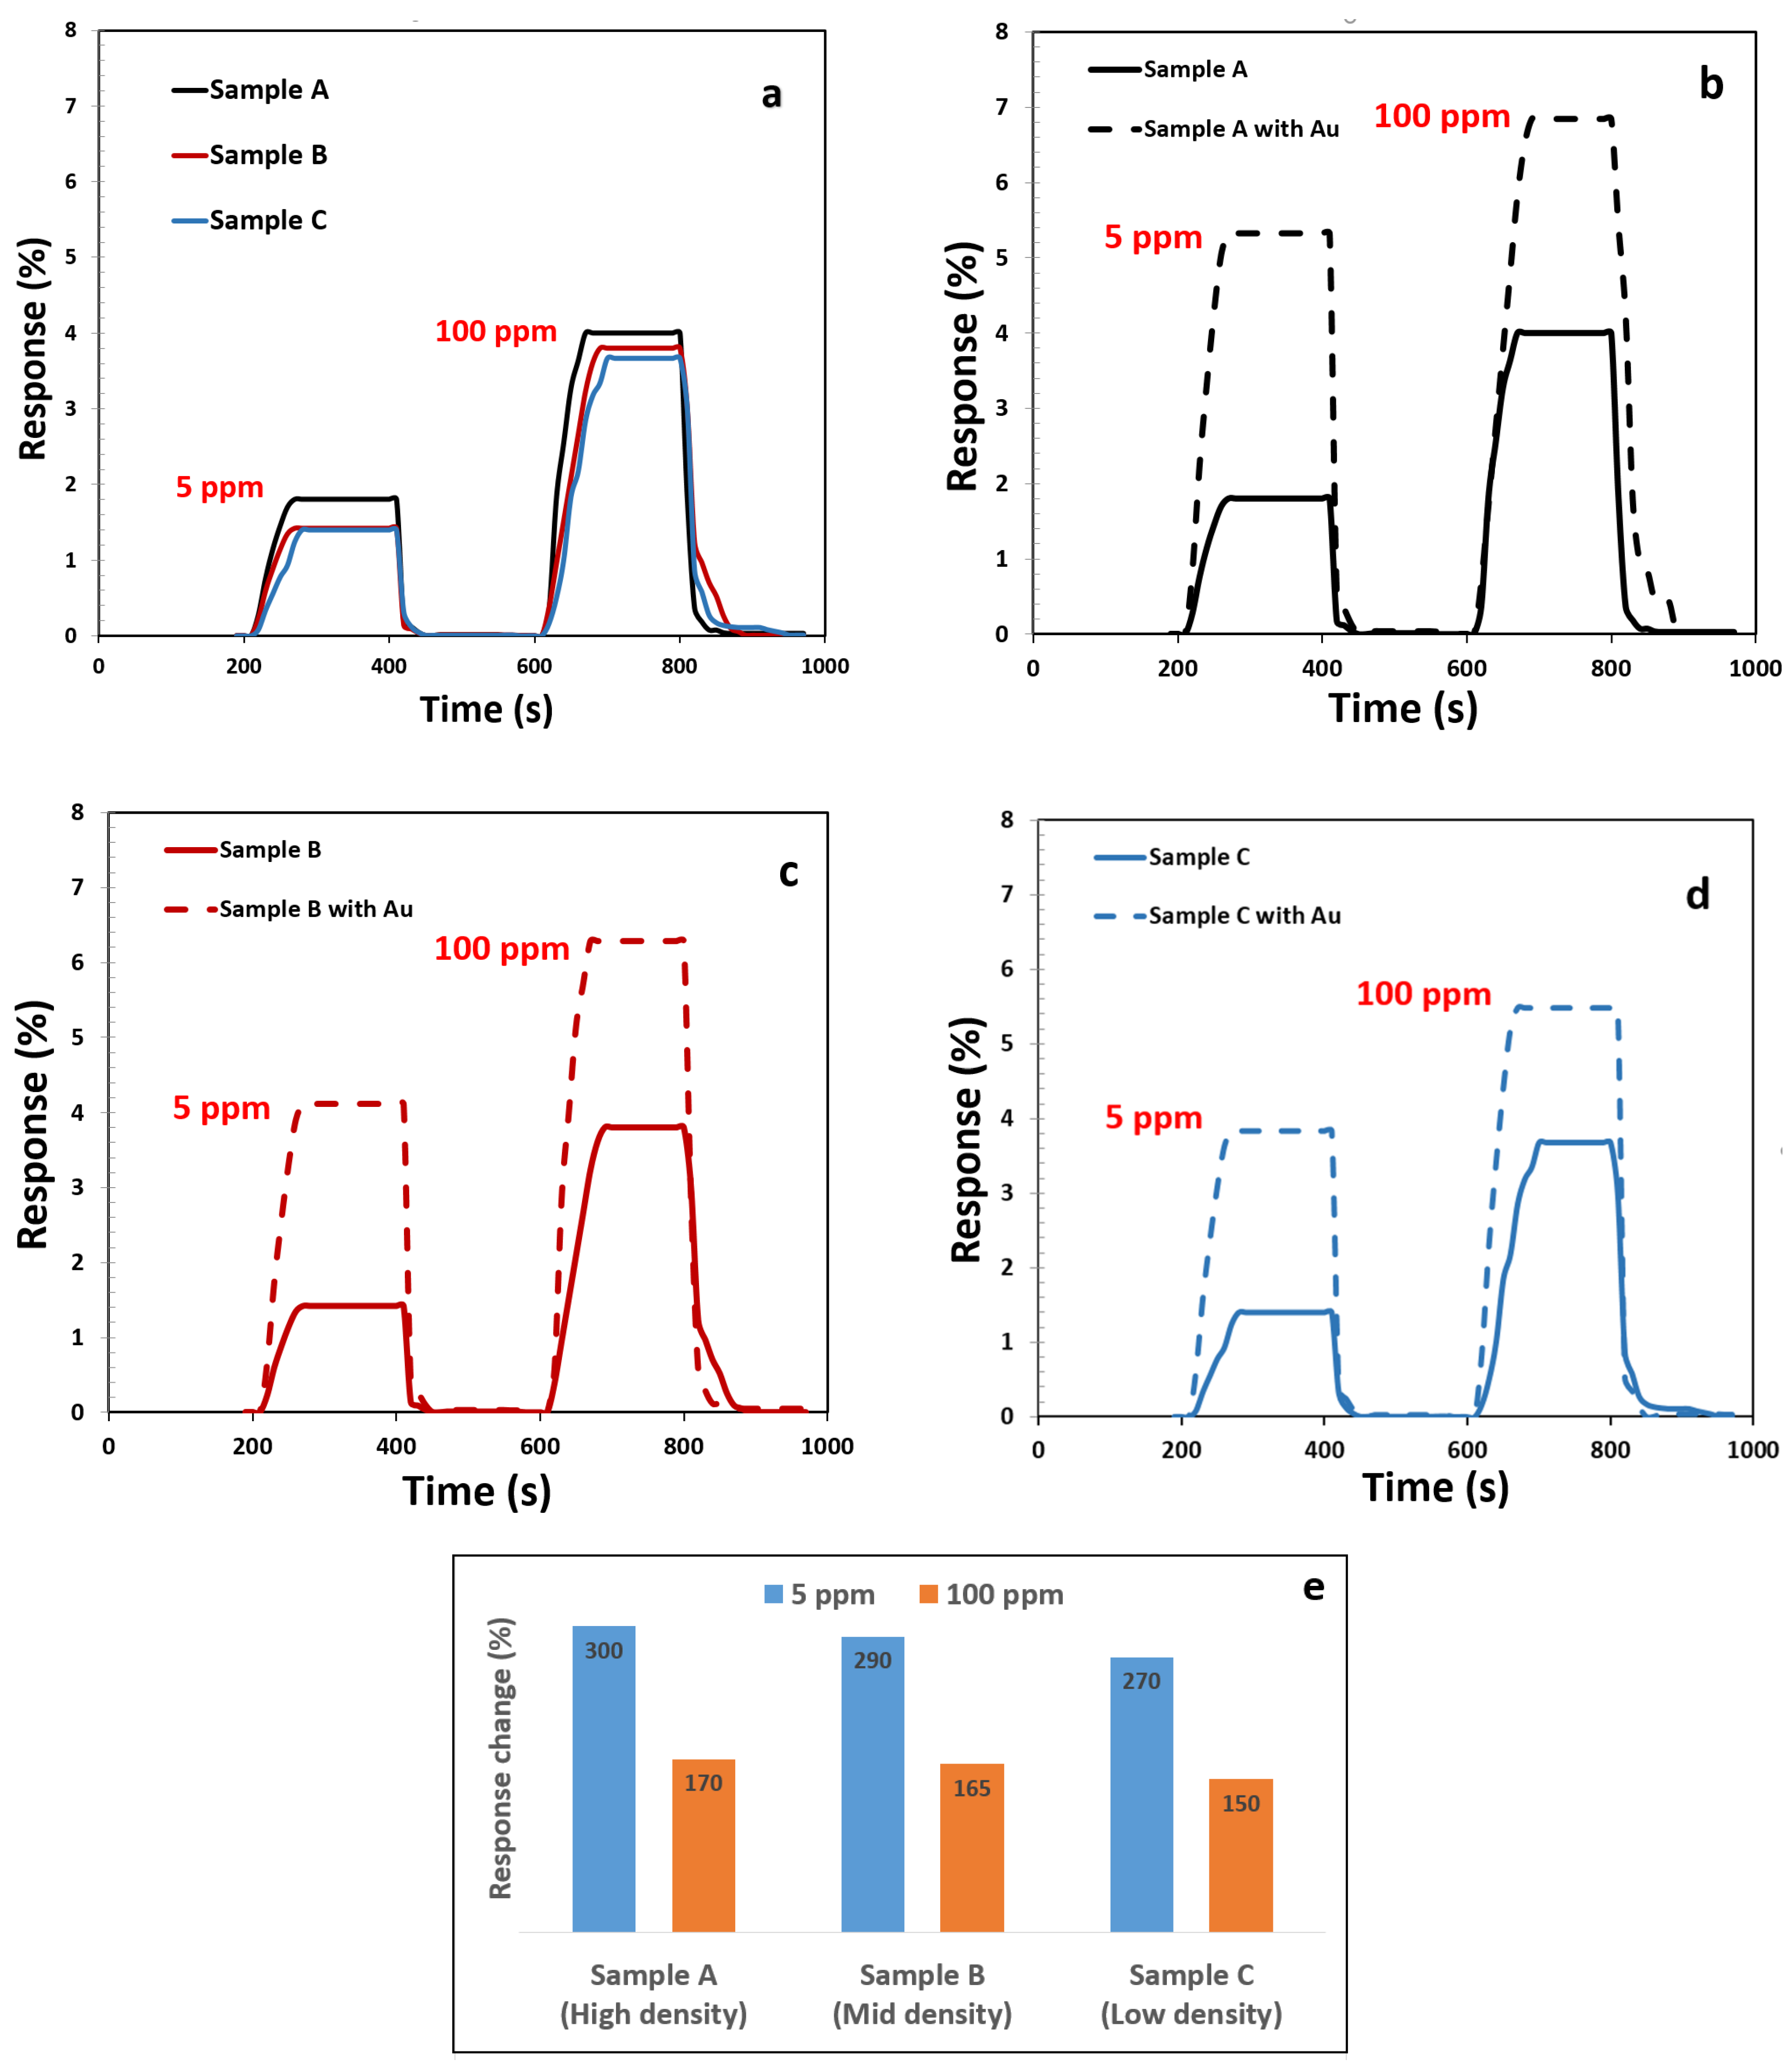
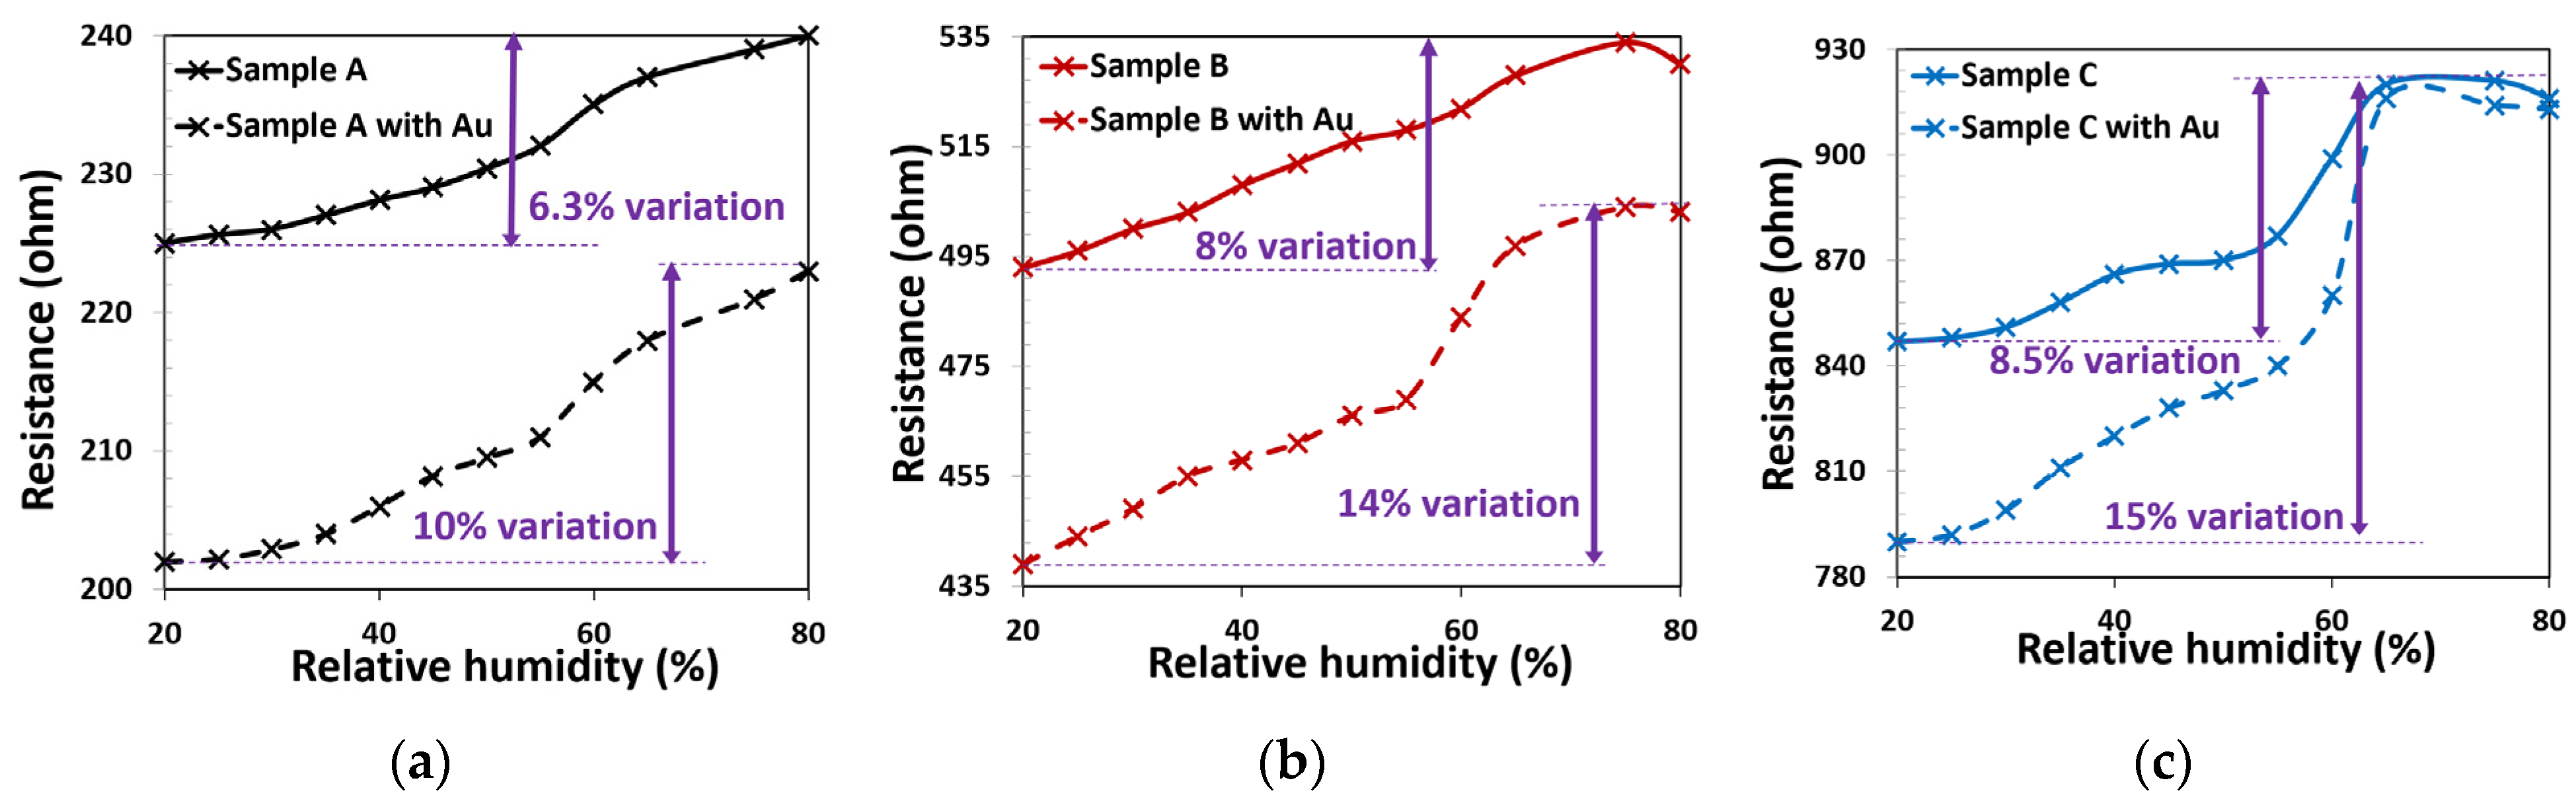
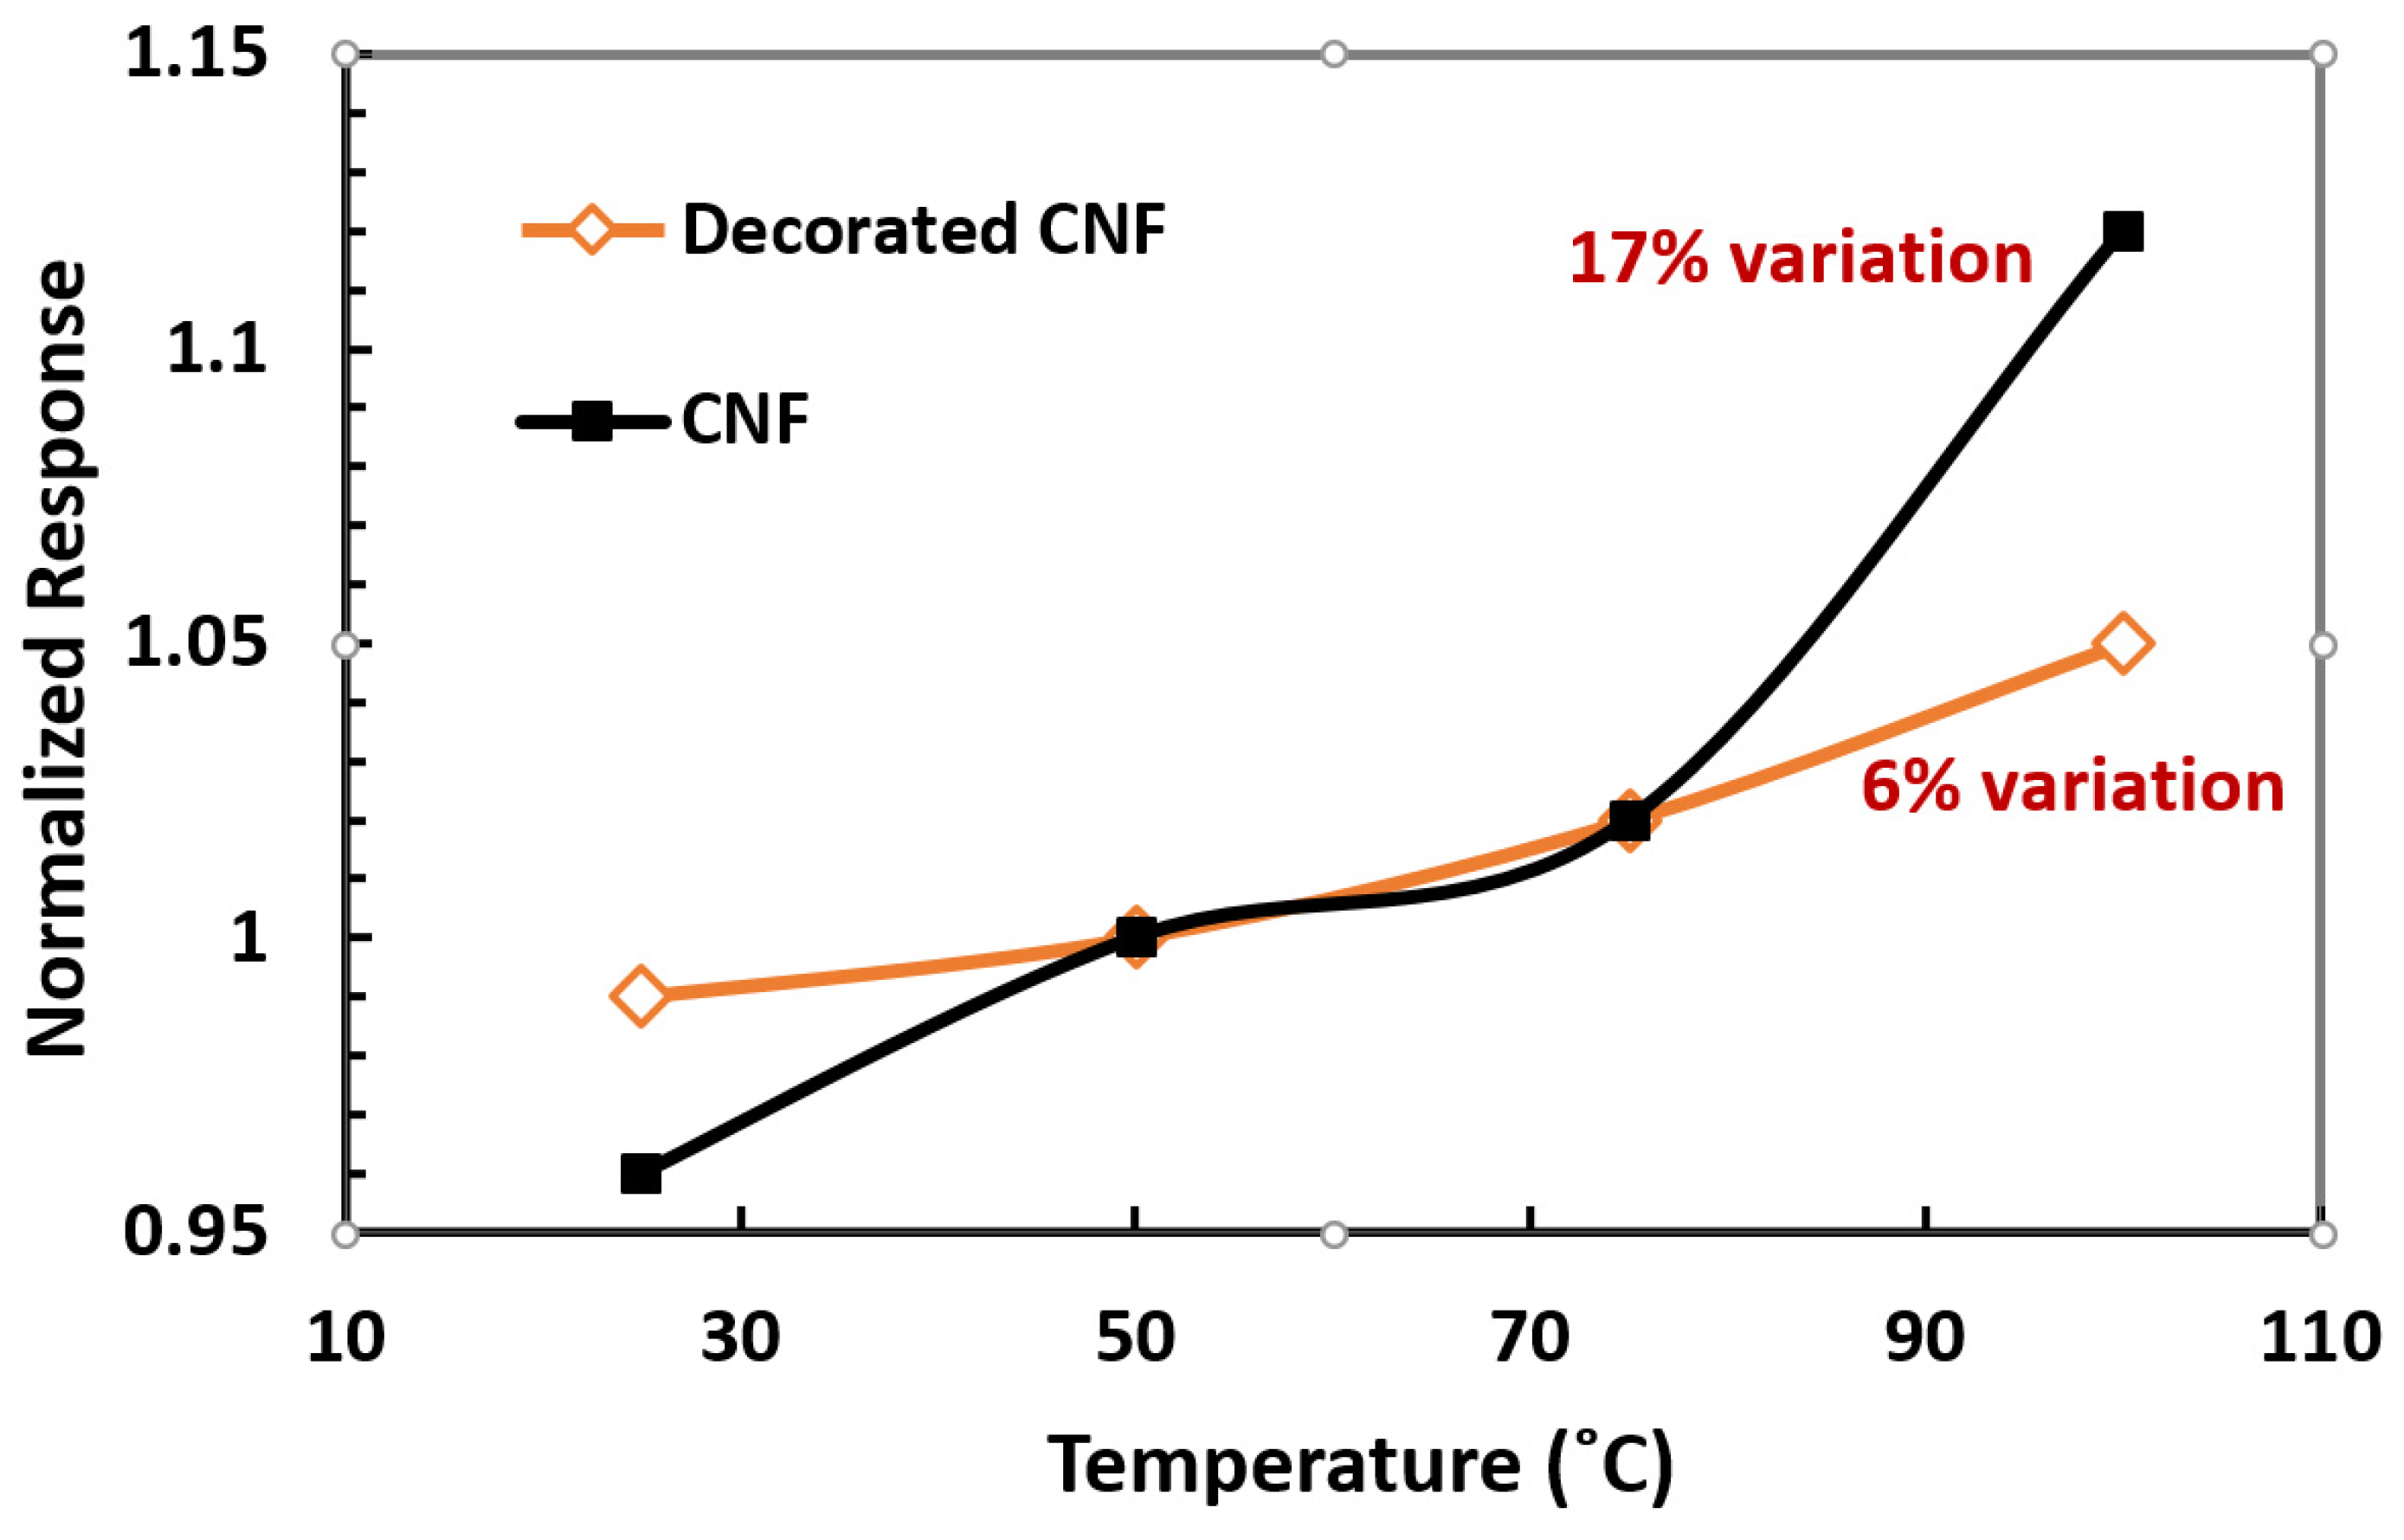
3.2. Gas Sensing Measurements
4. Conclusions
Supplementary Materials
Author Contributions
Funding
Institutional Review Board Statement
Informed Consent Statement
Data Availability Statement
Conflicts of Interest
References
- Yarova, S.; Jones, D.; Jaouen, F.; Cavaliere, S. Strategies to Hierarchical Porosity in Carbon Nanofiber Webs for Electrochemical Applications. Surfaces 2019, 2, 159–176. [Google Scholar] [CrossRef] [Green Version]
- Al Mamun, K.A.; Tulip, F.S.; MacArthur, K.; McFarlane, N.; Islam, S.K.; Hensley, D. Vertically Aligned Carbon Nanofiber based Biosensor Platform for Glucose Sensor. Int. J. High Speed Electron. Syst. 2014, 23, 14500062. [Google Scholar] [CrossRef]
- Wang, Z.; Wu, S.; Wang, J.; Yu, A.; Wei, G. Carbon Nanofiber-Based Functional Nanomaterials for Sensor Applications. Nanomaterials 2019, 9, 1045. [Google Scholar] [CrossRef] [PubMed] [Green Version]
- Ruiz-Cornejo, J.C.; Sebastián, D.; Lázaro, M.J. Synthesis and applications of carbon nanofibers: A review. Rev. Chem. Eng. 2020, 36, 493–511. [Google Scholar] [CrossRef]
- Mohamed, A. Synthesis, Characterization, and Applications Carbon Nanofibers. In Carbon-Based Nanofillers and Their Rubber Nanocomposites; Yaragalla, S., Mishra, R., Thomas, S., Kalarikkal, N., Maria, H., Eds.; Elsevier: Amsterdam, The Netherlands, 2019; pp. 243–257. [Google Scholar]
- Lee, C.S.; Hyun, Y. Preparation and Characterization of Carbon Nanofibers and Its Composites by Chemical Vapor Deposition. In Chemical Vapor Deposition—Recent Advances and Applications in Optical, Solar Cells and Solid State Devices; Nerella, S., Ed.; IntechOpen: London, UK, 2016. [Google Scholar]
- Shooshtari, M.; Rahbarpour, S.; Tabatabai, S.K.; Ghafourifard, H. Catalyst Thickness Effect on Carbon-Nanotubes Diameter and Gas Response. In Proceedings of the 1st International Conference on New Research Achievements in Electrical & Computer Engineering (ICNRAECE), Tehran, Iran, 13 May 2016. [Google Scholar]
- Bannov, A.; Uvarov, N.; Ukhina, A.; Chukanov, I.; Dyukova, K.; Kuvshinov, G. Structural changes in carbon nanofibers induced by ball milling. Carbon 2012, 50, 1090–1098. [Google Scholar] [CrossRef]
- Zhao, Z.; Gou, J.; Khan, A. Processing and Structure of Carbon Nanofiber Paper. J. Nanomater. 2009, 2009, 325769. [Google Scholar] [CrossRef] [Green Version]
- Hérou, S.; Bailey, J.J.; Kok, M.; Schlee, P.; Jervis, R.; Brett, D.J.; Shearing, P.; Ribadeneyra, M.; Titirici, M. High-Density Lignin-Derived Carbon Nanofiber Supercapacitors with Enhanced Volumetric Energy Density. Adv. Sci. 2021, 8, 2100016. [Google Scholar] [CrossRef]
- Monereo, O.; Claramunt, S.; de Marigorta, M.M.; Boix, M.; Leghrib, R.; Prades, J.; Cornet, A.; Merino, P.; Merino, C.; Cirera, A.; et al. Flexible sensor based on carbon nanofibers with multifunctional sensing features. Talanta 2013, 107, 239–247. [Google Scholar] [CrossRef]
- Ma, P.-C.; Siddiqui, N.A.; Marom, G.; Kim, J.-K. Dispersion and functionalization of carbon nanotubes for polymer-based nanocomposites: A review. Compos. Part A Appl. Sci. Manuf. 2010, 41, 1345–1367. [Google Scholar] [CrossRef]
- Claramunt, S.; Monereo, O.; Boix, M.; Leghrib, R.; Prades, J.; Cornet, A.; Merino, P.; Cirera, A. Flexible gas sensor array with an embedded heater based on metal decorated carbon nanofibers. Sens. Actuators B Chem. 2013, 187, 401–406. [Google Scholar] [CrossRef] [Green Version]
- Franke, M.E.; Koplin, T.J.; Simon, U. Metal and metal oxide nanoparticles in chemiresistors: Does the nanoscale matter? Small 2006, 2, 36–50. [Google Scholar] [CrossRef] [PubMed]
- Tang, X.; Debliquy, M.; Lahem, D.; Yan, Y.; Raskin, J.-P. A Review on Functionalized Graphene Sensors for Detection of Ammonia. Sensors 2021, 21, 1443. [Google Scholar] [CrossRef] [PubMed]
- Tang, R.; Shi, Y.; Hou, Z.; Wei, L. Carbon nanotube-based chemiresistive sensors. Sensors 2017, 17, 882. [Google Scholar] [CrossRef] [PubMed]
- Mubeen, S.; Zhang, T.; Chartuprayoon, N.; Rheem, Y.; Mulchandani, A.; Myung, N.V.; Deshusses, M.A. Sensitive Detection of H2S Using Gold Nanoparticle Decorated Single-Walled Carbon Nanotubes. Anal. Chem. 2010, 82, 250–257. [Google Scholar] [CrossRef] [PubMed] [Green Version]
- Star, A.; Joshi, V.; Skarupo, S.; Thomas, D.; Gabriel, J.-C.P. Gas Sensor Array Based on Metal-Decorated Carbon Nanotubes. J. Phys. Chem. B 2006, 110, 21014–21020. [Google Scholar] [CrossRef]
- Leghrib, R.; Felten, A.; Demoisson, F.; Reniers, F.; Pireaux, J.-J.; Llobet, E. Room-temperature, selective detection of benzene at trace levels using plasma-treated metal-decorated multiwalled carbon nanotubes. Carbon 2010, 48, 3477–3484. [Google Scholar] [CrossRef]
- Young, S.J.; Lin, Z.D. Ammonia gas sensors with Au-decorated carbon nanotubes. Microsyst. Technol. 2018, 24, 4207–4210. [Google Scholar] [CrossRef]
- Zanolli, Z.; Leghrib, R.; Felten, A.; Pireaux, J.-J.; Llobet, E.; Charlier, J.-C. Gas Sensing with Au-Decorated Carbon Nanotubes. ACS Nano 2011, 5, 4592–4599. [Google Scholar] [CrossRef]
- Vollebregt, S.; Ishihara, R. The direct growth of carbon nanotubes as vertical interconnects in 3D integrated circuits. Carbon 2016, 96, 332–338. [Google Scholar] [CrossRef]
- Rahman, M.T.; Panat, R. Aerosol jet 3D printing and high temperature characterization of nickel nanoparticle films. Manuf. Lett. 2021, 29, 5–10. [Google Scholar] [CrossRef]
- Hadiyan, M.; Salehi, A.; Koohi-Saadi, A. Sub-ppm acetone gas sensing properties of free-standing ZnO nanorods. J. Electroceramics 2019, 42, 147–155. [Google Scholar] [CrossRef]
- Shooshtari, M.; Salehi, A. An electronic nose based on carbon nanotube -titanium dioxide hybrid nanostructures for detection and discrimination of volatile organic compounds. Sens. Actuators B Chem. 2022, 357, 131418. [Google Scholar] [CrossRef]
- Ge, L.; Wang, L.; Du, A.; Hou, M.; Rudolph, V.; Zhu, Z. Vertically-aligned carbon nanotube membranes for hydrogen separation. RSC Adv. 2012, 2, 5329–5336. [Google Scholar] [CrossRef] [Green Version]
- Trivedi, S.; Alameh, K. Effect of vertically aligned carbon nanotube density on the water flux and salt rejection in desalination membranes. SpringerPlus 2016, 5, 1158. [Google Scholar] [CrossRef] [PubMed] [Green Version]
- Zhu, M.-G.; Si, J.; Zhang, Z.; Peng, L.-M. Aligning Solution-Derived Carbon Nanotube Film with Full Surface Coverage for High-Performance Electronics Applications. Adv. Mater. 2018, 30, e1707068. [Google Scholar] [CrossRef]
- Li, Y.-R.; Su, C.-C.; Chang, S.-H. Applying Aluminum—Vertically-Aligned Carbon Nanotube Forests Composites for Heat Dissipation. Nanomaterials 2019, 9, 758. [Google Scholar] [CrossRef] [Green Version]
- Mao, M.; Bogaerts, A. Investigating the plasma chemistry for the synthesis of carbon nanotubes/nanofibres in an inductively coupled plasma enhanced CVD system: The effect of different gas mixtures. J. Phys. D Appl. Phys. 2010, 43, 205201. [Google Scholar] [CrossRef] [Green Version]
- Muangrat, W.; Gallnom, E.; Issro, C.; Pfeiler, W.; Pierron-Bohnes, V. Effect of structure and morphology of carbon nanotubes on NO2 gas sensing. Songklanakarin J. Sci. Technol. 2012, 34, 695–699. [Google Scholar]
- Shooshtari, M.; Salehi, A. Ammonia room-temperature gas sensor using different TiO2 nanostructures. J. Mater. Sci. Mater. Electron. 2021, 32, 17371–17381. [Google Scholar] [CrossRef]
- Li, Y.; Ji, K.; Duan, Y.; Meng, G.; Dai, Z. Effect of Hydrogen Concentration on the Growth of Carbon Nanotube Arrays for Gecko-Inspired Adhesive Applications. Coatings 2017, 7, 221. [Google Scholar] [CrossRef] [Green Version]
- Zhao, Y.; Zhang, Y.; Yang, C.; Cheng, L. Ultralight and flexible SiC nanoparticle-decorated carbon nanofiber mats for broad-band microwave absorption. Carbon 2021, 171, 474–483. [Google Scholar] [CrossRef]
- Tabrizi, N.S.; Ullmann, M.; Vons, V.A.; Lafont, U.; Schmidt-Ott, A. Generation of nanoparticles by spark discharge. J. Nanoparticle Res. 2009, 11, 315–332. [Google Scholar] [CrossRef] [Green Version]
- Feng, J.; Biskos, G.; Schmidt-Ott, A. Toward industrial scale synthesis of ultrapure singlet nanoparticles with controllable sizes in a continuous gas-phase process. Sci. Rep. 2015, 5, 15788. [Google Scholar] [CrossRef] [PubMed] [Green Version]
- Schmidt-Ott, A. Spark Ablation: Building Blocks for Nanotechnology; CRC Press: Boca Raton, FL, USA, 2019. [Google Scholar]
- Agarwal, U.P. Chapter 18—Raman Spectroscopy of CNC-and CNF-Based Nanocomposites. In Handbook of Nanocellulose and Cellulose Nanocomposites; John Wiley & Sons: Hoboken, NJ, USA, 2017; pp. 609–625. [Google Scholar]
- Nozaki, T.; Yoshida, S.; Okazaki, K. Plasma-Induced Damage and Surface Functionalization of Double-Walled Carbon Nanotubes Using Atmospheric Pressure RF Discharge. Plasma Process. Polym. 2012, 9, 1154–1159. [Google Scholar] [CrossRef]
- Sakthivel, M.; Ramaraj, S.; Chen, S.M.; Dinesh, B.; Chen, K.H. A highly conducting flower like Au nanoparticles interconnected functionalized CNFs and its enhanced electrocatalytic activity towards hydrazine through direct electron transfer. J. Taiwan Inst. Chem. Eng. 2018, 82, 64–74. [Google Scholar] [CrossRef]
- Young, S.J.; Lin, Z.D. Ethanol gas sensors based on multi-wall carbon nanotubes on oxidized Si substrate. Microsyst. Technol. 2018, 24, 55–58. [Google Scholar] [CrossRef]
- Anju, V.; Jithesh, P.; Narayanankutty, S.K. A novel humidity and ammonia sensor based on nanofibers/polyaniline/polyvinyl alcohol. Sens. Actuators A Phys. 2019, 285, 35–44. [Google Scholar] [CrossRef]
- Vu, T.D.; Cong, T.N.; Huu, B.L.; Duc, C.N.; Huu, L.N. Surface-Modified Carbon Nanotubes for Enhanced Ammonia Gas Sensitivity at Room Temperature. J. Nanosci. Nanotechnol. 2019, 19, 7447–7451. [Google Scholar] [CrossRef]
- Georgakilas, V.; Gournis, D.; Tzitzios, V.; Pasquato, L.; Guldi, D.M.; Prato, M. Decorating carbon nanotubes with metal or semiconductor nanoparticles. J. Mater. Chem. 2007, 17, 2679. [Google Scholar] [CrossRef]
- Li, X.; Hong, J.; Zhang, L. Binary Gas Analyzer Based on a Single Gold Nanoparticle Photothermal Response. ACS Omega 2020, 5, 27164–27170. [Google Scholar] [CrossRef]
- Kumar, S.; Kumar, S.; Sengar, M.; Kumari, P. Gold-carbonaceous materials based heterostructures for gas sensing applications. RSC Adv. 2021, 11, 13674–13699. [Google Scholar] [CrossRef]
- Furue, R.; Koveke, E.P.; Sugimoto, S.; Shudo, Y.; Hayami, S.; Ohira, S.-I.; Toda, K. Arsine gas sensor based on gold-modified reduced graphene oxide. Sensors Actuators B Chem. 2017, 240, 657–663. [Google Scholar] [CrossRef]
- Wang, Y.; Yeow, J.T.W. A Review of Carbon Nanotubes-Based Gas Sensors. J. Sensors 2009, 2009, 493904. [Google Scholar] [CrossRef]
- Yin, F.; Yue, W.; Li, Y.; Gao, S.; Zhang, C.; Kan, H.; Niu, H.; Wang, W.; Guo, Y. Carbon-based nanomaterials for the detection of volatile organic compounds: A review. Carbon 2021, 180, 274–297. [Google Scholar] [CrossRef]
- Li, W.; Zhang, L.-S.; Wang, Q.; Yu, Y.; Chen, Z.; Cao, C.-Y.; Song, W.-G. Low-cost synthesis of graphitic carbon nanofibers as excellent room temperature sensors for explosive gases. J. Mater. Chem. 2012, 22, 15342–15347. [Google Scholar] [CrossRef]
- Shooshtari, M.; Salehi, A.; Vollebregt, S. Effect of Humidity on Gas Sensing Performance of Carbon Nanotube Gas Sensors Operated at Room Temperature. IEEE Sensors J. 2020, 21, 5763–5770. [Google Scholar] [CrossRef]
- Song, H.; Zhang, Y.; Cao, J. Sensing mechanism of an ionization gas temperature sensor based on a carbon nanotube film. RSC Adv. 2017, 7, 53265–53269. [Google Scholar] [CrossRef] [Green Version]
- Shooshtari, M.; Salehi, A.; Vollebregt, S. Effect of temperature and humidity on the sensing performance of TiO2 nanowire-based ethanol vapor sensors. Nanotechnology 2021, 32, 325501. [Google Scholar] [CrossRef]
- Radhakrishnan, J.; Kumara, M. Geetika Effect of temperature modulation, on the gas sensing characteristics of ZnO nanostructures, for gases O2, CO and CO2. Sensors Int. 2020, 2, 100059. [Google Scholar] [CrossRef]
- Dubey, H.K. Carbon Nanofiber—A Potential Superconductor. In Carbon Nanofibers: Fundamentals and Applications; Sharon, M., Sharon, M., Eds.; Scrivener Publishing LLC: Beverly, MA, USA, 2021; pp. 159–174. [Google Scholar]
- Freddi, S.; Drera, G.; Pagliara, S.; Goldoni, A.; Sangaletti, L. Enhanced selectivity of target gas molecules through a minimal array of gas sensors based on nanoparticle-decorated SWCNTs. Analyst 2019, 144, 4100–4110. [Google Scholar] [CrossRef]
- Tit, N.; Ezzi, M.; Abdullah, H.M.; Yusupov, M.; Kouser, S.; Bahlouli, H.; Yamani, Z.H. Detection of CO2 using CNT-based sensors: Role of Fe catalyst on sensitivity and selectivity. Mater. Chem. Phys. 2017, 186, 353–364. [Google Scholar] [CrossRef]


Publisher’s Note: MDPI stays neutral with regard to jurisdictional claims in published maps and institutional affiliations. |
© 2022 by the authors. Licensee MDPI, Basel, Switzerland. This article is an open access article distributed under the terms and conditions of the Creative Commons Attribution (CC BY) license (https://creativecommons.org/licenses/by/4.0/).
Share and Cite
Shooshtari, M.; Sacco, L.N.; Van Ginkel, J.; Vollebregt, S.; Salehi, A. Enhancement of Room Temperature Ethanol Sensing by Optimizing the Density of Vertically Aligned Carbon Nanofibers Decorated with Gold Nanoparticles. Materials 2022, 15, 1383. https://doi.org/10.3390/ma15041383
Shooshtari M, Sacco LN, Van Ginkel J, Vollebregt S, Salehi A. Enhancement of Room Temperature Ethanol Sensing by Optimizing the Density of Vertically Aligned Carbon Nanofibers Decorated with Gold Nanoparticles. Materials. 2022; 15(4):1383. https://doi.org/10.3390/ma15041383
Chicago/Turabian StyleShooshtari, Mostafa, Leandro Nicolas Sacco, Joost Van Ginkel, Sten Vollebregt, and Alireza Salehi. 2022. "Enhancement of Room Temperature Ethanol Sensing by Optimizing the Density of Vertically Aligned Carbon Nanofibers Decorated with Gold Nanoparticles" Materials 15, no. 4: 1383. https://doi.org/10.3390/ma15041383
APA StyleShooshtari, M., Sacco, L. N., Van Ginkel, J., Vollebregt, S., & Salehi, A. (2022). Enhancement of Room Temperature Ethanol Sensing by Optimizing the Density of Vertically Aligned Carbon Nanofibers Decorated with Gold Nanoparticles. Materials, 15(4), 1383. https://doi.org/10.3390/ma15041383