
Effect of Laser Speed and Hatch Spacing on the Corrosion Behavior of 316L Stainless Steel Produced by Selective Laser Melting


Abstract
:1. Introduction
2. Materials and Methods
3. Results and Discussion
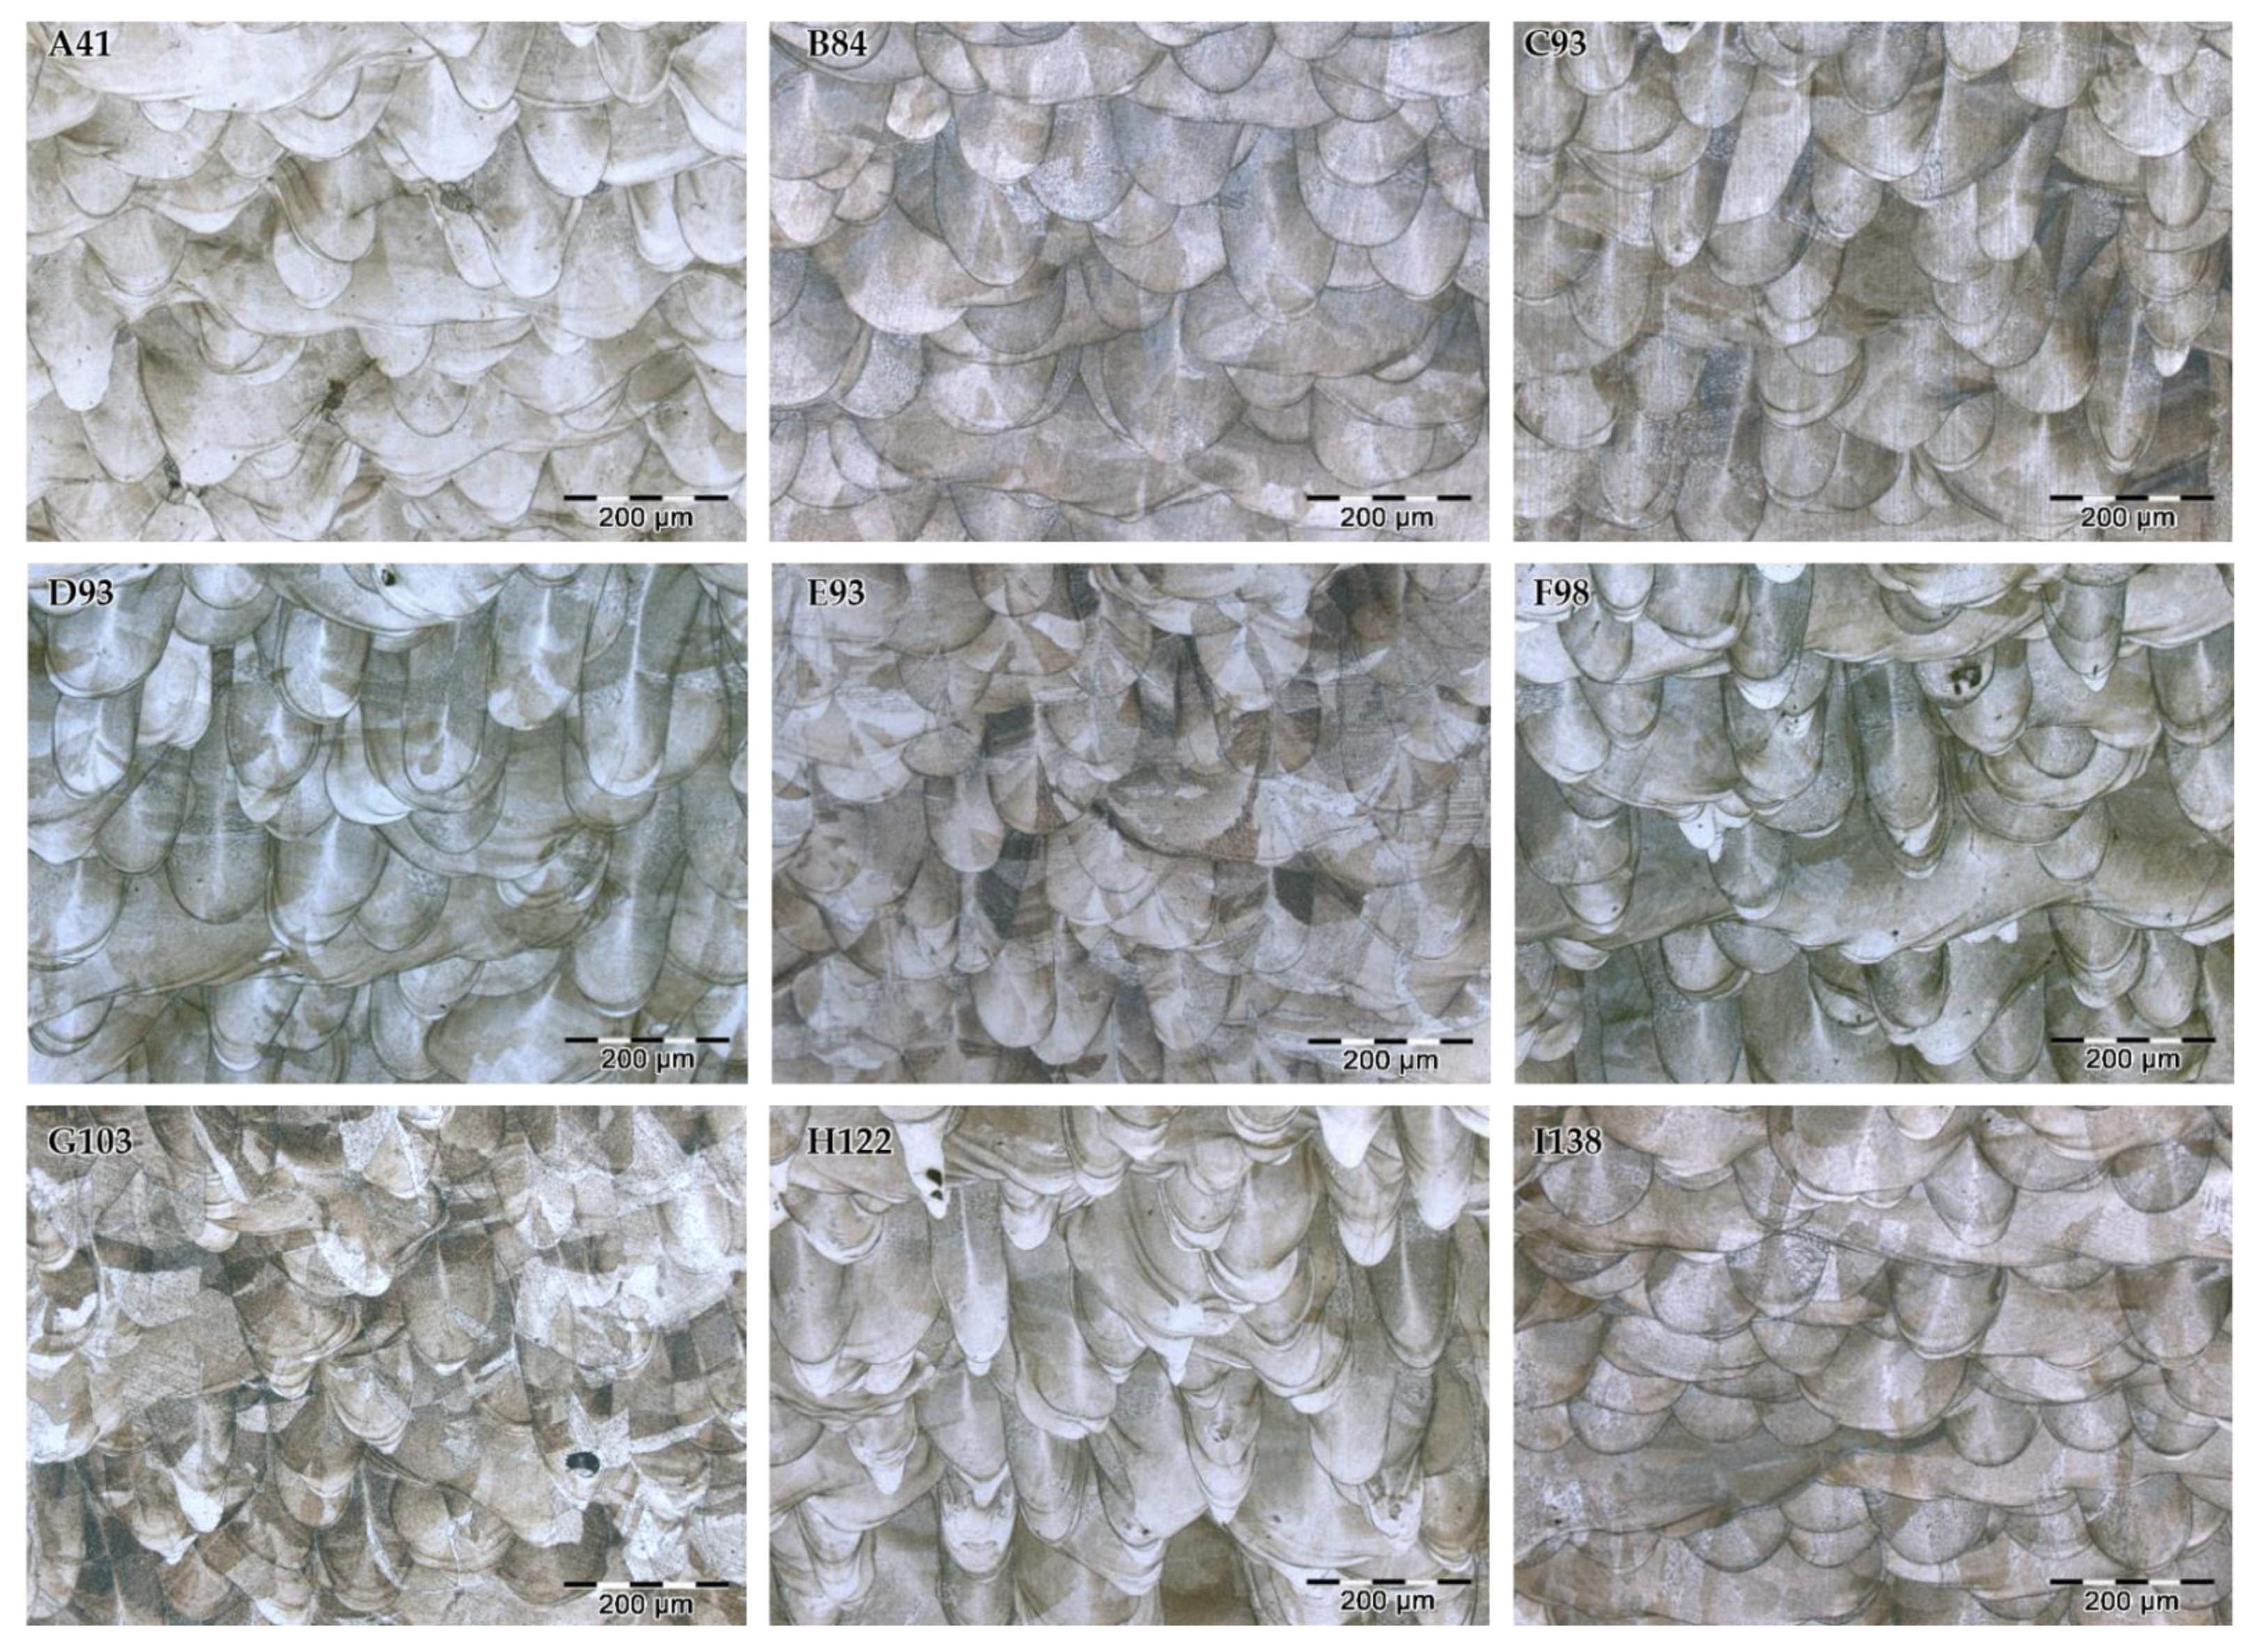
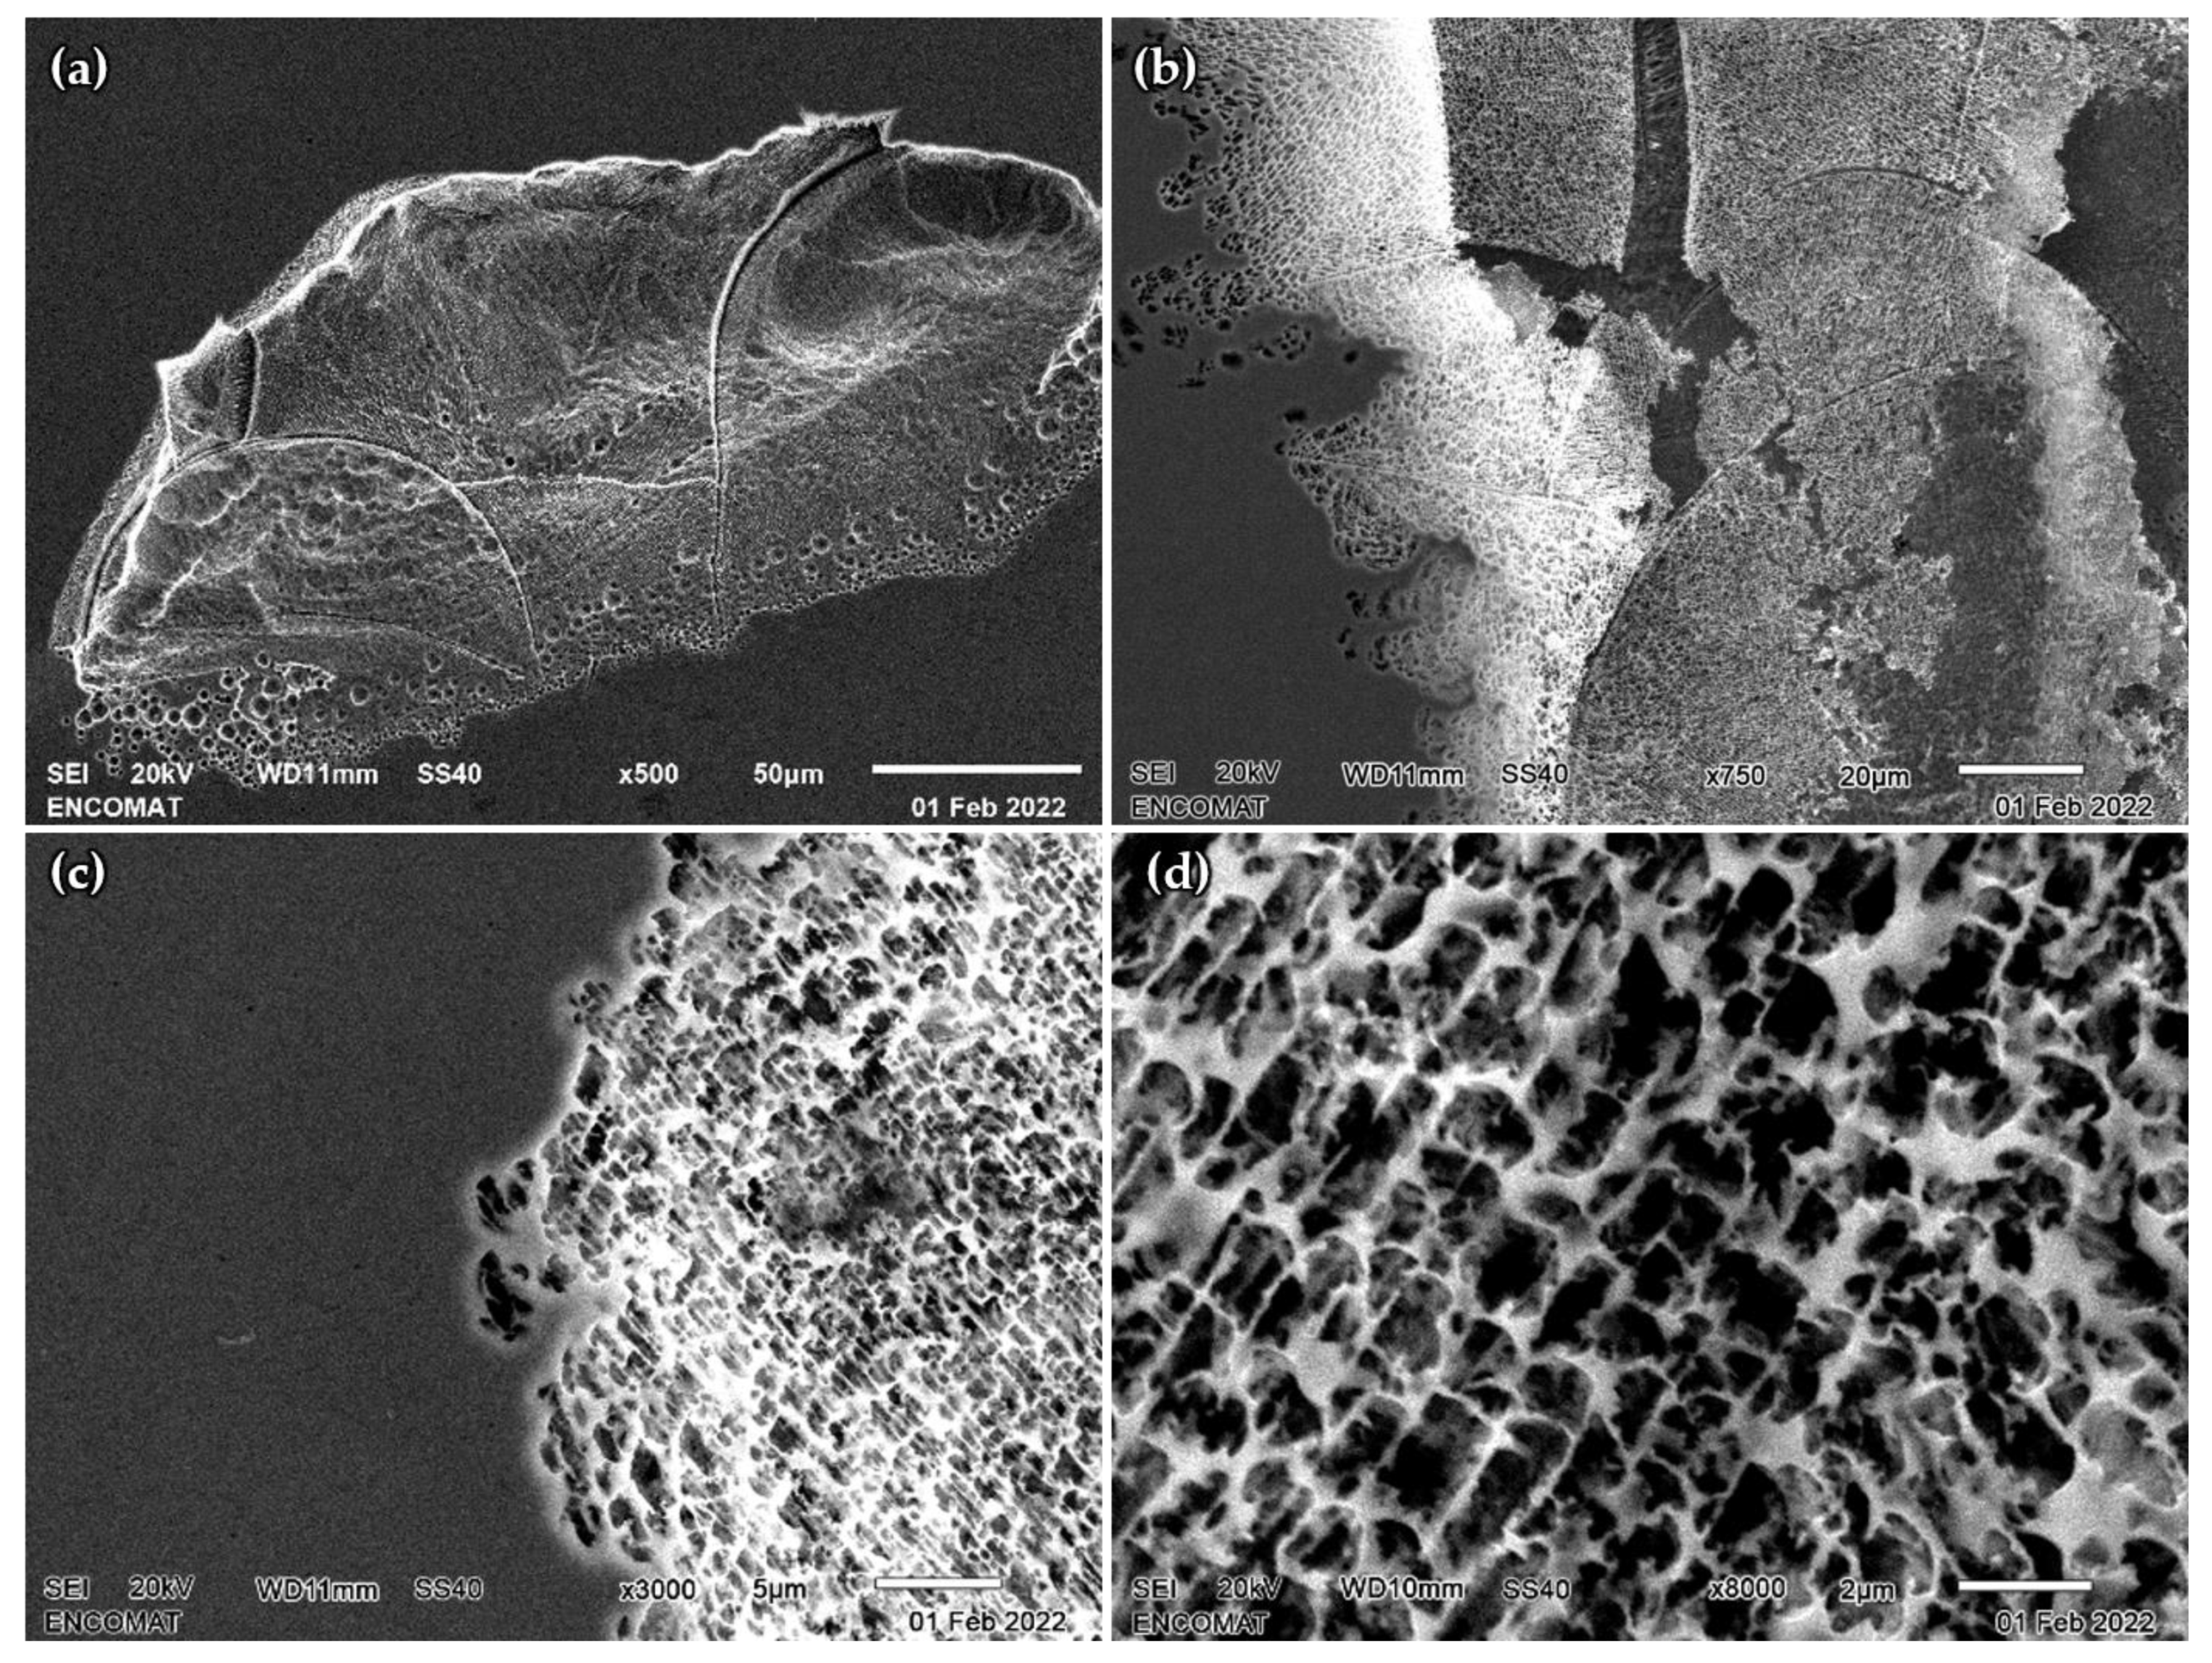
3.1. Microstructural Characterization
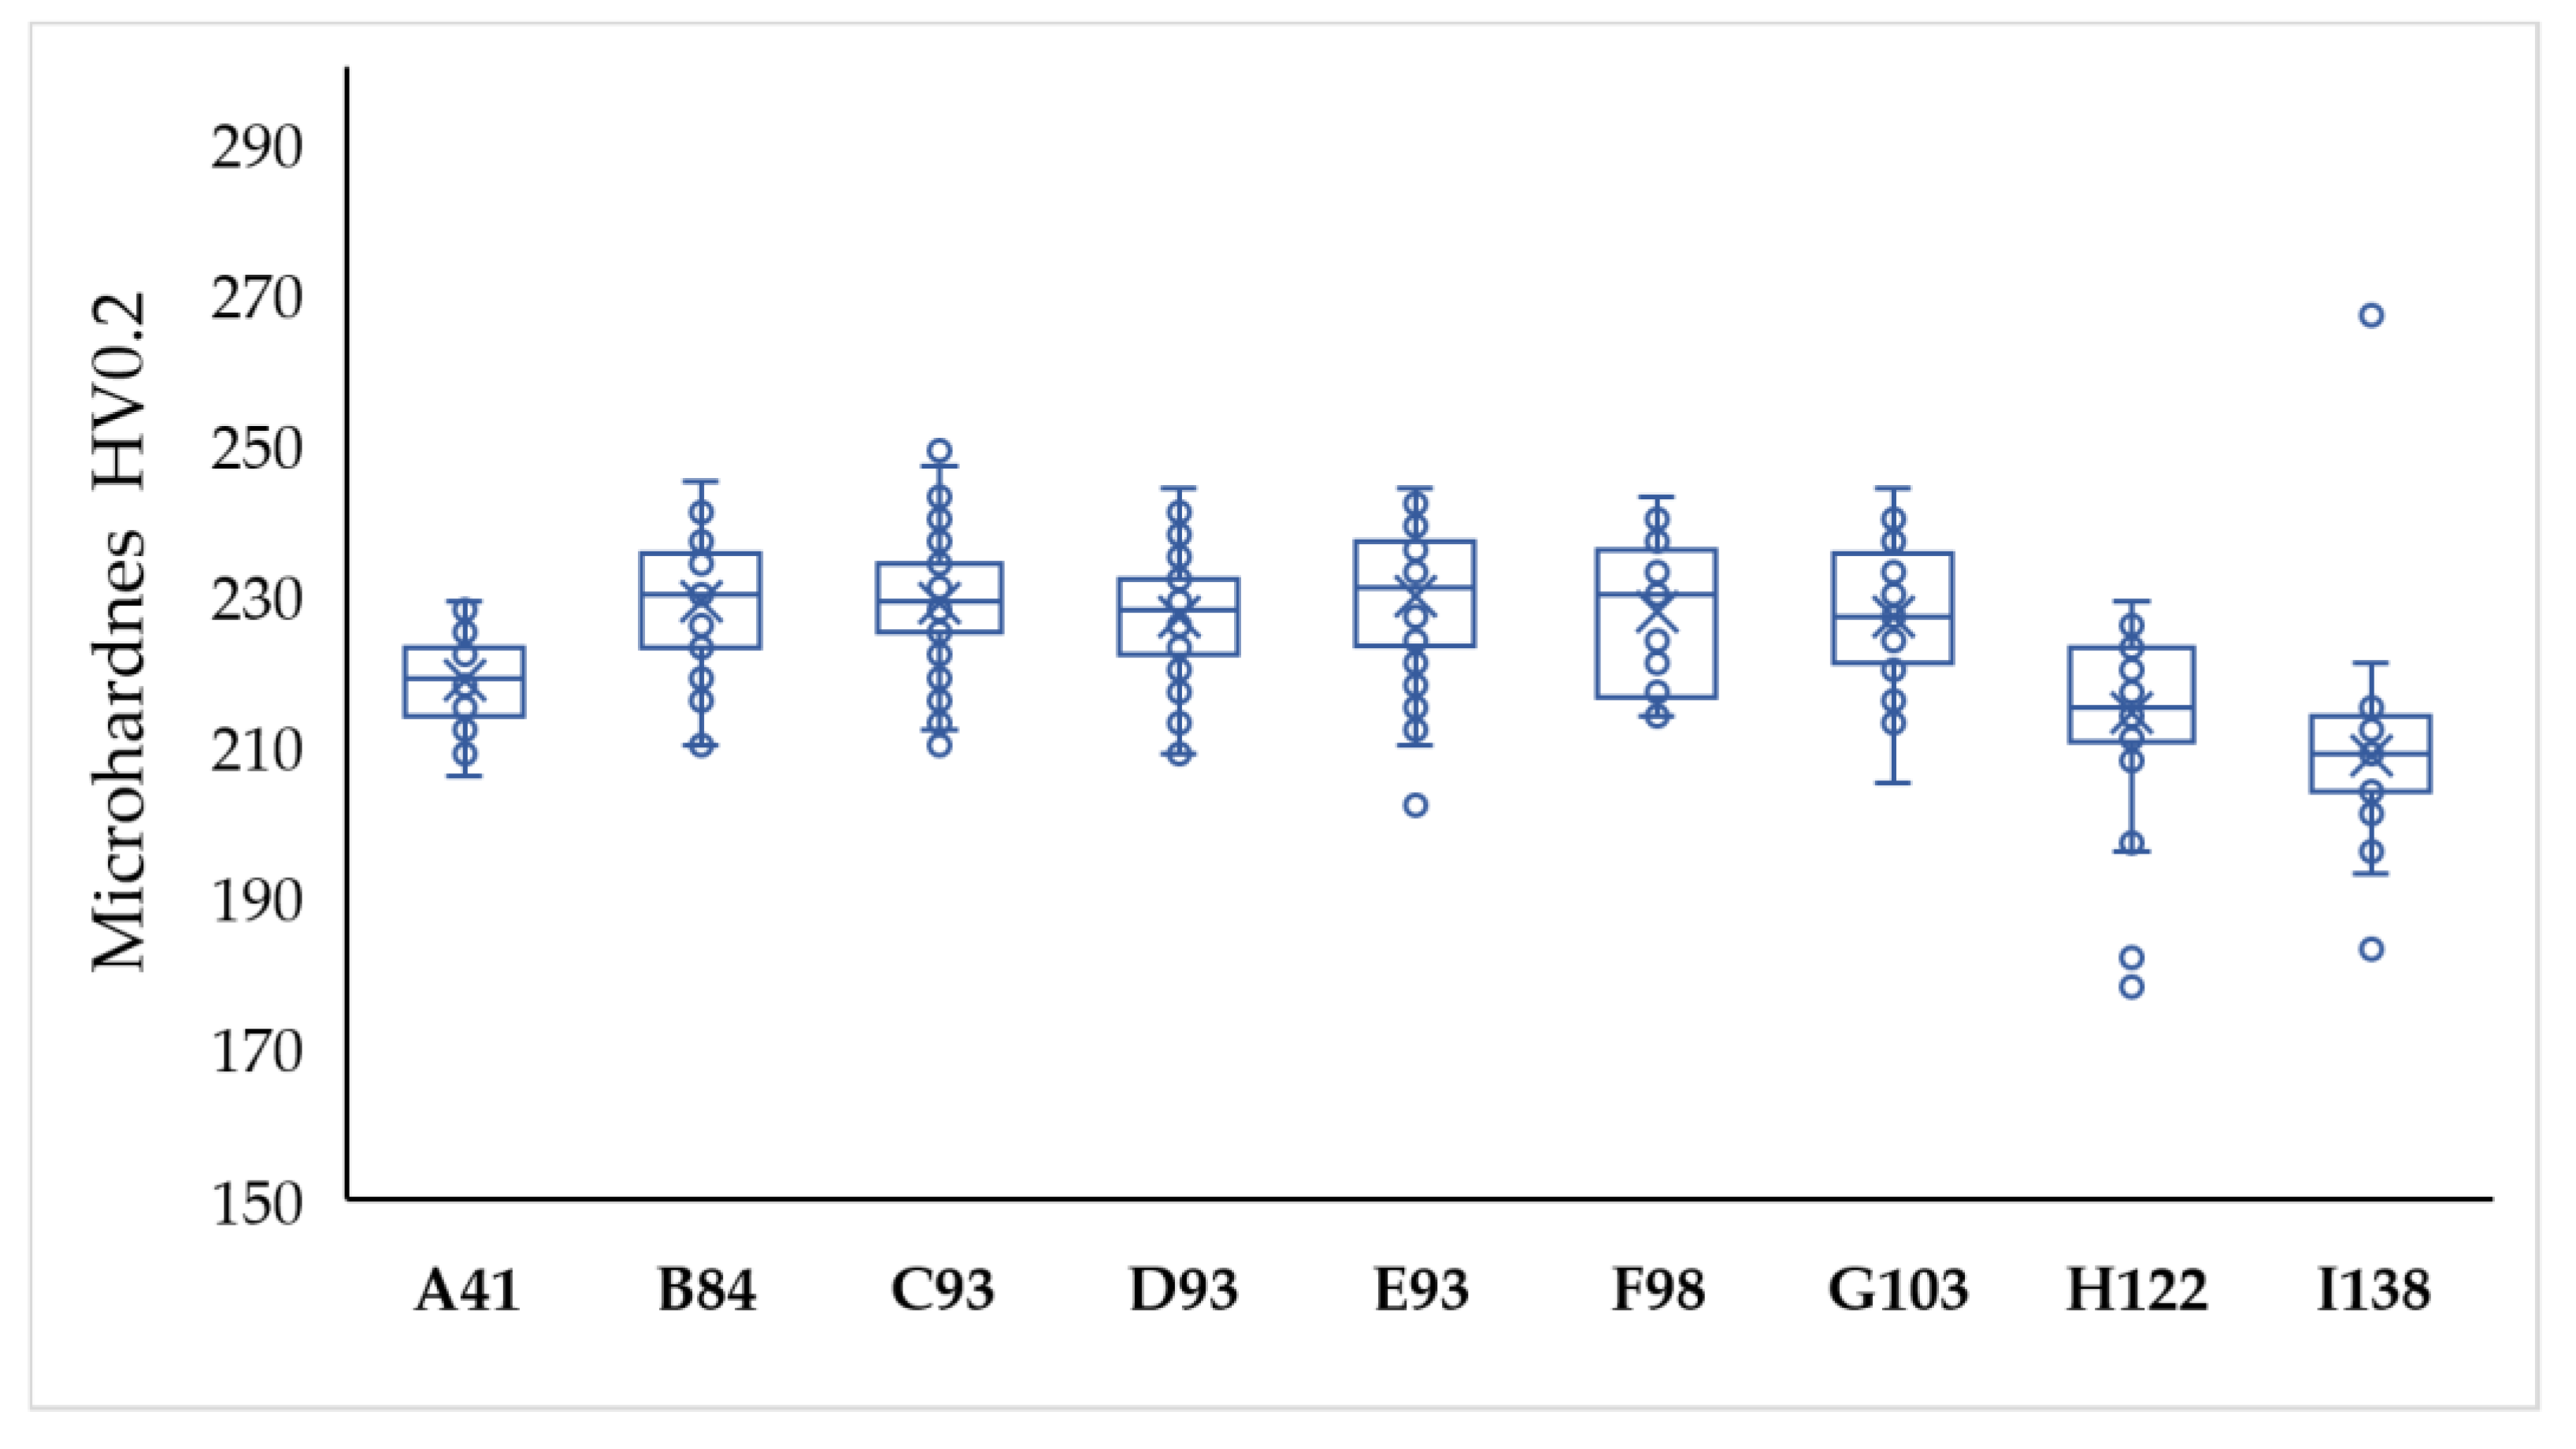
3.2. Hardness Measurements
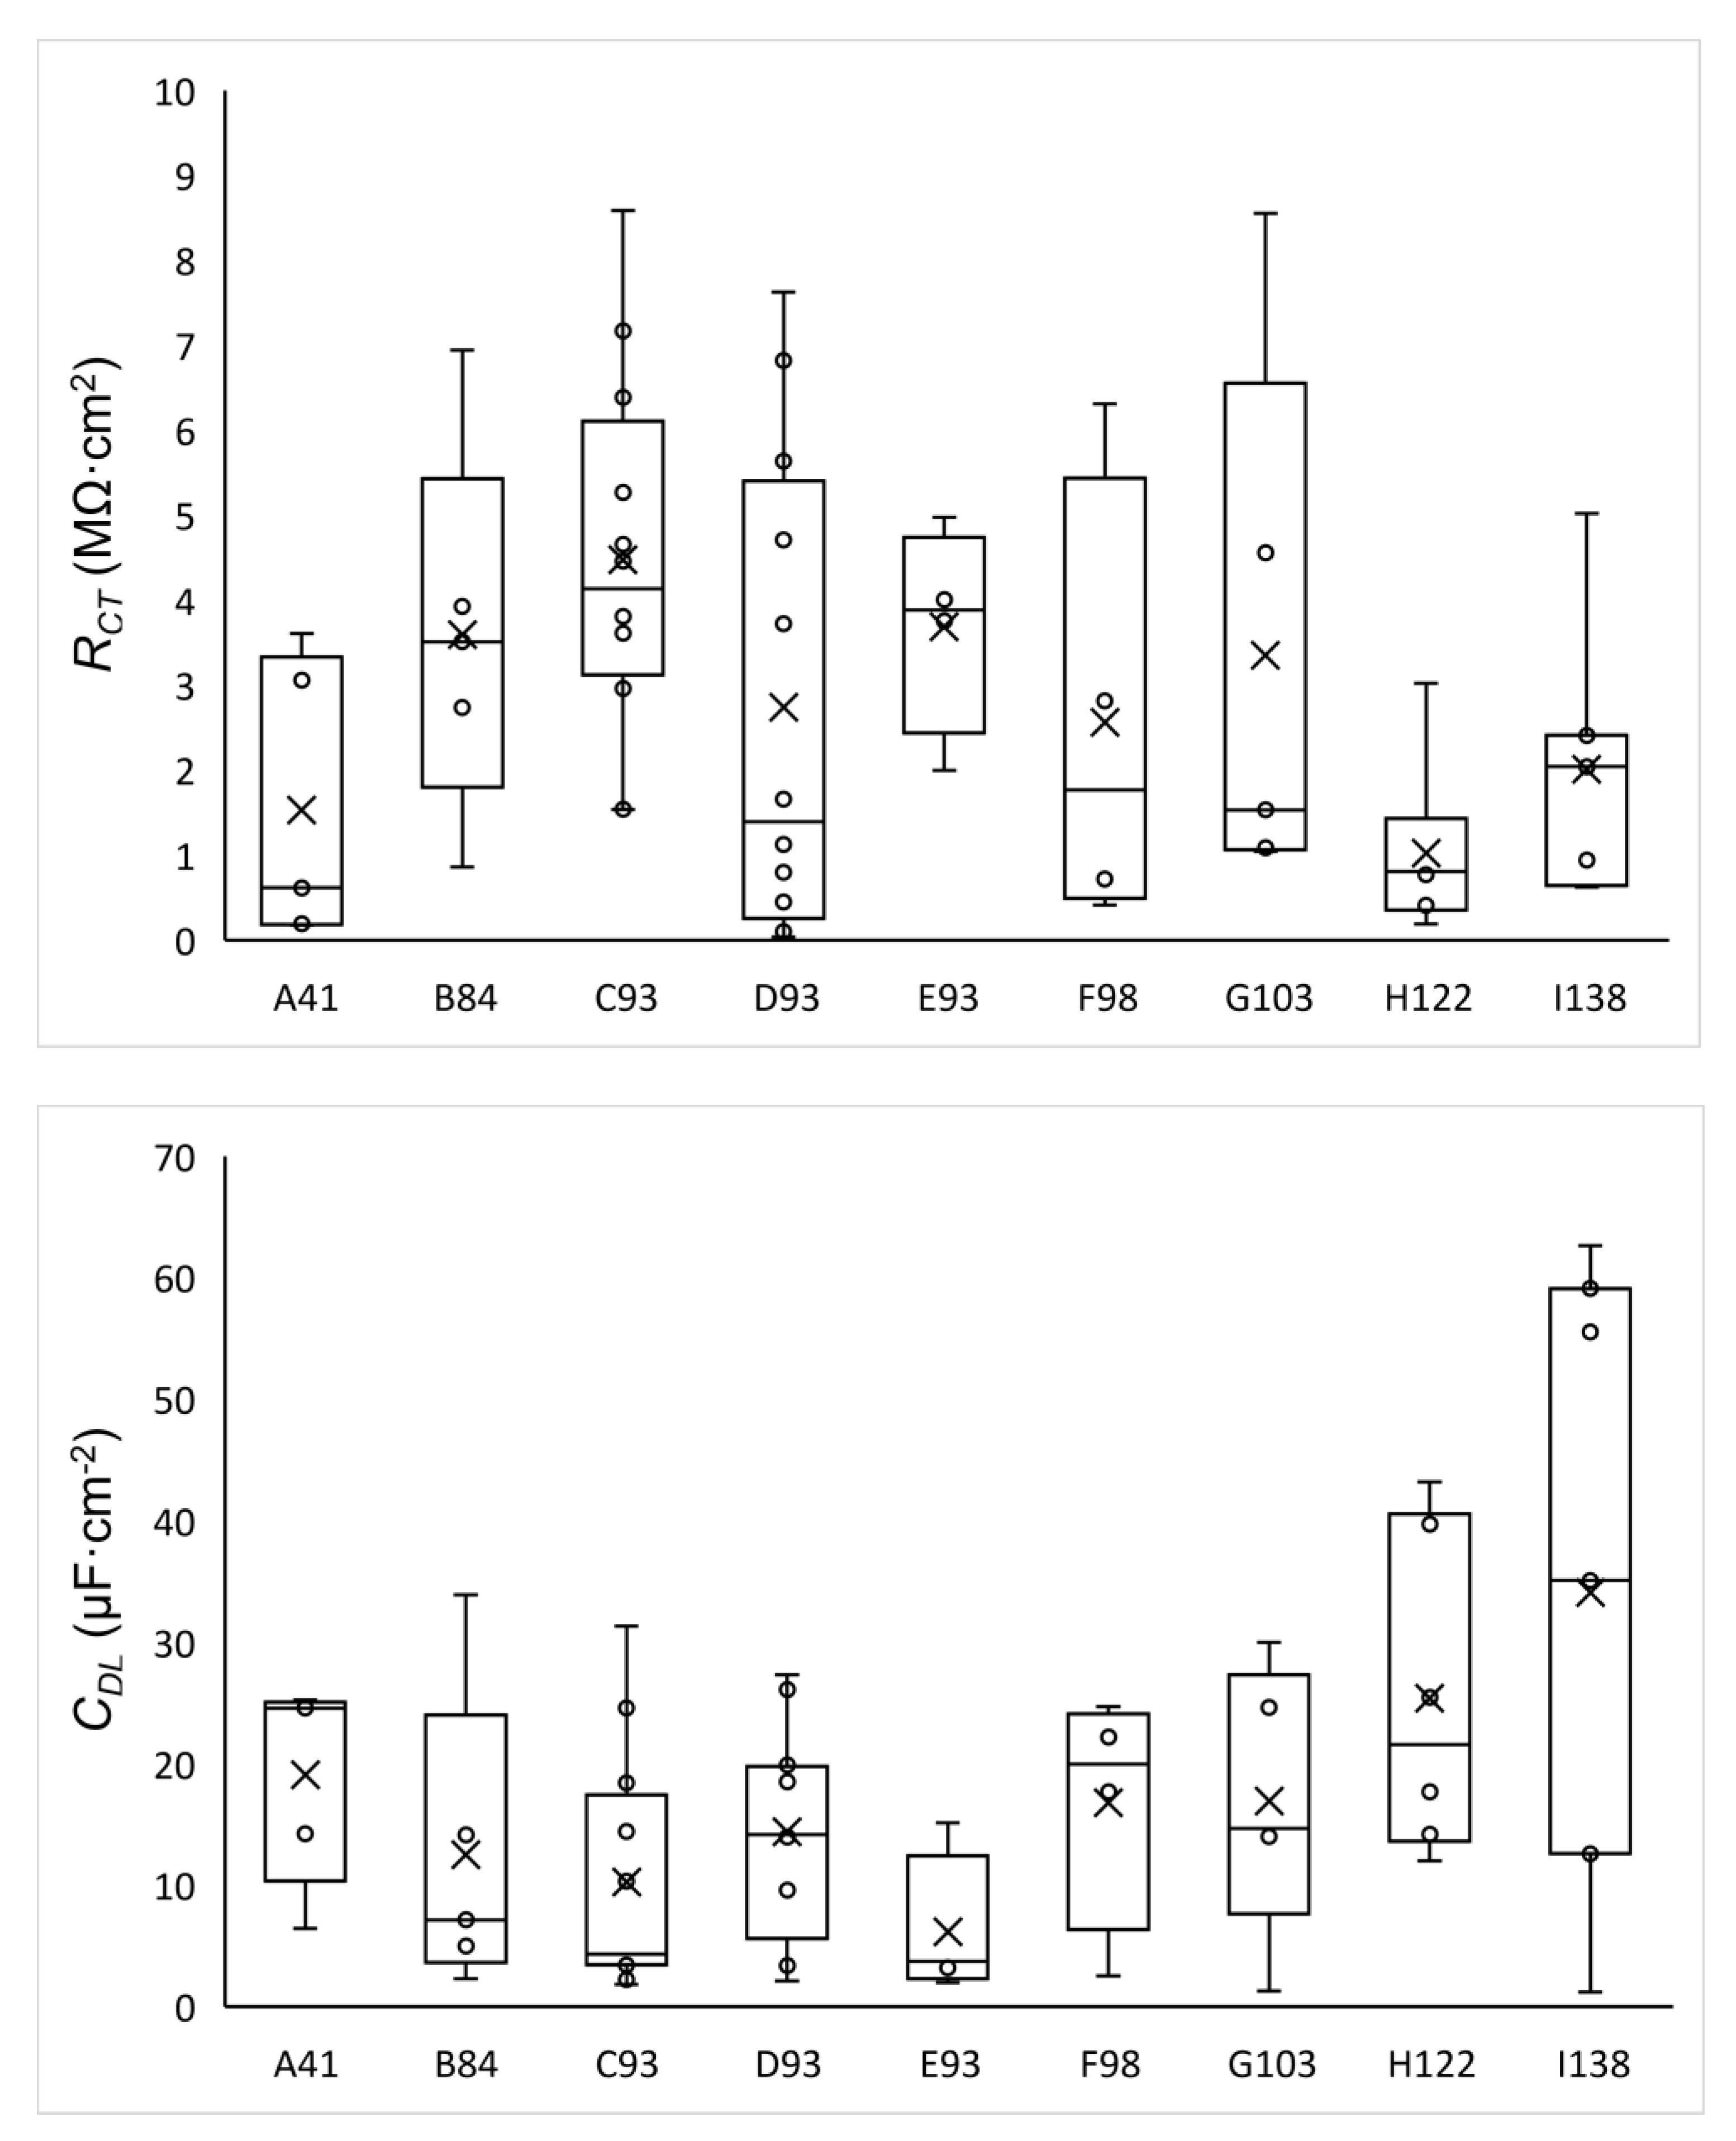
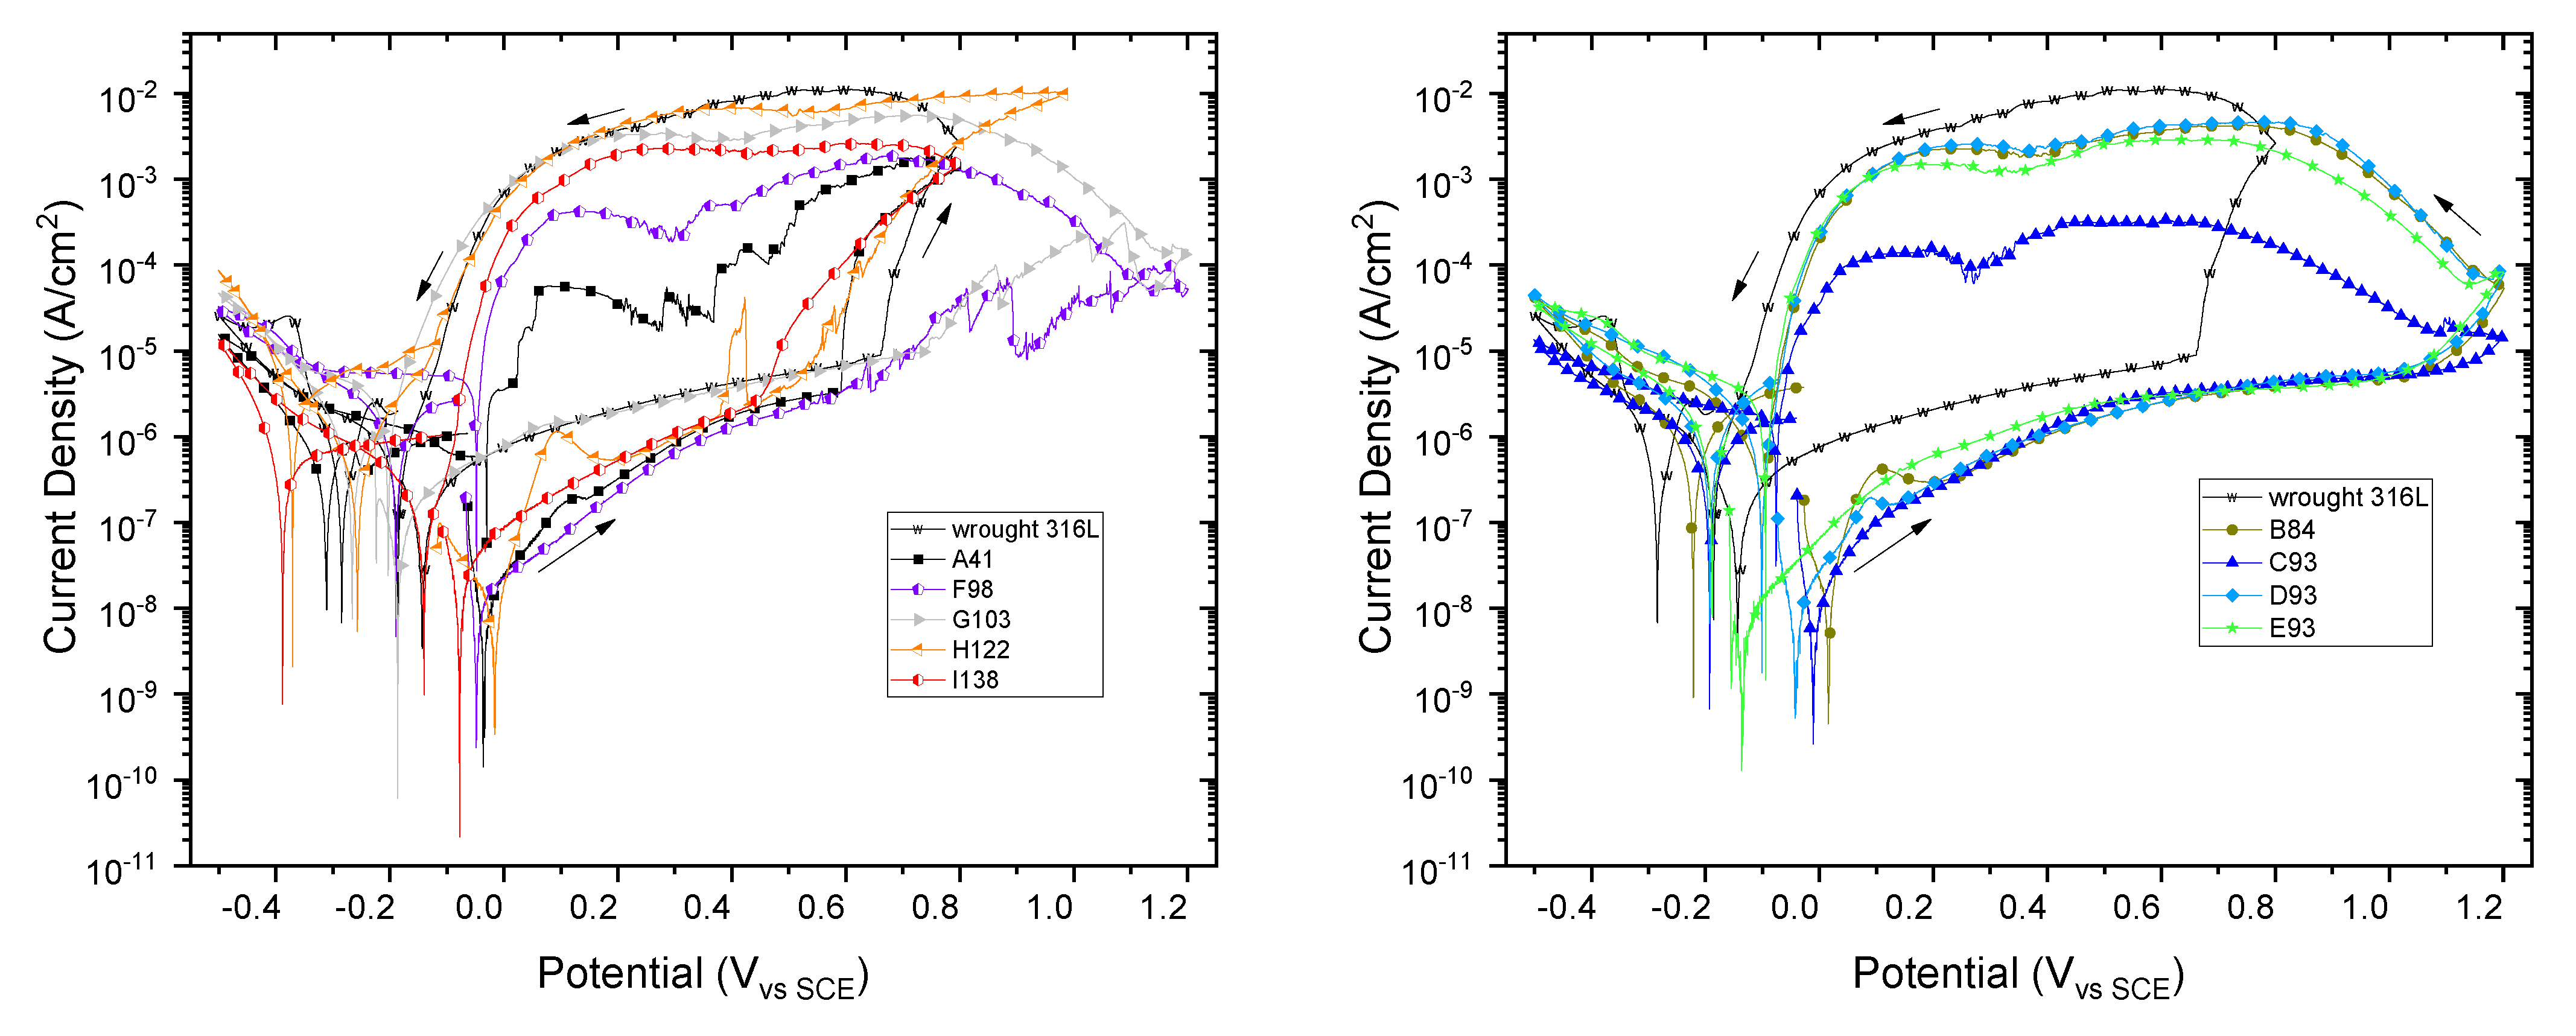
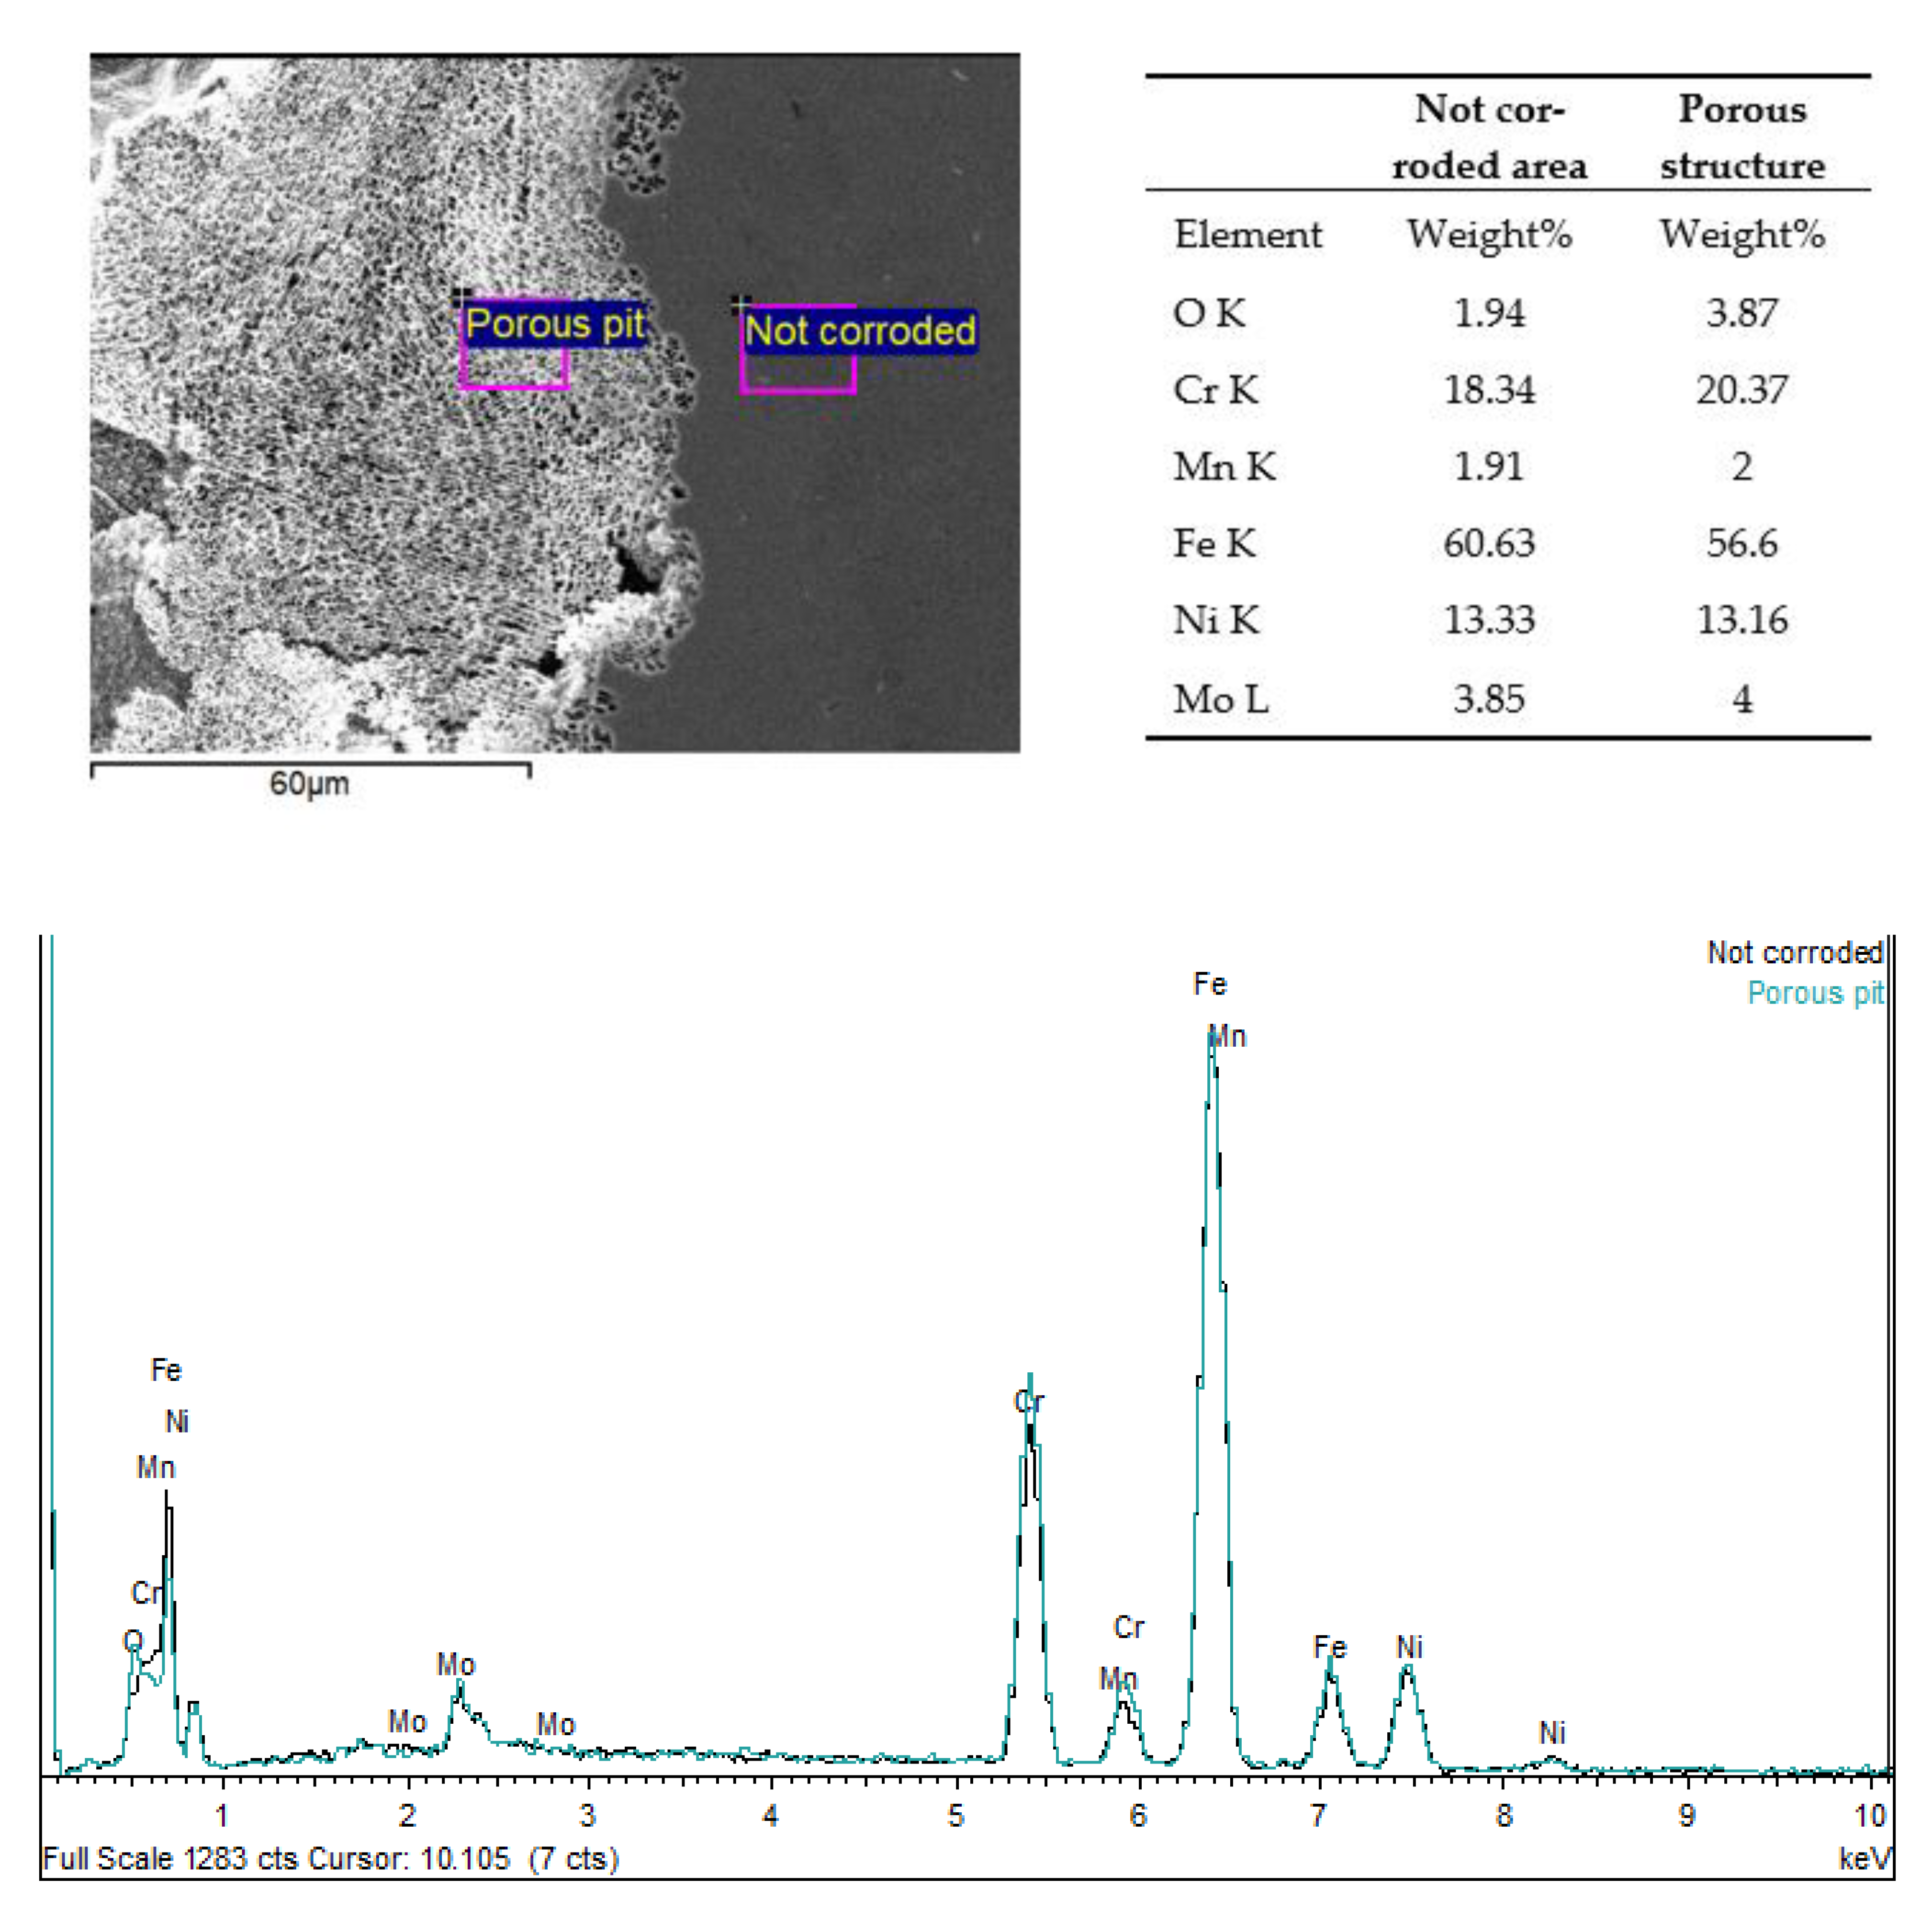
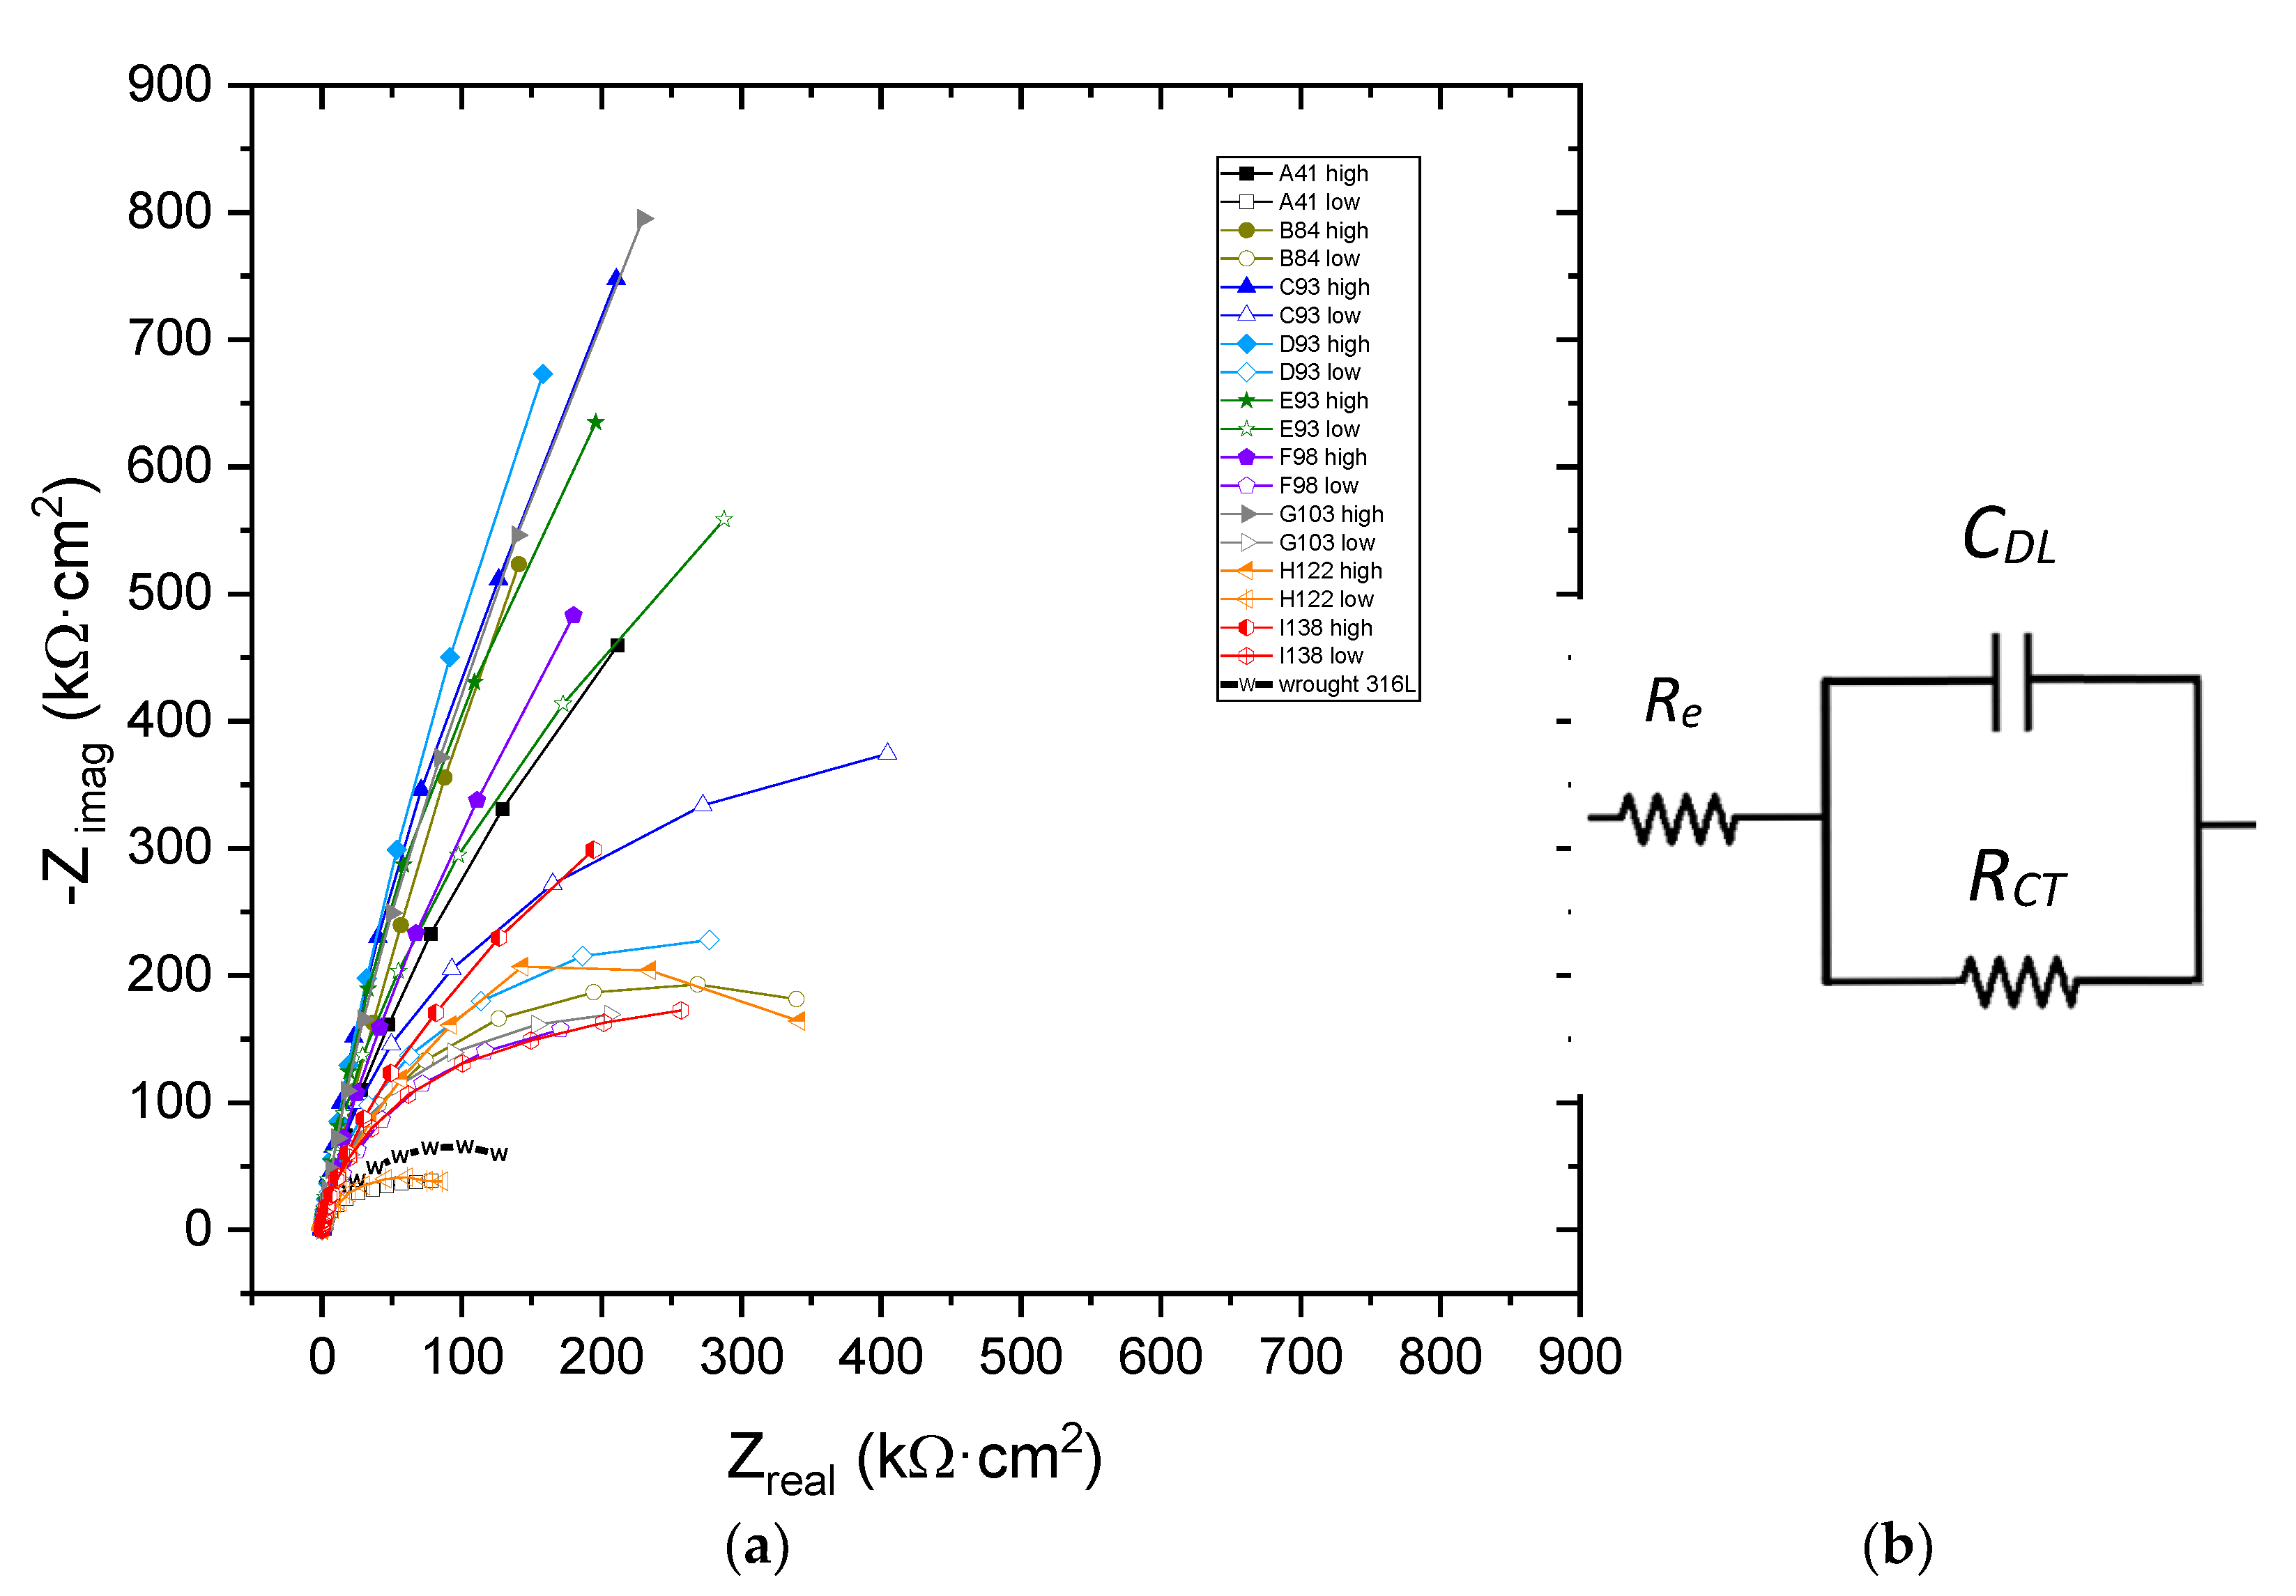
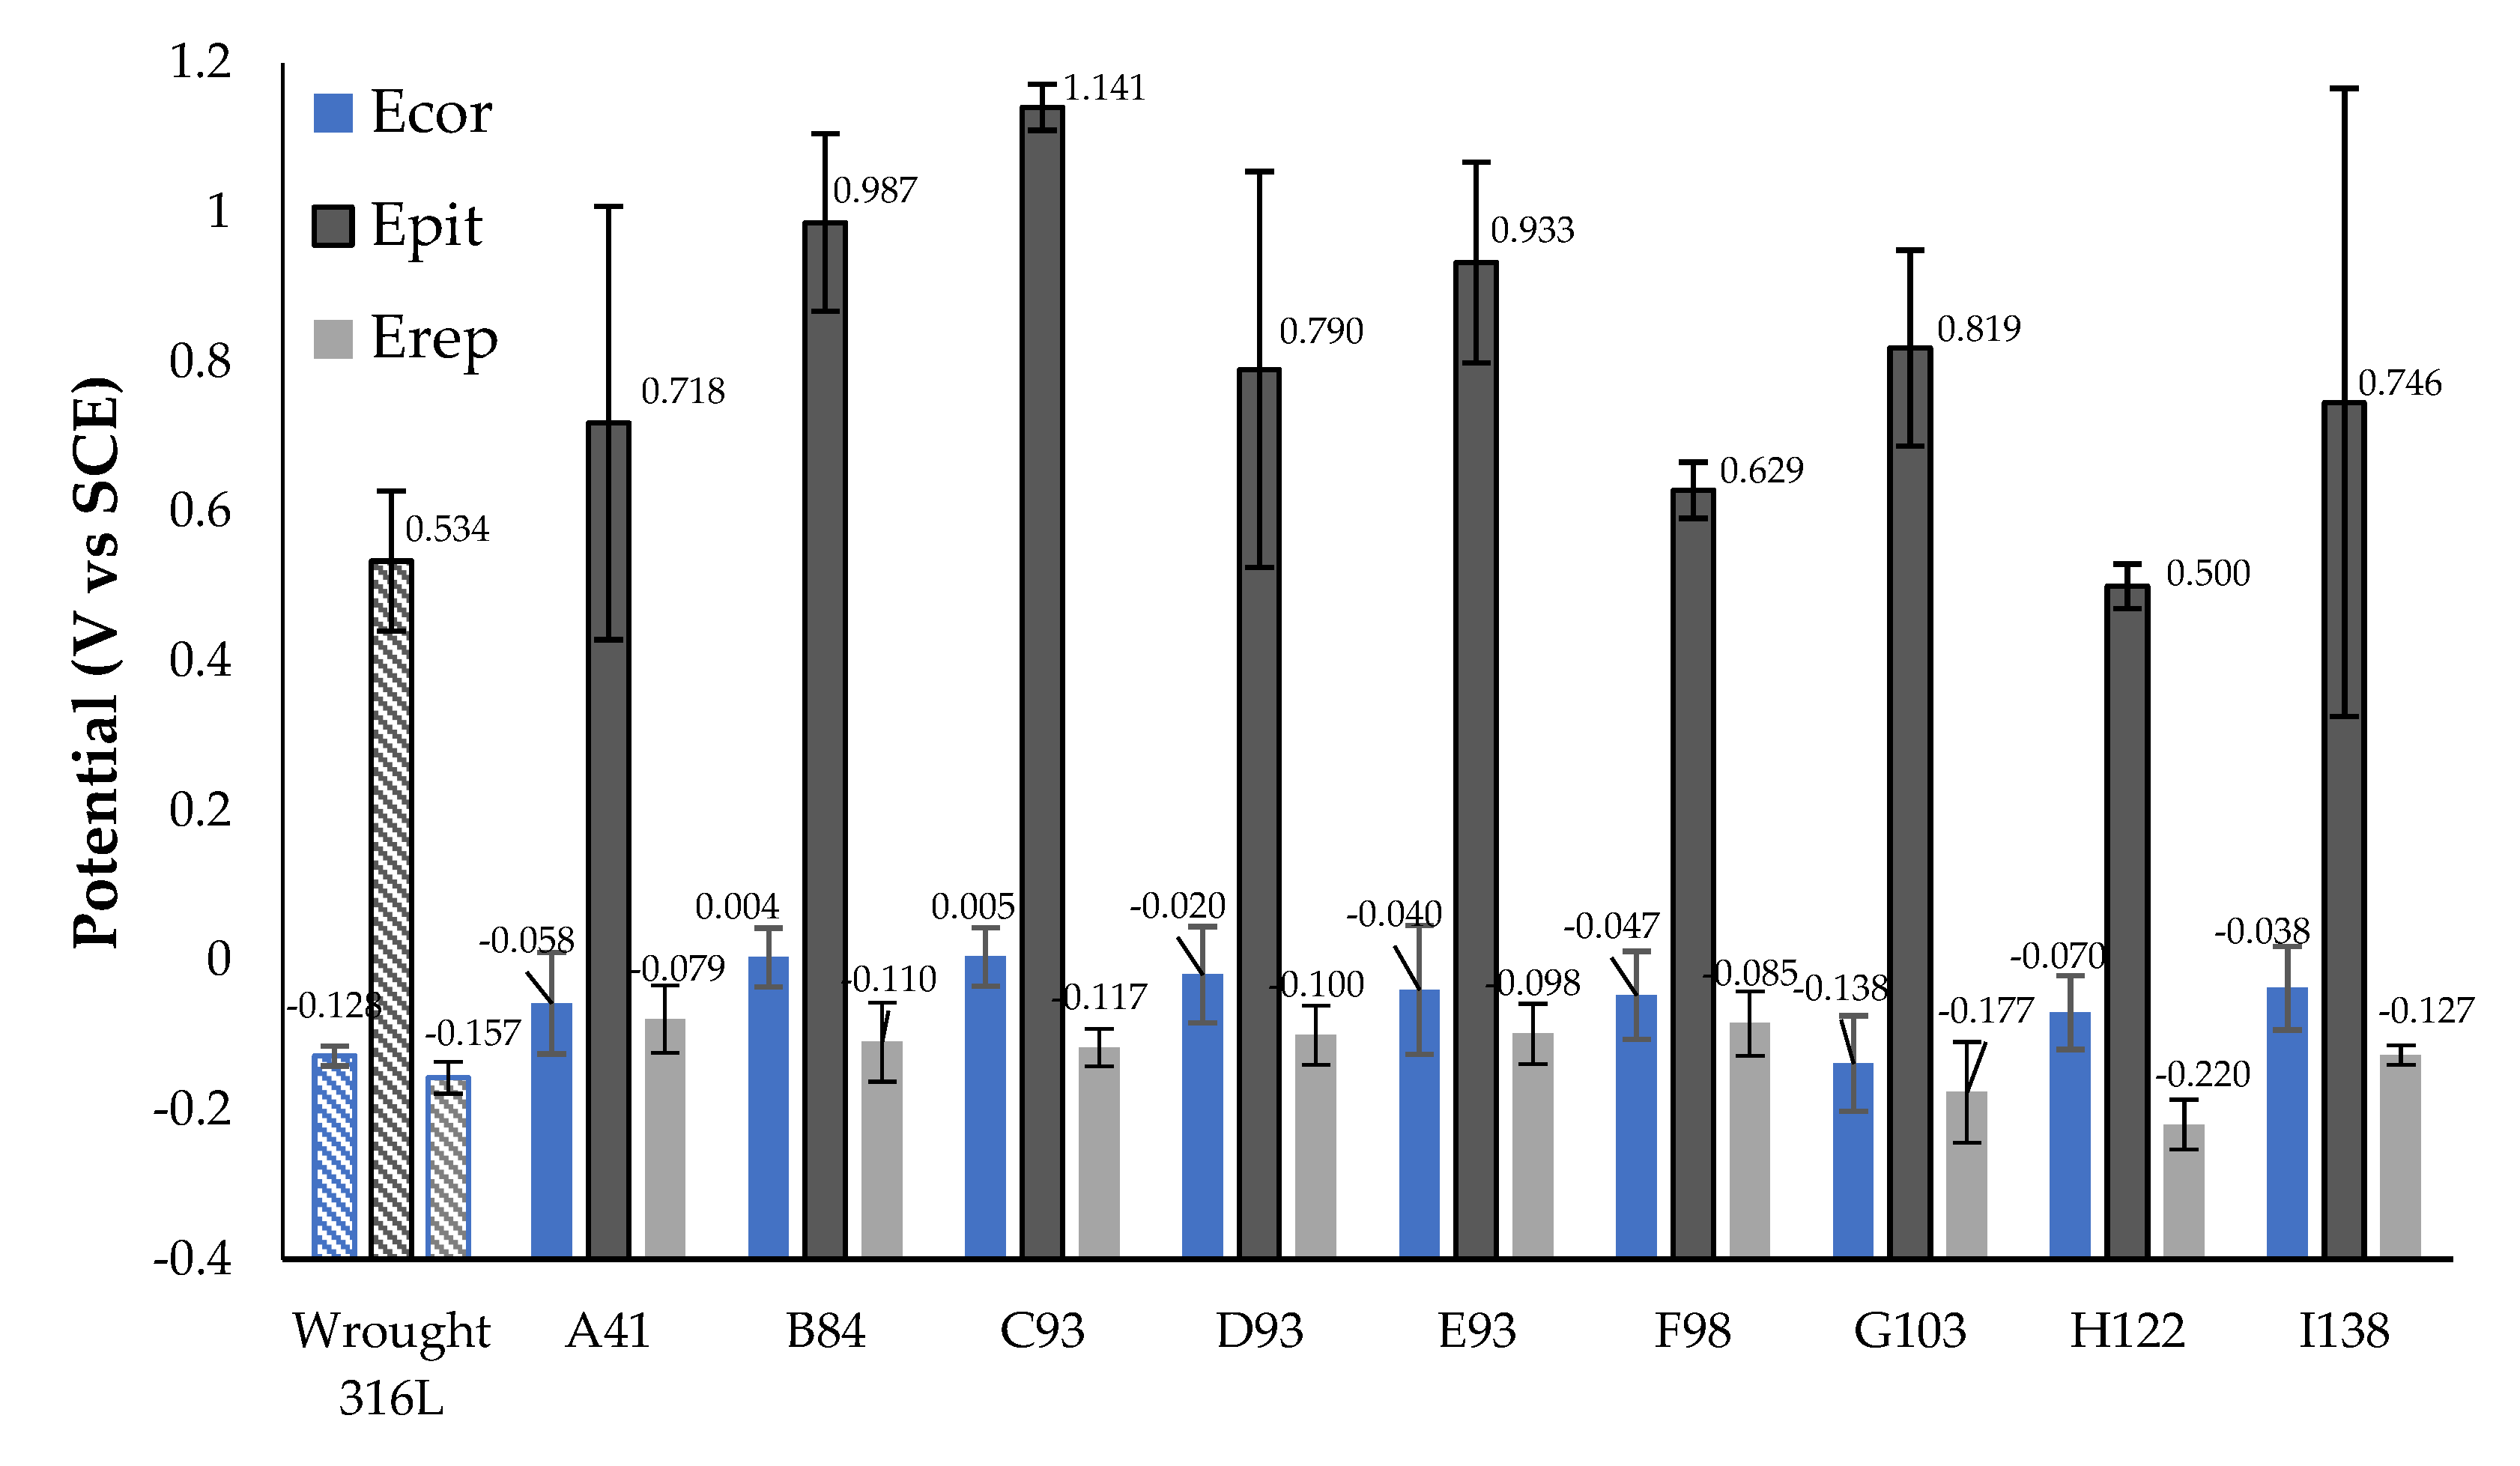
3.3. Electrochemical Analysis
4. Conclusions
Author Contributions
Funding
Institutional Review Board Statement
Informed Consent Statement
Acknowledgments
Conflicts of Interest
References
- Gibson, I.; Rosen, D.; Stucker, B. Powder Bed Fusion Processes. In Additive Manufacturing Technologies; Springer: New York, NY, USA, 2015; pp. 107–145. [Google Scholar]
- Ngo, T.D.; Kashani, A.; Imbalzano, G.; Nguyen, K.T.Q.; Hui, D. Additive manufacturing (3D printing): A review of materials, methods, applications and challenges. Compos. Part B Eng. 2018, 143, 172–196. [Google Scholar] [CrossRef]
- Praveena, B.A.; Lokesh, N.; Abdulrajak Buradi Santhosh, N.; Praveena, B.L.; Vignesh, R. A comprehensive review of emerging additive manufacturing (3D printing technology): Methods, materials, applications, challenges, trends and future potential. Mater. Today Proc. 2021. [Google Scholar] [CrossRef]
- Gorsse, S.; Hutchinson, C.; Gouné, M.; Banerjee, R. Additive manufacturing of metals: A brief review of the characteristic microstructures and properties of steels, Ti-6Al-4V and high-entropy alloys. Sci. Technol. Adv. Mater. 2017, 18, 584–610. [Google Scholar] [CrossRef] [PubMed] [Green Version]
- Gu, D.D.; Meiners, W.; Wissenbach, K.; Poprawe, R. Laser additive manufacturing of metallic components: Materials, processes and mechanisms. Int. Mater. Rev. 2012, 57, 133–164. [Google Scholar] [CrossRef]
- Kong, D.; Dong, C.; Ni, X.; Li, X. Corrosion of metallic materials fabricated by selective laser melting. Npj Mater. Degrad. 2019, 3, 24. [Google Scholar] [CrossRef]
- DebRoy, T.; Wei, H.L.; Zuback, J.S.; Mukherjee, T.; Elmer, J.W.; Milewski, J.O.; Beese, A.M.; Wilson-Heid, A.; De, A.; Zhang, W. Additive manufacturing of metallic components—Process, structure and properties. Prog. Mater. Sci. 2018, 92, 112–224. [Google Scholar] [CrossRef]
- Ko, G.; Kim, W.; Kwon, K.; Lee, T.K. The corrosion of stainless steel made by additive manufacturing: A review. Metals 2021, 11, 516. [Google Scholar] [CrossRef]
- Sander, G.; Tan, J.; Balan, P.; Gharbi, O.; Feenstra, D.R.; Singer, L.; Thomas, S.; Kelly, R.G.; Scully, J.R.; Birbilis, N. Corrosion of additively manufactured alloys: A review. Corrosion 2018, 74, 1318–1350. [Google Scholar] [CrossRef] [Green Version]
- Alsalla, H.H.; Smith, C.; Hao, L. Effect of build orientation on the surface quality, microstructure and mechanical properties of selective laser melting 316L stainless steel. Rapid Prototyp. J. 2018, 24, 9–17. [Google Scholar] [CrossRef]
- Guo, P.; Zou, B.; Huang, C.; Gao, H. Study on microstructure, mechanical properties and machinability of efficiently additive manufactured AISI 316L stainless steel by high-power direct laser deposition. J. Mater. Process. Technol. 2017, 240, 12–22. [Google Scholar] [CrossRef]
- Ziętala, M.; Durejko, T.; Polański, M.; Kunce, I.; Płociński, T.; Zieliński, W.; Łazińska, M.; Stępniowski, W.; Czujko, T.; Kurzydłowski, K.J.; et al. The microstructure, mechanical properties and corrosion resistance of 316 L stainless steel fabricated using laser engineered net shaping. Mater. Sci. Eng. A 2016, 677, 1–10. [Google Scholar] [CrossRef]
- Liverani, E.; Toschi, S.; Ceschini, L.; Fortunato, A. Effect of selective laser melting (SLM) process parameters on microstructure and mechanical properties of 316L austenitic stainless steel. J. Mater. Process. Technol. 2017, 249, 255–263. [Google Scholar] [CrossRef]
- Saeidi, K.; Gao, X.; Zhong, Y.; Shen, Z.J. Hardened austenite steel with columnar sub-grain structure formed by laser melting. Mater. Sci. Eng. A 2015, 625, 221–229. [Google Scholar] [CrossRef]
- Kumar Maurya, N.; Sharma, R.; Kumar, N.; Kumar, A.; Anand, P.; Rai, P.; Singh, H. An overview of investigation of Fatigue, tensile strength and hardness of the components fabricated through direct metal laser sintering (DMLS) process. Mater. Today Proc. 2021, 47, 3979–3984. [Google Scholar] [CrossRef]
- Liu, J.; Song, Y.; Chen, C.; Wang, X.; Li, H.; Zhou, C.; Wang, J.; Guo, K.; Sun, J. Effect of scanning speed on the microstructure and mechanical behavior of 316L stainless steel fabricated by selective laser melting. Mater. Des. 2020, 186, 108355. [Google Scholar] [CrossRef]
- Yu, J.M.; Dao, V.H.; Yoon, K.B. Effects of scanning speed on creep behaviour of 316L stainless steel produced using selective laser melting. Fatigue Fract. Eng. Mater. Struct. 2020, 43, 2312–2325. [Google Scholar] [CrossRef]
- Kurzynowski, T.; Gruber, K.; Stopyra, W.; Kuźnicka, B.; Chlebus, E. Correlation between process parameters, microstructure and properties of 316 L stainless steel processed by selective laser melting. Mater. Sci. Eng. A 2018, 718, 64–73. [Google Scholar] [CrossRef]
- Mower, T.M.; Long, M.J. Mechanical behavior of additive manufactured, powder-bed laser-fused materials. Mater. Sci. Eng. A 2016, 651, 198–213. [Google Scholar] [CrossRef]
- Chao, Q.; Cruz, V.; Thomas, S.; Birbilis, N.; Collins, P.; Taylor, A.; Hodgson, P.D.; Fabijanic, D. On the enhanced corrosion resistance of a selective laser melted austenitic stainless steel. Scr. Mater. 2017, 141, 94–98. [Google Scholar] [CrossRef]
- Sun, S.H.; Ishimoto, T.; Hagihara, K.; Tsutsumi, Y.; Hanawa, T.; Nakano, T. Excellent mechanical and corrosion properties of austenitic stainless steel with a unique crystallographic lamellar microstructure via selective laser melting. Scr. Mater. 2019, 159, 89–93. [Google Scholar] [CrossRef]
- Revilla, R.I.; Wouters, B.; Andreatta, F.; Lanzutti, A.; Fedrizzi, L.; De Graeve, I. EIS comparative study and critical Equivalent Electrical Circuit (EEC) analysis of the native oxide layer of additive manufactured and wrought 316L stainless steel. Corros. Sci. 2020, 167, 108480. [Google Scholar] [CrossRef]
- Sander, G.; Thomas, S.; Cruz, V.; Jurg, M.; Birbilis, N.; Gao, X.; Brameld, M.; Hutchinson, C.R. On The Corrosion and Metastable Pitting Characteristics of 316L Stainless Steel Produced by Selective Laser Melting. J. Electrochem. Soc. 2017, 164, C250–C257. [Google Scholar] [CrossRef]
- Suryawanshi, J.; Baskaran, T.; Prakash, O.; Arya, S.B.; Ramamurty, U. On the corrosion resistance of some selective laser melted alloys. Materialia 2018, 3, 153–161. [Google Scholar] [CrossRef]
- Andreatta, F.; Lanzutti, A.; Vaglio, E.; Totis, G.; Sortino, M.; Fedrizzi, L. Corrosion behaviour of 316L stainless steel manufactured by selective laser melting. Mater. Corros. 2019, 70, 1633–1645. [Google Scholar] [CrossRef]
- Lodhi, M.J.K.; Deen, K.M.; Greenlee-Wacker, M.C.; Haider, W. Additively manufactured 316L stainless steel with improved corrosion resistance and biological response for biomedical applications. Addit. Manuf. 2019, 27, 8–19. [Google Scholar] [CrossRef]
- Ni, X.; Kong, D.; Wu, W.; Zhang, L.; Dong, C.; He, B.; Lu, L.; Wu, K.; Zhu, D. Corrosion Behavior of 316L Stainless Steel Fabricated by Selective Laser Melting Under Different Scanning Speeds. J. Mater. Eng. Perform. 2018, 27, 3667–3677. [Google Scholar] [CrossRef]
- Zhang, Y.; Zhang, J.; Yan, Q.; Zhang, L.; Wang, M.; Song, B.; Shi, Y. Amorphous alloy strengthened stainless steel manufactured by selective laser melting: Enhanced strength and improved corrosion resistance. Scr. Mater. 2018, 148, 20–23. [Google Scholar] [CrossRef]
- Man, C.; Dong, C.; Liu, T.; Kong, D.; Wang, D.; Li, X. The enhancement of microstructure on the passive and pitting behaviors of selective laser melting 316L SS in simulated body fluid. Appl. Surf. Sci. 2019, 467–468, 193–205. [Google Scholar] [CrossRef]
- Kale, A.B.; Kim, B.K.; Kim, D.I.; Castle, E.G.; Reece, M.; Choi, S.H. An investigation of the corrosion behavior of 316L stainless steel fabricated by SLM and SPS techniques. Mater. Charact. 2020, 163, 110204. [Google Scholar] [CrossRef]
- Woźniak, A.; Adamiak, M.; Chladek, G.; Kasperski, J. The influence of the process parameters on the microstructure and properties SLM processed 316 L stainless steel. Arch. Metall. Mater. 2020, 65, 17–80. [Google Scholar] [CrossRef]
- Lodhi, M.J.K.; Deen, K.M.; Haider, W. Corrosion behavior of additively manufactured 316L stainless steel in acidic media. Materialia 2018, 2, 111–121. [Google Scholar] [CrossRef]
- Sun, Y.; Moroz, A.; Alrbaey, K. Sliding wear characteristics and corrosion behaviour of selective laser melted 316L stainless steel. J. Mater. Eng. Perform. 2014, 23, 518–526. [Google Scholar] [CrossRef]
- Kong, D.; Ni, X.; Dong, C.; Zhang, L.; Man, C.; Yao, J.; Xiao, K.; Li, X. Heat treatment effect on the microstructure and corrosion behavior of 316L stainless steel fabricated by selective laser melting for proton exchange membrane fuel cells. Electrochim. Acta 2018, 276, 293–303. [Google Scholar] [CrossRef]
- Trelewicz, J.R.; Halada, G.P.; Donaldson, O.K.; Manogharan, G. Microstructure and Corrosion Resistance of Laser Additively Manufactured 316L Stainless Steel. JOM 2016, 68, 850–859. [Google Scholar] [CrossRef]
- Sander, J.; Hufenbach, J.; Giebeler, L.; Wendrock, H.; Kühn, U.; Eckert, J. Microstructure and properties of FeCrMoVC tool steel produced by selective laser melting. Mater. Des. 2016, 89, 335–341. [Google Scholar] [CrossRef]
- Mohd Yusuf, S.; Nie, M.; Chen, Y.; Yang, S.; Gao, N. Microstructure and corrosion performance of 316L stainless steel fabricated by Selective Laser Melting and processed through high-pressure torsion. J. Alloys Compd. 2018, 763, 360–375. [Google Scholar] [CrossRef]
- King, W.E.; Barth, H.D.; Castillo, V.M.; Gallegos, G.F.; Gibbs, J.W.; Hahn, D.E.; Kamath, C.; Rubenchik, A.M. Observation of keyhole-mode laser melting in laser powder-bed fusion additive manufacturing. J. Mater. Process. Technol. 2014, 214, 2915–2925. [Google Scholar] [CrossRef]
- Madison, J.D.; Aagesen, L.K. Quantitative characterization of porosity in laser welds of stainless steel. Scr. Mater. 2012, 67, 783–786. [Google Scholar] [CrossRef]
- Rännar, L.E.; Koptyug, A.; Olsén, J.; Saeidi, K.; Shen, Z. Hierarchical structures of stainless steel 316L manufactured by Electron Beam Melting. Addit. Manuf. 2017, 17, 106–112. [Google Scholar] [CrossRef]
- Ganesh, P.; Giri, R.; Kaul, R.; Ram Sankar, P.; Tiwari, P.; Atulkar, A.; Porwal, R.K.; Dayal, R.K.; Kukreja, L.M. Studies on pitting corrosion and sensitization in laser rapid manufactured specimens of type 316L stainless steel. Mater. Des. 2012, 39, 509–521. [Google Scholar] [CrossRef]
- Cherry, J.A.; Davies, H.M.; Mehmood, S.; Lavery, N.P.; Brown, S.G.R.; Sienz, J. Investigation into the effect of process parameters on microstructural and physical properties of 316L stainless steel parts by selective laser melting. Int. J. Adv. Manuf. Technol. 2015, 76, 869–879. [Google Scholar] [CrossRef] [Green Version]
- Tolosa, I.; Garciandía, F.; Zubiri, F.; Zapirain, F.; Esnaola, A. Study of mechanical properties of AISI 316 stainless steel processed by “selective laser melting”, following different manufacturing strategies. Int. J. Adv. Manuf. Technol. 2010, 51, 639–647. [Google Scholar] [CrossRef]
- Sobral, A.V.C.; Ristow, W.; Azambuja, D.S.; Costa, I.; Franco, C.V. Potentiodynamic tests and electrochemical impedance spectroscopy of injection molded 316L steel in NaCl solution. Corros. Sci. 2001, 43, 1019–1030. [Google Scholar] [CrossRef]
- Nóvoa, X.R.; Abreu, C.M.; Cristóbal, M.J.; Figueroa, R.; Novoa, X.R.; Pena, G.; Pérez, M.C. Microstructure of the Passive Layer Formed on Different Austenitic Stainless Steels Implanted with Molybdenum. Defect Diffus. Forum 2009. [Google Scholar] [CrossRef]
- Zhong, Y.; Liu, L.; Wikman, S.; Cui, D.; Shen, Z. Intragranular cellular segregation network structure strengthening 316L stainless steel prepared by selective laser melting. J. Nucl. Mater. 2016, 470, 170–178. [Google Scholar] [CrossRef]


| Ref. | Laser Power (P) (W) | Scanning Speed (v) (mm/s) | Hatch Spacing (h) (μm) | Layer Thickness (t) (μm) | Energy Density 1 (E) (J/mm3) | Corrosion Results | Grinding Level | Relative Density |
|---|---|---|---|---|---|---|---|---|
| [20] | 175 | 730 | 120 | 30 | 66.6 | SLM Epit: 740 mV vs. SCE. Passivity > wrought 316L (0.6 M NaCl) | 0.04 μm colloidal silica | - |
| [21] | - | - | -- | - | SLM Epit 700 mV > wrought 316L (0.9 wt% NaCl) | #800 grit SiC | 99.4%–99.6% | |
| [22] | 180 | 600 | 20 | 25 | 600 | SLM Epit 900 mV > wrought 316L (3.5 wt% NaCl) | 1 μm surface finishin | - |
| [23] | 165–285 | 860–1160 | 110 | 40 | 39.1–75.3 | SLM Epit 300 mV > wrought 316L (NaCl 0.1M solution) | 1 μm | - |
| [24] | 90 | 1000 | 105 | 30 | 28.6 | SLM Epit > wrought 316L (high variability) (NaCl 0.1 M solution) | - | - |
| [25] | 180 | 600 | 36 | 25 | 333 | SLM Epit = 1.4 V vs. Ag/AgCl (3 M KCl) >> wrought 316L (3.5 wt% NaCl) | - | |
| [26] | 200 | - | 100 | 30 | - | SLM Epit = 920 mV vs. SCE >> wrought 316L (0.9 M NaCl) | 1200 grit SiC | - |
| [27] | 150 | 800–1400 | 25 | 25 | 171–300 | SLM Epit 300 mV > wrought 316L (3.5 wt% NaCl) | 2000 grit SiC | - |
| [28] | 285 | 960 | 110 | 40 | 67 | SLM Epit 100 mV > wrought 316L (3.5 wt% NaCl) | - | - |
| [29] | 200 | 800 | - | 120 | SLM Epit 200 mV > wrought 316L (simulated body fluid | 2000 grit SiC | - | |
| [30] | 200 | 800 | 100 | 30 | 83.3 | SLM ≈ Epit vs. wrought 316L (3 wt% NaCl solution) | 2400 grit SiC | 99.58% |
| [31] | 150–200 | 300–600 | 10–50 | 50 | 100–1333 | SLM Epit: 560 mV vs. Ag/AgCl, ≈ wrought 316L Ringer’s solution pH 6.9 ± 0.2. | 0.04 µm Colloidal silica | 98% |
| [32] | 200 | - | 100 | 30 | - | SLM Epit < wrought 316L pH (1, 2 and 3) | 1 μm diamond suspension | - |
| [33] | 150 | 125–200 | 90 | 50 | 167–267 | SLM Epit < wrought 316L (0.9 wt% NaCl) | 1200 grit SiC | 98.3% |
| [34] | 195 | 1083 | 25 | 25 | 288 | SLM < wrought 316L 0.5 M H2SO4, 50 ppm Cl− and 2 ppm F− | 2000 grit SiC | - |
| [35] | 200 | 590 | 50 | 50 | 135.6 | SLM 316L: low passivity and high anodic current (0.1 M HCl) | 0.25-µm diamond suspension | - |
| Cr | Ni | Mo | C | Cu | Mn | N | P | S | Si | Fe |
|---|---|---|---|---|---|---|---|---|---|---|
| 17–19 | 13–15 | 2.25–3 | 0.03 | 0.5 | 2 | 0.1 | 0.025 | 0.01 | 0.75 | Balance |
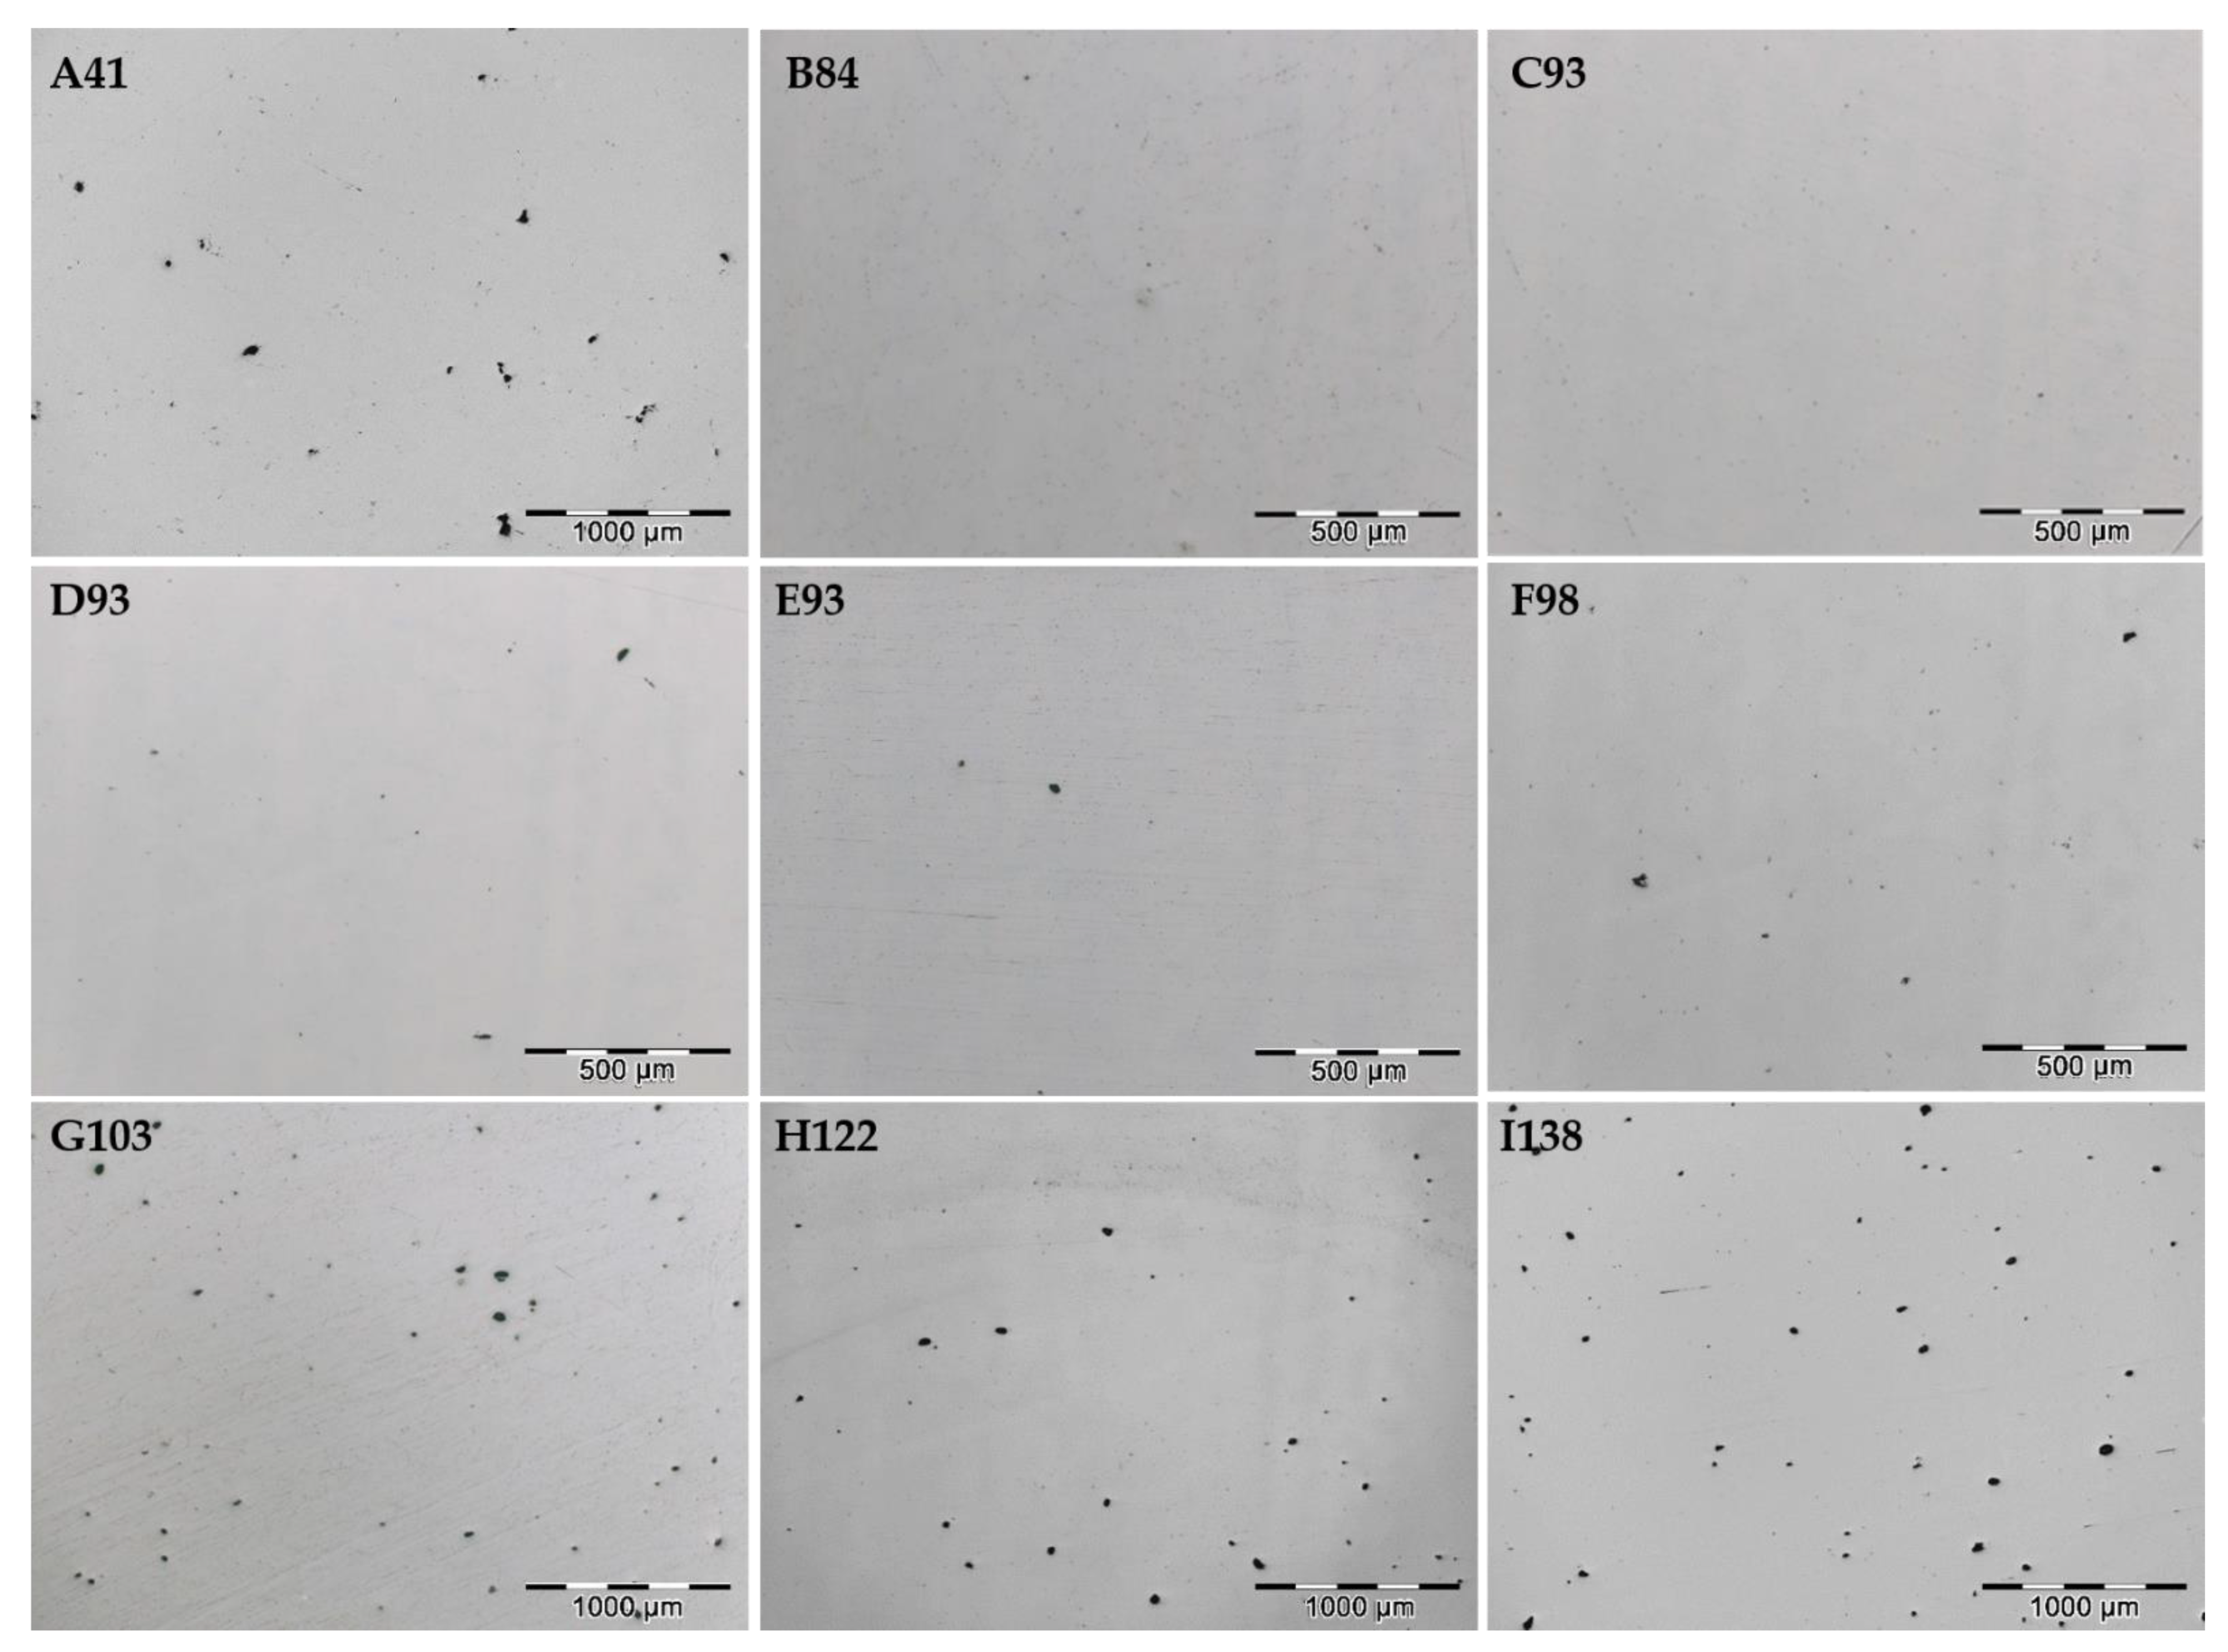
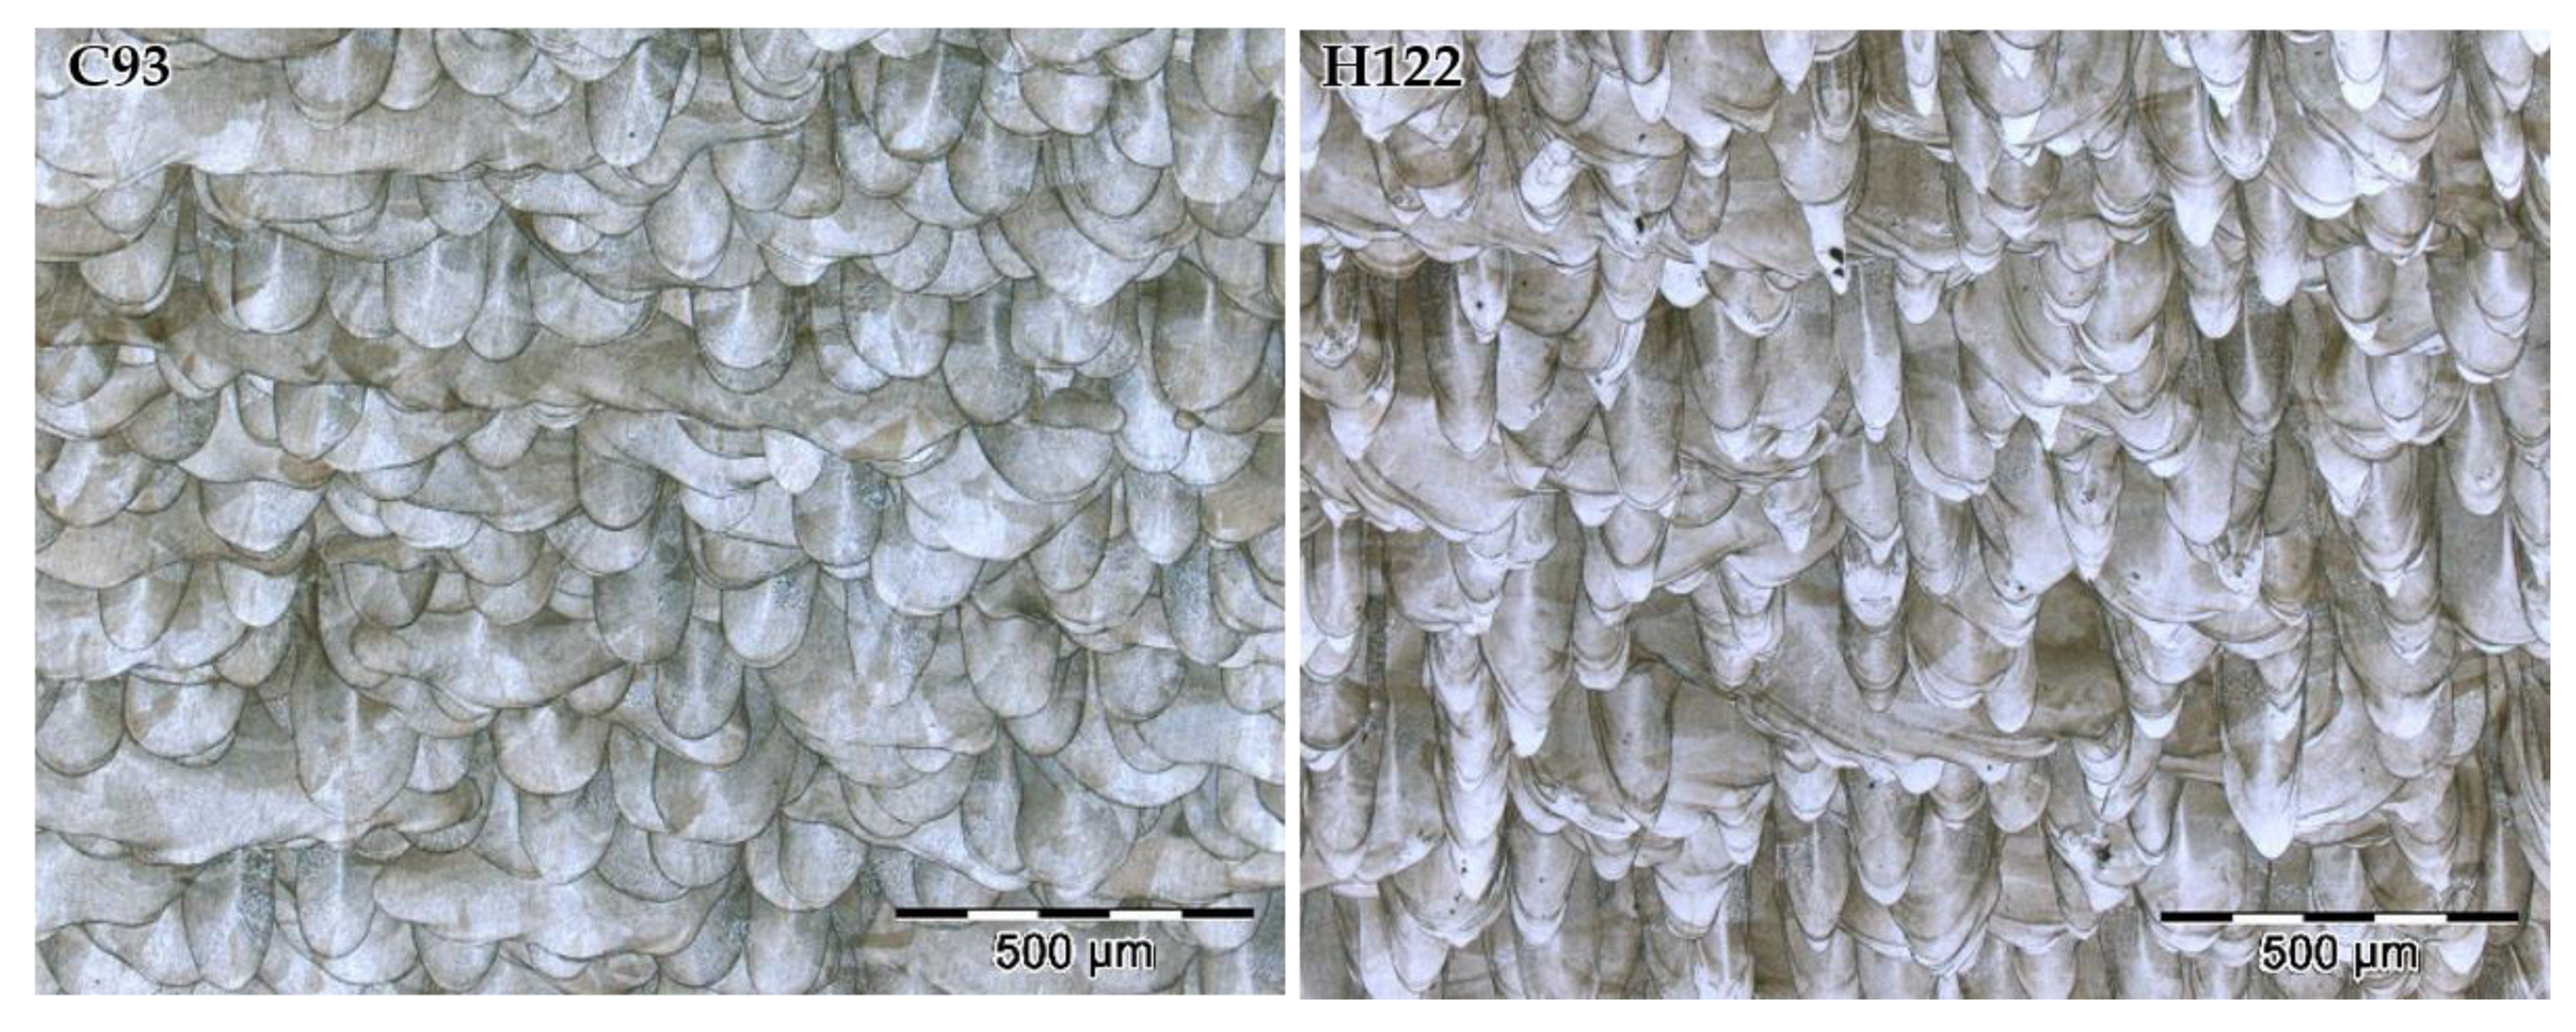
| Sample | A41 | B84 | C93 | D93 | E93 | F98 | G103 | H122 | I138 |
|---|---|---|---|---|---|---|---|---|---|
| Laser speed (mm/s) | 1200 | 550 | 625 | 500 | 555 | 496.74 | 450 | 400 | 608 |
| Hatch distance (mm) | 0.19 | 0.2 | 0.16 | 0.2 | 0.18 | 0.19 | 0.2 | 0.19 | 0.11 |
| E (J/mm3) | 40.57 | 84.09 | 92.5 | 92.5 | 92.59 | 98.01 | 102.78 | 121.71 | 138.31 |
| Sample | A41 | B84 | C93 | D93 | E93 | F98 | G103 | H122 | I138 |
| Porosity (%) | 0.46 | 0.28 | 0.16 | 0.17 | 0.22 | 0.26 | 0.53 | 0.54 | 0.65 |
Publisher’s Note: MDPI stays neutral with regard to jurisdictional claims in published maps and institutional affiliations. |
© 2022 by the authors. Licensee MDPI, Basel, Switzerland. This article is an open access article distributed under the terms and conditions of the Creative Commons Attribution (CC BY) license (https://creativecommons.org/licenses/by/4.0/).
Share and Cite
Collazo, A.; Figueroa, R.; Pérez, C.; Nóvoa, X.R. Effect of Laser Speed and Hatch Spacing on the Corrosion Behavior of 316L Stainless Steel Produced by Selective Laser Melting. Materials 2022, 15, 1353. https://doi.org/10.3390/ma15041353
Collazo A, Figueroa R, Pérez C, Nóvoa XR. Effect of Laser Speed and Hatch Spacing on the Corrosion Behavior of 316L Stainless Steel Produced by Selective Laser Melting. Materials. 2022; 15(4):1353. https://doi.org/10.3390/ma15041353
Chicago/Turabian StyleCollazo, Antonio, Raúl Figueroa, Carmen Pérez, and Xosé Ramón Nóvoa. 2022. "Effect of Laser Speed and Hatch Spacing on the Corrosion Behavior of 316L Stainless Steel Produced by Selective Laser Melting" Materials 15, no. 4: 1353. https://doi.org/10.3390/ma15041353
APA StyleCollazo, A., Figueroa, R., Pérez, C., & Nóvoa, X. R. (2022). Effect of Laser Speed and Hatch Spacing on the Corrosion Behavior of 316L Stainless Steel Produced by Selective Laser Melting. Materials, 15(4), 1353. https://doi.org/10.3390/ma15041353