
Production and Properties of the Porous Layer Obtained by the Electrochemical Method on the Surface of Austenitic Steel


Abstract
:1. Introduction
- tissue compatibility (biocompatibility),
- non-toxicity and non-allergic,
- cytotoxic and carcinogenic,
- bioactivity enabling acceleration of the adhesion process with living tissue,
- blood-compatibility,
- no tendency to form clots, which depend on location in the blood stream,
- the contact time of the implant surface with blood,
- the blood flow velocity,
- the chemical composition of the surface [4].
2. Materials and Method
3. Results and Discussion
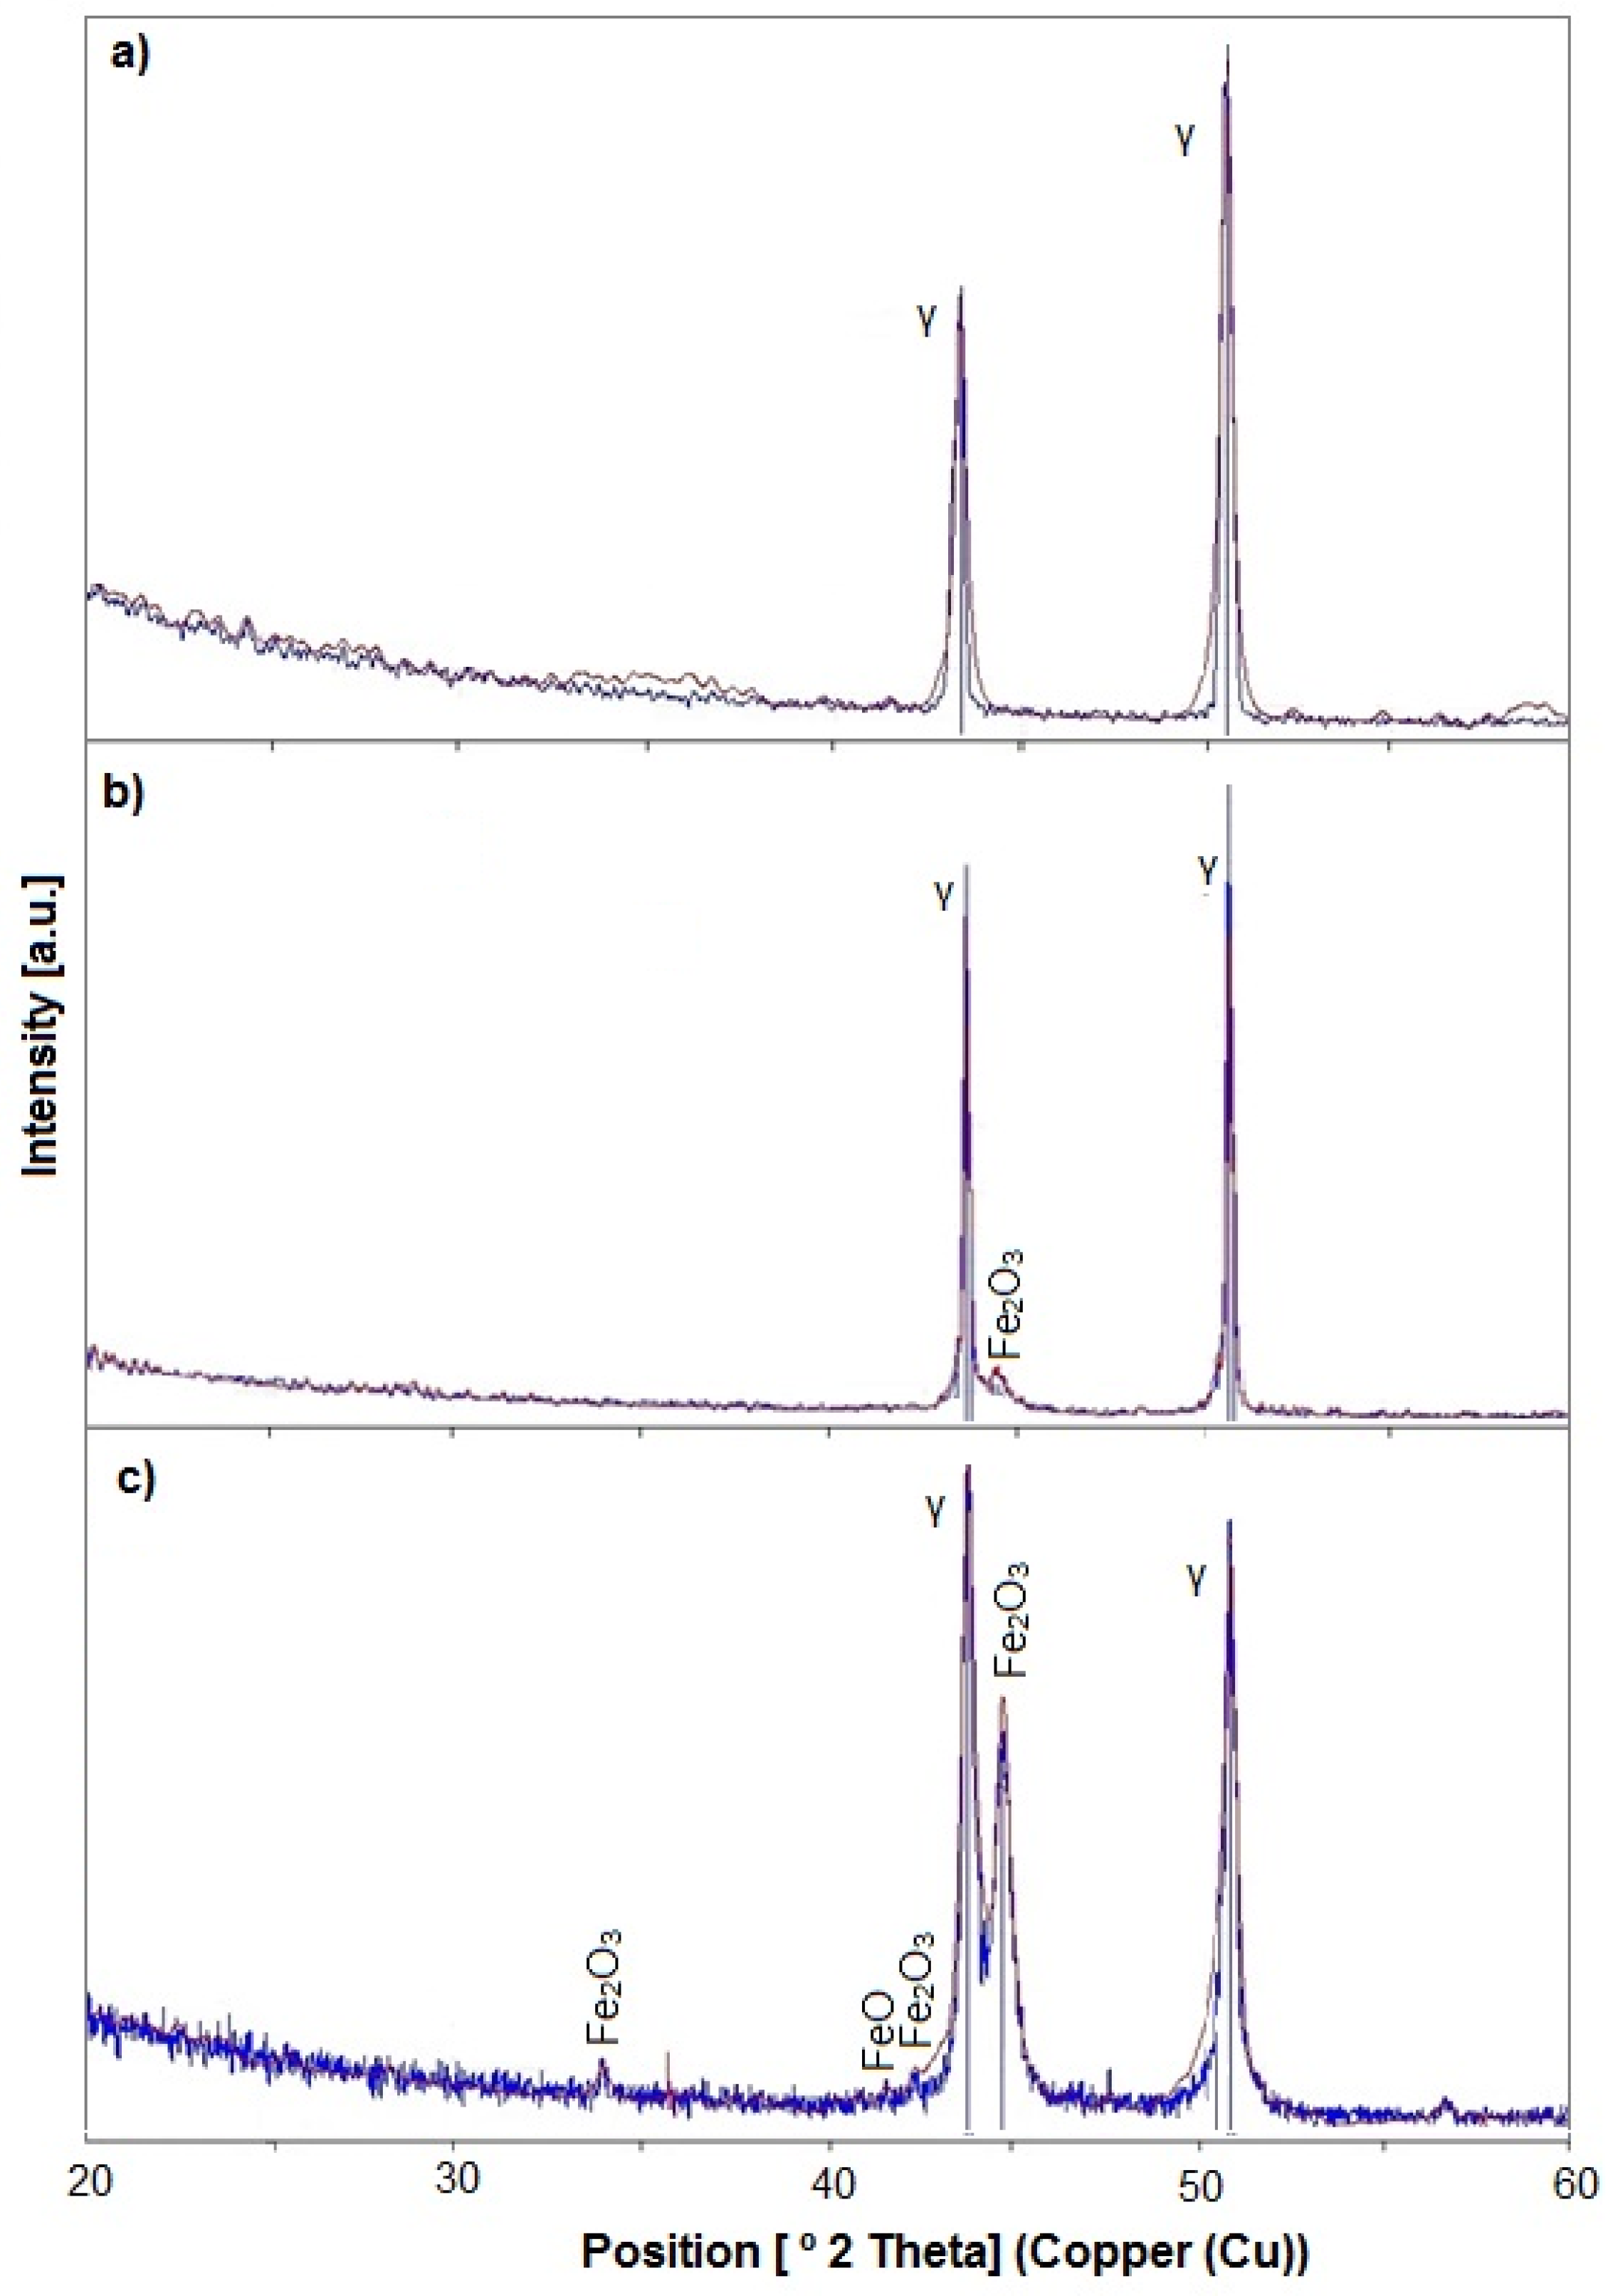
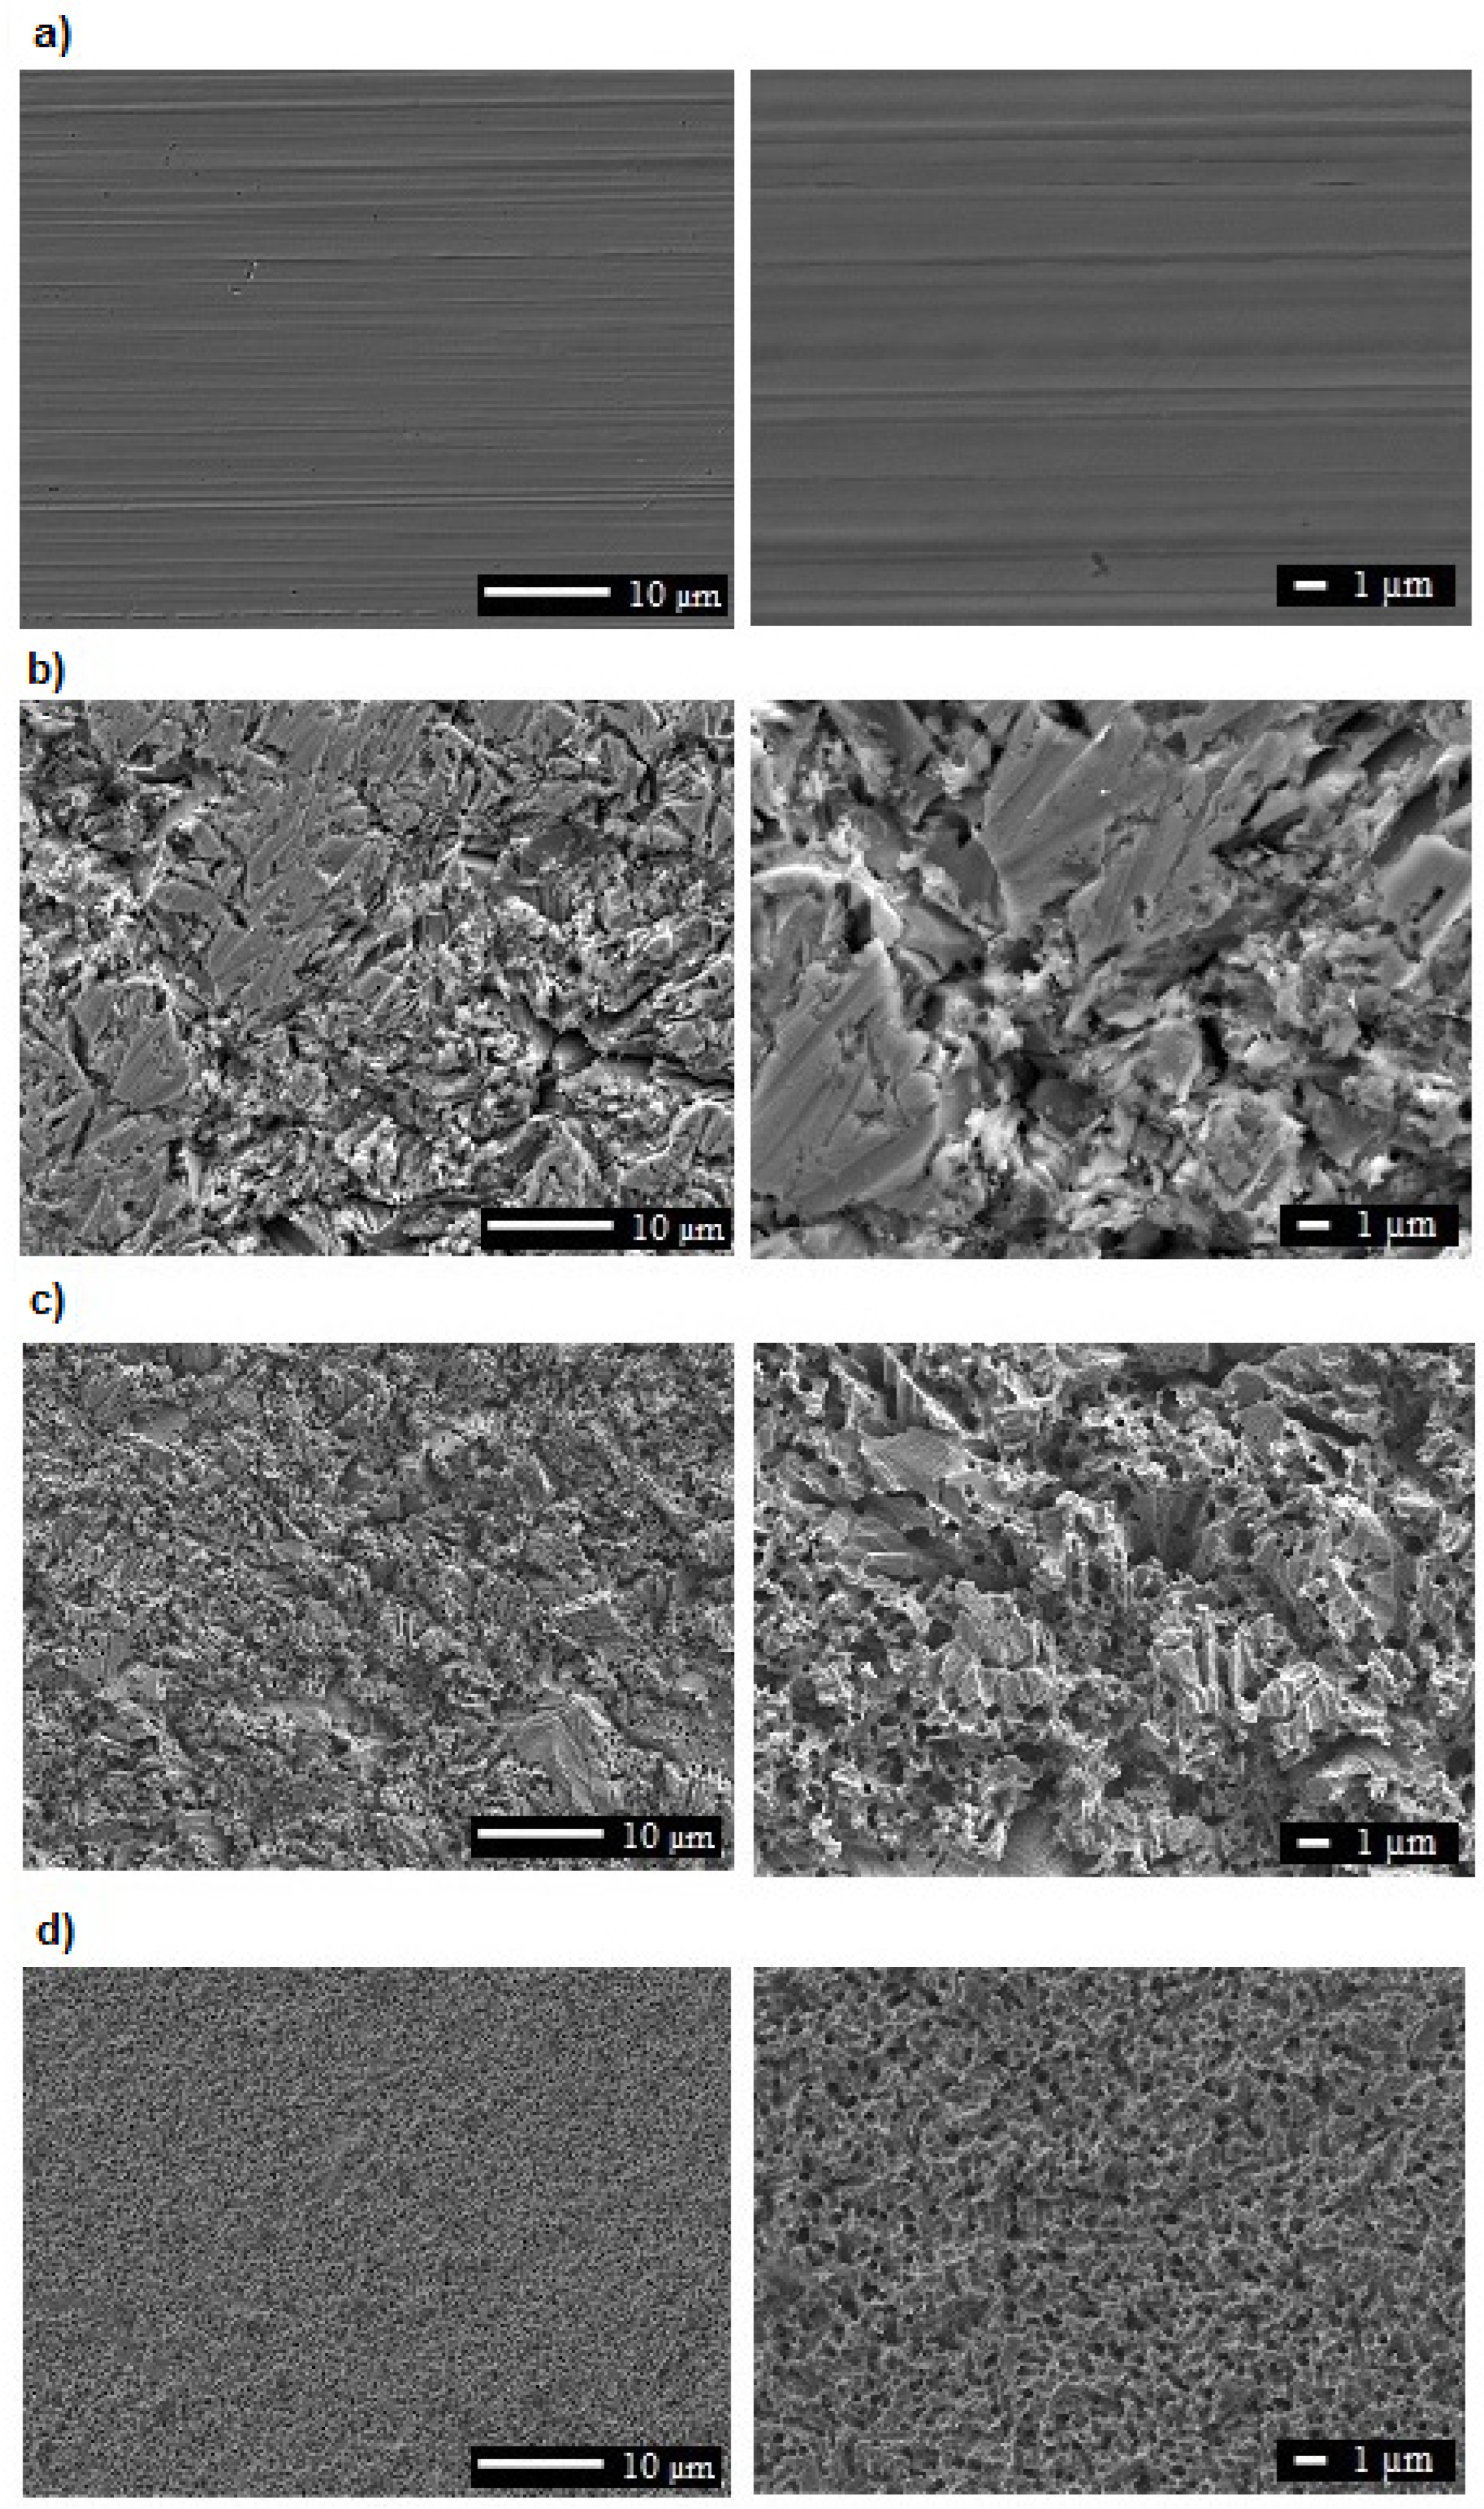
3.1. Microstructure, Surface Topography, Phase, and Chemical Compositions
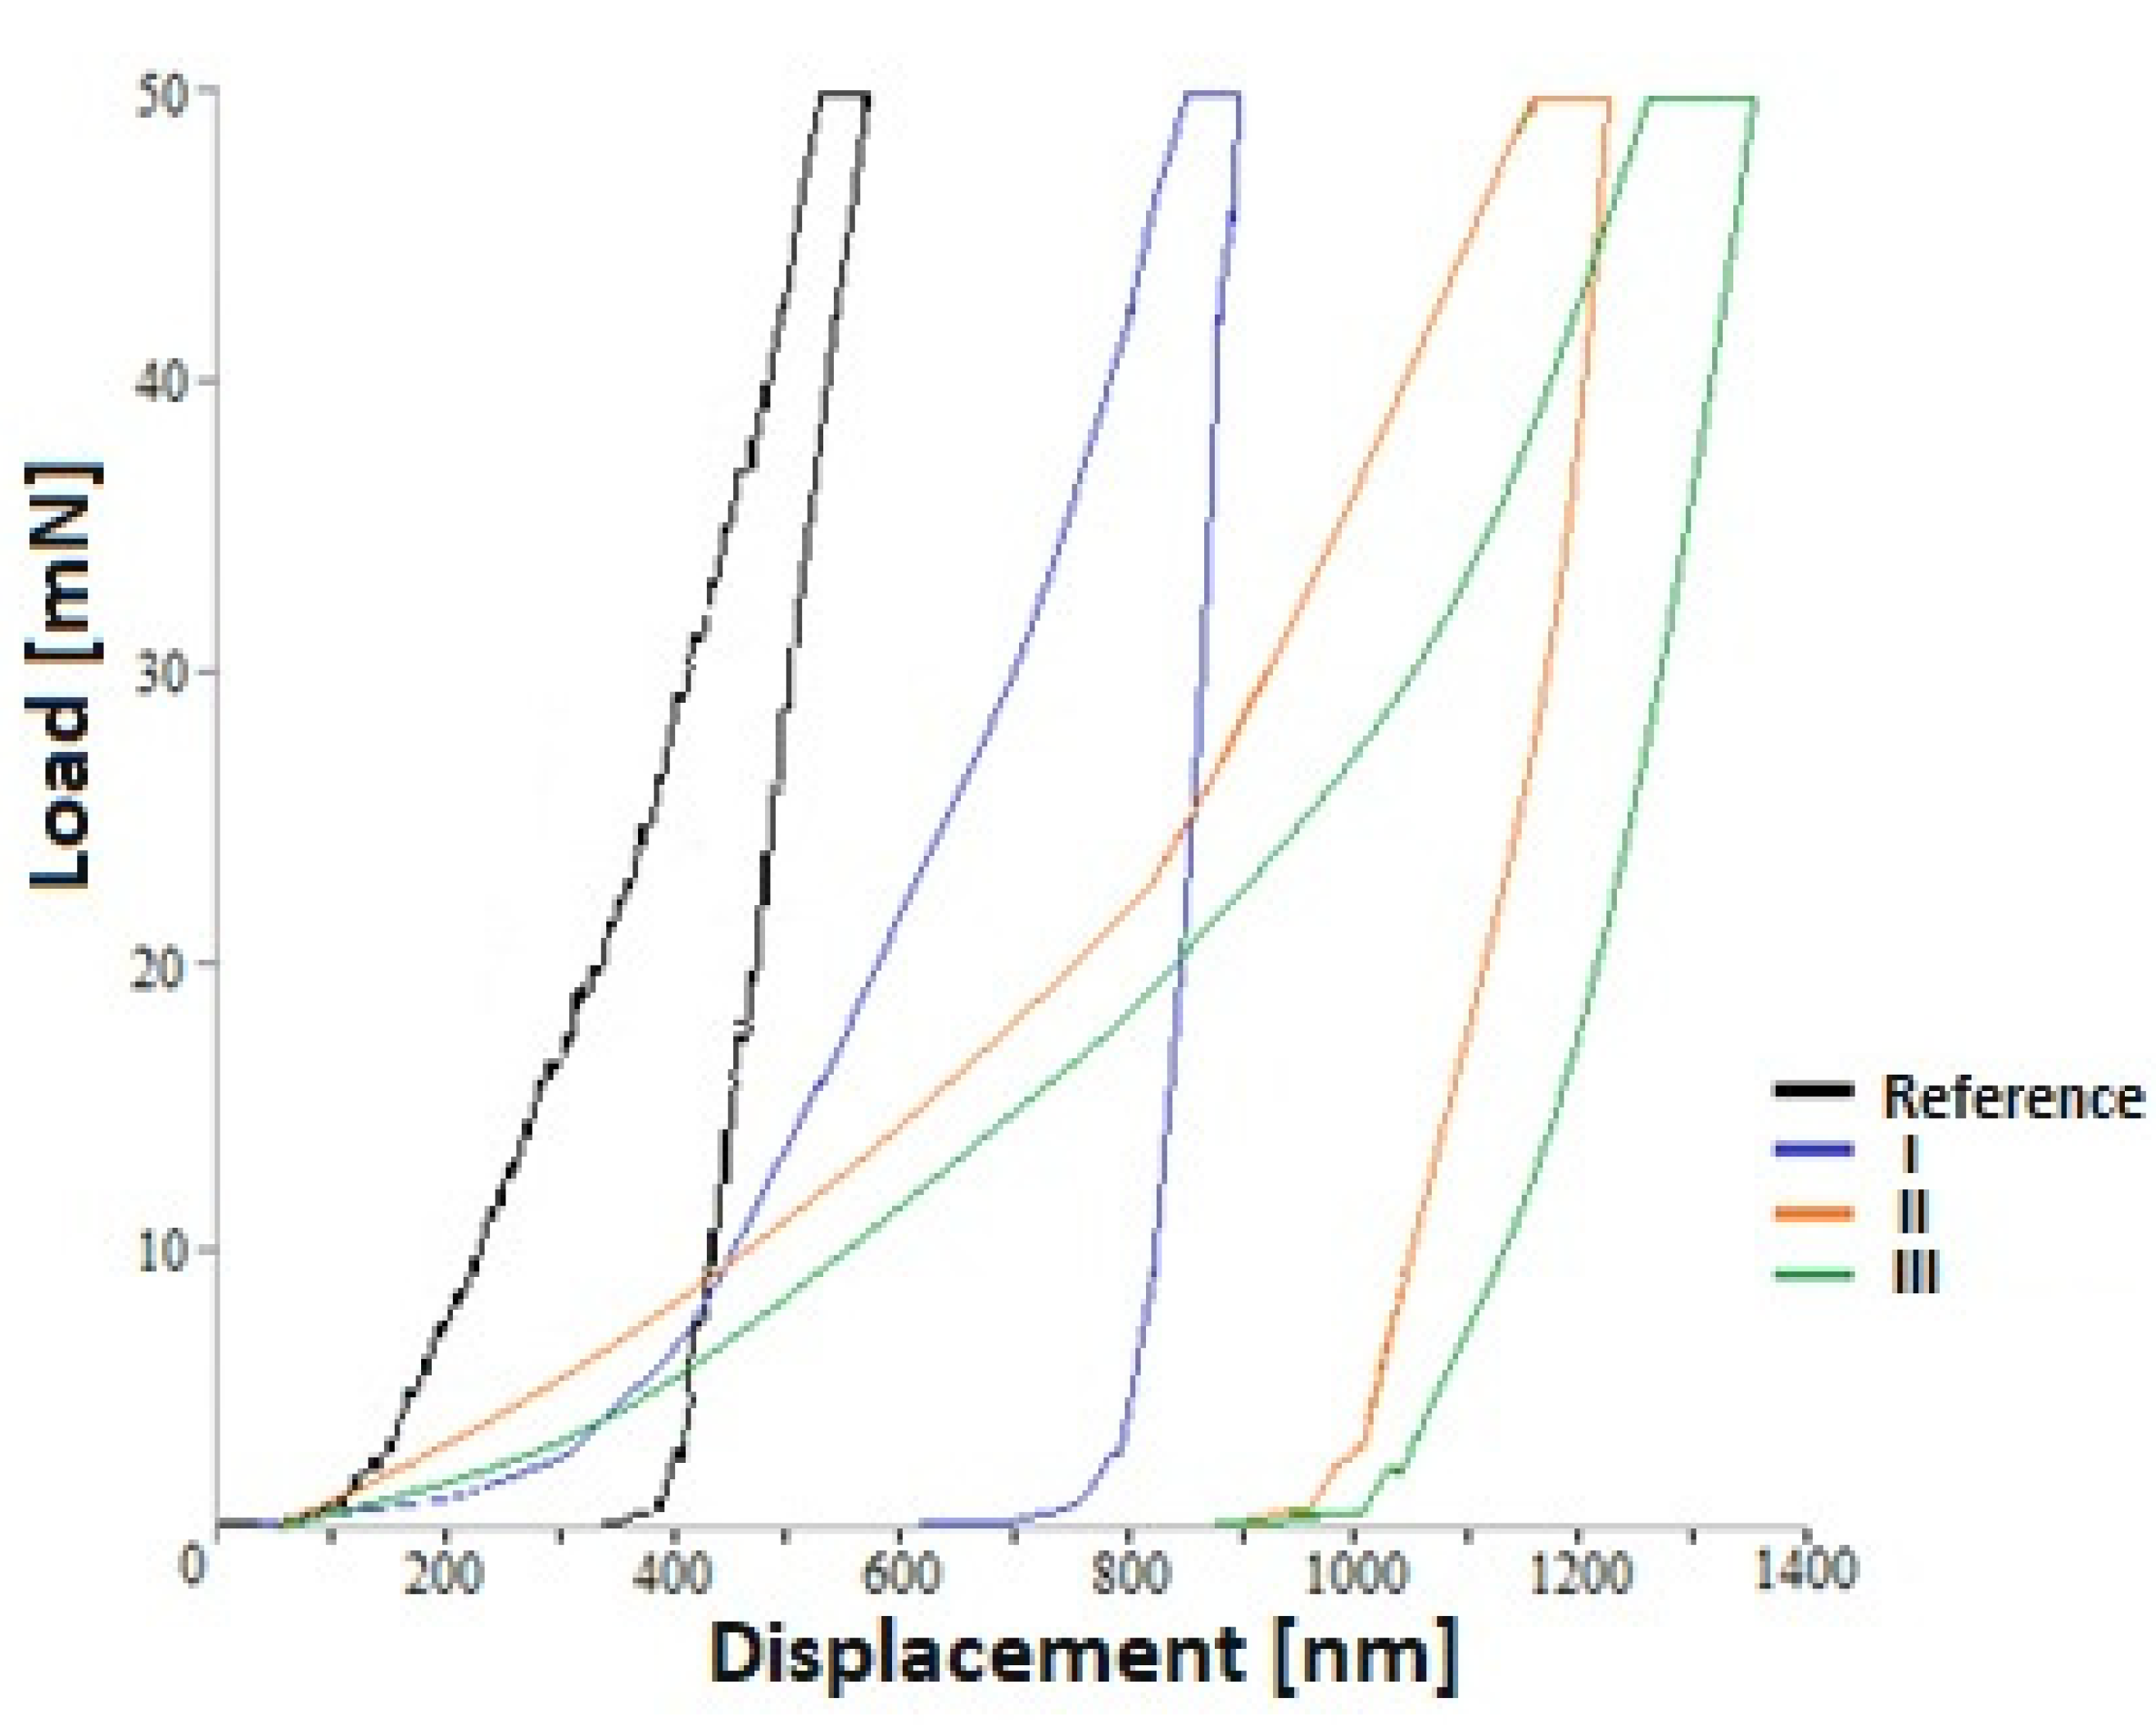
3.2. Nanomechanical Properties
4. Conclusions
Author Contributions
Funding
Institutional Review Board Statement
Informed Consent Statement
Data Availability Statement
Acknowledgments
Conflicts of Interest
References
- Paital, S.R.; Dahotre, N.B. Calcium phosphate coatings for bio-implant applications: Materials, performance, factors, and methodologies. Mater. Sci. Eng. R Rep. 2009, 66, 1–70. [Google Scholar] [CrossRef]
- Geijselaers, H.J.M.; Hilkhuijsen, P.; Bor, T.C.; van den Boogaard, A.H. Large strain cyclic behavior of metastable austenic stainless steel. Mater. Sci. Eng. 2015, A631, 166–172. [Google Scholar] [CrossRef]
- Shang, Y.-B.; Shi, H.-J.; Wang, Z.-X.; Zhang, G.-D. In-situ SEM study of short fatigue crack propagation behavior in a dissimilar metal welded joint of nuclear power plant. Mater. Des. 2015, 88, 598–609. [Google Scholar] [CrossRef]
- Kasemo, B. Biological surface science. Surf. Sci. 2002, 500, 656–677. [Google Scholar] [CrossRef]
- Ferretti, J.L.; Cointry, G.R.; Capozza, R.F.; Frost, H.M. Bone mass, bone strength, muscle-bone interactions, osteopenias and osteoporoses. Mech. Ageing Dev. 2003, 124, 269–279. [Google Scholar] [CrossRef]
- Pawlikowski, M.; Skalski, K.; Haraburda, M. Process of hip joint prosthesis design including bone remodelling phenomenon. Comput. Struct. 2003, 81, 887–893. [Google Scholar] [CrossRef]
- Spoerke, E.D.; Murray, N.G.; Li, H.; Brinson, C.; Dunand, D.C.; Stupp, S.I. A bioactive titanium foam scaffold for bone repair. Acta Biomater. 2005, 1, 523–533. [Google Scholar] [CrossRef]
- Bizi-Bandoki, P.; Benayoun, S.; Valette, S.; Beaugiraud, B.; Audouard, E. Modifications of roughness and wettability properties of metals induced by femtosecond laser treatment. Appl. Surf. Sci. 2011, 257, 5213–5218. [Google Scholar] [CrossRef]
- Martínez-Calderon, M.; Rodríguez, A.; Dias-Ponte, A.; Morant-Miñana, M.C.; Gómez-Aranzadi, M.; Olaizola, S.M. Femtosecond laser fabrication of highly hydrophobic stainless steel surface with hierarchical structures fabricated by combining ordered microstructures and LIPSS. Appl. Surf. Sci. 2016, 374, 81–89. [Google Scholar] [CrossRef]
- Mroczkowska, K.; Gąsiorek, J.; Mazur-Nowacka, A.; Szczygieł, B.; Antończak, A.J. Adhesion and corrosion resistance of laser-oxidized titanium in potential biomedical application. Surf. Coat. Technol. 2019, 366, 179–189. [Google Scholar] [CrossRef]
- Aniołek, K.; Kupka, M.; Barylski, A. Sliding wear resistance of oxide layers formed on a titanium surface during thermal oxidation. Wear 2016, 356–357, 23–29. [Google Scholar] [CrossRef]
- Kim, J.H.; Mirzaei, A.; Kim, H.W.; Kim, S.S. Facile fabrication of superhydrophobic surfaces from austenitic stainless steel (AISI 304) by chemical etching. Appl. Surf. Sci. 2018, 439, 598–604. [Google Scholar] [CrossRef]
- Pantoja, M.; Velasco, F.; Abenojar, J.; Martinez, M.A. Development of superhydrophobic coatings on AISI 304 austenitic stainless steel with different surface pretreatments. Thin Solid Film. 2019, 671, 22–30. [Google Scholar] [CrossRef]
- Gao, L.; Yang, S.; Yang, H.; Ma, T. One-Stage Method for fabricating superhydrophobic stainless steel surface and its anti-corrosion performance. Adv. Eng. Mater. 2017, 19, 1600511. [Google Scholar] [CrossRef]
- Gao, A.; Hang, R.; Bai, L.; Tang, B.; Chu, P.K. Electrochemical surface engineering of titanium-based alloys for biomedical application. Electrochim. Acta 2018, 271, 699–718. [Google Scholar] [CrossRef]
- Khodaei, M.; Kelishadi, S.H. The effect of different oxidizing ions on hydrogen peroxide treatment of titanium dental implant. Surf. Coat. Technol. 2018, 353, 158–162. [Google Scholar] [CrossRef]
- Choi, W.T.; Oh, K.; Singh, P.M.; Breedveld, V.; Hess, D.W. Wettability control of stainless steel surfaces via evolution of intrinsic grain structures. J. Mater. Sci. 2016, 51, 5196–5206. [Google Scholar] [CrossRef]
- Borgioli, F.; Galvanetto, E.; Bacci, T. Effects of surface modification by means of low-temperature plasma nitriding wetting and corrosion behavior of austenitic stainless steel. Coatings 2020, 10, 98. [Google Scholar] [CrossRef] [Green Version]
- Choi, W.T.; Oh, K.; Singh, P.M.; Breedveld, V.; Hess, D.W. Hydrophobicity and improved localized corrosion resistance of grain boundary etched stainless steel in chloride-containing environment. J. Electrochem. Soc. 2017, 164, C61–C65. [Google Scholar] [CrossRef]
- Habibzadeh, S.; Li, L.; Shum-Tim, D.; Davis, E.C.; Omanovic, S. Electrochemical polishing as a 316L stainless steel surface treatment method: Towards the improvement of biocompatibility. Corros. Sci. 2014, 87, 89–100. [Google Scholar] [CrossRef]
- O’Brien, B.; Carroll, W. The evolution of cardiovascular stent materials and surfaces in response to clinical drivers: A review. Acta Biomater. 2009, 5, 945–958. [Google Scholar] [CrossRef] [PubMed]
- Ossowska, A.; Zieliński, A.; Olive, J.-M.; Wojtowicz, A.; Szweda, P. Influence of two-stage anodization on properties of the oxide coatings on the Ti-13Nb-13Zr alloy. Coatings 2020, 10, 707–727. [Google Scholar] [CrossRef]
- Ossowska, A.; Beutner, R.; Scharnweber, D.; Zieliński, A. Properties of the composite oxide layers on the Ti13Nb13Zr alloy. Surf. Eng. 2017, 33, 841–848. [Google Scholar] [CrossRef]
- Pawlik, A.; Hnida, K.; Socha, R.P.; Wiercigroch, E.; Małek, K.; Sulka, G.D. Effects of anodizing conditions and annealing temperature on the morphology and crystalline structure of anodic oxide layers grown on iron. Appl. Surf. Sci. 2017, 426, 1084–1093. [Google Scholar] [CrossRef]
- Klimas, V.; Pakštas, V.; Vrublevsky, I.; Chernyakova, K.; Jagminas, A. Fabrication and characterization of anodic films onto the type-304 stainless steel in glycerol electrolyte. J. Phys. Chem. C 2013, 117, 20730–20737. [Google Scholar] [CrossRef]
- Lin, D.J.; Fuh, L.J.; Chen, C.Y.; Chen, W.C.; Lin, J.H.C.; Chen, C.C. Rapid nano-scale surface modification on micro-arc oxidation coated titanium by microwave-assisted hydrothermal process. Mater. Sci. Eng. C 2019, 95, 236–247. [Google Scholar] [CrossRef]
- He, X.; Zhang, X.; Wang, X.; Qin, L. Review of antibacterial activity of titanium-based implants’ surfaces fabricated by micro-arc oxidation. Coatings 2017, 7, 45. [Google Scholar] [CrossRef] [Green Version]
- Lim, S.-G.; Choe, H.-C. Bioactive apatite formation on PEO-treated Ti-6Al-4V alloy after 3rd anodic titanium oxidation. Appl. Surf. Sci. 2019, 484, 365–373. [Google Scholar] [CrossRef]
- Cordeiro, J.M.; Nagay, B.E.; Ribeiro, A.L.R.; da Cruz, N.C.; Rangel, E.C.; Fais, L.M.G.; Vaz, L.G.; Barão, V.A.R. Functionalization of an experimental Ti-Nb-Zr-Ta alloy with a biomimetic coating produced by plasma electrolytic oxidation. J. Alloy Compd. 2019, 770, 1038–1048. [Google Scholar] [CrossRef]
- Burstein, G.T.; Vines, S.P. Repetitive nucleation of corrosion pits on stainless steel and the efects of surface roughness. J. Electrochem. Soc. 2001, 148, 504–516. [Google Scholar] [CrossRef]
- Hilbert, L.R.; Bagge-Ravn, D.; Kold, J.; Gram, L. Influence of surface roughness of stainless steel on microbial adhesion and corrosion resistance. Int. Biodeterior. Biodegrad. 2003, 52, 175–185. [Google Scholar] [CrossRef]
- Gachot, C.; Rosenkranz, A.; Hsu, S.M.; Costa, H.L. A critical assessment of surface texturing for friction and wear improvement. Wear 2017, 372–373, 21–41. [Google Scholar] [CrossRef]
- Grützmacher, P.G.; Profito, F.J.; Rosenkranz, A. Multi-scale surface texturing in tribology—current knowledge and future perspectives. Lubricants 2019, 7, 95. [Google Scholar] [CrossRef] [Green Version]
- Quéré, D. Wetting and Roughness. Annu. Rev. Mater. Res. 2008, 38, 71–99. Available online: https://www.semanticscholar.org/paper/Wetting-and-Roughness-Qu/ecd2f3fb1cc2d5c64a5d35d1cf666022fabf3cb7 (accessed on 1 February 2021). [CrossRef]
- Cao, L.; Hu, H.A.; Gao, D. Design and fabrication of micro-textures for inducing a superhydrophobic behavior on hydrophilic materials. Langmuir 2007, 23, 4310–4314. [Google Scholar] [CrossRef]
- Duan, J.-A.; Dong, X.; Yin, K.; Yang, S.; Chu, D. A hierarchical superaerophilic cone: Robust spontaneous and directional transport of gas bubbles. Appl. Phys. Lett. 2018, 113, 203704. [Google Scholar] [CrossRef]
- Sheng, Y.J.; Jiang, S.; Tsao, H.K. Effects of geometrical characteristics of surface roughness on droplet wetting. J. Chem. Phys. 2007, 127, 234704. [Google Scholar] [CrossRef]
- Whyman, G.; Bormashenko, E. How to make the Cassie wetting state stable? Langmuir 2011, 27, 8171–8176. [Google Scholar] [CrossRef]
- Tuteja, A.; Choi, W.; Mckinley, G.H.; Cohen, R.E.; Rubner, M.F. Design parameters for superhydrophobicity and superoleophobicity. MRS Bull. 2008, 33, 752–758. [Google Scholar] [CrossRef] [Green Version]
- Kota, A.K.; Mabry, J.M.; Tuteja, A. Superoleophobic surfaces: Design criteria and recent studies. Surf. Innov. 2013, 1, 71–83. [Google Scholar] [CrossRef] [Green Version]
- Liu, K.; Jiang, L. Metallic surfaces with special wettability. Nanoscale 2011, 3, 825–838. [Google Scholar] [CrossRef] [PubMed]
- Yin, K.; Du, H.; Dong, X.; Wang, C.; Duan, J.-A.; He, J. A simple way to achieve bioinspired hybrid wettability surface with micro/nanopatterns for e_cient fog collection. Nanoscale 2017, 9, 14620–14626. [Google Scholar] [CrossRef] [PubMed]
- Yang, S.; Yin, K.; Chu, D.; He, J.; Duan, J.-A. Femtosecond laser structuring of Janus foam: Water spontaneous antigravity unidirectional penetration and pumping. Appl. Phys. Lett. 2018, 113, 203701. [Google Scholar] [CrossRef]
- Yang, S.; Yin, K.; Wu, J.; Wu, Z.; Chu, D.; He, J.; Duan, J.-A. Ultrafast nano-structuring of superwetting Ti foam with robust antifouling and stability towards e_cient oil-in-water emulsion separation. Nanoscale 2019, 11, 17607–17614. [Google Scholar] [CrossRef]
- Roach, P.; Eglin, D.; Rohde, K.; Perry, C.C. Modern biomaterials: A review—Bulk properties and implications of surface modifications. J. Mater. Sci. Mater. Med. 2007, 18, 1263–1277. [Google Scholar] [CrossRef]
- Von Recum, A.F.; Shannon, C.E.; Cannon, C.E.; Long, K.J.; van Kooten, T.G.; Meyle, J. Surface roughness, porosity, and texture as modifiers of cellular adhesion. Tissue Eng. 2007, 2, 241–253. [Google Scholar] [CrossRef]
- Elter, P.; Sickel, F.; Ewald, A. Nanoscaled periodic surface structures of medical stainless steel and their e_ect on osteoblast cells. Acta Biomater. 2009, 5, 1468–1473. [Google Scholar] [CrossRef]
- Ossowska, A.; Zieliński, A. The mechanisms of degradation of titanium dental implants. Coatings 2020, 10, 836–850. [Google Scholar] [CrossRef]
- Pradhan, D.; Wren, A.W.; Misture, S.T.; Mellott, N.P. Investigating the structure and biocompatibility of niobium and titanium oxides as coatings for orthopedic metallic implants. Mater. Sci. Eng. C 2016, 58, 918–926. [Google Scholar] [CrossRef]
- Asoh, H.; Nakatani, M.; Ono, S. Fabrication of thick nanoporous oxide films on stainless steel via DC anodization and subsequent biofunctionalization. Surf. Coat. Technol. 2016, 307, 441–451. [Google Scholar] [CrossRef]
- Rangaraju, R.R.; Raja, K.S.; Panday, A.; Misra, M. An investigation on room temperature synthesis of vertically oriented arrays of iron oxide nanotubes by anodization of iron. Electrochim. Acta 2010, 55, 785–793. [Google Scholar] [CrossRef]
- Zhong, Z.; Qin, J.; Ma, J. Cellulose acetate/hydroxyapatite/chitosan coatings for improved corrosion resistance and bioactivity. Mat. Sci. Eng. C Mater. 2015, 49, 251–255. [Google Scholar] [CrossRef] [PubMed]
- Shayan, M.; Moradi, M.; Plakseychuk, A.Y.; Shankar, R.; Chun, Y. Osteoblast cell response to oxide films formed on nanograin 316L stainless steel obtained by two-dimensional linear plane-strain machining. Mater. Lett. 2016, 177, 94–98. [Google Scholar] [CrossRef] [Green Version]
- Tsuchiya, H.; Suzumura, T.; Terada, Y.; Fujimoto, S. Formation of self-organized pores on type 316 stainless steel in organic solvents. Electrochim. Acta 2012, 82, 333–338. [Google Scholar] [CrossRef]
- Doff, J.; Archibong, P.E.; Jones, G.; Koroleva, E.V.; Skeldon, P.; Thompson, G.E. Formation and composition of nanoporous films on 316L stainless steel by pulsed polarization. Electrochim. Acta 2011, 56, 3225–3237. [Google Scholar] [CrossRef]
- Kure, K.; Konno, Y.; Tsuji, E.; Skeldon, P.; Thompson, G.E.; Habazaki, H. Formation of self-organized nanoporous anodic films on type 304 stainless steel. Electrochem. Commun. 2012, 21, 1–4. [Google Scholar] [CrossRef]
- Zhou, T.; Cao, Z.; Zhang, P.; Ma, H.; Gao, Z.; Wang, H.; Lu, Y.; He, J.; Zhao, Y. Transition metal ions regulated oxygen evolution reaction performance of Ni-based hydroxides hierarchical nanoarrays. Sci. Rep. 2017, 7, 46154. [Google Scholar] [CrossRef] [Green Version]
- Pai, R.; Singh, A.; Simotwo, S.; Kalra, V. In situ grown iron oxides on carbon nanofibers as freestanding anodes in aqueous supercapacitors. Adv. Eng. Mater. 2018, 20, 1701116. [Google Scholar] [CrossRef]
- Amin, M.A.; Saracoglu, M.; El-Bagoury, N.; Sharshar, T.; Ibrahim, M.M.; Wysocka, J.; Krakowiak, S.; Ryl, J. Microstructure and corrosion behaviour of carbon steel and ferritic and austenitic stainless steels in NaCl solutions and the effect of p-nitrophenyl phosphate disodium salt. Int. J. Electrochem. Sci. 2016, 11, 10029–10052. [Google Scholar] [CrossRef]
- Payne, B.P.; Biesinger, M.C.; McIntyre, N.S. X-ray photoelectron spectroscopy studies of reactions on chromium metal and chromium oxide surfaces. J. Electron. Spectros. Relat. Phenom. 2011, 184, 29–37. [Google Scholar] [CrossRef]
- Biesinger, M.C.; Payne, B.P.; Grosvenor, A.P.; Lau, L.W.M.; Gerson, A.R.; Smart, R.S.C. Resolving surface chemical states in XPS analysis of first row transition metals, oxides and hydroxides: Cr, Mn, Fe, Co and Ni. Appl. Surf. Sci. 2011, 257, 2717–2730. [Google Scholar] [CrossRef]
- Wu, H.; Lian, K. The development of pseudocapacitive molybdenum oxynitride electrodes for supercapacitors. ECS Trans. 2014, 58, 67–75. [Google Scholar] [CrossRef]
- Tardio, S.; Abel, M.-L. Comparative study of the native oxide on 361L stainless steel by XPS and ToF-SIMS. J. Vac. Sci. Technol. A 2015, 33, 05E122. [Google Scholar] [CrossRef] [Green Version]
- Thomson, S.P.; Loughlan, J. Enhancing the post-bucking response of composite panel structure utilizing shape memory alloy actostors- a smart structural concept. Compos. Struct. 2001, 51, 21–36. [Google Scholar] [CrossRef]
- Chen, Z.; Wang, X.; Bhakhri, V.; Giuliani, F.A. Atkinson Nanoindentation of porous bulk and thin films of La0.6 Sr0.4Co0.2Fe0.8O3−δ. Acta Mat. 2013, 61, 5720–5734. [Google Scholar] [CrossRef] [Green Version]
- Chen, Z. Nanoindentation of Macro-Porous Materials for Elastic Modulus and Hardness Determination. Applied Nanoindentation in Advanced Materials; Tiwari, A., Natarajan, S., Eds.; John Wiley & Sons, Ltd.: Hoboken, NJ, USA, 2017; pp. 135–156. [Google Scholar] [CrossRef]
- Faucheux, N.; Schweiss, R.; Lutzow, K.; Werner, C.; Groth, T. Self-assembled monolayers with different terminating groups as model substrates for cell adhesion studies. Biomaterials 2004, 25, 2721–2730. [Google Scholar] [CrossRef]
- Menzies, K.L.; Jones, L. The Impact of Contact Angle on the Biocompatibility of Biomaterials. Optom. Vis. Sci. 2010, 87, 387–399. [Google Scholar] [CrossRef]
- Arima, Y.; Iwata, H. Effect of wettability and surface functional groups on protein adsorption and cell adhesion using well-defined mixed self-assembled monolayers. Biomaterials 2007, 28, 3074–3082. [Google Scholar] [CrossRef]
- Zhou, W.; Zhong, X.; Wu, X.; Yuan, L.; Zhao, Z.; Wang, H.; Xia, Y.; Feng, Y.; He, J.; Chen, W. The effect of surface roughness and wettability of nanostructures TiO2 film on TCA- 8113 epithelial-like cells. Surf. Coat. Technol. 2006, 200, 6155–6160. [Google Scholar] [CrossRef]
- Wysocka, J.; Cieslik, M.; Krakowiak, S.; Ryl, J. Carboxylic acids as efficient corrosion inhibitors of aluminium alloys in alkaline media. Electrochim. Acta 2018, 289, 175–192. [Google Scholar] [CrossRef]
- Jorcin, J.-B.; Orazem, M.E.; Pebere, N.; Tribollet, B. EPC analysis by local electrochemical impedance spectroscopy. Electrochim. Acta 2006, 51, 1473–1479. [Google Scholar] [CrossRef]
- Macdonald, D. Some advantages and pitfalls of electrochemical impedance spectroscopy. Corrosion 1990, 46, 229–242. [Google Scholar] [CrossRef]
- Ryl, J.; Wysocka, J.; Cieslik, M.; Gerengi, H.; Ossowski, T.; Krakowiak, S.; Niedzialkowski, P. Understanding the origin of high corrosion inhibition efficiency of bee products towards aluminium alloys in alkaline environments. Electrochim. Acta 2019, 304, 263–274. [Google Scholar] [CrossRef]


| C | Cr | Ni | Mo | Mn | Si | N | Fe |
|---|---|---|---|---|---|---|---|
| 0.03 | 17.64 | 11.97 | 2.15 | 1.71 | 0.71 | 0.053 | bal. |
| Sample | Voltage [V] | Time [Min] |
|---|---|---|
| I | 100 | 15 |
| II | 150 | 15 |
| III | 200 | 15 |
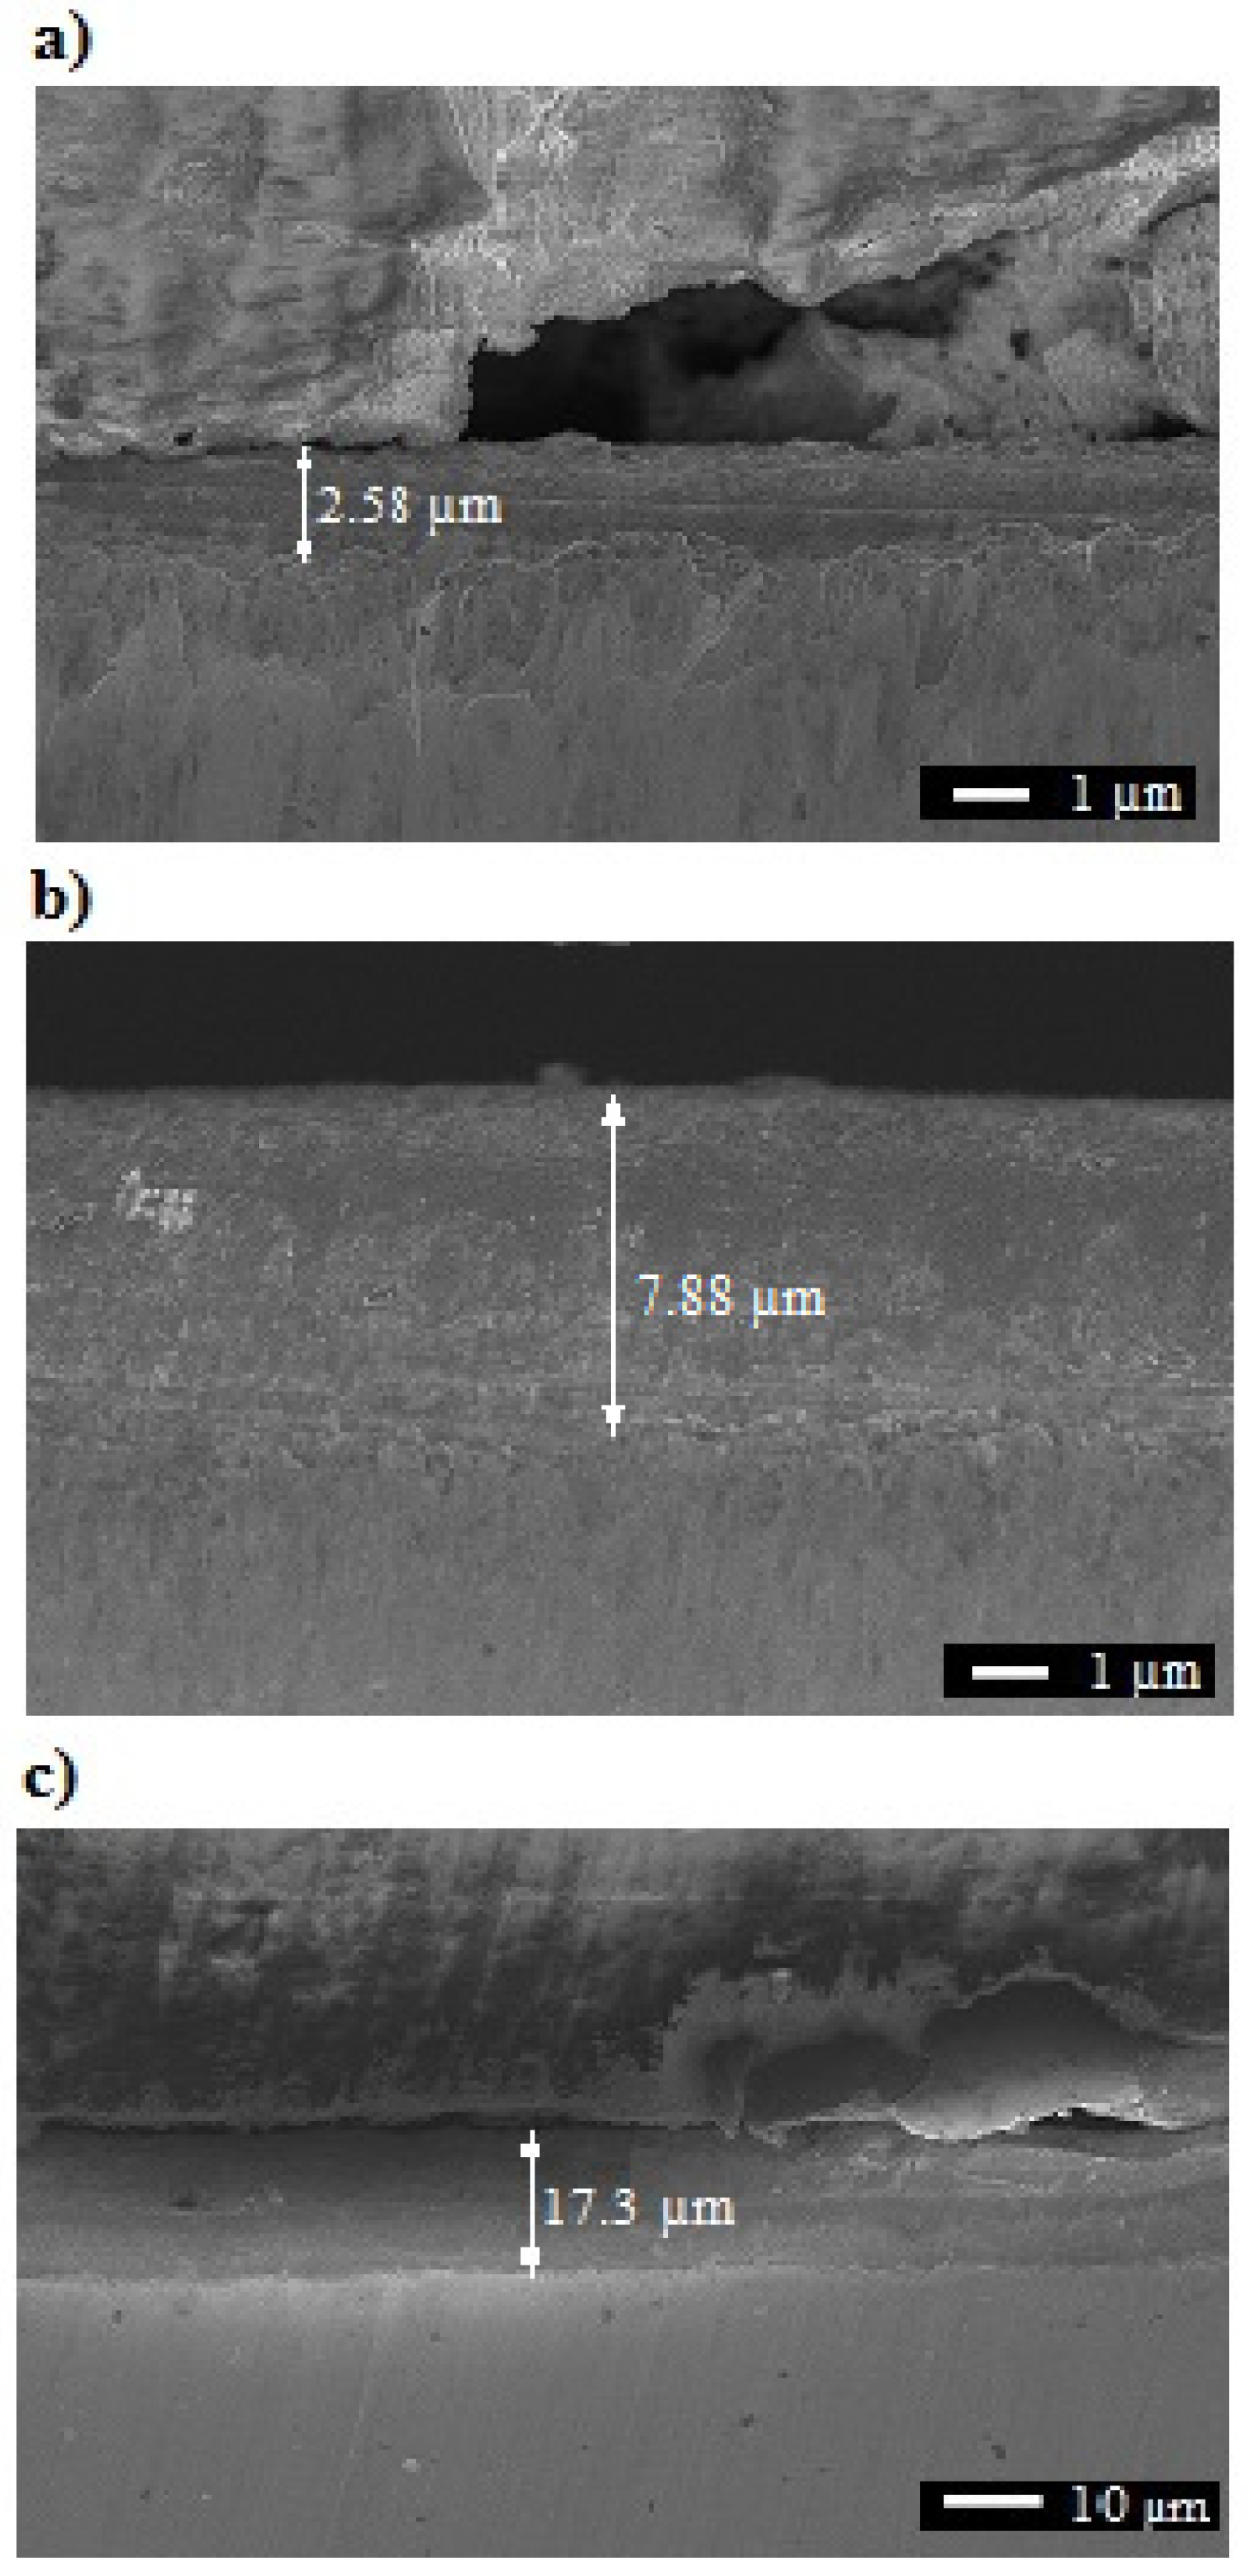
| Sample | Thickness [μm] |
|---|---|
| I | 2.3–2.8 |
| II | 6.0–7.9 |
| III | 14.3–15.8 |
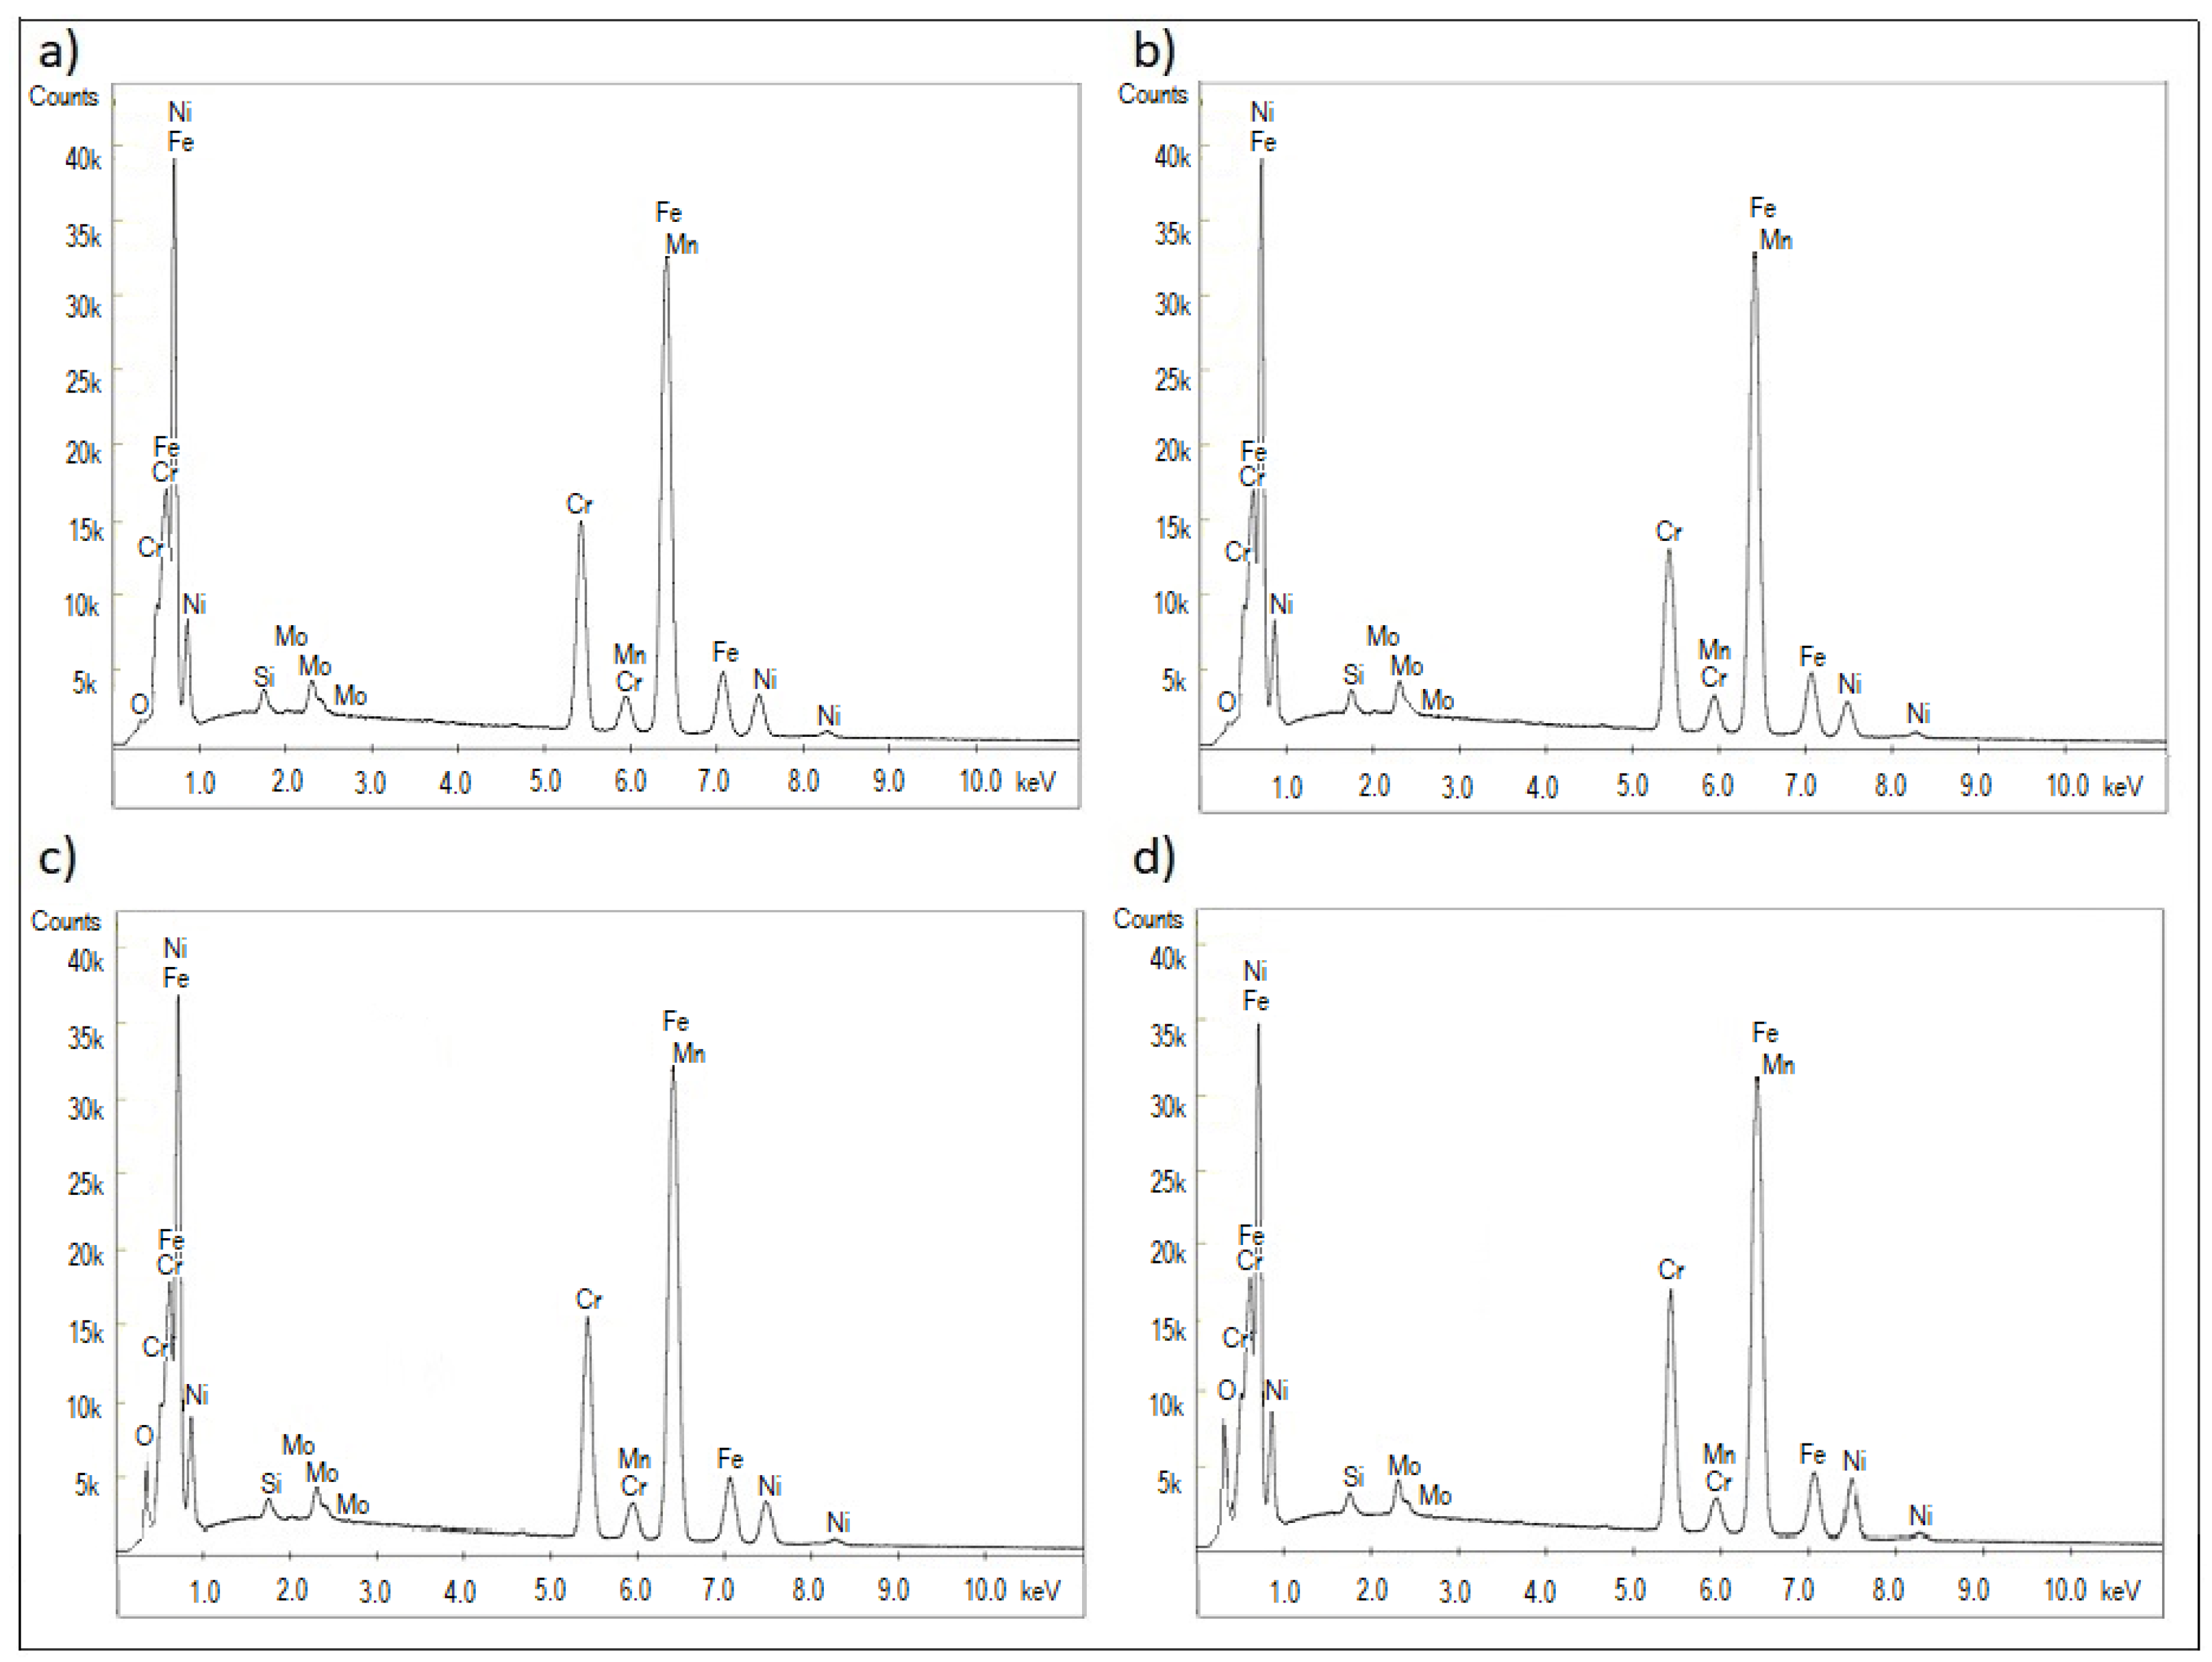
| Element | Reference | Sample I | Sample II | Sample III |
|---|---|---|---|---|
| Fe | 68.88 | 68.58 | 63.75 | 58.89 |
| Cr | 16.24 | 14.49 | 15.13 | 15.71 |
| Ni | 10.72 | 8.96 | 9.62 | 10.38 |
| Mo | 2.13 | 2.11 | 2.09 | 2.01 |
| Mn | 1.47 | 1.46 | 1.47 | 1.45 |
| Si | 0.56 | 0.54 | 0.57 | 0.58 |
| O * | - | 1.86 | 7.37 | 10.98 |
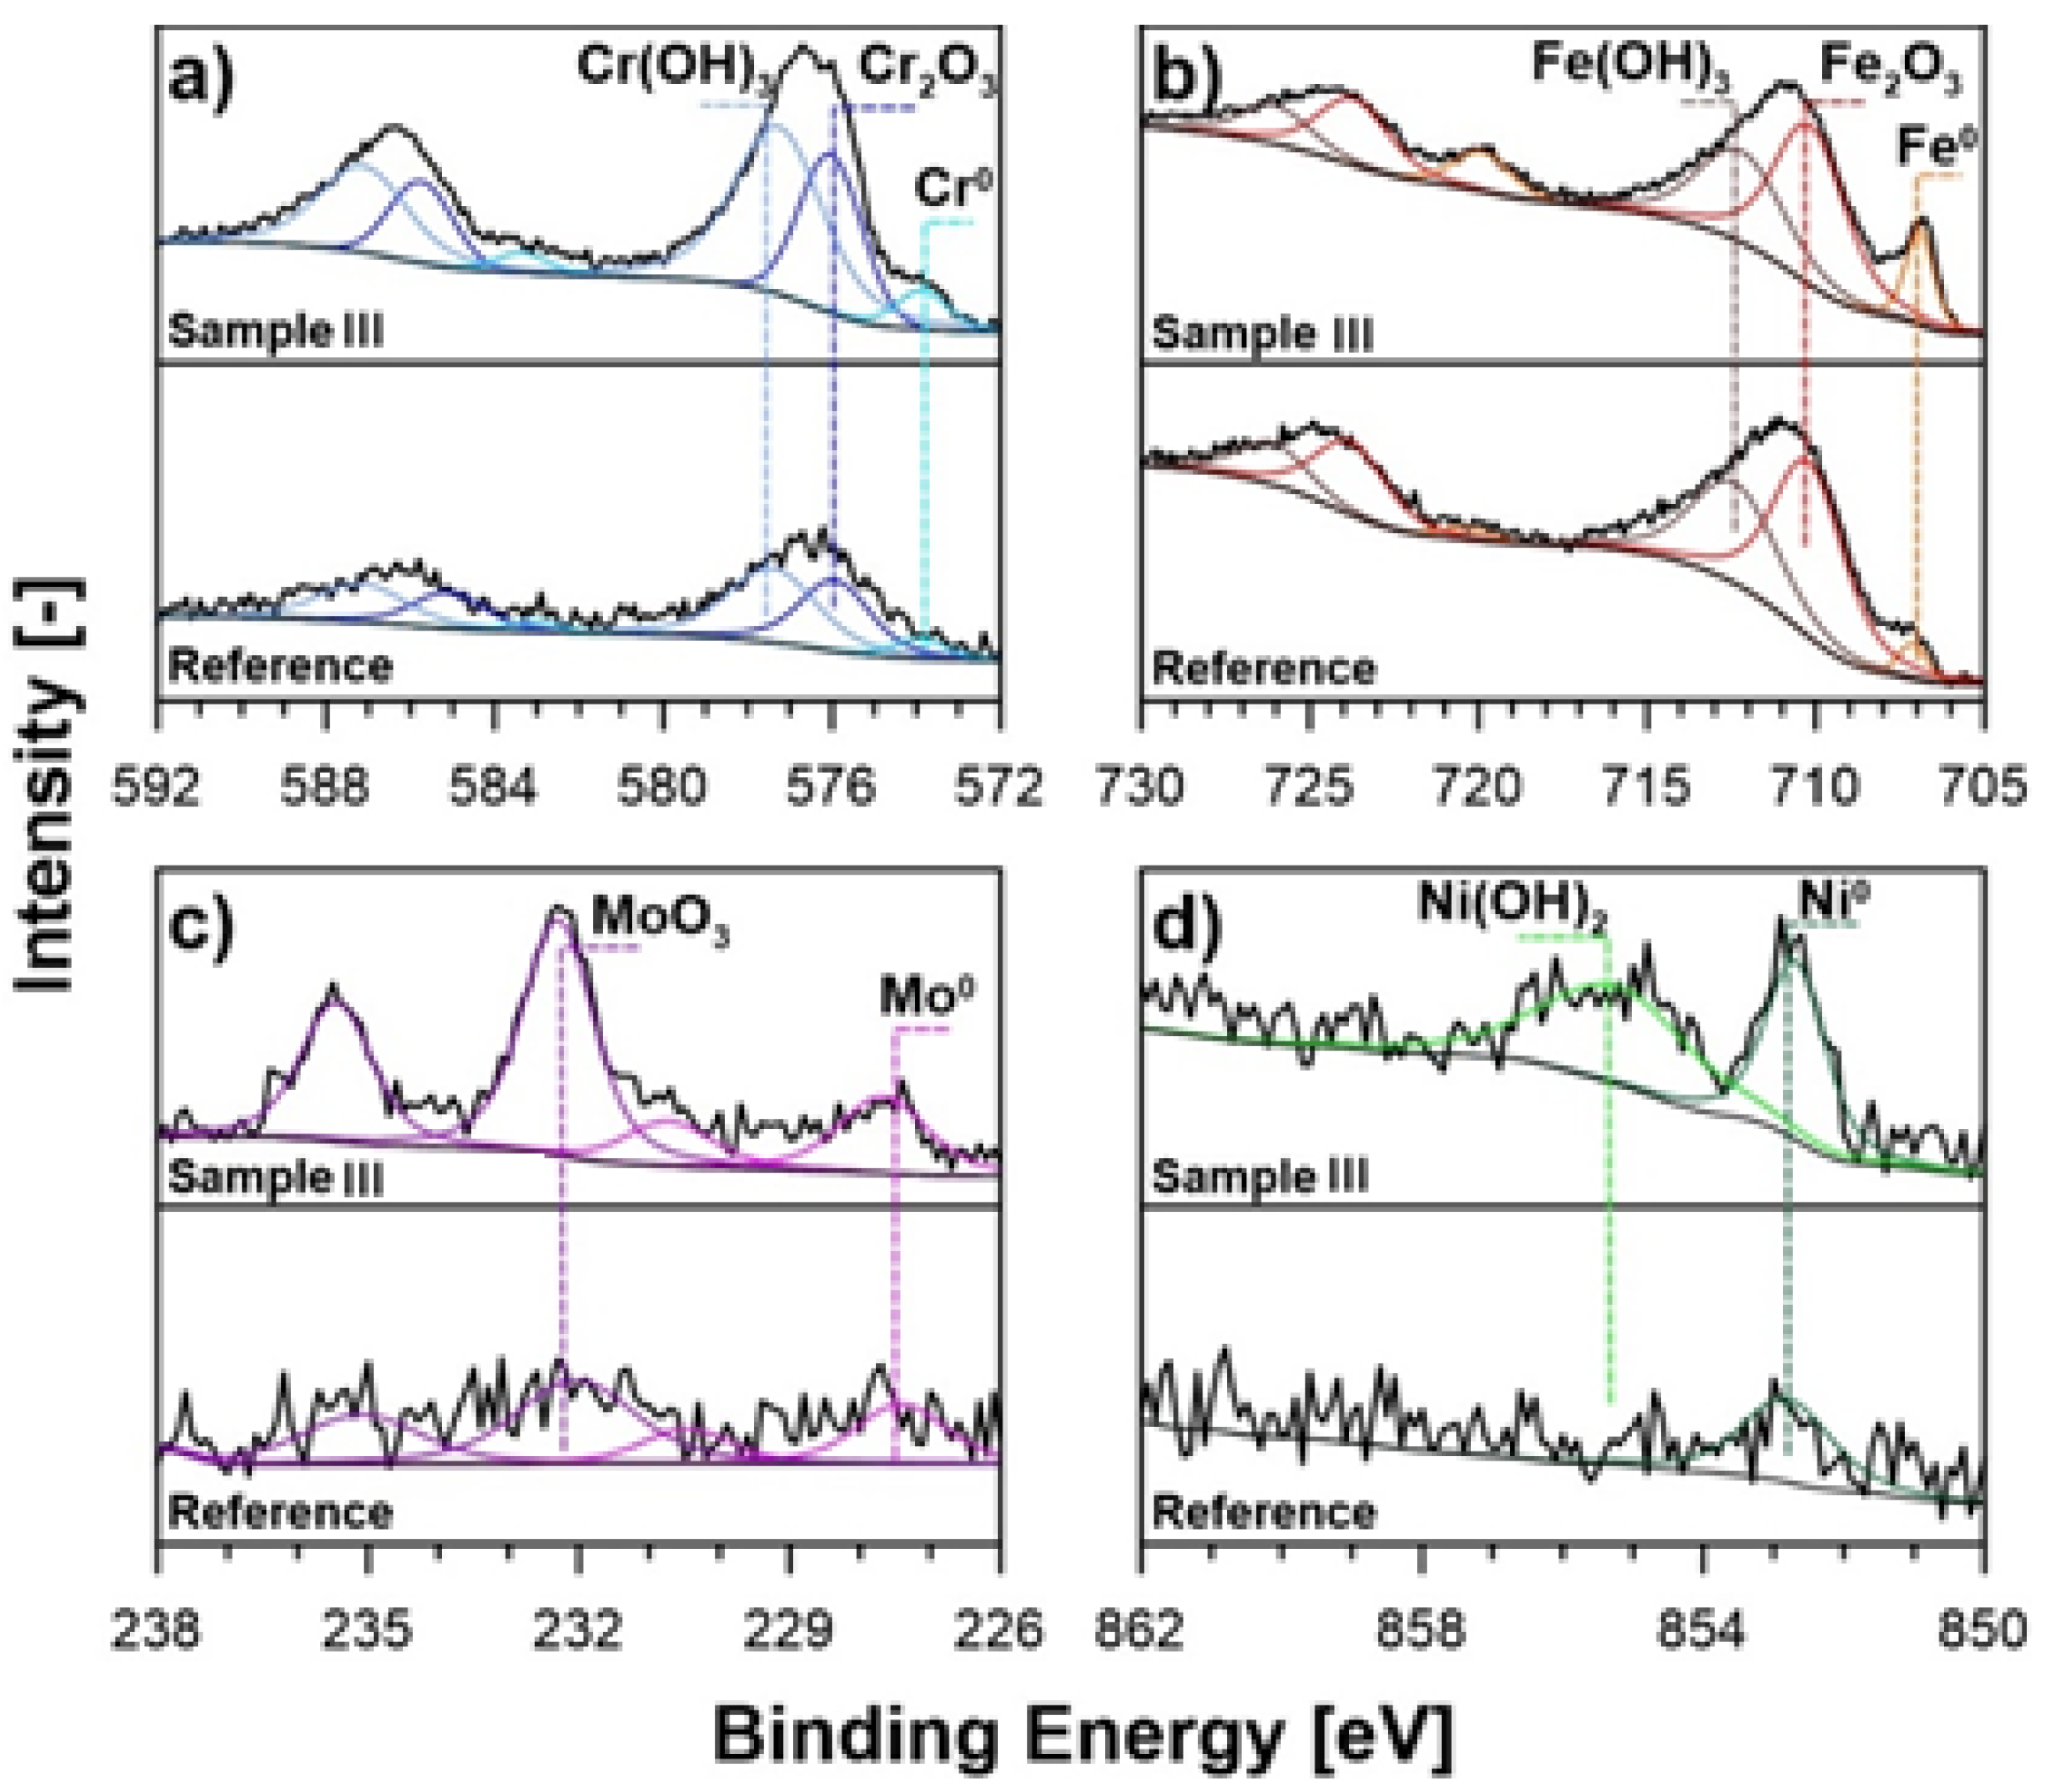
| Chemical State | Fe 2p3/2 | Cr 2p3/2 | Mo 3d7/2 | Ni 2p3/2 | ||||||
|---|---|---|---|---|---|---|---|---|---|---|
| Fe0 | Fe2O3 | Fe(OH)3 | Cr0 | Cr2O3 | Cr(OH)3 | Mo0 | MoO3 | Ni0 | Ni(OH)2 | |
| BE [eV] | 707.0 | 710.3 | 712.3 | 573.9 | 576.0 | 577.3 | 227.7 | 232.3 | 852.8 | 855.4 |
| Reference | 2.9 | 39.2 | 27.1 | 2.2 | 10.5 | 13.8 | 0.8 | 1.4 | 2.1 | 0.0 |
| Sample I | 6.0 | 27.2 | 19.1 | 3.5 | 16.1 | 17.7 | 1.4 | 3.3 | 2.3 | 3.4 |
| Sample II | 5.6 | 29.2 | 17.5 | 2.3 | 14.8 | 19.8 | 1.3 | 3.7 | 2.1 | 3.7 |
| Sample III | 5.9 | 26.1 | 17.8 | 3.1 | 12.9 | 22.6 | 1.9 | 4.6 | 2.2 | 2.9 |
| Sample | Max. Depth (nm) | Plastic Depth (nm) | Hardness (GPa) | Young’s Modulus (GPa) |
|---|---|---|---|---|
| Reference | 214 ± 15 | 198 ± 4 | 2.89 ± 0.05 | 43.48 ± 0.23 |
| I | 83 ± 31 | 79 ± 3 | 2.26 ± 0.16 | 16.90 ± 7.30 |
| II | 115 ± 30 | 107 ± 7 | 1.77 ± 0.21 | 15.75 ± 5.09 |
| III | 131 ± 22 | 127 ± 2 | 0.92 ±0.42 | 13.10 ± 4.63 |
| Sample | Average Contact Angle [°] |
|---|---|
| Reference | 81.93 ± 2.60 |
| I | 76.74 ± 3.43 |
| II | 63.41 ± 5.57 |
| III | 56.40 ± 3.32 |
| RS [Ωcm2] | Q [µFsn−1cm−2] | α [-] | RP [MΩcm2] | Prot.eff [%] | |
|---|---|---|---|---|---|
| Reference | 327 | 24.8 | 0.76 | 0.5 | -- |
| Sample I | 341 | 33.2 | 0.83 | 23.2 | 97.9 |
| Sample II | 345 | 23.3 | 0.88 | 52.5 | 99.1 |
| Sample III | 352 | 20.8 | 0.90 | 34.4 | 98.6 |
Publisher’s Note: MDPI stays neutral with regard to jurisdictional claims in published maps and institutional affiliations. |
© 2022 by the authors. Licensee MDPI, Basel, Switzerland. This article is an open access article distributed under the terms and conditions of the Creative Commons Attribution (CC BY) license (https://creativecommons.org/licenses/by/4.0/).
Share and Cite
Ossowska, A.; Ryl, J.; Sternicki, T. Production and Properties of the Porous Layer Obtained by the Electrochemical Method on the Surface of Austenitic Steel. Materials 2022, 15, 949. https://doi.org/10.3390/ma15030949
Ossowska A, Ryl J, Sternicki T. Production and Properties of the Porous Layer Obtained by the Electrochemical Method on the Surface of Austenitic Steel. Materials. 2022; 15(3):949. https://doi.org/10.3390/ma15030949
Chicago/Turabian StyleOssowska, Agnieszka, Jacek Ryl, and Tomasz Sternicki. 2022. "Production and Properties of the Porous Layer Obtained by the Electrochemical Method on the Surface of Austenitic Steel" Materials 15, no. 3: 949. https://doi.org/10.3390/ma15030949
APA StyleOssowska, A., Ryl, J., & Sternicki, T. (2022). Production and Properties of the Porous Layer Obtained by the Electrochemical Method on the Surface of Austenitic Steel. Materials, 15(3), 949. https://doi.org/10.3390/ma15030949