Article

Study of Cutting Power and Power Efficiency during Straight-Tooth Cylindrical Milling Process of Particle Boards

1
Co-Innovation Center of Efficient Processing and Utilization of Forest Resources, Nanjing Forestry University, Nanjing 210037, China
2
Anhui Product Quality Supervision & Inspection Research Institute, Hefei 230051, China
3
Department of Wood and Forest Sciences, Laval University, Quebec City, QC G1V 0A6, Canada
*
Author to whom correspondence should be addressed.
Materials 2022, 15(3), 879; https://doi.org/10.3390/ma15030879
Submission received: 7 January 2022 / Revised: 17 January 2022 / Accepted: 22 January 2022 / Published: 24 January 2022

Abstract

:
The cutting power consumption of milling has direct influence on the economic benefits of manufacturing particle boards. The influence of the milling parameters on the cutting power were investigated in this study. Experiments and data analyses were conducted based on the response surface methodology. The results show that the input parameters had significant effects on the cutting power. The high rake angle reduced the cutting force. Thus, the cutting power decreased with the increase in the rake angle and the cutting energy consumption was also reduced. The cutting power increased with the rotation speed of the main shaft and the depth of milling induced the impact resistance between the milling tool and particle board and the material removal rate. The p-values of the created models and input parameters were less than 0.05, which meant they were significant for cutting power and power efficiency. The depth of milling was the most important factor, followed by the rotation speed of the main shaft and then the rake angle. Due to the high values of R2 of 0.9926 and 0.9946, the quadratic models were chosen for creating the relationship between the input parameters and response parameters. The predicted values of cutting power and power efficiency were close to the actual values, which meant the models could perform good predictions. To minimize the cutting power and maximize the power efficiency for the particle board, the optimized parameters obtained via the response surface methodology were 2°, 6991.7 rpm, 1.36 mm for rake angle, rotation speed of the main shaft and depth of milling, respectively. The model further predicted that the optimized parameters combination would achieve cutting power and power efficiency values of 52.4 W and 11.9%, respectively, with the desirability of 0.732. In this study, the influence of the input parameters on the cutting power and power efficiency are revealed and the created models were useful for selecting the milling parameters for particle boards, to reduce the cutting power.

1. Introduction

Under the environmental protection goal of carbon neutrality and carbon peak, sustainable manufacturing has become the new development direction of the manufacturing industry. This has led to a focus on recycling and the conservation of natural resources and energy in furniture manufacturing processes [1,2,3]. Particle boards (PBs) as a kind of wood-based panel, are widely applied for the manufacturing of custom furniture in China [4,5,6] and milling occupies a large proportion of that manufacturing process [7,8]. Among the previous studies of material processing, most of them focused on revealing the influences of cutting parameters, cutting tools geometry and materials properties on the cutting tools’ conditions, cutting force, cutting efficiency and cutting qualities [9,10,11]. For PB processing, Boucher et al. studied the influences of the helix angle and density variation on the cutting force of PBs. The helix angle had positive influence on the decrease in cutting force and improvement of tool life [12]. In the peripheral up-milling of PBs, the higher the cutting speed used, the higher the principal cutting forces [13]. In addition, the properties of PBs also have influence on the cutting force. Bouzakis and Koutoupas found that the specific cutting force increased with the increase in the particle board’s mechanical strength critical stresses and the linear correlation between them was obvious [14].
The optimization of process parameters for reducing the final production costs is also one of the biggest challenges in the machining process. Hence, revealing the effects of processing parameters on the cutting power and power efficiency and achieving the optimized parameter combination would be meaningful for the furniture manufacturing industry [15,16]. At present, many scholars have focused on the influence of technical parameters on power consumption, modelling techniques for predicting and optimizing energy consumption, etc. [17,18,19]. From the previous research studies, the milling energy consumption and efficiency of machining processes for heat-treated wood has been found to be less than that for un-treated wood due to chemical degradation and reduced wood density. Additionally, the power consumption decreased as the temperature of heat treatment increased [20,21]. Normally, the specific cutting energy increases with the wood density, but decreases with the increase in moisture content [22]. In addition to the milling process, wood sawing power consumption has also been of interest. The influence of cutting motion parameters and saw blade parameters on power consumption were investigated in the past. Power consumption has been found to vary with different saw blades and increase under higher feed rates. With the increase in the feed speed, not only the sawing power increased, but also the waviness increased [23,24,25].
In addition to revealing the influencing rule of processing parameters on energy consumption, it is also meaningful to find the trade-offs between productivity, cut quality and power consumption. Different modelling techniques (such as artificial neural networks (ANNs), deep learning (DL), machine learning (ML), etc.) have been studied to monitor tool conditions, reduce cutting power consumption and increase energetic efficiency [26,27,28,29,30,31]. Tiryaki et al. employed artificial neural networks to minimize the surface roughness and power consumption of wood abrasive machining processes. Their results showed that the created models could give accurate prediction of power consumption and surface roughness as a result of low values of mean absolute percentage error [32]. De Melo et al. used the robust optimization technique to optimize the energy efficiency of the Pinus taeda wood planning process. Their results showed that the cutting motor rotation, feed motor rotation and cutting depth had significant influence on the specific cutting energy. They also found that the optimal parameter combination for lower power consumption was determined by the mean square error (MSE) [33]. The ANN modeling method is also a common modeling technique to predict the cutting power. During the wood planning process, the mean absolute percentage error values between the actual and predicted values for the training data set and testing data set were very small. The R2 values were close to the value of 1, which also meant that the ANN models could effectively be used in wood machining optimization to reduce the cutting power [34].
However, there is no published work focusing on revealing the effects of the milling parameters on the cutting power and power efficiency during the PB milling process. Moreover, the explicitly quantifying relationships between input parameters and response parameters have not been revealed either. In this paper, the cutting power and power efficiency during a straight-tooth cylindrical milling process of PBs were studied. The rake angle of the milling cutter, the rotation speed of the main shaft and the depth of milling were selected as input parameters. The response surface methodology (RSM) was applied to investigate the effects of the input parameters on the cutting power and power efficiency and establish the relationship between the input parameters and response parameters. These results will be beneficial in revealing the change tendency of the response parameters and guiding the selection of the input parameters to reduce the spindle power during the PB milling process.

2. Materials and Methods

2.1. Materials

Samples with the size of 150 mm × 80 mm × 18 mm (length × width × thickness) were cut randomly from commercial PB products. According to the Chinese standard GB/T 17657-2013 [35], the tests for modulus of rupture and modulus of elasticity of the supplied PBs were repeated five times and their mean values were 17.3 MPa and 1622 MPa, respectively. A density of 695.3 kg/m3 and a moisture content of 10.2 ± 2% were also documented.

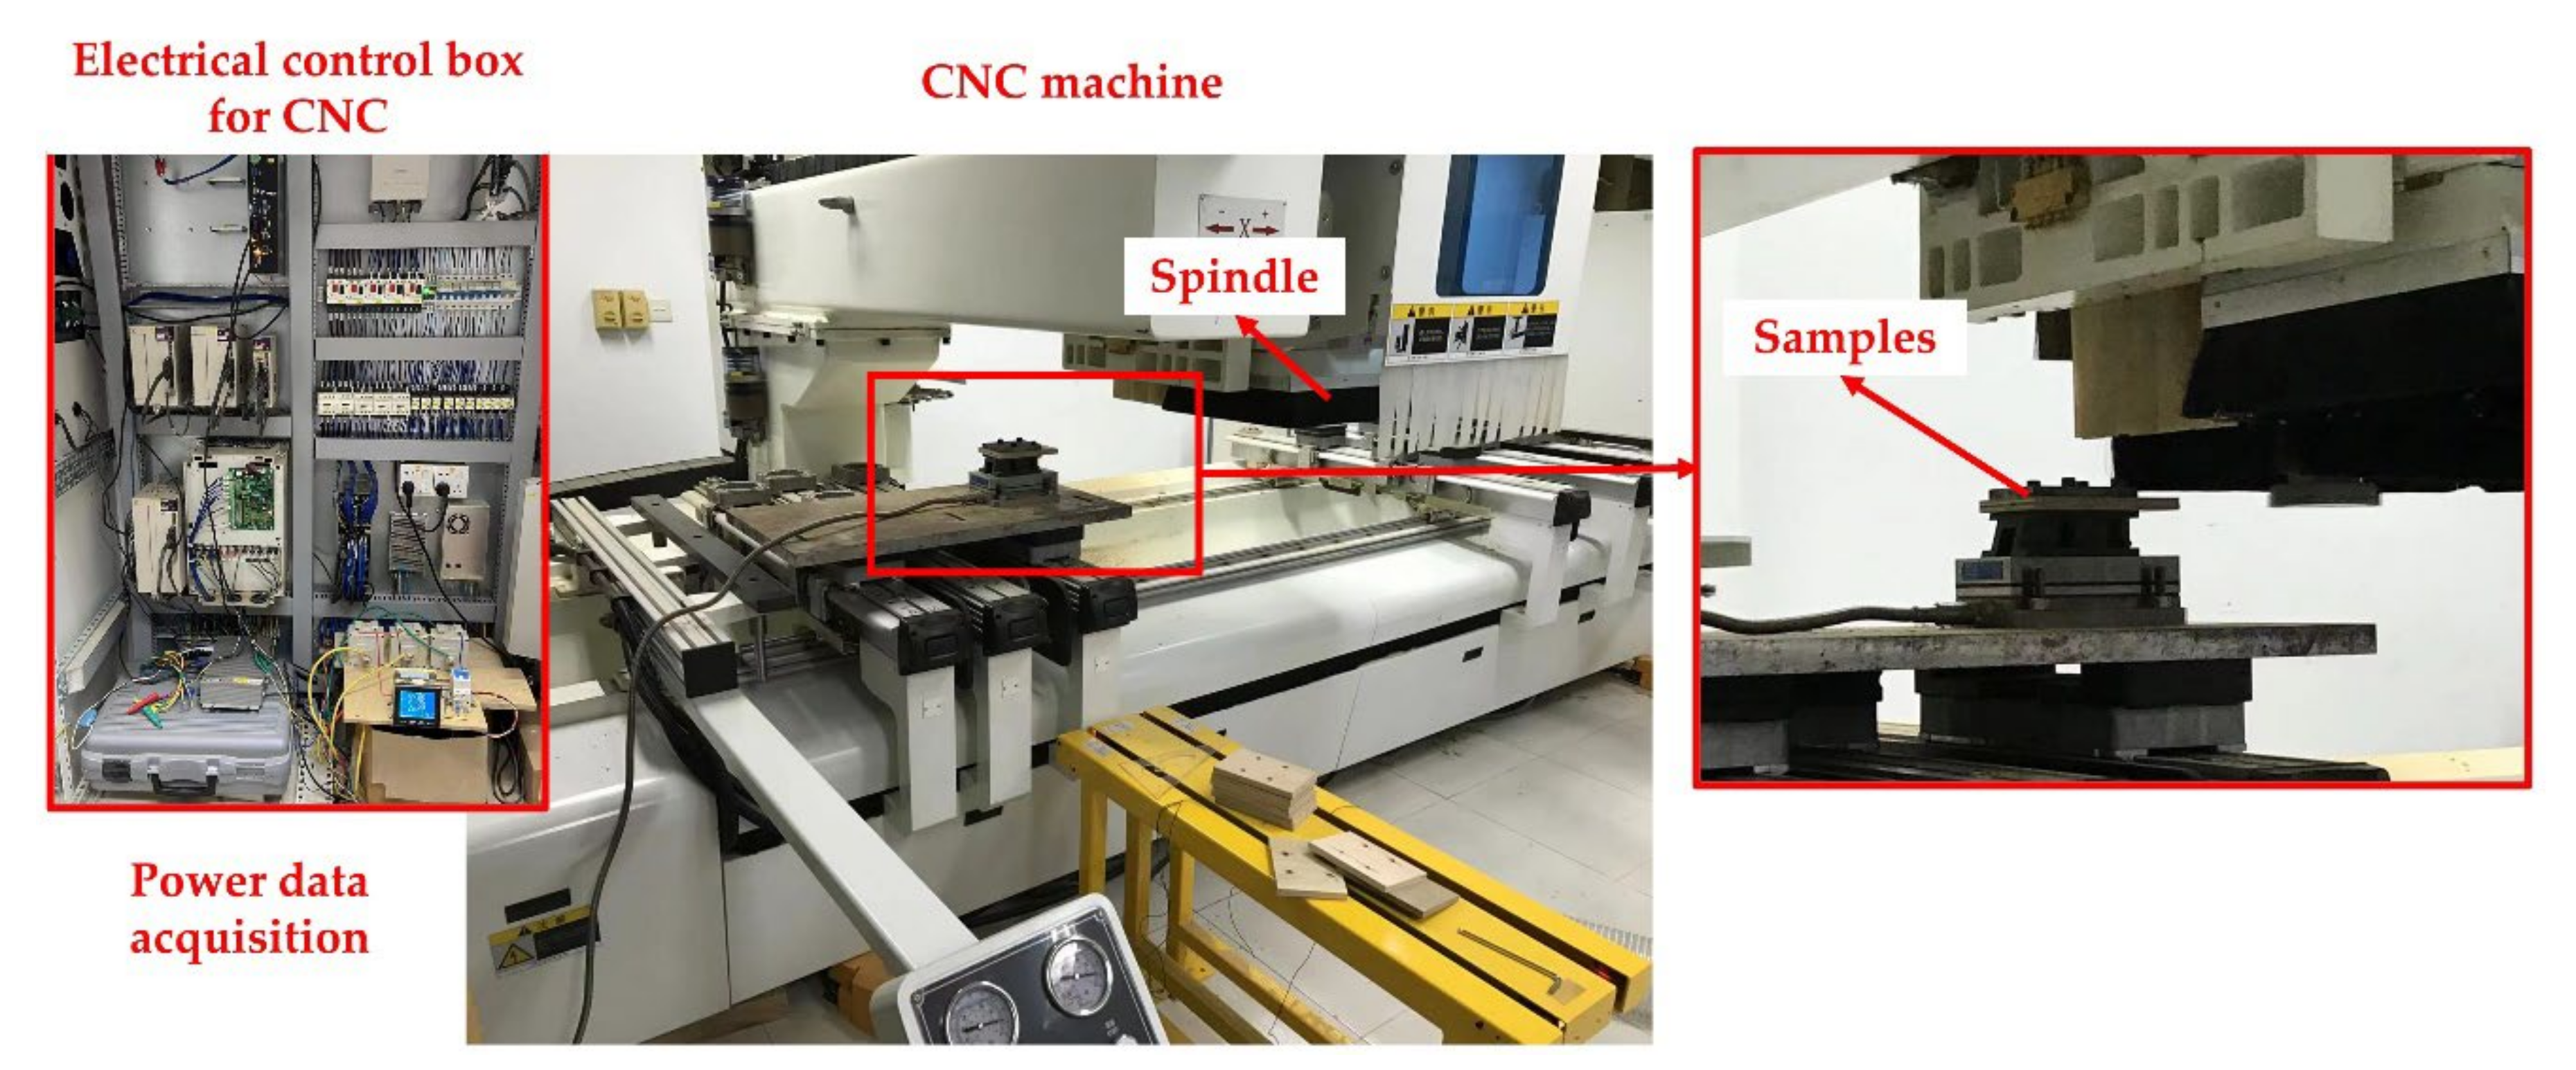
2.2. Experimental Setup and Cutting Tools

A computerized numerical control (CNC) machining center was applied to carry out the milling experiments. The spindle power of the CNC machining center was measured by a three-phase power analyzer (AN87300, Ainuo Co., Ltd., Shandong, China). In this study, all the samples were cut by peripheral milling with a straight-tooth cylindrical milling tool. The milling tool had three inserted knives, which were made of cemented carbide. The diameter and wedge angle of the selected milling tool were held constant at 180 mm and 45°, respectively. The schematic diagram of the experimental setup is shown in Figure 1.

2.3. Methods

The RSM, with its preponderance of convenient modeling and strong ability to deal with multi-objective optimization, was applied for the purpose of developing, improving and optimizing the processes [36,37,38]. The prediction and optimization capabilities of the RSM are highly appreciated [39]. In this paper, the Box–Behnken design (BBD) of the RSM was selected to arrange the experiments and analyze the experimental data. The details of the input parameters and their ranges were determined by the actual production and reference values in the literature, which are shown in Table 1. The feed speed and cutting length were fixed for all tests and were held constant at 5 m/min and 150 mm, respectively. Each group of experiment was repeated five times and the mean values were used for data analysis and modeling.
Quadratic, linear and 2 FI are frequently employed to model the relationship between input parameters and response parameters. The quadratic model is shown in Equation (1).
Y = b 0 + i = 1 k b i X i   + i , j k b ij X i X j   + i = 1 k b ii X i 2
where Y represents the response parameters; b0 represents a constant coefficient; and bi, bii and bij represent coefficients of linear, quadratic and interacting terms, respectively.
The response parameters in this study included cutting power and power efficiency, which are defined and shown in Equations (2) and (3). In Figure 2, the schematic diagram of dynamic power change at different cutting stages in one set of experiments is shown.
P c   =   P t     P 0
  η = P c P t = P c P c + P 0 = 1 1 + P 0 P c
where Pc is the cutting power (W), η is power efficiency, Pt is the total power during the PB milling process (W) and P0 is the power during the no-load operation stage of the CNC machine (W).

3. Results and Discussion

All the experiments were conducted by the “Run” order shown in Table 2 to avoid the effects of the test sequence on the results’ accuracy. The cutting power and power efficiency were calculated by Equations (2) and (3) and their results are also recorded in Table 2.

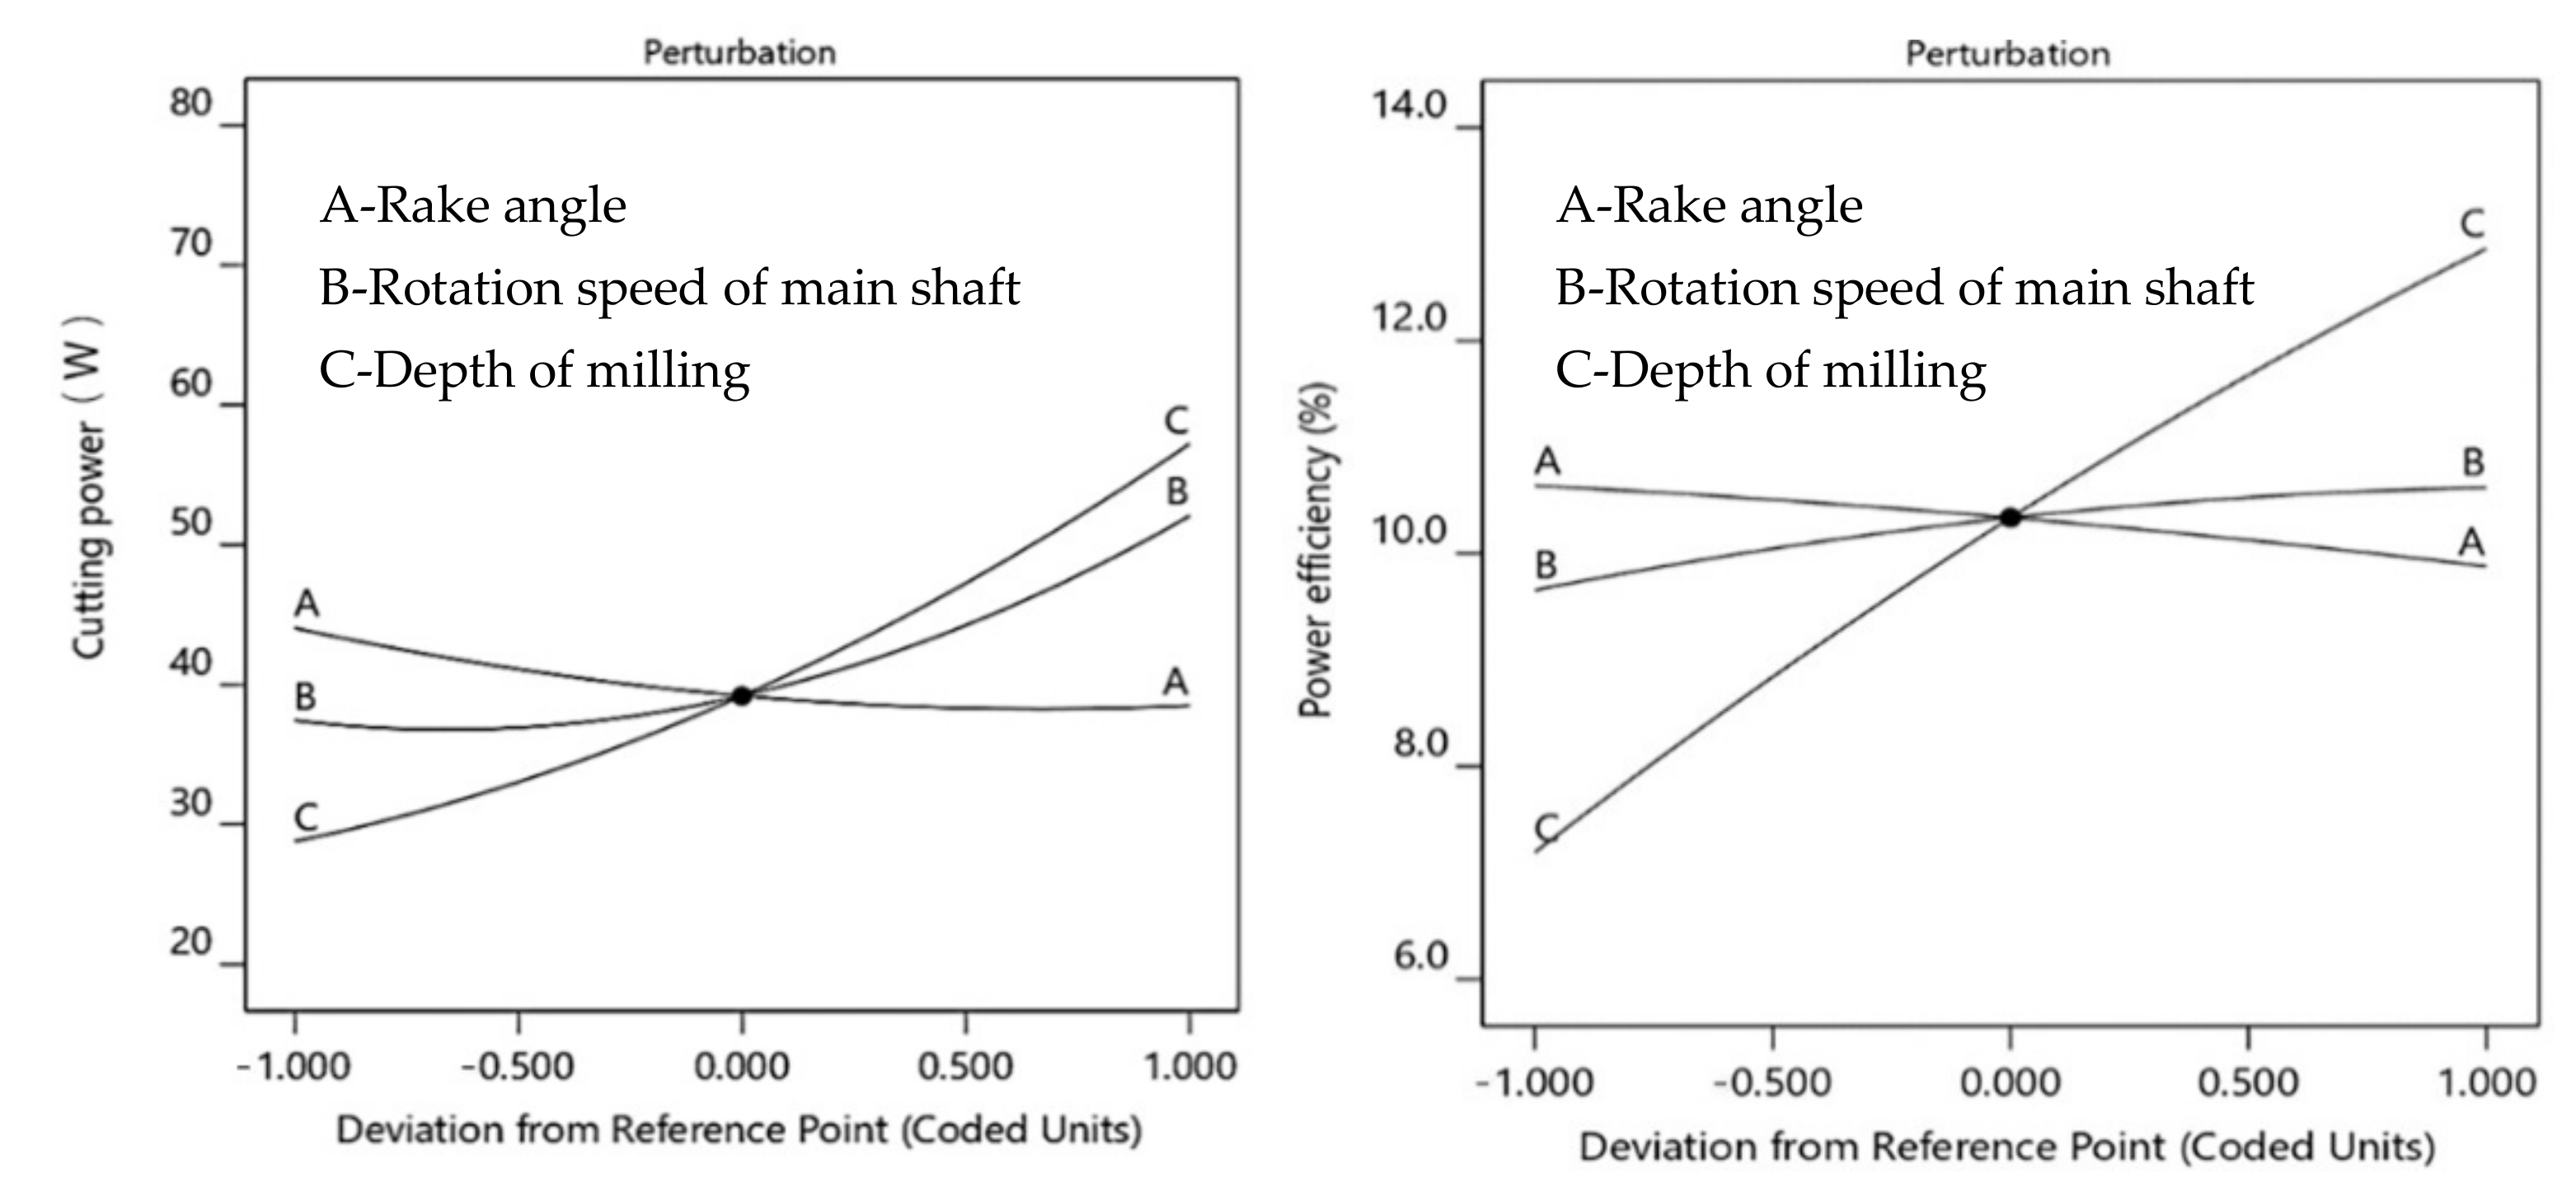
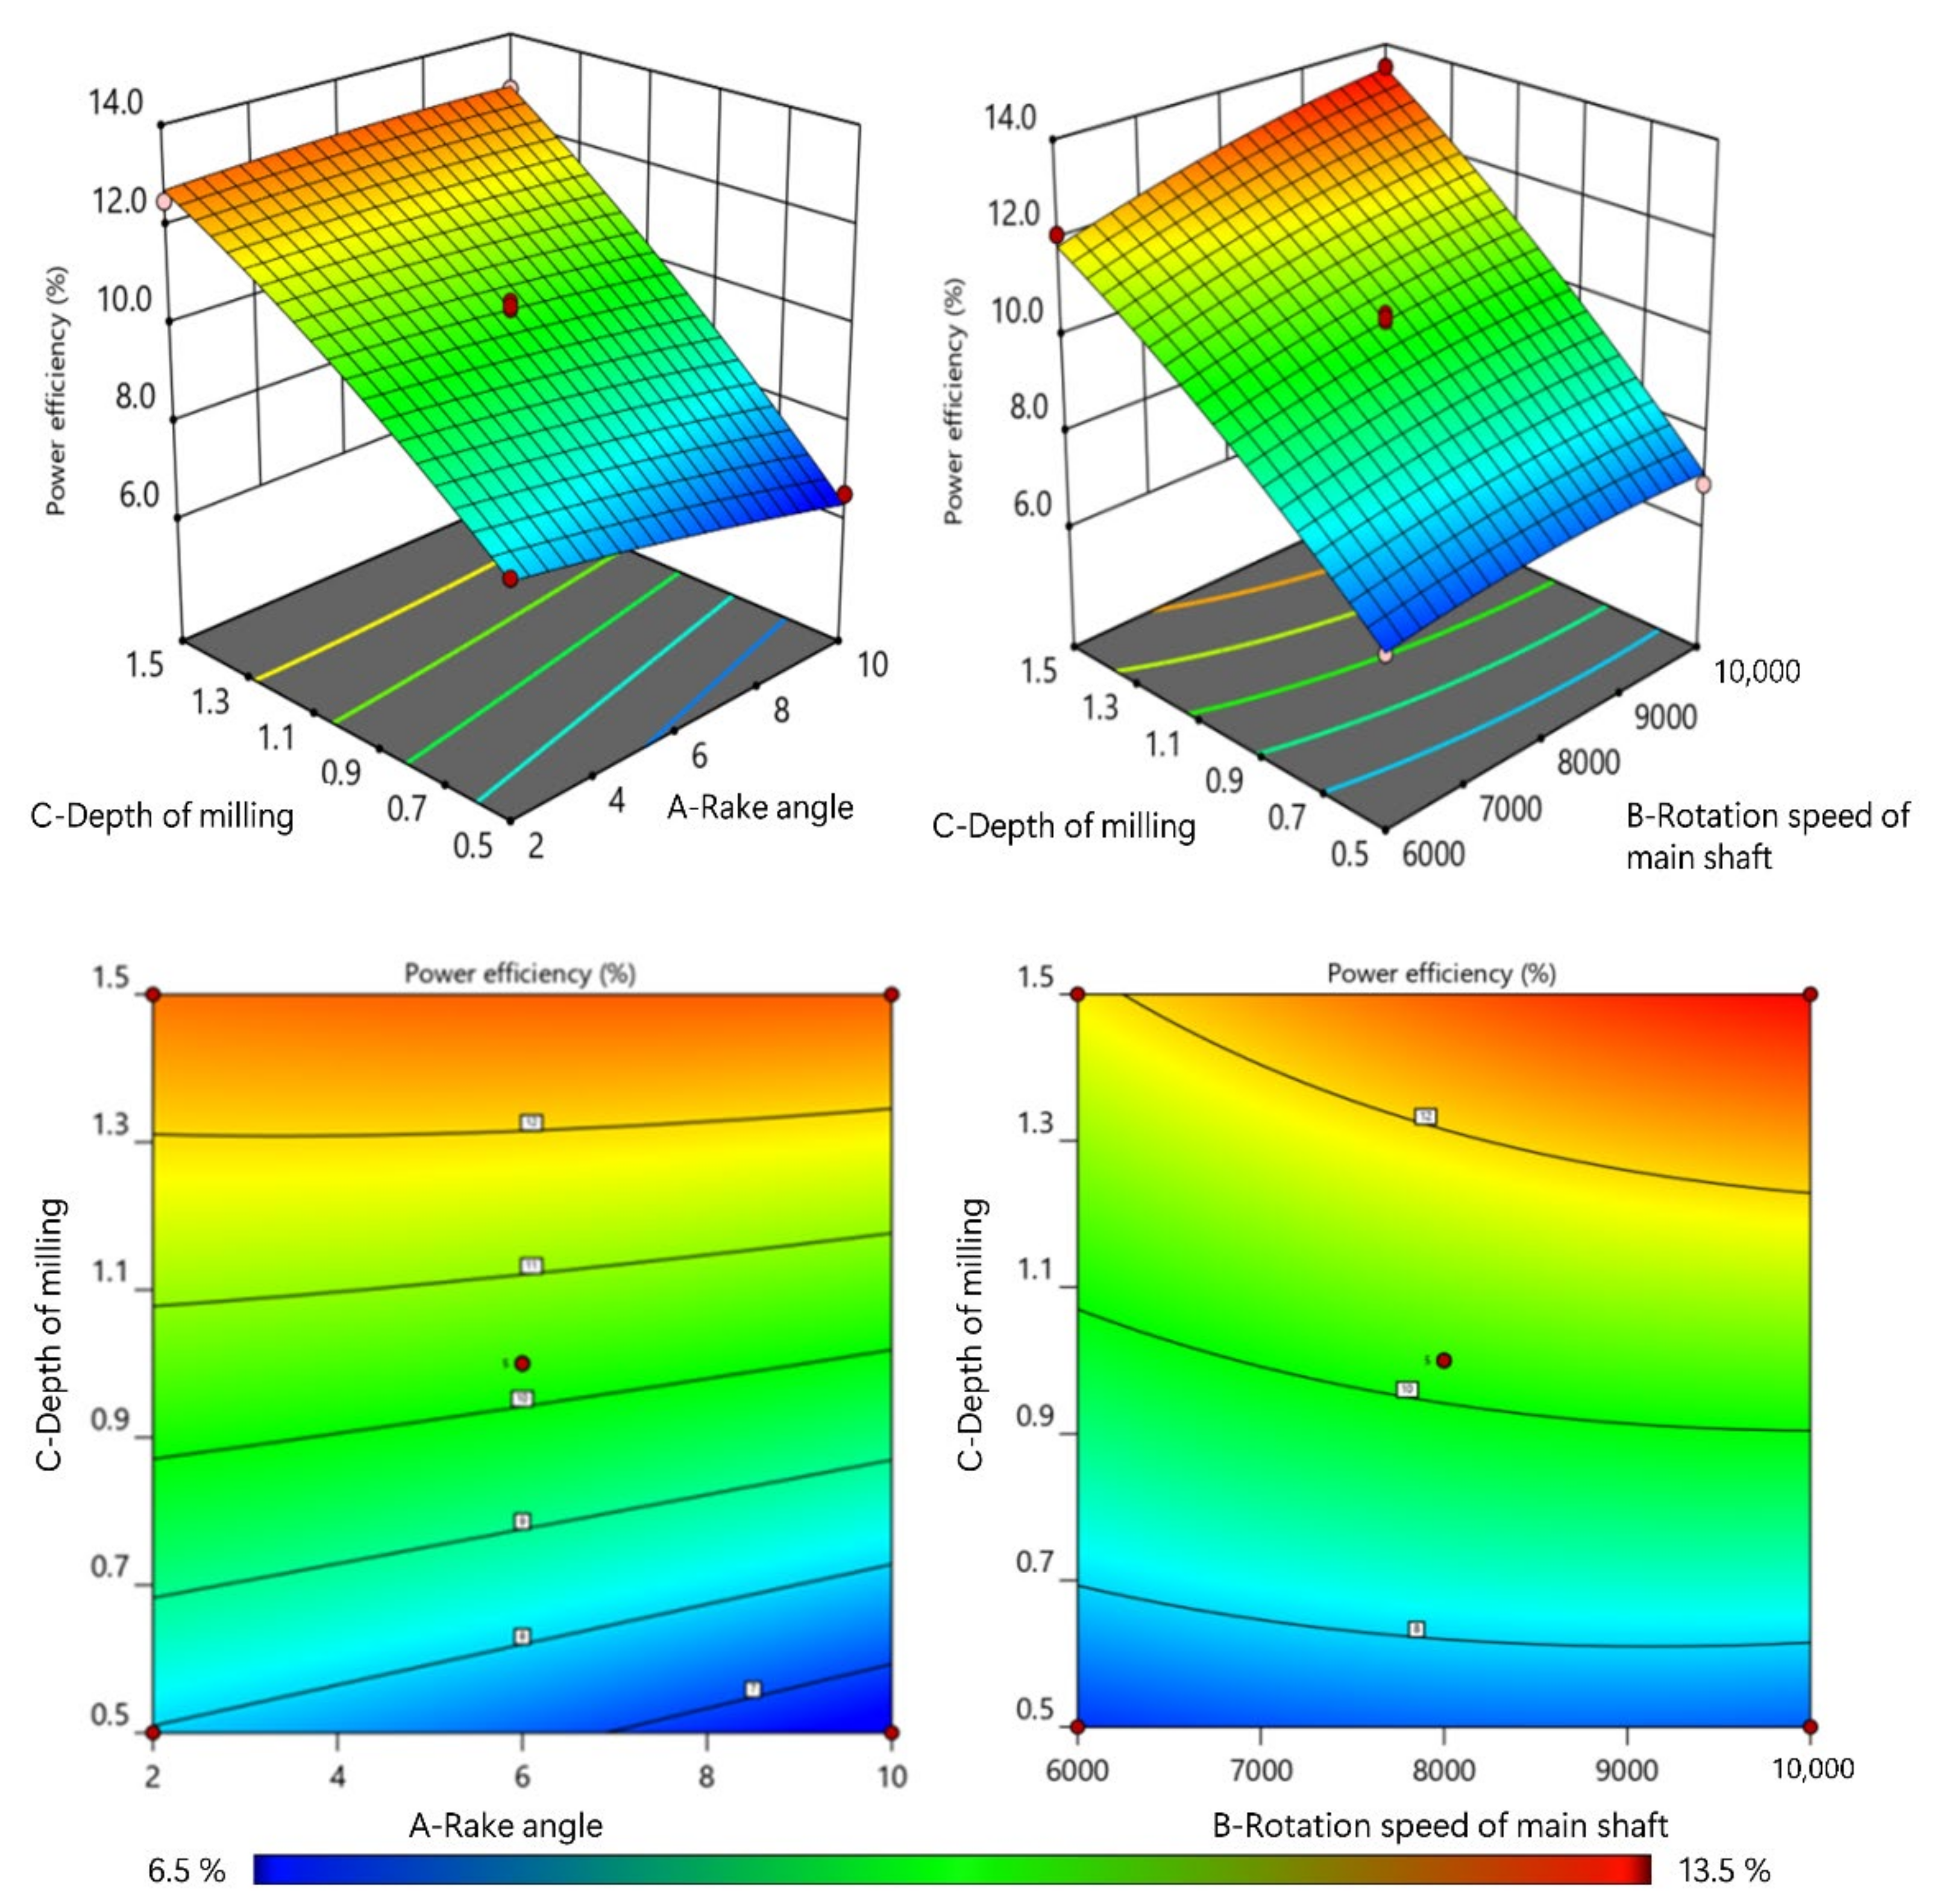
3.1. Influence of Input Parameters on Pc and η

To investigate the variation in power consumption during the PB milling process, the influences of the input parameters on Pc and η were analyzed. Figure 3 shows that Pc increased with the increase in the rotation speed of the main shaft and depth of milling. However, it decreased with the increase in the rake angle. A decrease in the cutting force has been observed with the increase in the rake angle [40,41,42], resulting in lower cutting power required [43]. With the increase in the depth of milling, the material removal rate increased, which consumed more energy.
PBs, which are made from a mixture of adhesive and shavings, are a heterogeneous material. The impact force between the milling tool and PB material increases as the rotation speed increases, which also causes an increase in the cutting power. From the plot of interaction impact trend (as shown in Figure 4), it is easy to see that a higher cutting power was required when milling with the combination of a higher depth of milling, a higher rotation speed of the main shaft and a lower rake angle.
The power efficiency was found to increase with the increase in the depth of milling and rotation speed of the main shaft. However, the value of η decreased with the increase in the rake angle due to reduced cutting force, resulting in reduced energy consumption. The higher values of η meant that a higher ratio of energy was consumed in the removal of material. In the Equation (3), P0 remains constant when the cutting motion parameters are fixed, while the value of η increases with the increase in Pc. This explains why the value of η increases with the increase in the depth of milling, but decreases with the increase in the rake angle. As shown in Figure 5, the highest value of η was achieved by the combination of the highest rotation speed of the main shaft, the highest depth of milling and the lowest rake angle. When the rotation speed of main shaft increased, both Pc and P0 increased. Hence, the η change was not evident.

3.2. Analysis of Variance

The analysis of variance (ANOVA) is a widely used technique to investigate the significance of input parameters and evaluate a models’ adequacy. In ANOVA tables, the p-value indicates the significance of a factor to a confidence level of 95% and the higher F-value indicates a relatively greater importance of that factor. In Table 3 and Table 4, the p-values of the quadratic models were less than 0.0001, indicating that these two models were extremely significant. For the same reason, all of the input parameters exhibited a significant influence on P c and η and many of the interaction terms also had significant influence. For the RSM quadratic models for P c and η , the F-value analysis revealed the depth of milling as the most important factor, followed by the rotation speed of the main shaft and then the rake angle. The highest percentage contribution was exerted by the depth of milling, which also meant the depth of milling was the most important factor [39].

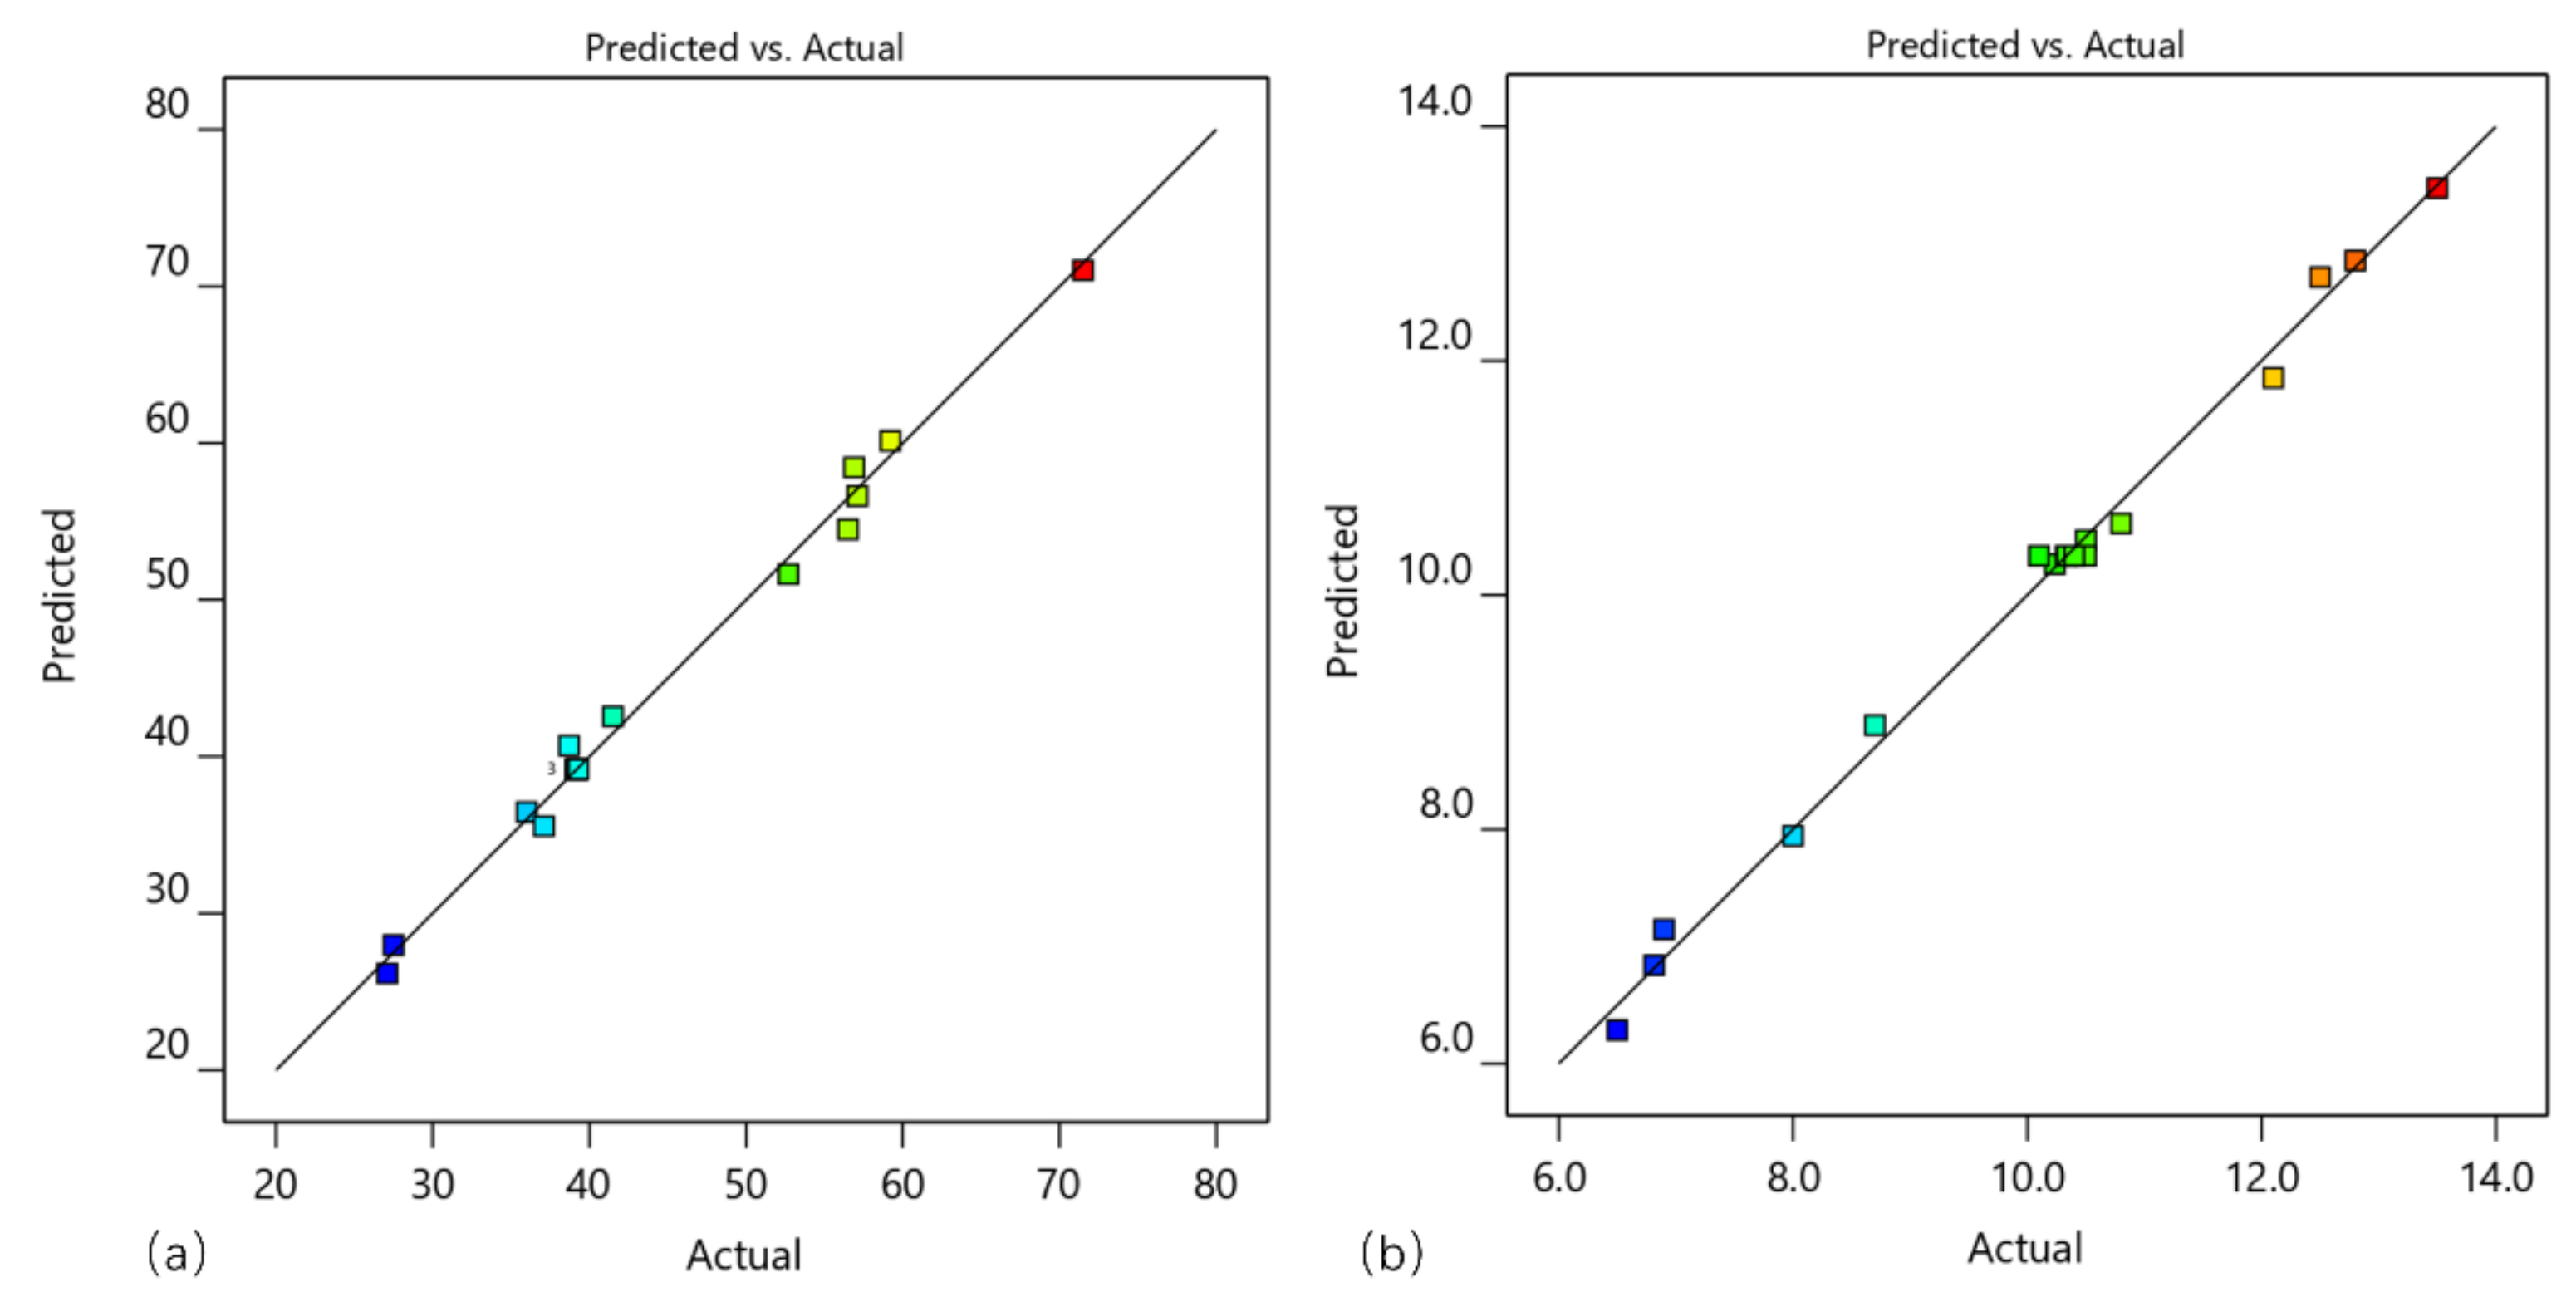
3.3. Regression Models

To create the relationship between the input parameters and response parameters, quadratic models were selected over others due to their higher R2 values (Table 5). These values reflected that the models were adequate to predict the cutting power and power efficiency, which is demonstrated by the plot of “predicted vs. actual” (Figure 6). The detailed models for Pc and η in terms of coded factors are shown in Equations (4) and (5).
P c = 39.20 2.77 × A + 7.31 × B + 12.41 × C + 0.275 × A × B + 1.92 × A × C + 0.95 × B × C + 2.07 × A 2 + 5.55 × B 2 + 3.80 × C 2
η   =   10.33 0.3793 × A + 0.4813 × B + 2.84 × C + 0.3086 × A × B + 0.45 × A × C + 0.3288 × B × C 0.0771 × A 2 0.1983 × B 2 0.3069 × C 2

3.4. Optimization of Milling Parameters for PBs

To achieve the purposed energy savings and improved power efficiency during PB milling processes, the lowest P c and highest η would be expected. Even the highest rake angle would be beneficial for decreasing cutting power, as too large of a rake angle would cause the milling tool to rapidly wear, which would have a negative impact on its working life. A higher depth of milling improves the material remove rate, which directly affects milling efficiency. Hence, the detailed conditions of optimization were confirmed and are shown in Table 6. The optimized parameters for P c and η were 2°, 6991.7 rpm, 1.36 mm for rake angle, rotation speed of the main shaft and depth of milling, respectively. The model further predicted that the optimized parameters combination would achieve P c and η values of 52.4 W and 11.9%, respectively, with the desirability of 0.732. To verify the accuracy of the optimization, a validation test was performed with the parameter combination of 2°, 6992 rpm, 1.4 mm for rake angle, rotation speed of the main shaft and depth of milling, respectively. In the validation test, the results of P c and η were 53.2 W and 13.1 %, respectively.

4. Conclusions

Power consumption is a key index in material processing which has a direct influence on the economic and environmental benefits of manufacturing processes. The selected input parameters were shown to have significant influences on the response parameters of Pc and η. Quadratic models were developed to model the relationship between input parameters and response parameters. Detailed conclusions are as follows:
(1)
The value of Pc increased with the increase in the rotation speed of the main shaft and the depth of milling, but decreased as the rake angle increased. The influence of the input parameters on η was similar to that on Pc. The depth of milling was the most important factor for the cutting power and power efficiency during PB milling, followed by the rotation speed of the main shaft and then the rake angle.
(2)
The values of the regression coefficient, for the Pc and η models, respectively, were 0.9926 and 0.9946 and these values reflected that the quadratic models accurately predicted the values of Pc and η.
(3)
Higher material removal rates consumed more cutting energy, which had a positive effect on improving power efficiency.
(4)
In this study, the optimized parameters for Pc and η were 2°, 6992 rpm, 1.4 mm for rake angle, rotation speed of the main shaft and depth of milling, respectively.

Author Contributions

Conceptualization, R.L. and W.X.; methodology, Q.Y.; software, J.L.; validation, R.L. and X.W.; formal analysis, R.L.; investigation, Q.Y.; resources, W.X.; data curation, Q.Y.; writing—original draft preparation, R.L.; writing—review and editing, X.W.; visualization, Q.Y.; supervision, X.W.; funding acquisition, R.L. All authors have read and agreed to the published version of the manuscript.

Funding

Natural Science Foundation of the Jiangsu Higher Education Institutions of China (18KJB220008).

Institutional Review Board Statement

Not applicable.

Informed Consent Statement

Not applicable.

Data Availability Statement

Data are contained within the article.

Acknowledgments

This research study was funded by the Natural Science Foundation of the Jiangsu Higher Education Institutions of China (18KJB220008) and the project from International Cooperation Joint Laboratory for Production, Education, Research and Application of Ecological Health Care on Home Furnishing.

Conflicts of Interest

On behalf of all authors, the corresponding author states that there is no conflict of interest.

List of Symbols

PBParticle board
CNCComputerized numerical control
ANNArtificial neural network
DLDeep learning
MLMachine learning
MSEMean square error
ANOVAAnalysis of variance
RSMResponse surface methodology
BBDBox–Behnken design
ηPower efficiency
PtTotal power during PB milling process (W)
P0Power during no-load operation stage of CNC machine (W)

References

  1. Guo, X.; Wang, J.; Buck, D.; Zhu, Z.; Guo, Y. Machinability of wood fiber/polyethylene composite during orthogonal cutting. Wood Sci. Technol. 2021, 55, 521–534. [Google Scholar] [CrossRef]
  2. Dong, W.; Hu, J.; Tian, G.; Qiu, X.; Guo, X. Machine energy utilization rate during milling of PVC/calcium powder/wood fiber composites. J. For. Eng. 2021, 6, 107–112. [Google Scholar] [CrossRef]
  3. Wang, Y.; Wu, Y.; Yang, F.; Wang, J.; Zhou, J. A multilayer transparent wood prepared by laminating two kinds of tree species. J. Appl. Polym. Sci. 2022, 139, 51872. [Google Scholar] [CrossRef]
  4. Lu, J.; Jiang, P.; Chen, Z.; Li, L. Characteristic analysis of flame retardant particleboard using three methods of combustion performance evaluation. J. For. Eng. 2020, 5, 28–34. [Google Scholar] [CrossRef]
  5. Xiong, X.; Ma, Q.; Yuan, Y.; Wu, Z.; Zhang, M. Current situation and key manufacturing considerations of green furniture in China: A review. J. Clean. Prod. 2020, 267, 121957. [Google Scholar] [CrossRef]
  6. Yan, X.; Han, Y.; Yin, T. Coating Process Optimization and Self-Healing Performance Evaluation of Shellac Microcapsules Coated with Melamine/Rice Husk Powder. Appl. Sci. 2021, 11, 8373. [Google Scholar] [CrossRef]
  7. Sun, Q.; Zhou, X.; Weng, J.; Li, X.; Zhou, H. Numerical simulation and experiment validation for characteristics of gas-solid flow in chip discharging field with vertical milling on MDF. J. For. Eng. 2021, 6, 25–32. [Google Scholar]
  8. Yan, X.; Peng, W.; Qian, X. Effect of Water-Based Acrylic Acid Microcapsules on the Properties of Paint Film for Furniture Surface. Appl. Sci. 2021, 11, 7586. [Google Scholar] [CrossRef]
  9. Chuchala, D.; Dobrzynski, M.; Pimenov, D.Y.; Orlowski, K.A.; Krolczyk, G.; Giasin, K. Surface Roughness Evaluation in Thin EN AW-6086-T6 Alloy Plates after Face Milling Process with Different Strategies. Materials 2021, 14, 3036. [Google Scholar] [CrossRef]
  10. Pimenov, D.Y.; Guzeev, V.I.; Krolczyk, G.; Mia, M.; Wojciechowski, S. Modeling flatness deviation in face milling considering angular movement of the machine tool system components and tool flank wear. Precis. Eng. 2018, 54, 327–337. [Google Scholar] [CrossRef]
  11. Bustillo, A.; Pimenov, D.Y.; Mia, M.; Kapłonek, W. Machine-learning for automatic prediction of flatness deviation considering the wear of the face mill teeth. J. Intell. Manuf. 2021, 32, 895–912. [Google Scholar] [CrossRef]
  12. Boucher, J.; Meausoone, P.-J.; Martin, P.; Auchet, S.; Perrin, L. Influence of helix angle and density variation on the cutting force in wood-based products machining. J. Mater. Process. Technol. 2007, 189, 211–218. [Google Scholar] [CrossRef]
  13. Palubicki, B. Cutting Forces in Peripheral Up-Milling of Particleboard. Materials 2021, 14, 2208. [Google Scholar] [CrossRef]
  14. Bouzakis, K.D.; Koutoupas, G. Bending and indentation tests to determine chipboards’ mechanical strength critical stresses and their correlation to the specific cutting force in milling. Wood Sci. Technol. 2003, 37, 141–159. [Google Scholar] [CrossRef]
  15. Sahinoglu, A.; Ulas, E. An investigation of cutting parameters effect on sound level, surface roughness, and power consumption during machining of hardened AISI 4140. Mech. Ind. 2020, 21, 523. [Google Scholar] [CrossRef]
  16. Pimenov, D.Y.; Abbas, A.T.; Gupta, M.K.; Erdakov, I.N.; Soliman, M.S.; El Rayes, M.M. Investigations of surface quality and energy consumption associated with costs and material removal rate during face milling of AISI 1045 steel. Int. J. Adv. Manuf. Technol. 2020, 107, 3511–3525. [Google Scholar] [CrossRef]
  17. Wu, Y.; Zhang, W.; Yang, Z.; Wang, Y. Influence factors of drilling power of wood structural component. J. For. Eng. 2020, 5, 36–41. [Google Scholar]
  18. Ouyang, J.; Mativenga, P.T.; Liu, Z.; Li, L. Energy consumption and process characteristics of picosecond laser de-coating of cutting tools. J. Clean. Prod. 2021, 290, 125815. [Google Scholar] [CrossRef]
  19. Akkus, H.; Yaka, H. Experimental and statistical investigation of the effect of cutting parameters on surface roughness, vibration and energy consumption in machining of titanium 6Al-4V ELI (grade 5) alloy. Measurement 2021, 167. [Google Scholar] [CrossRef]
  20. Koleda, P.; Barcik, S.; Korcok, M.; Jamberova, Z.; Chayeuski, V. Effect of Technological Parameters on Energetic Efficiency When Planar Milling Heat-treated Oak Wood. Bioresources 2021, 16, 515–528. [Google Scholar] [CrossRef]
  21. Sedlecký, M.; Kvietkova, M.S.; Kubš, J.; Kubová, P. The Effect of Milling Parameters and Thermal Modification on Power Input During the Milling of Thermally Modified Spruce and Oak Wood. Bioresources 2019, 14, 669–687. [Google Scholar] [CrossRef]
  22. Guedes, T.O.; Moreira da Silva, J.R.; Gherardi Hein, P.R.; Ferreira, S.C. Cutting Energy Required during the Mechanical Processing of Wood Species at Different Drying Stages. Maderas-Ciencia Y Tecnologia 2020, 22, 477–482. [Google Scholar] [CrossRef]
  23. Licow, R.; Chuchala, D.; Deja, M.; Orlowski, K.A.; Taube, P. Effect of pine impregnation and feed speed on sound level and cutting power in wood sawing. J. Clean. Prod. 2020, 272, 122833. [Google Scholar] [CrossRef]
  24. Krilek, J.; Tavodova, M.; Kovac, J.; Tichy, B. Impact of Irregular Tooth Pitch of Circular Saw Blades on Power for Wood Cross-Cutting. Drvna Ind. 2020, 71, 3–11. [Google Scholar] [CrossRef]
  25. Nasir, V.; Cool, J. Optimal power consumption and surface quality in the circular sawing process of Douglas-fir wood. Eur. J. Wood Wood Prod. 2019, 77, 609–617. [Google Scholar] [CrossRef]
  26. Patange, A.D.; Jegadeeshwaran, R. A machine learning approach for vibration-based multipoint tool insert health prediction on vertical machining centre (VMC). Measurement 2021, 173, 108649. [Google Scholar] [CrossRef]
  27. Patil, S.S.; Pardeshi, S.S.; Patange, A.D.; Jegadeeshwaran, R. Deep Learning Algorithms for Tool Condition Monitoring in Milling: A Review. J. Phys. Conf. Ser. 2021, 1969, 012039. [Google Scholar] [CrossRef]
  28. Patange, A.D.; Jegadeeshwaran, R.; Dhobale, N.C. Milling cutter condition monitoring using machine learning approach. IOP Conf. Ser. Mater. Sci. Eng. 2019, 624, 012030. [Google Scholar] [CrossRef]
  29. Patange, A.D.; Jegadeeshwaran, R. Review on tool condition classification in milling: A machine learning approach. Mater. Today Proc. 2021, 46, 1106–1115. [Google Scholar] [CrossRef]
  30. Xu, L.; Huang, C.; Niu, J.; Wang, J.; Liu, H.; Wang, X. Prediction of cutting power and surface quality, and optimization of cutting parameters using new inference system in high-speed milling process. Adv. Manuf. 2021, 9, 388–402. [Google Scholar] [CrossRef]
  31. Tien, D.H.; Duc, Q.T.; Van, T.N.; Nguyen, N.-T.; Duc, T.D.; Duy, T.N. Online monitoring and multi-objective optimisation of technological parameters in high-speed milling process. Int. J. Adv. Manuf. Technol. 2021, 112, 2461–2483. [Google Scholar] [CrossRef]
  32. Tiryaki, S.; Ozsahin, S.; Aydin, A. Employing artificial neural networks for minimizing surface roughness and power consumption in abrasive machining of wood. Eur. J. Wood Wood Prod. 2017, 75, 347–358. [Google Scholar] [CrossRef]
  33. De Melo, D.J.; Guedes, T.O.; Moreira da Silva, J.R.; de Paiva, A.P. Robust optimization of energy consumption during mechanical processing of wood. Eur. J. Wood Wood Prod. 2019, 77, 1211–1220. [Google Scholar] [CrossRef]
  34. Tiryaki, S.; Malkocoglu, A.; Ozsahin, S. Artificial Neural Network Modeling to Predict Optimum Power Consumption in Wood Machining. Drewno 2016, 59, 109–125. [Google Scholar] [CrossRef]
  35. GB/T 17657-2013; Test Methods of Evaluating the Properties of Wood-Based Panels and Surface Decorated Wood-Based Panels. Standardization Administration of the People’s Republic of China: Beijing, China, 2013.
  36. Zhu, Z.; Buck, D.; Guo, X.; Cao, P. High-Quality and High-Efficiency Machining of Stone-Plastic Composite with Diamond Helical Cutters. J. Manuf. Process 2020, 58, 914–922. [Google Scholar] [CrossRef]
  37. Zhu, Z.; Buck, D.; Guo, X.; Cao, P.; Wang, J. Cutting performance in the helical milling of stone-plastic composite with diamond tools. CIRP J. Manuf. Sci. Technol. 2020, 31, 119–129. [Google Scholar] [CrossRef]
  38. Zhu, Z.; Buck, D.; Cao, P.; Guo, X.; Wang, J. Assessment of Cutting Forces and Temperature in Tapered Milling of Stone–Plastic Composite Using Response Surface Methodology. JOM 2020, 72, 3917–3925. [Google Scholar] [CrossRef]
  39. Mia, M.; Dhar, N.R. Response surface and neural network based predictive models of cutting temperature in hard turning. J. Adv. Res. 2016, 7, 1035–1044. [Google Scholar] [CrossRef] [Green Version]
  40. Zhu, Z.; Buck, D.; Ekevad, M.; Marklund, B.; Guo, X.; Cao, P.; Zhu, N. Cutting forces and chip formation revisited based on orthogonal cutting of Scots pine. Holzforschung 2019, 73, 131–138. [Google Scholar] [CrossRef]
  41. Guo, X.; Wang, J.; Buck, D.; Zhu, Z.; Ekevad, M. Cutting forces and cutting quality in the up-milling of solid wood using ceramic cutting tools. Int. J. Adv. Manuf. Technol. 2021, 114, 1575–1584. [Google Scholar] [CrossRef]
  42. Cao, P.; Zhu, Z.; Buck, D.; Guo, X.; Ekevad, M.; Wang, X. Effect of rake angle on cutting performance during machining of stone-plastic composite material with polycrystalline diamond cutters. J. Mech. Sci. Technol. 2019, 33, 351–356. [Google Scholar] [CrossRef]
  43. Van-Dam, V.; Thanh-Toan, N.; Ngoc-Hung, C.; Quoc-Huy, N.; Ky-Thanh, H.; Van-Du, N. Multiresponse Optimization of Cutting Force and Cutting Power in Chopping Agricultural Residues Using Grey-Based Taguchi Method. Agriculture 2020, 10, 51. [Google Scholar] [CrossRef] [Green Version]
Figure 1. The schematic diagram of experimental setup.
Materials 15 00879 g001
Figure 2. Spindle power plot for a single experiment.
Materials 15 00879 g002
Figure 3. The plot of impact trend for cutting power and power efficiency.
Materials 15 00879 g003
Figure 4. The plot of interaction impact trend for cutting power.
Materials 15 00879 g004
Figure 5. The plot of interaction impact trend for power efficiency.
Materials 15 00879 g005
Figure 6. The plot of predicted vs. actual for (a) Pc and (b) η.
Materials 15 00879 g006
Table 1. The input parameters and their ranges.
ParametersCodesRanges
−101
Rake angle (°)A2610
Rotation speed of main shaft (rpm)B6000800010,000
Depth of milling (mm)C0.51.01.5
Table 2. The results of cutting power and power efficiency during the PB milling process.
StandardRunFactors P c
(W)
η
(%)
Rake Angle (°)Rotation Speed of Main Shaft (rpm)Depth of Milling (mm)
16260001.041.510.2
2161060001.036.08.7
31210,0001.057.110.8
4141010,0001.052.710.5
54280000.537.18.0
651080000.527.16.5
711280001.559.212.5
821080001.556.912.8
917660000.527.56.8
1012610,0000.538.76.9
117660001.556.512.1
129610,0001.571.513.5
1310680001.039.210.1
148680001.039.110.3
153680001.039.210.5
1613680001.039.210.3
1715680001.039.310.4
Table 3. ANOVA results for Pc.
SourceSS % Cont.dfMS F-Valuep-Value
Model2352.9999.26 9261.44103.73<0.0001
A—Rake angle61.612.60 161.6124.440.0017
B—Rotation speed of main shaft427.7818.041427.78169.73<0.0001
C—Depth of milling1615.9668.17 11615.96641.16<0.0001
AB0.30250.01 10.30250.12000.7392
AC14.820.63 114.825.880.0457
BC3.610.15 13.611.430.2703
A218.130.76 118.137.190.0314
B2129.695.47 1129.6951.460.0002
C260.802.56 160.8024.120.0017
Error37.931.607
Cor Total2370.6310016
SS—Sum of squares MS—Mean square.
Table 4. ANOVA results for η.
SourceSS % Cont.dfMS F-Valuep-Value
Model69.5999.46 97.73142.02<0.0001
A—Rake angle1.151.64 11.1521.140.0025
B—Rotation speed of main shaft1.852.6411.8534.040.0006
C—Depth of milling64.3291.93 164.321181.49<0.0001
AB0.38090.54 10.38097.000.0332
AC0.81001.16 10.810014.880.0062
BC0.43250.62 10.43257.940.0258
A20.02510.04 10.02510.46020.5193
B20.16560.24 10.16563.040.1247
C20.39650.57 10.39657.280.0307
Error0.43941.607
Cor Total69.9710016
SS—Sum of squares MS—Mean square.
Table 5. Results of ANOVA for different models.
Response ParametersModelsSDR2Adj. R2Pred. R2
P c Linear4.520.88810.86230.8246
2FI4.970.89600.83360.7101
Quadratic1.590.99260.98300.8810Suggested
η Linear0.45080.96220.95350.9273
2FI0.31920.98540.97670.9517
Quadratic0.23330.99460.98760.9307Suggested
Table 6. Goals and parameter range for optimization of PB milling process.
ConditionsGoalLower LimitUpper Limit
Aminimize210
Bin range600010,000
Cmaximize0.51.5
P c minimize27.171.5
η maximize6.513.5
Publisher’s Note: MDPI stays neutral with regard to jurisdictional claims in published maps and institutional affiliations.

