
Effect of Different Ultrasonic Power on the Properties of RHA Steel Welded Joints


Abstract
:1. Introduction
2. Experimental Procedures
2.1. Materials
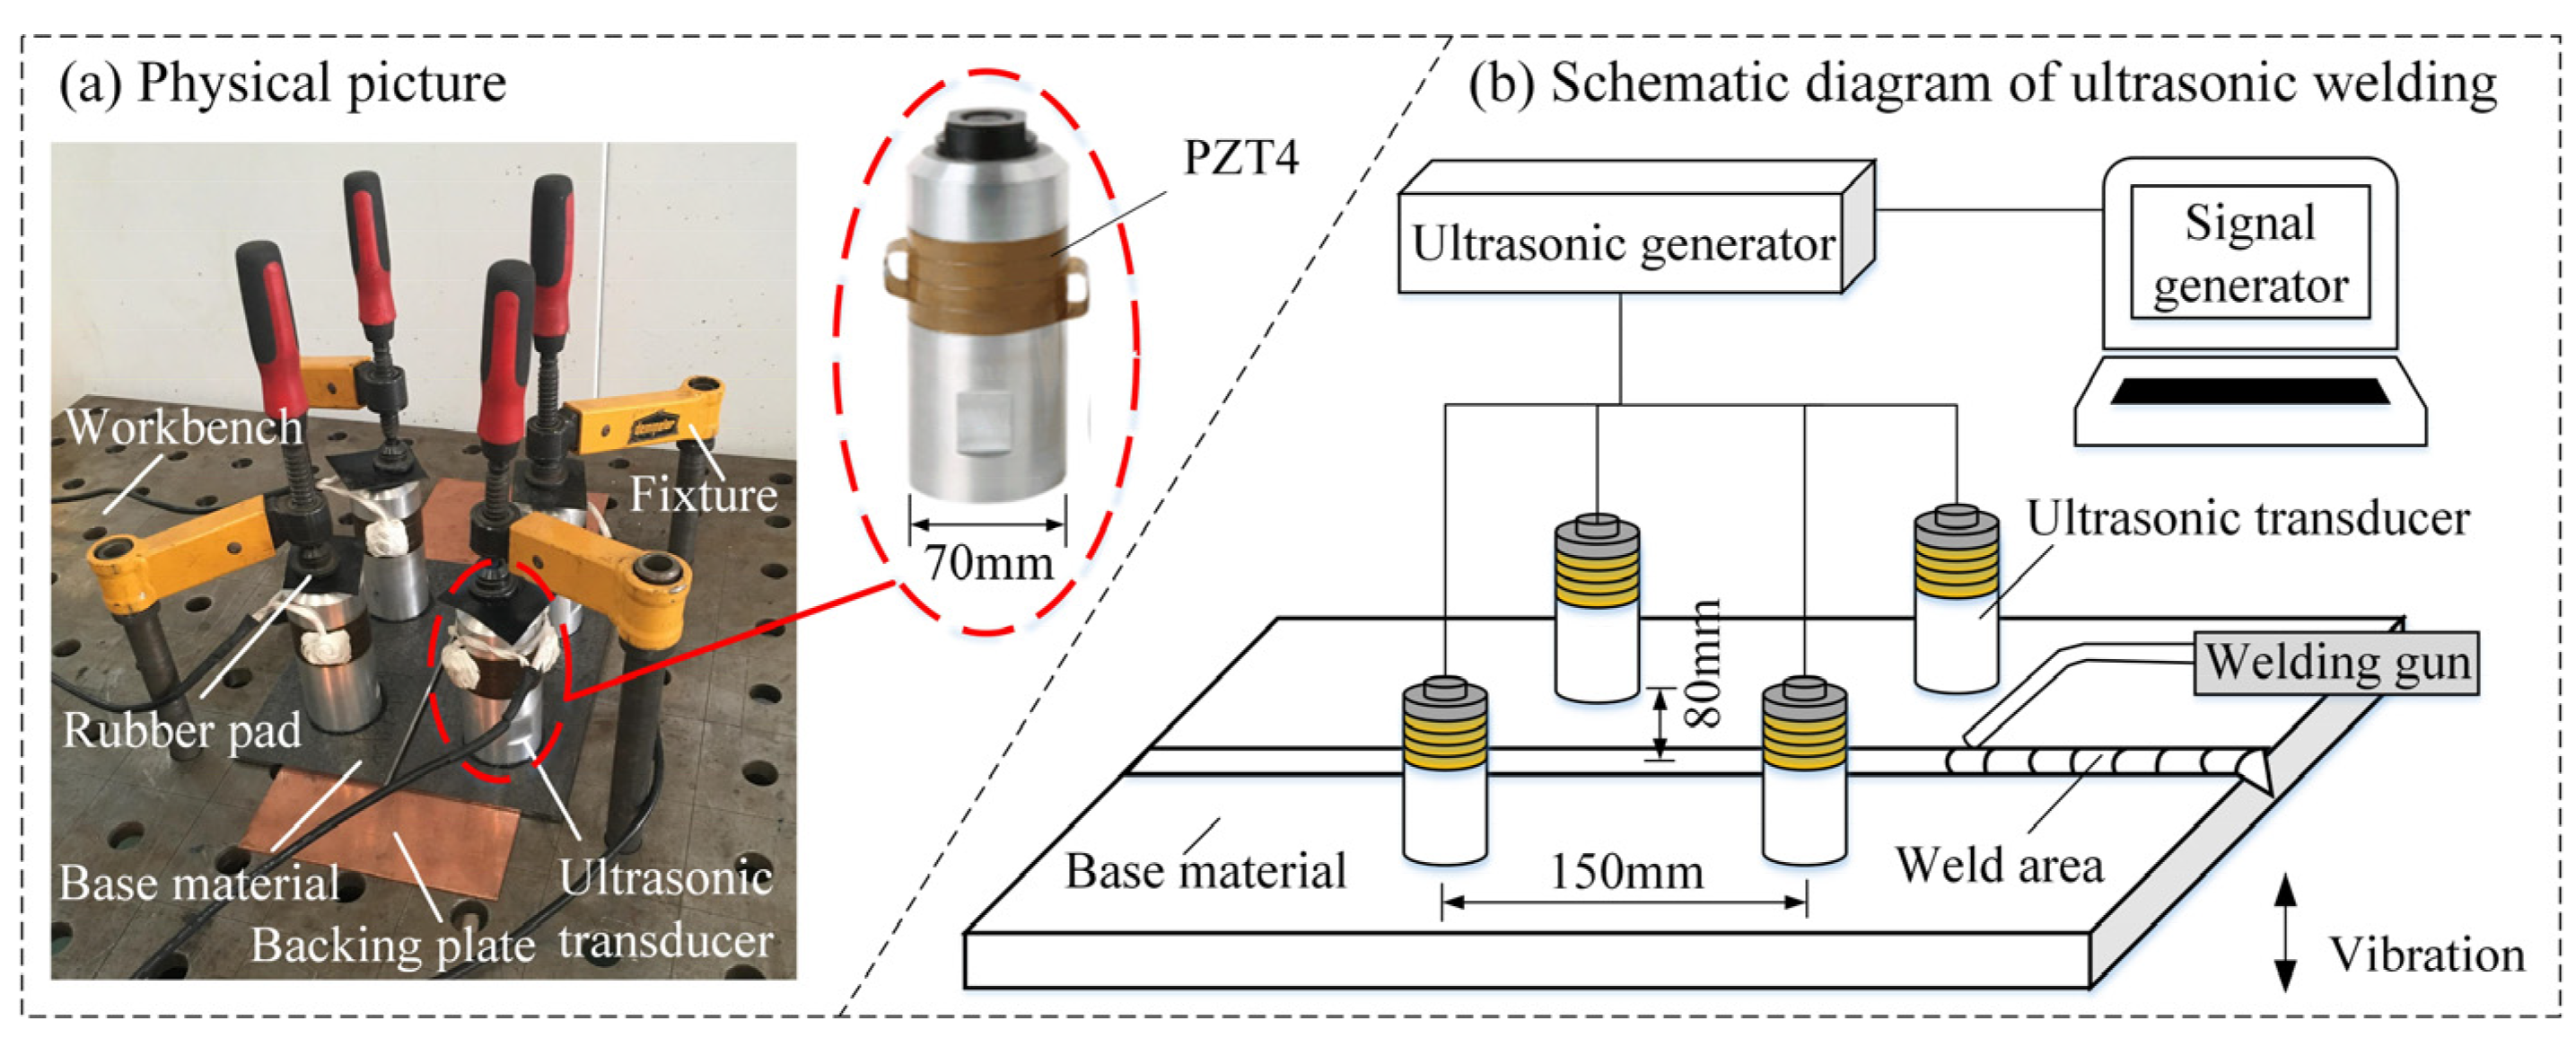
2.2. Test System
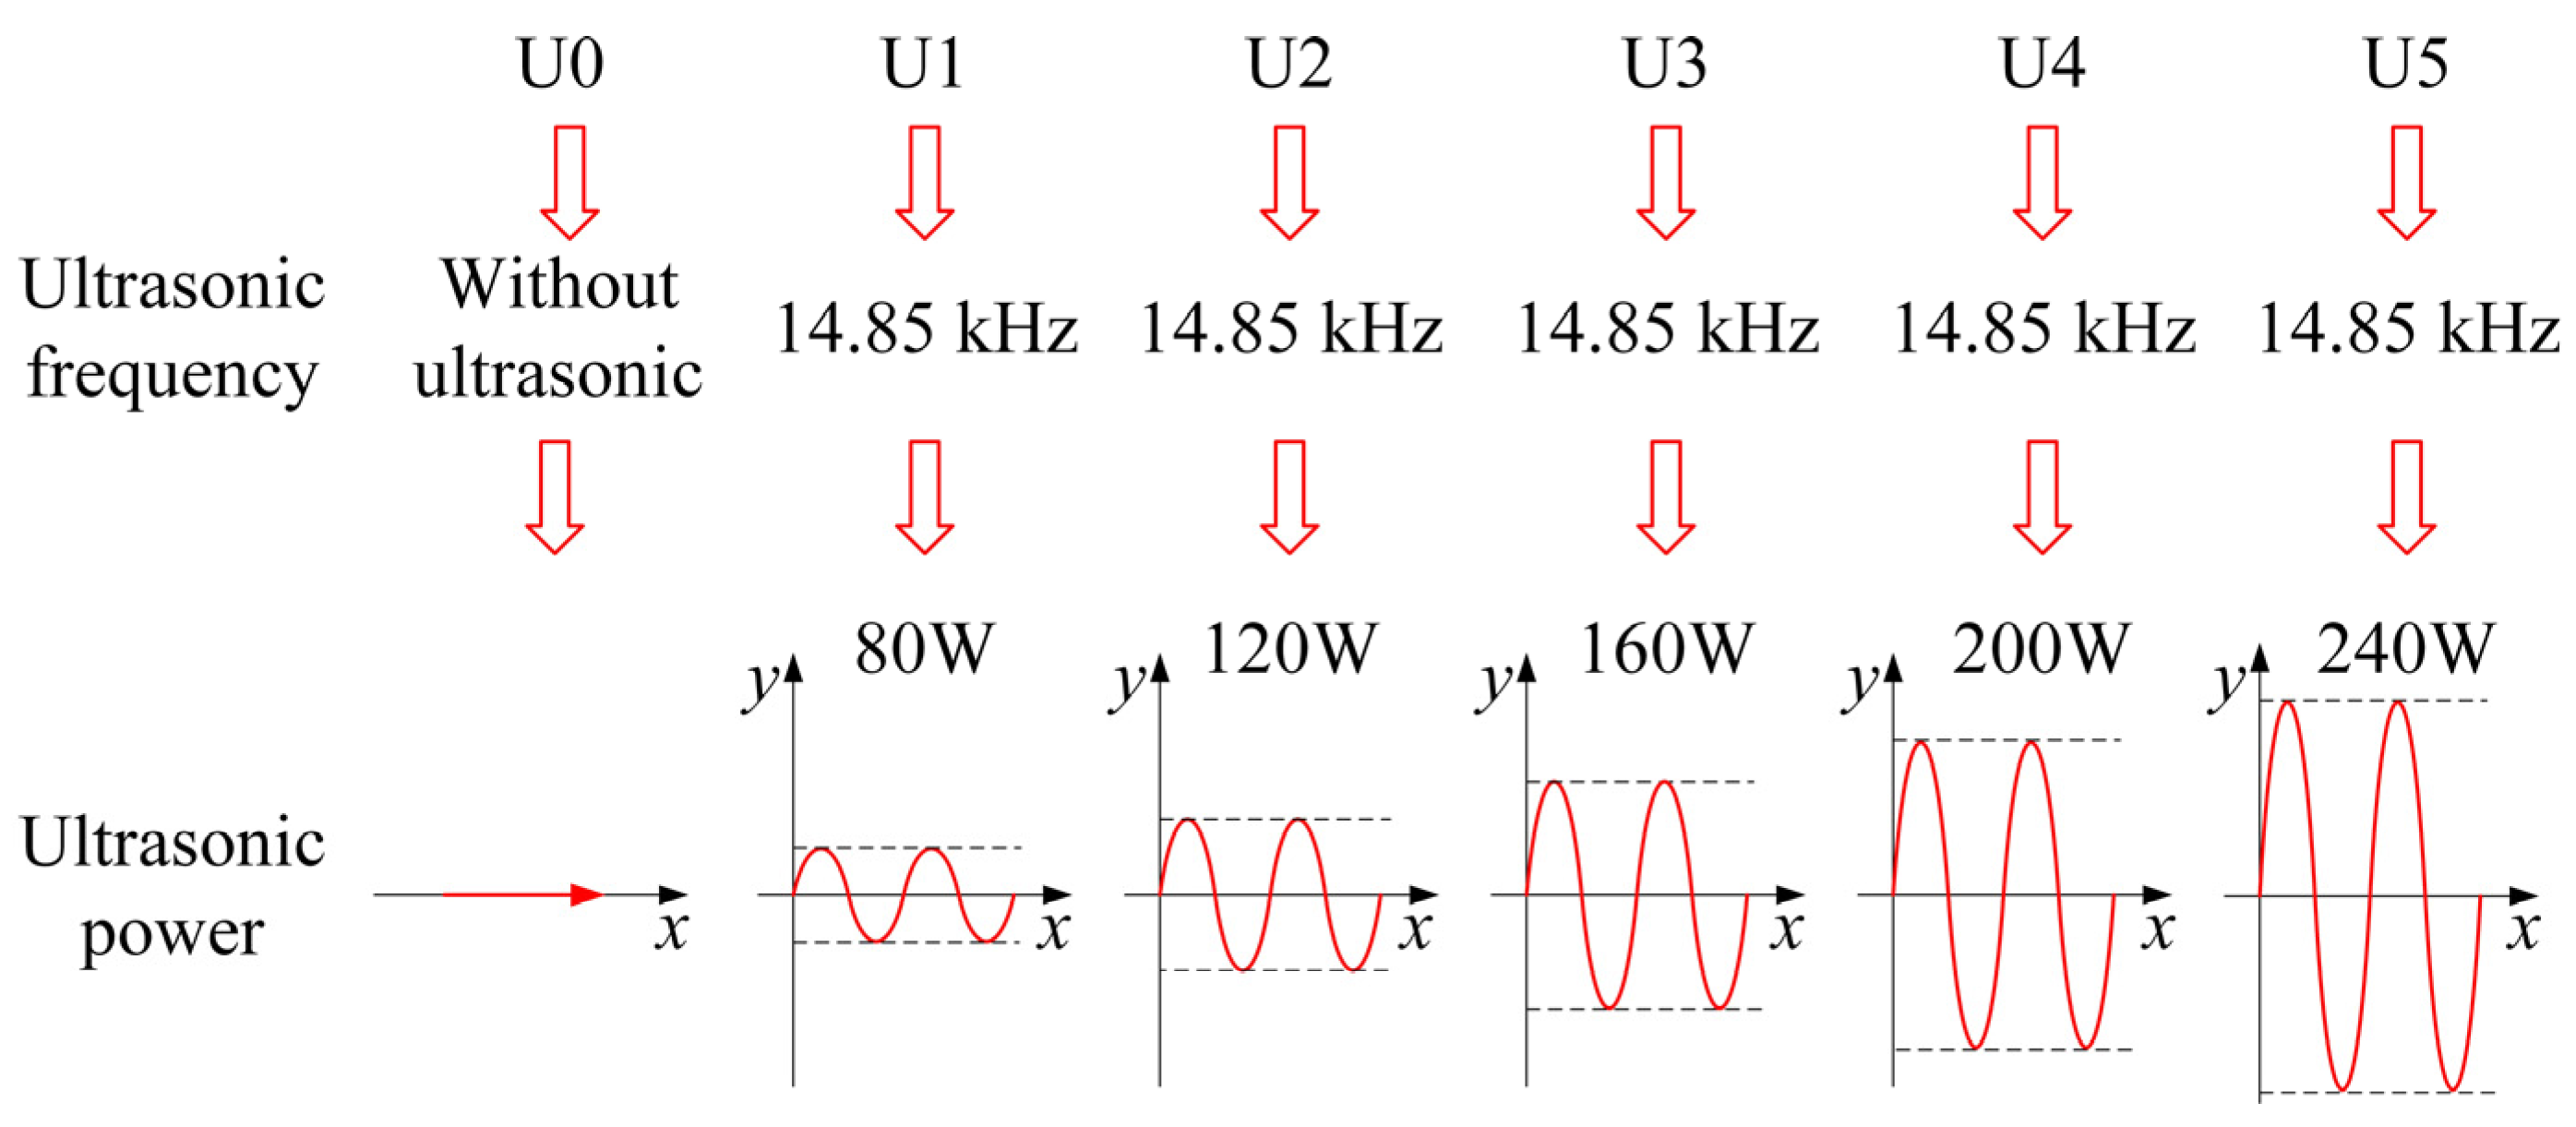
2.3. Test Method
3. Results and Discussion
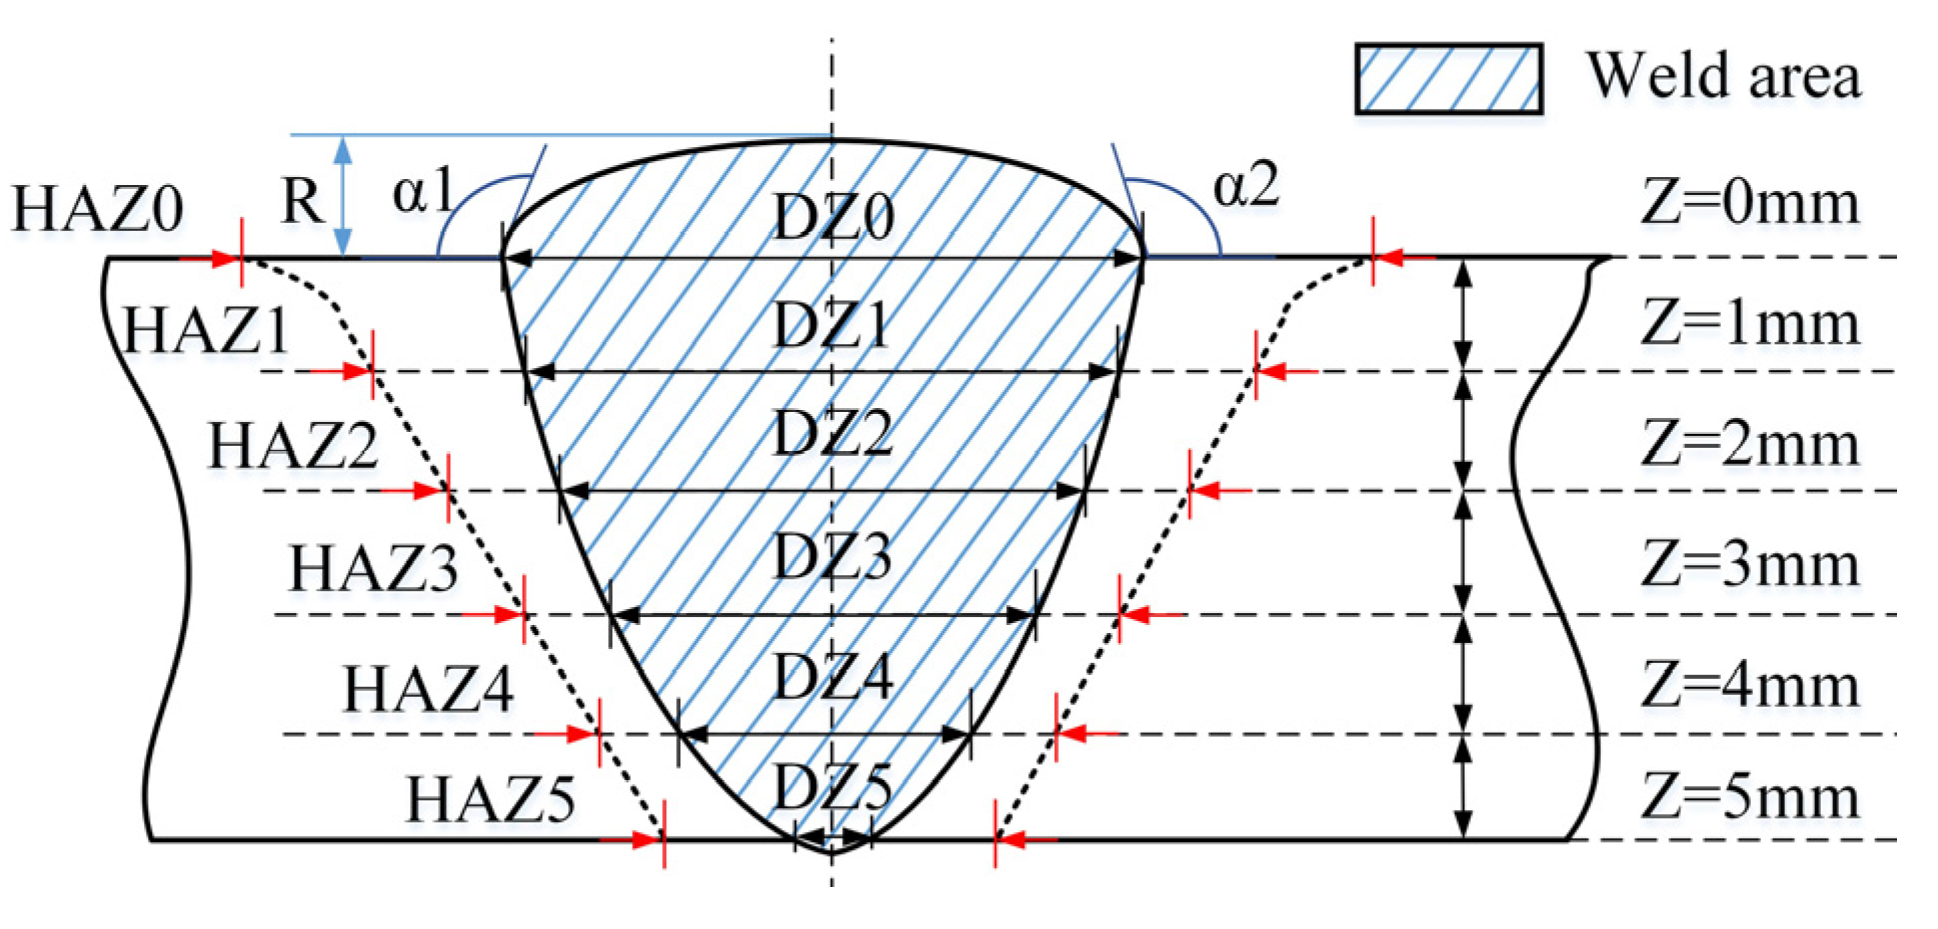
3.1. Macroscopic Morphology of a Weld
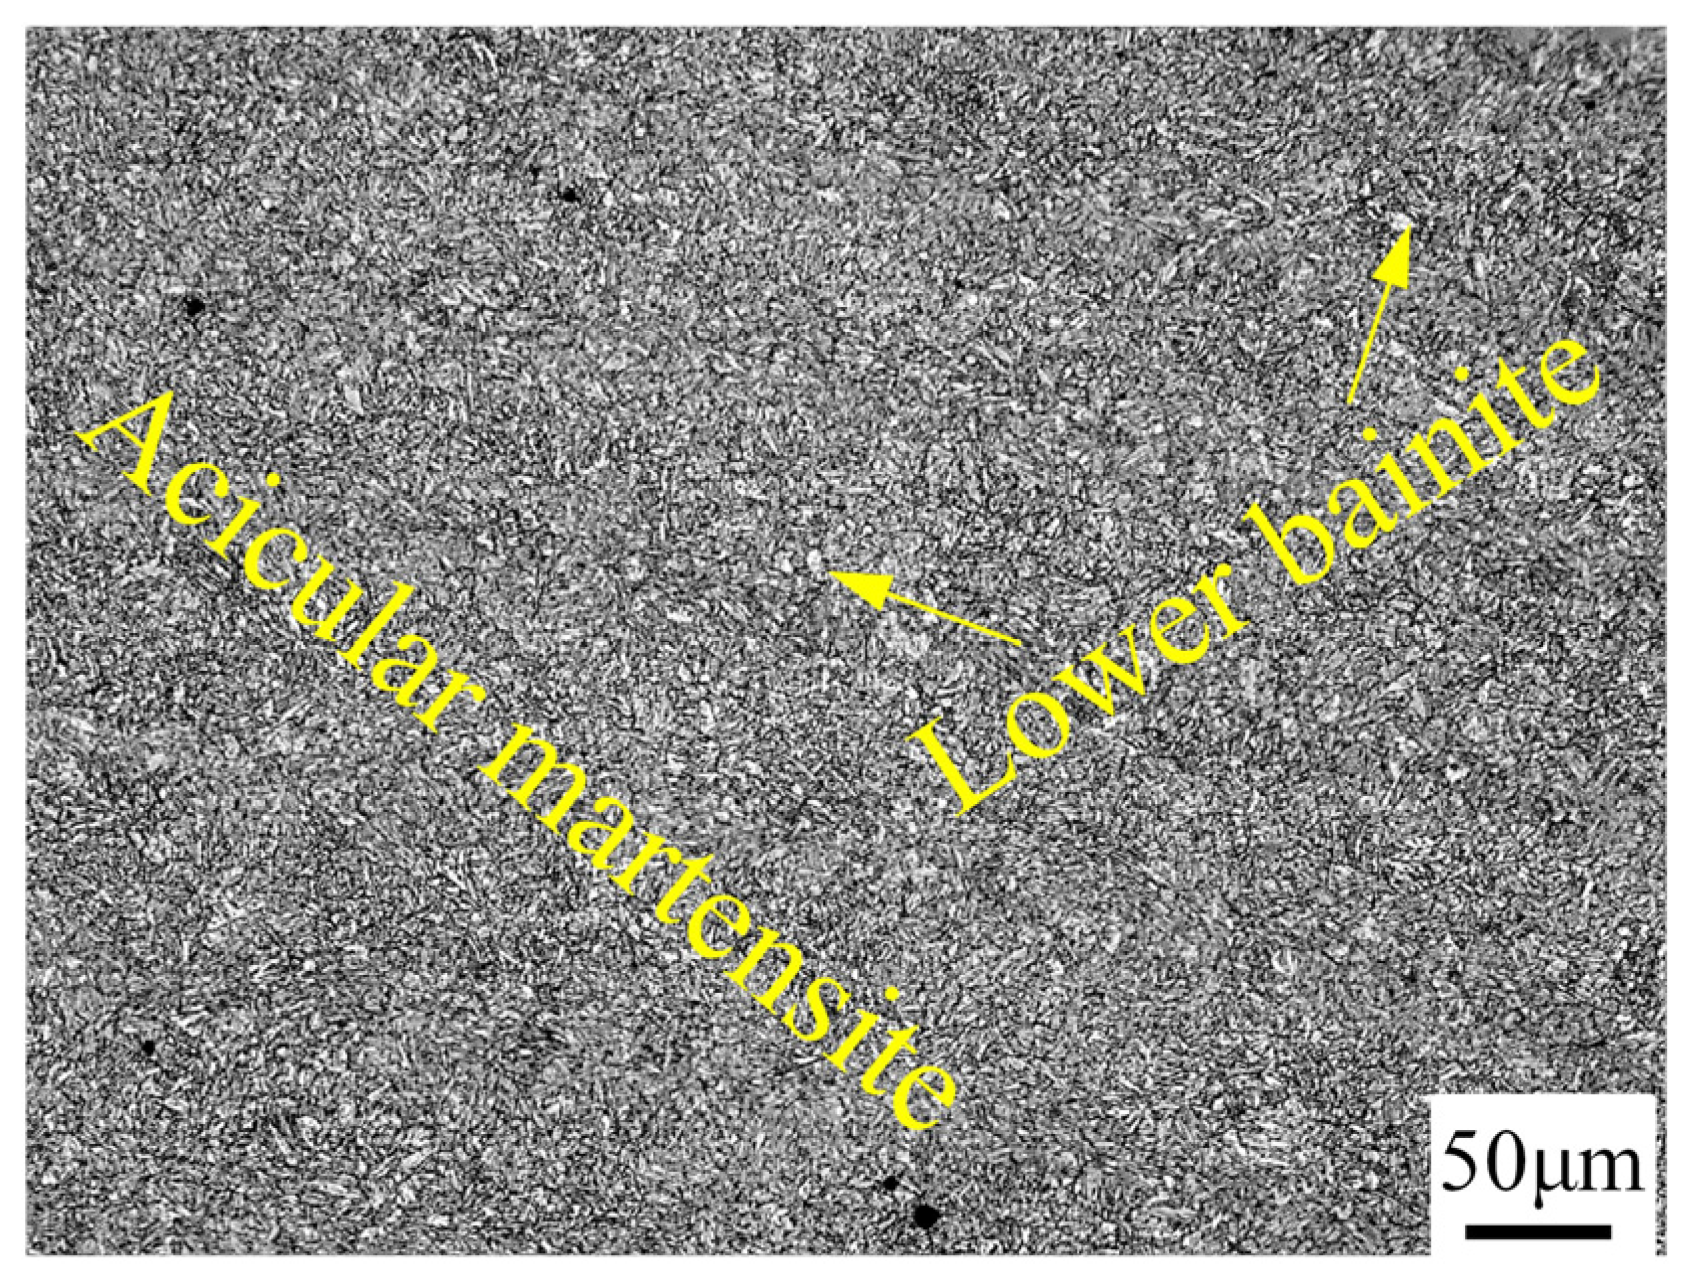
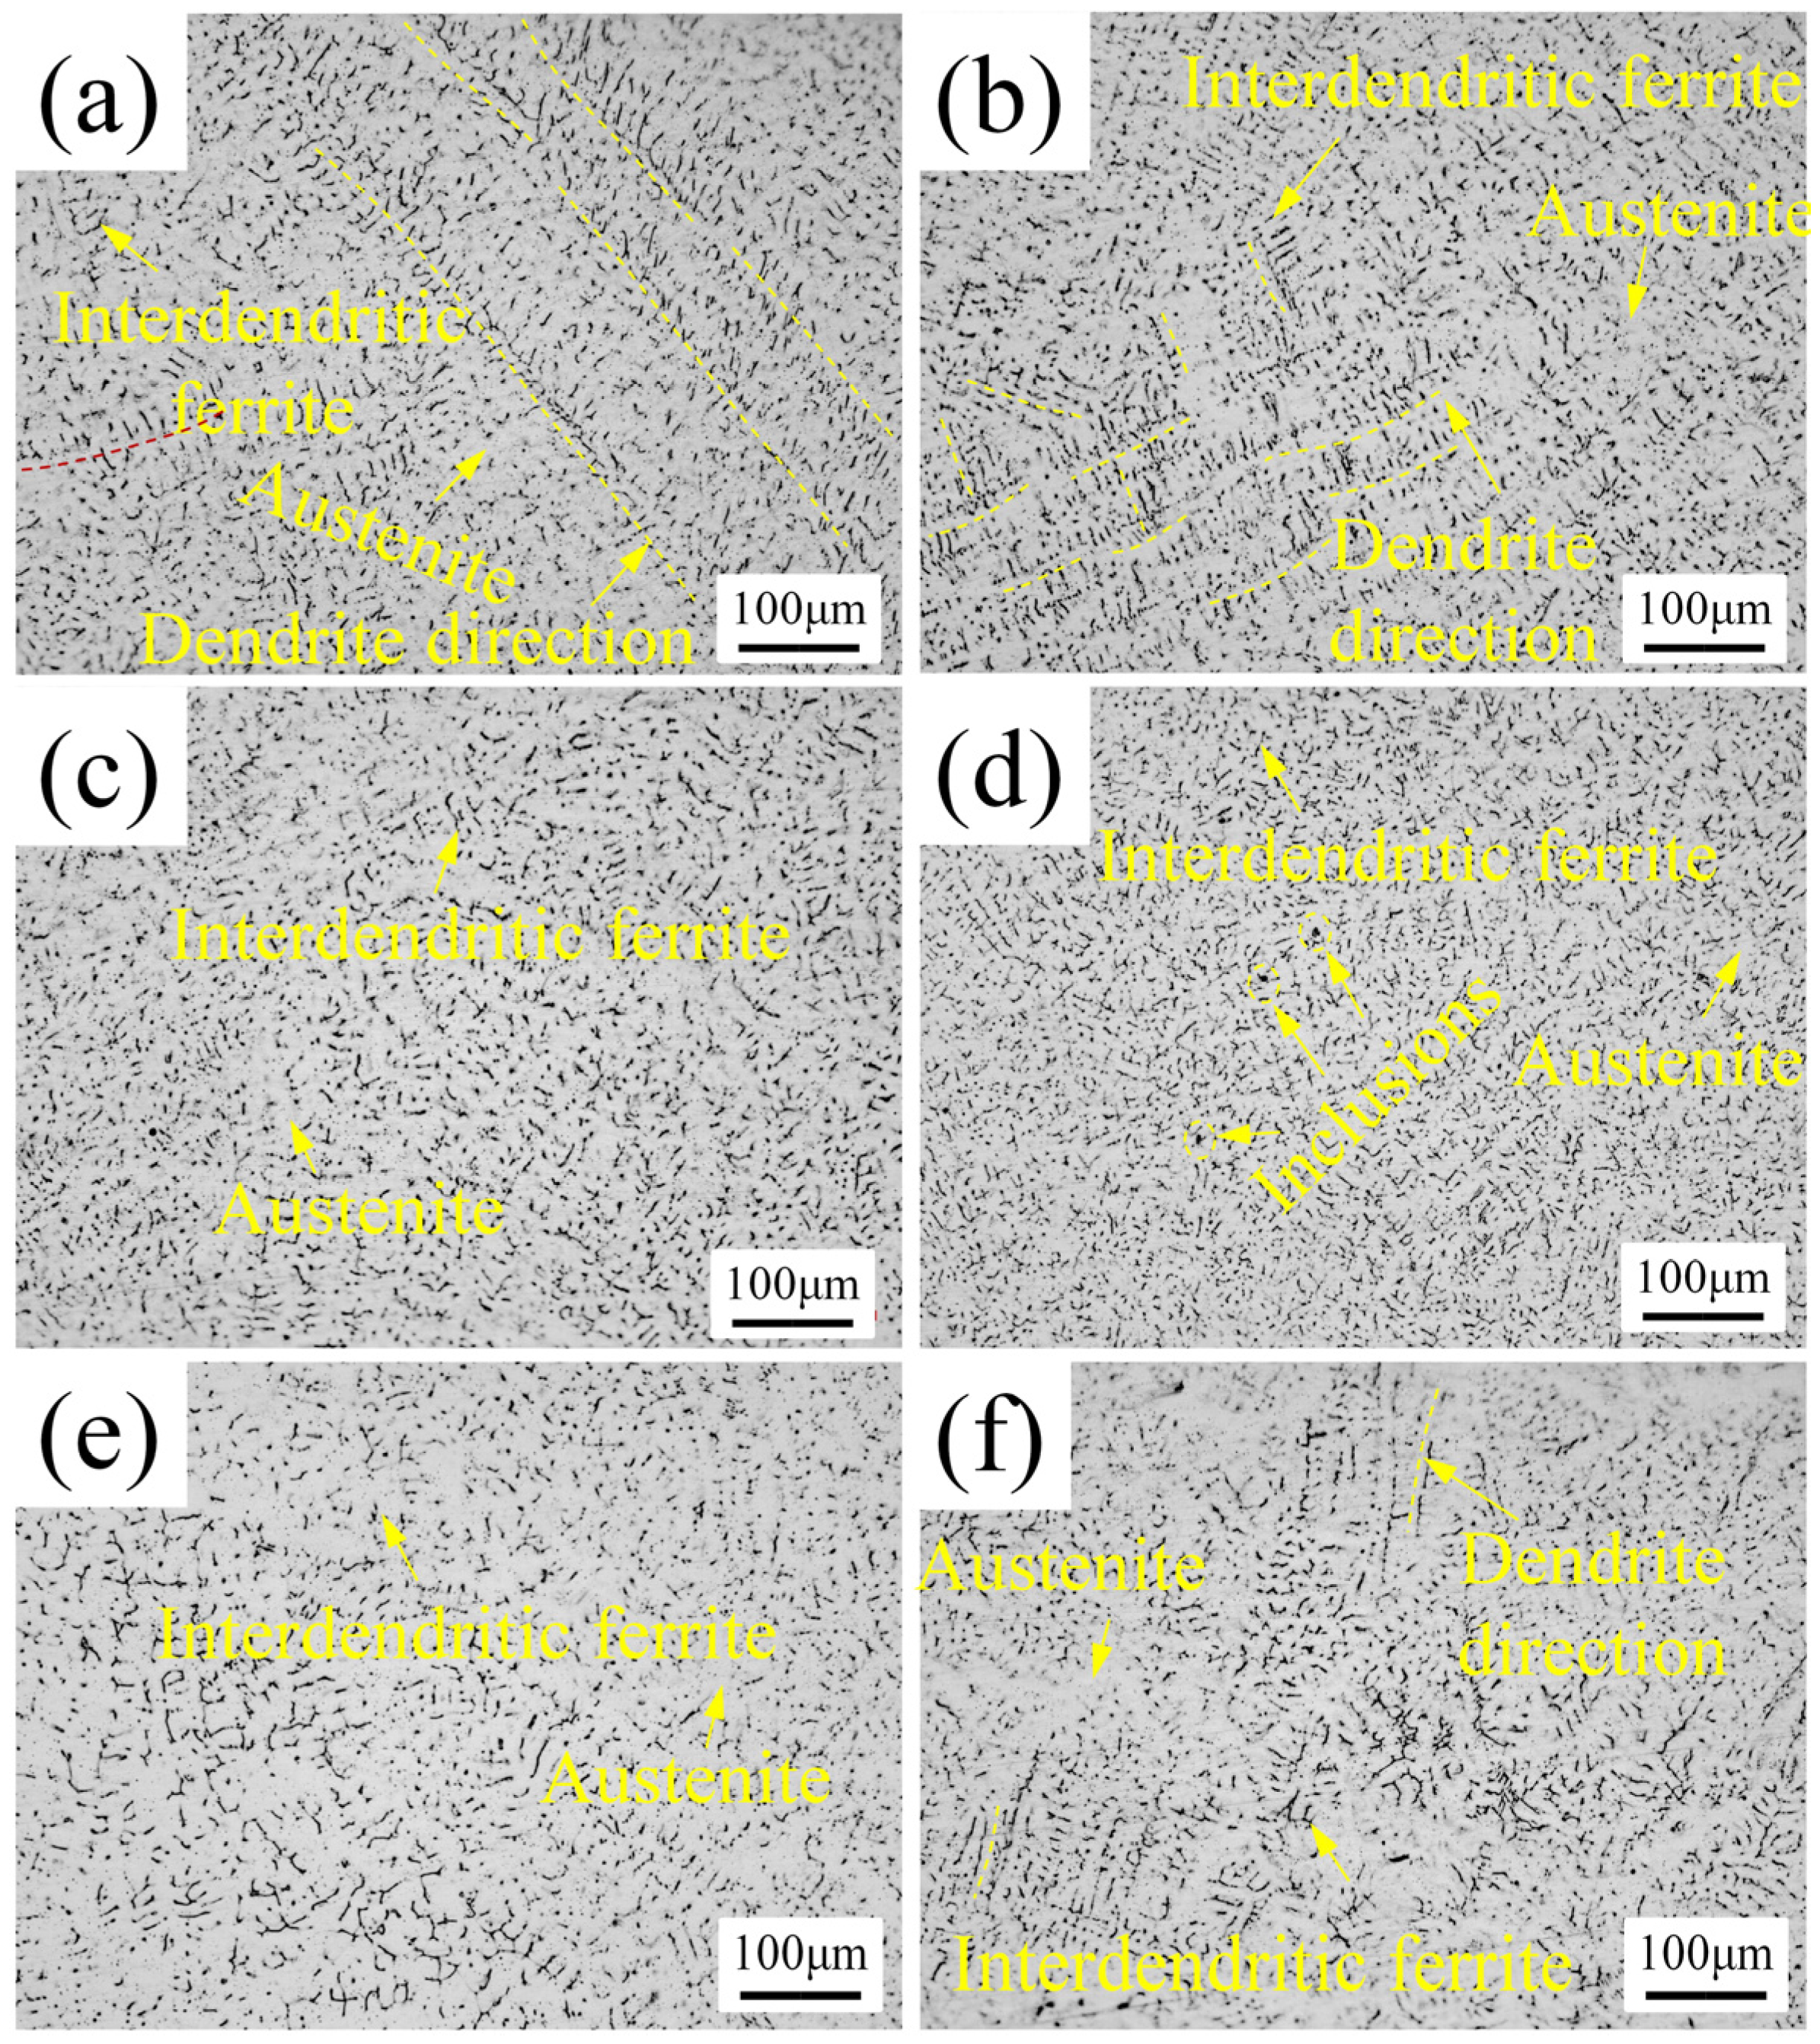
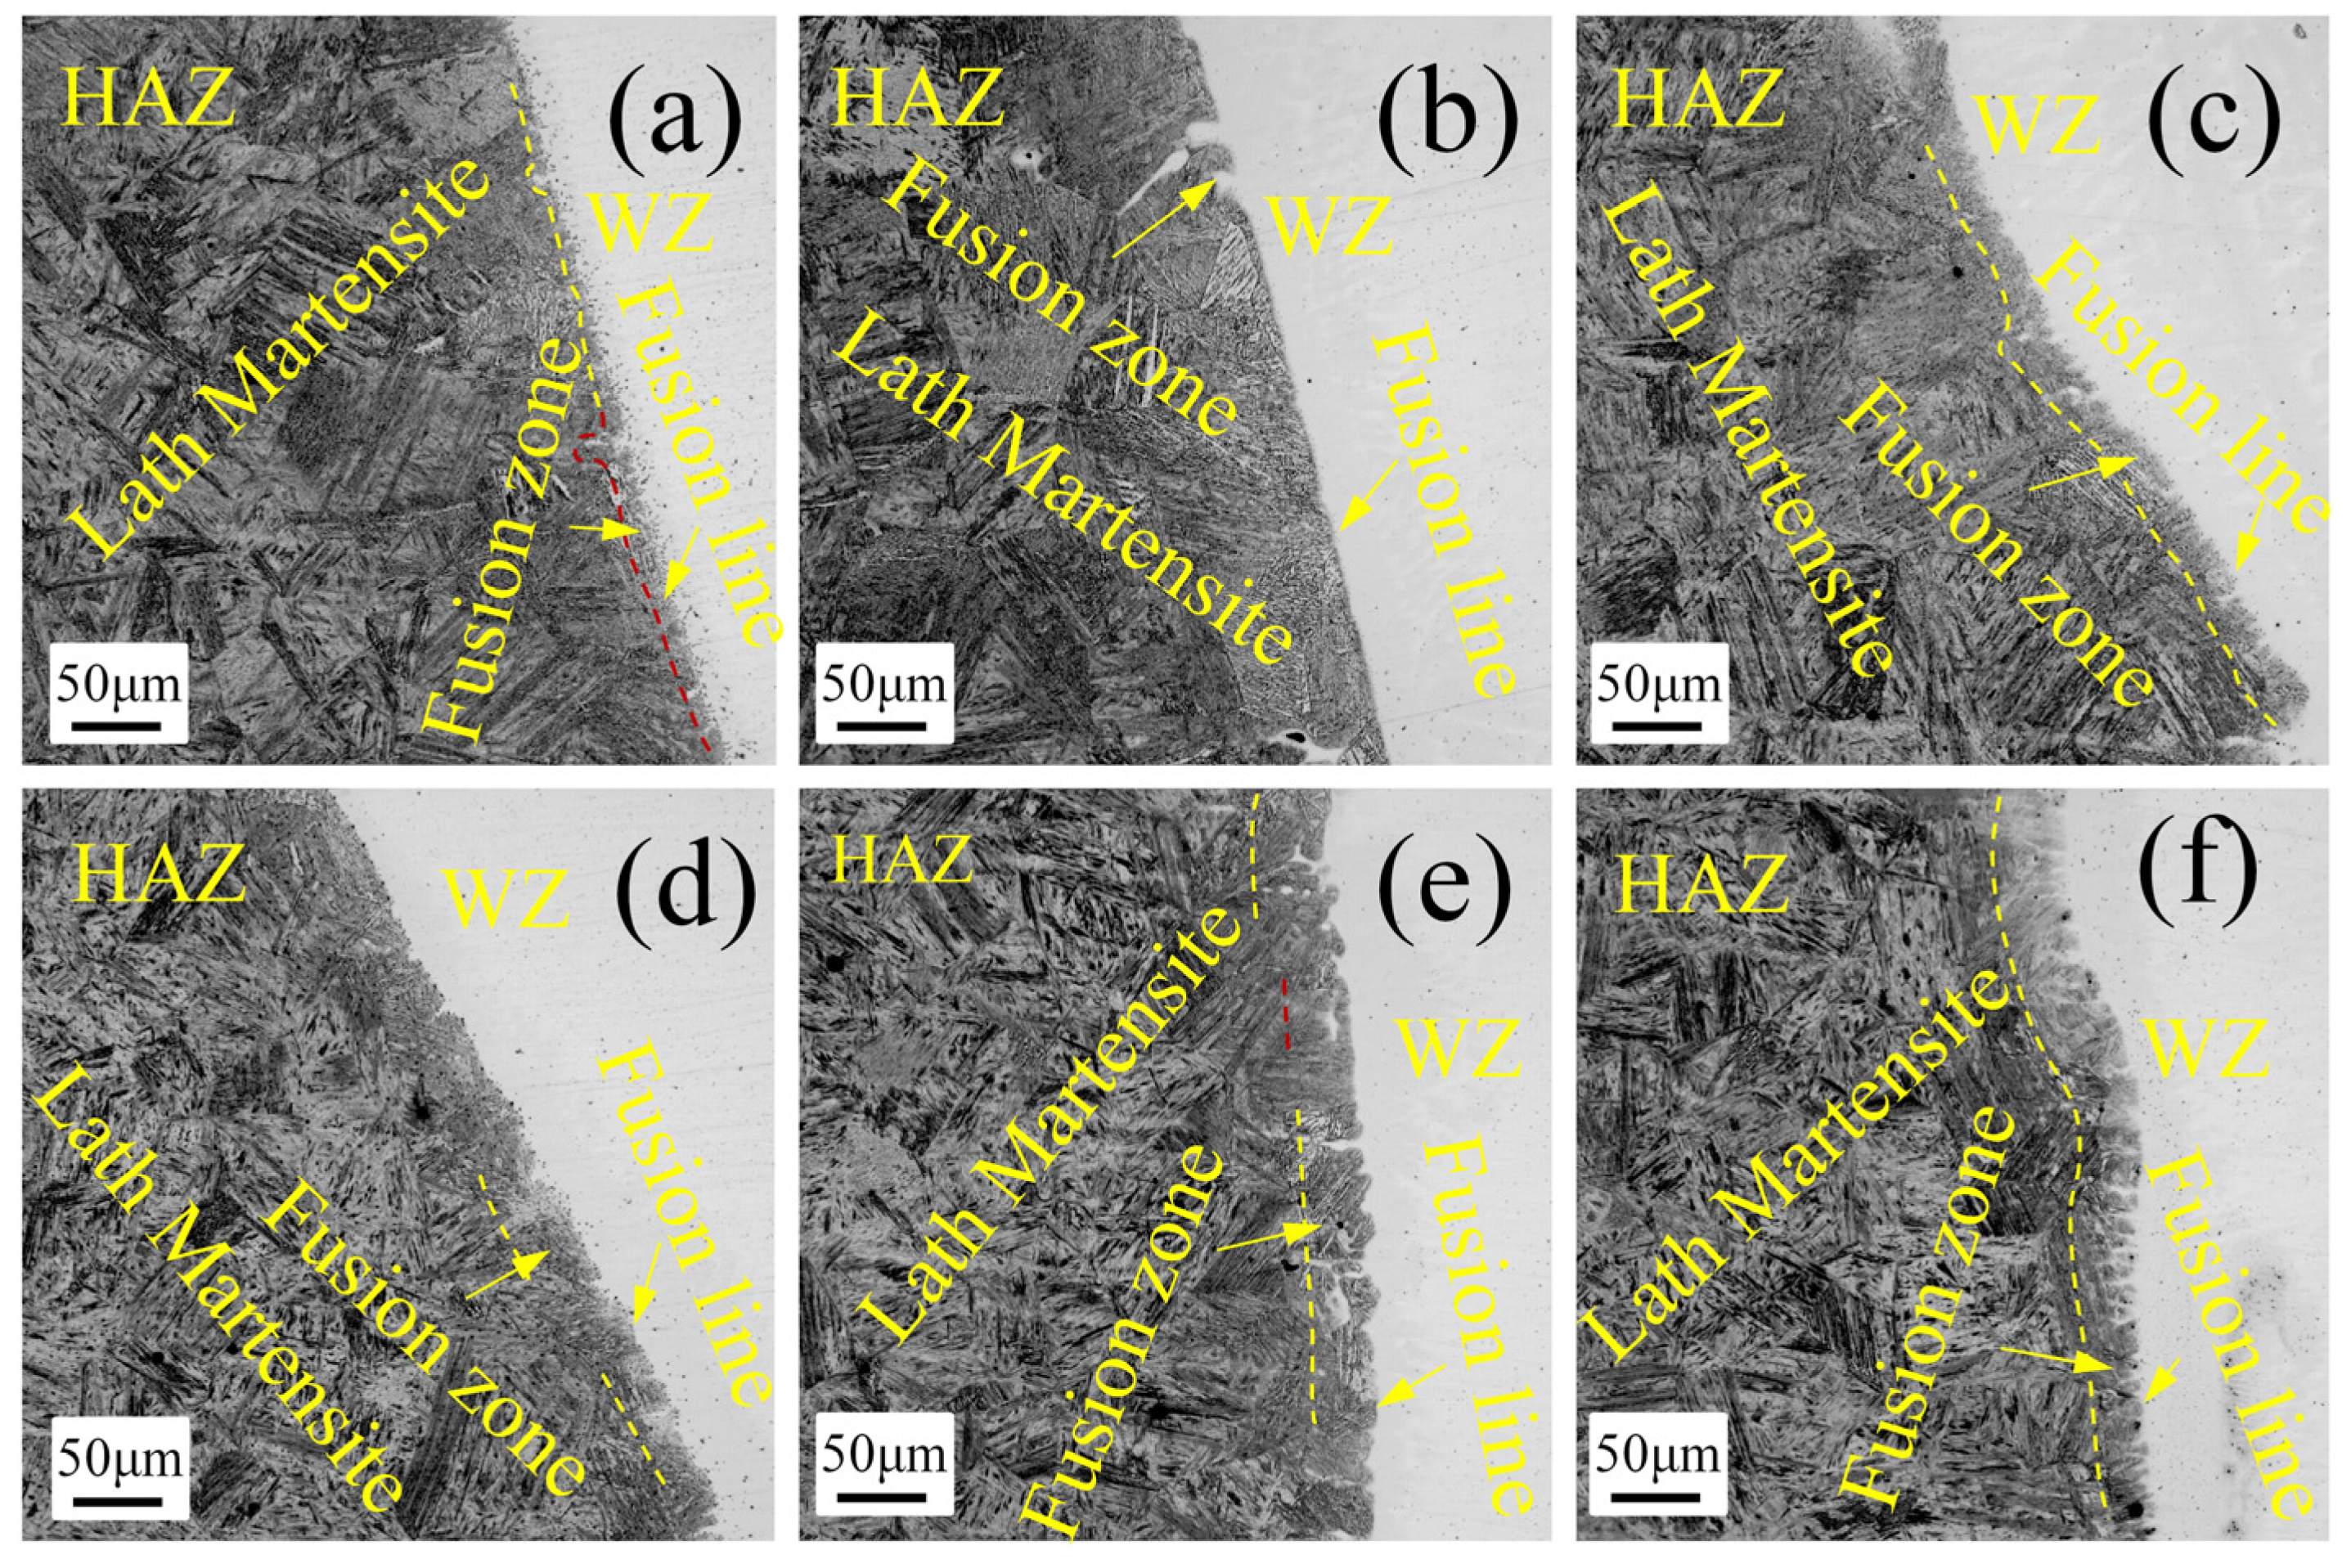
3.2. Weld Microstructure
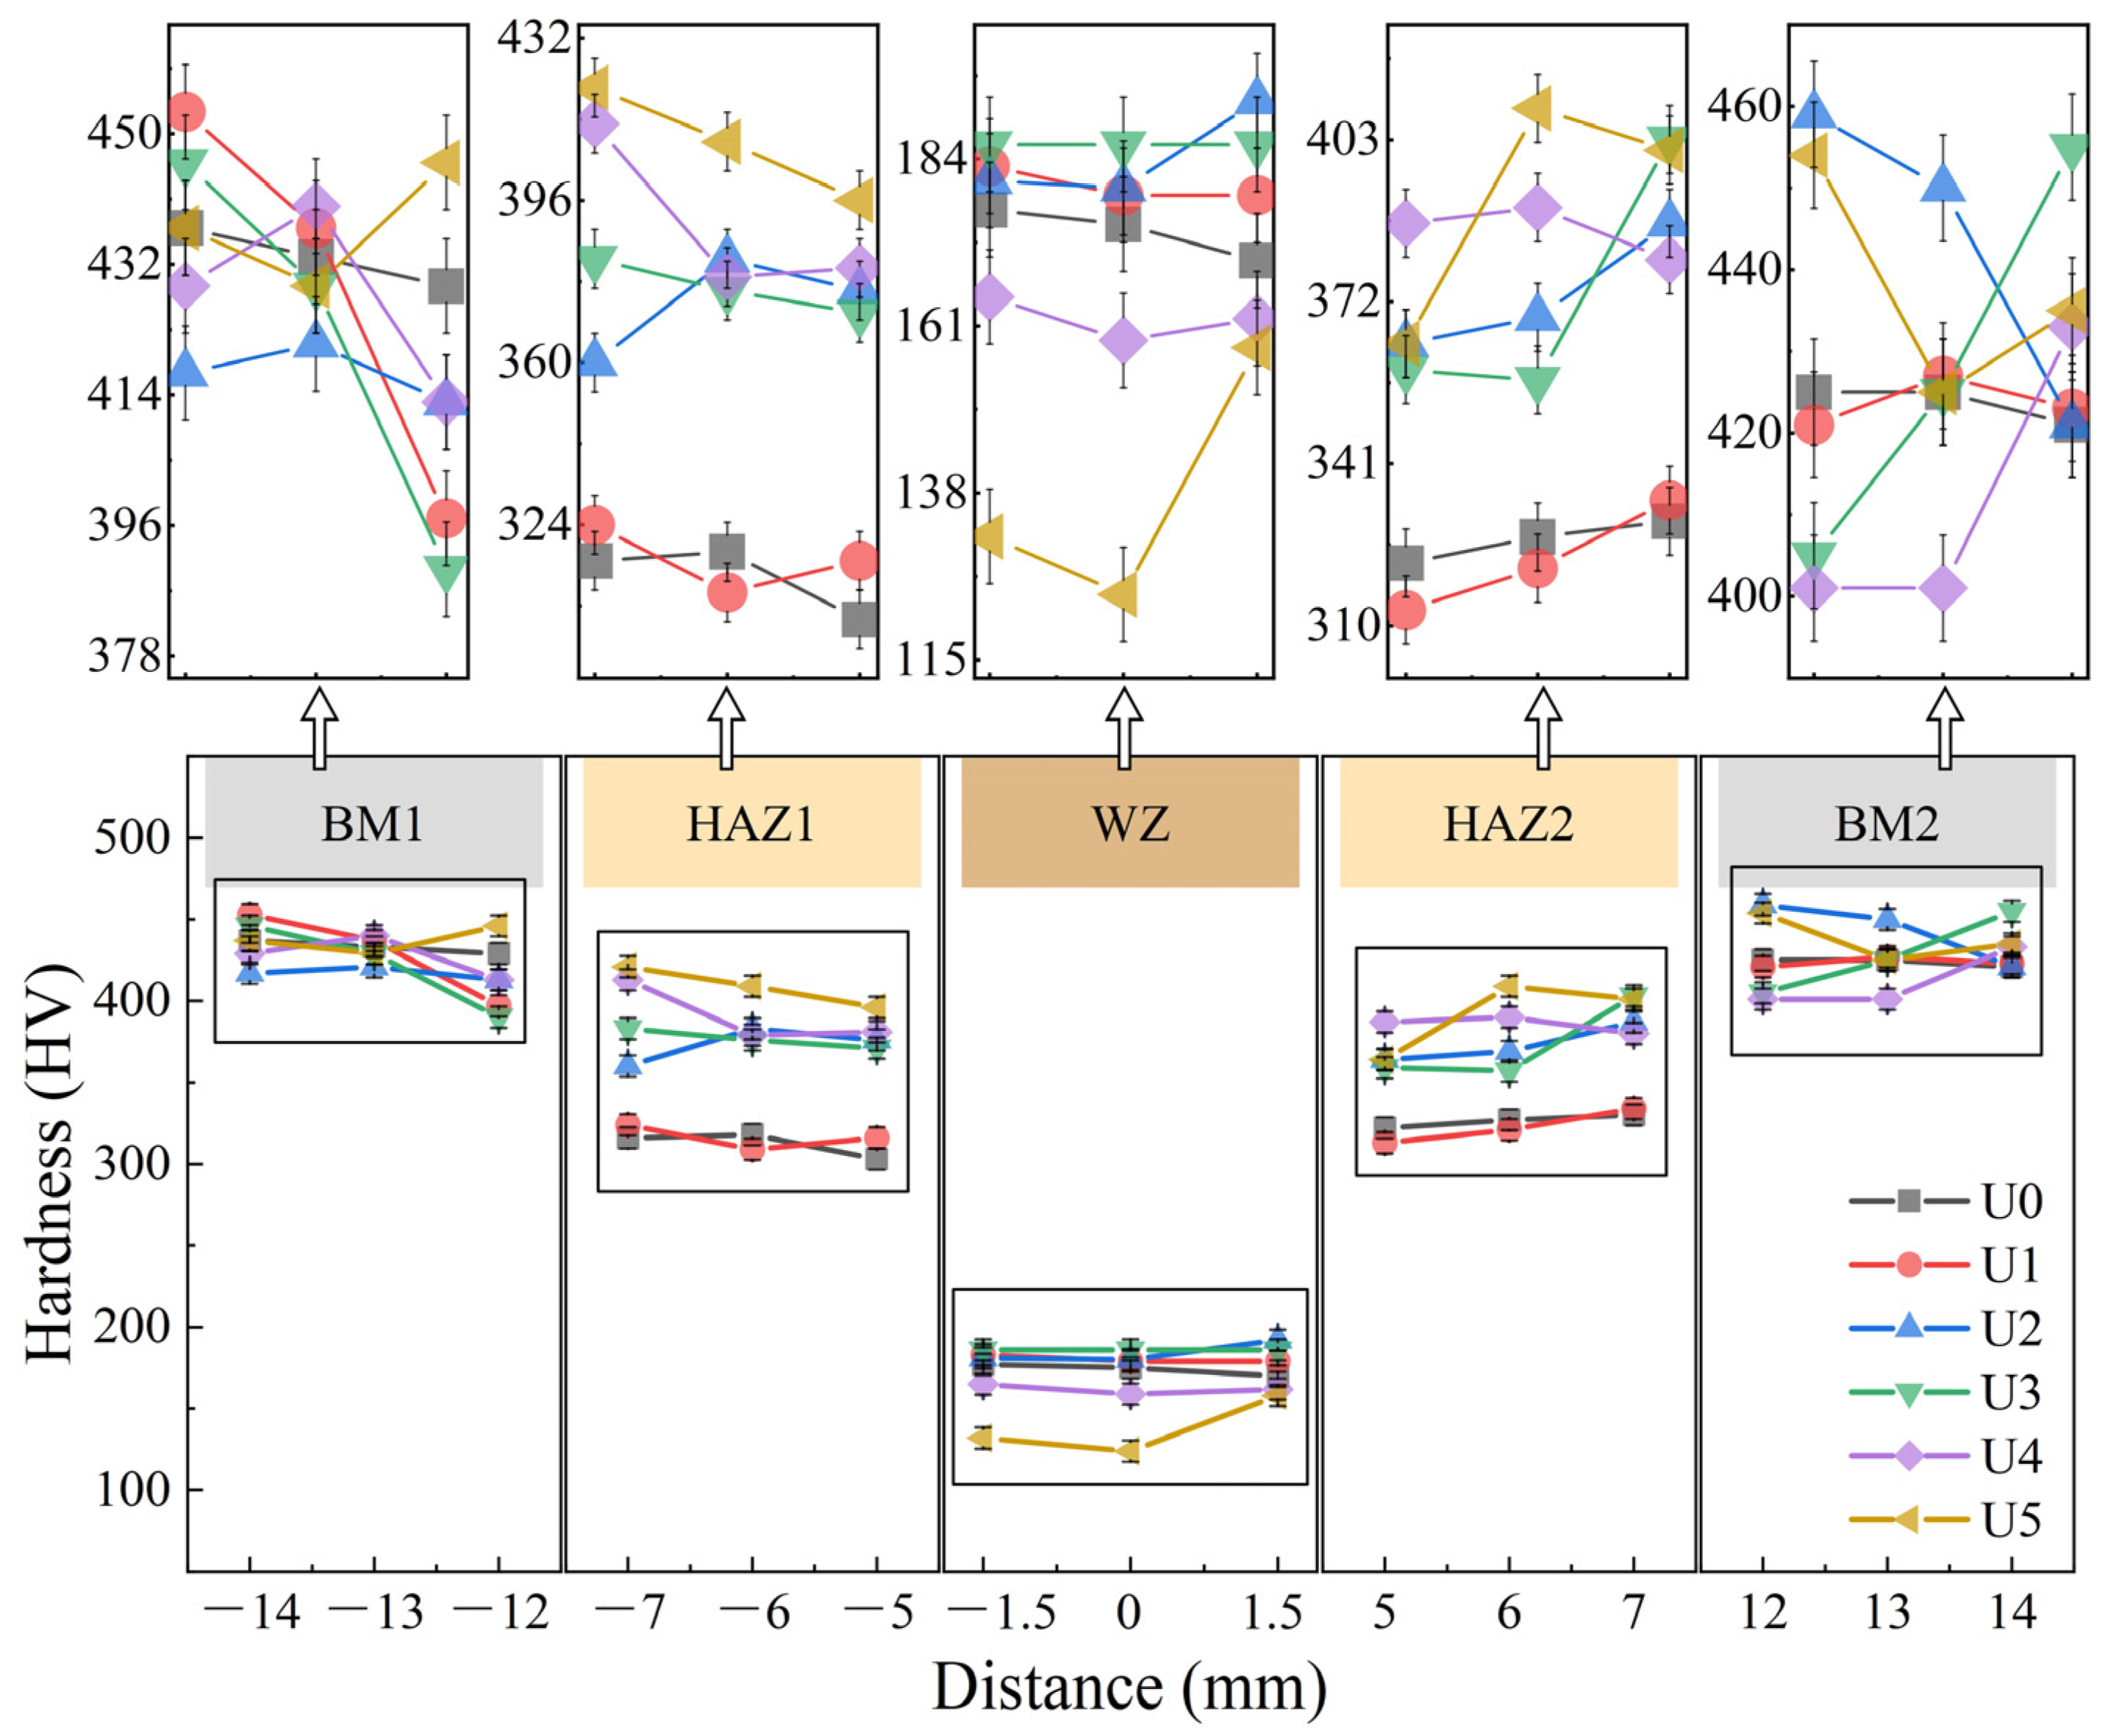
3.3. Microhardness Test
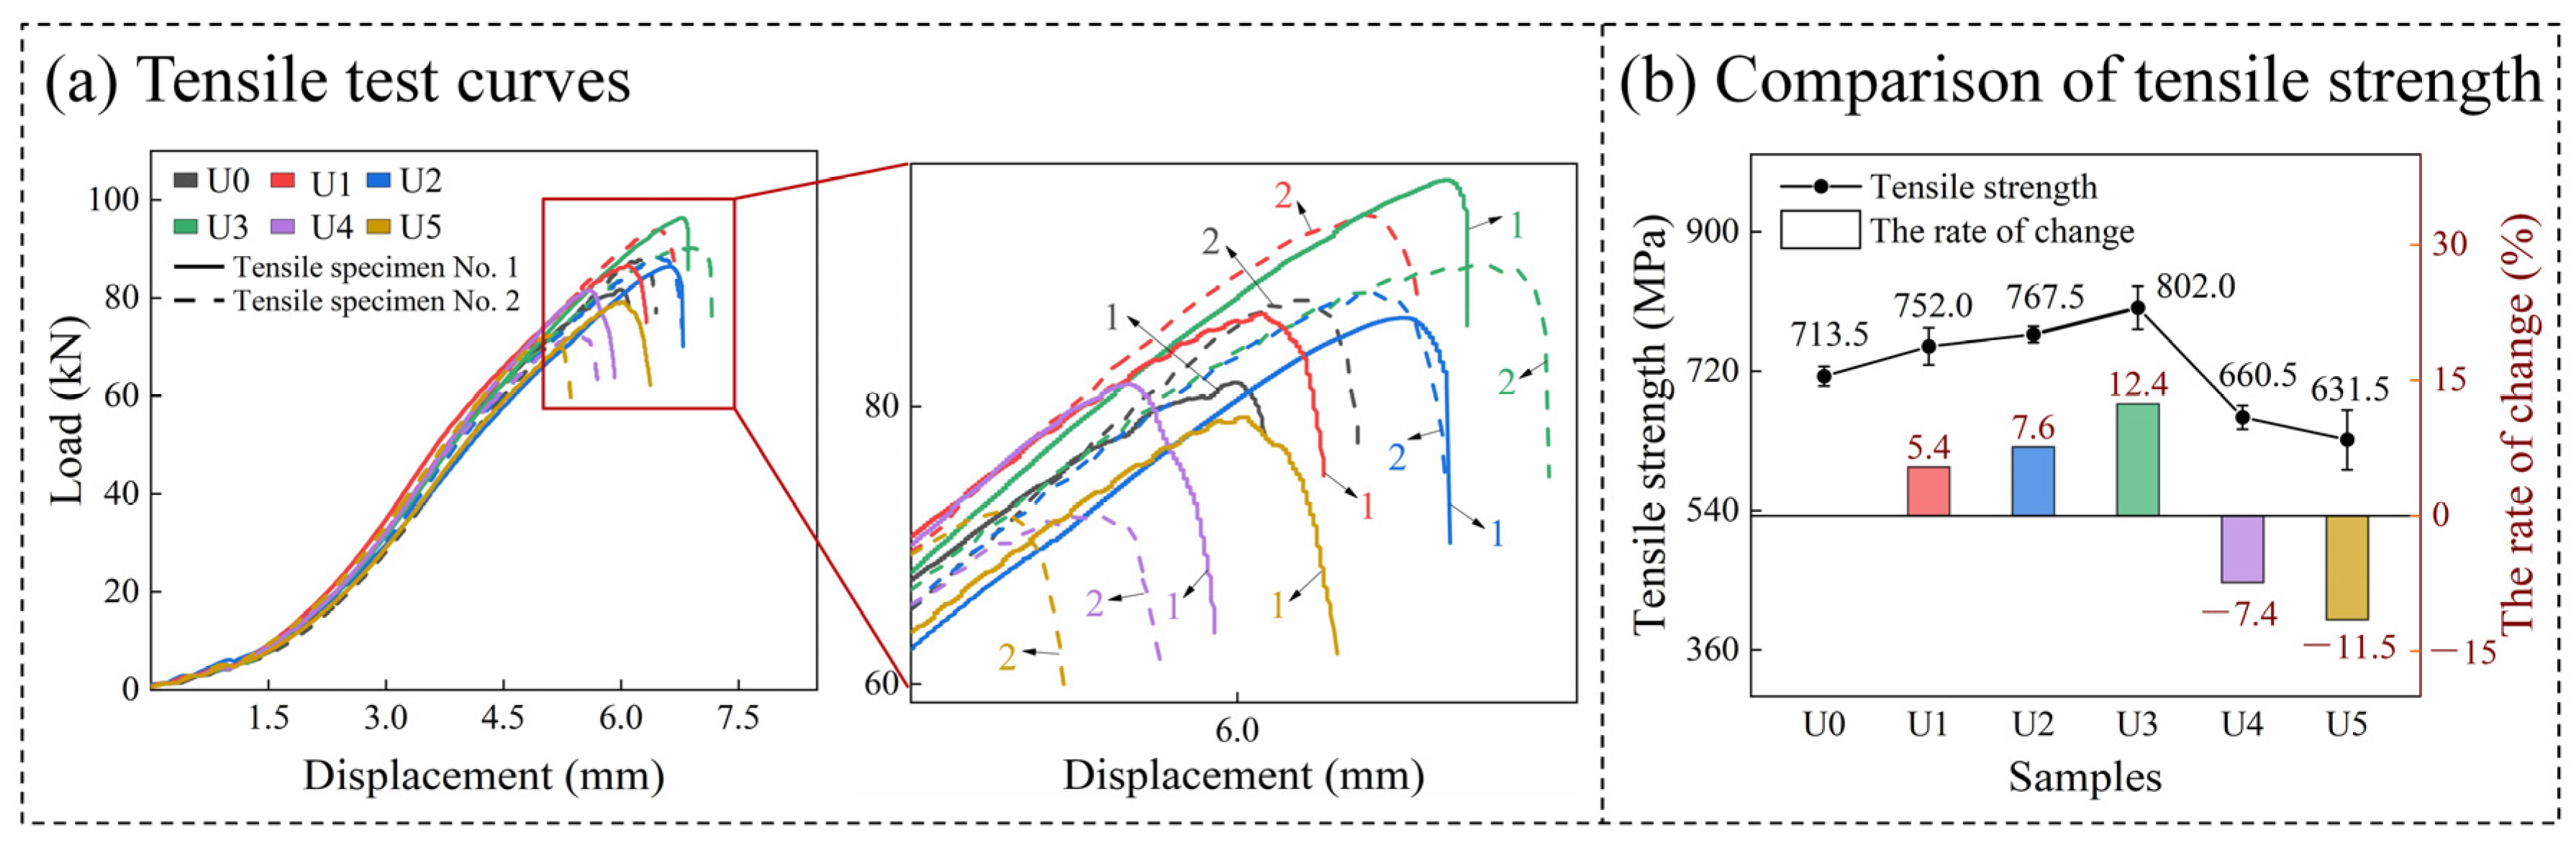
3.4. Tensile Test
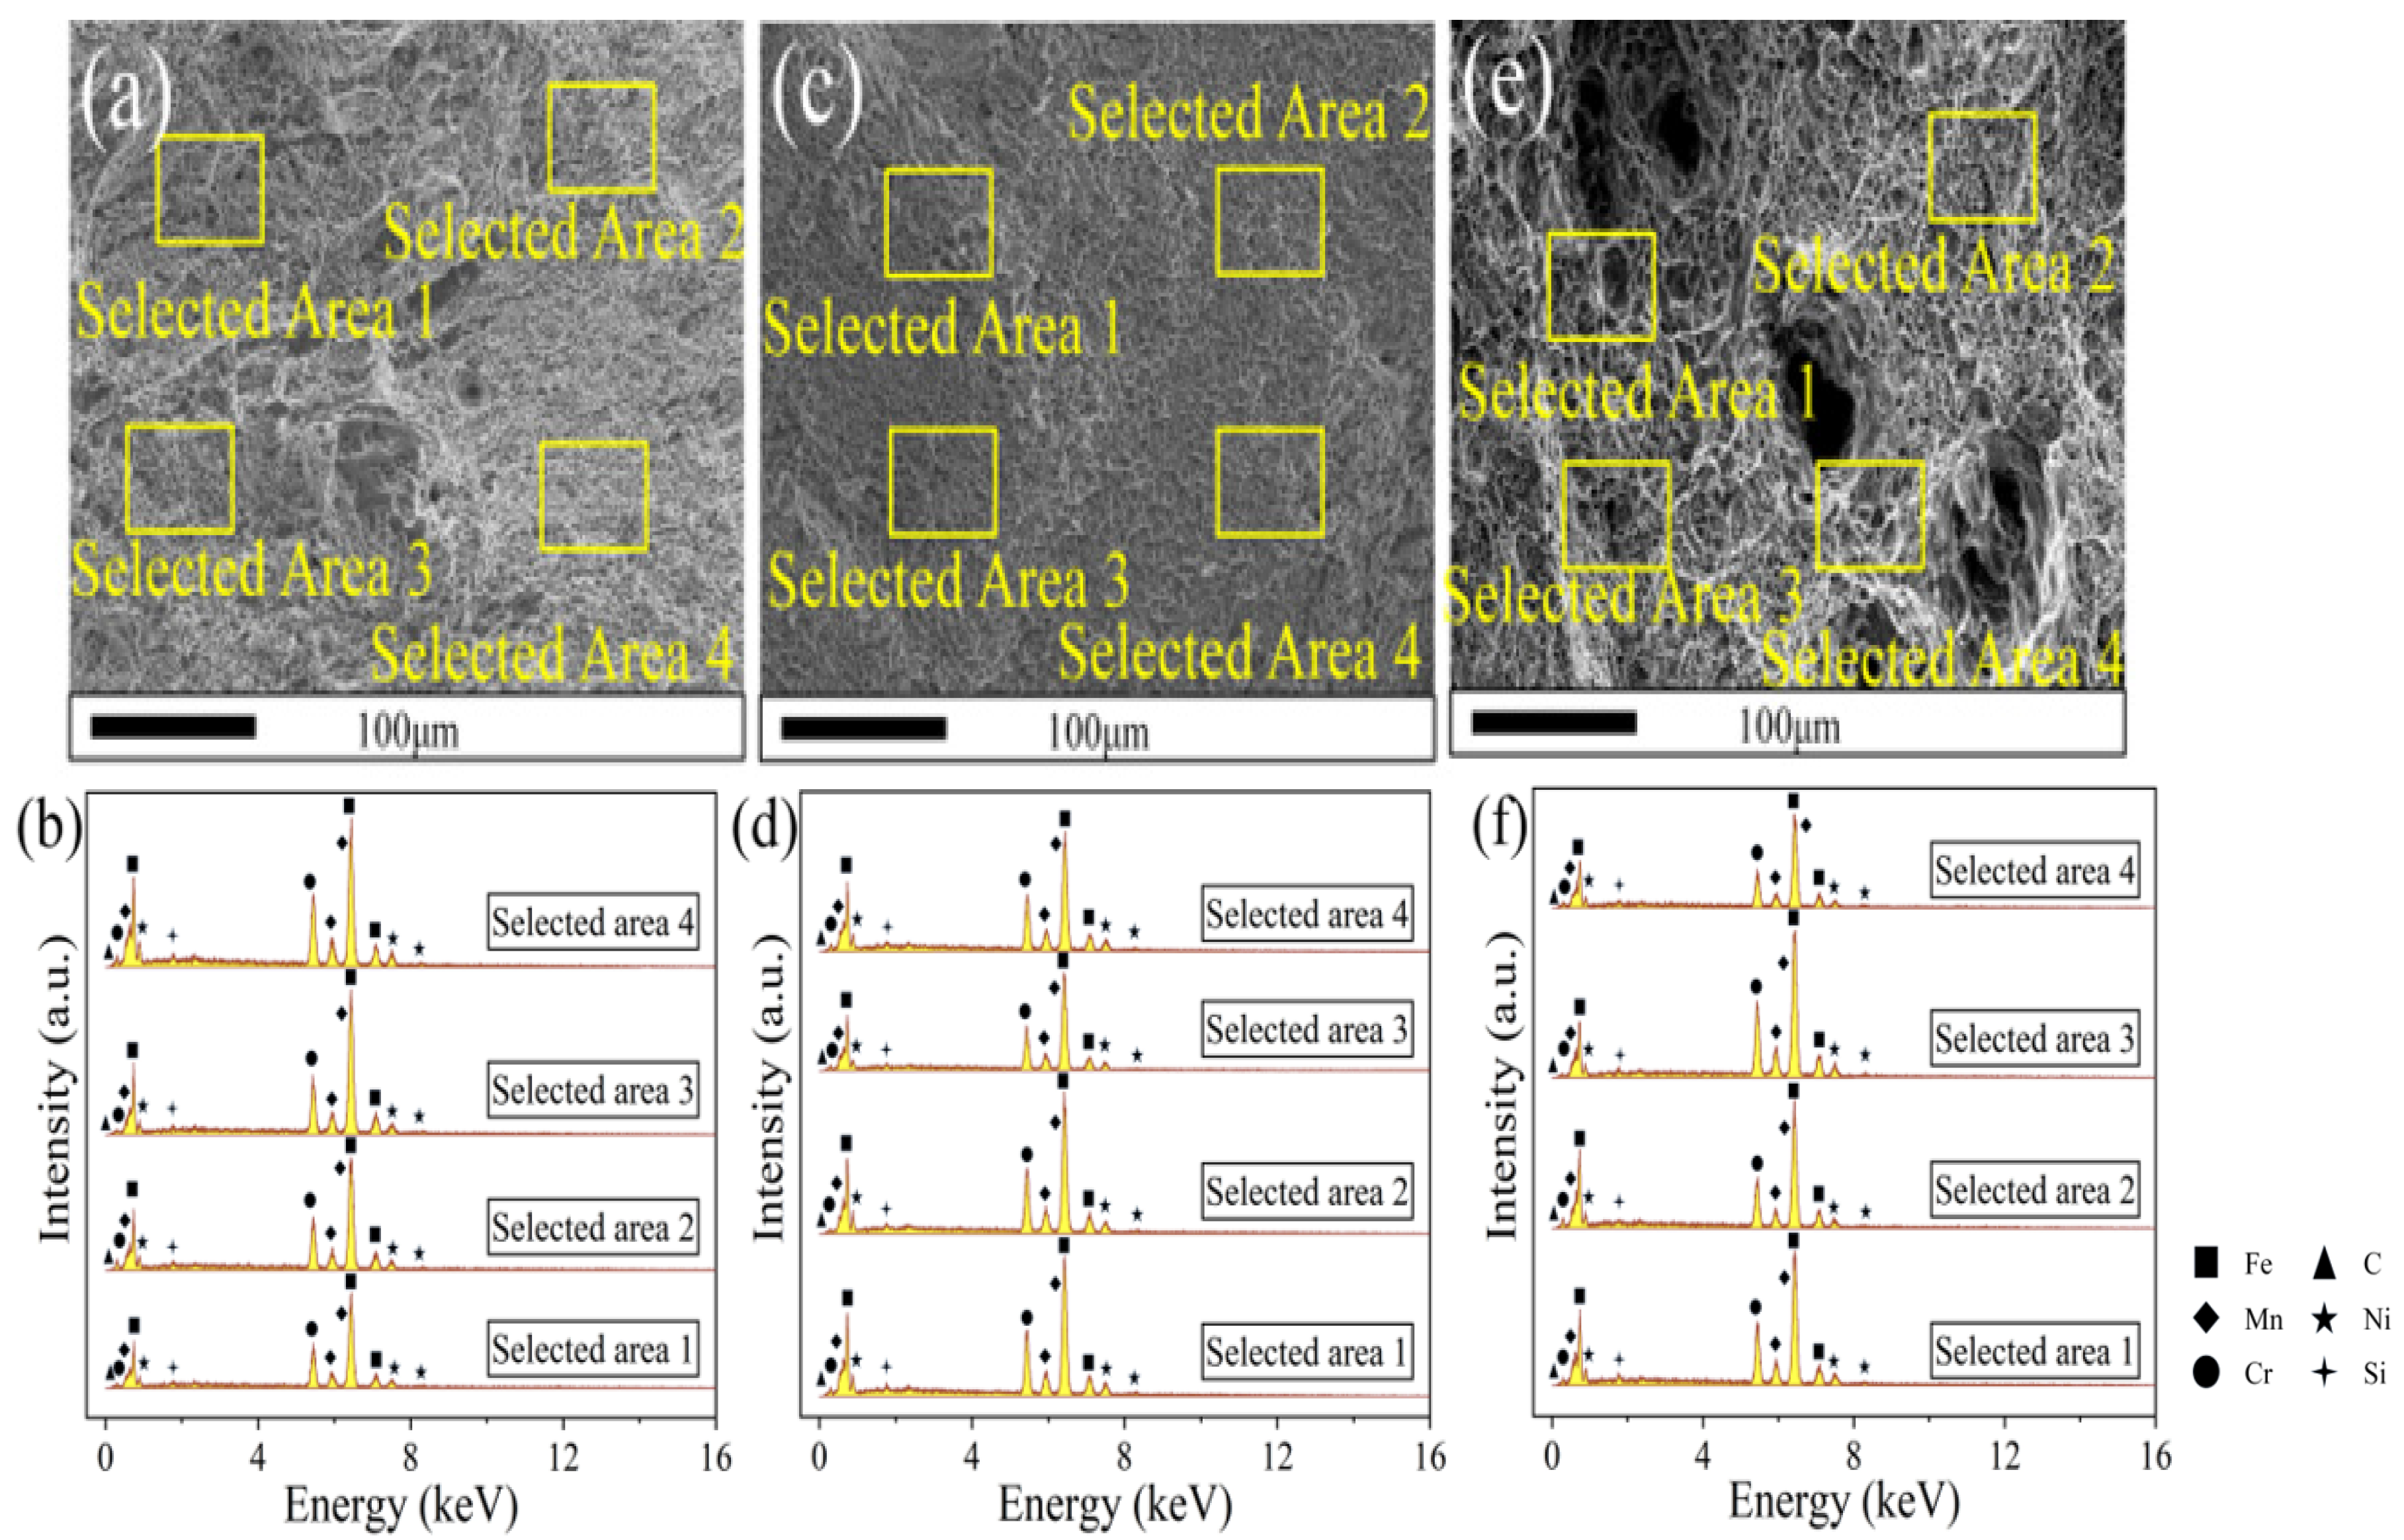
3.5. Analysis of Weld Element Content
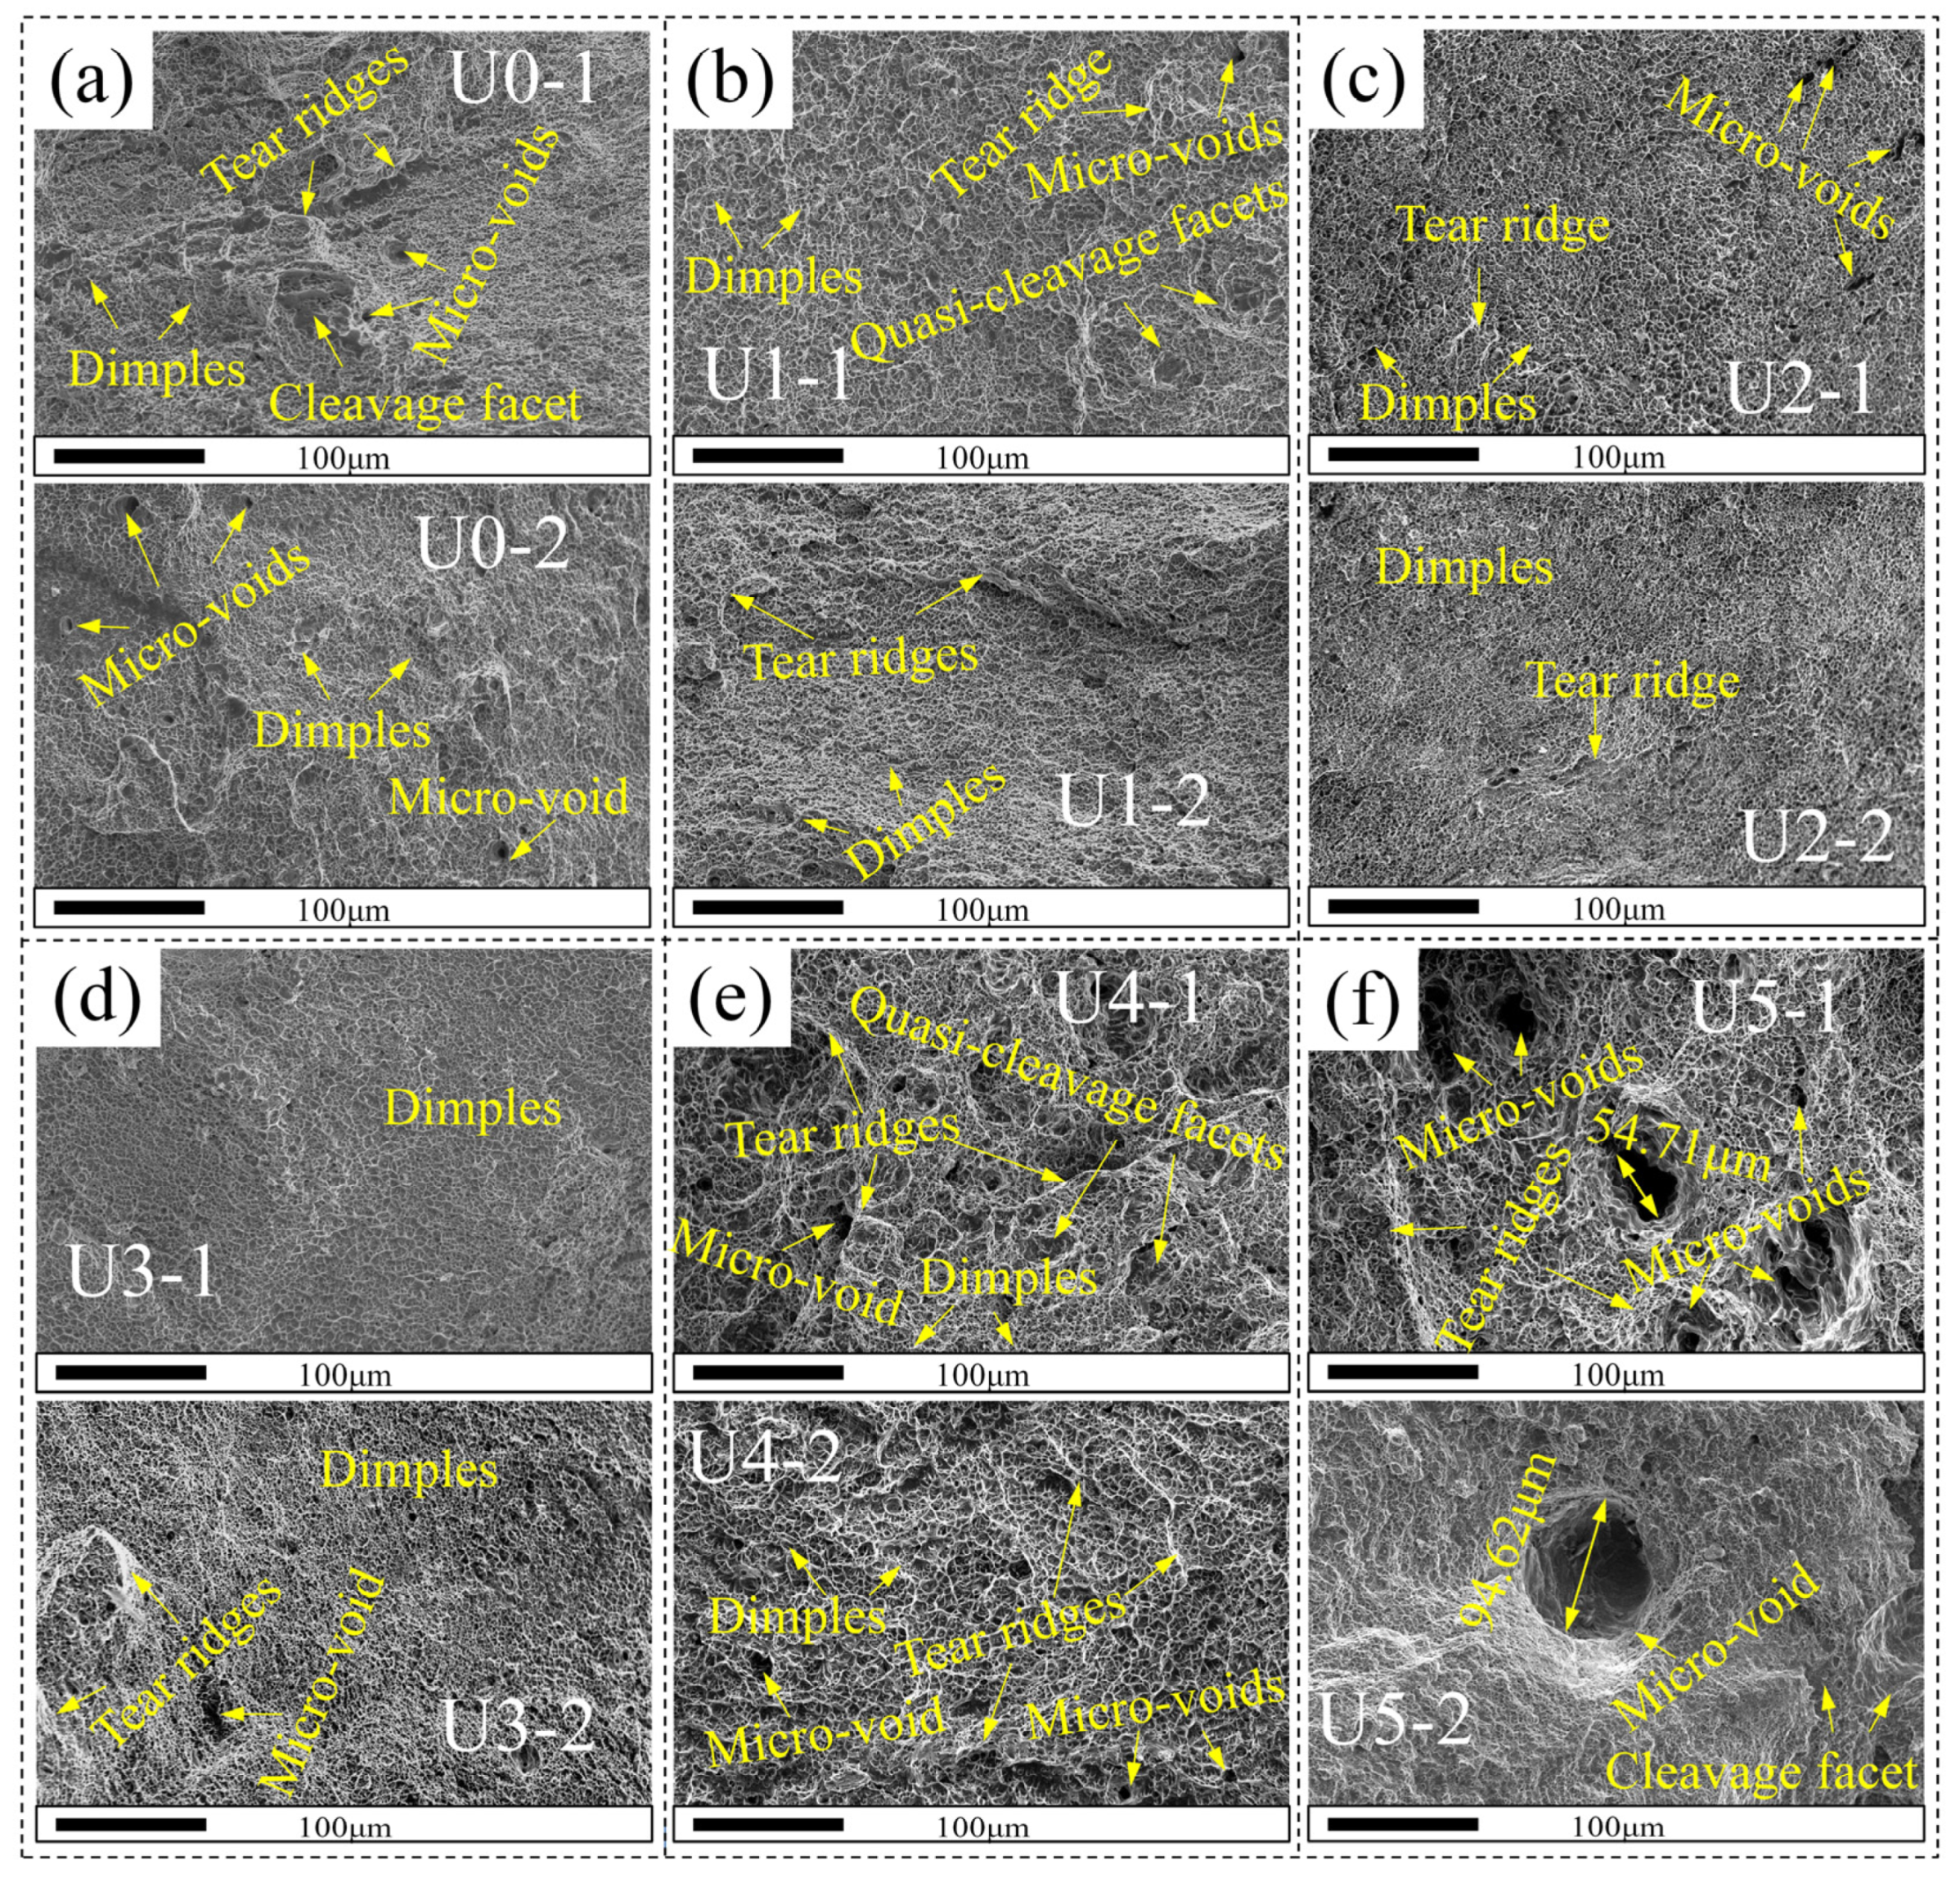
3.6. Impact Test
4. Conclusions
- (1)
- Ultrasonic wave has a significant influence on the surface-forming quality of a weld and the macroscopic morphology of the joint. With the increase of ultrasonic power, the weld pool spattering and the weld-forming quality will deteriorate. However, the use of ultrasonic waves can help increase the pool depth and can even help increase the pool width if the ultrasonic power is appropriate. Unfortunately, ultrasonic regulation will increase the HAZ width. The pool widths and HAZ widths are highly symmetric on both sides of an ultrasonic weld.
- (2)
- It is beneficial to improve the microstructure of welded joints by using the ultrasonic waves with appropriate power for weld regulation during welding. The ultrasonic regulation with appropriate power cannot only refine the grains in WZ and HAZ and distribute the WZ grains evenly but also regulate the segregation of weld metal elements—but with a weak effect. High ultrasonic power will make the microstructure worse.
- (3)
- In the six groups of welding experiments, the U3 weld zone has the best microhardness and impact resistance, as well as the highest tensile strength (802 MPa). The mechanical properties of the U1 and U2 weld zones are also improved to some extent, while those of the U4 and U5 weld zones are significantly degraded. However, the HAZs in the U4 and U5 states have the best microhardness and impact resistance. This also shows that different ultrasonic power can be used to regulate the welded joints with different performance requirements.
Author Contributions
Funding
Institutional Review Board Statement
Informed Consent Statement
Data Availability Statement
Acknowledgments
Conflicts of Interest
References
- Chen, J.S.; Gao, Y.L.; Sun, B.S.; An, K.; Zhou, B. Development status of foreign armor steel and its standards. J. Ord. Equip. Eng. 2020, 41, 1–9. Available online: http://qikan.cqvip.com/Qikan/Article/Detail?id=7103261261 (accessed on 17 November 2021).
- Huang, J.; Zhai, Z.Y.; Wang, K.H.; Song, K. Simulation and experiment on multi-pass welding of 616 armor steel with thick plate structure. Trans. China Weld. Institu. 2018, 39, 89–93. Available online: http://qikan.cqvip.com/Qikan/Article/Detail?id=676832185 (accessed on 20 November 2021).
- Zhu, M.; Zheng, Q.; Wu, W.; Qian, W.; Zhang, Y.; Wang, B. Influence of welding sequence on residual stress evolution in Incoloy825/X52 bimetallic clad plate butt-welded joints. Sci. Technol. Weld. Join. 2021, 26, 356–362. [Google Scholar] [CrossRef]
- Han, Y.Q.; Tong, J.H.; Hong, H.T.; Sun, Z.B. The influence of hybrid arc coupling mechanism on GMAW arc in VPPA-GMAW hybrid welding of aluminum alloys. Int. J. Adv. Manuf. Technol. 2019, 101, 989–994. [Google Scholar] [CrossRef]
- Xie, J.; Ma, Y.; Wang, M.; Li, H.; Fang, N.; Liu, K. Interfacial characteristics and residual welding stress distribution of K4750 and Hastelloy X dissimilar superalloys joints. J. Manuf. Process. 2021, 67, 253–261. [Google Scholar] [CrossRef]
- Naveen Kumar, S.; Balasubramanian, V.; Malarvizhi, S.; Hafeezur Rahman, A.; Balaguru, V. Influence of microstructural characteristics on ballistic performance and its mode of failure in shielded metal arc welded ultra-high hard armor steel joints. Trans. Indian Inst. Met. 2021, 74, 909–921. [Google Scholar] [CrossRef]
- Ragavendran, M.; Vasudevan, M. Effect of laser and hybrid laser welding processes on the residual stresses and distortion in AISI type 316L(N) stainless steel weld joints. Metall. Mater. Trans. B 2021, 52, 2582–2603. [Google Scholar] [CrossRef]
- Ingram, E.; Golan, O.; Haj-Ali, R.; Eliaz, N. The Effect of localized vibration during welding on the microstructure and mechanical behavior of steel welds. Materials 2019, 12, 2553. [Google Scholar] [CrossRef] [Green Version]
- Fairushin, A.M.; Kinev, S.A.; Zaripov, M.Z. Effect of vibration treatment during welding on technological strength of chromium martensitic steel P91. In IOP Conference Series: Materials Science and Engineering; IOP Publishing: Bristol, UK, 2021; Volume 1047, p. 012178. [Google Scholar]
- Khandaei, M.; Vahidshad, Y.; Ayaz, M. Improvement of weld quality in electromagnetic welding of aluminum-stainless steel sheets. Mater. Und Werkst. 2020, 51, 1372–1388. [Google Scholar] [CrossRef]
- Ayaz, M.; Khandaei, M.; Vahidshad, Y. Evaluating the electromagnetic welding parameters for improving the mechanical properties of Al–Cu joint. Arab. J. Sci. Eng. 2020, 45, 9619–9637. [Google Scholar] [CrossRef]
- Chen, C.; Zhou, H.; Wang, C.; Liu, L.; Zhang, K. Laser welding of ultra-high strength steel with different oscillating modes. J. Manuf. Process. 2021, 68, 761–769. [Google Scholar] [CrossRef]
- Li, J.Z.; Sun, Q.J.; Liu, Y.B.; Zhen, Z.Y.; Sun, Q.; Feng, J.C. Melt flow and microstructural characteristics in beam oscillation superimposed laser welding of 304 stainless steel. J. Manuf. Process. 2020, 50, 629–637. [Google Scholar] [CrossRef]
- Jiang, Z.G.; Chen, X.; Li, H.; Lei, Z.L.; Chen, Y.B.; Wu, S.B.; Wang, Y.H. Grain refinement and laser energy distribution during laser oscillating welding of Invar alloy. Mater. Design 2020, 186, 108195. [Google Scholar] [CrossRef]
- Chen, Z.; Li, X.; Gao, M. Effects of circular oscillating beam on heat transfer and melt flow of laser melting pool. J. Mater. Res. Technol. 2020, 9, 9271–9282. [Google Scholar]
- Shi, C.; Shen, K.; Mao, D.; Zhou, Y.; Li, F. Effects of ultrasonic treatment on microstructure and mechanical properties of 6016 aluminium alloy. Mater. Sci. Technol. 2018, 34, 1511–1518. [Google Scholar] [CrossRef]
- Liu, Z.; Li, R.; Jiang, R.; Zhang, L.; Li, X. Scalable ultrasound-assisted casting of ultra-large 2219 Al alloy ingots. Metall. Mater. Trans. A 2019, 50, 1146–1152. [Google Scholar] [CrossRef]
- Ye, L.; Zhu, X.; He, Y.; Song, T. Effect of frequency ratio and phase difference on the dynamic behavior of a cavitation bubble induced by dual-frequency ultrasound. Chem. Eng. Process. 2021, 165, 108448. [Google Scholar] [CrossRef]
- Lei, Y.C.; Xue, H.L.; Hu, W.X.; Liu, Z.Z.; Yan, J.C. Effect of arc ultrasonic vibration on microstructure of joint of plasma arc ‘in situ’ welding of SiCp/6061Al. Sci. Technol. Weld. Join. 2013, 16, 575–580. [Google Scholar] [CrossRef]
- Sun, Q.J.; Lin, S.B.; Yang, C.L.; Zhao, G.Q. Penetration increase of AISI 304 using ultrasonic assisted tungsten inert gas welding. Sci. Technol. Weld. Join. 2013, 14, 765–767. [Google Scholar] [CrossRef]
- Xie, W.; Fan, C.; Yang, C.; Lin, S. Effect of acoustic field parameters on arc acoustic binding during ultrasonic wave-assisted arc welding. Ultrason. Sonochemistry 2016, 29, 476–484. [Google Scholar] [CrossRef]
- Lei, Z.; Bi, J.; Li, P.; Li, Q.; Chen, Y.; Zhang, D. Melt flow and grain refining in ultrasonic vibration assisted laser welding process of AZ31B magnesium alloy. Opt. Laser Technol. 2018, 108, 409–417. [Google Scholar] [CrossRef]
- Chen, C.; Fan, C.; Cai, X.; Liu, Z.; Lin, S.; Yang, C. Arc characteristics and weld appearance in pulsed ultrasonic assisted GTAW process. Results Phys. 2019, 15, 102692. [Google Scholar] [CrossRef]
- Chen, C.; Fan, C.; Cai, X.; Lin, S.; Yang, C.; Zhuo, Y. Microstructure and mechanical properties of Q235 steel welded joint in pulsed and un-pulsed ultrasonic assisted gas tungsten arc welding. J. Mater. Process. Technol. 2020, 275, 116335. [Google Scholar] [CrossRef]
- Liu, J.; Zhu, H.; Li, Z.; Cui, W.; Shi, Y. Effect of ultrasonic power on porosity, microstructure, mechanical properties of the aluminum alloy joint by ultrasonic assisted laser-MIG hybrid welding. Opt. Laser Technol. 2019, 119, 105619. [Google Scholar] [CrossRef]
- Chinnam, R.K.; Fauteux, C.; Neuenschwander, J.; Janczak-Rusch, J. Evolution of the microstructure of Sn–Ag–Cu solder joints exposed to ultrasonic waves during solidification. Acta Mater. 2011, 59, 1474–1481. [Google Scholar] [CrossRef]
- Dai, W.L. Effects of high-intensity ultrasonic-wave emission on the weldability of aluminum alloy 7075-T6. Mater. Lett. 2003, 57, 2447–2454. [Google Scholar] [CrossRef]
- Dong, H.; Yang, L.; Dong, C.; Kou, S. Improving arc joining of Al to steel and Al to stainless steel. MAT Sci. Eng. A 2012, 534, 424–435. [Google Scholar] [CrossRef]
- Tan, A.T.; Tan, A.W.; Yusof, F. Influence of high-power-low-frequency ultrasonic vibration time on the microstructure and mechanical properties of lead-free solder joints. J. Mater. Process. Technol. 2016, 238, 8–14. [Google Scholar] [CrossRef]
- Yang, F.; Zhou, J.; Ding, R. Ultrasonic vibration assisted tungsten inert gas welding of dissimilar magnesium alloys. J. Mater. Sci. Technol. 2018, 34, 2240–2245. [Google Scholar] [CrossRef]
- Lan, H.X.; Gong, X.F.; Zhang, S.F.; Wang, L.; Wang, B.; Nie, L.P. Ultrasonic vibration assisted tungsten inert gas welding of dissimilar metals 316L and L415. Int. J. Min. Met. Mater. 2020, 27, 943–953. [Google Scholar] [CrossRef]
- Zhao, G.; Wang, Z.; Hu, S.; Duan, S.; Chen, Y. Effect of ultrasonic vibration of molten pool on microstructure and mechanical properties of Ti-6Al-4V joints prepared via CMT + P welding. J. Manuf. Process. 2020, 52, 193–202. [Google Scholar] [CrossRef]
- Padhy, G.K.; Wu, C.S.; Gao, S.; Shi, L. Local microstructure evolution in Al 6061-T6 friction stir weld nugget enhanced by ultrasonic vibration. Mater. Design 2016, 92, 710–723. [Google Scholar] [CrossRef]
- Jian, X.; Xu, H.; Meek, T.T. Effect of power ultrasound on solidification of aluminum A356 alloy. Mater. Lett. 2005, 59, 190–193. [Google Scholar] [CrossRef]
- Kumar, S.; Wu, C.S.; Padhy, G.K.; Ding, W. Application of ultrasonic vibrations in welding and metal processing: A status review. J. Manuf. Process. 2017, 26, 295–322. [Google Scholar] [CrossRef]
- Liu, X.; Wu, C.; Padhy, G.K. Characterization of plastic deformation and material flow in ultrasonic vibration enhanced friction stir welding. Scripta Mater. 2015, 102, 95–98. [Google Scholar] [CrossRef]
- Fan, Y.Y.; Fan, C.L.; Yang, C.L.; Liu, W.G.; Lin, S.B. Research on short circuiting transfer mode of ultrasonic assisted GMAW method. Sci. Technol. Weld. Join. 2013, 17, 186–191. [Google Scholar] [CrossRef]
- Du, J.; Chen, F. Cavitation dynamics and flow aggressiveness in ultrasonic cavitation erosion. Int. J. Mech. Sci. 2021, 204, 106545. [Google Scholar] [CrossRef]
- Zhang, C.L.; Wu, M.S.; Du, J.L. Improving weld quality by arc-excited ultrasonic treatment. Tsinghua Sci. Technol. 2001, 6, 475–478. [Google Scholar]
- Pocwiardowski, P.; Lasota, H.; Ravn, C. Near boundary acoustic streaming in Ni-Fe alloy electrodeposition control. Acta Acust. United Acust. 2005, 91, 365–371. [Google Scholar]
- Wang, Y.; Wang, Y.T.; Li, R.D.; Niu, P.D.; Wang, M.B.; Yuan, T.C.; Li, K. Hall-Petch relationship in selective laser melting additively manufactured metals: Using grain or cell size? J. Cent. South. Univ. 2021, 28, 1043–1057. [Google Scholar] [CrossRef]
- Ye, H.; Ye, K.; Guo, B.G.; Le, F.B.; Wei, C.; Sun, X.; Wang, G.Y.; Liu, Y. Effects of combining ultrasonic micro-forging treatment with laser metal wire deposition on microstructural and mechanical properties in Ti–6Al–4V alloy. Mater. Charact. 2020, 162, 110187. [Google Scholar] [CrossRef]
- Vasantharaja, P.; Vasudevan, M.; Palanichamy, P. Effect of welding processes on the residual stress and distortion in type 316LN stainless steel weld joints. J. Manuf. Process. 2015, 19, 187–193. [Google Scholar] [CrossRef]


| Material | C | Si | Mn | P | S | Cr | Ni | Mo | Nb |
|---|---|---|---|---|---|---|---|---|---|
| Base material | 0.27–0.31 | 0.20–0.35 | 0.20–0.35 | ≤0.015 | ≤0.008 | 0.60–1.00 | 0.60–0.85 | 0.15–0.30 | 0.02–0.06 |
| Welding wire | 0.04–0.14 | 0.65–1.00 | 6.50–8.00 | ≤0.030 | ≤0.030 | 18.50–22.00 | 8.00–10.75 | ≤0.75 | — |
| Parameters | Value |
|---|---|
| Base metal thickness (mm) | 5 |
| Welding current (A) | 200 |
| Welding voltage (V) | 22 |
| Welding speed (mm/s) | 5 |
| Gas flow (L/min) | 15 |
| Gas ratio | 95% Ar + 5% CO2 |
| wire extension (mm) | 15 |
Publisher’s Note: MDPI stays neutral with regard to jurisdictional claims in published maps and institutional affiliations. |
© 2022 by the authors. Licensee MDPI, Basel, Switzerland. This article is an open access article distributed under the terms and conditions of the Creative Commons Attribution (CC BY) license (https://creativecommons.org/licenses/by/4.0/).
Share and Cite
Yin, P.; Xu, C.; Pan, Q.; Zhang, W.; Jiang, X. Effect of Different Ultrasonic Power on the Properties of RHA Steel Welded Joints. Materials 2022, 15, 768. https://doi.org/10.3390/ma15030768
Yin P, Xu C, Pan Q, Zhang W, Jiang X. Effect of Different Ultrasonic Power on the Properties of RHA Steel Welded Joints. Materials. 2022; 15(3):768. https://doi.org/10.3390/ma15030768
Chicago/Turabian StyleYin, Peng, Chunguang Xu, Qinxue Pan, Wenjun Zhang, and Xiaowei Jiang. 2022. "Effect of Different Ultrasonic Power on the Properties of RHA Steel Welded Joints" Materials 15, no. 3: 768. https://doi.org/10.3390/ma15030768
APA StyleYin, P., Xu, C., Pan, Q., Zhang, W., & Jiang, X. (2022). Effect of Different Ultrasonic Power on the Properties of RHA Steel Welded Joints. Materials, 15(3), 768. https://doi.org/10.3390/ma15030768