
The Object Segmentation from the Microstructure of a FSW Dissimilar Weld

 ,
,  ,
,  and
and
Abstract
:1. Introduction
- We present a new approach based on computer vision algorithms to segment layers occurring in the welding joint after applying the FSW method.
- We propose a methodology for object detection and analysis in multiple microstructure layers.
- The result of the application of a new type of the FSW tool (dual-speed) is also presented below.
- We compare and estimate the correlation between the feature importance and domain knowledge.
1.1. Motivation
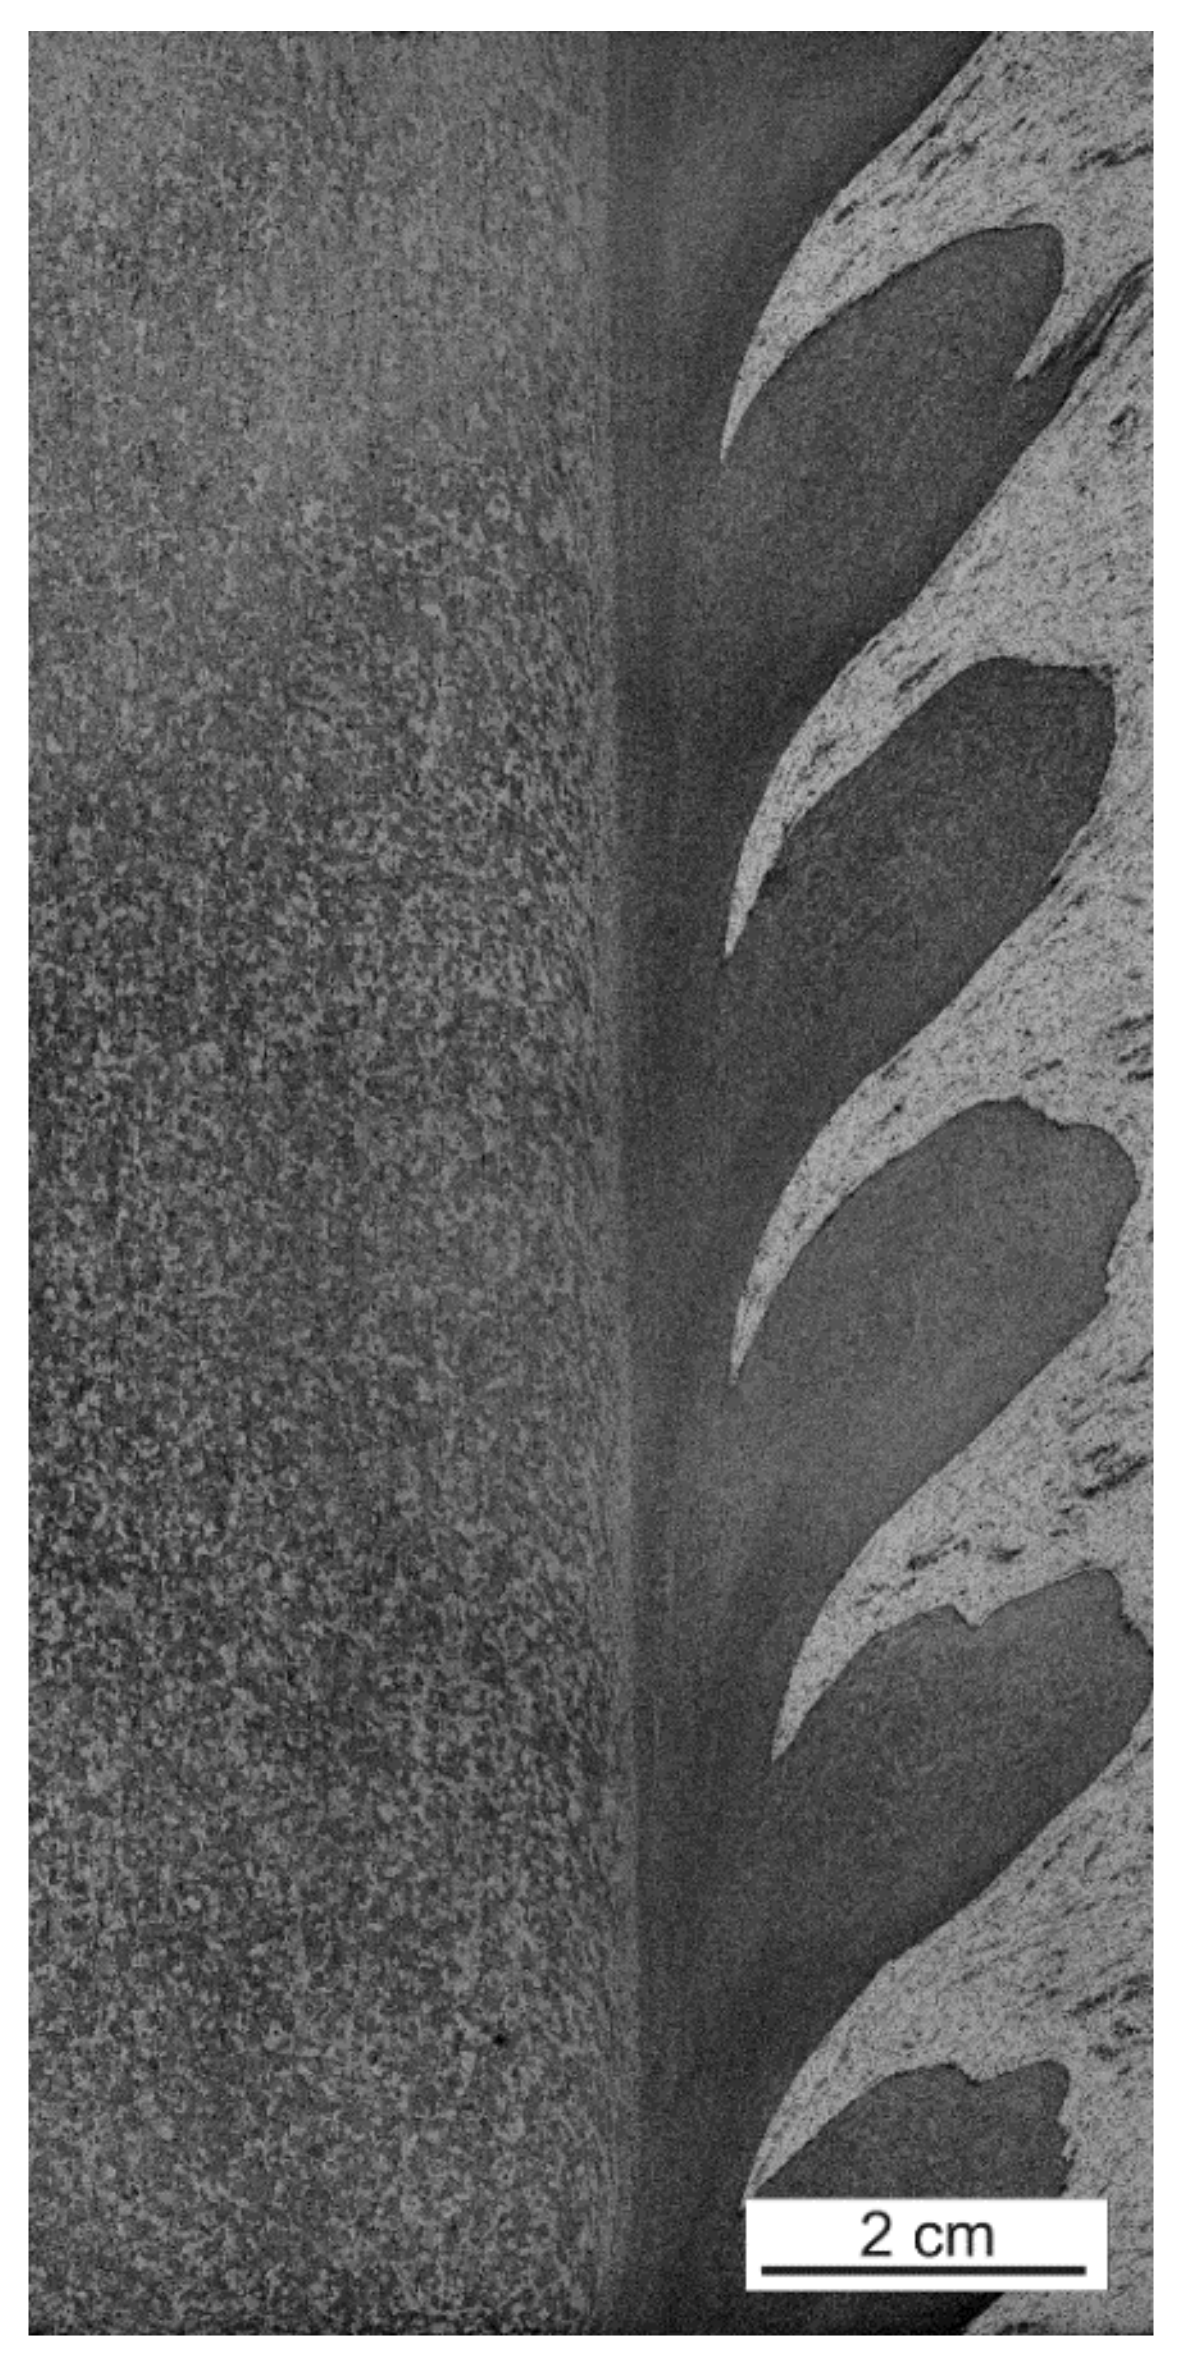
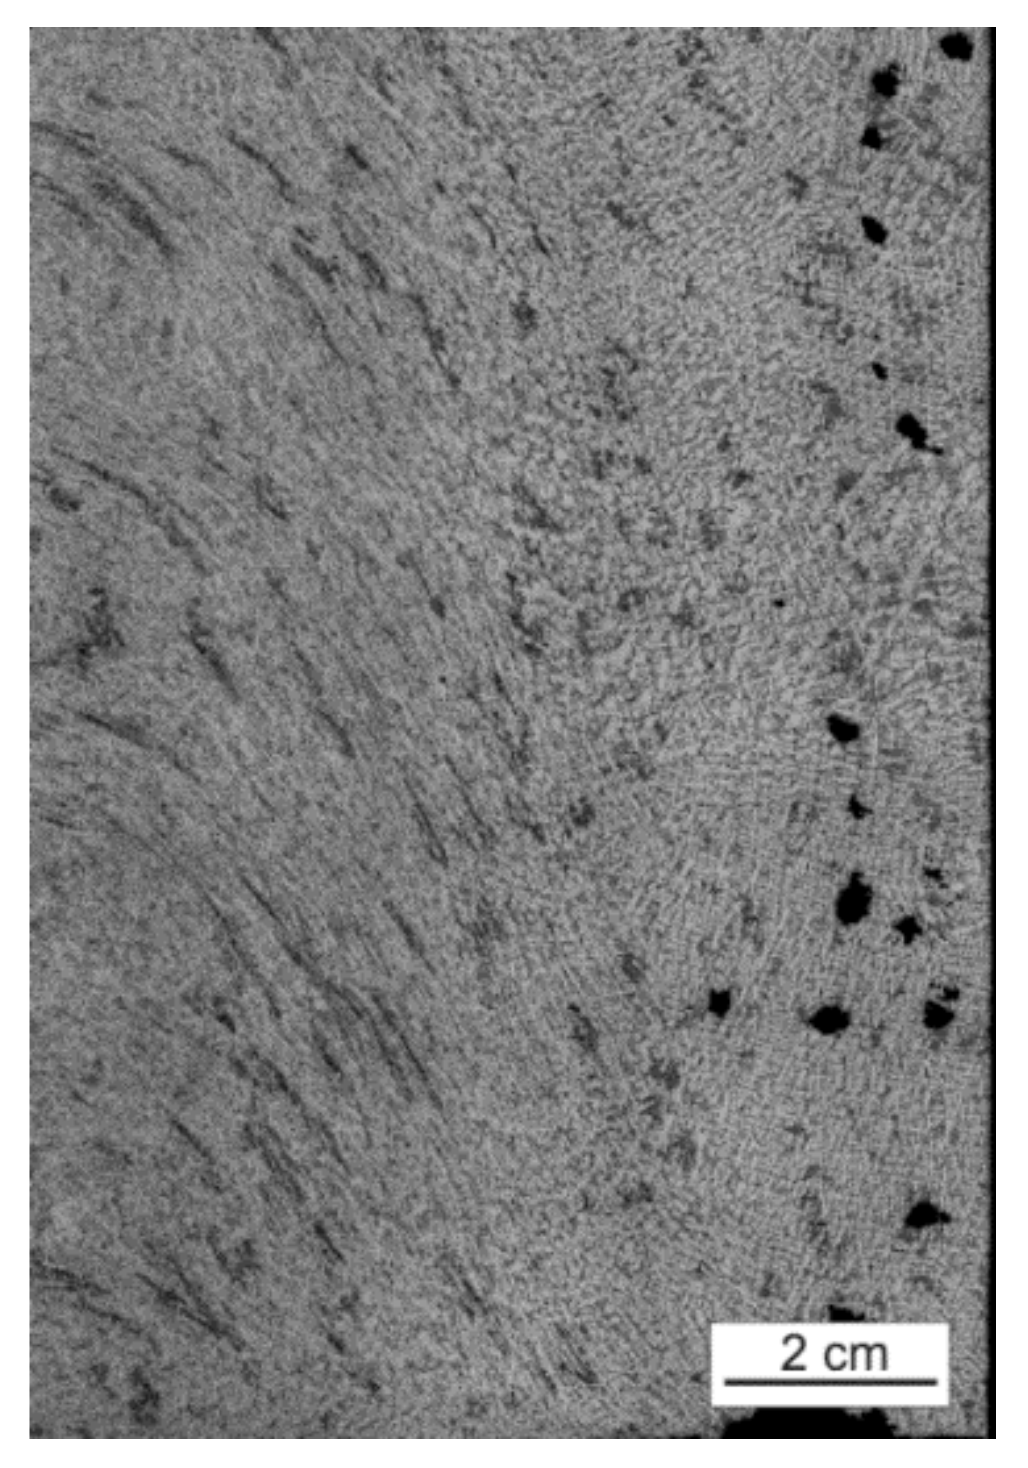
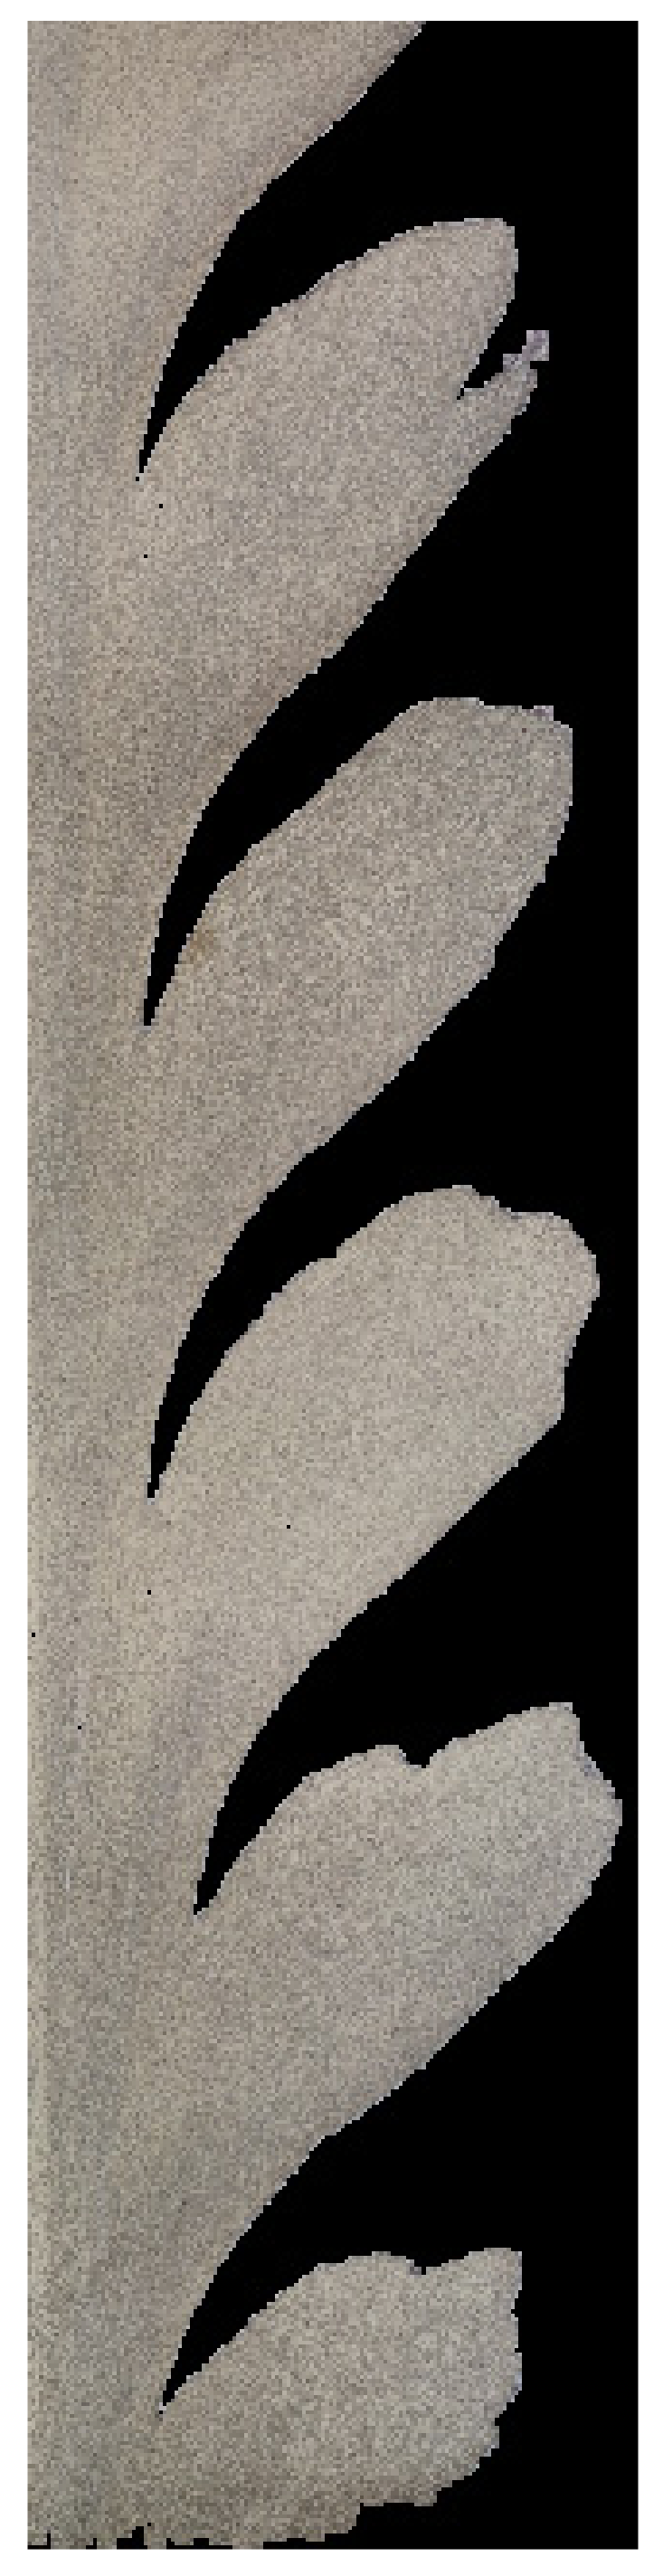
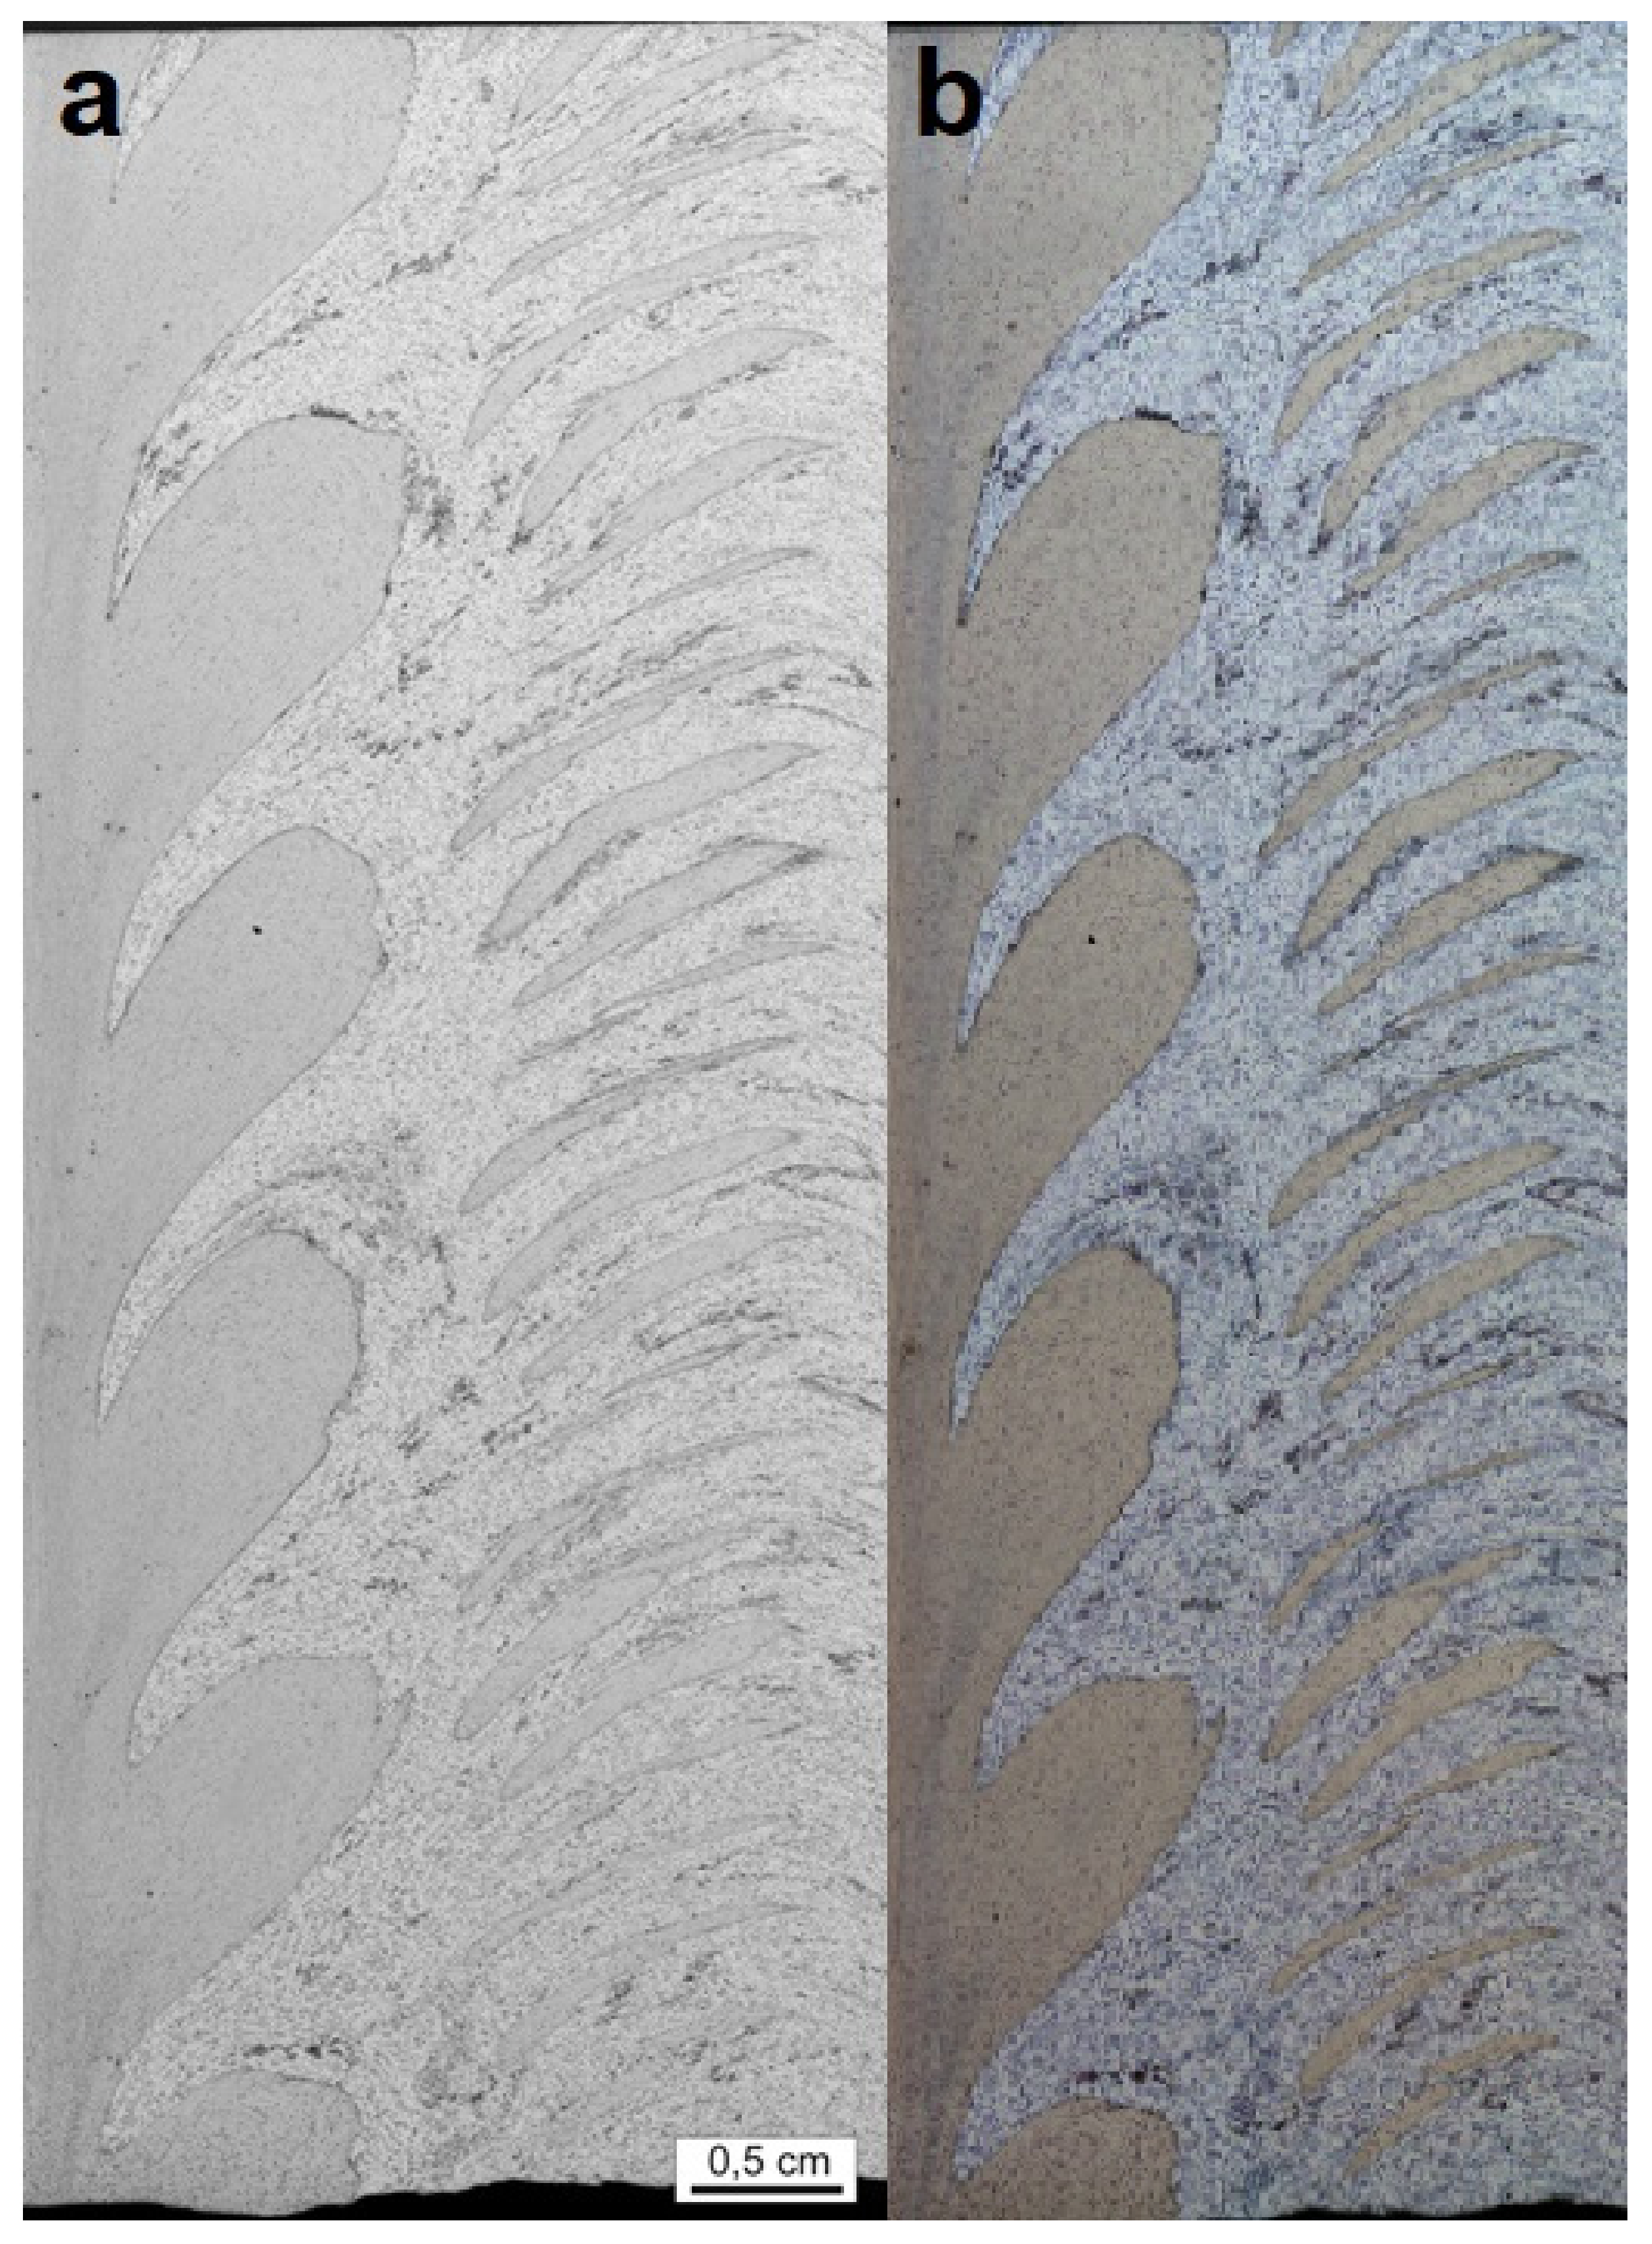
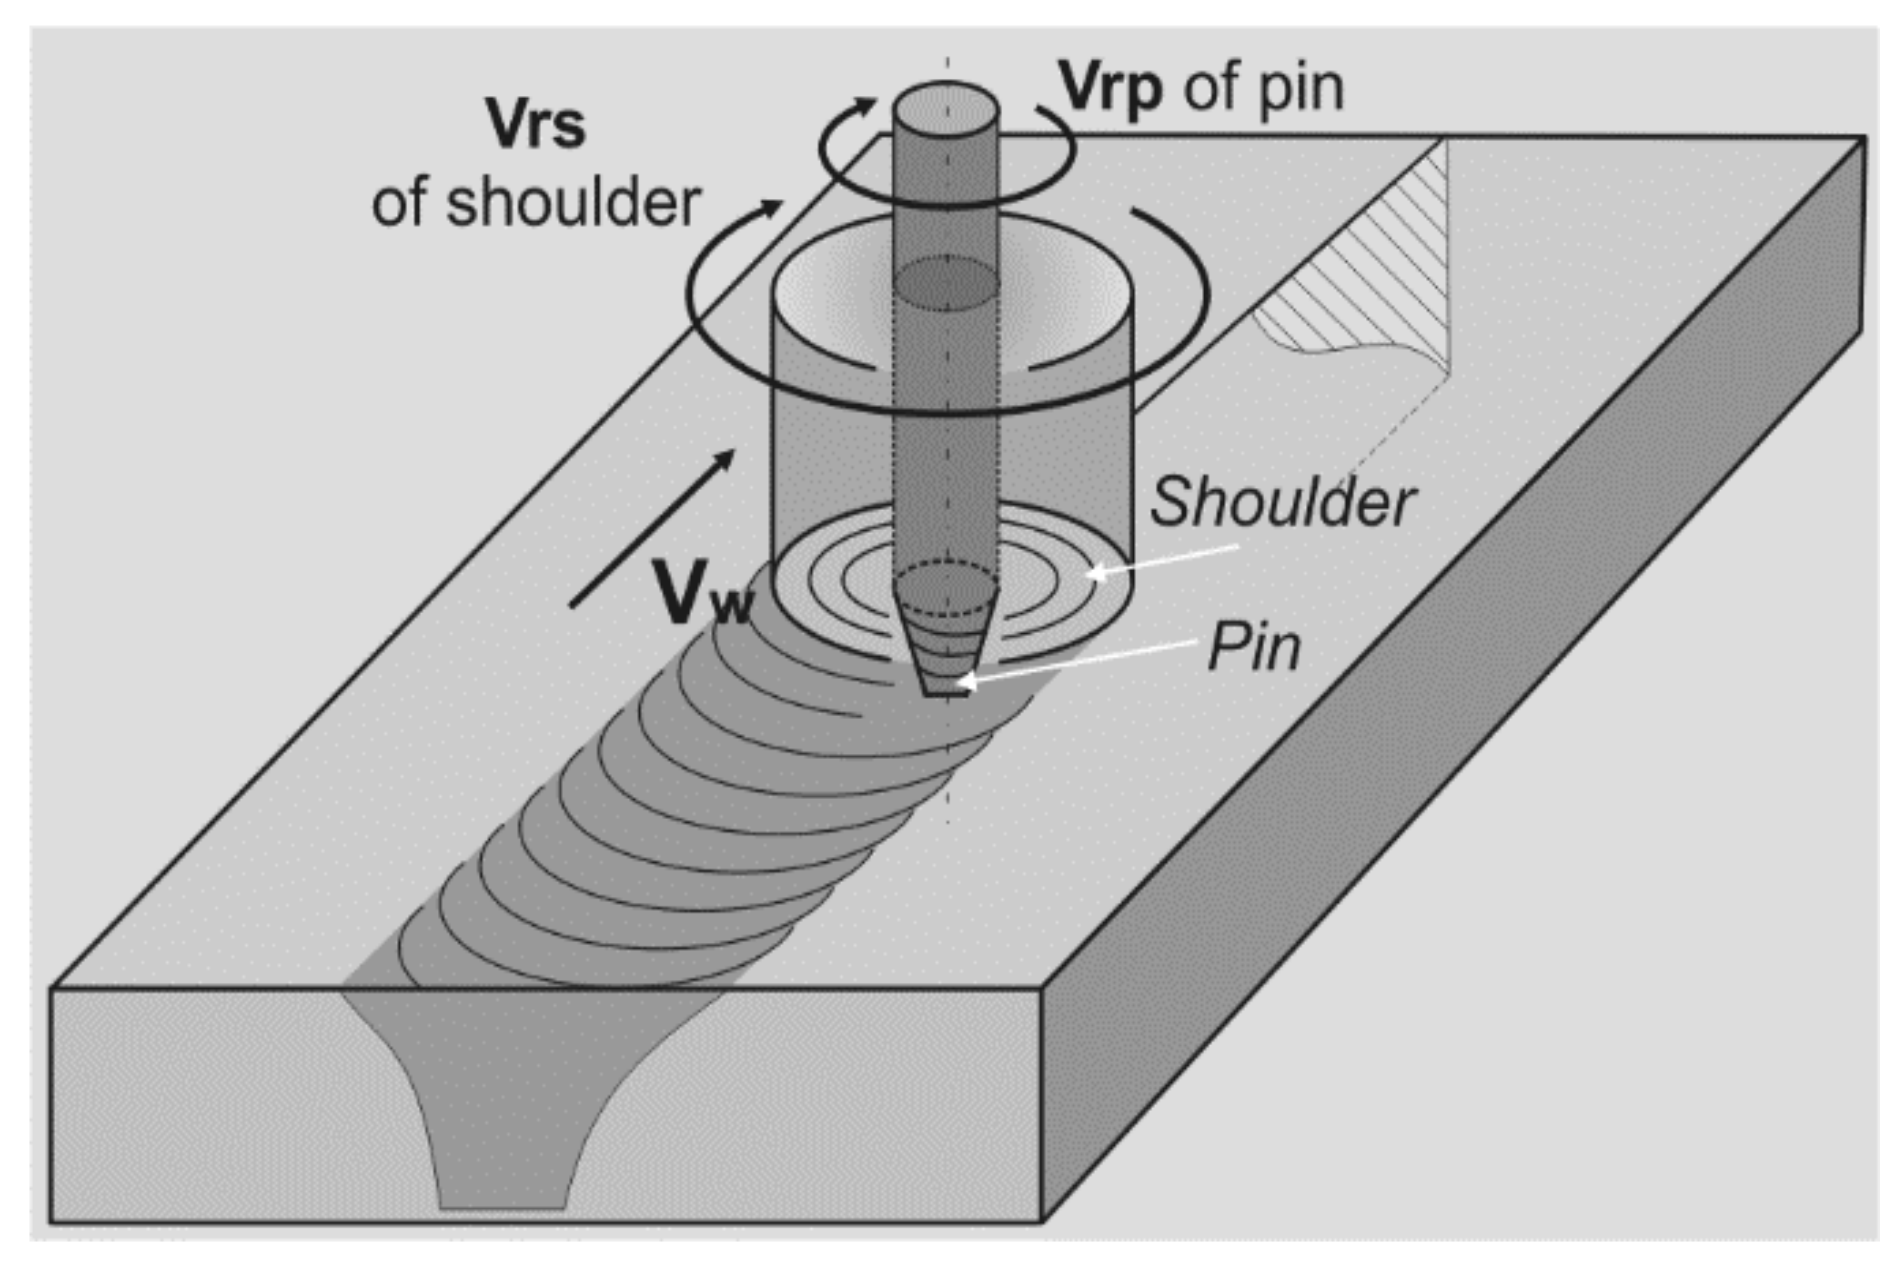
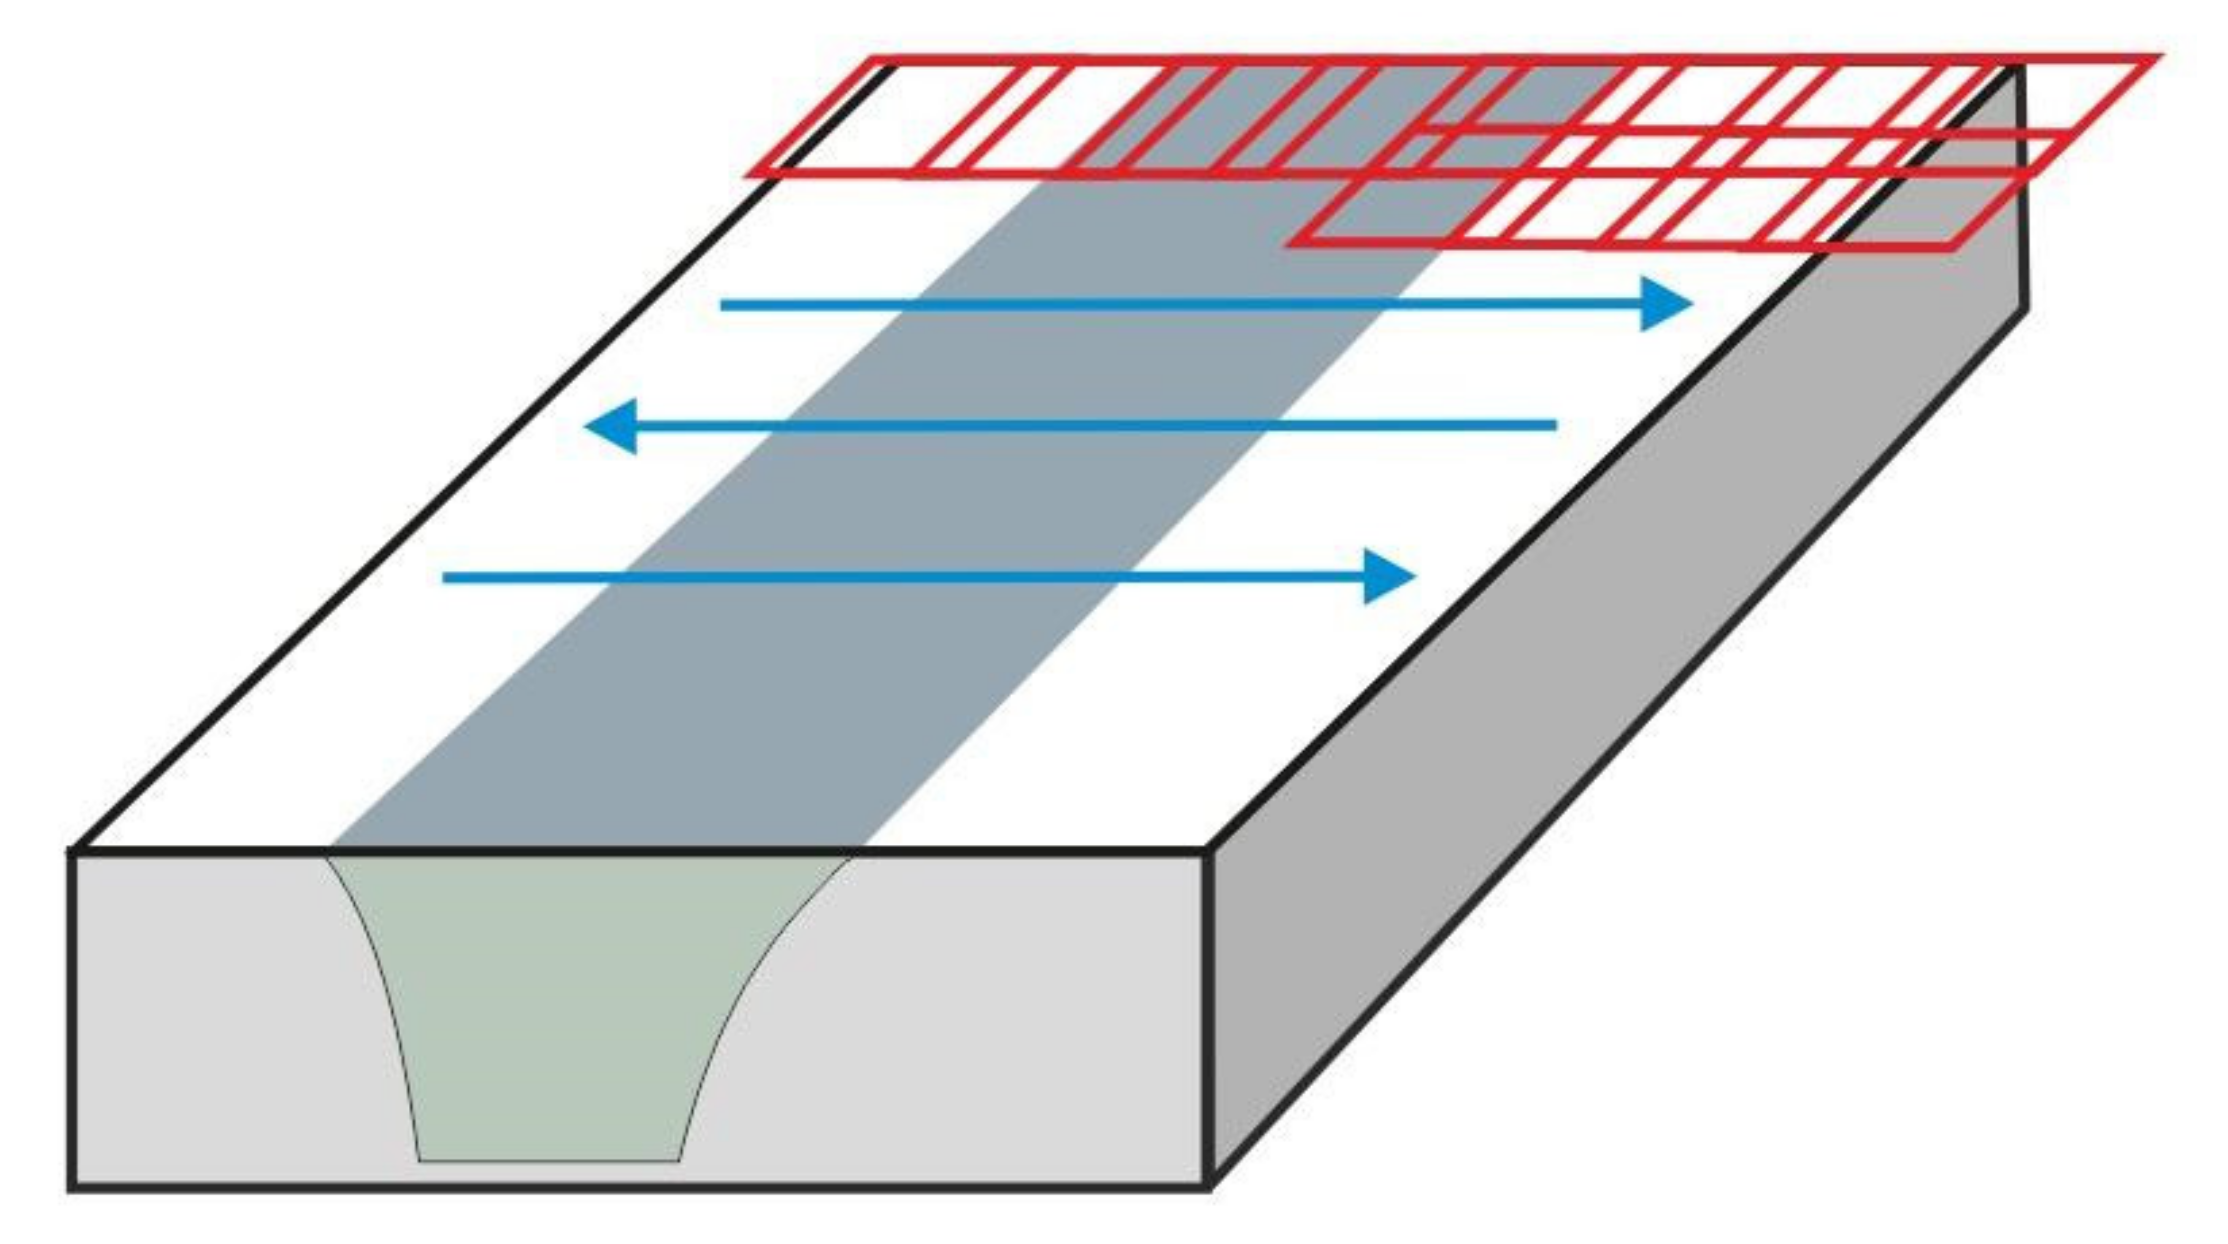
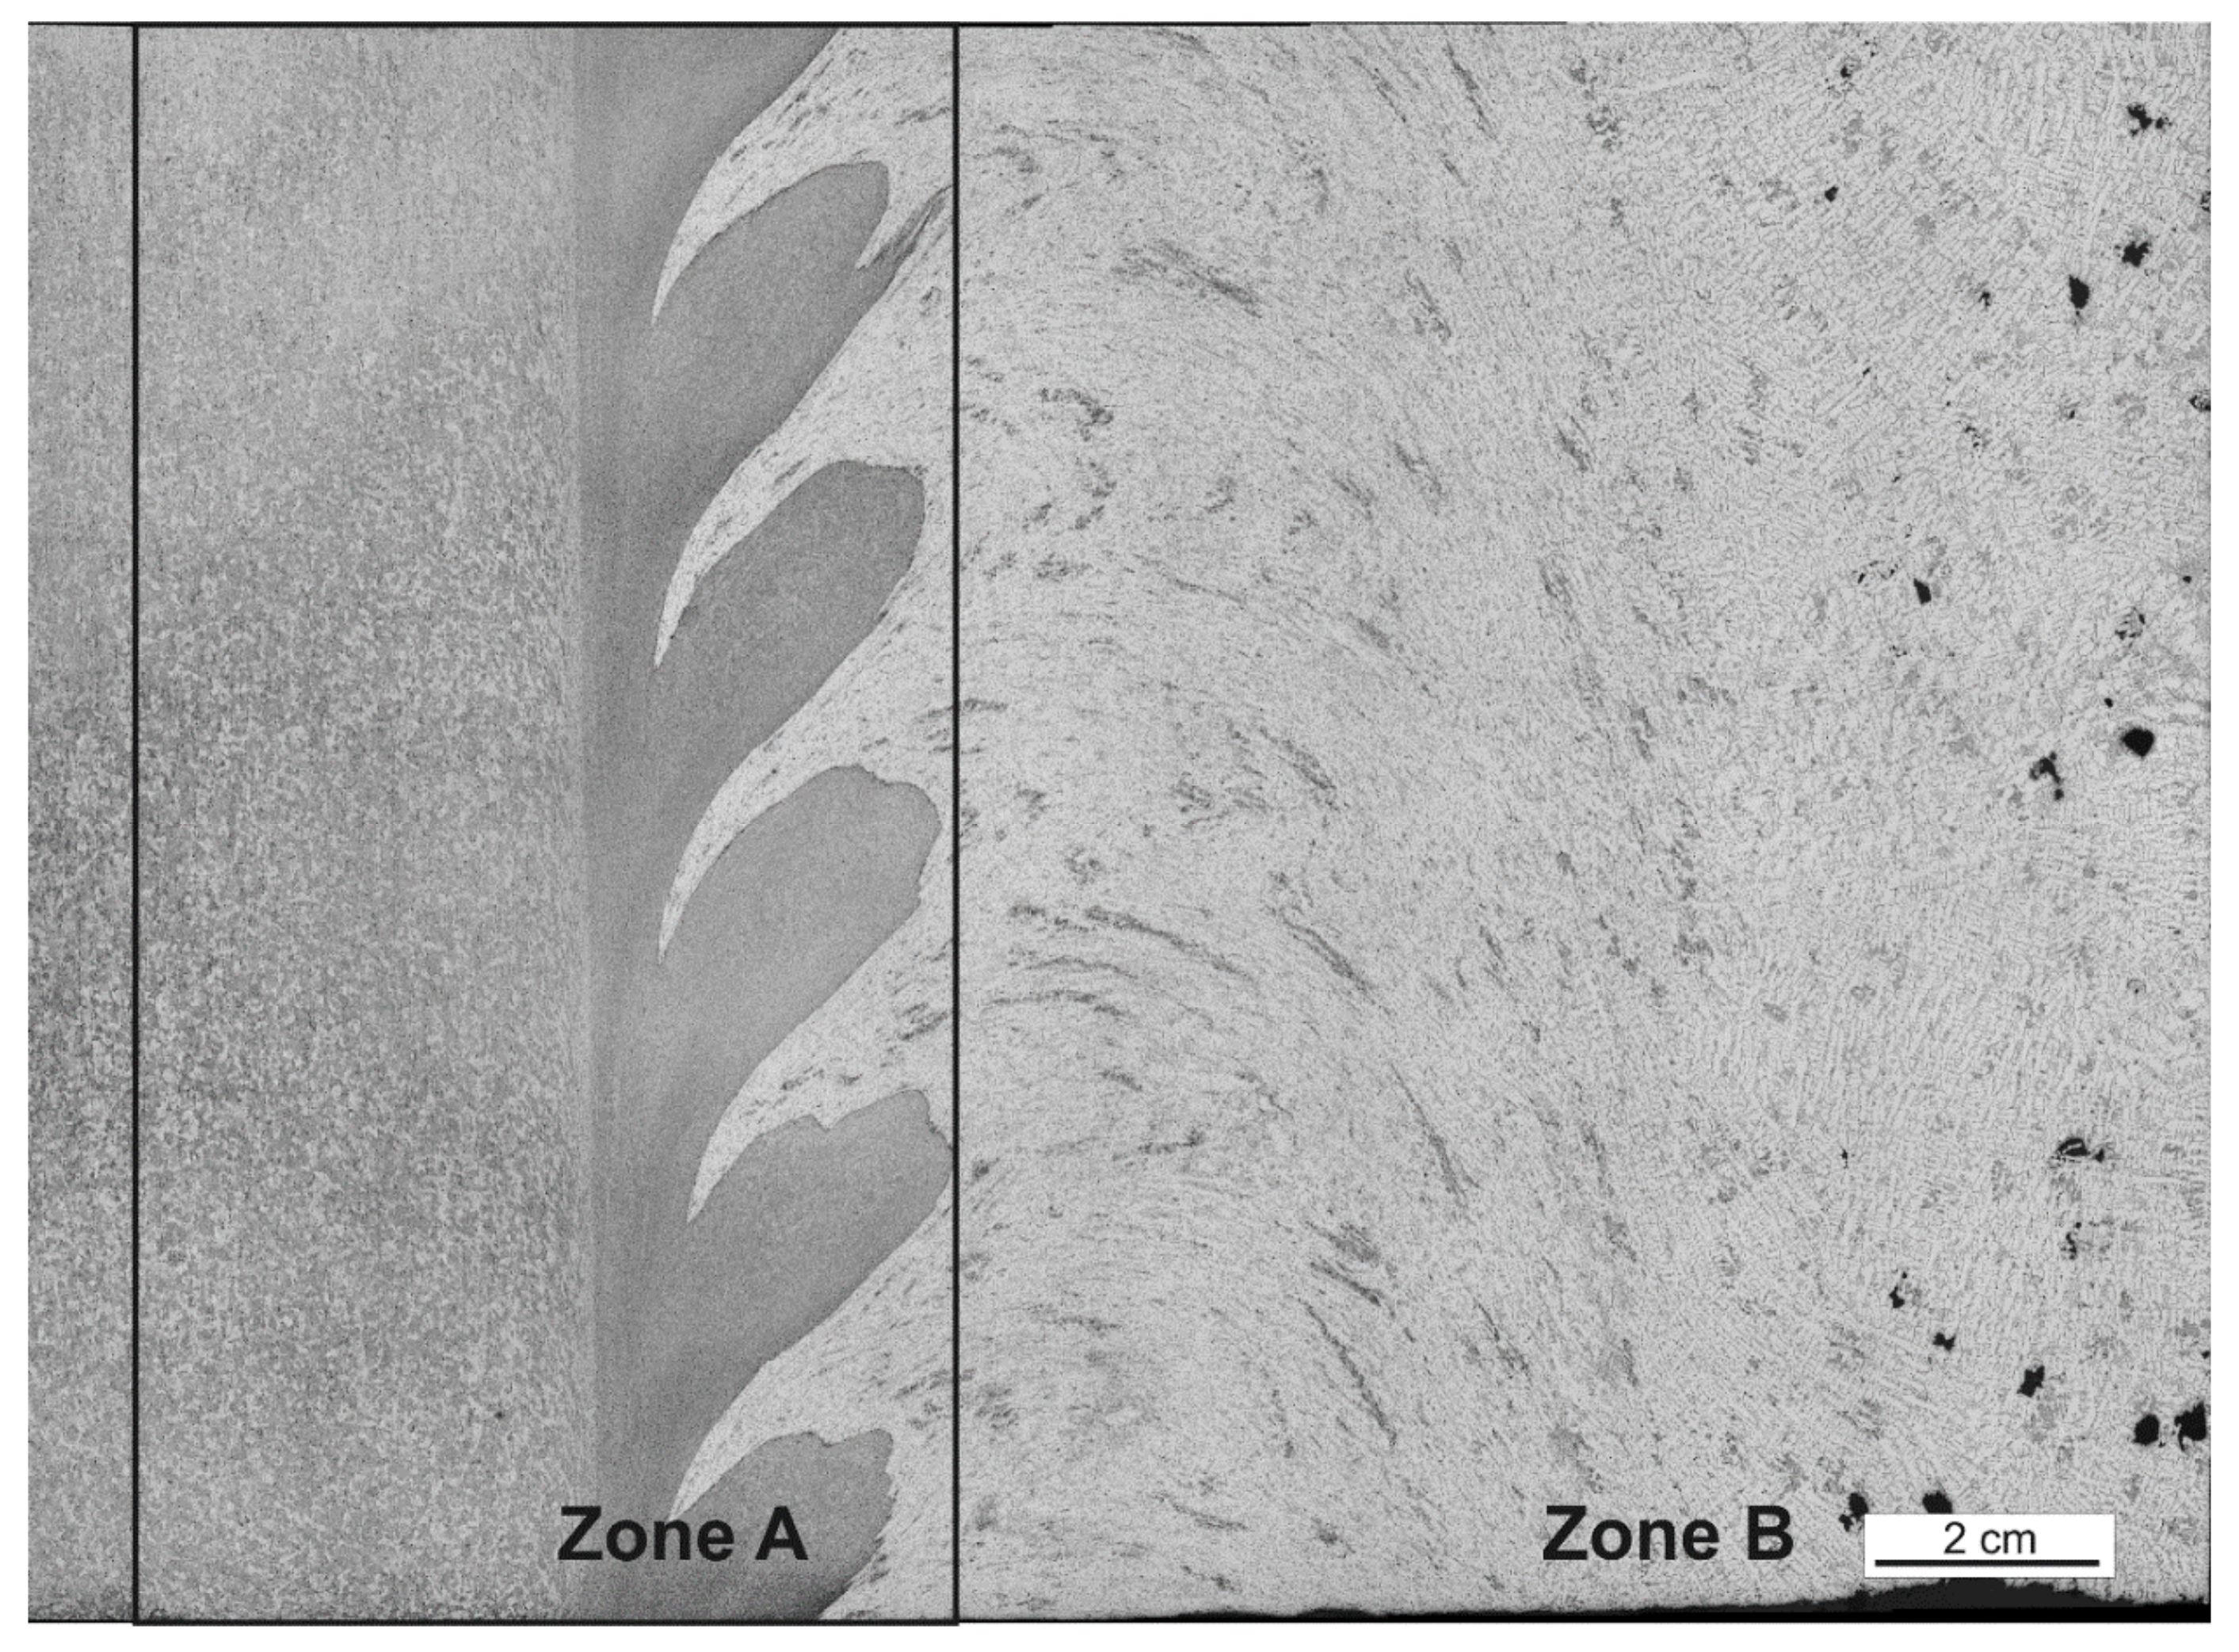
1.2. FSW Weld Images Specification
2. Weld Joint Analysis Framework
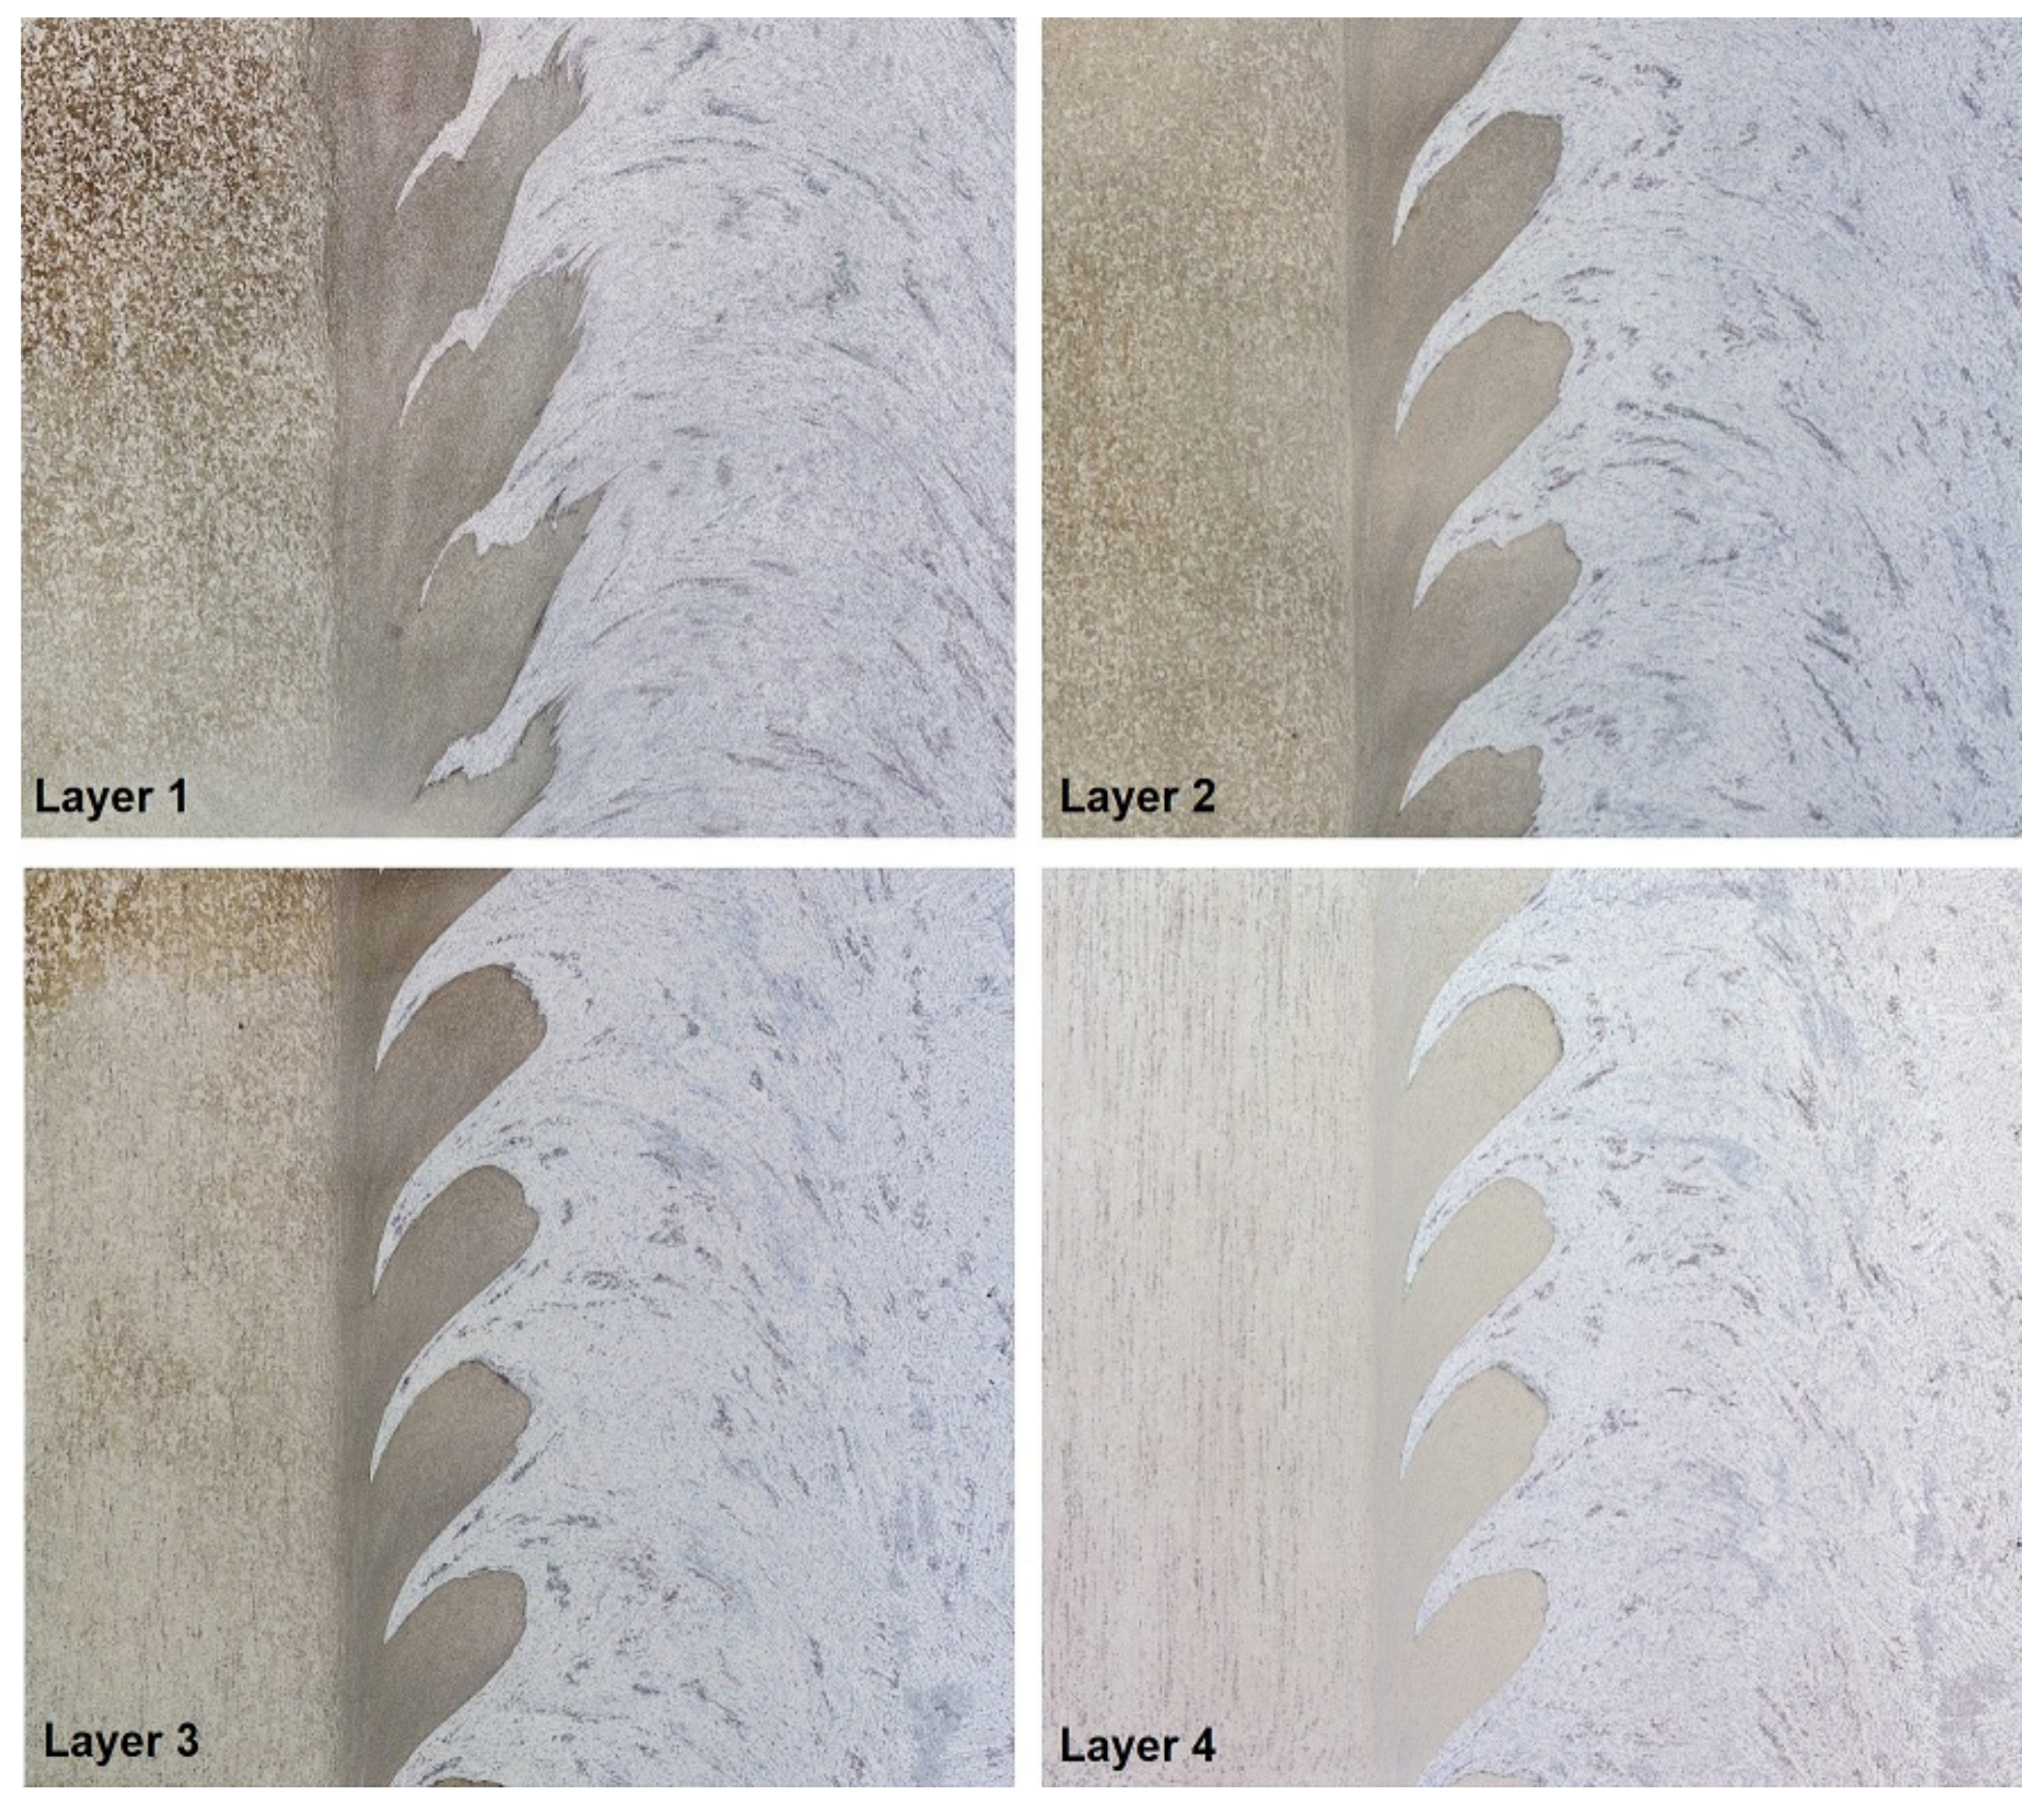
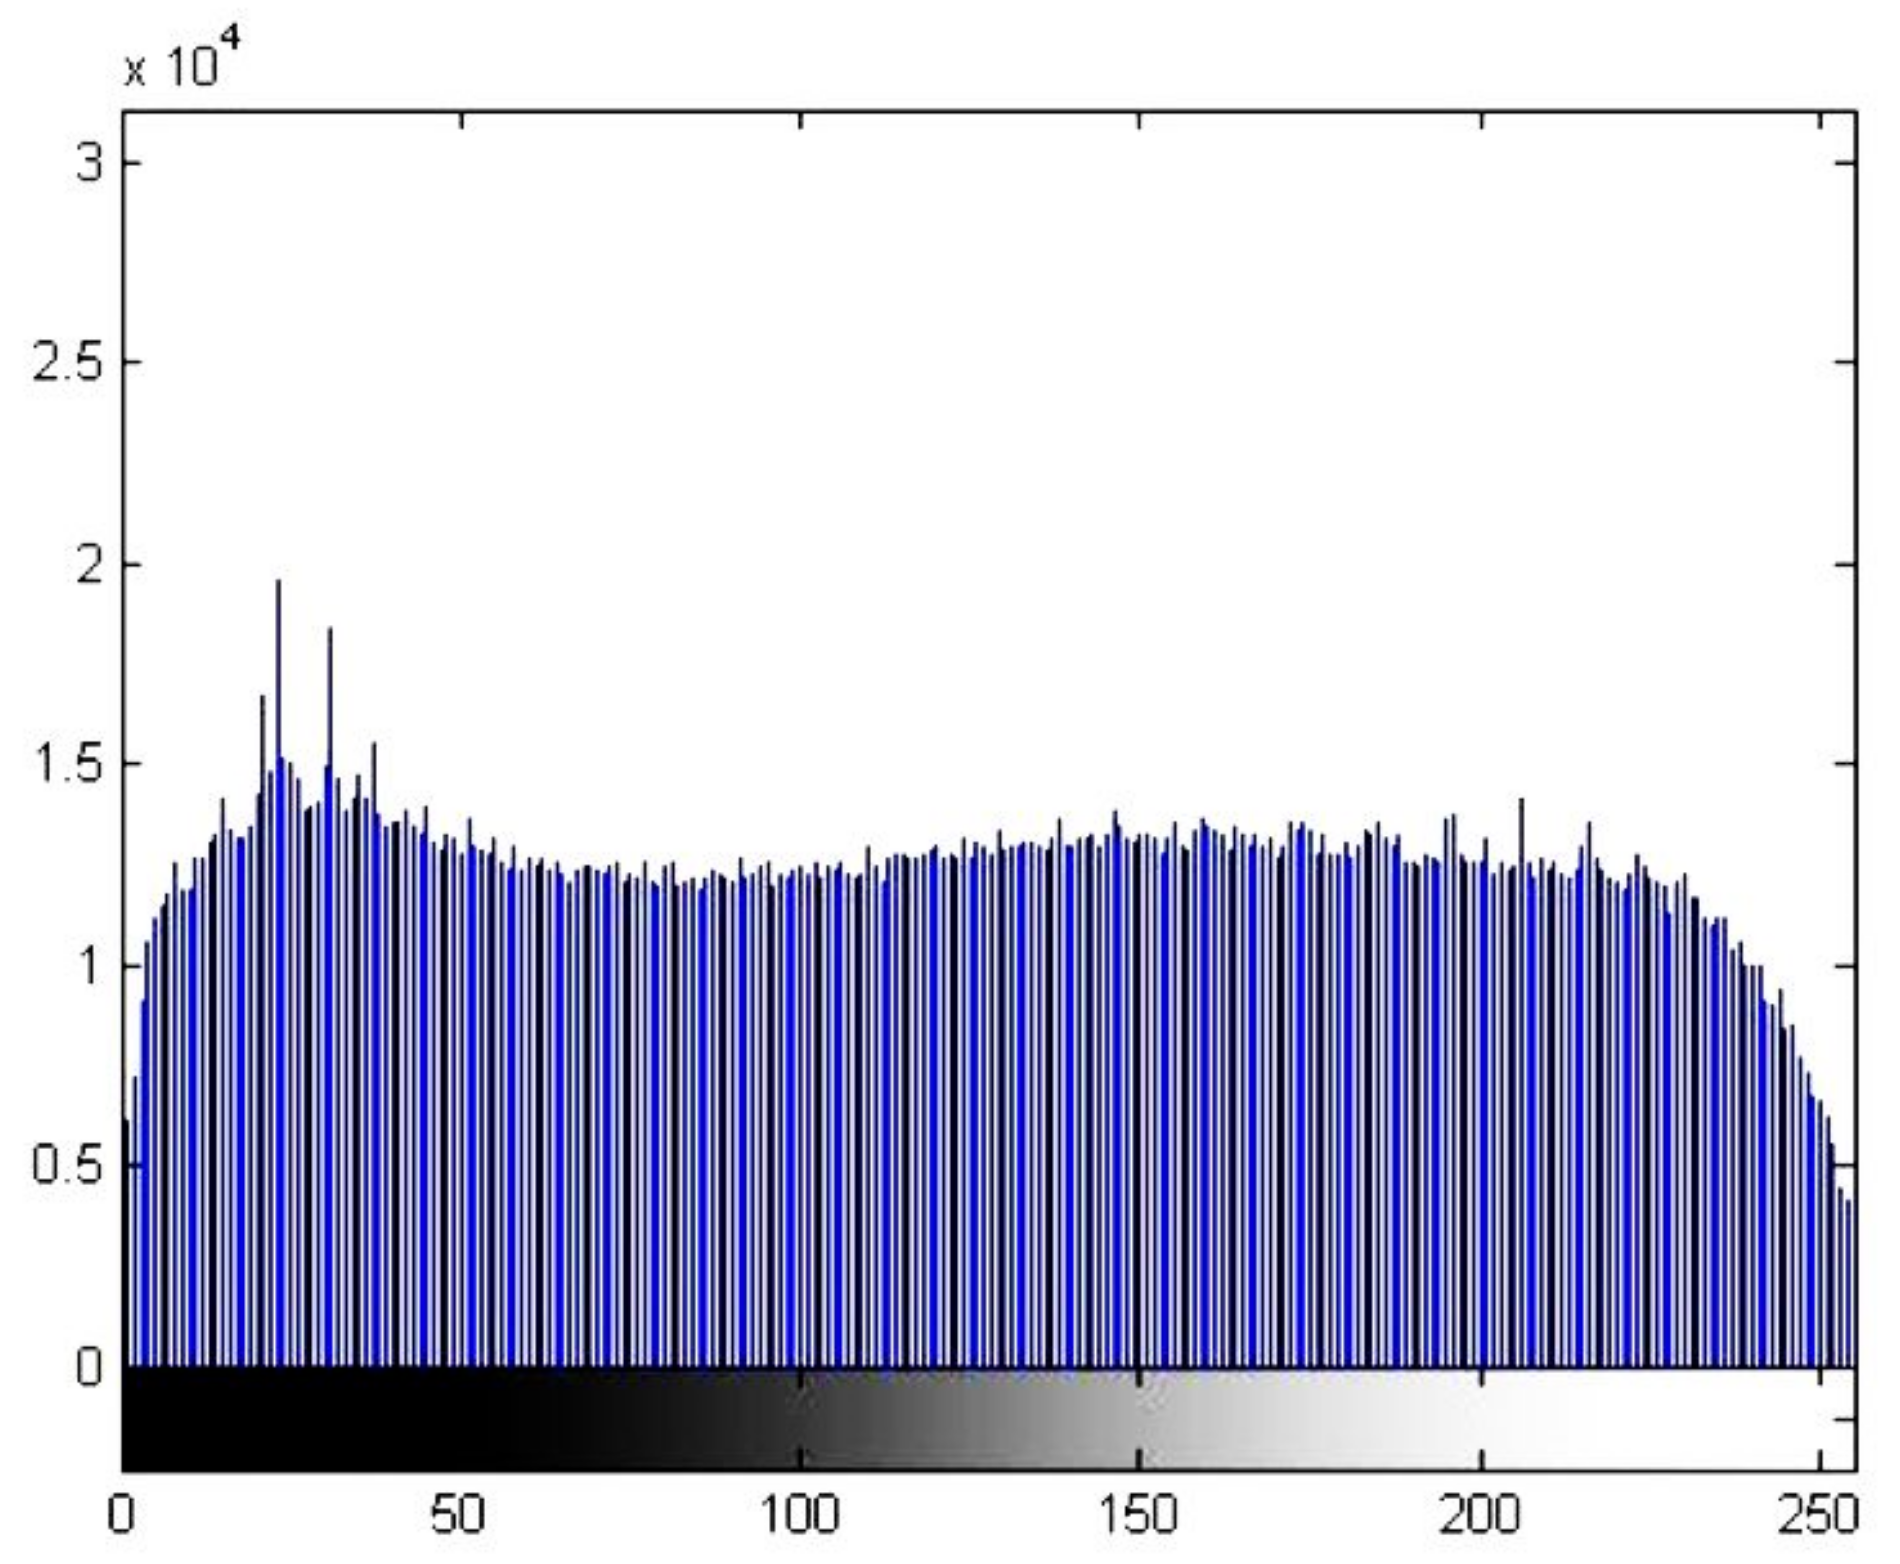
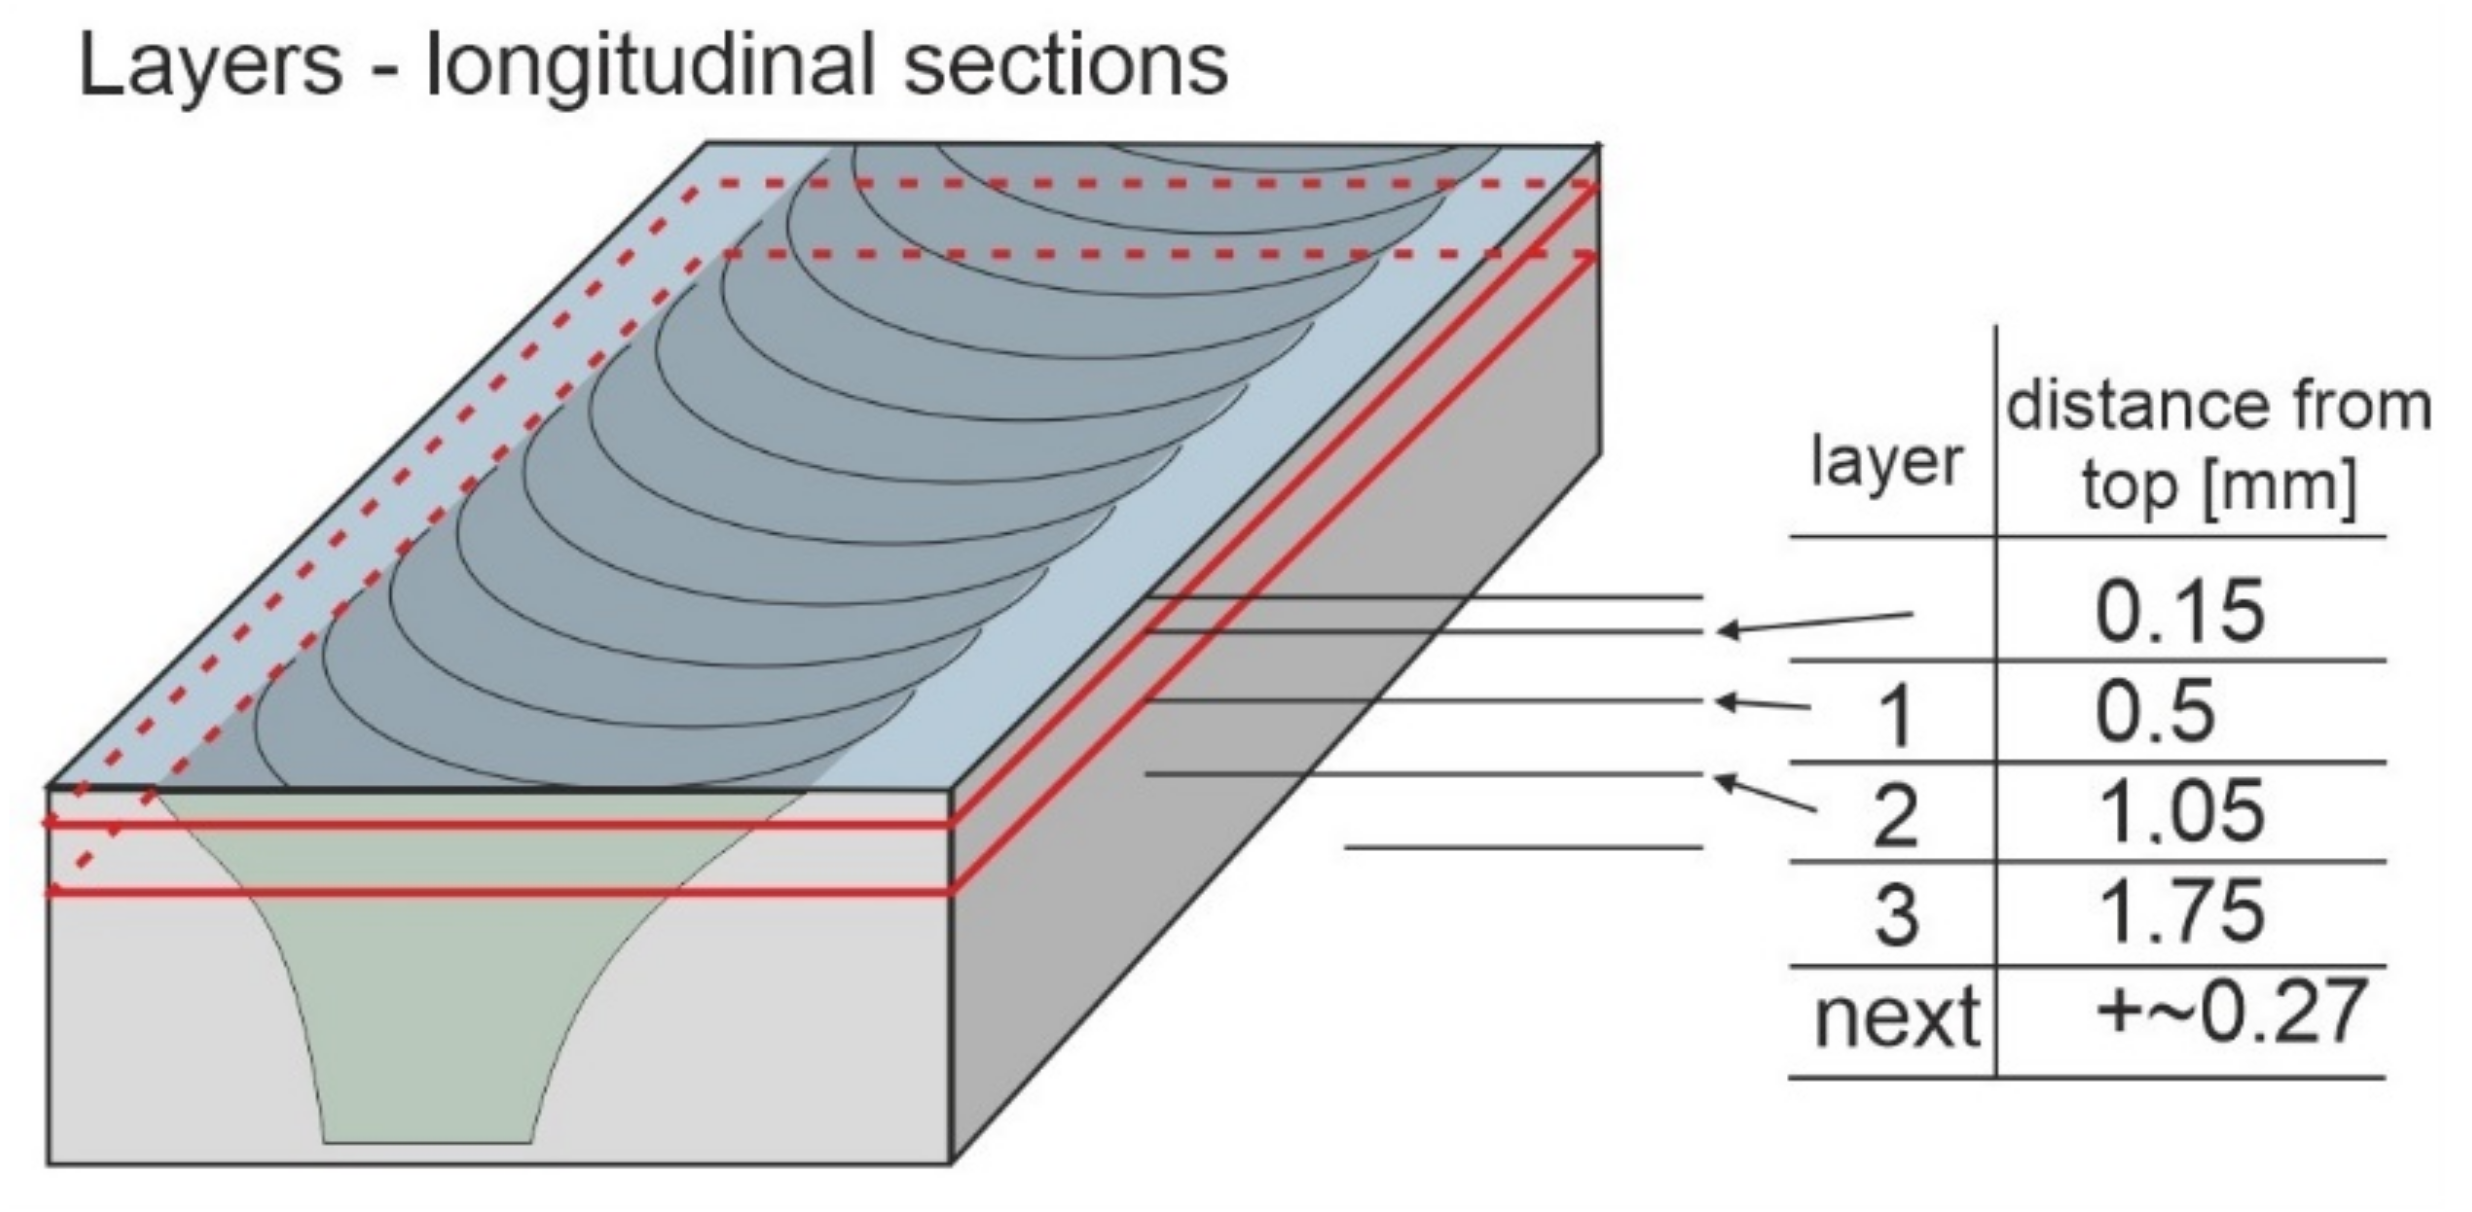
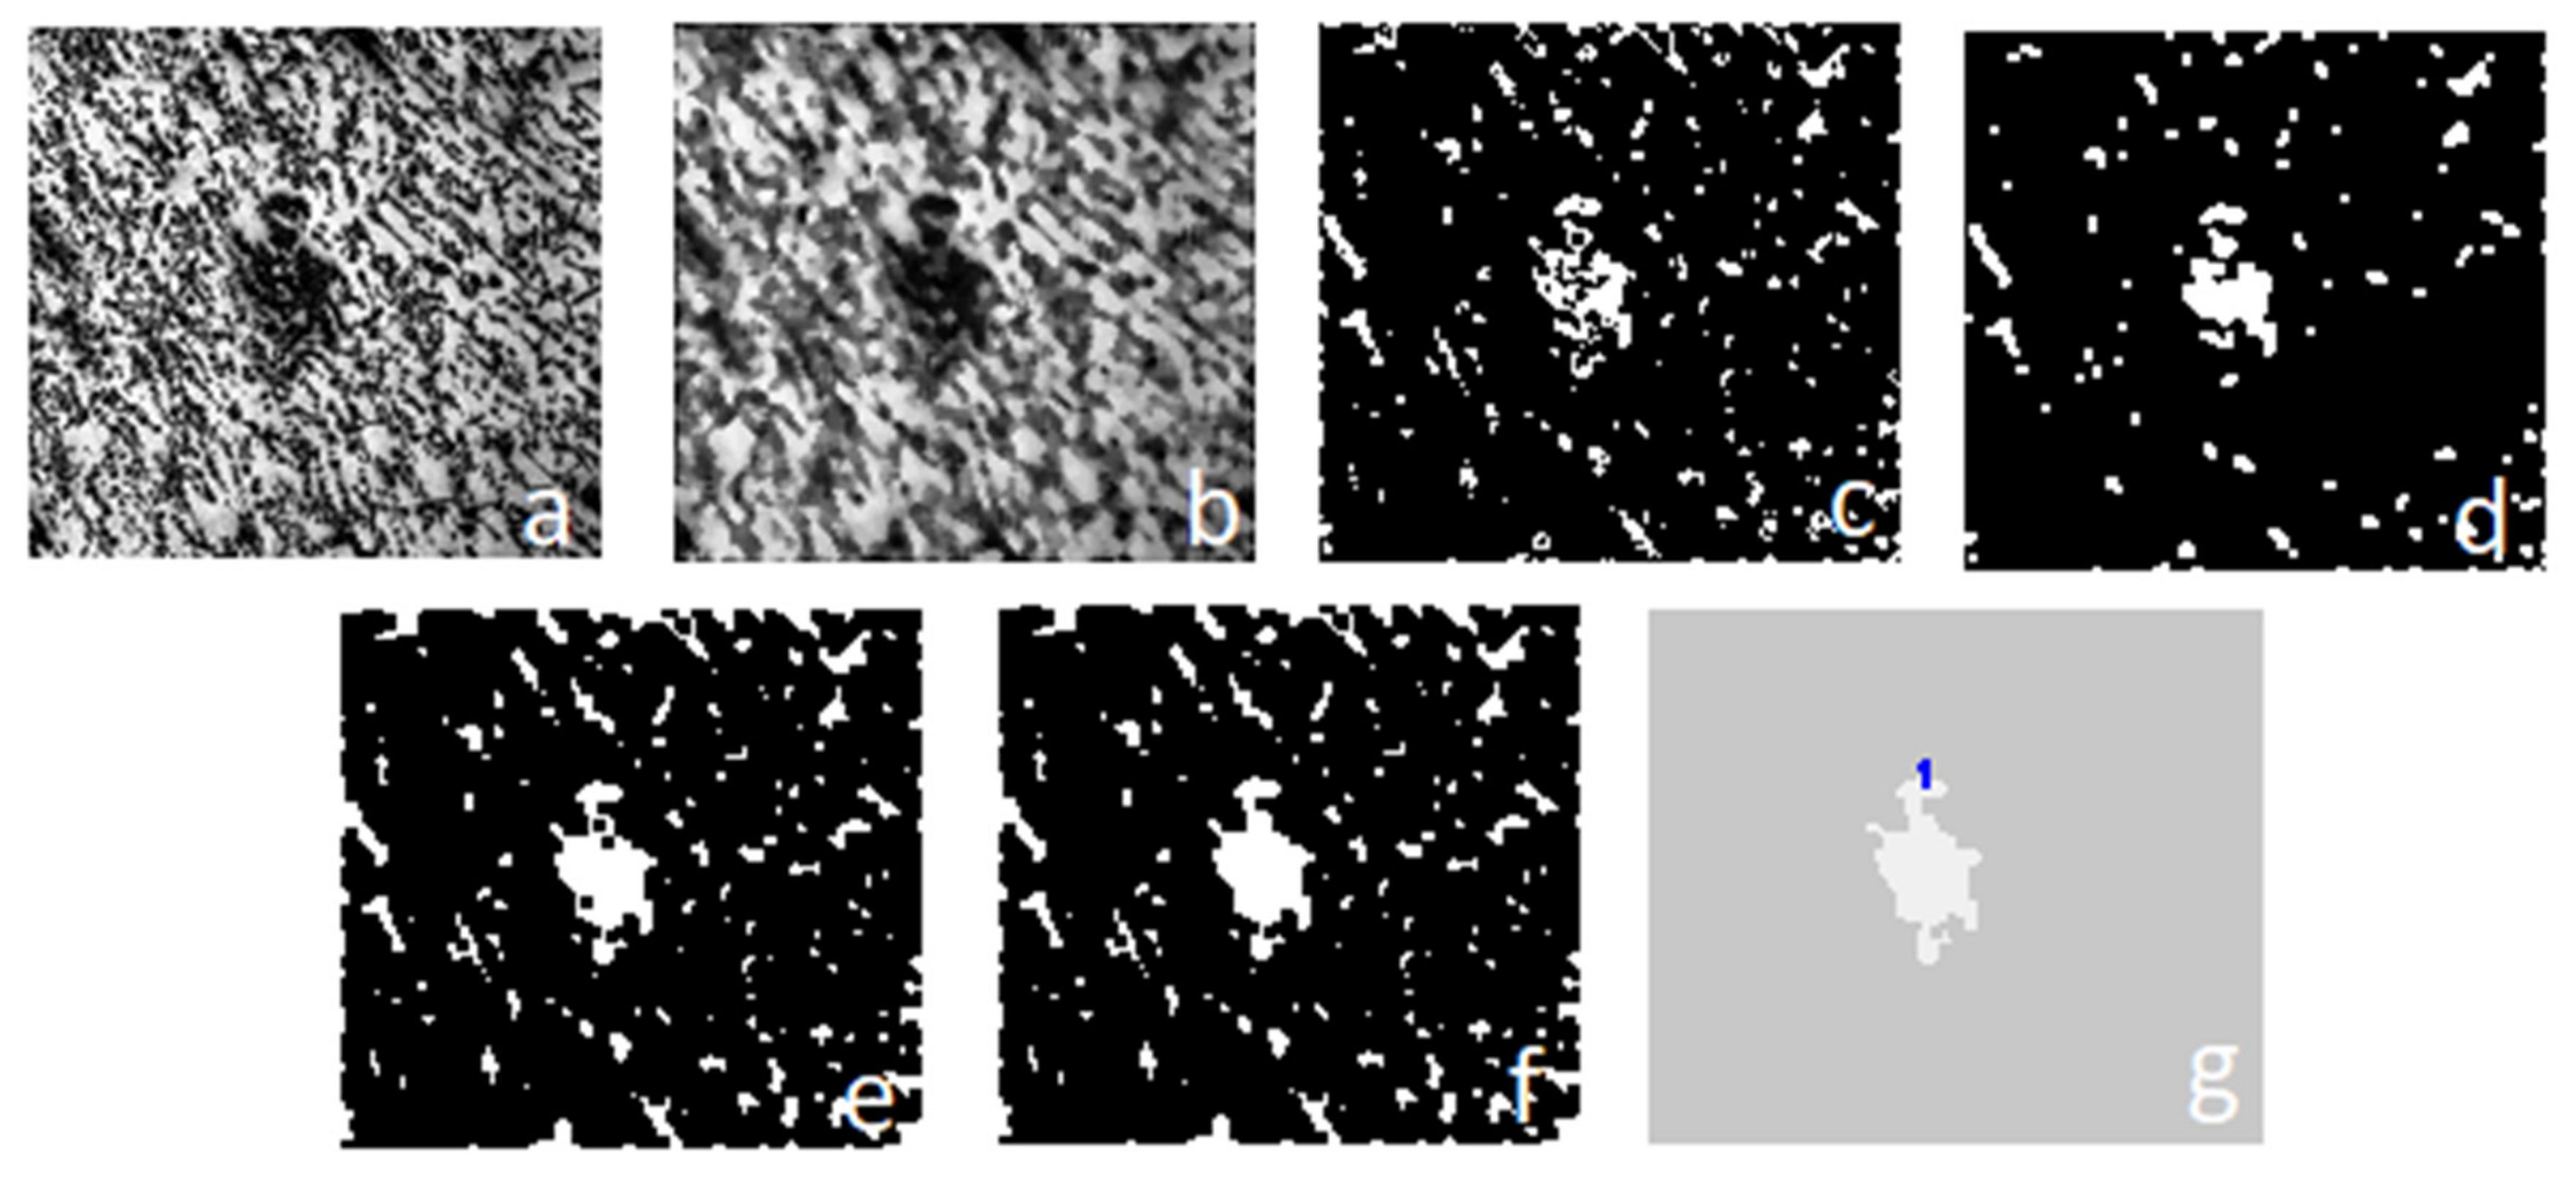
2.1. Image Preprocessing and Layers Segmentation
2.2. Abrasions Detection in the Microstructure
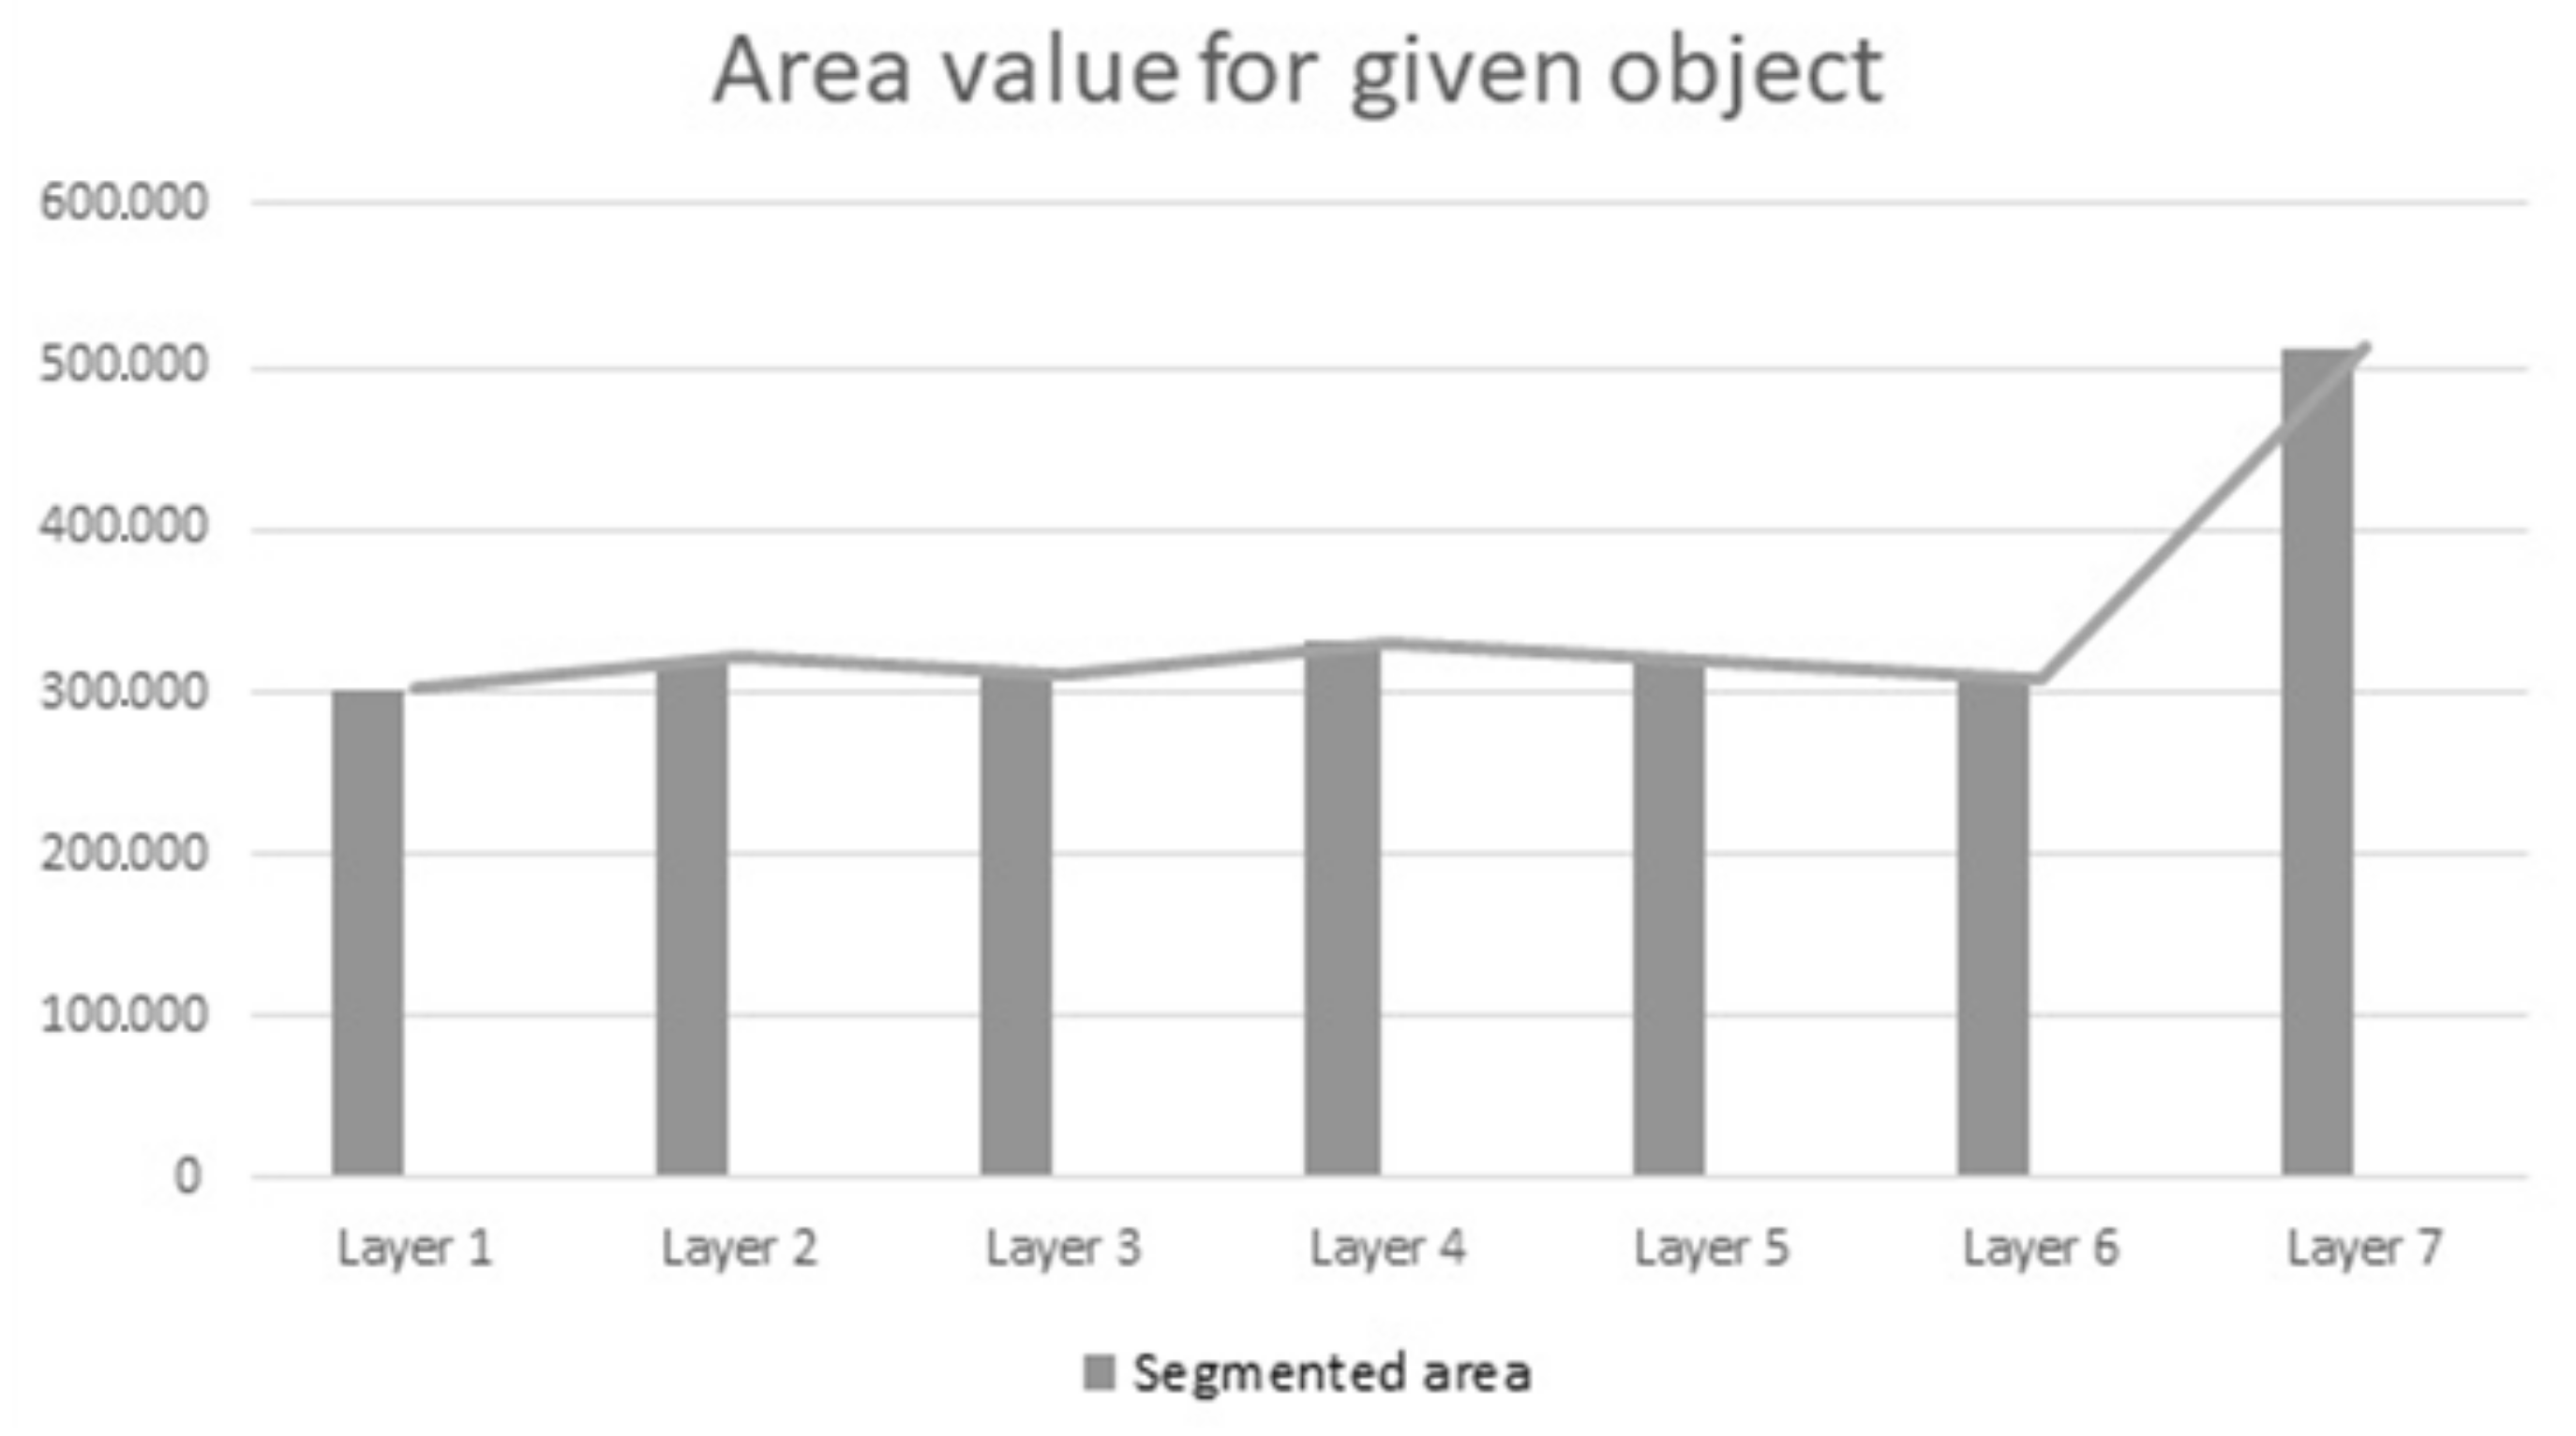
3. Results
4. Conclusions
Author Contributions
Funding
Institutional Review Board Statement
Informed Consent Statement
Data Availability Statement
Conflicts of Interest
References
- Mroczka, K.; Pietras, A.; Dymek, S. Dissimilar FSW welds of light alloys – microstructure and mechanical properties. In Proceedings of the 12th International Symposium on FSW (12ISFSW), Chicoutimi, QC, Canada, 26–28 June 2018. [Google Scholar]
- Hamilton, C.; Dymek, S.; Blicharski, M.; Brzegowy, W. Microstructural and flow characteristics of friction stir welded aluminium 6061-T6 extrusions. Sci. Technol. Weld. Join. 2007, 12, 702. [Google Scholar] [CrossRef]
- Kalemba, I.; Kopyściański, M.; Hamilton, C.; Dymek, S. Natural Aging Behavior of Friction Stir Welded Al-Zn-Mg-Cu Aluminum Alloys. Arch. Metall. Mater. 2015, 60, 875–879. [Google Scholar] [CrossRef] [Green Version]
- Kurtyka, P.; Ryłko, N.; Tokarski, T.; Wójcicka, A.; Pietras, A. Cast aluminum matrix composites modified using FSP process—Changing of the structure and mechanical properties. Compos. Struct. 2015, 133, 959–967. [Google Scholar] [CrossRef]
- Krasnowski, K.; Hamilton, C.; Dymek, S. Influence of the tool shape and weld configuration on microstructure and mechanical properties of the Al 6082 alloy FSW joints. Arch. Civ. Mech. Eng. 2015, 15, 133–141. [Google Scholar] [CrossRef]
- Kopyściański, M.; Dymek, S.; Hamilton, C.; Weglowska, A.; Pietras, A.; Szczepanek, M.; Wojnarowska, M. Microstructure of Friction Stir Welded Dissimilar wrought 2017A and cast AlSi9Mg Aluminum Alloys. Acta Phys. Pol. A 2017, 131, 1390–1393. [Google Scholar] [CrossRef]
- Hamilton, C.; Dymek, S.; Dryzek, E.; Kopyściański, M.; Pietras, A.; Węglowska, A.; Wróbel, M. Application of positron lifetime annihilation spectroscopy for characterization of friction stir welded dissimilar aluminum alloys. Mater. Charact. 2017, 132, 431–436. [Google Scholar] [CrossRef]
- Mroczka, K. Characteristics of AlSi9Mg/2017A aluminum alloys friction stir welded with offset welding line and root-side heating. Arch. Metall. Mater. 2014, 4, 1299–1305. [Google Scholar]
- Kurtyka, P.; Ryłko, N. Quantitative analysis of the particle distributions in reinforced composites. Compos. Struct. 2017, 182, 412–419. [Google Scholar] [CrossRef]
- LaTorre, A.; Alonso-Nanclaresa, L.; Muelas, S.; Peña, J.; De Felipe, J. Segmentation of neuronal nuclei based on clump splitting and a two-step binarization of images. Expert Syst. Appl. 2013, 40, 6521–6530. [Google Scholar] [CrossRef]
- Ntirogiannis, K.; Gatos, B.; Pratikakis, I. A combined approach for the binarization of handwritten document images. Pattern Recognit. Lett. 2014, 35, 3–15. [Google Scholar] [CrossRef]
- Liu, M.; Liu, Y.; Hu, H.; Nie, L. Genetic algorithm and mathematical morphology based binarization method for strip steel defect image with non-uniform illumination. J. Vis. Commun. Image Represent. 2016, 37, 70–77. [Google Scholar] [CrossRef]
- Vo, Q.; Kim, S.; Yang, H.; Lee, G. Binarization of degraded document images based on hierarchical deep supervised network. Pattern Recognit. 2018, 74, 568–586. [Google Scholar] [CrossRef]
- Ogiela, M.; Tadeusiewicz, R. Image Understanding Methods in Biomedical Informatics and Digital Imaging. J. Biomed. Inform. 2001, 34, 377–386. [Google Scholar] [CrossRef] [PubMed]
- Basaeed, E.; Bhaskar, H.; Al-Mualla, M. Supervised remote sensing image segmentation using boosted convolutional neural networks. Knowl. -Based Syst. 2016, 99, 19–27. [Google Scholar] [CrossRef]
- Chi, J.; Eramian, M. Enhancing textural differences using wavelet-based texture characteristics morphological component analysis: A preprocessing method for improving image segmentation. Comput. Vis. Image Underst. 2017, 158, 49–61. [Google Scholar] [CrossRef]
- Flores, F.; De Alencar Lotufo, R. Watershed from propagated markers: An interactive method to morphological object segmentation in image sequences. Image Vis. Comput. 2010, 28, 1491–1514. [Google Scholar] [CrossRef]
- Su, T.-C.; Yang, M.-D.; Wu, T.-C.; Lin, J.-Y. Morphological segmentation based on edge detection for sewer pipe defects on CCTV images. Expert Syst. Appl. 2011, 38, 13094–13114. [Google Scholar] [CrossRef]
- Parida, P.; Bhoi, N. 2-D Gabor filter based transition region extraction and morphological operation for image segmentation. Comput. Electr. Eng. 2017, 62, 119–134. [Google Scholar] [CrossRef]
- Jacquin, D.; Guillemot, G. A review of microstructural changes occurring during FSW in aluminum alloys and their modelling. J. Mater. Process. Technol. 2021, 288, 116706. [Google Scholar] [CrossRef]
- Beygi, R.; Pouraliakbar, H.; Torabi, K.; Eisaabadi, G.B.; Fallah, V.; Kim, S.K.; Shi, R.; da Silva, L.F.M. The inhibitory effect of stir zone liquefaction and eutectic-phase formation on the growth of γ/β intermetallics during dissimilar FSW of Al/Mg alloys. J. Manuf. Process. 2021, 70, 152–162. [Google Scholar] [CrossRef]
- Baghdadi, A.H.; Sajuri, Z.; Keshtgar, A.; Sharif, N.M.; Rajabi, A. Mechanical Property Improvement in Dissimilar Friction Stir Welded Al5083/Al6061 Joints: Effects of Post-Weld Heat Treatment and Abnormal Grain Growth. Materials 2022, 15, 288. [Google Scholar] [CrossRef] [PubMed]
- Huang, T.; Yang, G.; Tang, G. A fast two-dimensional median filtering algorithm. IEEE Trans. Acoust. Speech Signal Process. 1979, 27, 13–18. [Google Scholar] [CrossRef] [Green Version]
- Uğur, E.; Engínoğlu, S.; Thanh, D.N.H.; Hieu, L.M. Adaptive frequency median filter for the salt and pepper denoising problem. IET Image Process. 2020, 14, 1291–1302. [Google Scholar]
- Duan, J.; Zhang, M.; Li, Q. A Multi-stage Adaptive Binarization Scheme for Document Images. In Proceedings of the 2009 International Joint Conference on Computational Sciences and Optimization, Sanya, China, 24–26 April 2009. [Google Scholar]
- Sha, C.; Hou, J.; Cui, H. A robust 2D Otsu’s thresholding method in image segmentation. J. Vis. Commun. Image Represent. 2016, 41, 339–351. [Google Scholar] [CrossRef]
- Mahgoub, A.; Talab, A.; Huang, Z.; Xi, F.; HaiMing, L. Detection crack in image using Otsu method and multiple filtering in image processing techniques. Opt.-Int. J. Light Electron Opt. 2016, 127, 1030–1033. [Google Scholar]
- Shen, J.; Chen, P.; Su, L.; Shi, T.; Tang, Z.; Liao, G. X-ray inspection of TSV defects with self-organizing map network and Otsu algorithm. Microelectron. Reliab. 2016, 67, 129–134. [Google Scholar] [CrossRef]
- Wójcicka, A.; Mroczka, K.; Kurtyka, P.; Binkowski, M.; Wróbel, Z. X-ray Microtomography Analysis of the Aluminum Alloy Composite Reinforced by SiC After Friction Stir Processing. J. Mater. Eng. Perform. 2014, 23, 3215–3221. [Google Scholar] [CrossRef] [Green Version]


| Object Type | Coordinates, such as Layer 1 |
|---|---|
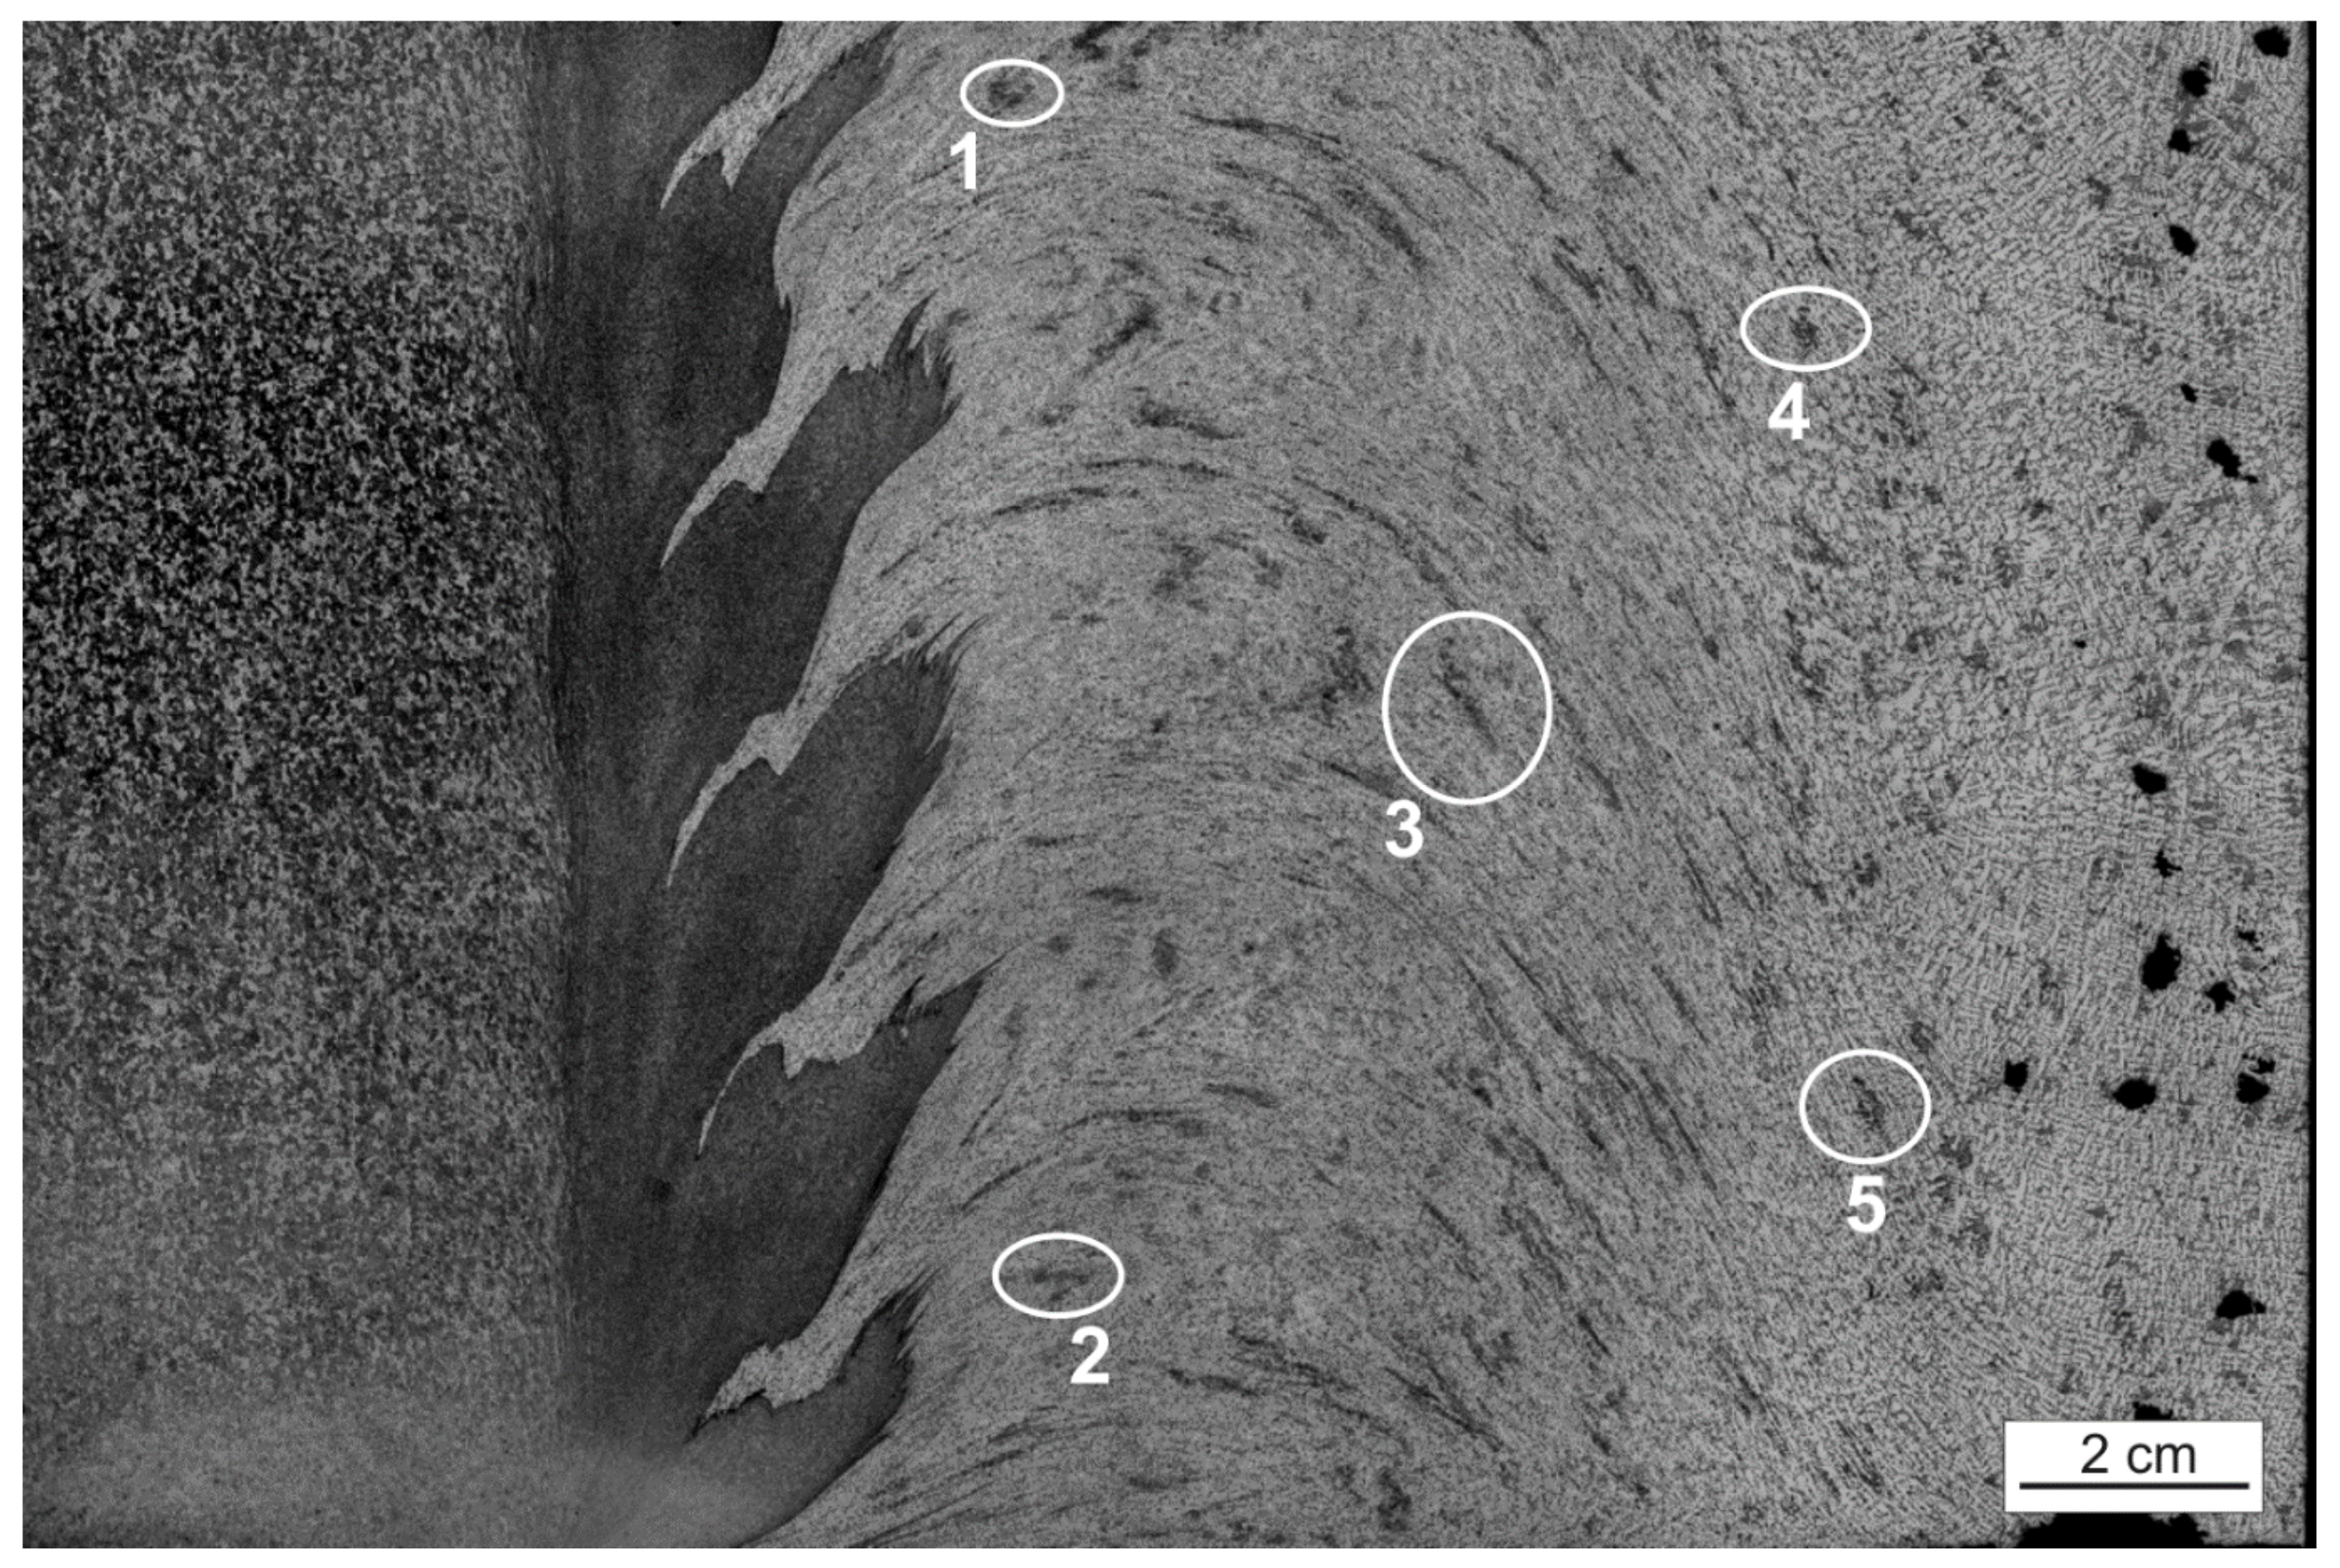
| Object 1 | x824 y77 |
| Object 2 | x870 y1062 |
| Object 3 | x1206 y576 |
| Object 4 | x1490 y277 |
| Object 5 | x1548 y925 |
| Coordinates: | Layer 1 | Layer 2 | Layer 3 | Layer 4 | Layer 5 | Layer 6 | Layer 7 |
|---|---|---|---|---|---|---|---|
| Object 1 | 484 | 10 | Single sets of pixels with values < 10 | Object from A zone | Single sets of pixels with values < 10 | Object from A zone | Object from A zone |
| Object 2 | 369 | 38 | 27 | Object from A zone | Object from A zone | Object from A zone | Object from A zone |
| Object 3 | 941 | 489 | 35 | 872 | Single pixels and border of abrasion in mixed layer | Single pixels and border of abrasion in mixed layer | Islands objects |
| Object 4 | 500 | Single sets of pixels with values < 10 | Single sets of pixels with values < 10 | Single sets of pixels with values < 10 | Single pixels and border of abrasion in mixed layer | 48 | 51 |
| Object 5 | 448 | 56 | 23 | Single sets of pixels with values < 10 | 60 | Single sets of pixels with values < 10 | Single sets of pixels with values < 10 |
Publisher’s Note: MDPI stays neutral with regard to jurisdictional claims in published maps and institutional affiliations. |
© 2022 by the authors. Licensee MDPI, Basel, Switzerland. This article is an open access article distributed under the terms and conditions of the Creative Commons Attribution (CC BY) license (https://creativecommons.org/licenses/by/4.0/).
Share and Cite
Wójcicka, A.; Walusiak, Ł.; Mroczka, K.; Jaworek-Korjakowska, J.K.; Oprzędkiewicz, K.; Wrobel, Z. The Object Segmentation from the Microstructure of a FSW Dissimilar Weld. Materials 2022, 15, 1129. https://doi.org/10.3390/ma15031129
Wójcicka A, Walusiak Ł, Mroczka K, Jaworek-Korjakowska JK, Oprzędkiewicz K, Wrobel Z. The Object Segmentation from the Microstructure of a FSW Dissimilar Weld. Materials. 2022; 15(3):1129. https://doi.org/10.3390/ma15031129
Chicago/Turabian StyleWójcicka, Anna, Łukasz Walusiak, Krzysztof Mroczka, Joanna Krystyna Jaworek-Korjakowska, Krzysztof Oprzędkiewicz, and Zygmunt Wrobel. 2022. "The Object Segmentation from the Microstructure of a FSW Dissimilar Weld" Materials 15, no. 3: 1129. https://doi.org/10.3390/ma15031129
APA StyleWójcicka, A., Walusiak, Ł., Mroczka, K., Jaworek-Korjakowska, J. K., Oprzędkiewicz, K., & Wrobel, Z. (2022). The Object Segmentation from the Microstructure of a FSW Dissimilar Weld. Materials, 15(3), 1129. https://doi.org/10.3390/ma15031129