


Lignocellulosic-Based Activated Carbon-Loaded Silver Nanoparticles and Chitosan for Efficient Removal of Cadmium and Optimization Using Response Surface Methodology

 , ,
, ,  and
and 
Abstract
1. Introduction
2. Materials and Methods
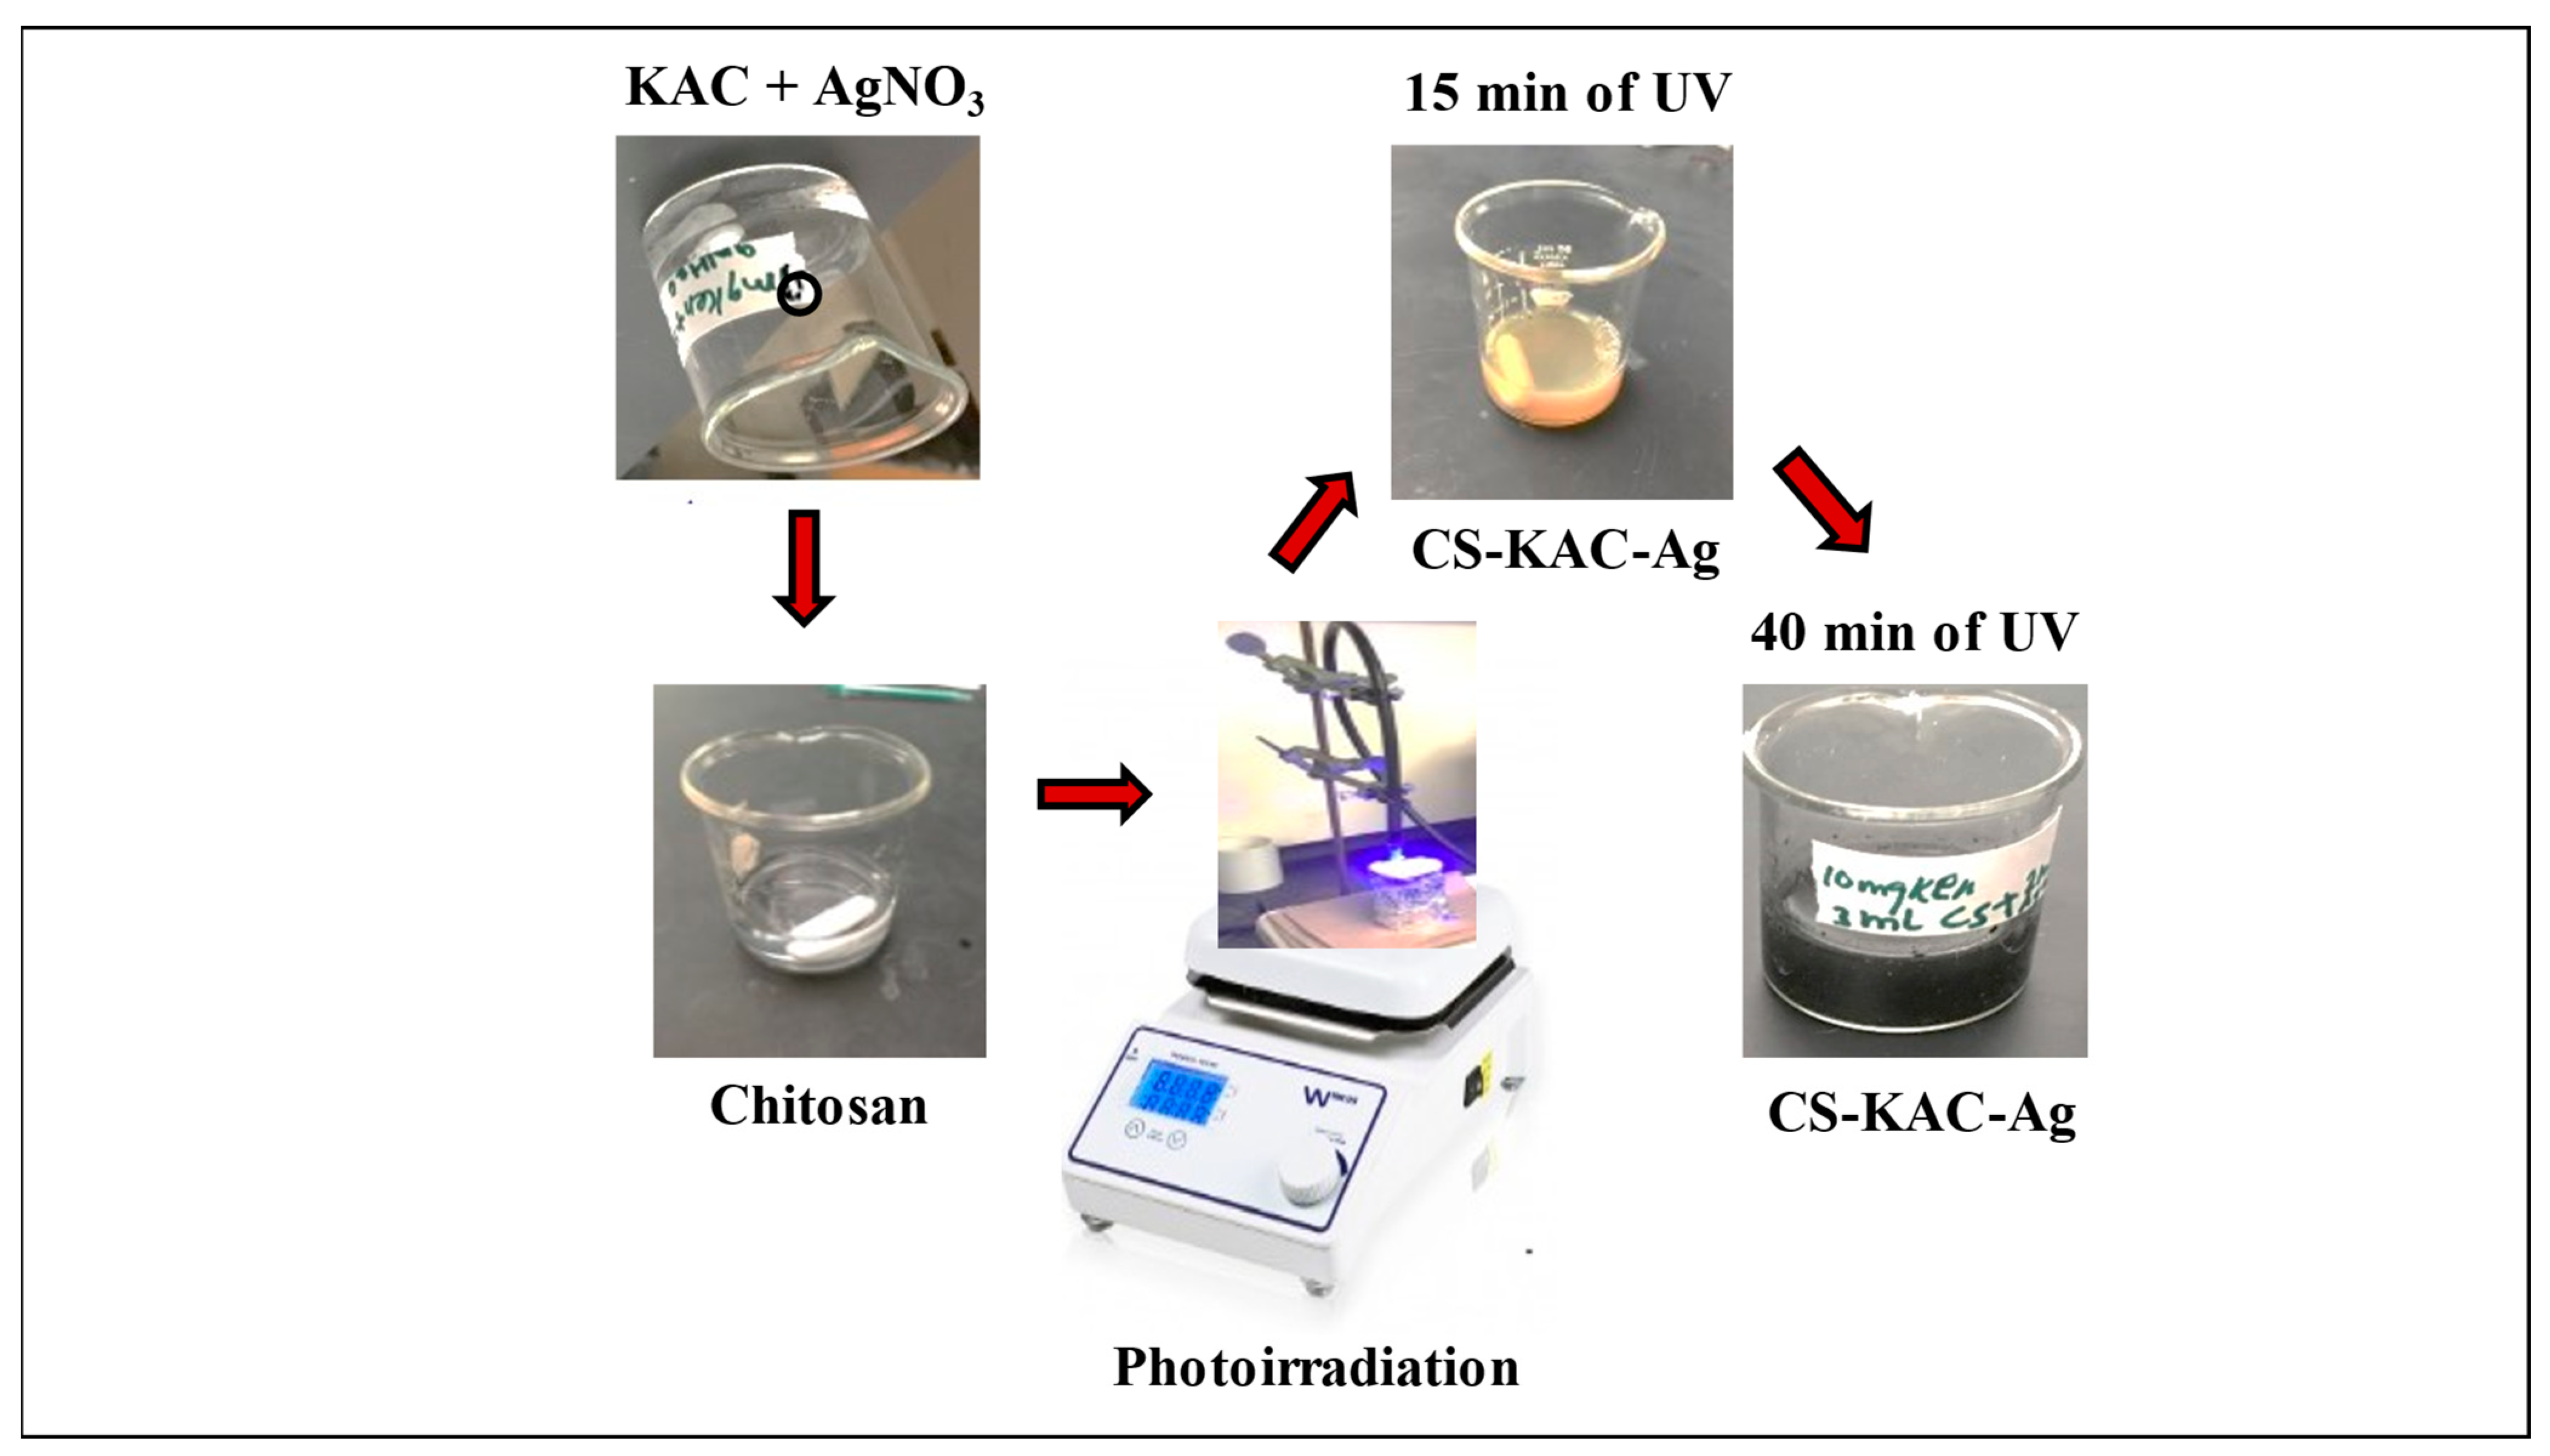
2.1. Preparation of the CS-KAC-Ag Nano-Absorbent
2.2. Characterization of the Nano-Adsorbent
2.3. Adsorbate Cd2+
3. Experiment
3.1. Adsorption Studies
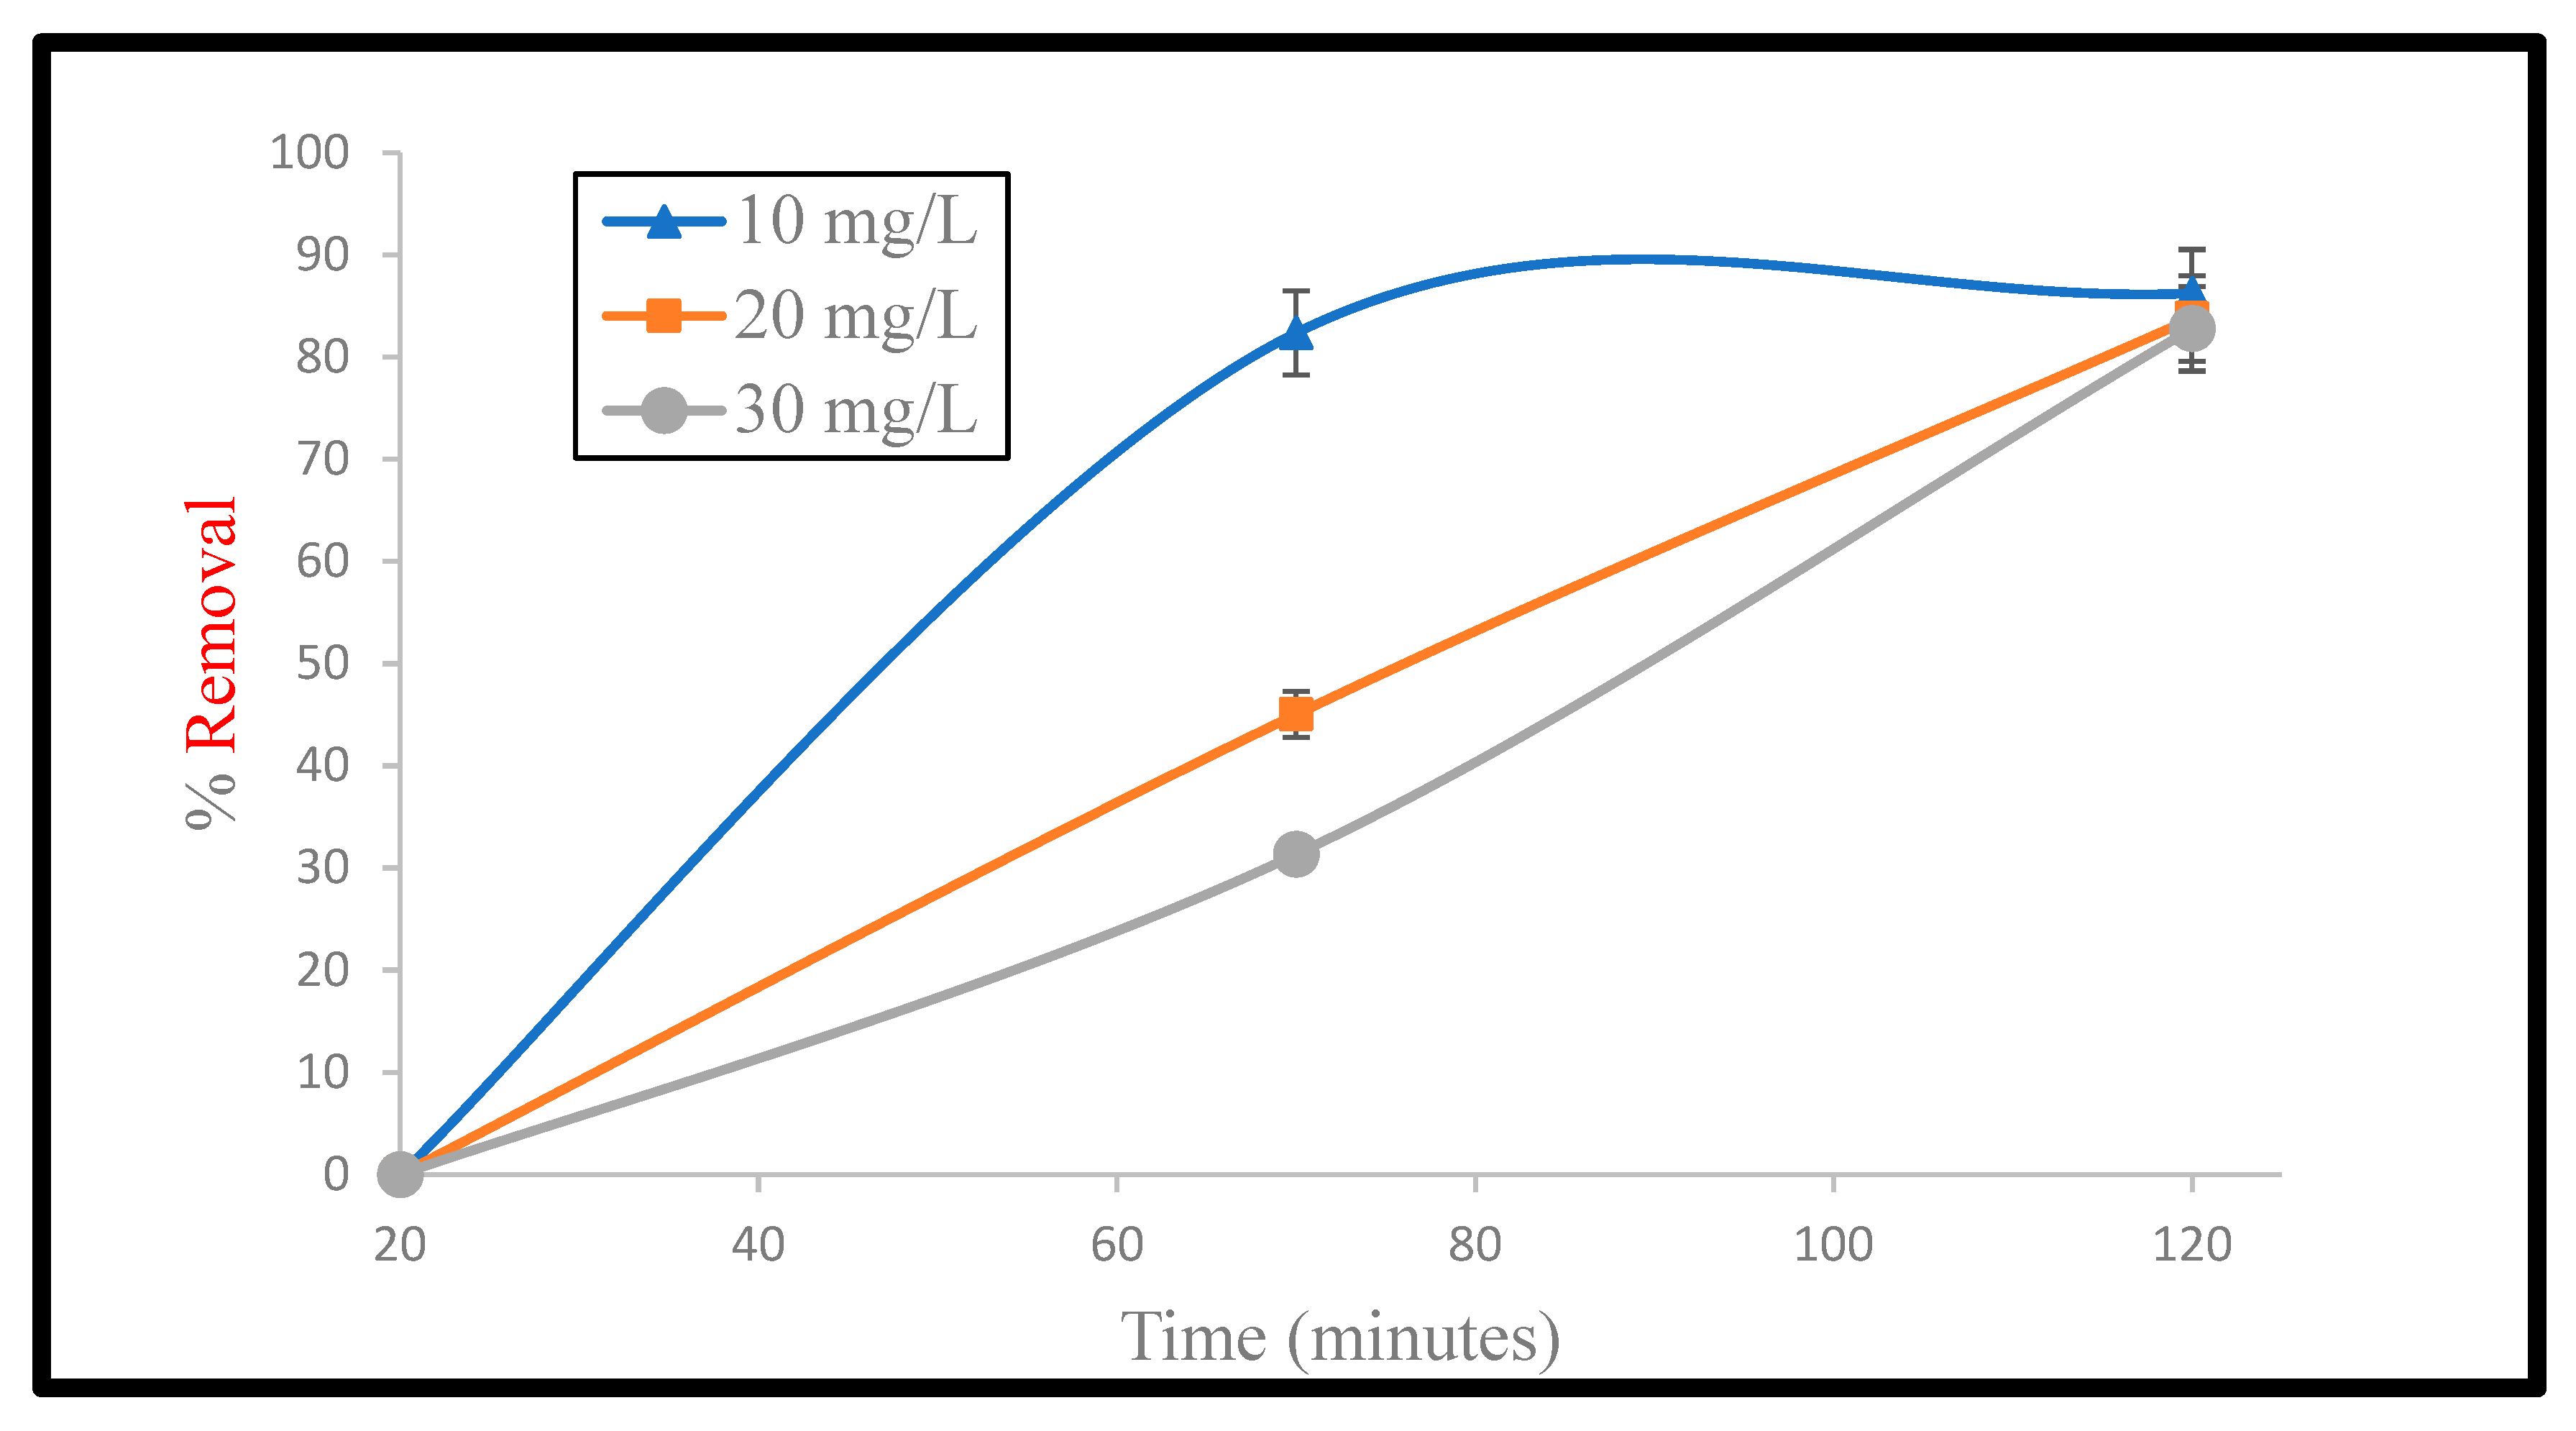
Effect of Initial Cd2+ Concentration and Time
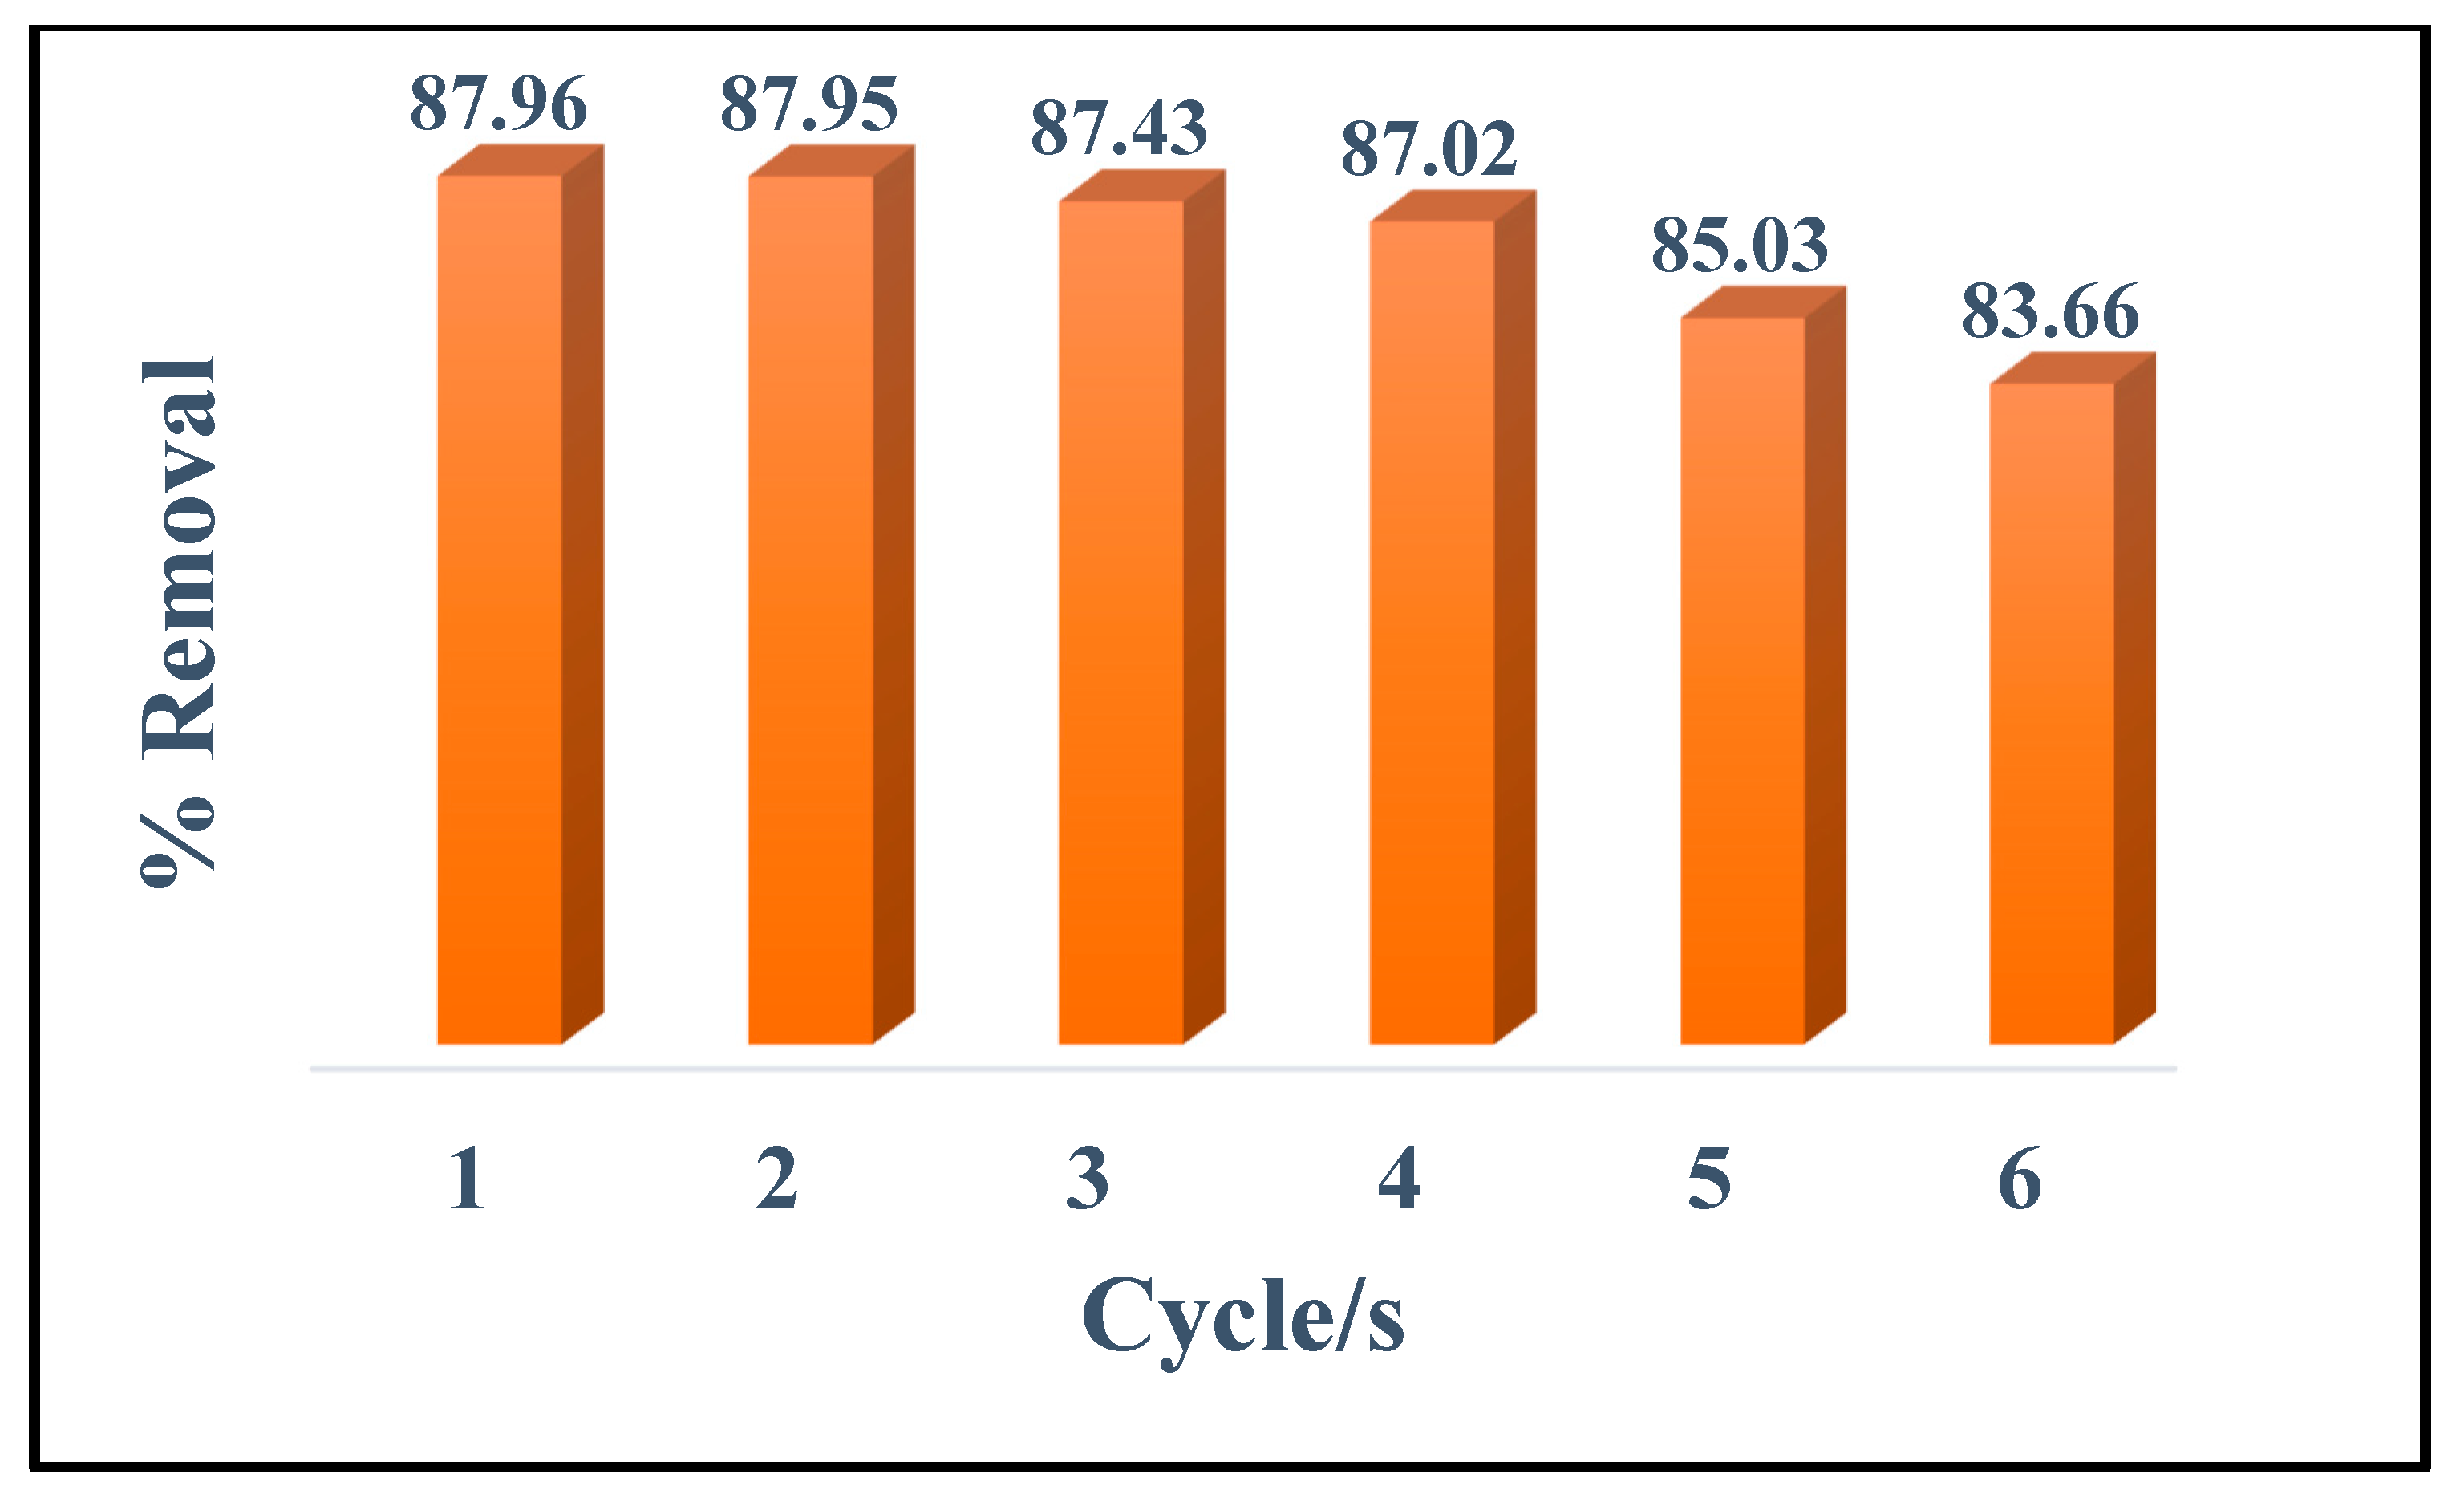
3.2. Reusability Study of CS-KAC-Ag
3.3. Adsorption Kinetics of Cd2+
3.4. Adsorption of Water Samples from Mining Sites in Mexico
3.5. Design of Experiments
3.5.1. Parameters Optimization Using Hybrid RSM-DF Method
3.5.2. Statistical Analysis
4. Results and Discussion
4.1. Characterization of CS-KAC-Ag
4.1.1. Ultraviolet-Visible Spectroscopy
4.1.2. BET Analysis
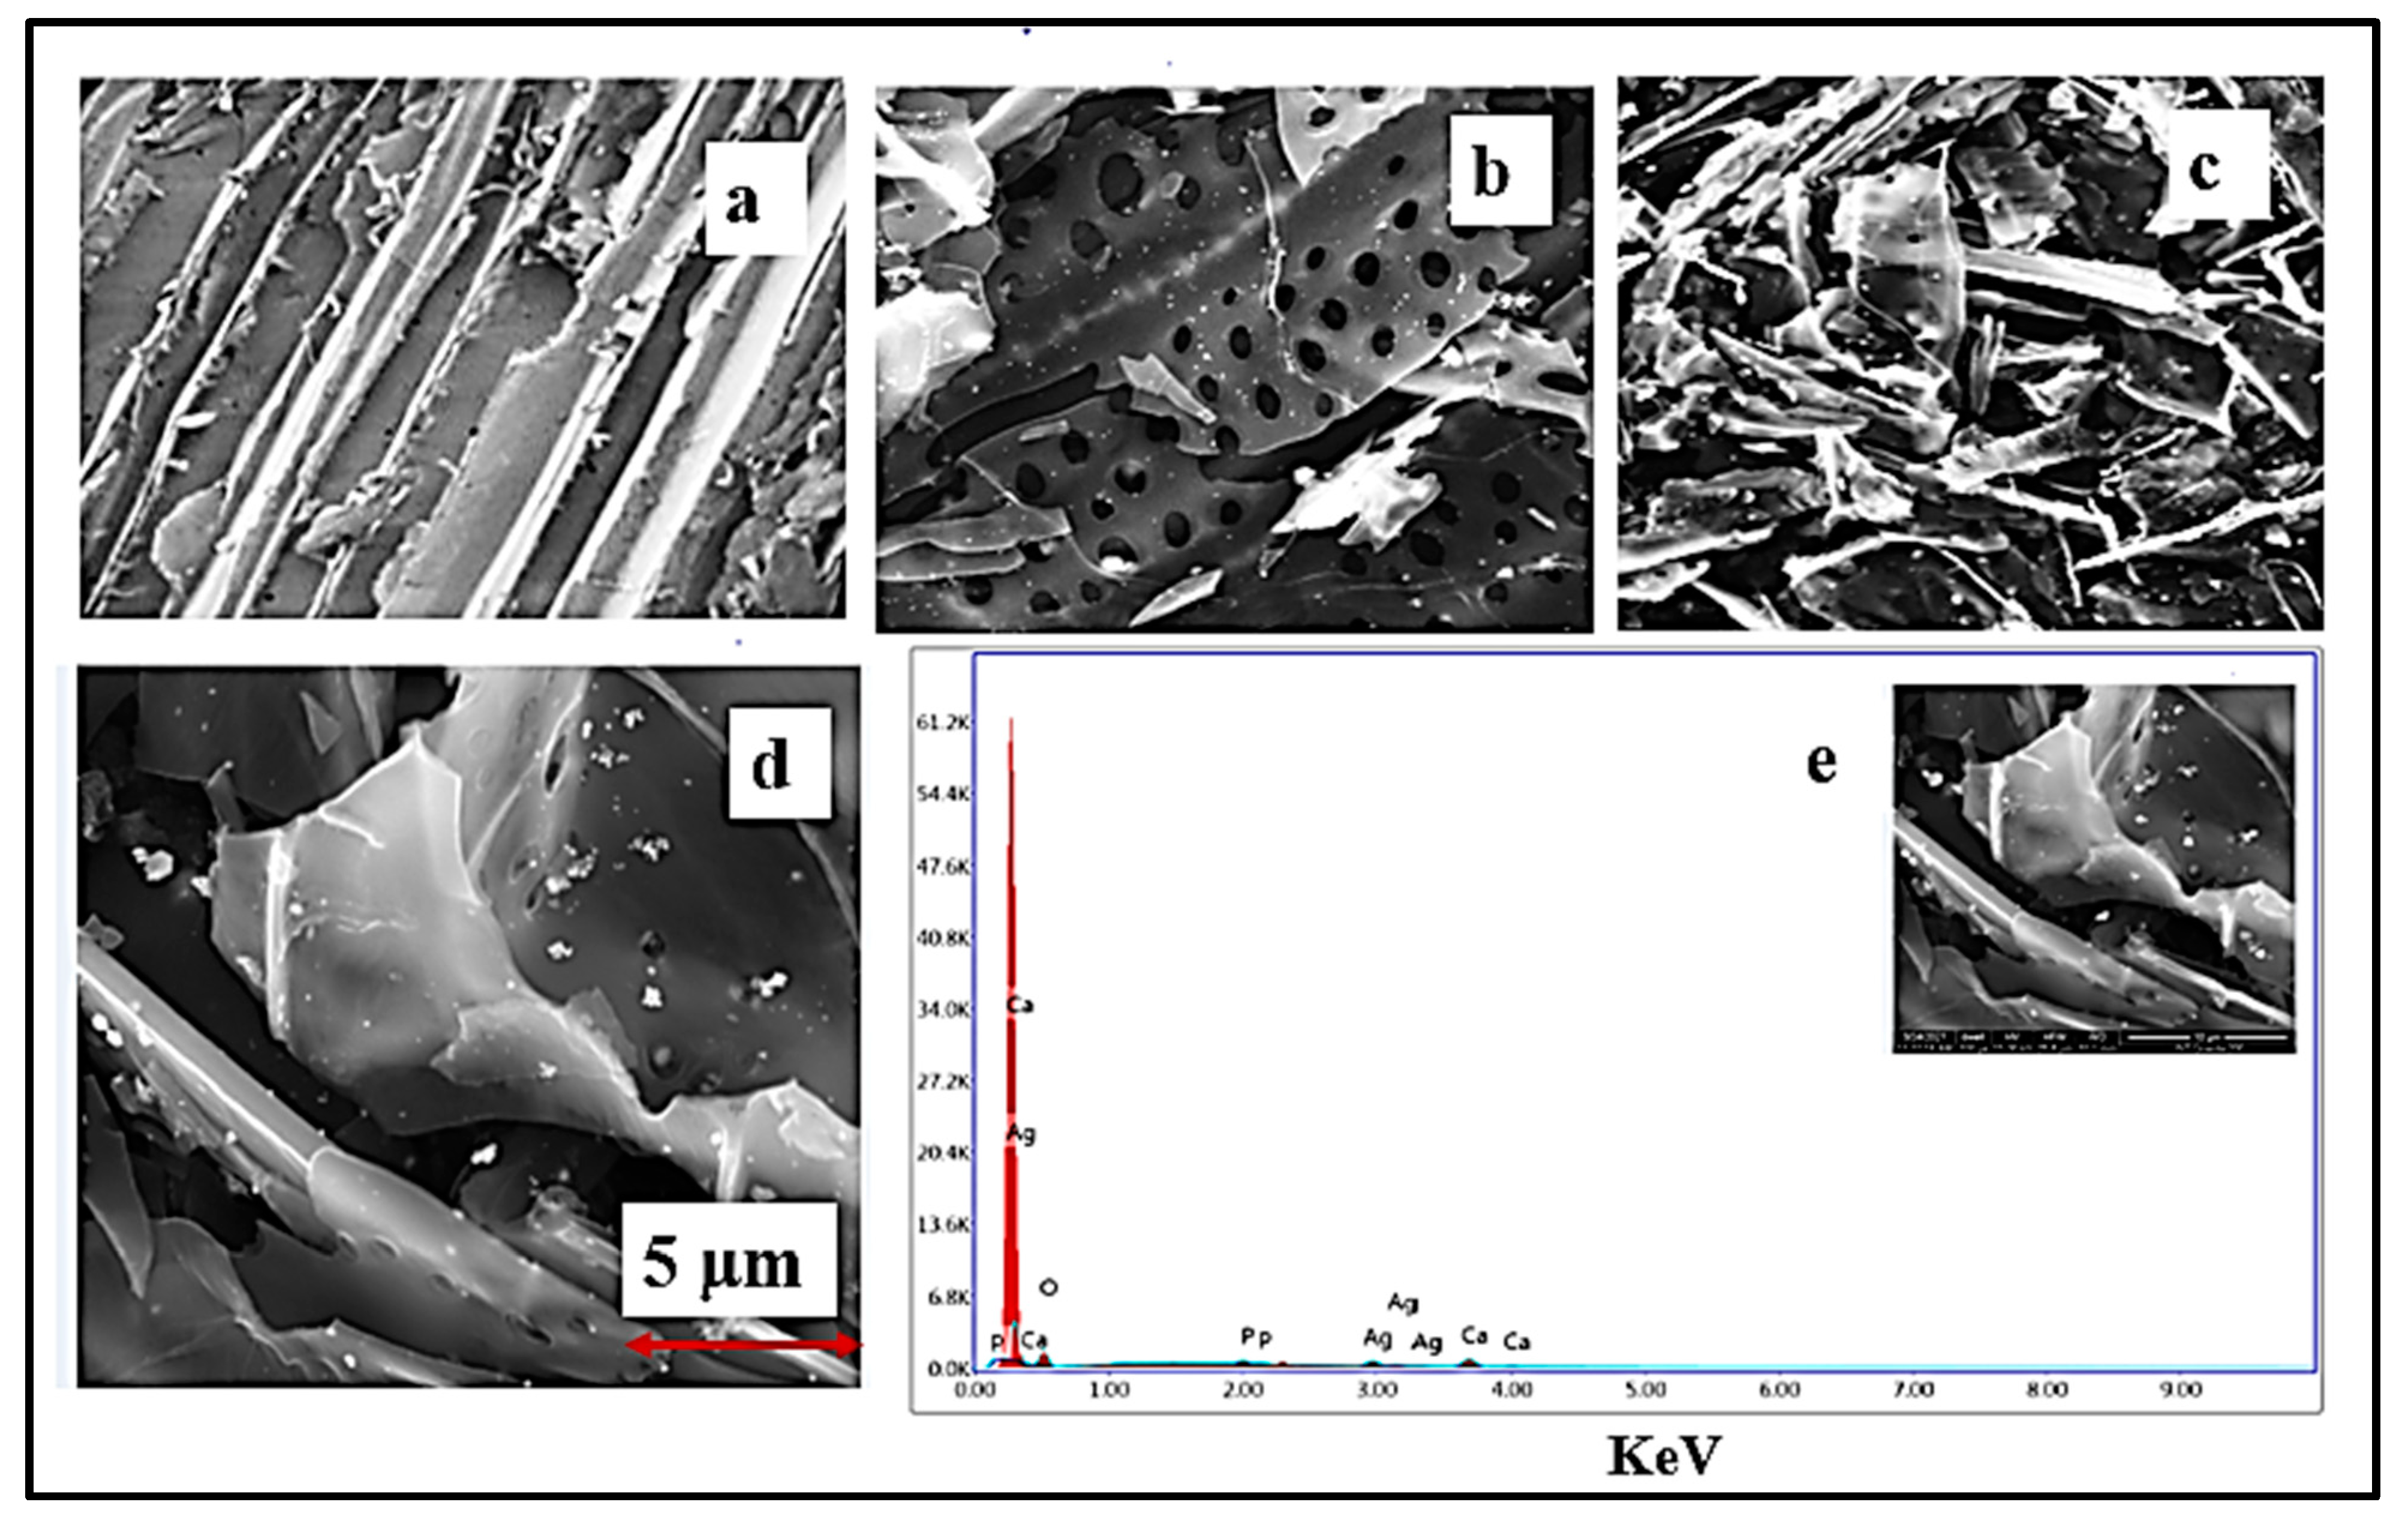
4.1.3. SEM Analysis
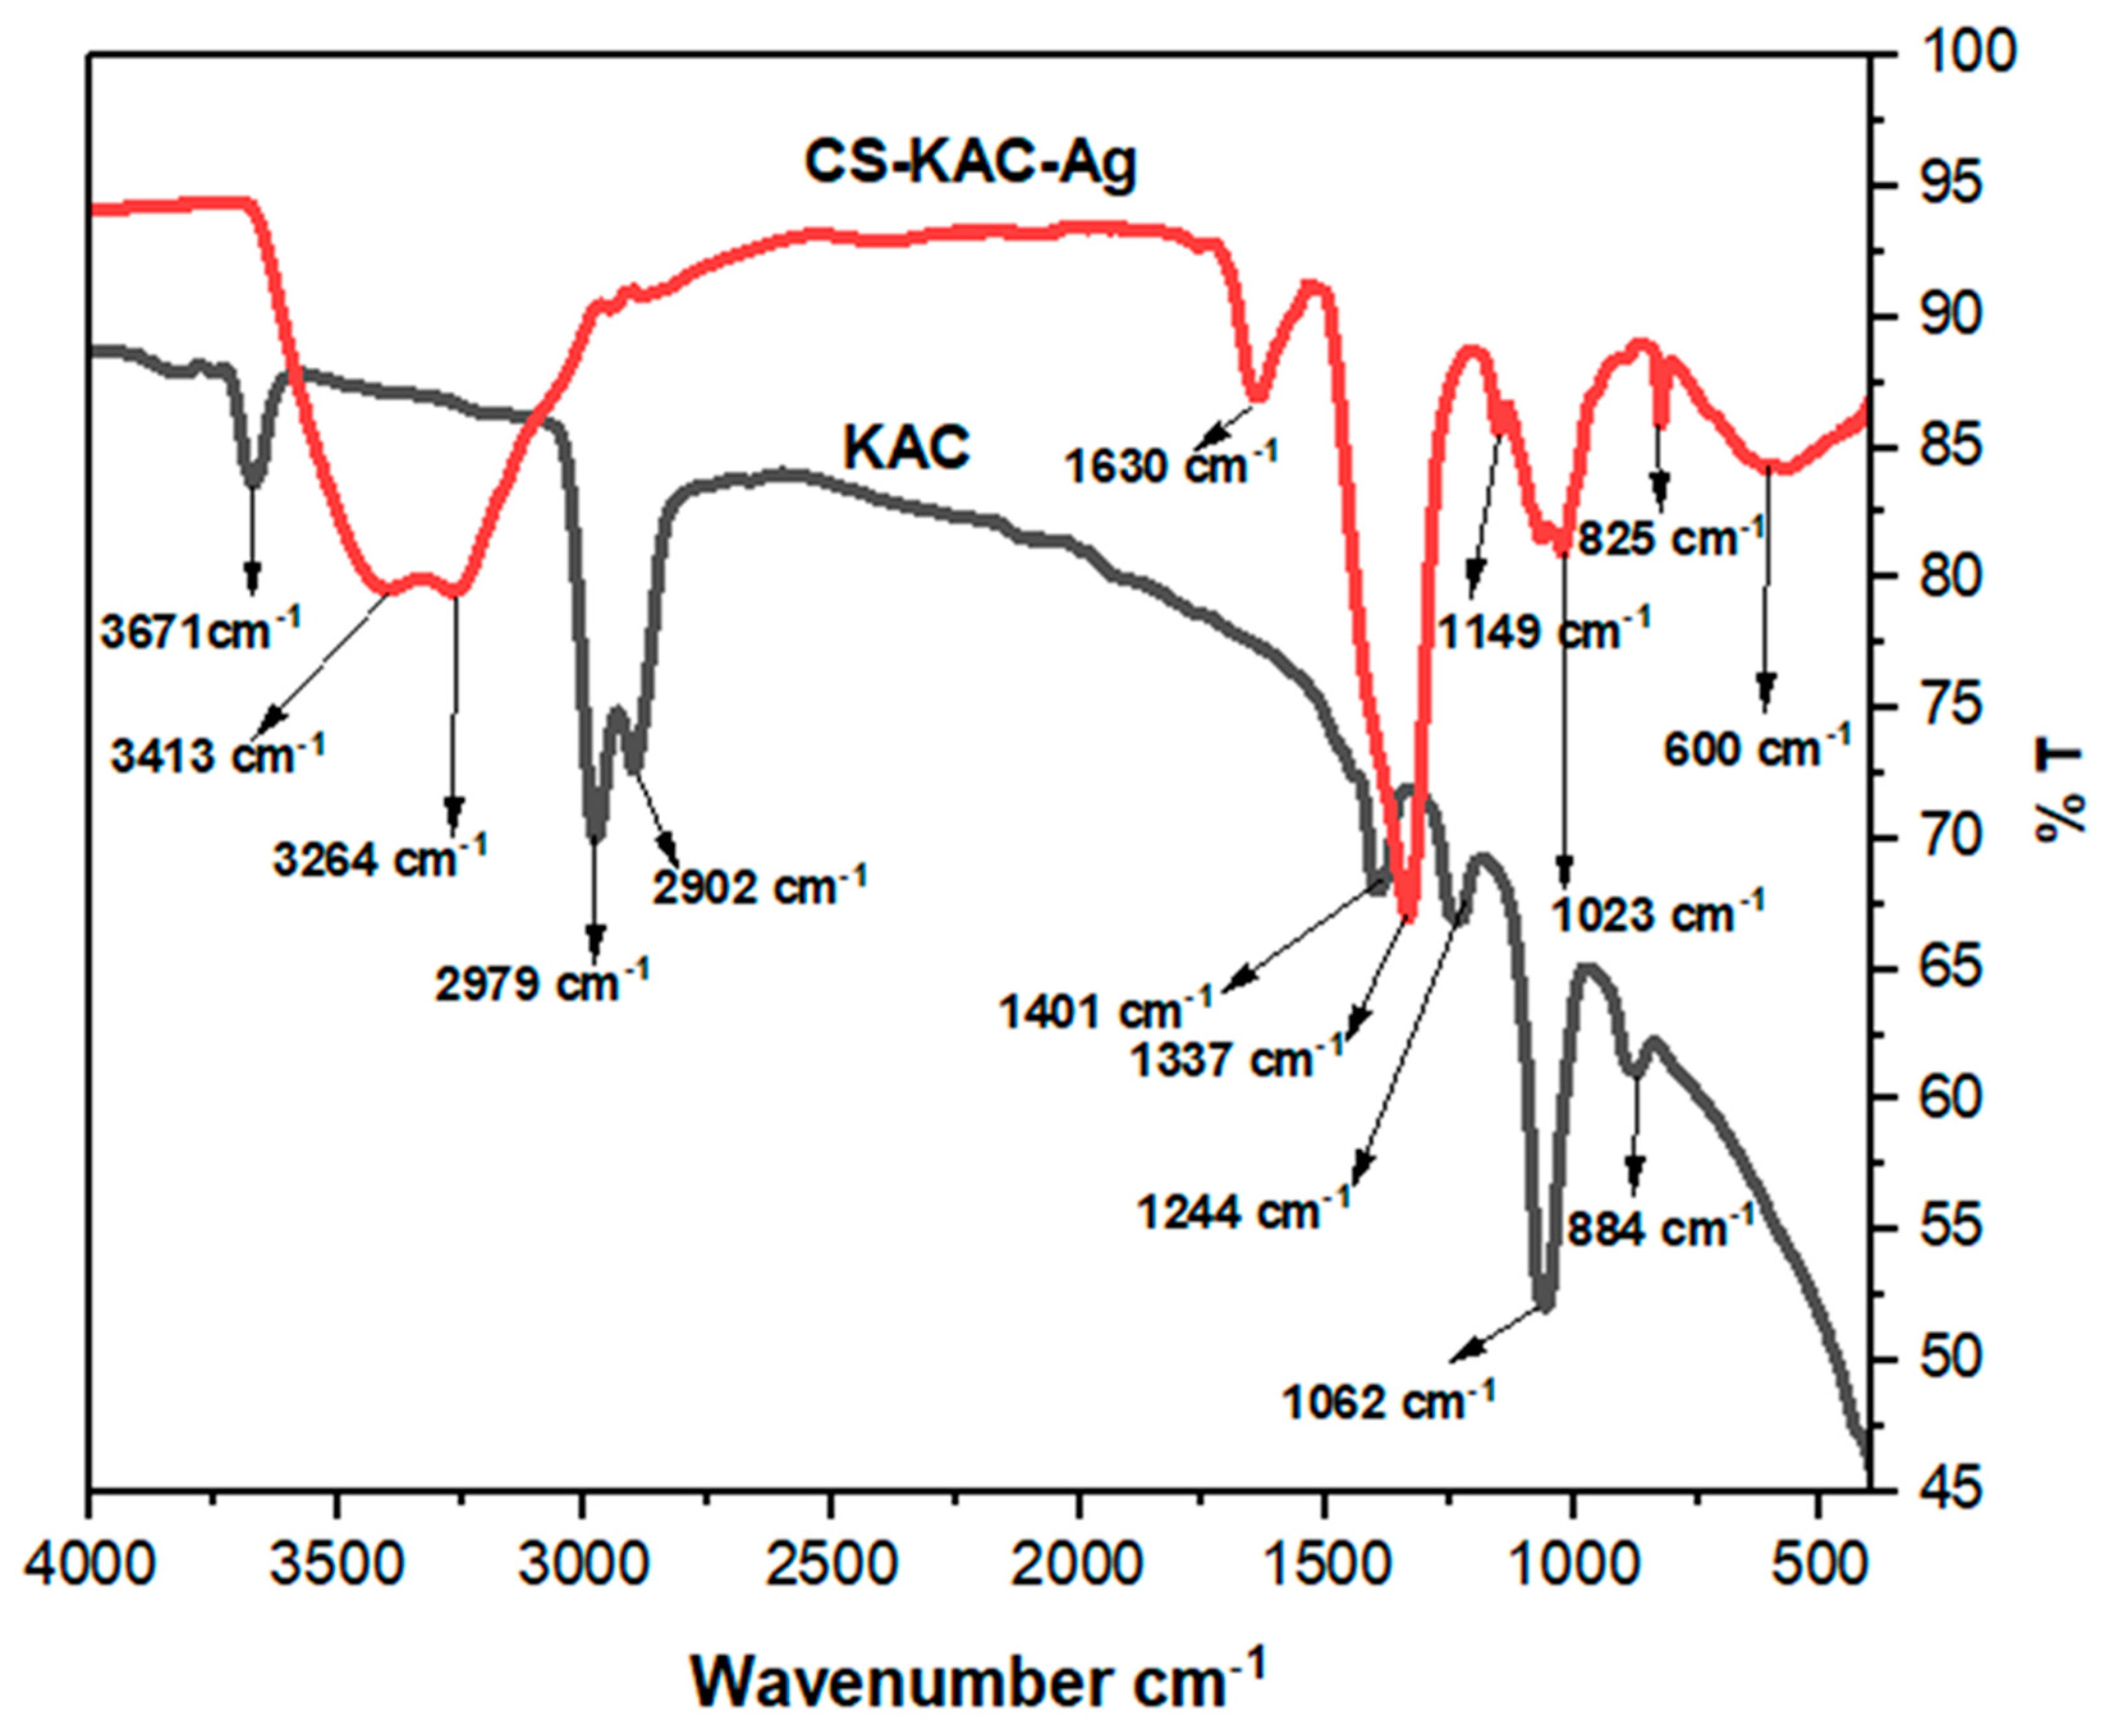
4.1.4. FTIR Analysis
4.2. Statistical Results and Interpretation
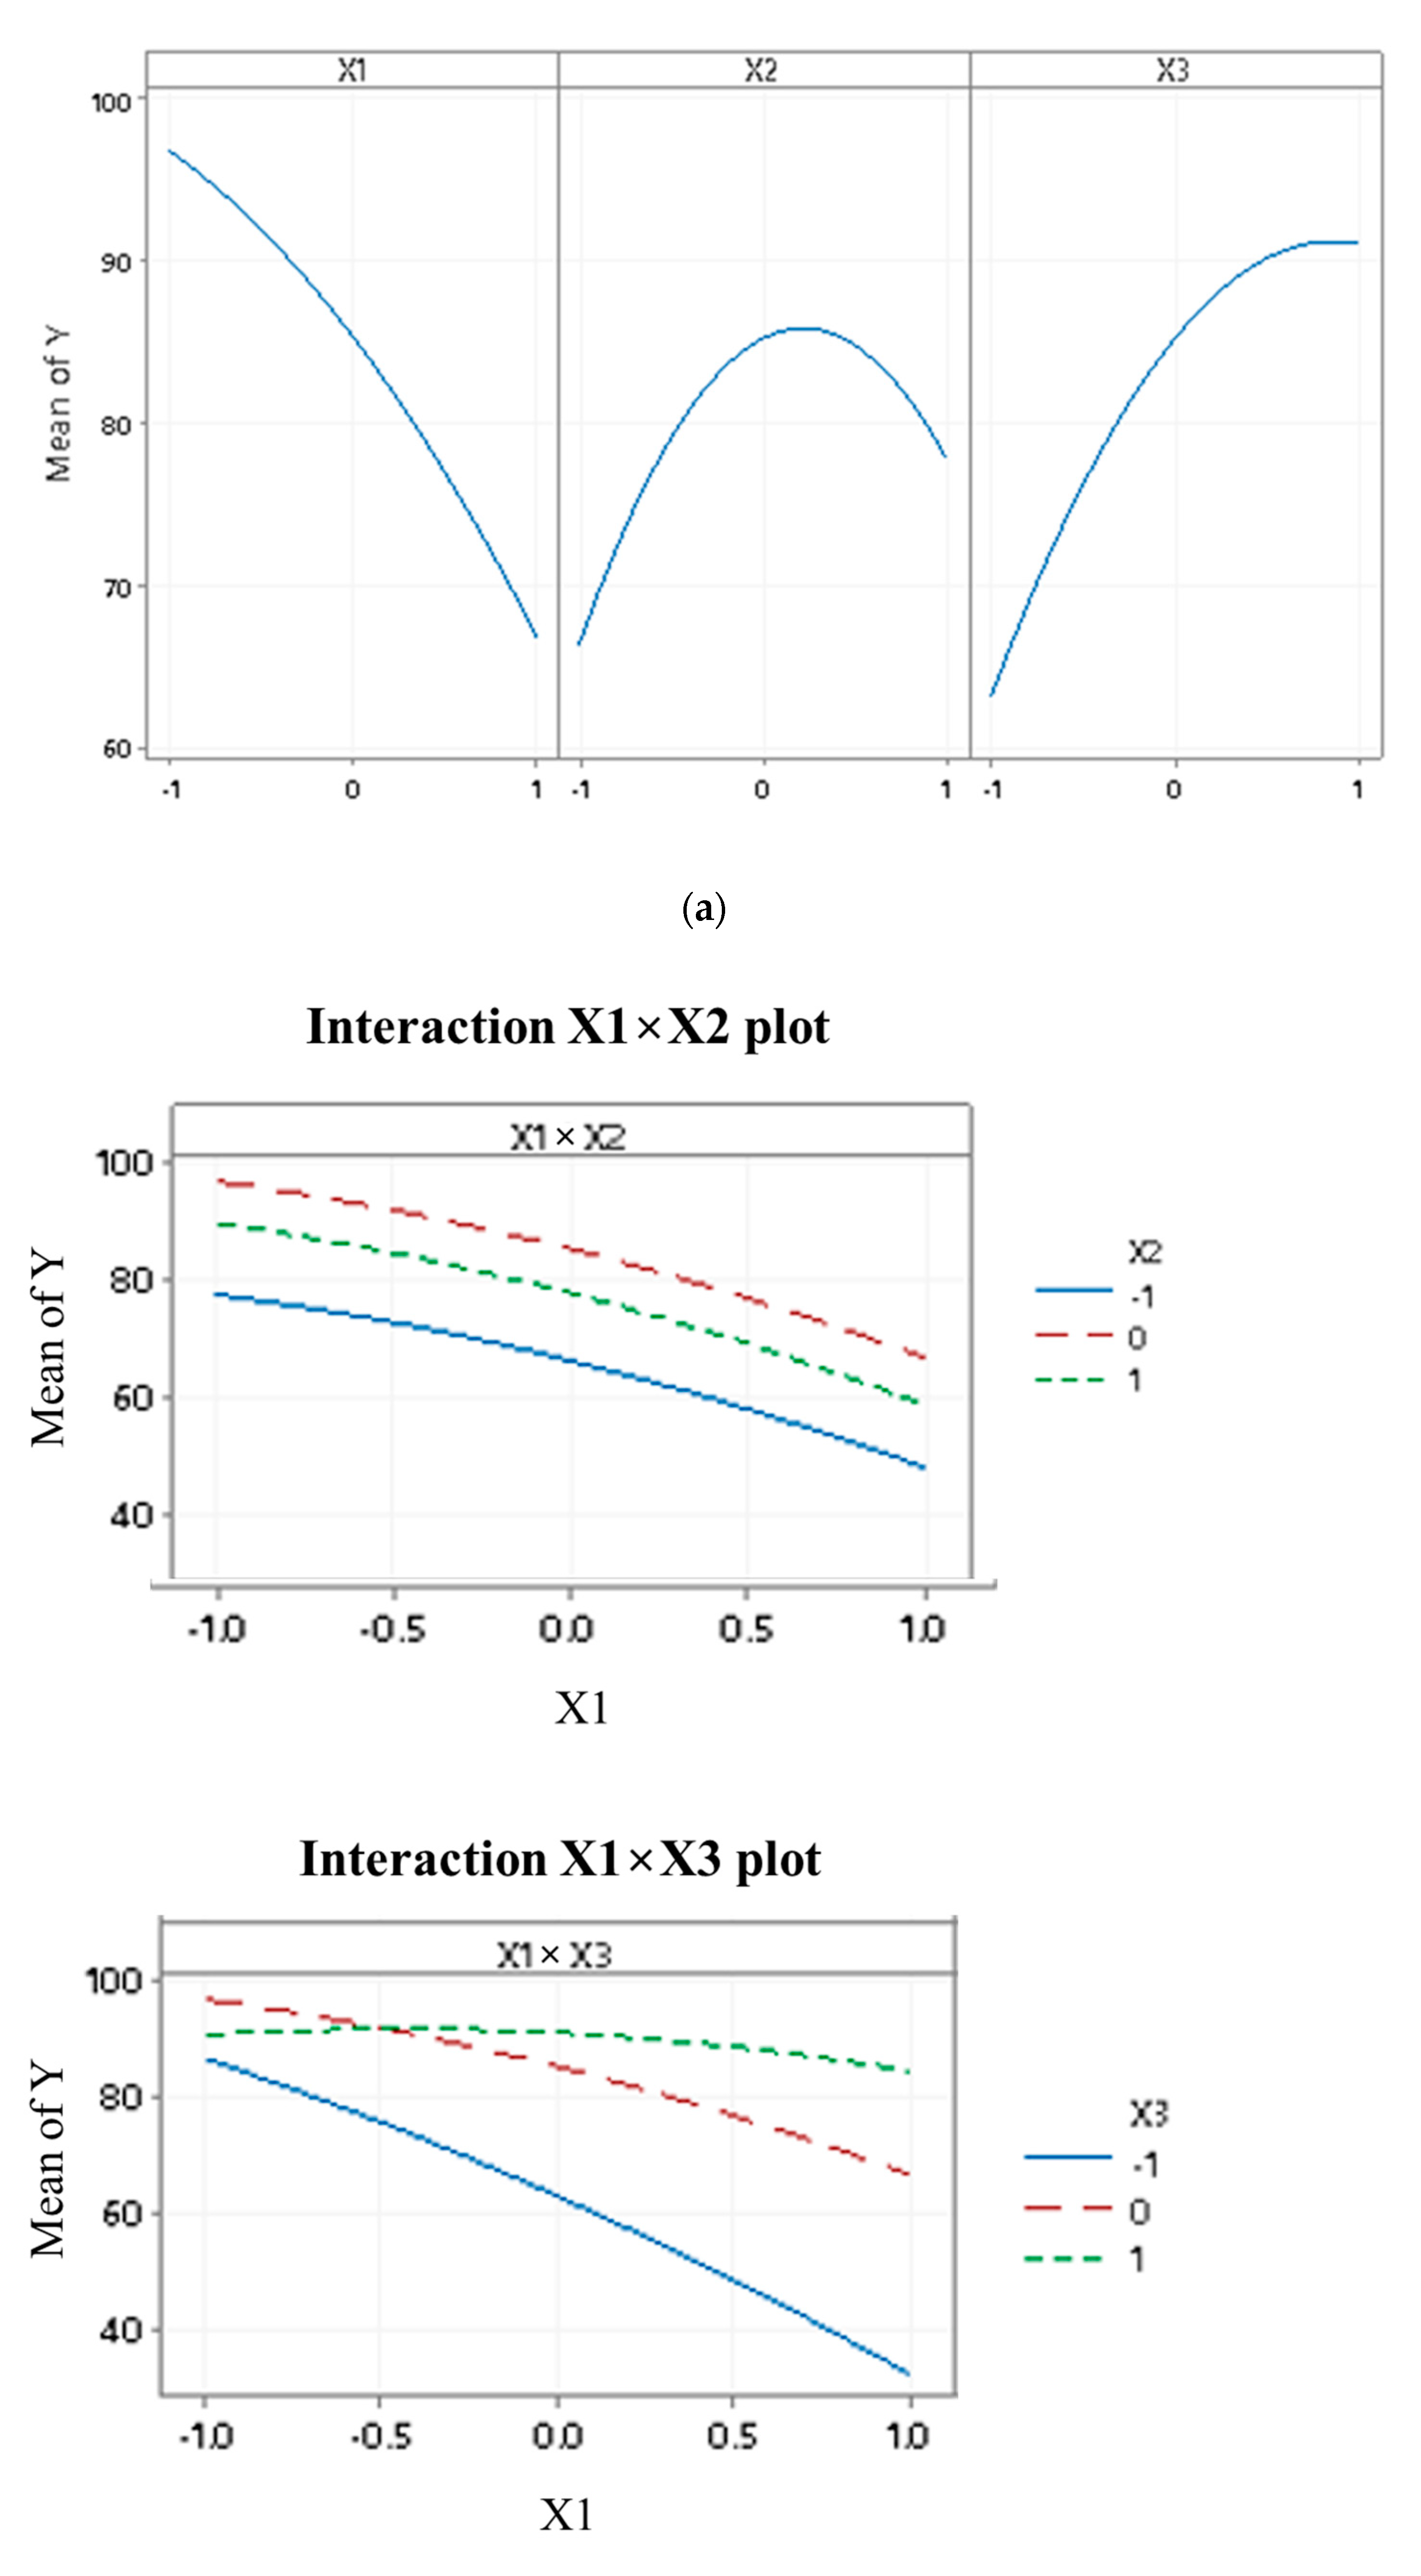
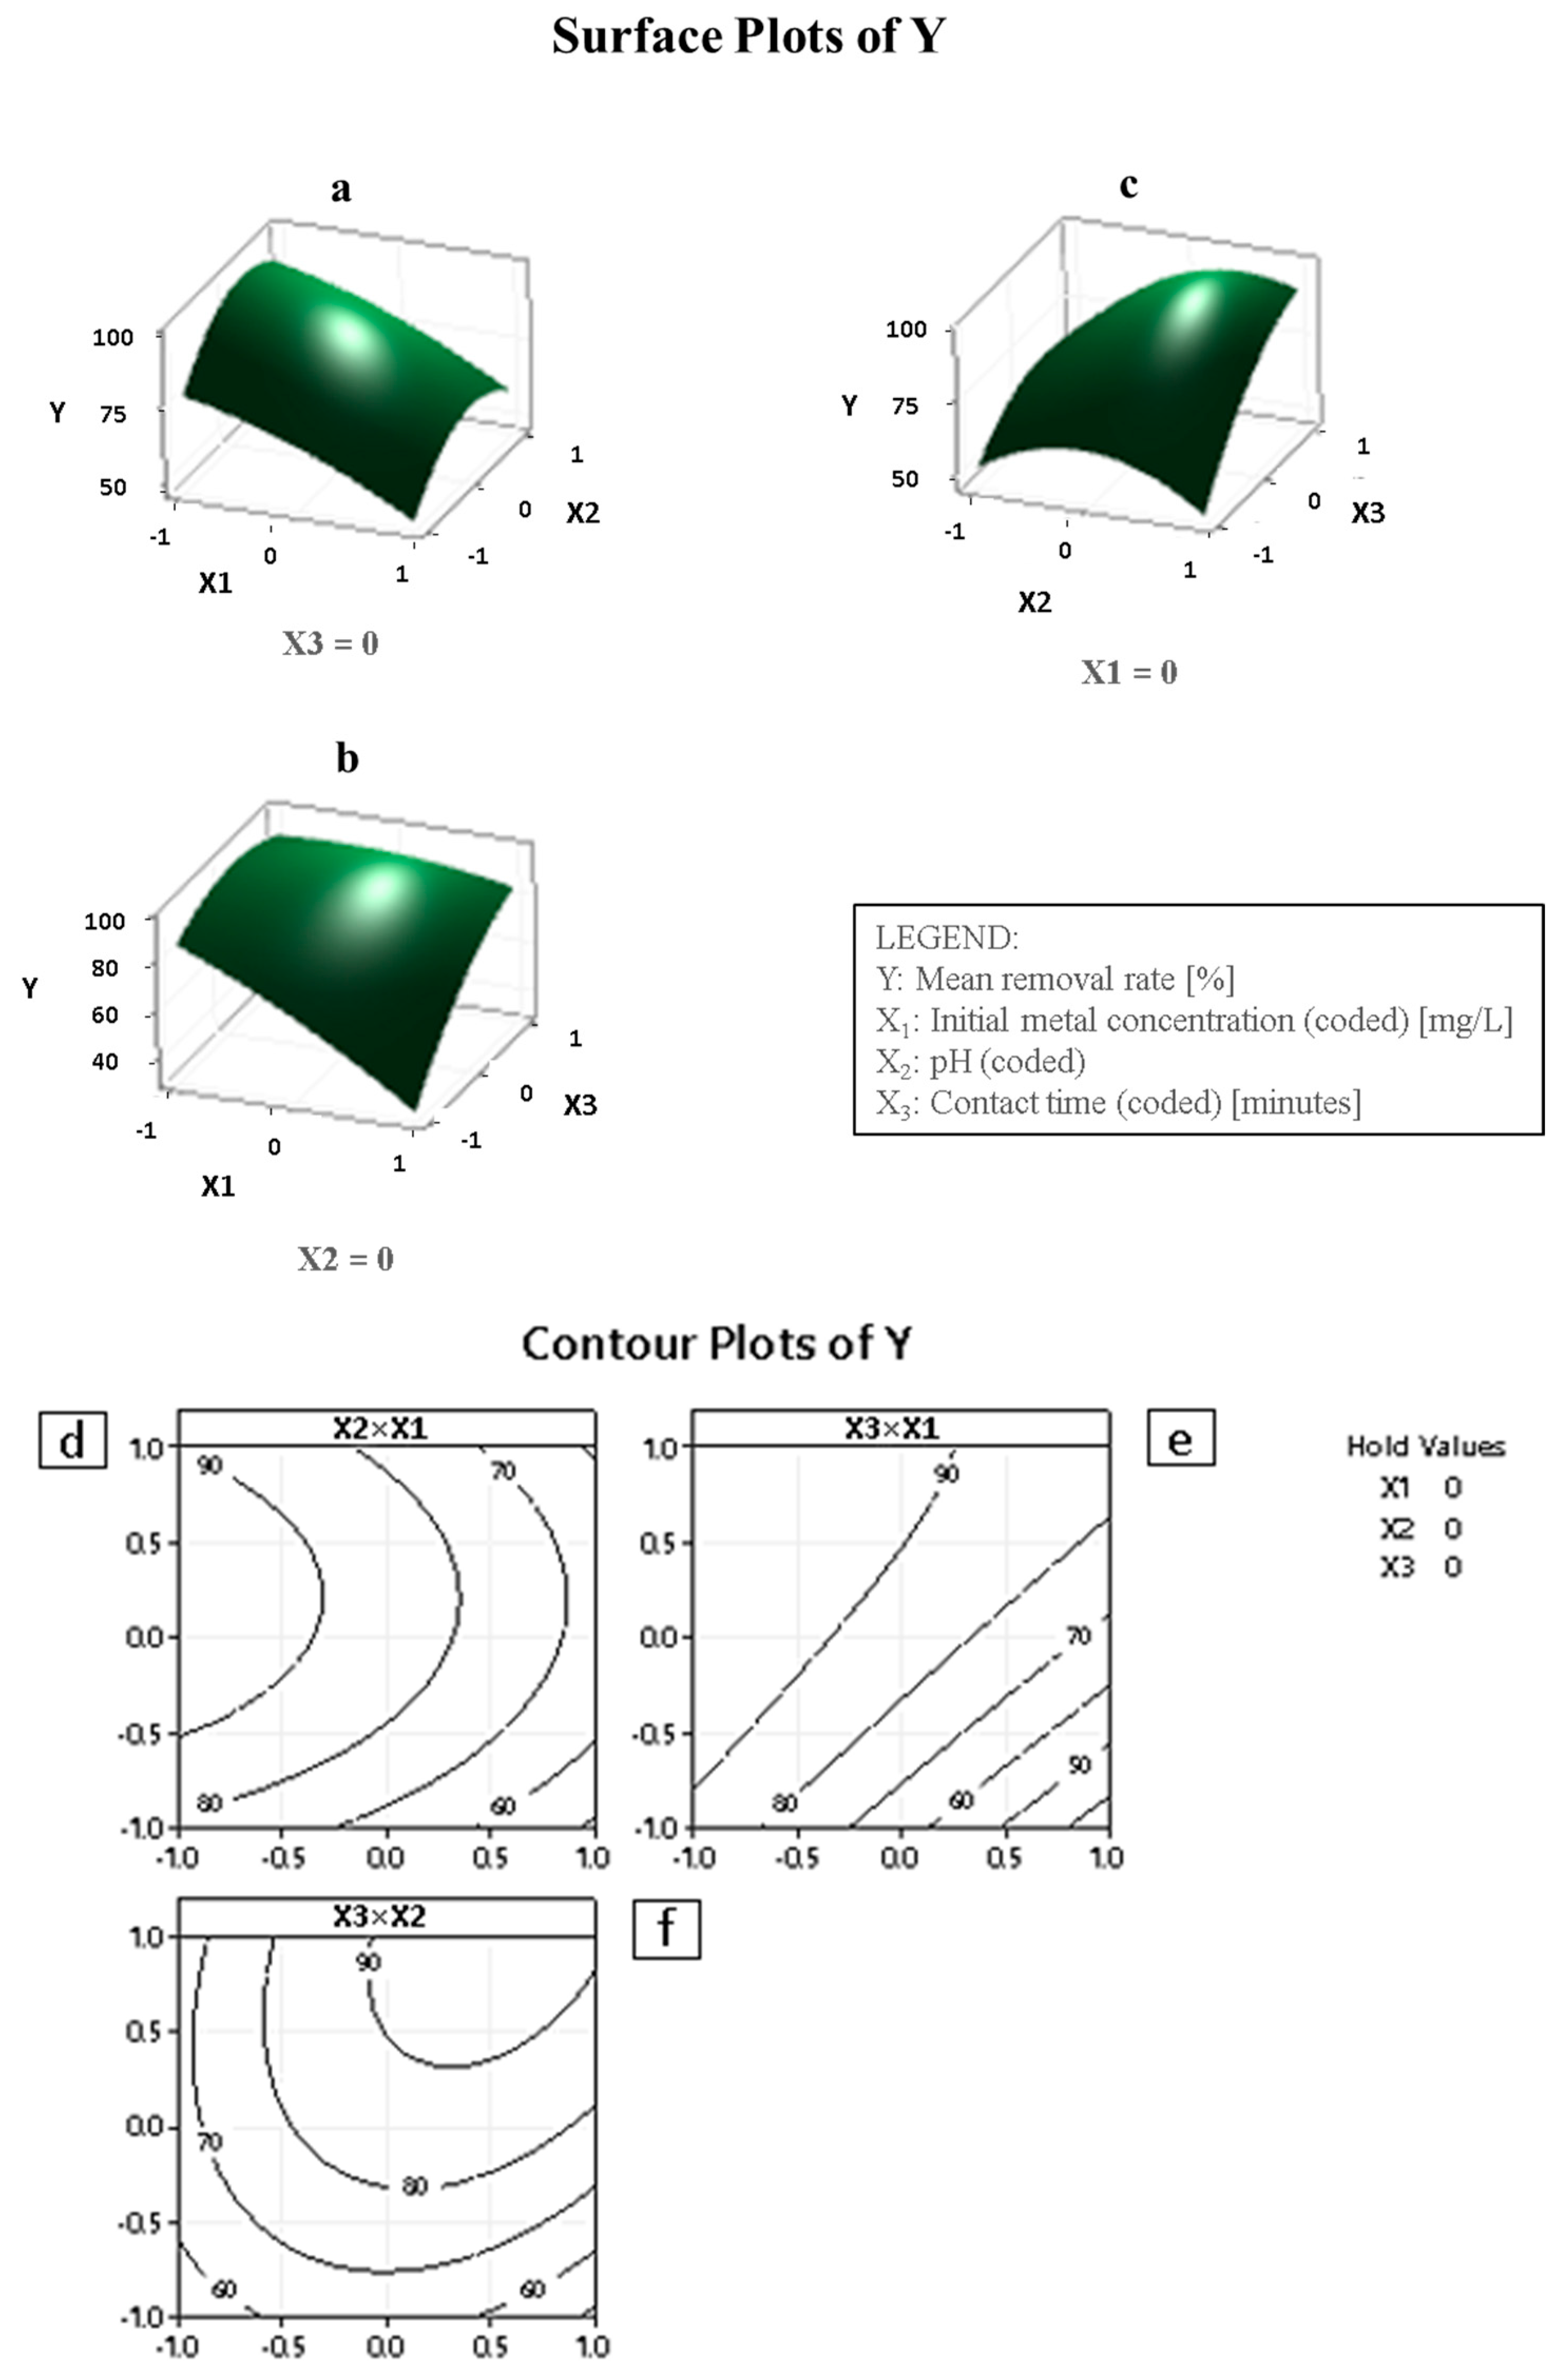
4.3. Interaction Effect on the Removal of Cd2+
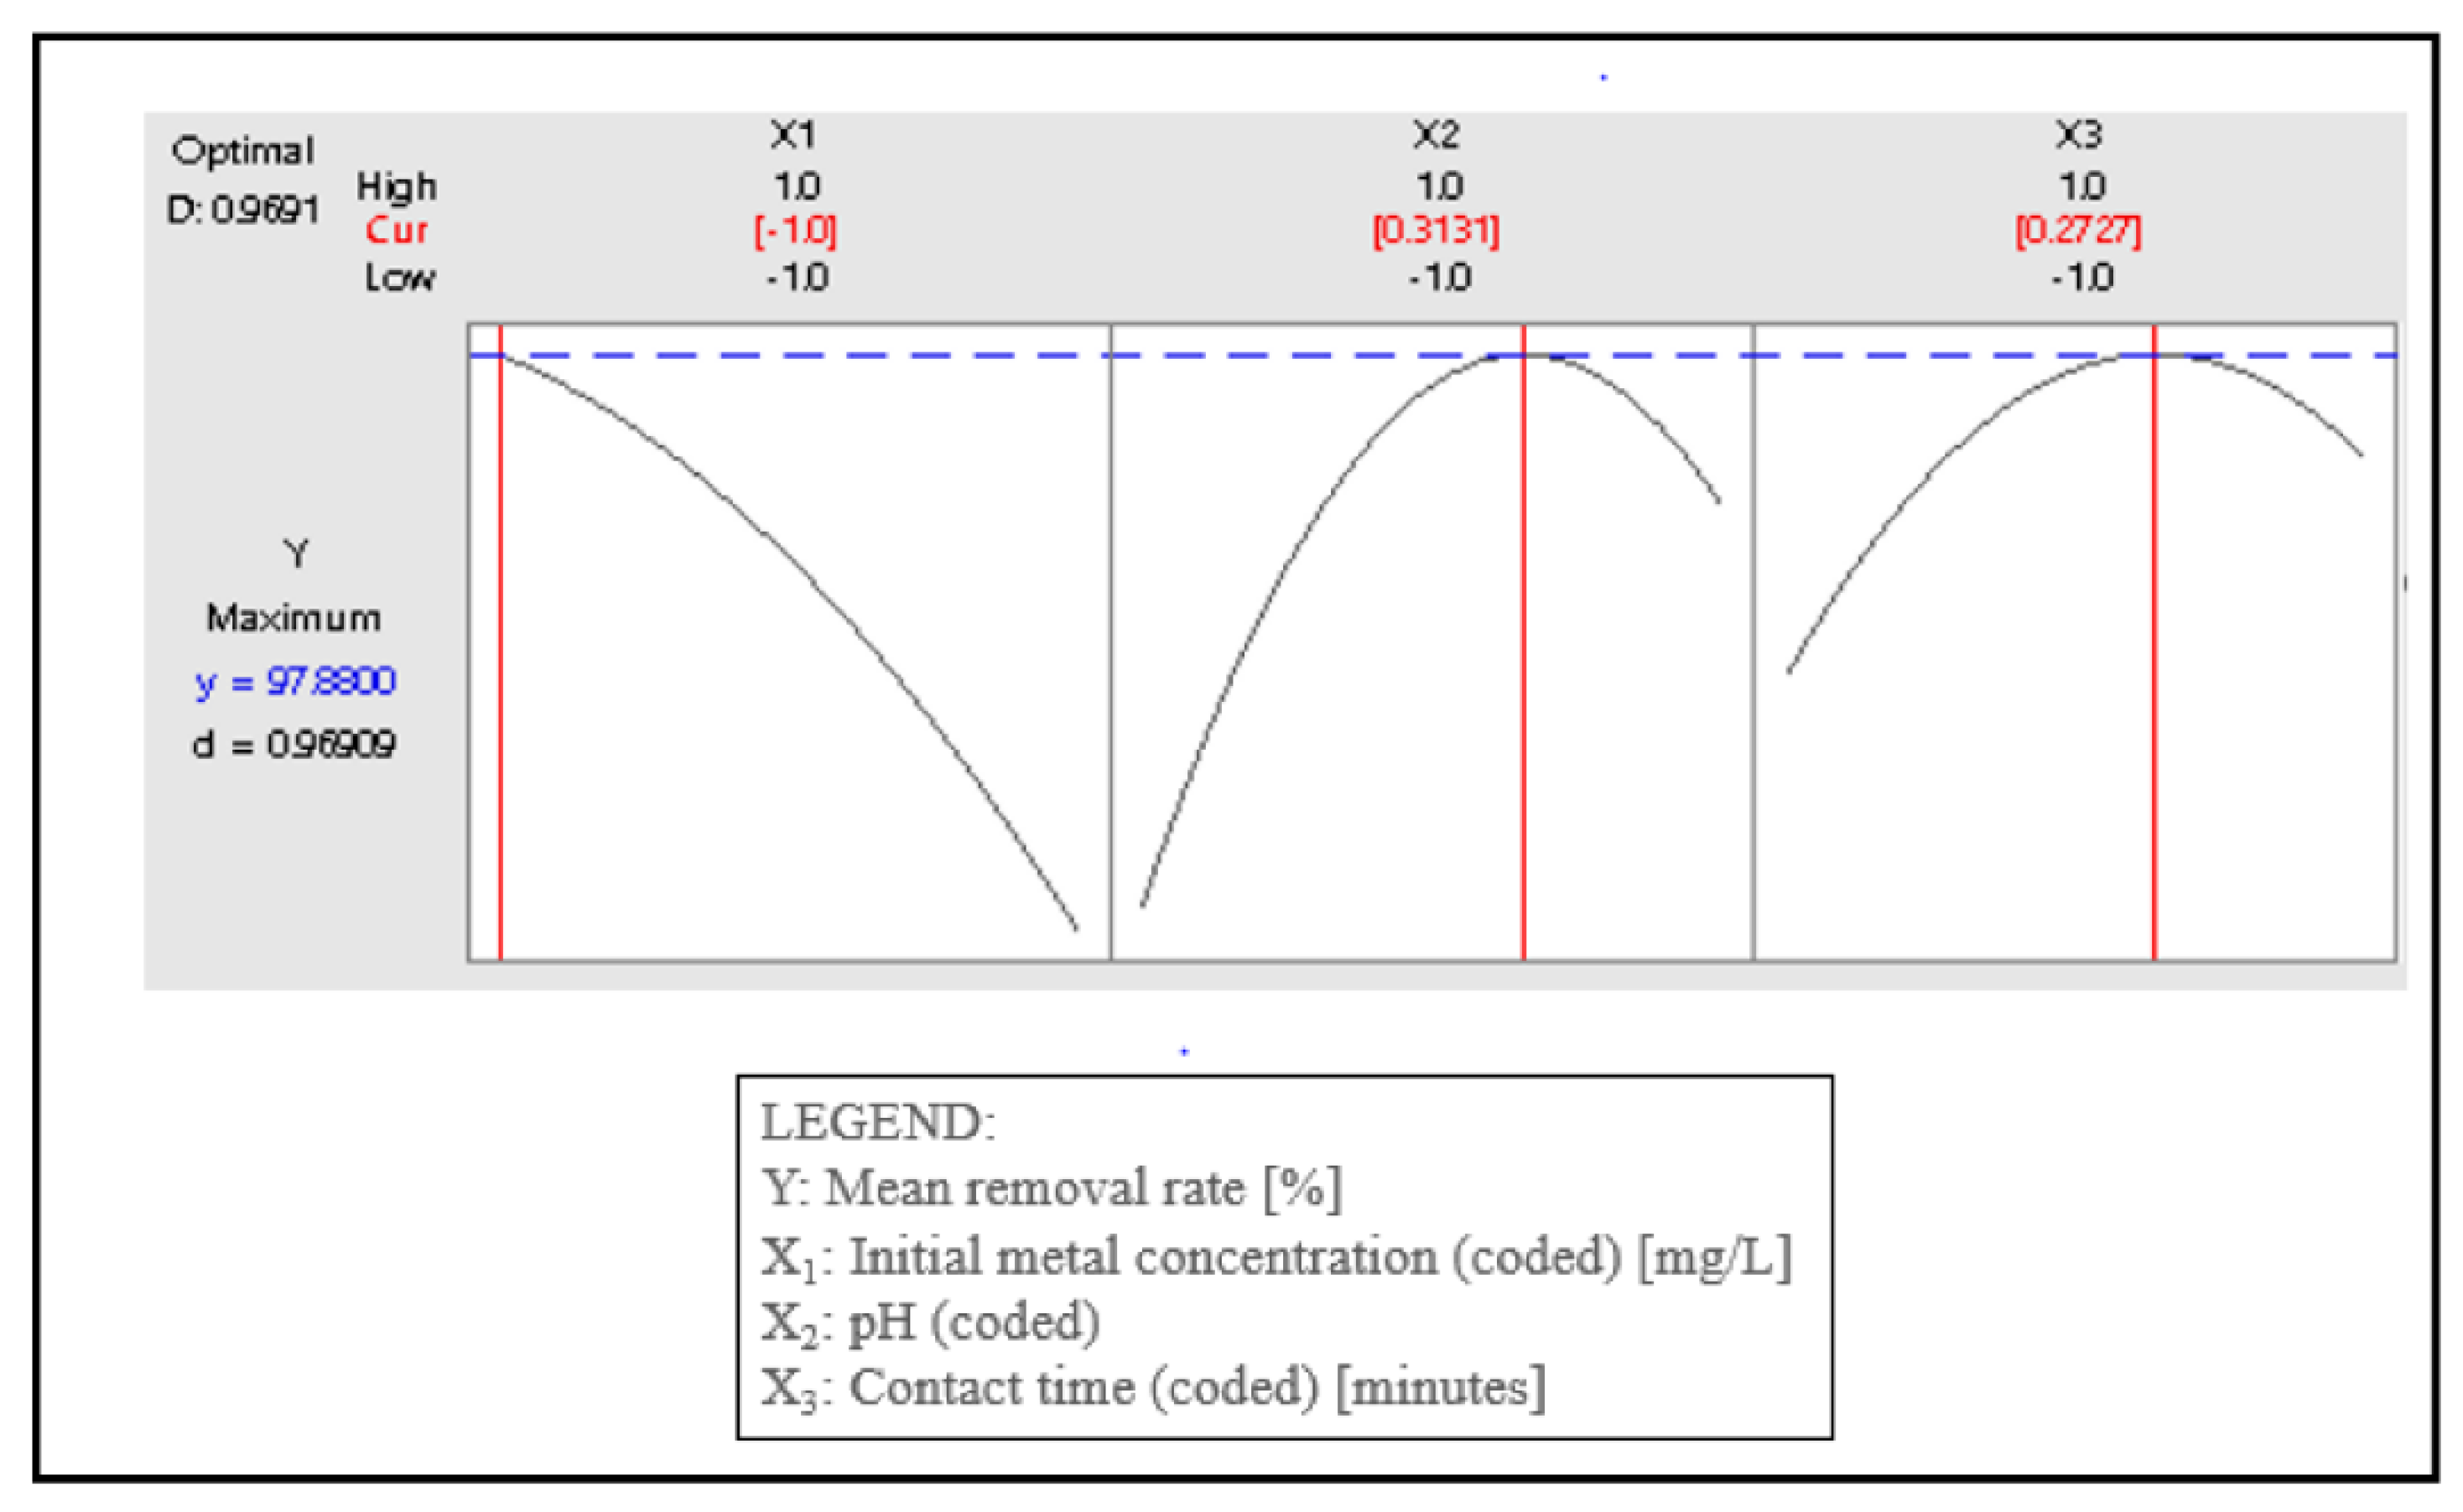
4.4. Optimization Results and Interpretation
4.5. Adsorption Kinetics
4.6. Application to Mining Wastewater Sample
4.7. Reusability Test of the Nano-adsorbent
4.8. Adsorption Mechanism
4.9. Comparison with Other Nanobiocomposites
5. Conclusions
Author Contributions
Funding
Institutional Review Board Statement
Informed Consent Statement
Data Availability Statement
Acknowledgments
Conflicts of Interest
References
- Esvandi, Z.; Foroutan, R.; Mirjalili, M.; Sorial, G.A.; Ramavandi, B. Physicochemical behavior of Penaeuse semisulcatuse chitin for Pb and Cd removal from aqueous environment. J. Polym. Environ. 2019, 27, 263–274. [Google Scholar] [CrossRef]
- Godt, J.; Scheidig, F.; Grosse-Siestrup, C.; Esche, V.; Brandenburg, P.; Reich, A.; Groneberg, D.A. The toxicity of cadmium and resulting hazards for human health. J. Occup. Med. Toxicol. 2006, 1, 1–6. [Google Scholar] [CrossRef] [PubMed]
- Kenawy, I.M.M.; Abou El-Reash, Y.G.; Hassanien, M.M.; Alnagar, N.R.; Mortada, W.I. Use of microwave irradiation for modification of mesoporous silica nanoparticles by thioglycolic acid for removal of cadmium and mercury. Microporous Mesoporous Mater. 2018, 258, 217–227. [Google Scholar] [CrossRef]
- Staessen, J.A.; Roels, H.A.; Emelianov, D.; Kuznetsova, T.; Thijs, L.; Vangronsveld, J.; Fagard, R. Environmental exposure to cadmium, forearm bone density, and risk of fractures: Prospective population study. Lancet 1999, 353, 1140–1144. [Google Scholar] [CrossRef]
- Burakov, A.E.; Galunin, E.V.; Burakova, I.V.; Kucherova, A.E.; Agarwal, S.; Tkachev, A.G.; Gupta, V.K. Adsorption of heavy metals on conventional and nanostructured materials for wastewater treatment purposes: A review. Ecotoxicol. Environ. Saf. 2018, 148, 702–712. [Google Scholar] [CrossRef]
- Othmani, A.; Magdouli, S.; Kumar, P.S.; Kapoor, A.; Chellam, P.V.; Gökkuş, Ö. Agricultural waste materials for adsorptive removal of phenols, chromium (VI) and cadmium (II) from wastewater: A review. Environ. Res. 2021, 204, 111916. [Google Scholar] [CrossRef]
- Nayak, A.; Bhushan, B.; Gupta, V.; Sharma, P. Chemically activated carbon from lignocellulosic wastes for heavy metal wastewater remediation: Effect of activation conditions. J. Colloid Interface Sci. 2017, 493, 228–240. [Google Scholar] [CrossRef]
- Kavand, M.; Eslami, P.; Razeh, L. The adsorption of cadmium and lead ions from the synthesis wastewater with the activated carbon: Optimization of the single and binary systems. J. Water Process Eng. 2020, 34, 101151. [Google Scholar] [CrossRef]
- Kolluru, S.S.; Agarwal, S.; Sireesha, S.; Sreedhar, I.; Kale, S.R. Heavy metal removal from Wastewater using Nanomaterials-Process and Engineering Aspects. Process Saf. Environ. Prot. 2021, 150, 323–355. [Google Scholar] [CrossRef]
- Cheng, S.; Liu, Y.; Xing, B.; Qin, X.; Zhang, C.; Xia, H. Lead and cadmium clean removal from wastewater by sustainable biochar derived from poplar saw dust. J. Clean. Prod. 2021, 314, 128074. [Google Scholar] [CrossRef]
- Mariana, M.; HPS, A.K.; Mistar, E.; Yahya, E.B.; Alfatah, T.; Danish, M.; Amayreh, M. Recent advances in activated carbon modification techniques for enhanced heavy metal adsorption. J. Water Process Eng. 2021, 43, 102221. [Google Scholar] [CrossRef]
- Puri, N.; Gupta, A.; Mishra, A. Recent advances on nano-adsorbents and nanomembranes for the remediation of water. J. Clean. Prod. 2021, 322, 129051. [Google Scholar] [CrossRef]
- Li, Y.; Gao, L.; Wang, Y.; Cheng, S.; Wu, G.; Yang, X.; Wan, S. Development of an acidized biochar-supported hydrated Fe (III) oxides for highly efficient cadmium and copper sequestration from water. Sci. Total Environ. 2021, 784, 147017. [Google Scholar] [CrossRef] [PubMed]
- Vakili, M.; Deng, S.; Cagnetta, G.; Wang, W.; Meng, P.; Liu, D.; Yu, G. Regeneration of chitosan-based adsorbents used in heavy metal adsorption: A review. Sep. Purif. Technol. 2019, 224, 373–387. [Google Scholar] [CrossRef]
- Bakshi, P.S.; Selvakumar, D.; Kadirvelu, K.; Kumar, N.S. Chitosan as an environment friendly biomaterial–a review on recent modifications and applications. Int. J. Biol. Macromol. 2020, 150, 1072–1083. [Google Scholar] [CrossRef]
- Nguyen, L.H.; Nguyen, T.M.P.; Van, H.T.; Vu, X.H.; Ha, T.L.A.; Nguyen, X.H. Treatment of hexavalent chromium contaminated wastewater using activated carbon derived from coconut shell loaded by silver nanoparticles: Batch experiment. Water Air Soil Pollut. 2019, 230, 1–14. [Google Scholar] [CrossRef]
- Ramesh, P.; Durga Prasad, B.; Narayana, K.L. Characterization of kenaf fiber and its composites: A review. J. Reinf. Plast. Compos. 2018, 37, 731–737. [Google Scholar] [CrossRef]
- Sajab, M.S.; Chia, C.H.; Zakaria, S.; Jani, S.M.; Ayob, M.K.; Chee, K.L.; Khiew, P.S.; Chiu, W.S. Citric acid modified kenaf core fibres for removal of methylene blue from aqueous solution. Bioresour. Technol. 2011, 102, 7237–7243. [Google Scholar] [CrossRef]
- Babakhani, A.; Sartaj, M. Removal of Cadmium (II) from aqueous solution using tripolyphosphate cross-linked chitosan. J. Environ. Chem. Eng. 2020, 8, 103842. [Google Scholar] [CrossRef]
- Tuan, T.Q.; Van Son, N.; Dung, H.T.K.; Luong, N.H.; Thuy, B.T.; Van Anh, N.T.; Hoa, N.D.; Hai, N.H. Preparation and properties of silver nanoparticles loaded in activated carbon for biological and environmental applications. J. Hazard. Mater. 2011, 192, 1321–1329. [Google Scholar] [CrossRef]
- Razak, M.R.; Yusof, N.A.; Aris, A.Z.; Nasir, H.M.; Haron, M.J.; Ibrahim, N.A.; Johari, I.S.; Kamaruzaman, S. Phosphoric acid modified kenaf fiber (K-PA) as green adsorbent for the removal of copper (II) ions towards industrial wastewater effluents. React. Funct. Polym. 2020, 147, 104466. [Google Scholar] [CrossRef]
- Xia, C.; Shi, S.Q. Self-activation for activated carbon from biomass: Theory and parameters. Green Chem. 2016, 18, 2063–2071. [Google Scholar] [CrossRef]
- Zuo, Y.; Chen, G.; Zeng, G.; Li, Z.; Yan, M.; Chen, A.; Guo, Z.; Huang, Z.; Tan, Q. Transport, fate, and stimulating impact of silver nanoparticles on the removal of Cd (II) by Phanerochaete chrysosporium in aqueous solutions. J. Hazard. Mater. 2015, 285, 236–244. [Google Scholar] [CrossRef] [PubMed]
- Lin, J.; Su, B.; Sun, M.; Chen, B.; Chen, Z. Biosynthesized iron oxide nanoparticles used for optimized removal of cadmium with response surface methodology. Sci. Total Environ. 2018, 627, 314–332. [Google Scholar] [CrossRef] [PubMed]
- Chaker, H.; Ameur, N.; Saidi-Bendahou, K.; Djennas, M.; Fourmentin, S. Modeling and BoBehnken design optimization of photocatalytic parameters for efficient removal of dye by lanthanum-doped mesoporous TiO2. J. Environ. Chem. Eng. 2021, 9, 104584. [Google Scholar] [CrossRef]
- Hina, K.; Zou, H.; Qian, W.; Zuo, D.; Yi, C. Preparation and performance comparison of cellulose-based activated carbon fibres. Cellulose 2018, 25, 607–617. [Google Scholar] [CrossRef]
- Jayamani, E.; Loong, T.G.; Bakri, M.K.B. Comparative study of Fourier transform infrared spectroscopy (FTIR) analysis of natural fibres treated with chemical, physical and biological methods. Polym. Bull. 2020, 77, 1605–1629. [Google Scholar] [CrossRef]
- Sharma, G.; Naushad, M. Adsorptive removal of noxious cadmium ions from aqueous medium using activated carbon/zirconium oxide composite: Isotherm and kinetic modelling. J. Mol. Liq. 2020, 310, 113025. [Google Scholar] [CrossRef]
- Singh, V.; Sharma, A.K.; Tripathi, D.N.; Sanghi, R. Poly (methylmethacrylate) grafted chitosan: An efficient adsorbent for anionic azo dyes. J. Hazard. Mater. 2009, 161, 955–966. [Google Scholar] [CrossRef]
- Xie, Y.; Li, S.; Wang, F.; Liu, G. Removal of perchlorate from aqueous solution using protonated cross-linked chitosan. Chem. Eng. J. 2010, 156, 56–63. [Google Scholar] [CrossRef]
- Tan, G.; Yuan, H.; Liu, Y.; Xiao, D. Removal of lead from aqueous solution with native and chemically modified corncobs. J. Hazard. Mater. 2010, 174, 740–745. [Google Scholar] [CrossRef] [PubMed]
- Tang, C.; Hu, D.; Cao, Q.; Yan, W.; Xing, B. Silver nanoparticles-loaded activated carbon fibers using chitosan as binding agent: Preparation, mechanism, and their antibacterial activity. Appl. Surf. Sci. 2017, 394, 457–465. [Google Scholar] [CrossRef]
- Hair, J.F.; Anderson, R.E.; Tatham, R.L.; Black, W.C. Multivariate Data Analysis, 5th ed.; Prentice-Hall: Englewood Cliffs, NJ, USA, 1998. [Google Scholar]
- Koohang, A.; Nord, J.H.; Sandoval, Z.V.; Paliszkiewicz, J. Reliability, validity, and strength of a unified model for information security policy compliance. J. Comput. Inf. Syst. 2020, 61, 1–9. [Google Scholar] [CrossRef]
- Egbosiuba, T.C.; Abdulkareem, A.S.; Kovo, A.S.; Afolabi, E.A.; Tijani, J.O.; Bankole, M.T.; Roos, W.D. Adsorption of Cr (VI), Ni (II), Fe (II) and Cd (II) ions by KIAgNPs decorated MWCNTs in a batch and fixed bed process. Sci. Rep. 2021, 11, 75. [Google Scholar] [CrossRef] [PubMed]
- Wang, T.; Kuttappan, D.; Amalaradjou, M.A.; Luo, Y.; Luo, Y. Polydopamine-coated chitosan hydrogel beads for synthesis and immobilization of silver nanoparticles to simultaneously enhance antimicrobial activity and adsorption kinetics. Adv. Compos. Hybrid Mater. 2021, 4, 696–706. [Google Scholar] [CrossRef]
- Jawad, A.H.; Mamat, N.H.; Hameed, B.H.; Ismail, K. Biofilm of cross-linked chitosan-ethylene glycol diglycidyl ether for removal of reactive red 120 and methyl orange: Adsorption and mechanism studies. J. Environ. Chem. Eng. 2019, 7, 102965. [Google Scholar] [CrossRef]
- Sharififard, H.; Rezvanpanah, E.; Rad, S.H. A novel natural chitosan/activated carbon/iron bio-nanocomposite: Sonochemical synthesis, characterization, and application for cadmium removal in batch and continuous adsorption process. Bioresour. Technol. 2018, 270, 562–569. [Google Scholar] [CrossRef]
- Alhan, S.; Nehra, M.; Dilbaghi, N.; Singhal, N.K.; Kim, K.H.; Kumar, S. Potential use of ZnO@ activated carbon nanocomposites for the adsorptive removal of Cd2+ ions in aqueous solutions. Environ. Res. 2019, 173, 411–418. [Google Scholar] [CrossRef]
- Pourbeyram, S. Effective removal of heavy metals from aqueous solutions by graphene oxide–zirconium phosphate (GO–Zr-P) nanocomposite. Industrial & Engineering Chem. Res. 2016, 55, 5608–5617. [Google Scholar]
- Peighambardoust, S.J.; Foroutan, R.; Peighambardoust, S.H.; Khatooni, H.; Ramavandi, B. Decoration of Citrus limon wood carbon with Fe3O4 to enhanced Cd2+ removal: A reclaimable and magnetic nanocomposite. Chemosphere 2021, 282, 131088. [Google Scholar] [CrossRef]
- Givianrad, M.H.; Rabani, M.; Saber-Tehrani, M.; Aberoomand-Azar, P.; Sabzevari, M.H. Preparation and characterization of nanocomposite, silica aerogel, activated carbon and its adsorption properties for Cd (II) ions from aqueous solution. J. Saudi Chem. Soc. 2013, 17, 329–335. [Google Scholar] [CrossRef]
- Pawar, R.R.; Kim, M.; Kim, J.G.; Hong, S.M.; Sawant, S.Y.; Lee, S.M. Efficient removal of hazardous lead, cadmium, and arsenic from aqueous environment by iron oxide modified clay-activated carbon composite beads. Appl. Clay Sci. 2018, 162, 339–350. [Google Scholar] [CrossRef]
- Guyo, U.; Makawa, T.; Moyo, M.; Nharingo, T.; Nyamunda, B.C.; Mugadza, T. Application of response surface methodology for Cd (II) adsorption on maize tassel-magnetite nanohybrid adsorbent. J. Environ. Chem. Eng. 2015, 3, 2472–2483. [Google Scholar] [CrossRef]


| Factors | Level 1 | Level 2 | Level 3 | |||
|---|---|---|---|---|---|---|
| Actual | Coded | Actual | Coded | Actual | Coded | |
| Initial metal concentrations (X1) | 10 mg L−1 | −1 | 30 mg L−1 | 0 | 50 mg L−1 | 1 |
| pH (X2) | 3 | −1 | 6 | 0 | 9 | 1 |
| Contact time (X3) | 20 min | −1 | 70 min | 0 | 120 min | 1 |
| Run No. | Coded Values | ||
|---|---|---|---|
| X1 | X2 | X3 | |
| 1 | 1 | 0 | 1 |
| 2 | 1 | −1 | 0 |
| 3 | 0 | −1 | 1 |
| 4 | 0 | 0 | 0 |
| 5 | 0 | −1 | −1 |
| 6 | 1 | 1 | 0 |
| 7 | 0 | 1 | 1 |
| 8 | 0 | 0 | 0 |
| 9 | −1 | 0 | −1 |
| 10 | 1 | 0 | −1 |
| 11 | 0 | 0 | 0 |
| 12 | −1 | −1 | 0 |
| 13 | −1 | 1 | 0 |
| 14 | −1 | 0 | 1 |
| 15 | 0 | 1 | −1 |
| Physio-Chemical Characteristics | KF | KAC | CS-KAC-Ag |
|---|---|---|---|
| BET specific surface area, m2/g | 3.2 | 843.3 | 204.400 |
| T plot micropore volume, cm3/g | 0.0 | 0.157 | 0.003 |
| T plot micropore area, m2/g | 0.0 | 317.9 | 8.300 |
| Cumulative adsorption surface area (BJH method), m2/g | 0.0 | 387.9 | 151.300 |
| Pore diameter, nm | 5.5 | 3.5 | 3.200 |
| Source | DF | Adj SS | Adj MS | F-Value | p-Value | VIF |
|---|---|---|---|---|---|---|
| Model | 9 | 5270.20 | 585.58 | 20.92 | 0.002 | |
| Linear | 3 | 3610.29 | 1203.43 | 43.00 | 0.001 | |
| X1 (initial metal concentration) | 1 | 1800.00 | 1800.00 | 64.32 | 0.000 | 1 |
| X2 (pH) | 1 | 258.21 | 258.21 | 9.23 | 0.029 | 1 |
| X3 (contact time) | 1 | 1552.08 | 1552.08 | 55.46 | 0.001 | 1 |
| Square | 3 | 842.55 | 280.85 | 10.04 | 0.015 | |
| X1 × X1 | 1 | 45.30 | 45.30 | 1.62 | 0.259 | 1.01 |
| X2 × X2 | 1 | 639.45 | 639.45 | 22.85 | 0.005 | 1.01 |
| X3 × X3 | 1 | 244.35 | 244.35 | 8.73 | 0.032 | 1.01 |
| 2-way interactions | 3 | 817.36 | 272.45 | 9.74 | 0.016 | |
| X1 × X2 | 1 | 0.54 | 0.54 | 0.02 | 0.895 | 1 |
| X1 × X3 | 1 | 570.02 | 570.02 | 20.37 | 0.006 | 1 |
| X2 × X3 | 1 | 246.80 | 246.80 | 8.82 | 0.031 | 1 |
| Error | 5 | 139.93 | 27.99 | |||
| Lack-of-fit | 3 | 139.93 | 46.64 | |||
| Pure Error | 2 | 5270.20 | 585.58 | 20.92 | 0.002 | |
| Total | 14 | 3610.29 | 1203.43 | 43.00 | 0.001 |
| Run No. | Coded Values | Actual Values | Predicted % Removal | % Removal | ||||
|---|---|---|---|---|---|---|---|---|
| X1 | X2 | X3 | X1 [mg L−1] | X2 | X3 [min.] | Ypred [%] | Yexp [%] | |
| 1 | 1 | 0 | 1 | 50 | 6 | 120 | 84.41 | 84.08 |
| 2 | 1 | −1 | 0 | 50 | 3 | 70 | 48.2 | 47.12 |
| 3 | 0 | −1 | 1 | 30 | 3 | 120 | 64.27 | 62.83 |
| 4 | 0 | 0 | 0 | 30 | 6 | 70 | 85.17 | 83.77 |
| 5 | 0 | −1 | −1 | 30 | 3 | 20 | 52.13 | 51.31 |
| 6 | 1 | 1 | 0 | 50 | 9 | 70 | 58.82 | 54.45 |
| 7 | 0 | 1 | 1 | 30 | 9 | 120 | 91.35 | 91.10 |
| 8 | 0 | 0 | 0 | 30 | 6 | 70 | 85.17 | 83.77 |
| 9 | −1 | 0 | −1 | 10 | 6 | 20 | 86.55 | 82.36 |
| 10 | 1 | 0 | −1 | 50 | 6 | 20 | 32.67 | 31.41 |
| 11 | 0 | 0 | 0 | 30 | 6 | 70 | 85.17 | 83.77 |
| 12 | −1 | −1 | 0 | 10 | 3 | 70 | 77.46 | 77.43 |
| 13 | −1 | 1 | 0 | 10 | 9 | 70 | 89.56 | 87.49 |
| 14 | −1 | 0 | 1 | 10 | 6 | 120 | 90.53 | 89.89 |
| 15 | 0 | 1 | −1 | 30 | 9 | 20 | 47.77 | 46.07 |
| Kinetic Models | Parameters | Cd2+ |
|---|---|---|
| Pseudo-first-order | qe (mg g−1) | 16.234 |
| k1 (min−1) | 0.037 | |
| R2 | 0.850 | |
| Pseudo-second-order | qe (mg g−1) | 46.948 |
| k2 | 0.021 | |
| R2 | 0.998 |
| No. | Adsorbent | Concentration (mg L−1) | pH | Adsorbent Dosage (g/L) | Removal Efficiency % | Literature |
|---|---|---|---|---|---|---|
| 1 | Chitosan/activated carbon iron nanocomposite | 5 | 4.2 | 0.03 | 95 | [38] |
| 2 | ZnO/activated carbon | 100 | 7 | 0.10 | 80 | [39] |
| 3 | Graphene Oxide−Zirconium Phosphate (GO−Zr-P) Nanocomposite | 50 | 6 | 0.15 | 99 | [40] |
| 4 | Lemon-activated carbon with Fe3O4 | 10 | 6 | 0.14 | 98.1 | [41] |
| 5 | Silica aerogel-activated carbon composite | 3 | 6 | 0.10 | 64.2 | [42] |
| 6 | Iron oxide-modified clay-activated carbon composite | 5 | 4.5 | 2.00 | 70.0 | [43] |
| 7 | Maize tassel-magnetite nanohybrid | 45 | 3.5 | 5.3 | 97.5 | [44] |
| 8 | CS-KAC-Ag | 10 | 6.5 | 0.20 | 95.1 | This study |
Publisher’s Note: MDPI stays neutral with regard to jurisdictional claims in published maps and institutional affiliations. |
© 2022 by the authors. Licensee MDPI, Basel, Switzerland. This article is an open access article distributed under the terms and conditions of the Creative Commons Attribution (CC BY) license (https://creativecommons.org/licenses/by/4.0/).
Share and Cite
Mandal, S.; Marpu, S.B.; Omary, M.A.; Dinulescu, C.C.; Prybutok, V.; Shi, S.Q. Lignocellulosic-Based Activated Carbon-Loaded Silver Nanoparticles and Chitosan for Efficient Removal of Cadmium and Optimization Using Response Surface Methodology. Materials 2022, 15, 8901. https://doi.org/10.3390/ma15248901
Mandal S, Marpu SB, Omary MA, Dinulescu CC, Prybutok V, Shi SQ. Lignocellulosic-Based Activated Carbon-Loaded Silver Nanoparticles and Chitosan for Efficient Removal of Cadmium and Optimization Using Response Surface Methodology. Materials. 2022; 15(24):8901. https://doi.org/10.3390/ma15248901
Chicago/Turabian StyleMandal, Sujata, Sreekar B. Marpu, Mohammad A. Omary, Catalin C. Dinulescu, Victor Prybutok, and Sheldon Q. Shi. 2022. "Lignocellulosic-Based Activated Carbon-Loaded Silver Nanoparticles and Chitosan for Efficient Removal of Cadmium and Optimization Using Response Surface Methodology" Materials 15, no. 24: 8901. https://doi.org/10.3390/ma15248901
APA StyleMandal, S., Marpu, S. B., Omary, M. A., Dinulescu, C. C., Prybutok, V., & Shi, S. Q. (2022). Lignocellulosic-Based Activated Carbon-Loaded Silver Nanoparticles and Chitosan for Efficient Removal of Cadmium and Optimization Using Response Surface Methodology. Materials, 15(24), 8901. https://doi.org/10.3390/ma15248901