
Terrestrial Laser Scanning of Lunar Soil Simulants


Abstract
:
1. Introduction
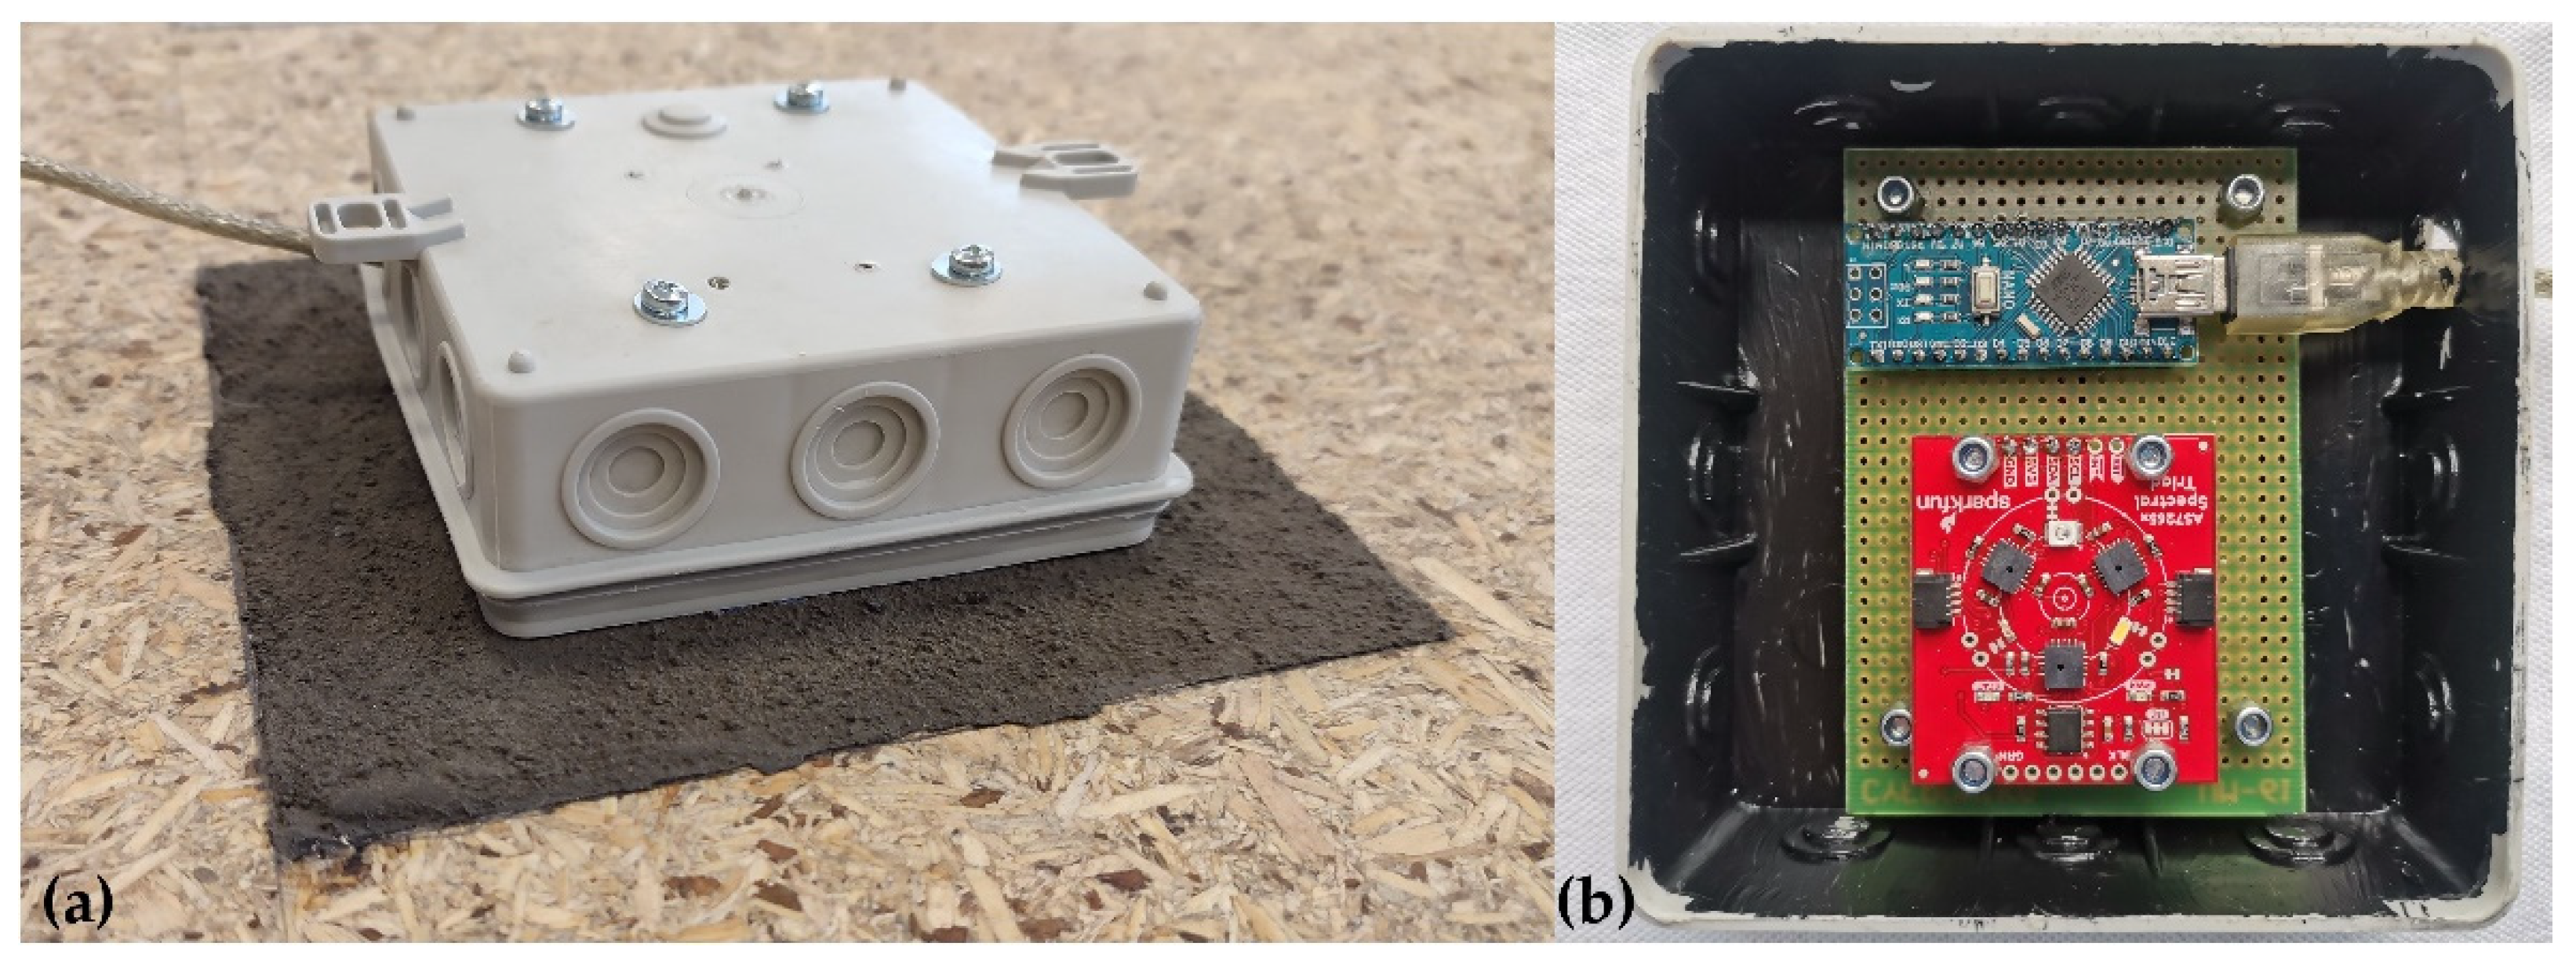
2. Materials and Equipment
3. Tests and Calculations
4. Results
5. Discussion
6. Conclusions
- It is possible to conduct measurements of LSSs using TLS; hence, future applications of TLS technology on the Moon are feasible.
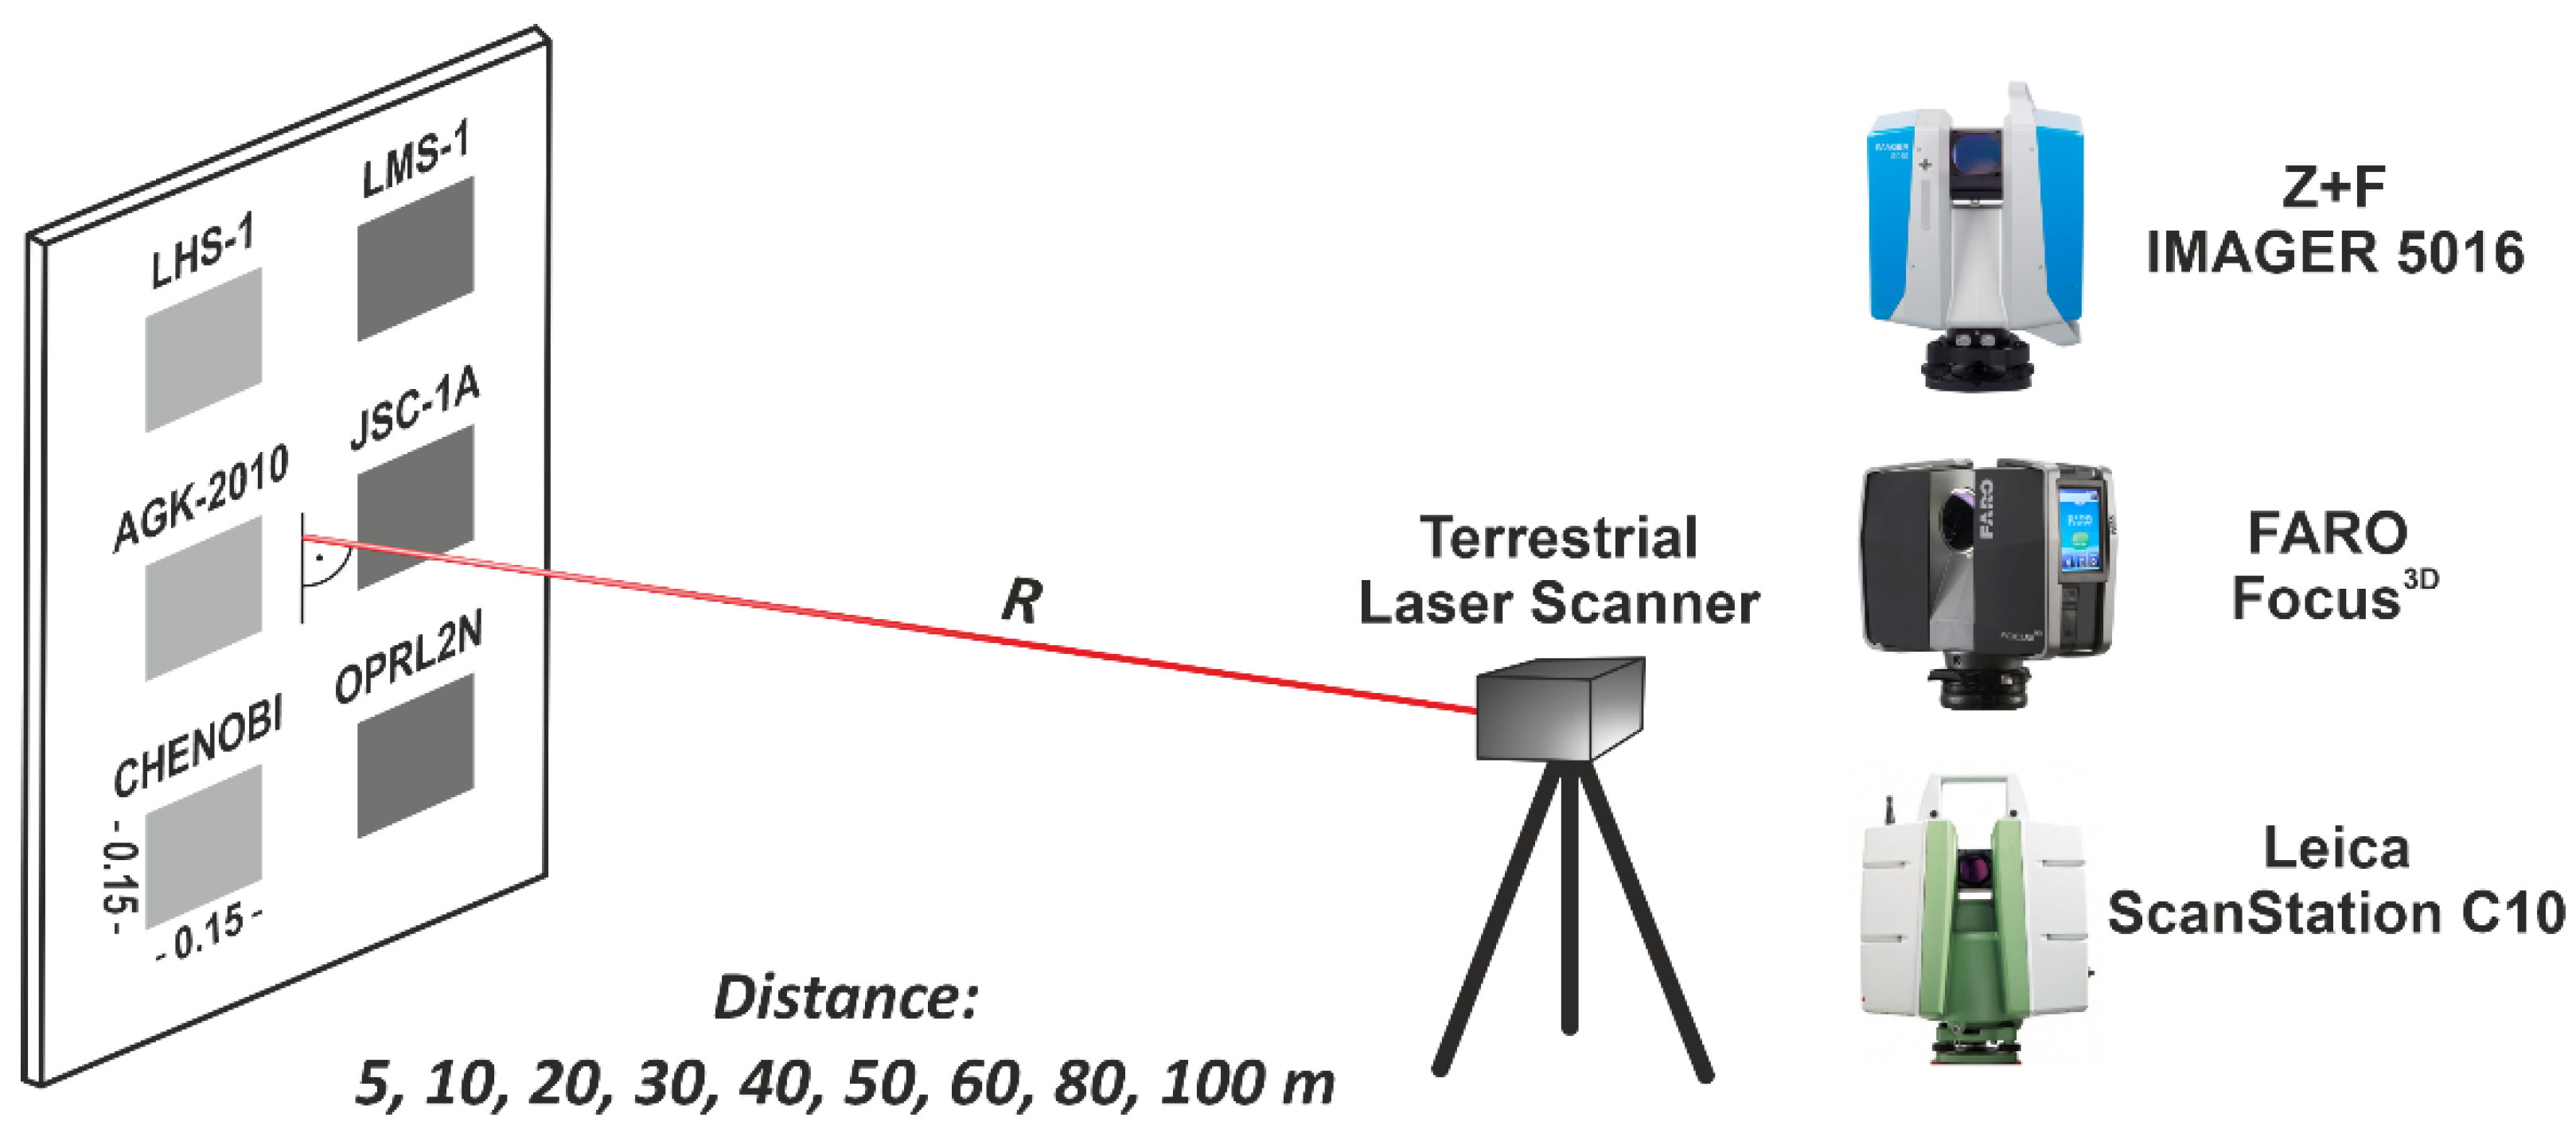
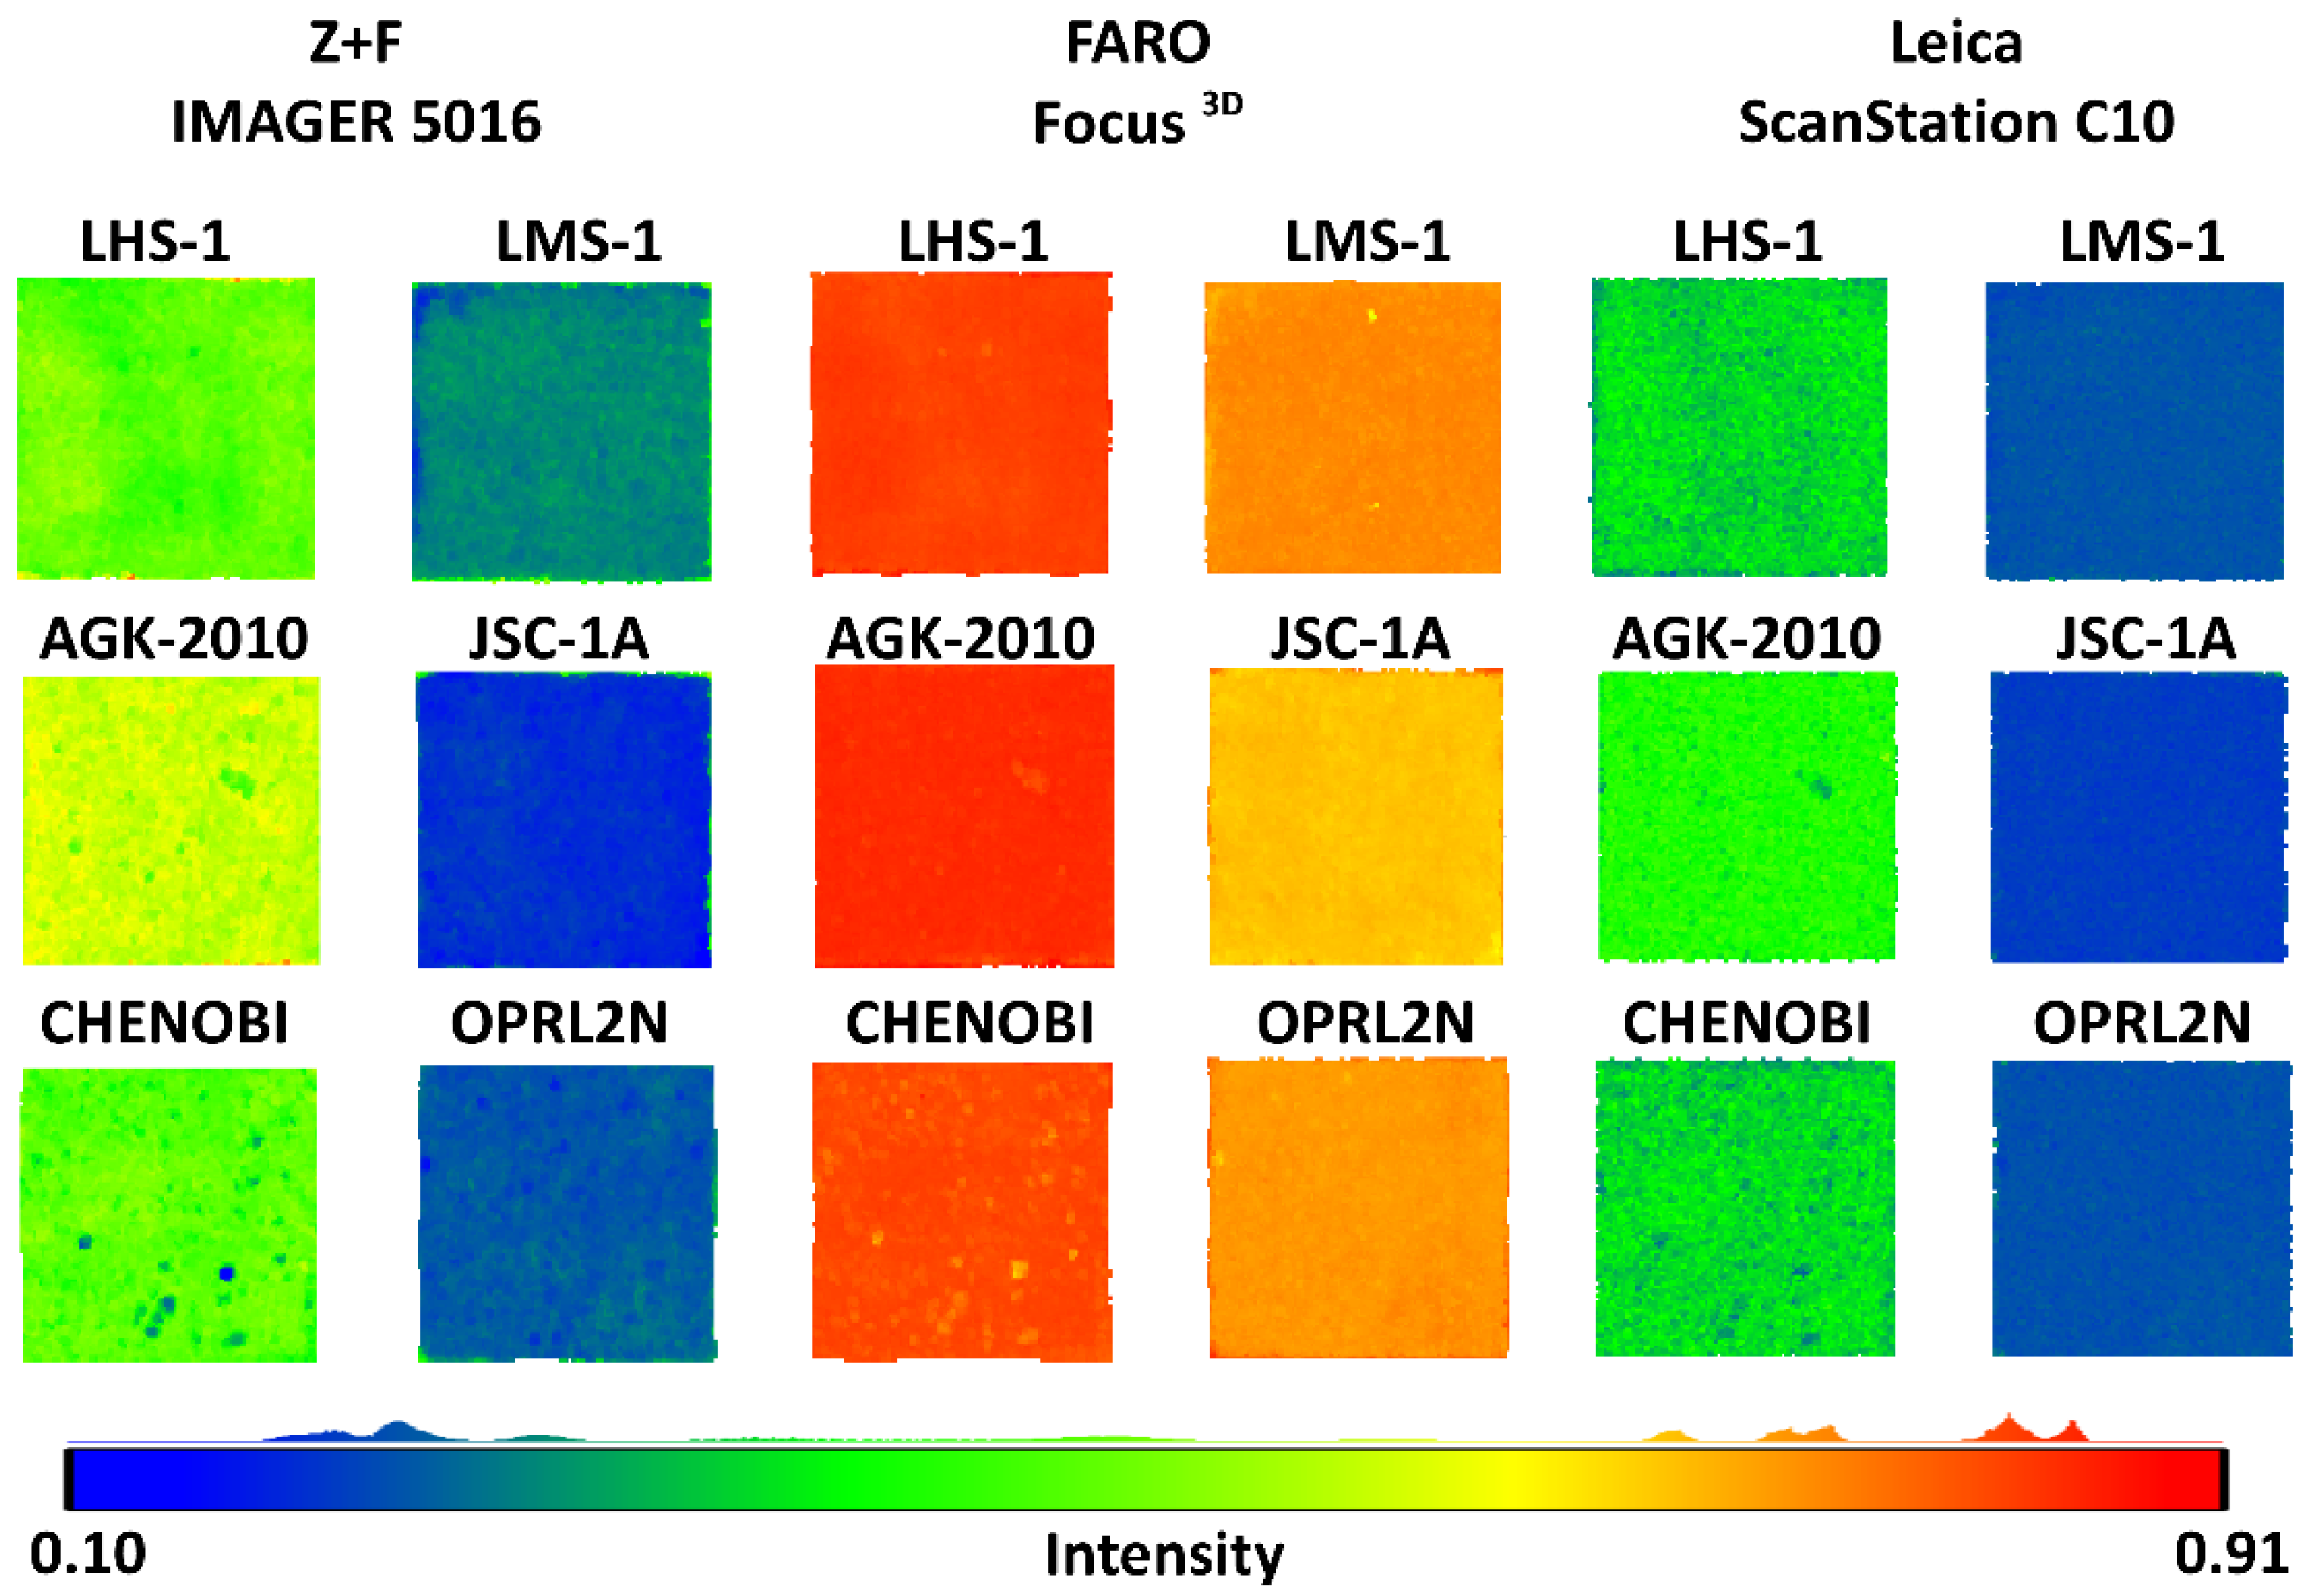
- The LSS specimens representing lunar mare and highland regions are characterised by different degrees of laser beam absorption. The LSS specimens representing mares, due to their darker colour in comparison to the LSSs representing highlands, return less energy to the scanner. Therefore, the feasible TLS measurement distance for lunar mare regions will be shorter than that for lunar highland regions.
- Measurements conducted using the FARO Focus3D scanner at distances of 100 m and 80 m were impossible to execute for all tested LSS specimens and mare LSS specimens, respectively.
- The Z+F IMAGER 5016 (PS) scanner was characterised by the highest precision of distance measurements. The Leica ScanStation C10 (TOF) scanner was characterised by slightly lower precision.
- Detailed studies focusing on the best wavelength for lunar rangefinders should be conducted.
- Significant modifications are required for the construction of scanners dedicated to lunar applications. Apart from the needs associated with extreme local conditions, wavelength issues are of special interest.
- To replicate the lunar soil density and void ratio, the results of TLS conducted on the lunar surface are needed.
- Combining multiple non-destructive technologies for lunar civil engineering, scanning should be enquired in future research programmes.
Author Contributions
Funding
Institutional Review Board Statement
Informed Consent Statement
Data Availability Statement
Conflicts of Interest
References
- Heiken, G.H.; Vaniman, D.T.; French, B.M. Lunar Sourcebook—A User’s Guide to the Moon; Hardcover; Cambridge University Press: Cambridge, UK, 1991; ISBN 0-521-33444-6. [Google Scholar]
- Spudis, P.D.; Bussey, D.B.J.; Baloga, S.M.; Butler, B.J.; Carl, D.; Carter, L.M.; Chakraborty, M.; Elphic, R.C.; Gillis-Davis, J.J.; Goswami, J.N.; et al. Initial results for the north pole of the Moon from Mini-SAR, Chandrayaan-1 mission. Geophys. Res. Lett. 2010, 37, 1–6. [Google Scholar] [CrossRef]
- Cafaro, F.; Miticocchio, E.; Marzulli, V. Remarks on the sources of error in the modelling of lunar geotechnical structures. Stud. Geotech. Mech. 2018, 40, 133–139. [Google Scholar] [CrossRef] [Green Version]
- Bennett, N.J.; Ellender, D.; Dempster, A.G. Commercial viability of lunar In-Situ Resource Utilization (ISRU). Planet. Space Sci. 2020, 182, 104842. [Google Scholar] [CrossRef]
- Karl, D.; Kamutzki, F.; Zocca, A.; Goerke, O.; Guenster, J.; Gurlo, A. Towards the colonization of Mars by in-situ resource utilization: Slip cast ceramics from Martian soil simulant. PLoS ONE 2018, 13, e0204025. [Google Scholar] [CrossRef] [Green Version]
- Sibille, L.; Carpenter, P.; Schlagheck, R.; French, R. Lunar Regolith Simulant Materials: Recommendations for Standardization, Production, and Usage; NASA Technical Reports Server: Cleveland, OH, USA, 2006; Volume 142. [Google Scholar]
- Li, C.; Su, Y.; Pettinelli, E.; Xing, S.; Ding, C.; Liu, J.; Ren, X.; Lauro, S.E.; Soldovieri, F.; Zeng, X.; et al. The Moon’s farside shallow subsurface structure unveiled by Chang’E-4 Lunar Penetrating Radar. Sci. Adv. 2020, 6, eaay6898. [Google Scholar] [CrossRef] [Green Version]
- Arslan, H.; Batiste, S.; Sture, S. Engineering Properties of Lunar Soil Simulant JSC-1A. J. Aerosp. Eng. 2010, 23, 70–84. [Google Scholar] [CrossRef]
- Li, R.; Zhou, G.; Yan, K.; Chen, J.; Chen, D.; Cai, S.; Mo, P.Q. Preparation and characterization of a specialized lunar regolith simulant for use in lunar low gravity simulation. Int. J. Min. Sci. Technol. 2022, 32, 1–15. [Google Scholar] [CrossRef]
- Taylor, L.A.; Pieters, C.M.; Britt, D. Evaluations of lunar regolith simulants. Planet. Space Sci. 2016, 126, 1–7. [Google Scholar] [CrossRef]
- Taylor, L.A.; Pieters, C.; Patchen, A.; Taylor, D.H.S.; Morris, R.V.; Keller, L.P.; McKay, D.S. Mineralogical and chemical characterization of lunar highland soils: Insights into the space weathering of soils on airless bodies. J. Geophys. Res. Planets 2010, 115, 1–14. [Google Scholar] [CrossRef]
- Jakus, A.E.; Koube, K.D.; Geisendorfer, N.R.; Shah, R.N. Robust and Elastic Lunar and Martian Structures from 3D-Printed Regolith Inks. Sci. Rep. 2017, 7, srep44931. [Google Scholar] [CrossRef]
- Lee, S.; van Riessen, A. A Review on Geopolymer Technology for Lunar Base Construction. Materials 2022, 15, 4516. [Google Scholar] [CrossRef] [PubMed]
- Wamelink, G.W.W.; Frissel, J.Y.; Krijnen, W.H.J.; Verwoert, M.R. Crop growth and viability of seeds on Mars and Moon soil simulants. Open Agric. 2019, 4, 509–516. [Google Scholar] [CrossRef]
- Duri, L.G.; Caporale, A.G.; Rouphael, Y.; Vingiani, S.; Palladino, M.; De Pascale, S.; Adamo, P. The Potential for Lunar and Martian Regolith Simulants to Sustain Plant Growth: A Multidisciplinary Overview. Front. Astron. Space Sci. 2022, 8, 747821. [Google Scholar] [CrossRef]
- Prabu, T.; Muthukkumaran, K.; Venugopal, I.; Anbazhagan, S. Assessment of shear strength and compressibility characteristics of a newly developed lunar highland soil simulant (LSS-ISAC-1) for Chandrayaan lander and rover missions. Planet. Space Sci. 2021, 209, 105354. [Google Scholar] [CrossRef]
- Reid, E.; Iles, P.; Muise, J.; Cristello, N.; Jones, B.; Faragalli, M.; Visscher, P.; Boucher, D.; Simard-Bilodeau, V.; Apostolopoulos, D.; et al. The Artemis Jr. rover: Mobility platform for lunar ISRU mission simulation. Adv. Space Res. 2015, 55, 2472–2483. [Google Scholar] [CrossRef]
- Wu, C.; Yuan, Y.; Tang, Y.; Tian, B. Application of Terrestrial Laser Scanning (TLS) in the Architecture, Engineering and Construction (AEC) Industry. Sensors 2021, 22, 265. [Google Scholar] [CrossRef]
- Suchocki, C.; Katzer, J.; Panuś, A. Remote Sensing to Estimate Saturation Differences of Chosen Building Materials Using Terrestrial Laser Scanner. Rep. Geod. Geoinformatics 2017, 103, 94–105. [Google Scholar] [CrossRef] [Green Version]
- Van Balen, K.; Verstrynge, E. Structural Analysis of Historical Constructions: Anamnesis, Diagnosis; Taylor & Francis: New York, NY, USA, 2017. [Google Scholar]
- Miśkiewicz, M.; Sobczyk, B.; Tysiac, P. Non-destructive testing of the longest span soil-steel bridge in Europe-field measurements and FEM calculations. Materials 2020, 13, 3652. [Google Scholar] [CrossRef]
- Suchocki, C. Application of terrestrial laser scanner in cliff shores monitoring. Rocz. Ochr. Sr. 2009, 11, 715–725. [Google Scholar]
- Wojtkowska, M.; Kedzierski, M.; Delis, P. Validation of terrestrial laser scanning and artificial intelligence for measuring deformations of cultural heritage structures. Measurement 2021, 167, 108291. [Google Scholar] [CrossRef]
- Maalek, R.; Lichti, D.D.; Walker, R.; Bhavnani, A.; Ruwanpura, J.Y. Extraction of pipes and flanges from point clouds for automated verification of pre-fabricated modules in oil and gas refinery projects. Autom. Constr. 2019, 103, 150–167. [Google Scholar] [CrossRef]
- Cadogan, D.; Stein, J.; Grahne, M. Inflatable composite habitat structures for lunar and mars exploration. Acta Astronaut. 1999, 44, 399–406. [Google Scholar] [CrossRef]
- Cesaretti, G.; Dini, E.; De Kestelier, X.; Colla, V.; Pambaguian, L. Building components for an outpost on the Lunar soil by means of a novel 3D printing technology. Acta Astronaut. 2014, 93, 430–450. [Google Scholar] [CrossRef]
- Wynne, J.J.; Titus, T.N.; Chong Diaz, G. On developing thermal cave detection techniques for earth, the Moon and Mars. Earth Planet. Sci. Lett. 2008, 272, 240–250. [Google Scholar] [CrossRef]
- Gibney, E. How to build a Moon base. Nature 2018, 562, 474–478. [Google Scholar] [CrossRef] [Green Version]
- Katzer, J.; Suchocki, C.; Błaszczak-Bąk, W.; Zarzycki, P.K.; Damięcka-Suchocka, M. Reliability and effectiveness of laser scanners in future construction efforts on the Moon and Mars. Autom. Constr. 2021, 132, 103979. [Google Scholar] [CrossRef]
- Zarzycki, P.K.; Katzer, J. Multivariate Comparison of Lunar Soil Simulants. J. Aerosp. Eng. 2019, 32, 06019005. [Google Scholar] [CrossRef]
- Smith, D.E.; Zuber, M.T.; Jackson, G.B.; Cavanaugh, J.F.; Neumann, G.A.; Riris, H.; Sun, X.; Zellar, R.S.; Coltharp, C.; Connelly, J.; et al. The lunar orbiter laser altimeter investigation on the lunar reconnaissance orbiter mission. Space Sci. Rev. 2010, 150, 209–241. [Google Scholar] [CrossRef]
- Isachenkov, M.; Chugunov, S.; Landsman, Z.; Akhatov, I.; Metke, A.; Tikhonov, A.; Shishkovsky, I. Characterization of novel lunar highland and mare simulants for ISRU research applications. Icarus 2022, 376, 114873. [Google Scholar] [CrossRef]
- Bednarz, S.; Rzyczniak, M.; Gonet, A.; Seweryn, K. Research of formed lunar regholit analog AGK-2010. Arch. Min. Sci. 2013, 58, 551–556. [Google Scholar] [CrossRef]
- Battler, M.M.; Spray, J.G. The Shawmere anorthosite and OB-1 as lunar highland regolith simulants. Planet. Space Sci. 2009, 57, 2128–2131. [Google Scholar] [CrossRef]
- Zhang, X.; Osinski, G.R.; Newson, T.; Ahmed, A.; Touqan, M.; Joshi, D.; Hill, H. A Comparative Study of Lunar Regolith Simulants in Relation to Terrestrial Tests for Lunar Exploration Missions. In Proceedings of the 50th Lunar and Planetary Science Conference, The Woodlands, TX, USA, 18–22 March 2019; Volume 2019, pp. 1–2. [Google Scholar]
- Suchocki, C. Comparison of Time-of-Flight and Phase-Shift TLS Intensity Data for the Diagnostics Measurements of Buildings. Materials 2020, 13, 353. [Google Scholar] [CrossRef] [Green Version]
- Previtali, M.; Barazzetti, L.; Brumana, R.; Cuca, B.; Oreni, D.; Roncoroni, F.; Scaioni, M. Automatic façade modelling using point cloud data for energy-efficient retrofitting. Appl. Geomat. 2014, 6, 95–113. [Google Scholar] [CrossRef]
- Abmayr, T.; Härtl, F.; Reinköster, M.; Fröhlich, C. Terrestrial Laser Scanning—Applications in Cultural Heritage Conservation and Civil Engineering. In Proceedings of the 3D-ARCH 2005: Virtual Reconstruction and Visualization of Complex Architectures, Mestre-Venice, Italy, 22–24 August 2005; Volume XXXVI, pp. 1–6. [Google Scholar]
- Nowak, R.; Kania, T.; Rutkowski, R.; Ekiert, E. Research and TLS (LiDAR) Construction Diagnostics of Clay Brick Masonry Arched Stairs. Materials 2022, 15, 552. [Google Scholar] [CrossRef] [PubMed]
- Fan, L.; Atkinson, P.M. Accuracy of Digital Elevation Models Derived from Terrestrial Laser Scanning Data. IEEE Geosci. Remote Sens. Lett. 2015, 12, 1923–1927. [Google Scholar] [CrossRef]
- Matwij, W.; Gruszczyński, W.; Puniach, E.; Ćwiąkała, P. Determination of underground mining-induced displacement field using multi-temporal TLS point cloud registration. J. Int. Meas. Confed. 2021, 180, 109482. [Google Scholar] [CrossRef]
- Watt, P.J.; Donoghue, D.N.M. Measuring forest structure with terrestrial laser scanning. Int. J. Remote Sens. 2005, 26, 1437–1446. [Google Scholar] [CrossRef]
- Suchocki, C.; Katzer, J. TLS technology in brick walls inspection. In Proceedings of the 2018 Baltic Geodetic Congress (BGC Geomatics), Olsztyn, Poland, 21–23 June 2018; IEEE: Olsztyn, Poland, 2018; pp. 359–363. [Google Scholar]
- Suchocki, C.; Damięcka-Suchocka, M.; Katzer, J.; Janicka, J.; Rapiński, J.; Stałowska, P. Remote Detection of Moisture and Bio-Deterioration of Building Walls by Time-Of-Flight and Phase-Shift Terrestrial Laser Scanners. Remote Sens. 2020, 12, 1708. [Google Scholar] [CrossRef]
- Rees, W.G. Physical Principles of Remote Sensing, 3rd ed.; Cambridge University Press: Cambridge, UK, 2013; ISBN 9781107004733. [Google Scholar]
- Pfeifer, N.; Dorninger, P.; Haring, A.; Fan, H. Investigating terrestrial laser scanning intensity data: Quality and functional relations. In Proceedings of the 8th Conference on Optical 3-D Measurement Techniques, ETH Zurich, Switzerland, 9–12 July 2007; Volume 1, pp. 328–337. [Google Scholar]
- Harikumar, A. Advanced Methods for Tree Species Classification and Biophysical Parameter Estimation Using Crown Geometric Information in High Density LiDAR Data. Ph.D. Thesis, University of Trento, International Doctorate School in Information and Communication Technologies, Trento, Italy, 16 September 2019. [Google Scholar]
- Schulz, T. Calibration of a Terrestrial Laser Scanner for Engineering Geodesy. Mitteilungen 2008, 96, 1–160. [Google Scholar] [CrossRef]
- Jacobs, G. Understanding Spot Size for Laser Scanning. Professional Surveyor Magazine, October 2006; Volume 26, 1. [Google Scholar]
- Tan, K.; Zhang, W.; Shen, F.; Cheng, X. Investigation of TLS intensity data and distance measurement errors from target specular reflections. Remote Sens. 2018, 10, 1077. [Google Scholar] [CrossRef] [Green Version]
- Chen, S.-E. Laser Scanning Technology for Bridge Monitoring. Intech. 2012, 1, 71–93. [Google Scholar] [CrossRef]
- Fahey, T.; Islam, M.; Gardi, A.; Sabatini, R. Laser beam atmospheric propagation modelling for aerospace LIDAR applications. Atmosphere 2021, 12, 918. [Google Scholar] [CrossRef]
- Rüeger, J.M. Electronic Distance Measurement: An Introduction; Springer Science & Business Media: Berlin/Heidelberg, Germany, 1992; ISBN 978-3-642-97196-9. [Google Scholar]
- Artese, S.; Perrelli, M. Monitoring a landslide with high accuracy by total station: A DTM-based model to correct for the atmospheric effects. Geosciences 2018, 8, 46. [Google Scholar] [CrossRef] [Green Version]
- Nocita, M.; Stevens, A.; van Wesemael, B.; Aitkenhead, M.; Bachmann, M.; Barthès, B.; Ben Dor, E.; Brown, D.J.; Clairotte, M.; Csorba, A.; et al. Soil Spectroscopy: An Alternative to Wet Chemistry for Soil Monitoring. Adv. Agron. 2015, 132, 139–159. [Google Scholar] [CrossRef]
- Gerhards, M.; Rock, G.; Schlerf, M.; Udelhoven, T. Water stress detection in potato plants using leaf temperature, emissivity, and reflectance. Int. J. Appl. Earth Obs. Geoinf. 2016, 53, 27–39. [Google Scholar] [CrossRef]
- SparkFun. Available online: https://www.sparkfun.com/ (accessed on 1 May 2021).


| Type | Acronym | Name | Availability | Country |
|---|---|---|---|---|
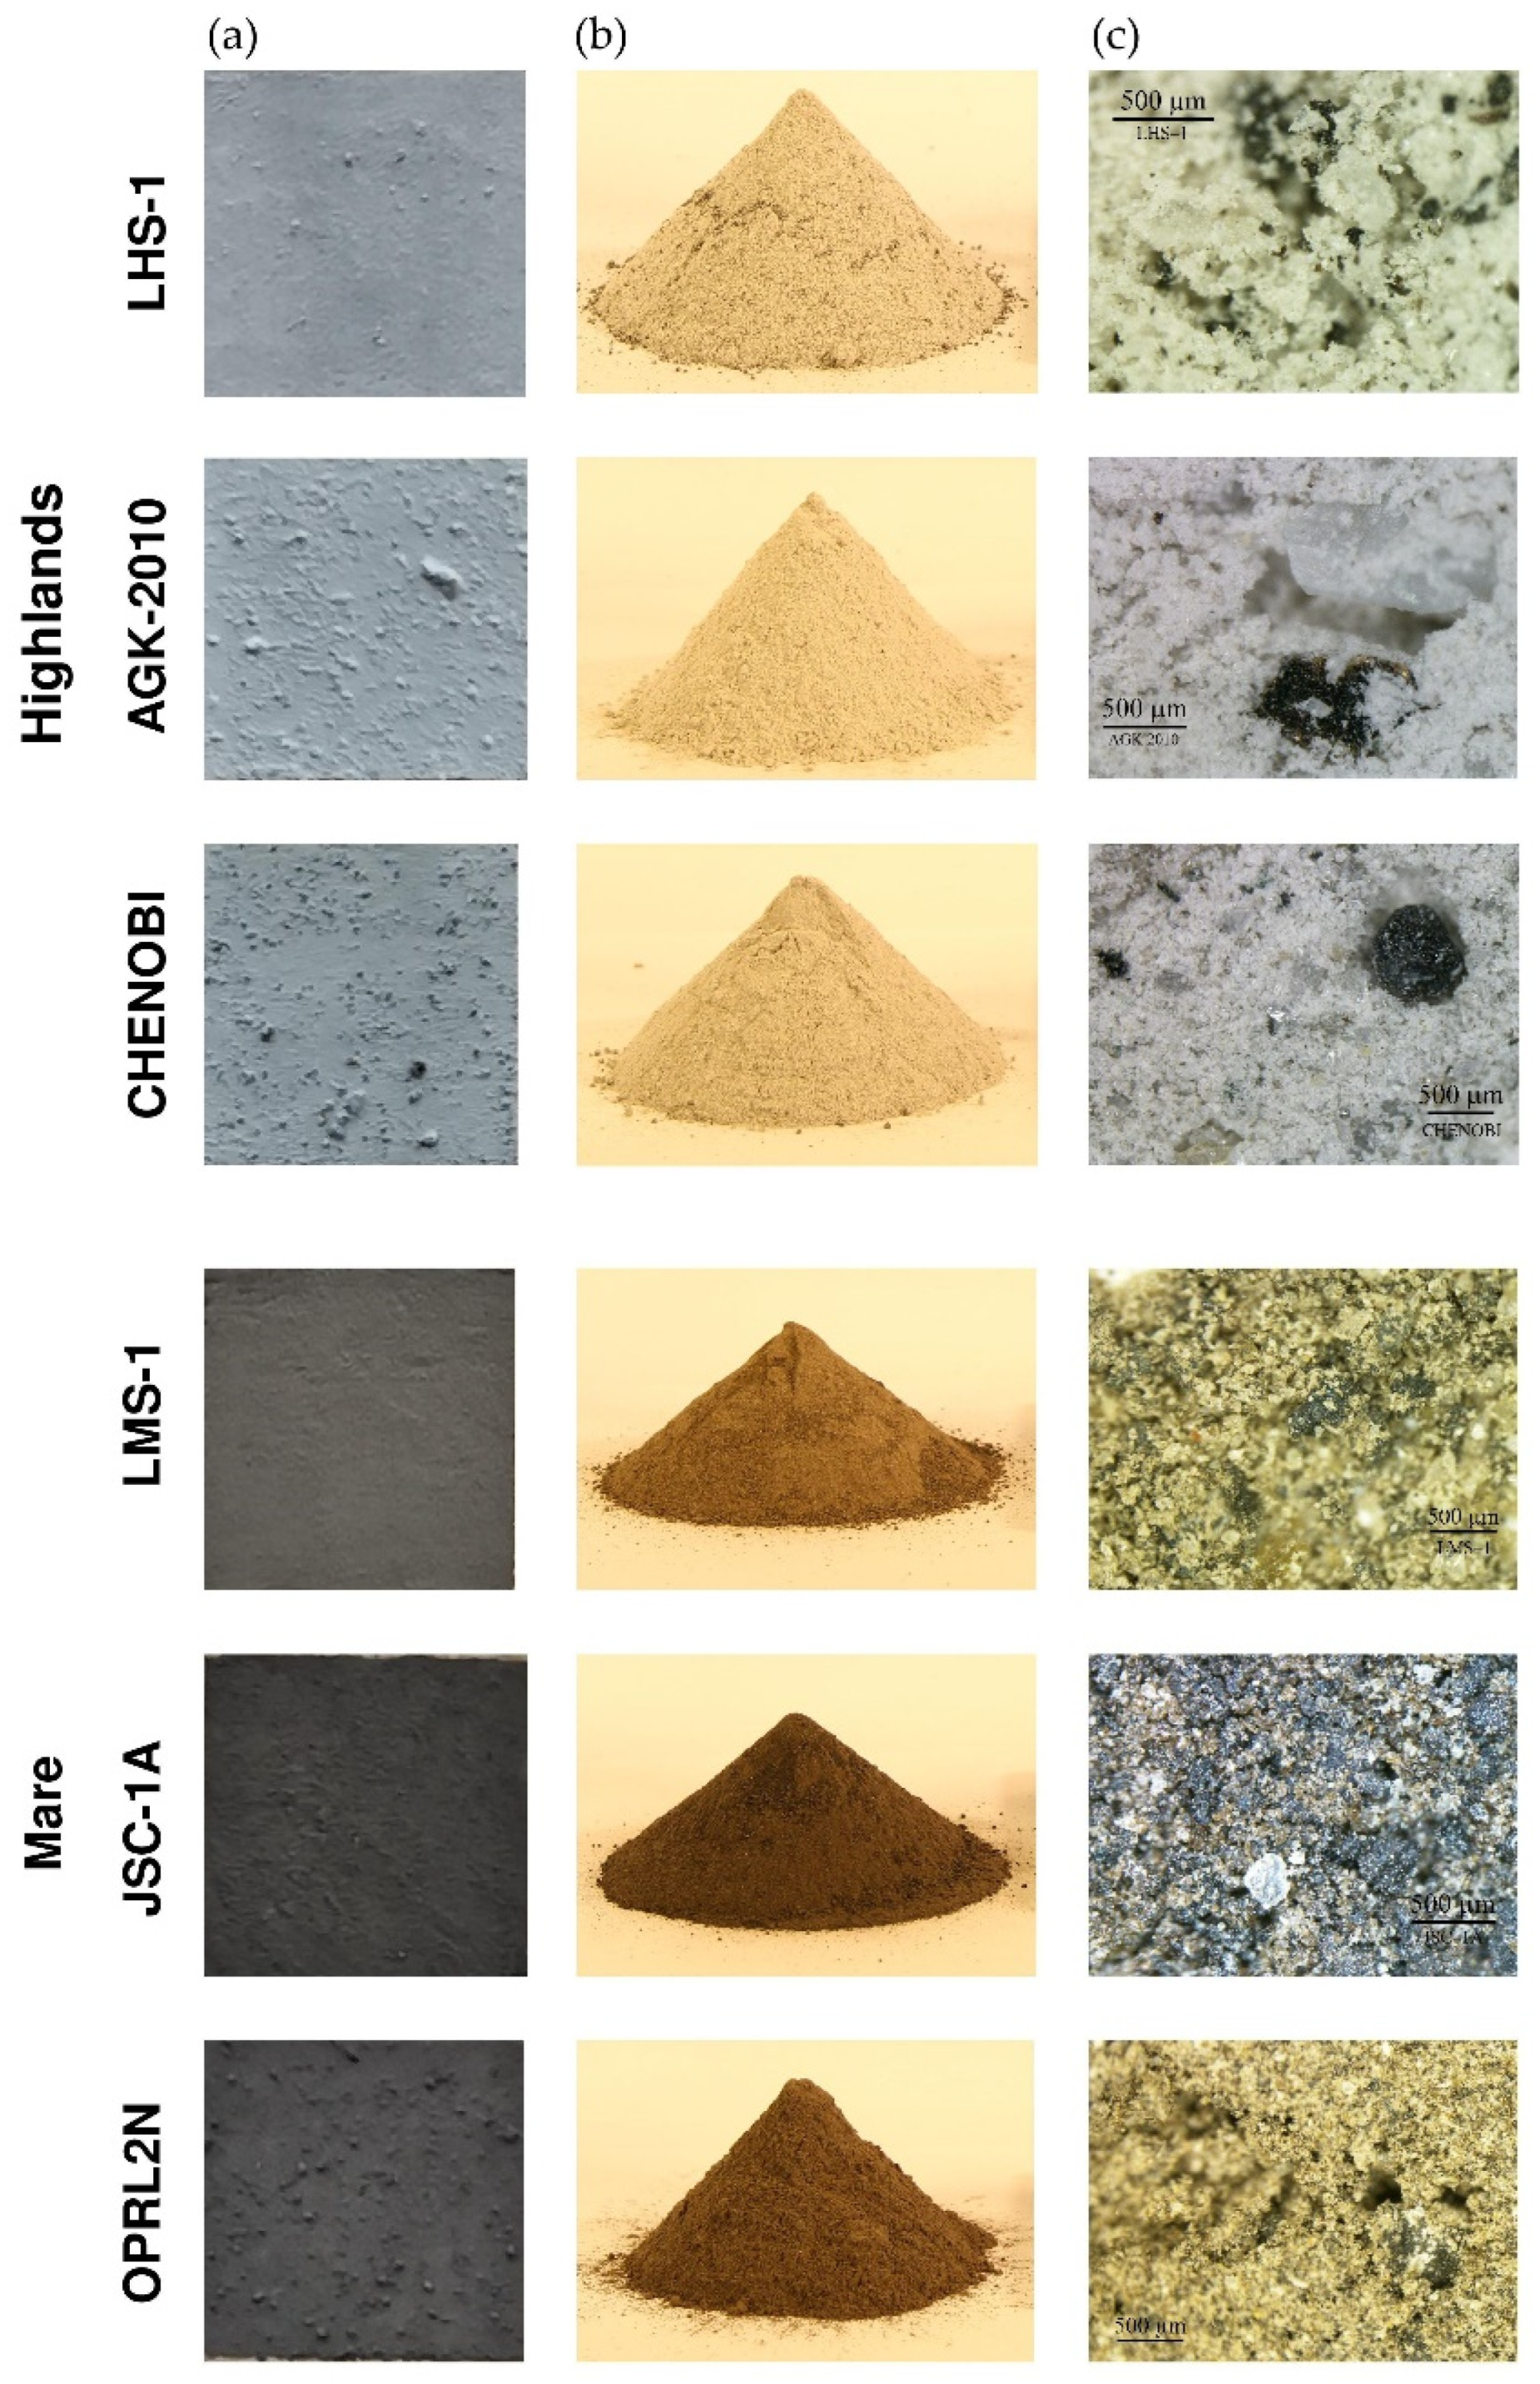
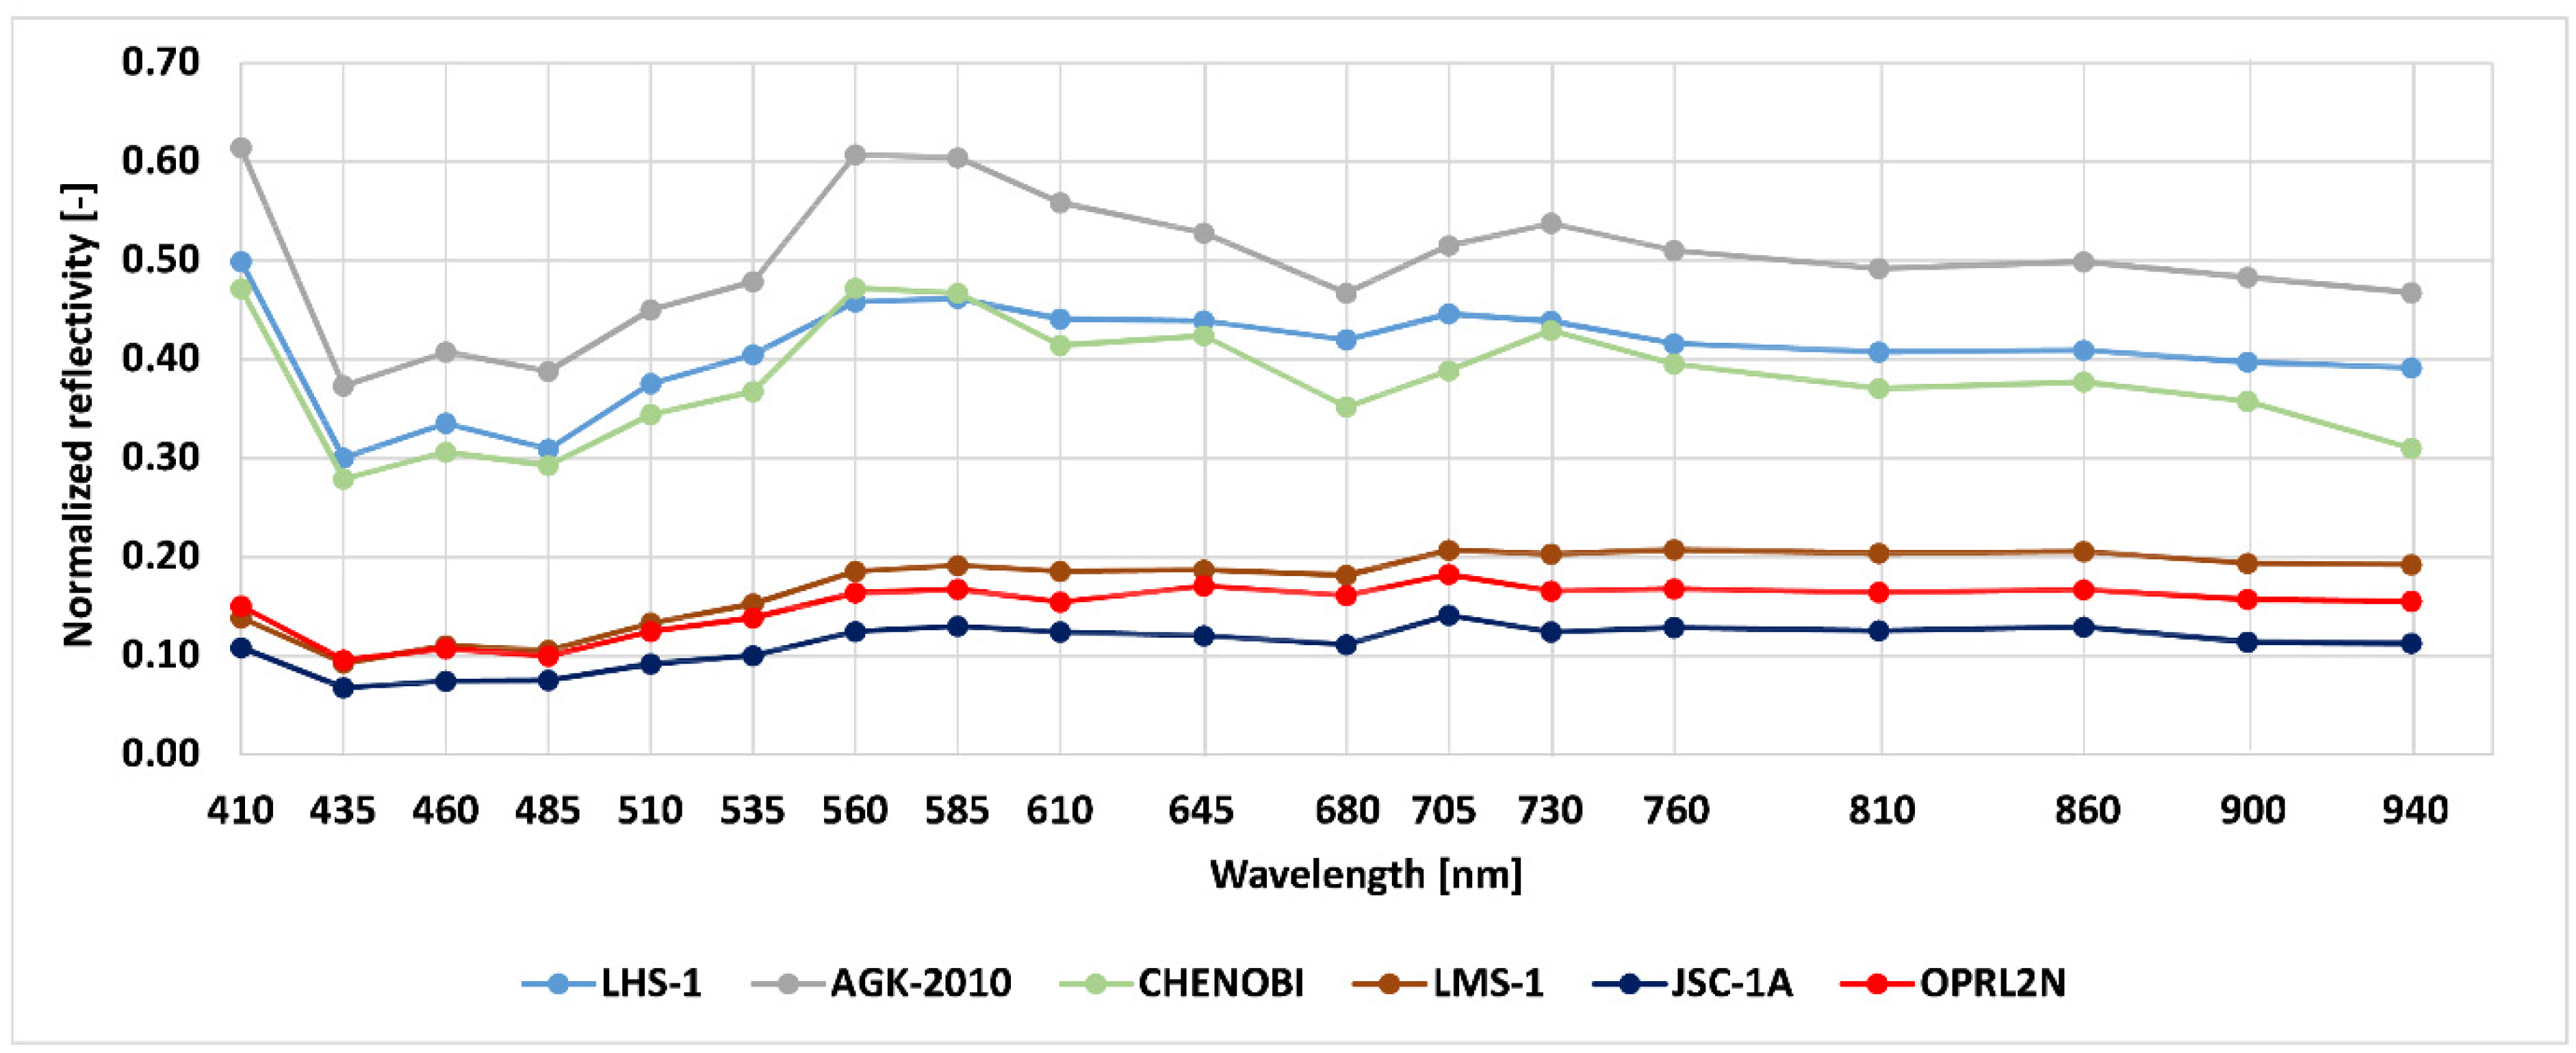
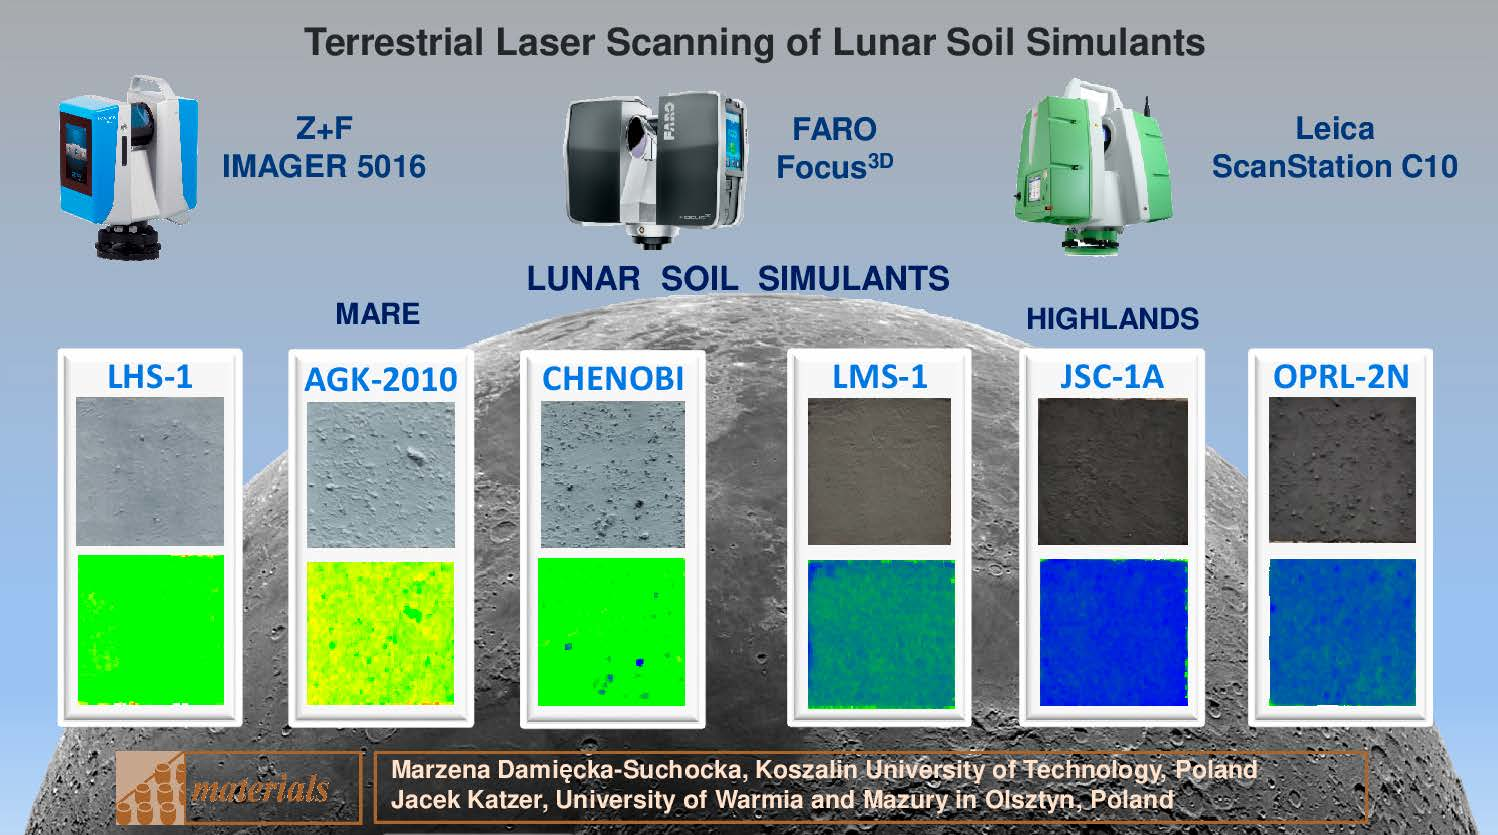
| Highlands | LHS-1 | Lunar Highlands Simulant [32] | YES | USA |
| AGK-2010 | Lunar Soil Analog (Analog Gruntu Księżycowego—in Polish) [33] | NO | Poland | |
| CHENOBI | CHemically ENhanced OB-1 Lunar Highlands Regolith Physical Simulant [34] | NO | Canada | |
| Mare | LMS-1 | Lunar Mare Simulant [32] | YES | USA |
| JSC-1A | Johnson Space Center [8] | NO | USA | |
| OPRL2N | Off Planet Research Mare Simulant [35] | YES | USA |
| Z+F IMAGER 5016 | FARO Focus3D | Leica ScanStation C10 | |
|---|---|---|---|
| Type of rangefinder | PS | PS | TOF |
| Laser wavelength | 1500 nm | 905 nm | 532 nm |
| Type of wavelength | Infrared | Near-infrared | Green |
| Max scan rate points/second | 1,100,000 | 1,000,000 | up to 50,000 |
| Max measurement distance | 365 m | 120 m | 300 m @ 90% |
| Distance measurement error | ±1 mm + 10 ppm/m | ±2 mm | ±4 mm (1–50 m) |
| Beam divergence | 0.3 mrad | 0.19 mrad | – |
| Beam diameter | ~3.5 mm at exit | 3.0 mm at exit | 0–50 m: 4.5 mm *, 7 mm ** |
| Operating temperature | −10 °C … +45 °C | 5 °C … +40 °C | 0 °C … +40 °C |
| Field of view (h/v) | 360°/320° | 360°/305° | 360°/270° |
| Additional sensors | HDR camera, optional IR camera, positioning system (barometer, acceleration sensor, gyroscope, compass, GPS) | Digital camera (70 megapixels), compass, height sensor (altimeter) | digital camera (4 megapixels) |
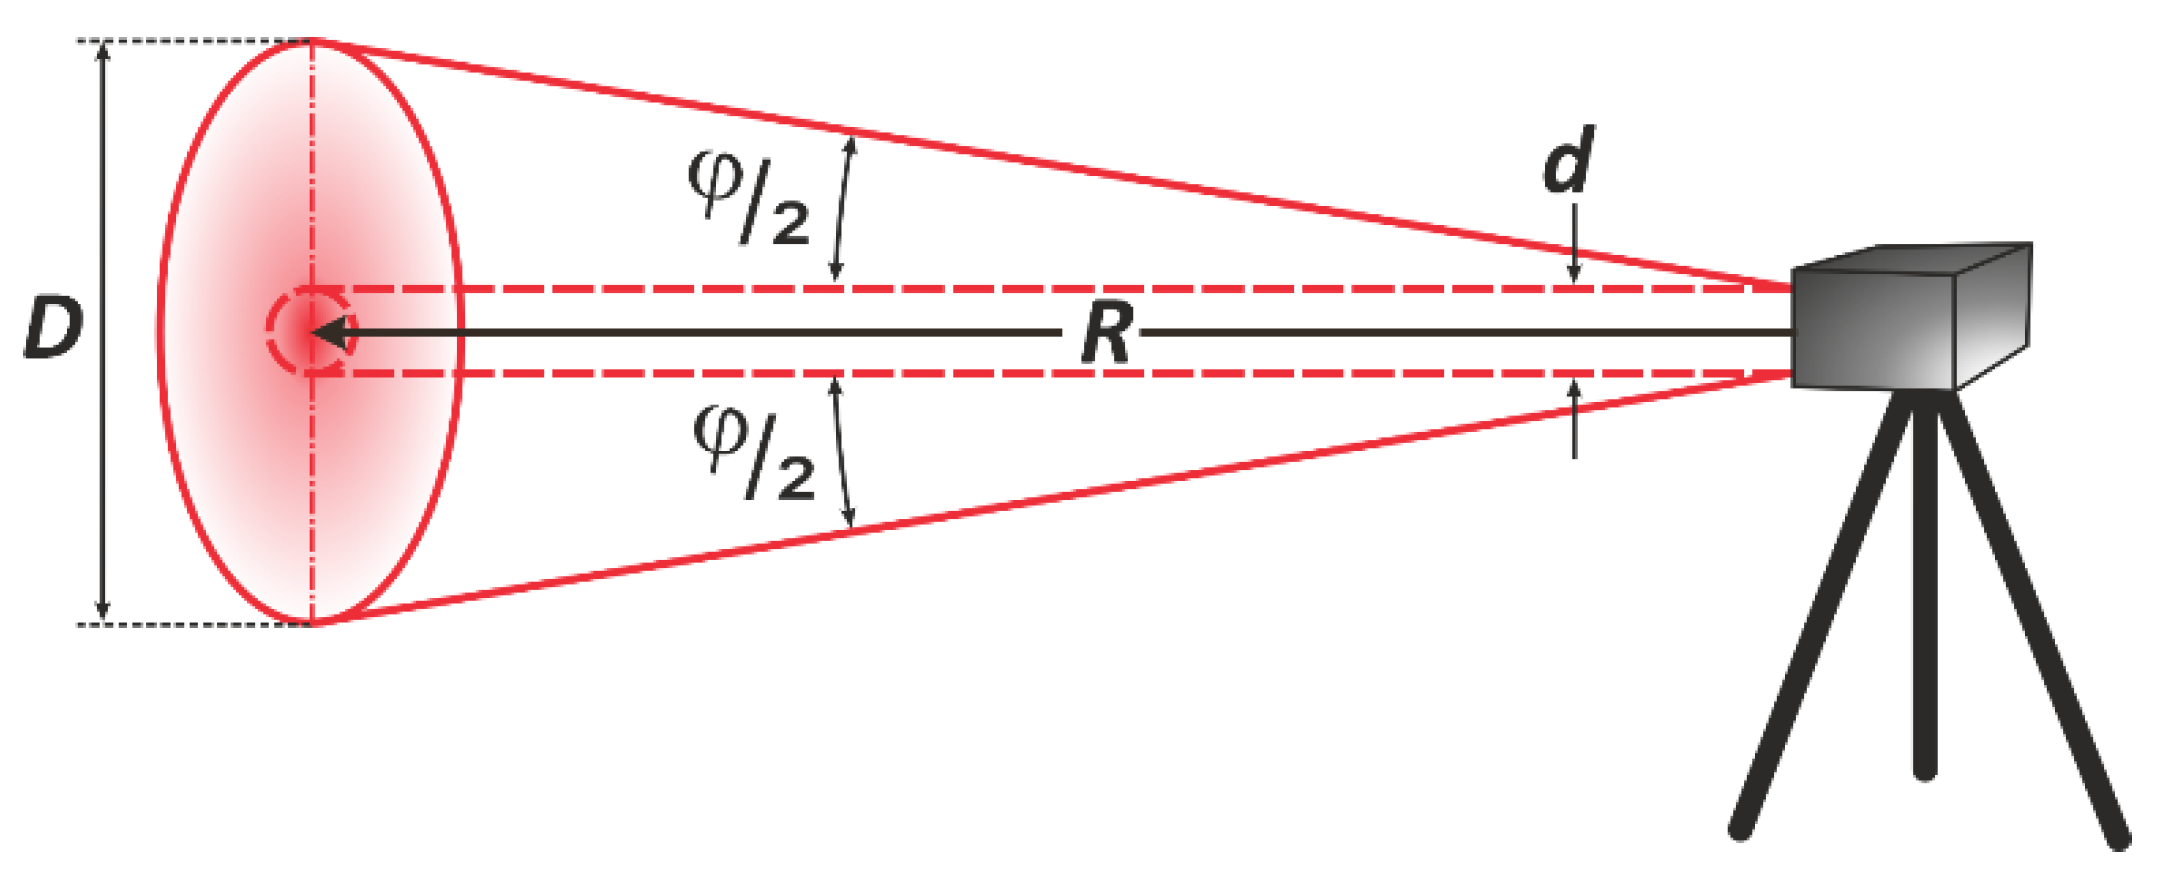
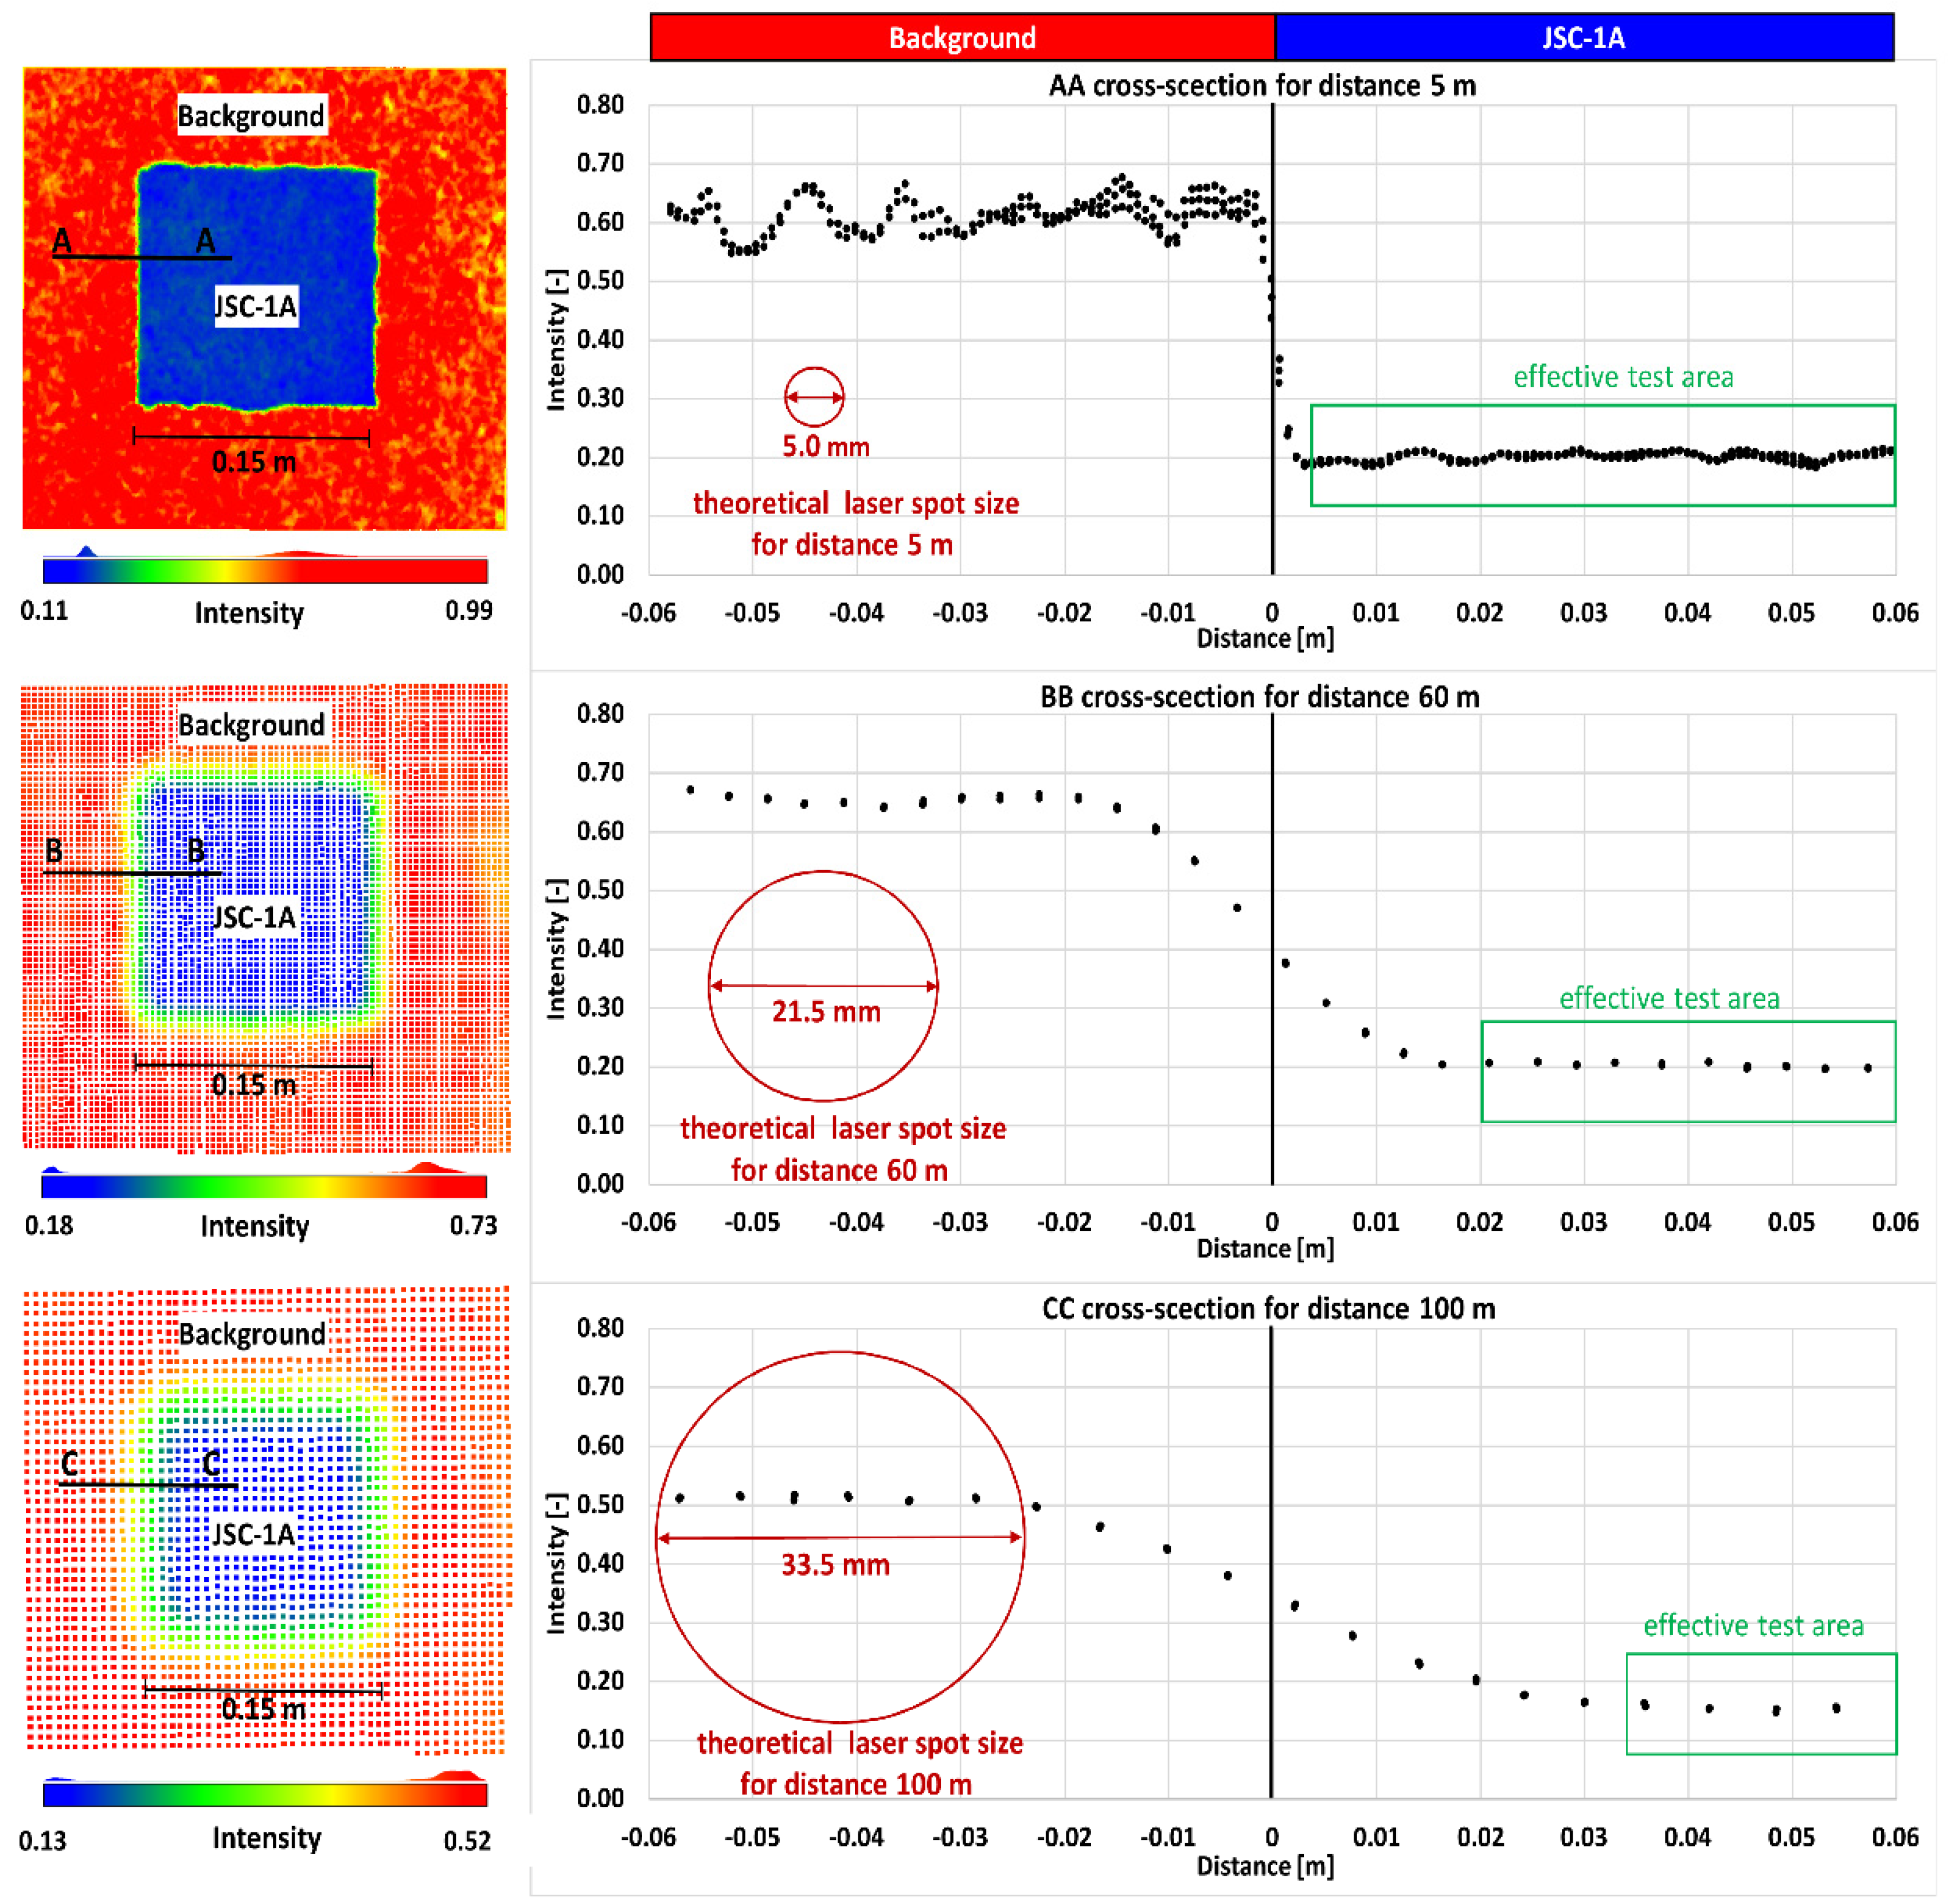
| R (m) | 5 | 10 | 20 | 30 | 40 | 50 | 60 | 80 | 100 |
|---|---|---|---|---|---|---|---|---|---|
| D (mm) | 5.0 | 6.5 | 9.5 | 12.5 | 15.5 | 18.5 | 21.5 | 27.5 | 33.5 |
| A (mm2) | 19.6 | 33.2 | 70.9 | 122.7 | 188.7 | 268.8 | 363.1 | 594.0 | 881.4 |
Publisher’s Note: MDPI stays neutral with regard to jurisdictional claims in published maps and institutional affiliations. |
© 2022 by the authors. Licensee MDPI, Basel, Switzerland. This article is an open access article distributed under the terms and conditions of the Creative Commons Attribution (CC BY) license (https://creativecommons.org/licenses/by/4.0/).
Share and Cite
Damięcka-Suchocka, M.; Katzer, J. Terrestrial Laser Scanning of Lunar Soil Simulants. Materials 2022, 15, 8773. https://doi.org/10.3390/ma15248773
Damięcka-Suchocka M, Katzer J. Terrestrial Laser Scanning of Lunar Soil Simulants. Materials. 2022; 15(24):8773. https://doi.org/10.3390/ma15248773
Chicago/Turabian StyleDamięcka-Suchocka, Marzena, and Jacek Katzer. 2022. "Terrestrial Laser Scanning of Lunar Soil Simulants" Materials 15, no. 24: 8773. https://doi.org/10.3390/ma15248773
APA StyleDamięcka-Suchocka, M., & Katzer, J. (2022). Terrestrial Laser Scanning of Lunar Soil Simulants. Materials, 15(24), 8773. https://doi.org/10.3390/ma15248773