
Carbides Dissolution in 5Cr15MoV Martensitic Stainless Steel and New Insights into Its Effect on Microstructure and Hardness


Abstract
1. Introduction
2. Materials and Methods
3. Results
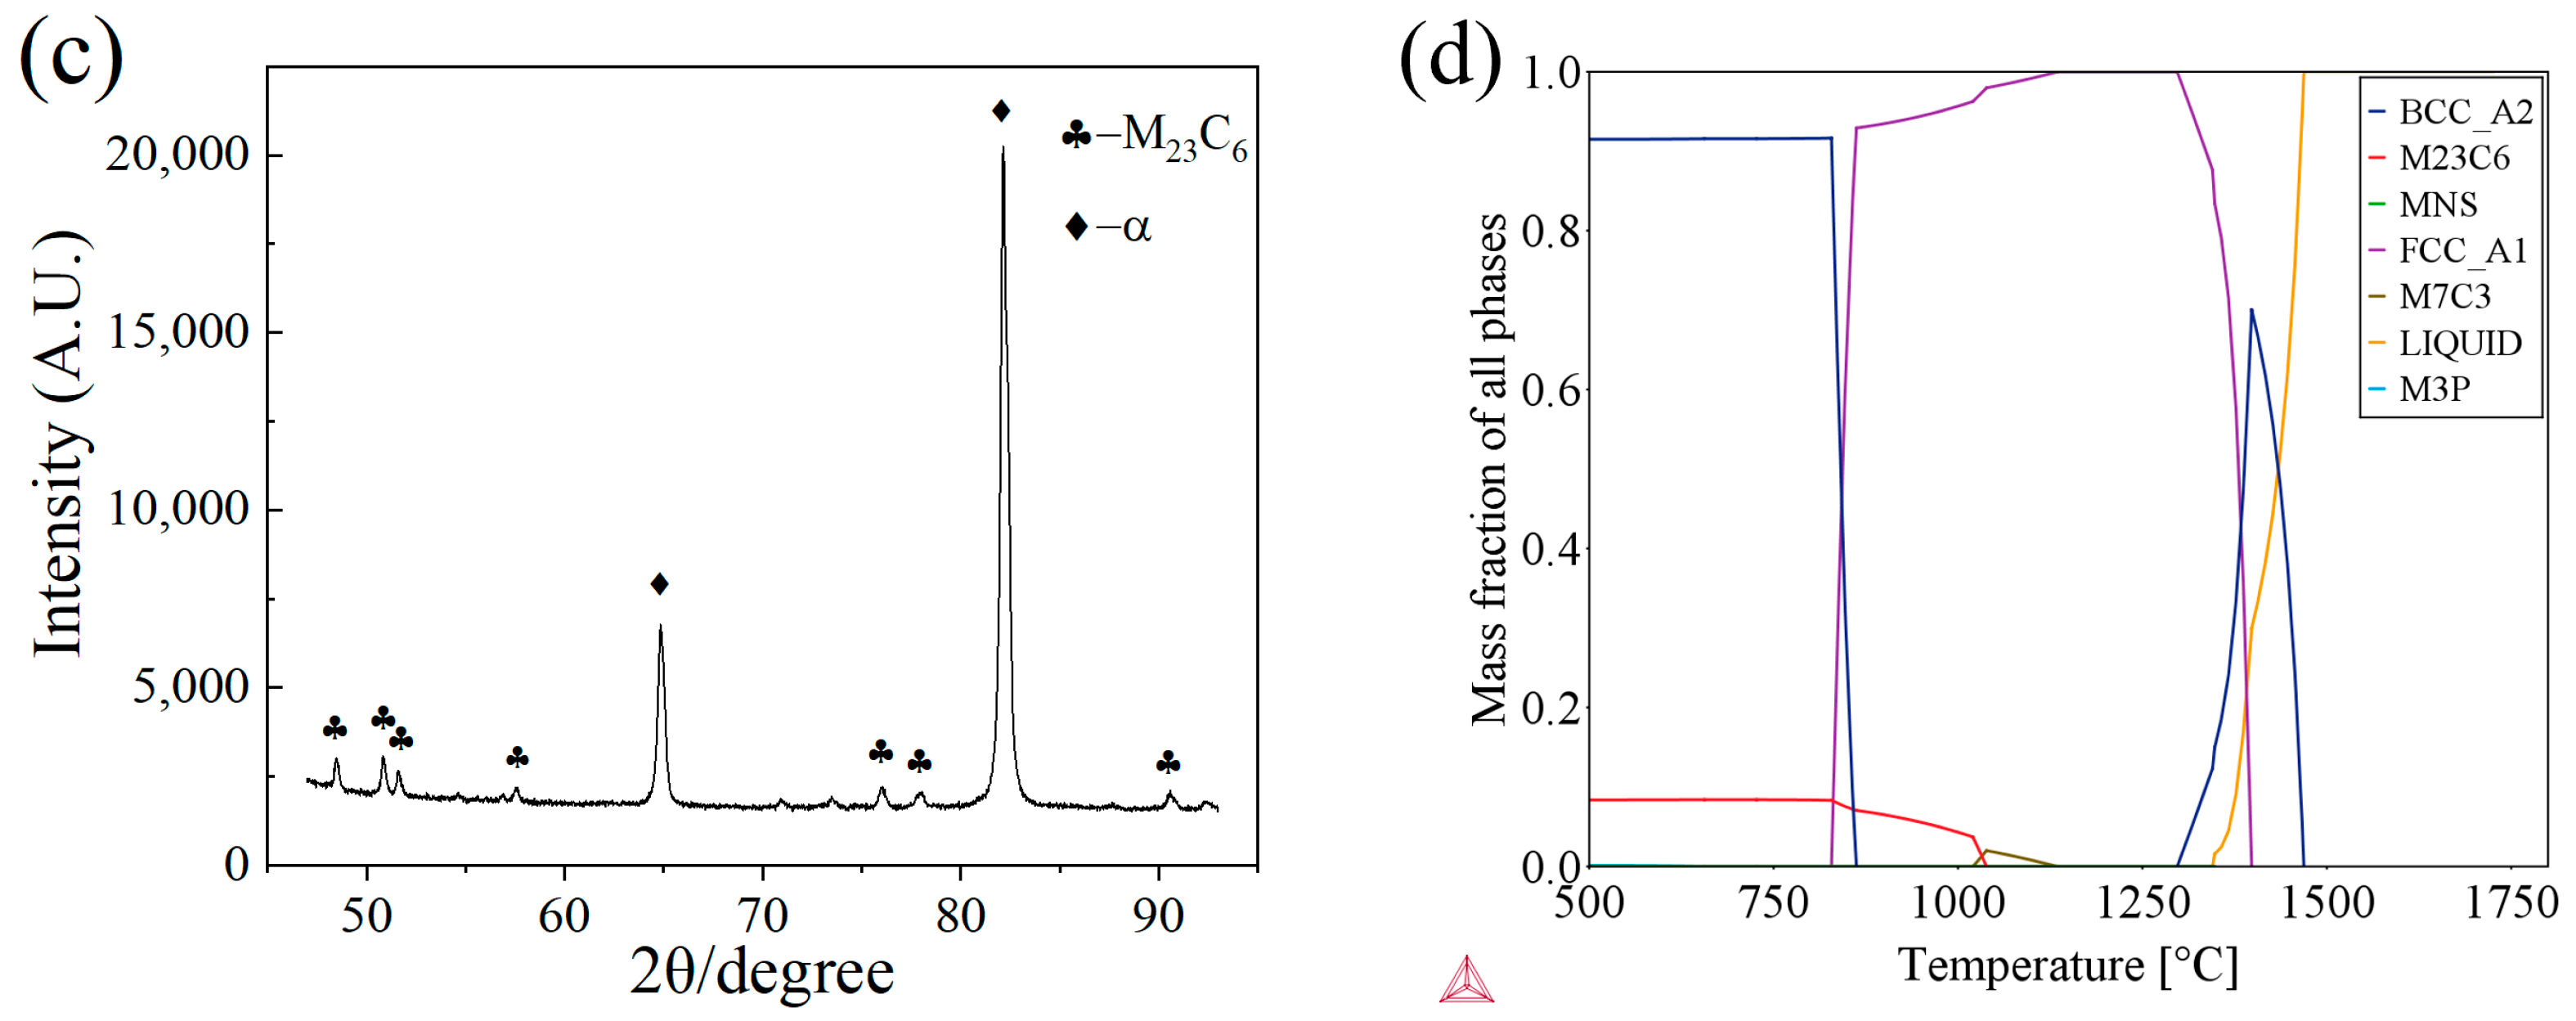
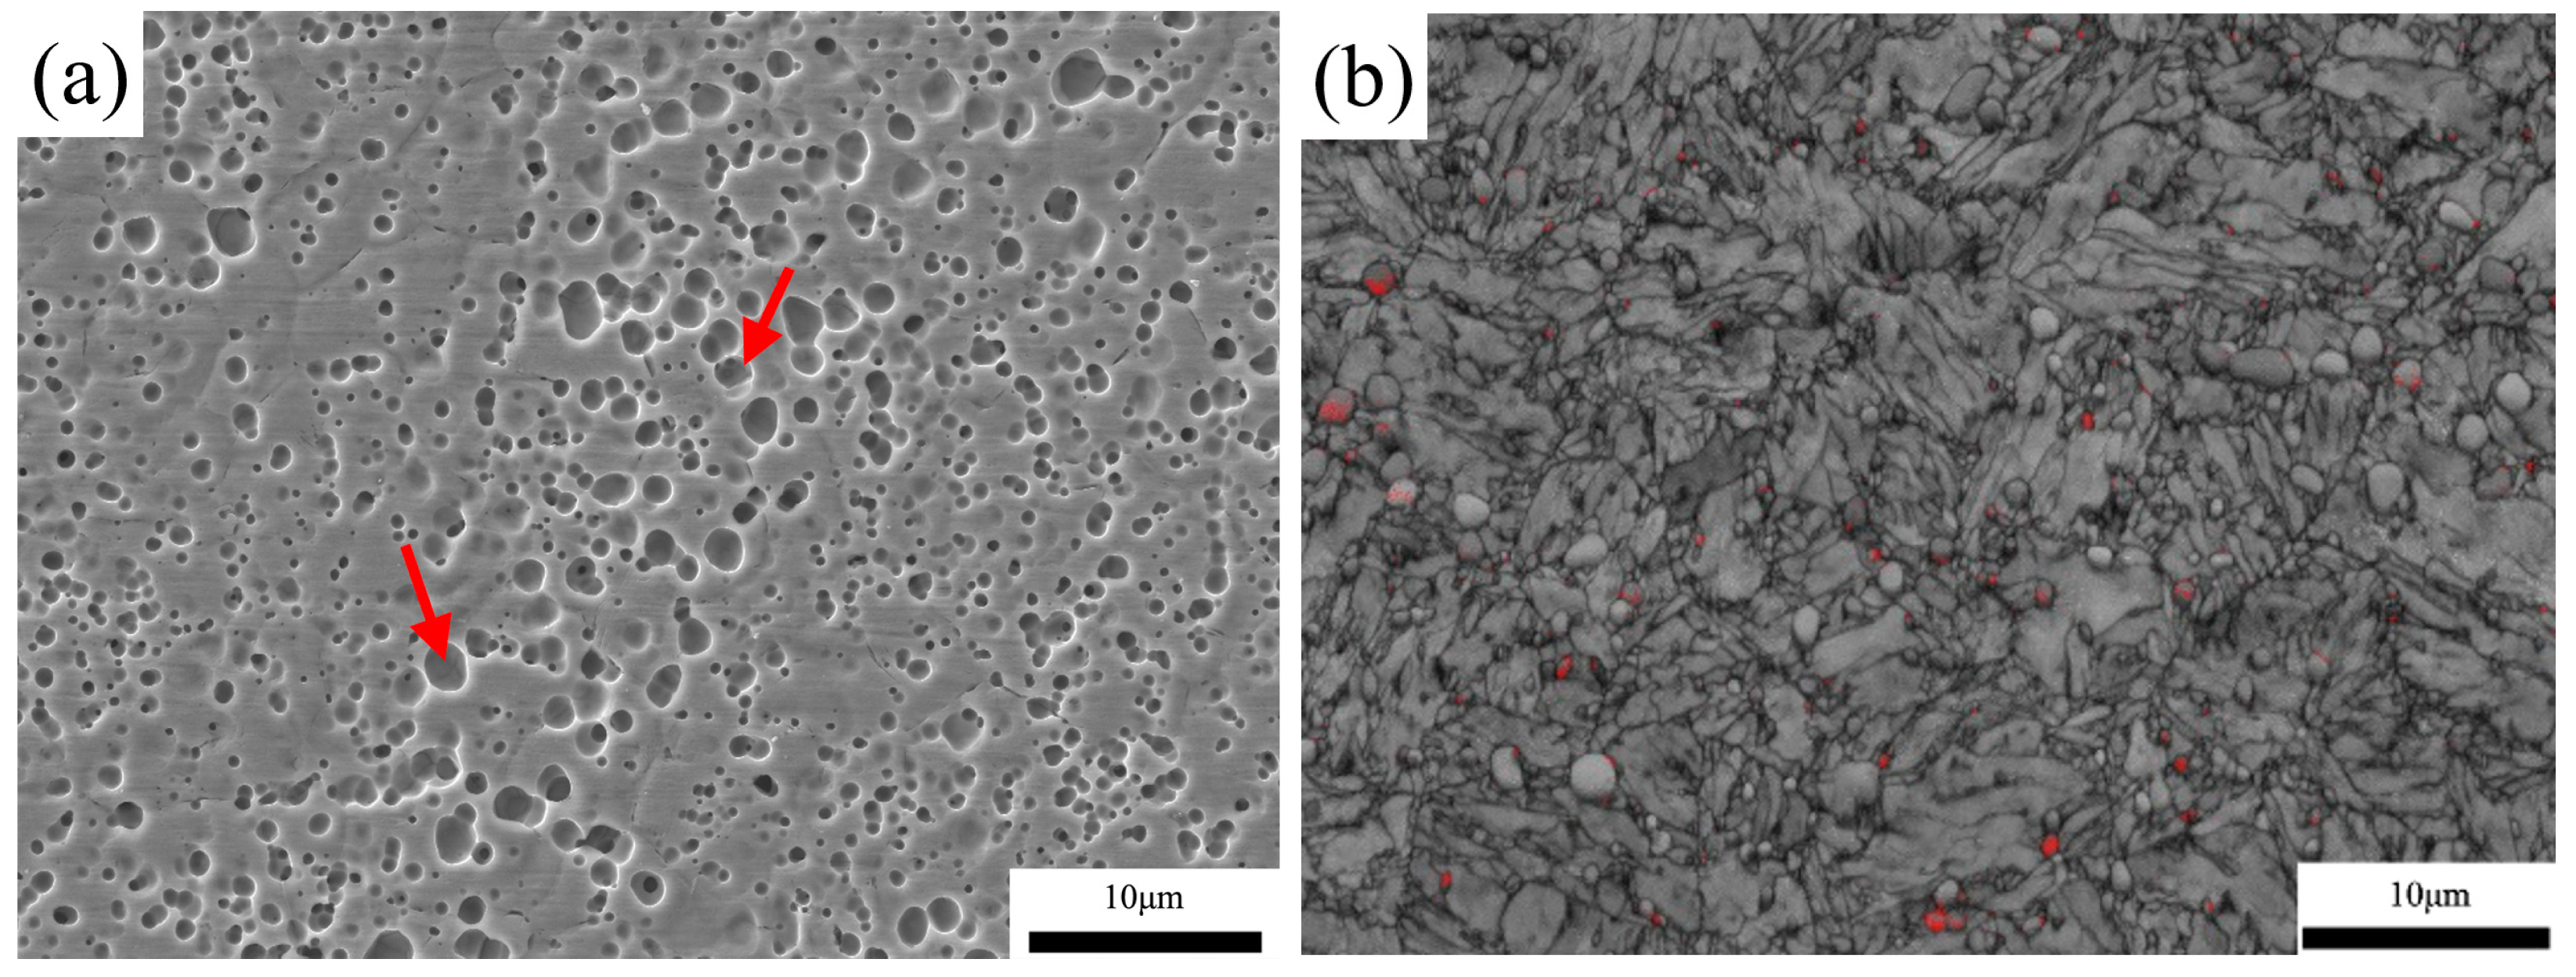
3.1. Microstructure Characterization of the Annealed Sample
3.2. Microstructure Characterization of the Quenched Samples
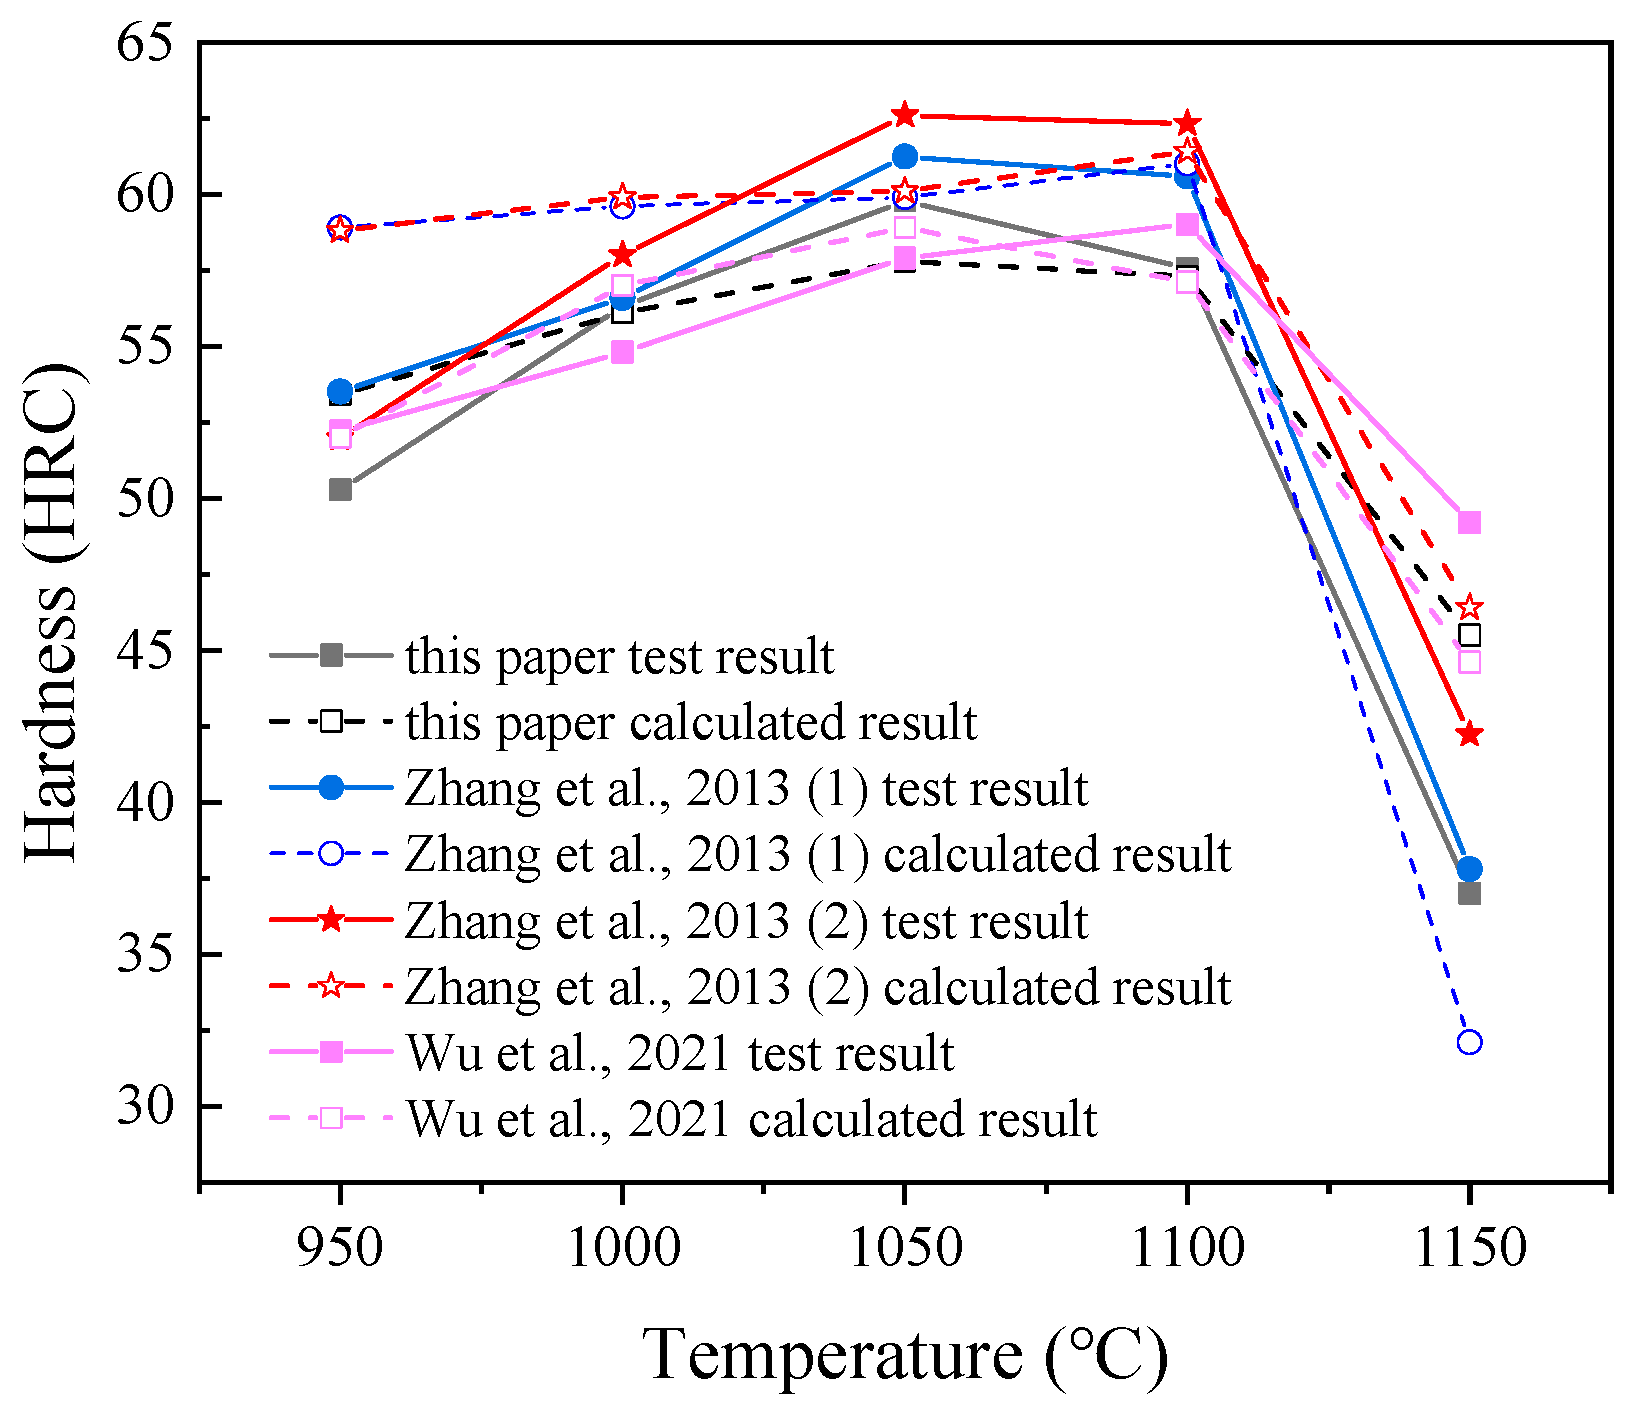
3.3. Hardness
4. Discussion
4.1. Dissolution Behavior of M23C6
4.2. Crystallographic Analysis of the Microstructure
4.3. Correlation of Microstructure and Hardness
5. Conclusions
- After oil quenched, the microstructure of 5Cr15MoV high-carbon martensite stainless steel was mainly composed of lath martensite, M23C6 carbides and retained austenite. With an increasing austenitizing temperature, the volume fraction of carbides decreased and retained austenite increased. When austenitizing temperature was 1050 °C, the highest hardness was obtained.
- At the initial stage, the dissolution of M23C6 carbides particles was in no particular order. The small particles disappeared rapidly first due to their small size. Moreover, the dissolution rate of larger carbides particles would become slow as the dissolution of a large number of fine carbides first resulted in decreasing chromium concentration between carbides and matrix.
- In 5Cr15MoV high-carbon martensite stainless steel, the martensite phase transformation conformed to K-S rules. The twin-related variant pair V1/V2 governed the phase transformation; meanwhile, the density of HAGBs increased at an austenitizing temperature in the range of 950–1150 °C, i.e., a mass fraction of carbon from 0.075% to 0.45%.
- The contribution to hardness came mainly from martensite in 5Cr15MoV high-carbon martensitic stainless steel. The retained austenite had a very negative effect on hardness when the volume fraction of retained austenite was more than 10%. In contrast, carbides contributed less to hardness due to their small content.
Author Contributions
Funding
Institutional Review Board Statement
Informed Consent Statement
Data Availability Statement
Conflicts of Interest
References
- Sapiro, D.; Webler, B. Fabrication of a Bronze Age Sword using Ancient Techniques. JOM 2016, 68, 3180–3185. [Google Scholar] [CrossRef]
- Gregory, G.; Hamby, R. Sharp edge cutting technology—A review of hand held and machine knives/blades and their sharp edge retention. Surf. Eng. 2000, 16, 373–378. [Google Scholar] [CrossRef]
- Barlow, L.; Toit, M.D. Effect of Austenitizing Heat Treatment on the Microstructure and Hardness of Martensitic Stainless Steel AISI 420. J. Mater. Eng. Perform. 2011, 21, 1327–1336. [Google Scholar] [CrossRef]
- de Andrés, G.C.; Caruana, G.; Alvarez, L.F. Control of M23C6 carbides in 0.45C–13Cr martensitic stainless steel by means of three representative heat treatment parameters. Mater. Sci. Eng. A 1998, 241, 211–215. [Google Scholar] [CrossRef]
- Buschow, K.H.J.; Cahn, R.W.; Flemings, M.C.; Ilschner, B.; Kramer, E.J.; Mahajan, S. Encyclopedia of Materials: Science and Technology. MRS Bull. 2004, 29, 512. [Google Scholar] [CrossRef][Green Version]
- de Silva, F.G.; Tavares, M.S.S.; Pardal, M.J.; Silva, M.R.D.; de Abreu, H.F.D. Influence of heat treatments on toughness and sensitization of a Ti-alloyed supermartensitic stainless steel. J. Mater. Sci. 2011, 46, 7737–7744. [Google Scholar] [CrossRef]
- Tan, L.; Graening, T.; Hu, X.; Zhong, W.; Yang, Y.; Zinkle, S.J.; Katoh, Y. Effects of carbonitrides and carbides on microstructure and properties of castable nanostructured alloys. J. Nucl. Mater. 2020, 540, 152376. [Google Scholar] [CrossRef]
- Srivatsa, K.; Srinivas, P.; Balachandran, G.; Balasubramanian, V. Improvement of impact toughness by modified hot working and heat treatment in 13%Cr martensitic stainless steel. Mater. Sci. Eng. A 2016, 677, 240–251. [Google Scholar] [CrossRef]
- Li, J.; Zhang, C.; Jiang, B.; Zhou, L.; Liu, Y. Effect of large-size M23C6-type carbides on the low-temperature toughness of martensitic heat-resistant steels. J. Alloys Compd. 2016, 685, 248–257. [Google Scholar] [CrossRef]
- Bonagani, K.S.; Bathula, V.; Kain, V. Influence of tempering treatment on microstructure and pitting corrosion of 13 wt.% Cr martensitic stainless steel. Corros. Sci. 2018, 131, 340–354. [Google Scholar] [CrossRef]
- Dalmau, A.; Richard, C.; Muñoz, A. Degradation mechanisms in martensitic stainless steels: Wear, corrosion and tribocorrosion appraisal. Tribol. Int. 2018, 121, 167–179. [Google Scholar] [CrossRef]
- Neri, M.A.; Colás, R. Analysis of a martensitic stainless steel that failed due to the presence of coarse carbides. Mater. Charact. 2001, 47, 283–289. [Google Scholar] [CrossRef]
- Deng, B.; Yang, D.; Wang, G.; Hou, Z.; Yi, H. Effects of Austenitizing Temperature on Tensile and Impact Properties of a Martensitic Stainless Steel Containing Metastable Retained Austenite. Materials 2021, 14, 1000. [Google Scholar] [CrossRef]
- Tsuchiyama, T.; Ono, Y.; Takaki, S. Microstructure Control for Toughening a High Carbon Martensitic Stainless Steel. ISIJ Int. 2000, 40, S184–S188. [Google Scholar] [CrossRef] [PubMed]
- Yang, Y.; Zhao, H.; Dong, H. Carbide Evolution in High-Carbon Martensitic Stainless Cutlery Steels during Austenitizing. J. Mater. Eng. Perform. 2020, 29, 3868–3875. [Google Scholar] [CrossRef]
- Wang, X.L.; Wang, Z.Q.; Dong, L.L.; Shang, C.J.; Ma, X.P.; Subramanian, S.V. New insights into the mechanism of cooling rate on the impact toughness of coarse grained heat affected zone from the aspect of variant selection. Mater. Sci. Eng. A 2017, 704, 448–458. [Google Scholar] [CrossRef]
- Wang, X.L.; Wang, Z.Q.; Ma, X.P.; Subramanian, S.V.; Xie, Z.J.; Shang, C.J.; Li, X.C. Analysis of impact toughness scatter in simulated coarse-grained HAZ of E550 grade offshore engineering steel from the aspect of crystallographic structure. Mater. Charact. 2018, 140, 312–319. [Google Scholar] [CrossRef]
- Hao, X.; Xi, T.; Zhang, H.; Yang, C.; Yang, K. Effect of Quenching Temperature on Microstructure and Properties of Cu-bearing 5Cr15MoV Martensitic Stainless Steel. Chin. J. Mater. Res. 2021, 35, 933–941. [Google Scholar] [CrossRef]
- Lastra, R. A Comparison of Liberation Determinations by Particle Area Percentage and Exposed Particle Perimeter Percentage In A Flotation Concentrator. J. Miner. Mater. Charact. Eng. 2002, 1, 31–37. [Google Scholar] [CrossRef]
- Aaron, H.B.; Kotler, G. Second phase dissolution. Metall. Trans. 1971, 2, 393–408. [Google Scholar] [CrossRef]
- Bowen, A.W.; Leak, G.M. Solute diffusion in alpha- and gamma-iron. Metall. Trans. 1970, 1, 1695–1700. [Google Scholar] [CrossRef]
- Wang, X.L.; Ma, X.P.; Wang, Z.Q.; Subramanian, S.V.; Xie, Z.J.; Shang, C.J.; Li, X.C. Carbon microalloying effect of base material on variant selection in coarse grained heat affected zone of X80 pipeline steel. Mater. Charact. 2019, 149, 26–33. [Google Scholar] [CrossRef]
- Kurdjumow, G.; Sachs, G. Über den Mechanismus der Stahlhärtung. Z. Phys. 1930, 64, 325–343. [Google Scholar] [CrossRef]
- Miyamoto, G.; Takayama, N.; Furuhara, T. Accurate measurement of the orientation relationship of lath martensite and bainite by electron backscatter diffraction analysis. Scr. Mater. 2009, 60, 1113–1116. [Google Scholar] [CrossRef]
- Takayama, N.; Miyamoto, G.; Furuhara, T. Effects of transformation temperature on variant pairing of bainitic ferrite in low carbon steel. Acta Mater. 2012, 60, 2387–2396. [Google Scholar] [CrossRef]
- Huang, S.; Wu, B.B.; Wang, Z.Q.; Yu, Y.S.; Wang, C.S.; Yan, L.; Li, X.C.; Shang, C.J.; Misra, R.D.K. EBSD study on the significance of carbon content on hardenability. Mater. Lett. 2019, 254, 412–414. [Google Scholar] [CrossRef]
- Wu, B.B.; Wang, Z.Q.; Wang, X.L.; Zhao, J.X.; Shang, C.J.; Misra, R.D.K. Relationship between high angle grain boundaries and hardness after γ→α transformation. Mater. Sci. Technol. 2019, 35, 1803–1814. [Google Scholar] [CrossRef]
- Wang, J.; Hong, H.; Huang, A.; Yang, X.; Qian, R.; Shang, C. New insight into the relationship between grain boundaries and hardness in bainitic/martensitic steels from the crystallographic perspective. Mater. Lett. 2022, 308, 131105. [Google Scholar] [CrossRef]
- Tomo-o Sato, T.N.; Jo Ishiwara, J. A Study on Hardness of Carbides in Iron and Steel. J. Jpn. Inst. Metals 1959, 23, 403–407. [Google Scholar] [CrossRef] [PubMed][Green Version]
- Stichel, W. ASM speciality handbook: Stainless steels. Mater. Corros. 1995, 46, 499. [Google Scholar] [CrossRef]
- Zhu, Z.; Yitao, Y.; Xuwei, W.; Hong, W. Martensitic Transformation (19). Heat Treat. Technol. Equip. 2014, 35, 67–72. [Google Scholar] [CrossRef]
- Zhang, J.; Wang, Z.; Li, X. Effect of quenching and tempering temperature on microstructure of 6Cr13 martensitic stainless steel. Heat Treat. Metals 2013, 38, 107–108. [Google Scholar] [CrossRef]
- Wu, Z. Effect of Heat Treatment Process on Microstructure and Properties of 7Cr14 Martensitic Stainless Steel; North University of China: Taiyuan, China, 2021. [Google Scholar]


| Material | C | Si | Mn | P | S | Cr | Mo | V | Fe |
|---|---|---|---|---|---|---|---|---|---|
| 5Cr15MoV | 0.46 | 0.41 | 0.43 | 0.018 | 0.012 | 14.7 | 0.47 | 0.21 | Bal. |
| Characteristic Diffraction Line | G |
|---|---|
| (200)γ/(200)α’ | 2.423 |
| (220)γ/(200)α’ | 1.274 |
| (311)γ/(200)α’ | 1.446 |
| (200)γ/(211)α’ | 1.331 |
| (220)γ/(211)α’ | 0.6955 |
| (311)γ/(211)α’ | 0.7939 |
| Phases | Austenitizing Temperature (°C) | ||||
|---|---|---|---|---|---|
| 950 | 1000 | 1050 | 1100 | 1150 | |
| Fraction of carbide (%) | 8.82 | 6.36 | 2.82 | 2.16 | 0.25 |
| Fraction of retained austenite (%) | 1.95 | 2.57 | 3.28 | 7.58 | 11.10 |
| 950 °C | 1000 °C | 1050 °C | 1100 °C | 1150 °C | |
|---|---|---|---|---|---|
| (wt.%) | 0.075 | 0.189 | 0.344 | 0.372 | 0.450 |
| Euler Angle (φ1, Φ, φ2) | ||
|---|---|---|
| Exact K-S OR | 114.2°, 10.5°, 204.2° | |
| Actual OR | 950 °C | 118.0°, 9.1°, 198.4° |
| 1000 °C | 118.9°, 9.3°, 197.6° | |
| 1050 °C | 119.0°, 9.2°, 197.3° | |
| 1100 °C | 119.4°, 9.2°, 197.0° | |
| 1150 °C | 117.8°, 9.1°, 198.5° | |
| Variant | Plane Parallel | Direction Parallel | Rotation Angle/Axis from V1 | CP Group | Bain Group | Boundary Type | |||||
|---|---|---|---|---|---|---|---|---|---|---|---|
| Exact K-S OR | 950 °C | 1000 °C | 1050 °C | 1100 °C | 1150 °C | ||||||
| V1 | (111)γ//(011)α | [−101]γ//[−1−11]α | - | - | - | - | - | - | CP1 | B1 | - |
| V2 | [−101]γ//[−11−1]α | 60.0°/[11−1] | 60.2 | 60.1 | 60.2 | 60.2 | 60.2 | B2 | Block | ||
| V3 | [01−1]γ//[−1−11]α | 60.0°/[011] | 59.8 | 60.0 | 59.8 | 59.8 | 59.5 | B3 | Block | ||
| V4 | [01−1]γ//[−11−1]α | 10.5°/[0−1−1] | 6.3 | 6.3 | 5.9 | 5.8 | 6.1 | B1 | Sub-block | ||
| V5 | [1−10]γ//[−1−11]α | 60.0°/[0−1−1] | 59.8 | 60.0 | 59.8 | 59.8 | 59.5 | B2 | Block | ||
| V6 | [1−10]γ//[−11−1]α | 49.5°/[011] | 53.9 | 53.9 | 54.3 | 54.3 | 54.2 | B3 | Block | ||
| V7 | (1–11)γ//(011)α | [10−1]γ//[−1−11]α | 49.5°/[−1−11] | 51.8 | 51.4 | 51.8 | 51.7 | 52.2 | CP2 | B2 | Packet |
| V8 | [10−1]γ//[−11−1]α | 10.5°/[11−1] | 8.9 | 9.3 | 9.1 | 9.2 | 8.6 | B1 | Packet | ||
| V9 | [−1−10]γ//[−1−11]α | 50.5°/[−103−13] | 52.2 | 52.1 | 52.3 | 52.3 | 52.2 | B3 | Packet | ||
| V10 | [−1−10]γ//[−11−1]α | 50.5°/[−7−55] | 51.5 | 51.2 | 51.3 | 51.3 | 51.5 | B2 | Packet | ||
| V11 | [011]γ//[−1−11]α | 14.9°/[1351] | 12.9 | 13.2 | 13.0 | 13.0 | 12.8 | B1 | Packet | ||
| V12 | [011]γ//[−11−1]α | 57.2°/[−356] | 58.3 | 58.2 | 58.0 | 57.9 | 58.0 | B3 | Packet | ||
| V13 | (−111)γ//(011)α | [0−11]γ//[−1−11]α | 14.9°/[5−13−1] | 12.9 | 13.2 | 13.0 | 13.0 | 12.8 | CP3 | B1 | Packet |
| V14 | [0−11]γ//[−11−1]α | 50.5°/[−55−7] | 51.5 | 51.2 | 51.3 | 51.3 | 51.5 | B3 | Packet | ||
| V15 | [−10−1]γ//[−1−11]α | 57.2°/[−6−25] | 57.1 | 56.8 | 56.9 | 56.8 | 57.2 | B2 | Packet | ||
| V16 | [−10−1]γ//[−11−1]α | 20.6°/[11−11−6] | 16.5 | 16.7 | 16.4 | 16.4 | 16.3 | B1 | Packet | ||
| V17 | [110]γ//[−1−11]α | 51.7°/[−116−11] | 51.3 | 51.2 | 51.2 | 51.1 | 51.1 | B3 | Packet | ||
| V18 | [110]γ//[−11−1]α | 47.1°/[−24−102] | 51.2 | 50.9 | 51.4 | 51.4 | 51.6 | B2 | Packet | ||
| V19 | (11–1)γ//(011)α | [−110]γ//[−1−11]α | 50.5°/[−31310] | 52.2 | 52.1 | 52.3 | 52.3 | 52.2 | CP4 | B3 | Packet |
| V20 | [−110]γ//[−11−1]α | 57.2°/[36−5] | 58.3 | 58.2 | 58.0 | 57.9 | 58.0 | B2 | Packet | ||
| V21 | [0−1−1]γ//[−1−11]α | 20.6°/[30−1] | 17.6 | 18.1 | 17.8 | 17.9 | 17.5 | B1 | Packet | ||
| V22 | [0−1−1]γ//[−11−1]α | 47.1°/[−102124] | 51.2 | 50.9 | 51.4 | 51.4 | 51.6 | B3 | Packet | ||
| V23 | [101]γ//[−1−11]α | 57.2°/[−2−5−6] | 57.1 | 56.8 | 56.9 | 56.8 | 57.2 | B2 | Packet | ||
| V24 | [101]γ//[−11−1]α | 21.1°/[9−40] | 18.3 | 18.6 | 18.3 | 18.4 | 18.2 | B1 | Packet | ||
Publisher’s Note: MDPI stays neutral with regard to jurisdictional claims in published maps and institutional affiliations. |
© 2022 by the authors. Licensee MDPI, Basel, Switzerland. This article is an open access article distributed under the terms and conditions of the Creative Commons Attribution (CC BY) license (https://creativecommons.org/licenses/by/4.0/).
Share and Cite
Liu, W.; Wang, X.; Guo, F.; Shang, C. Carbides Dissolution in 5Cr15MoV Martensitic Stainless Steel and New Insights into Its Effect on Microstructure and Hardness. Materials 2022, 15, 8742. https://doi.org/10.3390/ma15248742
Liu W, Wang X, Guo F, Shang C. Carbides Dissolution in 5Cr15MoV Martensitic Stainless Steel and New Insights into Its Effect on Microstructure and Hardness. Materials. 2022; 15(24):8742. https://doi.org/10.3390/ma15248742
Chicago/Turabian StyleLiu, Wenle, Xuelin Wang, Fujian Guo, and Chengjia Shang. 2022. "Carbides Dissolution in 5Cr15MoV Martensitic Stainless Steel and New Insights into Its Effect on Microstructure and Hardness" Materials 15, no. 24: 8742. https://doi.org/10.3390/ma15248742
APA StyleLiu, W., Wang, X., Guo, F., & Shang, C. (2022). Carbides Dissolution in 5Cr15MoV Martensitic Stainless Steel and New Insights into Its Effect on Microstructure and Hardness. Materials, 15(24), 8742. https://doi.org/10.3390/ma15248742