Article

Kinetic Mechanisms and Emissions Investigation of Torrefied Pine Sawdust Utilized as Solid Fuel by Isothermal and Non-Isothermal Experiments

1
School of Mine, China University of Mining and Technology, Xuzhou 221116, China
2
School of Low-Carbon Energy and Power Engineering, China University of Mining and Technology, Xuzhou 221116, China
*
Author to whom correspondence should be addressed.
Materials 2022, 15(23), 8650; https://doi.org/10.3390/ma15238650
Submission received: 26 October 2022 / Revised: 11 November 2022 / Accepted: 2 December 2022 / Published: 4 December 2022
(This article belongs to the Section Biomaterials)

Abstract

:
This study comprehensively investigated the utilization of torrefied pine sawdust (PS) as solid fuels, involving the characterization of torrefied PS properties, the investigation of combustion behaviors and kinetic mechanisms by non-isothermal experiments, and the evaluation of emissions during isothermal experiments. Results show that torrefaction significantly improved the quality of the solids. The upgradation of torrefied PS properties then further enhanced its combustion performance. For the kinetics mechanisms, degradation mechanisms and diffusion mechanisms were respectively determined for the volatile combustion and the char combustion by using both Coats–Redfern (CR) and Freeman–Carroll (FC) methods. Further, after torrefaction, the emission of NO for volatile combustion reduced while it increased for char combustion. An inverse relationship was found between the conversion of fuel-N to NO and the nitrogen content in the torrefied samples. This study provided comprehensive insights for considering torrefaction as a pretreatment technique for PS utilization as a solid fuel.

1. Introduction

With the declaration of peak carbon emissions by 2030 and carbon neutral by 2060, the utilization of renewable energy sources, such as solar, wind, and biomass energy, etc., became increasingly important in China. As the only carbon-based material among these renewable energy sources, biomass has the ability to be converted into gases, liquids, chemicals and solid materials with zero CO2 emissions through its life cycle [1] due to which it is considered to be an indispensable material to partially substitute the consumption of traditional fossil fuels [2]. Nowadays, the common technologies for biomass utilization are thermochemical and biological conversion [3], wherein thermochemical conversion, including combustion, pyrolysis, gasification, etc., is the most efficient [1]. However, there are still challenges for biomass large scale utilization due to its high moisture, low energy density, and hydrophilia, as well as the high milling and transportation costs [4,5].
Within this context, various pretreatment technologies have been developed by researchers. Compared with pyrolysis and hydrothermal carbonization treatments, torrefaction which is actually a mild pyrolysis process is of less energy consumption and costs [6]. It consumed the least energy during the reaction with obtaining the highest energy values in the solid products [7,8]. Due to this, torrefaction attracted increasingly attention [9]. Generally, the torrefaction process involves four stages [1]. At first, biomass is heated to the drying temperature (<105 °C) and the free water inside the biomass evaporates. As the temperature continuously rises (<200 °C), the bound water is removed accompanied by minor mass loss caused by the slightly degradation of the organics. Then, it is the torrefaction process operated at a desired temperature (200~300 °C) involving the decomposition of hemicellulose, cellulose and partial lignin [10]. Finally, the torrefied biomass is cooled to room temperature. It is widely accepted that the properties of torrefied biomass, such as HHV, bulk density, energy density and grindability etc., are upgraded by reducing the water and oxygen content [11,12,13].
Because of the upgraded properties, torrefied biomass can easily replace coal in combustion or be co-fired with coal for electric power generation and heat supply [14,15]. Investigation of kinetics is the fundament to reveal the combustion mechanisms and to provide references for designing industrial facilities. Thermogravimetric analysis (TGA) has been proved to be an effective method to understand the combustion mechanism of solid fuels [16]. Ignition temperature (Ti), burnout temperature (Tp) etc. are commonly used parameters for assessing the combustion performance [17,18]. Nyakuma et al. [19] found that the torrefied pellets of oil palm empty fruit bunches were less thermally reactive compared to the raw pellet. In addition, few studies researched the kinetic mechanisms of torrefied biomass. Torrefaction was found to increase the activation energy (Ea) and enhance the thermal stability of oil palm wastes [16], whereas it decreased the Ea of the spent coffee grounds and pigeon pea stalk [20,21]. However, Gürel et al. [22] reported that the torrefied biomass fuels exhibited the same qualitative behavior as the raw fuels. It can be seen that there are still conflicts in the results in the existing literature, and there is still confusion about the kinetic mechanisms of torrefied biomass combustion.
In addition to the kinetics, gas pollutants emission is another focus for torrefied biomass utilization as solid fuel. Ma et al. [23] found that torrefaction effectively decreased CO, NO and SO2 emissions during combustion of municipal wastes. For Bamboo residues, torrefaction reduced NH3 and NO emissions [24]. Maxwell et al. [25] also found that the emission of NOx decreased for torrefied biomass combustion, despite of the increased fuel-N content. On the contrary, torrefaction increased the fuel-N contents and subsequently resulted in a higher NOx emissions for kenaf [26] and Grape pomace [27]. However, torrefaction of banana leaf reduced CO, CO2 and SO2 emissions potential than commercial hard coal, except for NOx [28]. It was reported that the conversions and emission factors of gas pollutants varied with biomass type [29,30].
As reviewed above, the upgradation on the properties of biomass after torrefaction was widely accepted. However, investigations on the kinetic mechanisms and gas pollutants emissions are still controversial. Due to this, more studies are still needed to complement information on torrefied biomass utilization as fuel. It is widely reported that torrefaction is far more sensitive to temperature than residence time and heating rate [21,31]. Thus, in this study, pine sawdust was traditionally torrefied and the properties of torrefied samples integrated with the combustion kinetic mechanism and the emissions were investigated by non-isothermal combustion and isothermal experiments. The results could provide complementary information for the design, optimization and modification of industrial facilities.

2. Materials and Methods

2.1. Materials

Pine sawdust (PS), a typical woody biomass was employed as sample in this study. Before experiments, the raw material was dried for 24 h at 105 °C and then pulverized. The particle size of 60~100 mesh was then sieved for subsequent torrefaction experiments and analysis.

2.2. Methods

2.2.1. Torrefaction of PS

Torrefaction experiments were conducted in a horizontal tube furnace (Yifeng Electric Furnace Co., LTD, Shanghai, China). A total of 3 ± 0.01 g of the PS powder was weighted in each experiment. Then, the samples were lightly torrefied at 200 °C, mildly at 250 °C and severely at 300 °C in N2 atmosphere for 1 h, respectively. The purity of the N2 was 99.999% and the flow rate was 0.5 L/min. After experiments, the solid product was cooled to the room temperature with the protection of N2 and then weighted and collected for further characterization and experiments. The torrefied PS produced at 200 °C, 250 °C and 300 °C were denoted as PS200, PS250 and PS300, respectively.

2.2.2. Characterization

To evaluate the evolution of chemical components after torrefaction, proximate and ultimate analysis for the raw and torrefied PS were investigated according to the methods described in our previous study [32]. HHV was also tested by a calorimeter bomb for the fuel purpose.
Mass yield and energy yield were calculated following Equations (1) and (2) [7], respectively.
M = m 1 m 0 × 100 %
E = M × H H V 1 H H V 0 × 100 %
where M is the mass yield, wt.%; m1 and m0 are the mass of torrefied product and raw biomass, respectively, g; E is the energy yield, %; HHV1 and HHV0 are the high heating value of torrefied product and raw biomass, respectively, MJ/kg.

2.2.3. Non-Isothermal Combustion

Non-isothermal combustion tests were performed using a TG analyzer (TGA 4000-SPECTRUM TWO, PerkinElmer, MA, USA) in air atmosphere to investigate the combustion behaviors of the raw and torrefied PS. 10 ± 0.1 mg of the samples were weighted and then loaded into an alumina ceramic crucible during each run. The flow rate of air was 100 mL/min. The temperature programming was set from room temperature to 800 °C with a heating rate of 10 °C/min.
Ignition temperature (Ti) and burnout temperature (Tb) were calculated to evaluate the thermal stability of the solid fuel. Ti was determined by TG/DTG plots using the intersection method (IM) [33] and Tb was the point where the weight loss rate was lower than 1 wt.%/min [17]. DTGmax was the highest weight loss rate in each stage and peak temperature (Tp) was the temperature at this point, both of which can be directly determined by DTG curves [26].
To further assess the combustion performance of the solid fuel, flammability index (Ci, wt.% min−1 °C−2) and comprehensive combustion index (S, wt.%2 min−2 °C−3) were calculated following equation (3~4) [28,34]. Especially, S is a comprehensive parameter integrates the ignition and burnout characteristics of the solid fuel [20]. A higher S indicates better combustion reactivity [24].
C i = D T G max T i 2
S = D T G max × D T G m e a n T i 2 × T b
where DTGmean is the average weight loss rate from ignition to burnout temperature, wt.%/min.

2.2.4. Kinetic Analysis

Kinetics mechanism provide valuable information for designing and optimizing the combustion facilities. In this study, model fitting methods of an integral method (Coats–Redfern method, CR) [35,36,37] and differential method (Freeman–Carroll, FC) [16,38] were employed for calculation of kinetics parameters using TGA data. The conversion rates of all reactions can be described by Arrhenius expression:
d α d t = k f ( α )
k = A exp ( E a R T )
where α is the conversion degree defined as (m0mt)/(m0mf); m0 is the initial mass of the sample, g; mt is the mass of the sample at time t, g; mf is the final mass of the sample, g; Ea is the apparent activation energy (kJ/mol); A is the pre-exponential factor (s−1); R is the universal gas constant; T is the temperature (K). A larger Ea indicates that the reaction is more difficult to process while a larger A indicates the more active the reaction [36].
Then, the conversion rate can be rewritten as the following equation:
d α d t = A e E R R T f ( α )
In this study, the TGA is non-isothermal process but the heating rate is constant, so Equation (7) can be modified considering the heating rate β as dT = βdt:
d α d T = A β e E R R T f ( α )
The most commonly used model for f(α) is defined as:
f ( α ) = ( 1 α ) n
To simplify the kinetic calculations, biomass combustion reactions were often considered as first order reaction in many literatures. However, the combustion process is actually complicated involving homogeneous and heterogeneous reactions. Therefore, different f(α) models were used in this study to calculate Ea and A.
For CR method:
g ( α ) = 1 f ( α ) d α = A β e E a R T d T
Integrating and then taking logarithms at both sides, Equation (10) becomes:
ln g ( α ) T 2 = ln [ A β R E a ( 1 2 R T E a ) ] E a R T
Here, (1 − 2RT/Ea) can be approximately equal to 1 because RT/Ea is far smaller than 1. Then, a line can be obtained with a slope and y-intercept using for the calculation of Ea and A, respectively.
For FC method, taking logarithms at both sides of Equation (8):
ln ( d α d T ) = ln A β E a R T + n ln ( 1 α )
Using interpolation method, Equation (12) becomes:
Δ ln ( d α d T ) Δ ln ( 1 α ) = n E a Δ T 1 R Δ ln ( 1 α )
Then, a regression line can be obtained with a slope and y-intercept directly corresponding to Ea and n, respectively. After defining Ea and n, A can be obtained from Equation (12).

2.2.5. Isothermal Combustion

Isothermal combustion experiments were carried out in the horizontal tube furnace at 800 °C to estimate the emissions. 50 ± 0.1 mg samples were employed in each test. The flow rate of air was 50 mL/min. CO2, CO and NO concentrations were on-line tested by a flue gas analyzer (NOVAplus, MRU Instruments, Inc., Neckarsulm, Germany). Each experiment was repeated three times and the average value of conversion rate was calculated.

3. Results and Discussion

3.1. Properties

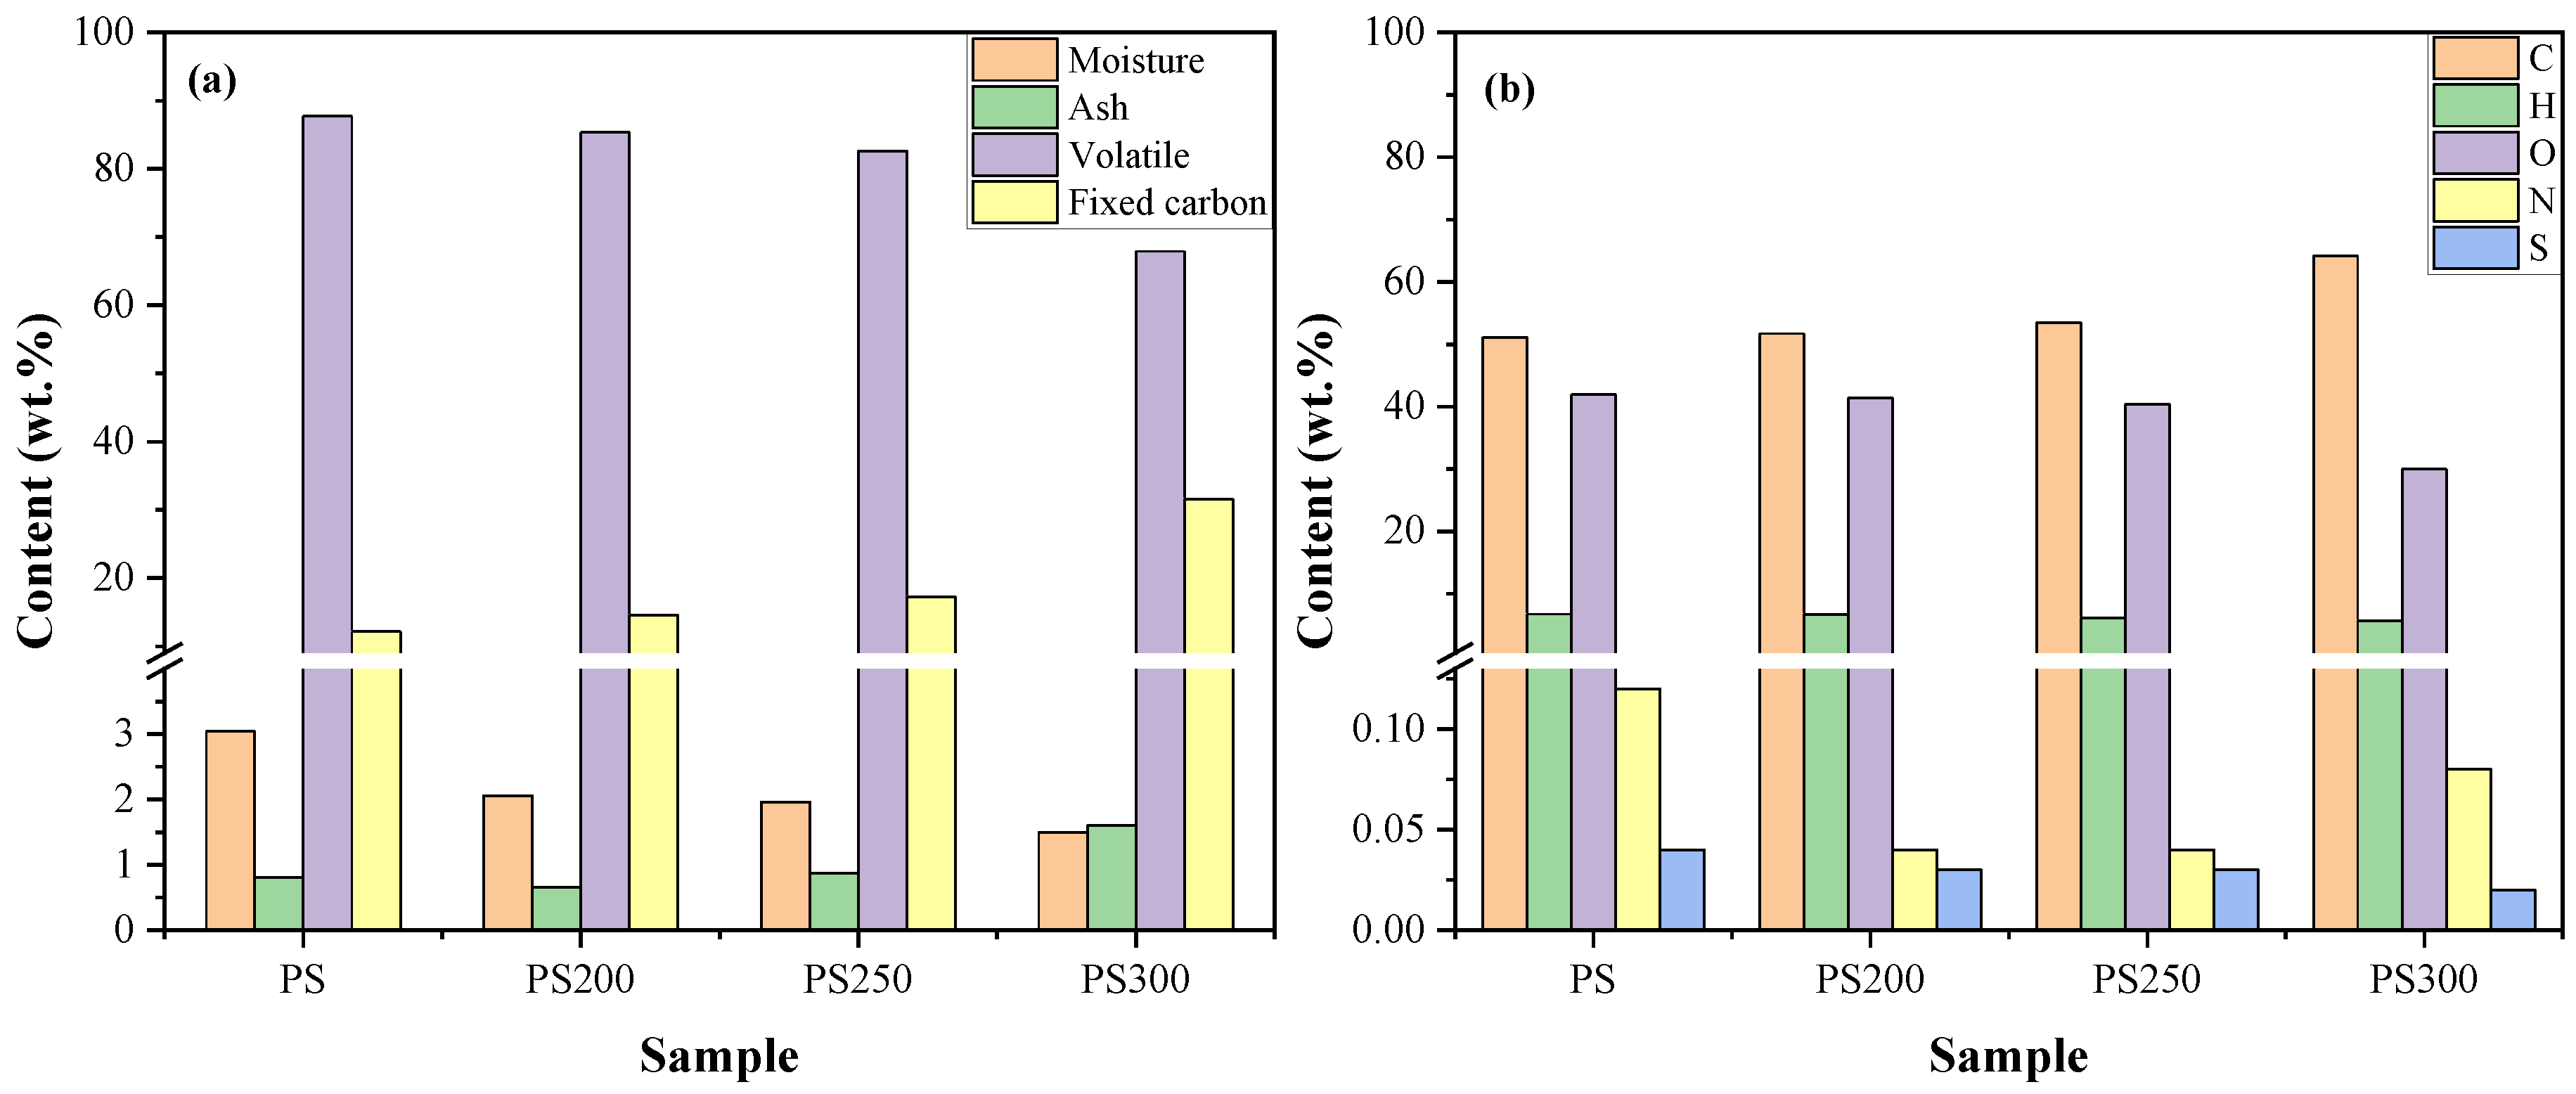
3.1.1. Proximate and Ultimate Analysis

The results of proximate and ultimate analysis of the raw and torrefied PS are shown in Figure 1 and the detailed information was given in Table S1 in the Supplementary Material. The contents of volatile and moisture decreased while those of ash and fixed carbon increased after torrefaction. This should be attributed to the evaporation and degradation of organics during torrefaction. It was reported that the stability of the organics in biomass followed in the order of hemicellulose decomposed at around 180 °C < cellulose at around 200 °C < lignin at approximately 300 °C [11,12]. Due to this, the degradation of the organics was more violent at 300 °C, leading to quite a significant reduction of volatile content and an increase of fixed carbon content in PS300 compared with that of PS200 and PS250, accompanied by the enrichment of ash components in the solid product.
The changes of the CHO contents were negligible when PS was lightly and mildly torrefied, while remarkable changes were observed at 300 °C. This means that the degradation of organics was much violent at 300 °C. At this temperature, a large amount of CHO elements is released in the form of CO2, CO and H2O via dihydrogen and dicarboxylic reactions of cellulose, hemicellulose and partial lignin [11,12,39]. The N content in PS, PS200, PS250 and PS300 was 0.12 wt.%, 0.04 wt.%, 0.04 wt.% and 0.08 wt.%, respectively. Thus, it can be calculated that 68.58 wt.%, 72.09 wt.% and 64.82 wt.% of the fuel-N was released in the torrefaction process, respectively. In general, the N and S contents decreased after torrefaction which might be beneficial to the reduction of NOx and SO2 pollutants in the consequently combustion process. Additionally, the S content in the raw and torrefied PS was tiny (less than 0.04 wt.%) that can be ignored.
A liner relationship between O/C and H/C was found in the Van Krevelen Plot as shown in Figure 2. As temperature increased, both O/C and H/C ratios decreased, indicating a higher energy density for solid fuel [1]. The raw PS has an O/C ratio of 0.82 and H/C ratio of 0.132. After torrefaction, the values of O/C and H/C ratio decreased to 0.8 and 0.129, 0.75 and 0.12, 0.46 and 0.09 for PS200, PS250 and PS300, respectively, implying the removal of O and H elements during torrefaction caused by the dehydration, deoxygenation and dehydrogenation reactions of organics [21]. This is highly in line with the results of proximate and element analysis. Further, the reduction of O/C and H/C ratios also led to an increase in the HHV of the solids, especially for PS300. The value of HHV was 20.89 MJ/kg for PS, while it reached to 25.49 MJ/kg for PS300, which is comparable to that of coal (25–35 MJ/kg) [1].

3.1.2. Mass and Energy Yields

As shown in Figure 3, the mass yield decreased with rising temperature. When torrefied at 200 °C, the weight loss of the solids was inconspicuous and the mass yield was 93.9 wt.%. This was attributed to the precipitation of a small amount of water, including evaporation and the slightly dehydration reaction of hemicellulose with poor stability [32]. Remarkable weight loss was observed at 300 °C with a mass yield of 51.5 wt.%, indicating that the degradation of hemicellulose, cellulose and lignin was much violent at a higher temperature [40]. The energy yield versus temperature showed the same tendency as the mass yield. However, the energy yield was always higher than the mass yield in any case. This is quite consistent with previous studies [12,41].
EMCI, an energy-mass co-benefit index that comprehensively considers the mass and energy yields [42] was evaluated. A larger EMCI indicates a higher energy density and a less volume of the solids, which are beneficial to increase processing efficiency and to facilitate transport [43]. The values of EMCI are simultaneously provided in Figure 1. At 200 °C and 250 °C, it was 0.40 and 2.03, respectively, while it reached to 11.34 at 300 °C. From this perspective, 300 °C was the optimal temperature for PS torrefaction.

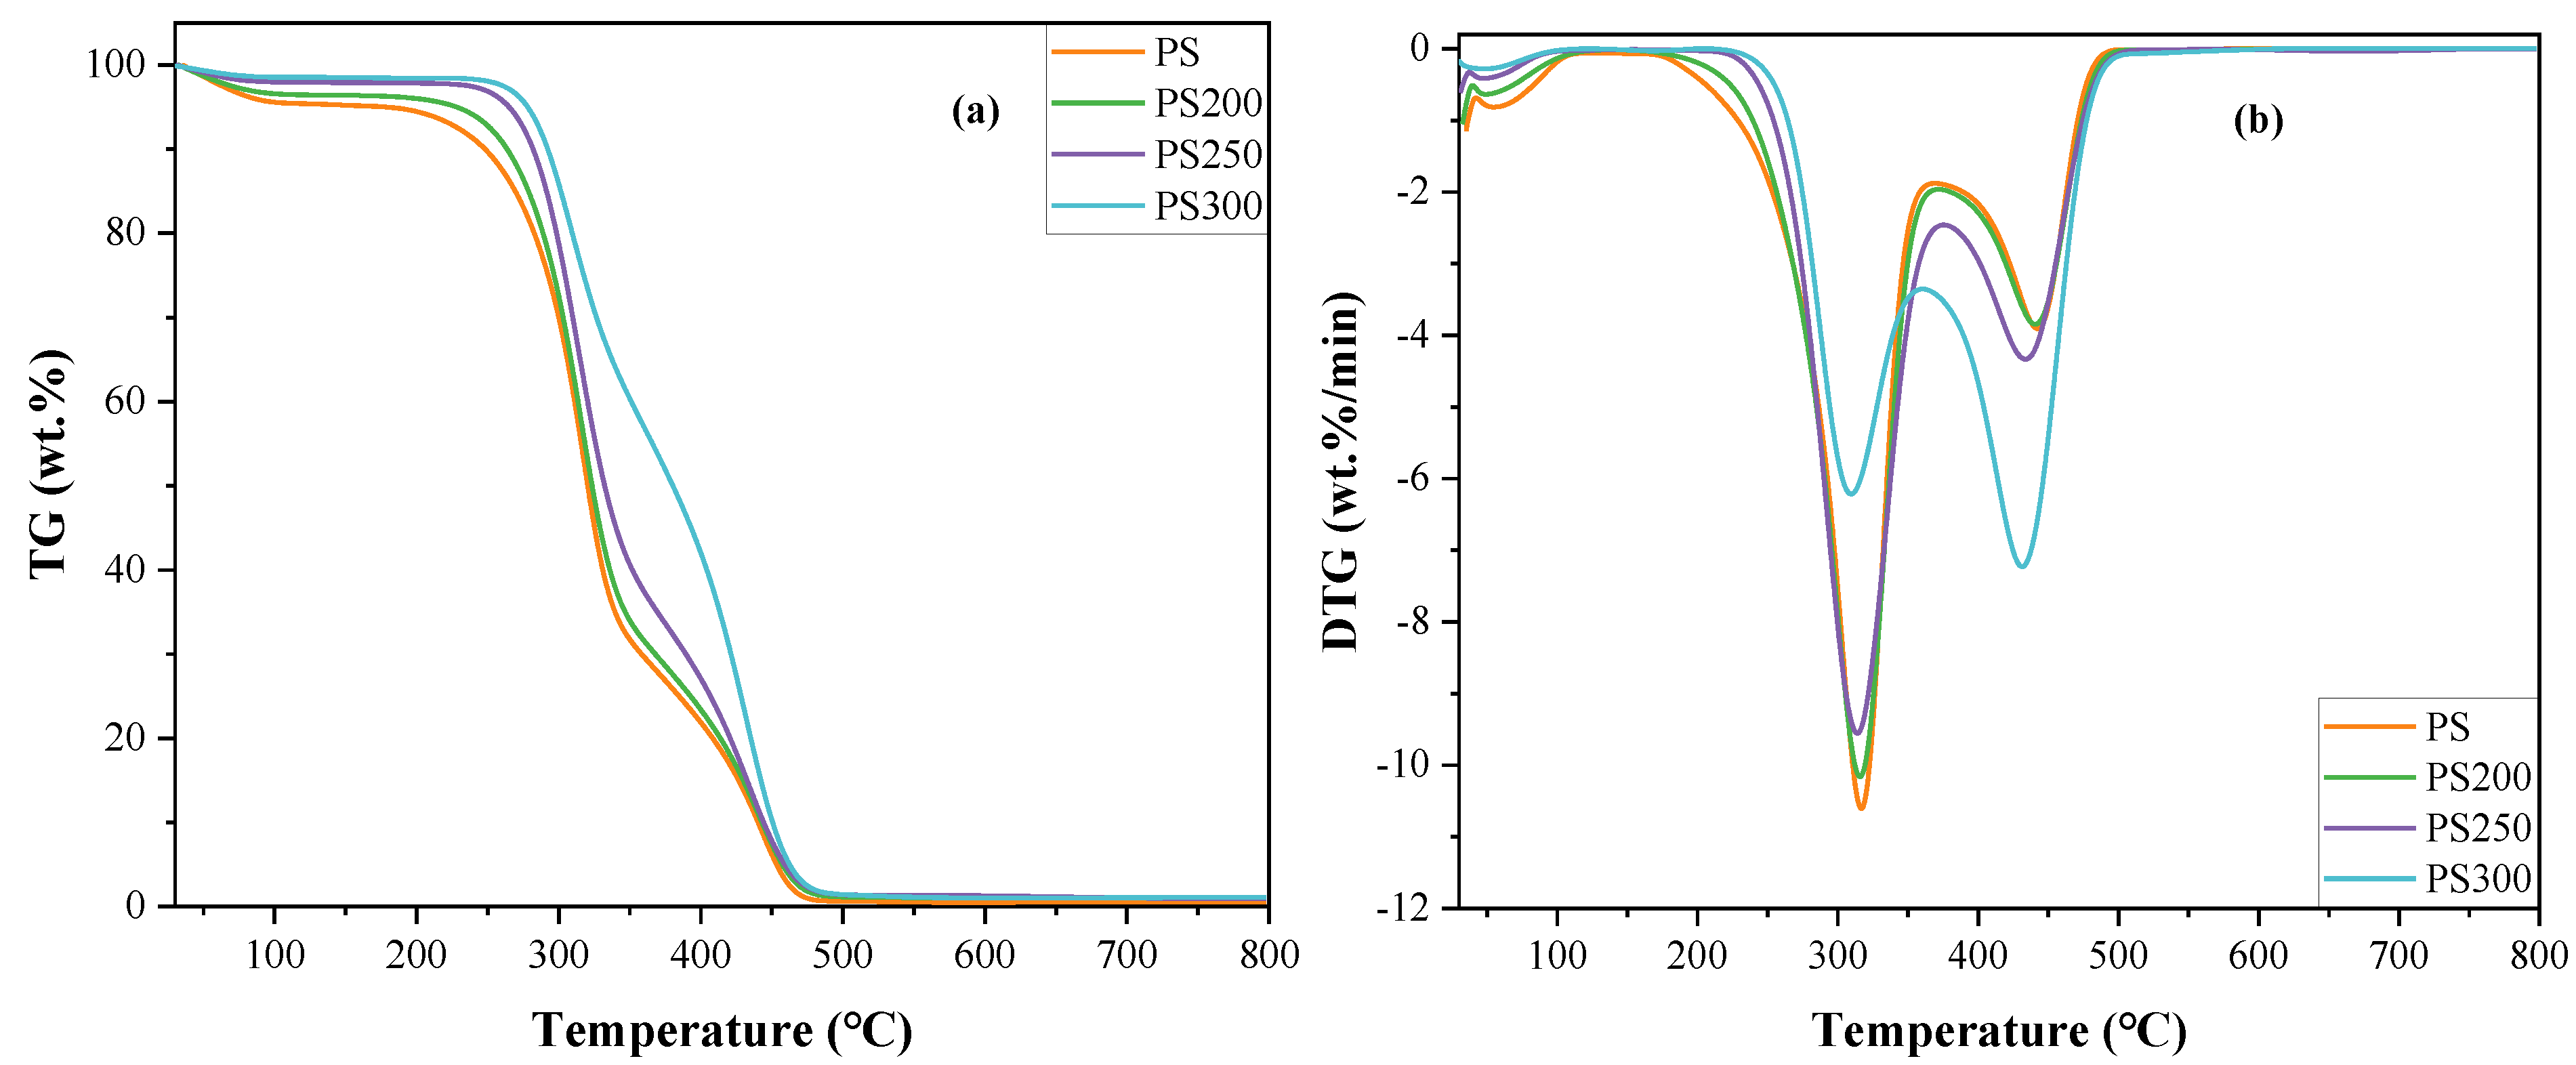
3.2. Non-Isothermal Combustion

Figure 4 illustrated the non-isothermal profiles for the combustion of the raw and torrefied PS. As shown in Figure 4a, the TG curves for PS200 and PS250 was not significantly affected by torrefaction. However, it was quite different for PS300, implying that the properties of PS were not greatly changed until the torrefaction temperature reached to 300 °C. In addition, there were three peaks for weight loss rate in the DTG curves, indicating that the combustion process could be divided into three stages: the drying stage (stage I), devolatilization and combustion stage (stage II), and char combustion stage (stage III). The mineral decomposition stage (stage IV) reported by Ullah et al. [44] was not observed in the profiles due to the negligible ash content in the raw and torrefied PS.
The drying stage occurred at temperatures below 150 °C during which the weight loss was usually assigned to the evaporation of absorbed moisture [17,28]. The maximum weight loss rate was 0.8 wt.%/min, 0.63 wt.%/min, 0.4 wt.%/min and 0.27 wt.%/min observed at 60 °C, 46.7 °C, 53.1°C and 54.1 °C for PS, PS200, PS250 and PS300, respectively. The decrease in the maximum weight loss rate indicated the reduction of moisture content in the torrefied PS.
The temperature range for devolatilization and combustion was from 150 °C to 369.1 °C, 371.7 °C, 375.4 °C and 360.5 °C for PS, PS200, PS250 and PS300, respectively. In this stage, the volatiles released due to the devolatilization and depolymerization of hemicellulose, cellulose and lignin, and then oxidized accompanied by the formation of the char matrix [28]. Then, it was the char combustion stage, which continued to approximately 500 °C.
Table 1 shows the combustion characteristics and indices of the raw and torrefied PS. Torrefaction increased the ignition temperature (Ti) from 272.9 °C for PS to 289.6 for PS300 in virtue of the breakdown of hemicellulose and retaining most of the cellulose and lignin in torrefied PS [45]. This led to the delay of the devolatilization and combustion. Alves et al. [28] also found that the ignition temperatures for torrefied banana leaf waste were 8~14 °C higher than that of the original sample due to the lower values of volatile, hydrogen and oxygen contents. The burnout temperatures (Tb) for torrefied PS were also higher than the raw PS, indicating a longer combustion process for torrefied PS because of the increase of the lignin content [17].
Compared to PS, the peak temperatures (Tp) of both volatile and char combustion for torrefied PS samples shifted to lower values, implying the upgradation of the reactivity of the solid fuels after torrefaction. The maximum weight loss rate (DTGmax) and the weight loss (WL) of the volatile combustion decreased while that of the char combustion increased. Especially for PS300, the DTGmax for the overall combustion process even shifted from volatile combustion to char combustion stage. This should be attributed to the reduction of volatile content and the increase of the fixed carbon content [19].
The flammability index (C) decreased with rising torrefaction temperature because torrefaction reduced the flammable components (mainly hemicellulose and cellulose) in the solid fuels [17]. The comprehensive combustion index (S) was not affected by light torrefaction, while it slightly decreased after mild and severe torrefaction. The values of S for torrefied poultry litter at 250–280 °C were also found to be lower than that of the raw sample [18]. It was reported that S was positively affected by hemicellulose while negatively correlated with lignin [46]. Duman et al. [47] researched the combustion behavior of torrefied olive tree pruning and vineyard pruning and came to the conclusion that torrefied biomass had lower S values compared to the raw samples. They suggested that S was affected by several factors, such as the number of active sites, oxygen content, inorganic content, etc. However, the decrease of S in this study was tiny that could be ignored.

3.3. Kinetic Mechanism
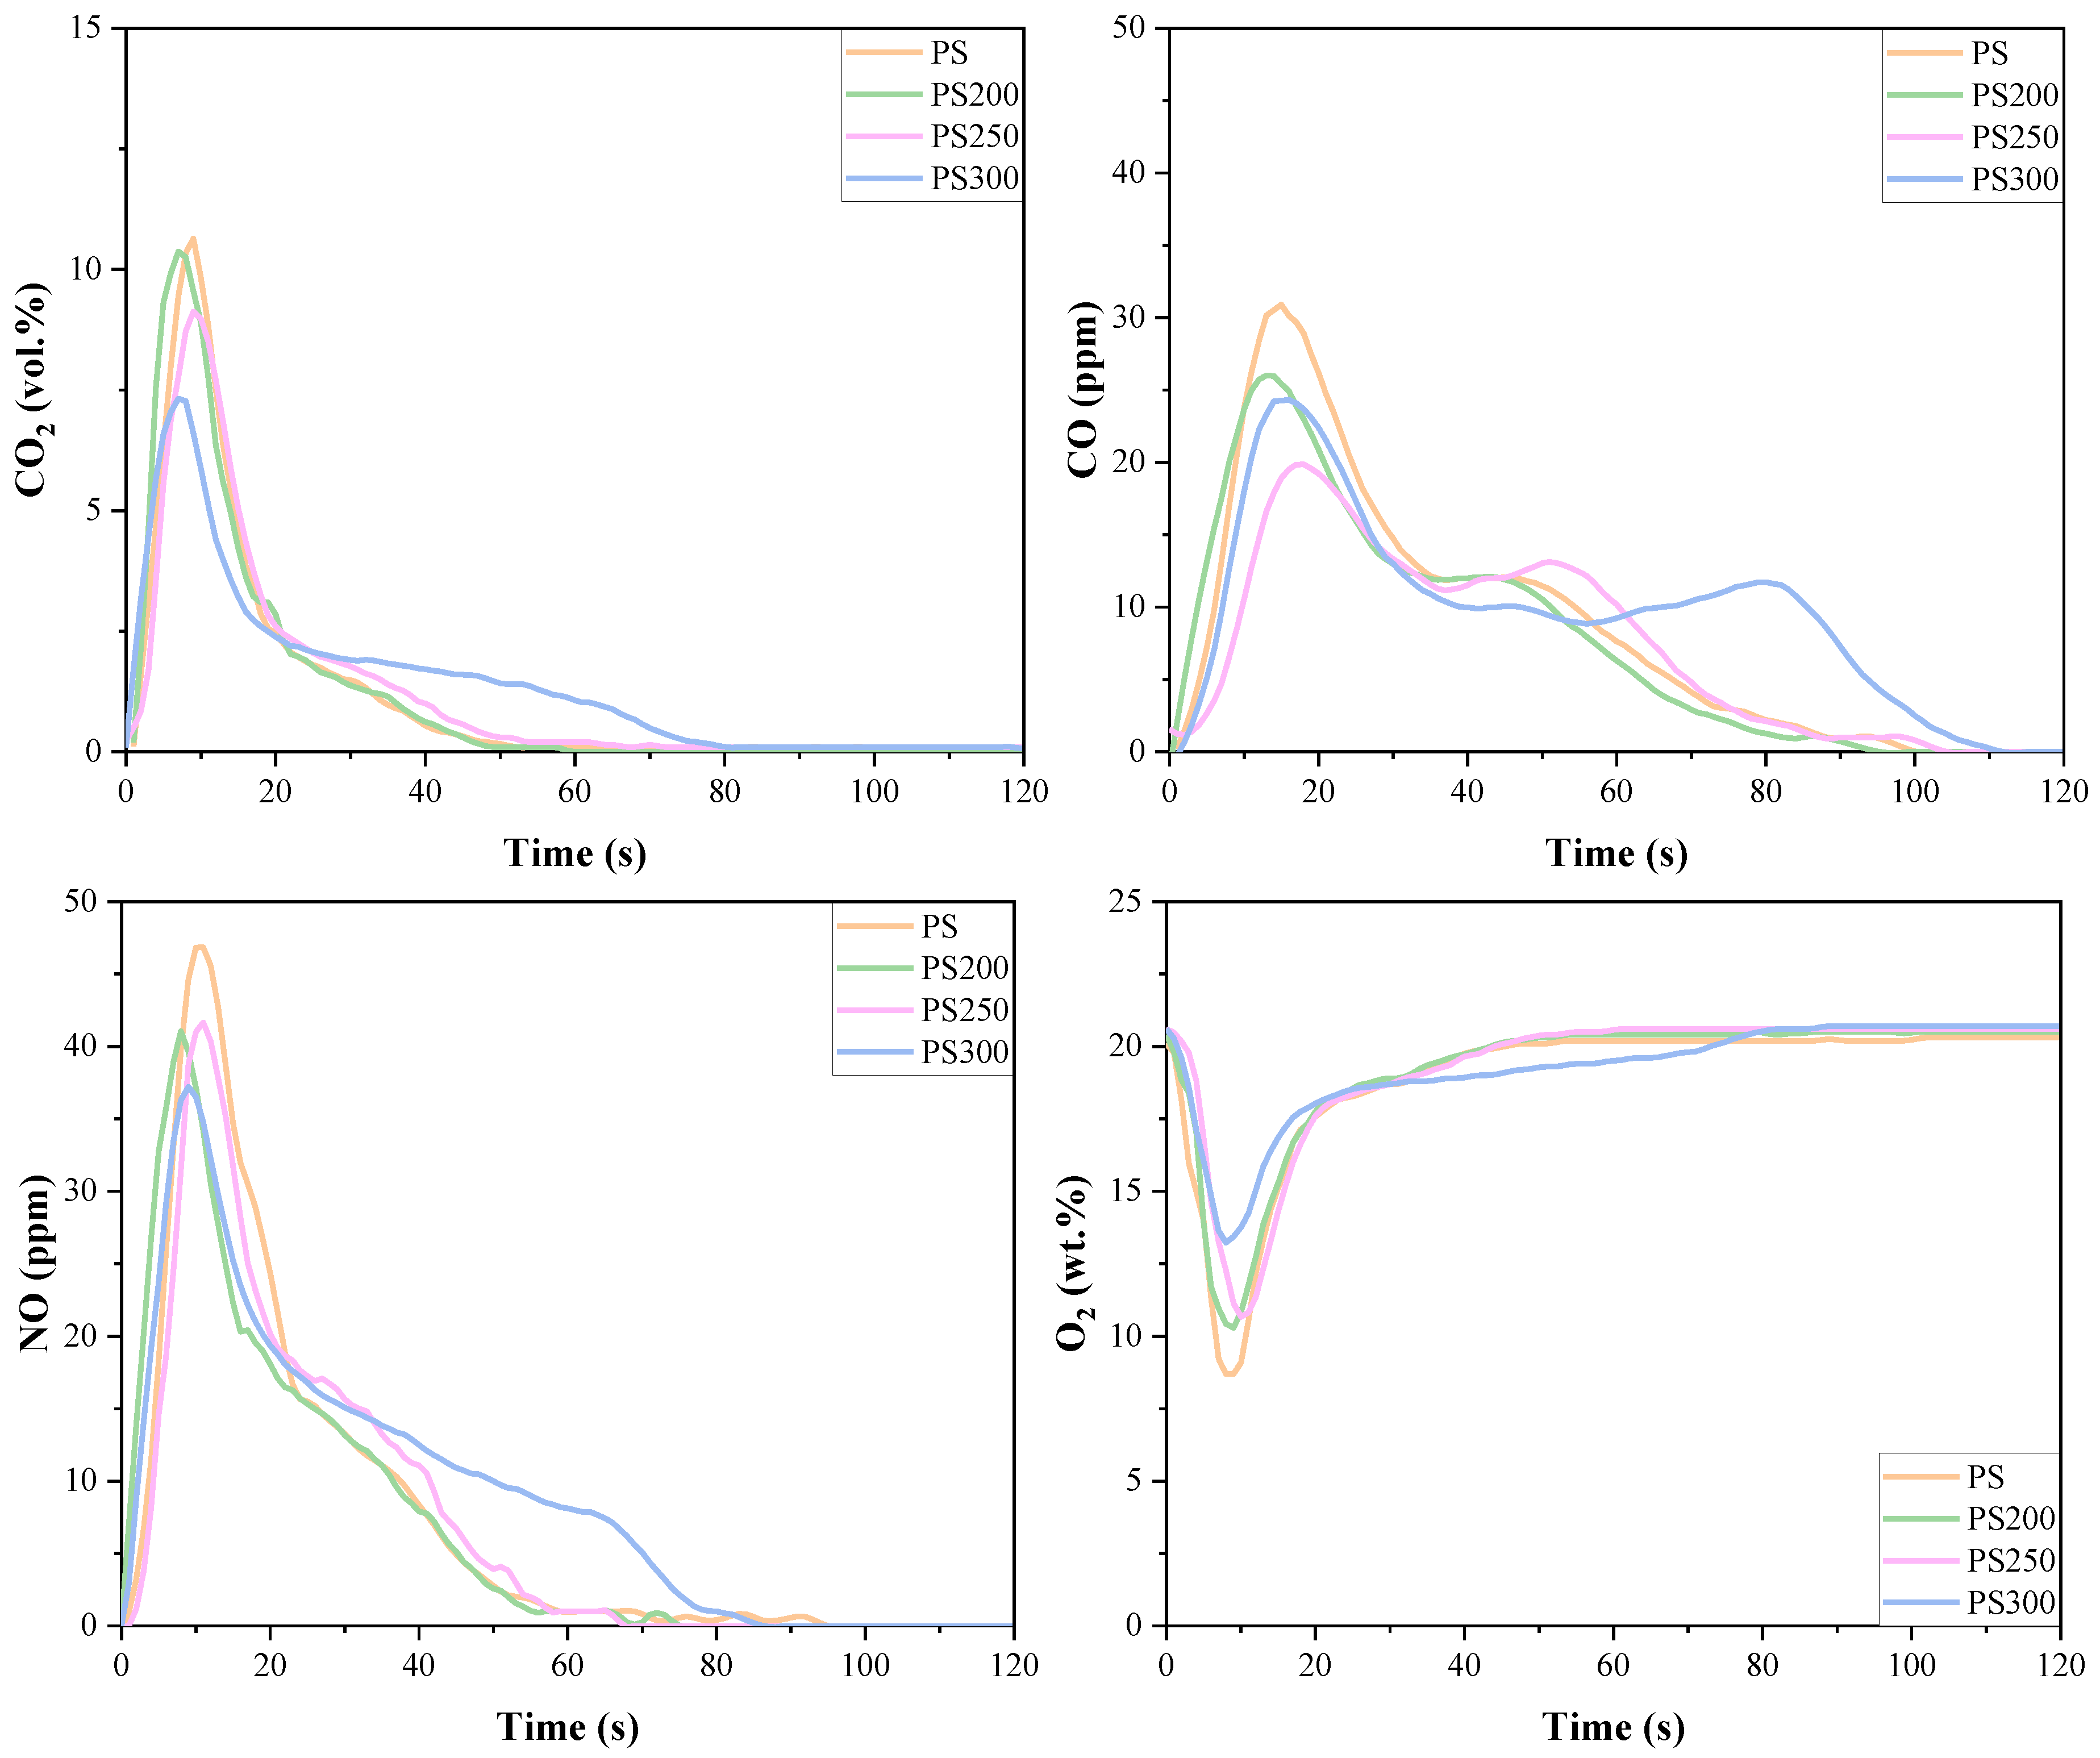
According to the DTG profiles in Figure 4, the combustion process of the raw and torrefied PS from Ti to Tp could be approximately assigned to two independent reactions involving volatile combustion and char combustion. Thus, the kinetic parameters Ea and A for each stage were determined by both CR and FC methods. To reveal the combustion reaction mechanisms, various function models (Table S2 in the Supplementary Materials) were used. The results corresponding to the best correlation coefficient (R2) for the two methods are shown in Table 2.
As shown in Table 2, all of the raw and torrefied PS presented good fitting results for both methods. The combustion reactions of volatiles followed degradation mechanisms while diffusion mechanisms were followed for the char combustion process. Castells et al. [16] also reported that degradation was followed by a diffusion reaction during combustion torrefied empty fruit bunches, palm kernel shell and palm mesocarp fiber, which are different parts of the palm oil tree. Thus, the dominate mechanism for the raw and torrefied PS combustion was the degradation reaction.
For both methods, the Ea values of the volatile combustion stage were much larger than those of the char combustion stage, indicating that the combustion process is dominated by devolatization [26]. This is because the release of volatiles from the sample needed energy. However, the ignition of the chars was accelerated with the support of the heat generated by volatile combustion, so less additional energy was needed for the char combustion. This was also reported by Xin et al. [41] Therefore, attention should be paid to the initial combustion stage of the torrefied biomass. This was consistent with previous study [36].
There were differences on the tendency of Ea values for volatile combustion between the CR and the FC method. For the CR method, it increased after light and mild torrefaction with a maximum value of 257.52 kJ/mol for PS250, and then decreased to 165.24 kJ/mol for PS300. This might be attributed to the destroyed structure of the solid at a higher temperature, which brought about decreases in kinetic parameters [16]. Ma et al. [23] also observed the highest value of Ea for TBP250 using CR method and a decline at above 250 °C. While for the FC method, it invariably decreased with the rising torrefaction temperature. However, for both methods, PS300 had the lowest Ea value, indicating that PS300 had better combustibility and reactivity. This might be attributed to the more developed pore structures under severe torrefaction temperature. The significantly destroyed morphological structure of a torrefied biomass at 300 °C has been reported in the other literature [19,24], which might enhance the diffusion of volatiles into oxygen and then bring about decreases in kinetic parameters [23]. Nevertheless, the Ea value of the char combustion stage gradually increased with rising torrefaction temperature for both CR and FR methods. Bach et al. [48] also reported an increase in kinetic parameters of char after torrefaction of Stem wood at 275 °C. Higher torrefaction temperatures were indicated for the reduction of volatile content in torrefied PS and the decrease of devolatilization during combustion, which subsequently led to less heat generation by volatile combustion. Thus, more additional energy was needed for the char combustion, and the Ea values increased.

3.4. Emissions

The emission profiles of CO2, CO and NO during isothermal combustion are shown in Figure 5. Meanwhile, the consumption profiles of O2 were also presented to provide sufficient information for analysis and discussion. It is obvious that the isothermal combustion process at 800 °C could be divided into two stages involving volatile combustion in the first ~20 s and char combustion lasted for the rest time.
When the combustion began, the O2 concentrations sharply decreased within 10 s due to the rapid oxidation of released volatiles. This was also responsible for the delayed formation of CO. As torrefaction temperature increased, the consumption of O2 caused by volatile oxidation decreased, owing to the reduction of volatile content in the torrefied PS, and for this reason, the concentration of CO2 decreased. However, a different trend was observed for CO emission. The concentration of CO firstly decreased and then increased with a minimum value for PS250. The increase in CO concentration for PS300 might be attributed to the more developed pore structures, which promoted the release of volatiles and then brought about incomplete combustion. Hu et al. [24] revealed that the morphological structure of bamboo residues was significantly changed after being torrefied at 300 °C, with completely broken fibers and superficially porous structures which enhanced the gas volatilization. Nyakuma et al. [19] also observed a dense network of macropores rather than the microporous and mesoporous fibers for torrefied pellets at 300 °C, which led to a significantly different fuel property. This might also be responsible for the reduction of NO concentration with rising torrefaction temperature because the developed pore structure of the char matrix could provide more active sites for NO reduction by CO and char. Another possible reason for NO reduction is the shift of unstable ammonia-N in biomass to heterocyclic-N which were tightly bound to the char matrix [32]. Furthermore, the time point for the peak value of O2 consumption was slightly delayed for PS200 and PS250 and then brought forward for PS300 in this stage, indicating that the combustibility of PS300 was much better than others. This was quite consistent with the results obtained from kinetics calculation that the Ea for PS300 was much smaller than that of other samples.
For the char combustion stage, the consumption of O2 was more pronounced for PS300 due to the significant increase in fixed carbon content. Meanwhile, the emissions of CO2 and CO for PS300 were notably intensified, meaning that the emissions of pollutants shifted from the volatile combustion to the char combustion stage. This was consistent with the special properties of PS300 and its combustion characteristics observed in TG/DTG profiles. Furthermore, NO concentration also increased with rising torrefaction temperature because the shift of ammonia-N to heterocyclic-N increased the char-N content [24].
To better understand the emission of NO in the overall combustion process, the conversion rate of fuel-N to NO was calculated by Equation (4) given in our previous study [49], and the results are shown in Figure 6. The conversion of fuel-C to CO was tiny (<0.01 wt.%), so it was not discussed here. It can be seen that the conversion rates of fuel-N to NO for torrefied PS combustion were slightly higher than that of the raw PS. With torrefaction temperature rising, the conversion rate firstly increased and then decreased. This was contrary to the results obtained by Lee et al. [26]. Maxwell et al. [25] reported a linear relationship between NOx emission and nitrogen content. However, in this study, the conversion was inversely correlated to the fuel-N content which was presented in Figure 1b. Yanik et al. [50] also found that the NO emission from the combustion of torrefied poultry litter was higher although the fuel-N content was lower than the raw poultry litter. This should be explained by the reduction of NOx precursors, while the increase of N2 formation with rising fuel-N content during pyrolysis [51] and subsequently less fuel-N was oxidized into NO.

4. Conclusions

This study aimed to provide complementary information for torrefied biomass utilization as solid fuels, regarding not only the properties but also the combustion kinetic mechanisms and emissions. In view of this, torrefied pine sawdust (PS) was produced and both isothermal and non-isothermal combustion experiments were conducted. Results showed that torrefaction significantly improved the quality of PS, which are a benefit to its fuel utilization. Further, degradation mechanisms for volatile combustion and diffusion mechanisms for the char combustion were determined by using both Coats–Redfern (CR) and Freeman–Carroll (FC) kinetic methods. Moreover, during the isothermal combustion, the emissions of CO2, CO and NO decreased for volatile, while they increased for char. Additionally, the conversion of fuel-N to NO was found to be inversely related to the nitrogen content in the samples. In conclusion, this study provided complementary information for understanding biomass torrefaction and designing of industrial facilities.

Supplementary Materials

The following supporting information can be downloaded at: https://www.mdpi.com/article/10.3390/ma15238650/s1, Table S1: Function models used in the kinetics calculations; Table S2: Function models used in the kinetics calculations.

Author Contributions

Conceptualization, L.Y. and X.L.; methodology, J.Y.; validation, L.Y. and X.L.; investigation, J.Y. and D.L.; resources, D.L.; writing—original draft preparation, X.L.; writing—review and editing, X.L. and L.Y.; visualization, D.L. and J.Y.; funding acquisition, X.L. All authors have read and agreed to the published version of the manuscript.

Funding

This research was funded by the Natural Science Foundation of Jiangsu Province, grant number BK20210511.

Institutional Review Board Statement

Not available.

Informed Consent Statement

Not available.

Data Availability Statement

Not available.

Conflicts of Interest

The authors declare no conflict of interest.

References

  1. Chen, W.; Lin, B.; Lin, Y.; Chu, Y.; Ubando, A.T.; Show, P.L.; Ong, H.C.; Chang, J.-S.; Ho, S.-H.; Culaba, A.B.; et al. Progress in biomass torrefaction: Principles, applications and challenges. Prog. Energy Combust. Sci. 2021, 82, 100887. [Google Scholar]
  2. Sun, Y.; Tong, S.; Li, X.; Wang, F.; Hu, Z.; Dacres, O.D.; Edreis, E.M.; Worasuwannarak, N.; Sun, M.; Liu, H.; et al. Gas-pressurized torrefaction of biomass wastes: The optimization of pressurization condition and the pyrolysis of torrefied biomass. Bioresour. Technol. 2021, 319, 124216. [Google Scholar] [CrossRef] [PubMed]
  3. Kwoczynski, Z.; Čmelík, J. Characterization of biomass wastes and its possibility of agriculture utilization due to biochar production by torrefaction process. J. Clean. Prod. 2021, 280, 124302. [Google Scholar] [CrossRef]
  4. Liu, Y.; Rokni, E.; Yang, R.; Ren, X.; Sun, R.; Levendis, Y.A. Torrefaction of corn straw in oxygen and carbon dioxide containing gases: Mass/energy yields and evolution of gaseous species. Fuel 2021, 285, 119044. [Google Scholar] [CrossRef]
  5. Feng, Y.; Qiu, K.; Zhang, Z.; Li, C.; Rahman, M.M.; Cai, J. Distributed activation energy model for lignocellulosic biomass torrefaction kinetics with combined heating program. Energy 2022, 239, 122228. [Google Scholar] [CrossRef]
  6. Lin, Y.; Chen, W.; Colin, B.; Pétrissans, A.; Lopes Quirino, R.; Pétrissans, M. Thermodegradation characterization of hardwoods and softwoods in torrefaction and transition zone between torrefaction and pyrolysis. Fuel 2022, 310, 122281. [Google Scholar] [CrossRef]
  7. González-Arias, J.; Gómez, X.; González-Castaño, M.; Sánchez, M.E.; Rosas, J.G.; Cara-Jiménez, J. Insights into the product quality and energy requirements for solid biofuel production: A comparison of hydrothermal carbonization, pyrolysis and torrefaction of olive tree pruning. Energy 2022, 238, 122022. [Google Scholar] [CrossRef]
  8. Lokmit, C.; Nakason, K.; Kuboon, S.; Jiratanachotikul, A.; Panyapinyopol, B. Enhancing lignocellulosic energetic properties through torrefaction and hydrothermal carbonization processes. Biomass Convers. Biorefin. 2022. [Google Scholar] [CrossRef]
  9. Tsai, W.; Jiang, T.; Tang, M.; Chang, C.; Kuo, T. Enhancement of thermochemical properties on rice husk under a wide range of torrefaction conditions. Biomass Convers. Biorefin. 2021. [Google Scholar] [CrossRef]
  10. Fleig, O.P.; Raymundo, L.M.; Trierweiler, L.F.; Trierweiler, J.O. Study of rice husk continuous torrefaction as a pretreatment for fast pyrolysis. J. Anal. Appl. Pyrolysis 2021, 154, 104994. [Google Scholar] [CrossRef]
  11. Barskov, S.; Zappi, M.; Buchireddy, P.; Dufreche, S.; Guillory, J.; Gang, D.; Hernandez, R.; Bajpai, R.; Baudier, J.; Cooper, R.; et al. Torrefaction of biomass: A review of production methods for biocoal from cultured and waste lignocellulosic feedstocks. Renew. Energy 2019, 142, 624–642. [Google Scholar] [CrossRef]
  12. Kanwal, S.; Chaudhry, N.; Munir, S.; Sana, H. Effect of torrefaction conditions on the physicochemical characterization of agricultural waste (sugarcane bagasse). Waste Manag. 2019, 88, 280–290. [Google Scholar] [CrossRef] [PubMed]
  13. Wang, L.; Riva, L.; Skreiberg, Ø.; Khalil, R.; Bartocci, P.; Yang, Q.; Yang, H.; Wang, X.; Chen, D.; Rudolfsson, M.; et al. Effect of Torrefaction on Properties of Pellets Produced from Woody Biomass. Energy Fuels 2020, 34, 15343–15354. [Google Scholar] [CrossRef]
  14. Grycova, B.; Klemencova, K.; Jezerska, L.; Zidek, M.; Lestinsky, P. Effect of torrefaction on pellet quality parameters. Biomass Convers. Biorefin. 2022. [Google Scholar] [CrossRef]
  15. Valix, M.; Katyal, S.; Cheung, W.H. Combustion of thermochemically torrefied sugar cane bagasse. Bioresour. Technol. 2017, 223, 202–209. [Google Scholar] [CrossRef]
  16. Castells, B.; Amez, I.; Medic, L.; García-Torrent, J. Torrefaction influence on combustion kinetics of Malaysian oil palm wastes. Fuel Process. Technol. 2021, 218, 106843. [Google Scholar] [CrossRef]
  17. Chen, C.; Ji, G.; Mu, L.; Zhang, Y.; Li, A. Comprehensive research on the solid, liquid, and gaseous products of rice husk and rice straw torrefaction. Sustain. Energy Fuels 2021, 5, 687–697. [Google Scholar] [CrossRef]
  18. Atimtay, A.; Yurdakul, S. Combustion and Co-Combustion characteristics of torrefied poultry litter with lignite. Renew. Energy 2020, 148, 1292–1301. [Google Scholar] [CrossRef]
  19. Nyakuma, B.B.; Oladokun, O.; Wong, S.L.; Abdullah, T.A.T. Torrefaction of oil palm empty fruit bunch pellets: Product yield, distribution and fuel characterisation for enhanced energy recovery. Biomass Convers. Biorefin. 2021. [Google Scholar] [CrossRef]
  20. Cardarelli, A.; Pinzi, S.; Barbanera, M. Effect of torrefaction temperature on spent coffee grounds thermal behaviour and kinetics. Renew. Energy 2022, 185, 704–716. [Google Scholar] [CrossRef]
  21. Singh, R.K.; Sarkar, A.; Chakraborty, J.P. Effect of torrefaction on the physicochemical properties of pigeon pea stalk (Cajanus cajan) and estimation of kinetic parameters. Renew. Energy 2019, 138, 805–819. [Google Scholar] [CrossRef]
  22. Gürel, K.; Magalhães, D.; Kazanç, F. The effect of torrefaction, slow, and fast pyrolysis on the single particle combustion of agricultural biomass and lignite coal at high heating rates. Fuel 2022, 308, 122054. [Google Scholar] [CrossRef]
  23. Ma, J.; Zhang, Z.; Wang, Z.; Kong, W.; Feng, S.; Shen, B.; Mu, L. Integration of torrefaction and in-situ pelletization for biodried products derived from municipal organic wastes: The influences of temperature on fuel properties and combustion behaviours. Fuel 2022, 313, 122845. [Google Scholar] [CrossRef]
  24. Hu, J.; Song, Y.; Liu, J.; Evrendilek, F.; Buyukada, M.; Yan, Y.; Li, L. Combustions of torrefaction-pretreated bamboo forest residues: Physicochemical properties, evolved gases, and kinetic mechanisms. Bioresour. Technol. 2020, 304, 122960. [Google Scholar] [CrossRef] [PubMed]
  25. Maxwell, D.; Gudka, B.A.; Jones, J.M.; Williams, A. Emissions from the combustion of torrefied and raw biomass fuels in a domestic heating stove. Fuel Process. Technol. 2020, 199, 106266. [Google Scholar] [CrossRef]
  26. Lee, B.; Sh, L.; Lee, D.; Jeon, C. Effect of torrefaction and ashless process on combustion and NOx emission behaviors of woody and herbaceous biomass. Biomass and Bioenergy 2021, 151, 106133. [Google Scholar] [CrossRef]
  27. Botelho, T.; Costa, M.; Wilk, M.; Magdziarz, A. Evaluation of the combustion characteristics of raw and torrefied grape pomace in a thermogravimetric analyzer and in a drop tube furnace. Fuel 2018, 212, 95–100. [Google Scholar] [CrossRef]
  28. Alves, J.L.F.; Da Silva, J.C.G.; Sellin, N.; Prá, F.D.B.; Sapelini, C.; Souza, O.; Marangoni, C. Upgrading of banana leaf waste to produce solid biofuel by torrefaction: Physicochemical properties, combustion behaviors, and potential emissions. Environ. Sci. Pollut. Res. 2022, 29, 25733–25747. [Google Scholar] [CrossRef]
  29. Schmid, D.; Karlström, O.; Yrjas, P. Release of NH3, HCN and NO during devolatilization and combustion of washed and torrefied biomass. Fuel 2020, 280, 118583. [Google Scholar] [CrossRef]
  30. Ren, X.; Sun, R.; Meng, X.; Vorobiev, N.; Schiemann, M.; Levendis, Y.A. Carbon, sulfur and nitrogen oxide emissions from combustion of pulverized raw and torrefied biomass. Fuel 2017, 188, 310–323. [Google Scholar] [CrossRef]
  31. Sukiran, M.A.; Wan Daud, W.M.A.; Abnisa, F.; Nasrin, A.B.; Astimar, A.A.; Loh, S.K. Individual torrefaction parameter enhances characteristics of torrefied empty fruit bunches. Biomass Convers. Biorefin. 2021, 11, 461–472. [Google Scholar] [CrossRef]
  32. Liu, X.; Yuan, L.; Yang, X. Evolution of chemical functional groups during torrefaction of rice straw. Bioresour. Technol. 2021, 320, 124328. [Google Scholar]
  33. Lu, J.; Chen, W. Investigation on the ignition and burnout temperatures of bamboo and sugarcane bagasse by thermogravimetric analysis. Appl. Energy 2015, 160, 49–57. [Google Scholar] [CrossRef]
  34. Yuan, H.; Yang, Q.; Wang, Y.; Gu, J.; He, M.; Sun, F.A. Impact of Torrefaction on the Fuel Properties and Combustion Characteristics of Compost of Food Waste and Sawdust. Energy Fuels 2018, 32, 3469–3476. [Google Scholar] [CrossRef]
  35. Toptas, A.; Yildirim, Y.; Duman, G.; Yanik, J. Combustion behavior of different kinds of torrefied biomass and their blends with lignite. Bioresour. Technol. 2015, 177, 328–336. [Google Scholar] [CrossRef]
  36. Chen, L.; Wen, C.; Wang, W.; Liu, T.; Liu, E.; Liu, H.; Li, Z. Combustion behaviour of biochars thermally pretreated via torrefaction, slow pyrolysis, or hydrothermal carbonisation and co-fired with pulverised coal. Renew. Energy 2020, 161, 867–877. [Google Scholar] [CrossRef]
  37. Coats, A.W.; Redfern, J.P. kinetic parameters from kinetic parameters from thermogravimetric data. Polym. Lett. 1965, 3, 917–920. [Google Scholar] [CrossRef]
  38. Eli, S.; Freeman, B.C. The Application of Thermoanalytical Techniques to Reaction Kinetics: The Thermogravimetric Evaluation of the Kinetics of the Decomposition of Calcium Oxalate Monohydrate. J. Phys. Chem. 1958, 4, 394–397. [Google Scholar]
  39. Jaya, S.T.; Shahab, S.; Richard Hess, J.; Wright, C.T.; Boardman, R.D. A review on biomass torrefaction process and product properties for energy applications. Ind. Biotechnol. 2011, 7, 384–401. [Google Scholar]
  40. Nam, H.; Capareda, S. Experimental investigation of torrefaction of two agricultural wastes of different composition using RSM (response surface methodology). Energy 2015, 91, 507–516. [Google Scholar] [CrossRef]
  41. Xin, S.; Huang, F.; Liu, X.; Mi, T.; Xu, Q. Torrefaction of herbal medicine wastes: Characterization of the physicochemical properties and combustion behaviors. Bioresour. Technol. 2019, 287, 121408. [Google Scholar] [CrossRef] [PubMed]
  42. Yu, Y.; Zhu, Z.; Wang, L.; Wang, G.; Bai, X. Effect of Torrefaction Treatment on Physical and Fuel Properties of Caragana (Caragana korshinskii) Pellets. Bioenergy Res. 2021, 14, 1277–1288. [Google Scholar] [CrossRef]
  43. Lu, K.; Lee, W.; Chen, W.; Liu, S.; Lin, T. Torrefaction and low temperature carbonization of oil palm fiber and eucalyptus in nitrogen and air atmospheres. Bioresour. Technol. 2012, 123, 98–105. [Google Scholar] [CrossRef] [PubMed]
  44. Ullah, H.; Lun, L.; Riaz, L.; Naseem, F.; Shahab, A.; Rashid, A. Physicochemical characteristics and thermal degradation behavior of dry and wet torrefied orange peel obtained by dry/wet torrefaction. Biomass Convers. Biorefin. 2021. [Google Scholar] [CrossRef]
  45. Singh, S.; Chakraborty, J.P.; Mondal, M.K. Torrefaction of woody biomass (Acacia nilotica): Investigation of fuel and flow properties to study its suitability as a good quality solid fuel. Renew. Energy 2020, 153, 711–724. [Google Scholar] [CrossRef]
  46. Zhang, X.; Li, Y.; Wang, M.; Han, L.; Liu, X. Effects of Hydrothermal Carbonization Conditions on the Combustion and Kinetics of Wheat Straw Hydrochar Pellets and Efficiency Improvement Analyses. Energy Fuels 2020, 34, 587–598. [Google Scholar] [CrossRef]
  47. Duman, G.; Balmuk, G.; Cay, H.; Kantarli, I.C.; Yanik, J. Comparative Evaluation of Torrefaction and Hydrothermal Carbonization: Effect on Fuel Properties and Combustion Behavior of Agricultural Wastes. Energy Fuels 2020, 34, 11175–11185. [Google Scholar] [CrossRef]
  48. Bach, Q.; Tran, K.; Skreiberg, Ø. Comparative study on the thermal degradation of dry- and wet-torrefied woods. Appl. Energy 2017, 185, 1051–1058. [Google Scholar] [CrossRef]
  49. Liu, X.; Luo, Z.; Yu, C. Conversion of char-N into NOx and N2O during combustion of biomass char. Fuel 2019, 242, 389–397. [Google Scholar] [CrossRef]
  50. Yanik, J.; Duman, G.; Karlström, O.; Brink, A. NO and SO2 emissions from combustion of raw and torrefied biomasses and their blends with lignite. J. Environ. Manag. 2018, 227, 155–161. [Google Scholar] [CrossRef]
  51. Liu, X.; Luo, Z.; Yu, C.; Xie, G. Conversion mechanism of fuel-N during pyrolysis of biomass wastes. Fuel 2019, 246, 42–50. [Google Scholar] [CrossRef]
Figure 1. Proximate (a) and ultimate (b) analysis results.
Materials 15 08650 g001
Figure 2. Van Krevelen Plot and HHV variation of raw and torrefied PS.
Materials 15 08650 g002
Figure 3. Mass yield, energy yield and EMCI versus temperature.
Materials 15 08650 g003
Figure 4. TG and DTG curves for the raw and torrefied PS combustion at 10 °C/min. (a) TG; (b) DTG.
Materials 15 08650 g004
Figure 5. CO2, CO and NO emissions and O2 consumption of isothermal combustion.
Materials 15 08650 g005
Figure 6. Conversion rate of fuel-N to NO during combustion.
Materials 15 08650 g006
Table 1. Combustion characteristics and indices of the raw and torrefied PS.
SampleTi
(°C)
Tb
(°C)
Volatile CombustionChar CombustionC × 104
(wt.%/min/°C2)
S × 107
(wt.%2/min2/°C3)
Tp
(°C)
DTGmax
(wt.%/min)
WL
(wt.%)
Tp
(°C)
DTGmax
(wt.%/min)
WL
(wt.%)
PS272.9470.8316.4−10.6055.62444.0−3.8935.851.360.12
PS200277.5473.6315.4−10.1641.80442.6−3.8348.021.320.12
PS250280.5474.6313.9−9.5533.83433.7−4.3351.661.210.11
PS300289.6487.3309.5−6.2119.93431.4−7.2357.290.930.10
Table 2. Kinetic parameters of the raw and torrefied PS.
SampleTemp. Interval (°C)Model FunctionR2Ea (kJ/mol)A (s−1)
CR methodPS272.9–369.1g50.98086175.27886.1565 × 1012
369.1–470.8D10.9617314.99322153.6378 × 10−4
PS200277.5–371.7g50.98649171.8342572.3500 × 1012
371.7–473.6D10.9757516.38310734.9355 × 10−4
PS250280.5–375.4g80.993257.5225882.1745 × 1020
375.4–474.6D10.9875122.98699792.0432 × 10−3
PS300289.6–360.5g80.99449165.2406471.9976 × 1011
360.5–487.3D20.9888167.57651557.5432 × 100
FC methodPS272.9–369.1g80.95713291.98499538.5326 × 1026
369.1–470.8D10.975895.63044108440.6876698
PS200277.5–371.7g80.96829281.8472447.5434 × 1025
371.7–473.6D10.982575.90238986342.4380384
PS250280.5–375.4g80.97924252.16340356.8384 × 1022
375.4–474.6D10.990737.12049503751.7821292
PS300289.6–360.5g80.98088150.26580789.741 × 1012
360.5–487.3D10.9820610.6473967691.2940023
Publisher’s Note: MDPI stays neutral with regard to jurisdictional claims in published maps and institutional affiliations.

