Abstract
The structure, vibrational density of states, and transport coefficients of liquid alumina were studied using molecular dynamics simulations. At the temperature of 2500 K, 3000 K, 3500 K, and 4000 K, systems with three different densities were constructed, respectively, including the configurations with densities of 2.81 g/cm3 and 3.17 g/cm3, and the relaxed ones with nearly zero pressure at each temperature. With the changes in temperature or density, the transformations on the structural, vibrational and transport properties were discussed. The Born–Mayer–Huggins type of atomic interactions was used, with newly optimized parameters. The analysis of the interatomic correlations indicated that the short-range order of liquid alumina was mainly constructed by AlO4 tetrahedra, also a certain number of AlO3 and AlO5 was present. Meanwhile, the structural transitions on the elemental units occurred as either the temperature or density increased. Two primary frequency bands were observed in each vibrational density of states spectrum, with the higher frequency bands produced by the O atom vibrations, and the lower frequency ones generated by the Al atom vibrations. Self-diffusion coefficients were estimated using the linear behavior of the mean-squared displacement at long time, while by using the Green–Kubo relation during equilibrium molecular dynamics simulations, thermal conductivities and viscosities were calculated. Significantly, the viscosity at 2500 K with a density of 2.81 g/cm3 was equal to 25.23 mPa s, which was very close to the experimental finding.
1. Introduction
Alumina is a significant ceramic material with various technical applications, such as high-temperature resistant ceramics [,,], catalysts [,,], abrasives [,], coatings [,,], insulators [,,] and capacitors [,]. Meanwhile, molten alumina has received much attention, due to its utilization in analyzing the performance of aluminum-fueled rocket engine effluent [], and also in the production of large sapphire single crystals [,].
Understandings of the origins of the outstanding macroscopic features can be promoted by the knowledge of the microscopic structures. The high melting point of alumina (up to 2327 K) [], however, frequently caused contamination from the container throughout the experiment, reducing the accuracy of the obtained structural information. With the use of X-ray diffraction [,,], neutron scattering measurements [,], nuclear magnetic resonance measurements (NMR) [,,], and aerodynamic-levitation and laser-heating techniques [], some processes in the structural investigations of molten alumina have been achieved. Most of the experiments obtained the coordination numbers of Al-O pairs between 4 and 5. However, there were also some disagreements; for example, the measurement conducted by Waseda et al. [] using X-ray diffraction at 2363 K concluded that the coordination number ZAl-O was equal to 5.6, indicating that the elemental units for the construction of liquid alumina were octahedral networks. Besides the structural information, the physical properties of molten alumina, for example, electrical conductivity [], heat capacity [], surface tension [,], emissivity [], and viscosity [], were investigated by non-contract measurements.
However, the experimental data were usually inadequate and difficult to reproduce because of the challenges experienced during the experiment processes. An alternative method was to estimate the characteristics of liquid alumina using first-principle calculations or molecular dynamics (MD) simulations. While it was discovered that liquid alumina was mostly made up of AlO4 tetrahedrons [,,,,,], others suggested that AlO5 may have also been present in significant amounts [,,]. Even Hemmati [] claimed that liquid alumina was mostly composed of AlO5 units. It was also evident from the MD simulations that the pore aggregation underwent a continuous transition as the pressure increased [,,,]. Additionally, by using the slopes of the mean-squared displacements, the self-diffusion coefficients were determined [,,,]. The specific heat, vibrational density of states, and ionic conductivity were examined at the temperature of 2600 K basing on an atomic interaction consisting of two- and three-body terms by Vashishta et al. []. Meanwhile, the charge-transport properties of liquid alumina were discussed in detail by Gheribi et al. [].
It is worth noting that most computational research on liquid alumina was performed at high or ambient pressures, and the relaxation configurations at particularly zero pressure have been less well understood. Furthermore, the earlier studies on liquid alumina have primarily aimed at the structural characteristics, with only a small number of them being concerned with the physical properties, particularly given the fact that a detailed exploration of transport properties has rarely been reported.
Therefore, in this study, the configurations with nearly zero or a certain pressure were all investigated. Furthermore, besides the structure and vibrational density of states, the transport coefficients of liquid alumina were carefully examined in this research. Using the newly optimized parameters [], the examinations were conducted by classical MD simulations based on Born–Mayer–Huggins (BMH) atomic interactions. Systems with three different densities were established at temperatures of 2500 K, 3000 K, 3500 K, and 4000 K, respectively. At each temperature, the examinations were performed on not only the configurations with densities of 2.81 g/cm3 and 3.17 g/cm3 (with some pressures), but also the relaxed ones with nearly zero pressure. Moreover, transformations in structural, vibrational, and transport characteristics were discussed in relation to the changes in both density and temperature.
2. Simulation Methods
2000 atoms (1200 O and 800 Al) were packed randomly into a basic cube, creating a system with periodic boundary conditions in x, y and z directions. Using the Verlet algorithm in the velocity form with a timestep of 1.0 × 10⁻³ ps, Newton’s equations of motion were integrated. The short-range interaction was cut off at 8.0 Å, and the Coulomb interaction was calculated by the Ewald summation method. After being equilibrated in the isobaric–isothermal ensemble (NPT) at zero pressure and the temperature of 4500 K, the initial configuration was cooled down to 2500 K with a cooling rate of 1 K/ps. The corresponding configuration was taken at intervals of 500 K, and it was equilibrated for 1000 ps at a constant temperature and zero pressure. Since the object of this study was liquid alumina, the simulation conducted temperature was required to be higher than the melting point of 2327 K []. Therefore, the simulations were carried out at 2500 K, 3000 K, 3500 K, and 4000 K, respectively. Furthermore, in order to compare the structure, vibrational density of states and transport coefficients of liquid alumina as a function of density, two configurations with densities of 2.81 g/cm3 and 3.17 g/cm3 were produced by adjusting the volume of the simulation box at each temperature. In particular, the density of 2.81 g/cm3 was experimentally recorded from neutron scattering measurements [], while many previous simulations of liquid alumina were also performed on the density of 3.17 g/cm3, which could be utilized to check the reliability of the simulation results in this paper by the comparisons with the reported results, including those obtained from both experiments and simulations. Moreover, at each temperature, configurations with densities of 2.81 g/cm3 and 3.17 g/cm3 as well as those with anticipated densities at nearly zero pressure were investigated. The snapshots of the considered configurations at different densities and temperatures are shown in Figure 1. Classical MD simulations were carried out with the LAMMPS code [] (version: stable_3Mar2020) by applying the Born–Mayer–Huggins (BMH) potential, and atomic interactions between O and Al particles were provided by
with α or β = O or Al, and rαβ being the distance between the centers of the particle α and the particle β. qα and qβ are the effective charges in the first term of the pair potential, which is associated with the long-range Coulomb. The Born repulsive is shown in the second term, while the dipolar expansion corresponds to the third and the fourth ones, though just the van der Waals term was calculated. Recently, Bouhadja et al. [] adjusted the parameters of Aαβ, σαβ, ραβ, and Cαβ in Equation (1), as displayed in Table 1.
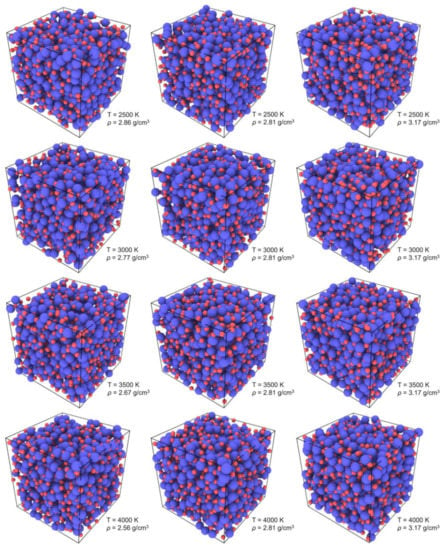
Figure 1.
Snapshots of the considered configurations in this study at the temperatures of 2500 K, 3000 K, 3500 K, and 4000 K, with three different densities at each temperature (the blue particles: Al atoms, the red particles: O atoms).

Table 1.
Potential parameters for liquid alumina [].
The atomic correlations were used to determine the short-range order of the structural characteristics of liquid alumina, including the pair distribution function (g(r)) and the coordination number as well as the bond-angle distribution. These methods were commonly employed for the analysis of microscopic structures and have been proven to be efficient [,,,,]. The partial pair distribution function (gαβ(r), PPDF) is shown as Equation (2):
where Nβ is the number of the particle β, V represents the volume of the system, represents the average number of the β particles spanning the space from r to r+Δr. The total pair distribution function (PDF) was calculated as Equation (3):
By using the minimum following the first peak of gαβ(r) as a cutoff radius (R), which was taken as RAl-O = 2.38 Å, RAl-Al = 3.76 Å and RO-O = 3.65 Å, the coordination numbers Zαβ(R), characterizing the mean number of β particles surrounding an α particle, were calculated as Equation (4):
Regarding the dynamics, the vibrational density of states (VDOS) and transport coefficients (self-diffusion coefficient, thermal conductivity and viscosity) were estimated. For each configuration, five independent simulations with various beginning momenta were performed to decrease the statistical errors, since the transport coefficients are sensitive to the initial conditions. Additionally, the results were calculated by averaging the standard deviations over the individual simulations.
By conducting a Fourier transform on the velocity autocorrelation function (Z(t)), VDOS was determined as Equation (5):
The self-diffusion coefficient (D), in this study, was computed from the linear behavior of the mean-squared displacement (MSD) over a long period, as displayed in Equation (6). This method has been widely used in the calculations of self-diffusion coefficients for many different systems, such as drugs [], gases [,] nanoparticles [,], and liquids [,]. Moreover, the obtained results often showed to be stable due to the long correlation time.
where rα(t) denotes the vector of the position related to particle α when at time t, and N denotes the number of the particle α.
Since liquid alumina was a homogeneous system, thermal conductivity (κ) and viscosity (η) could be estimated by the equilibrium molecular dynamics (EMD) simulations with the Green–Kubo relation. The integral of time of the heat-current autocorrelation function (HCACF) was used to calculate the thermal conductivity, while that of the stress autocorrelation function (SACF) was used to evaluate the viscosity. The definition of the heat-current (J) is:
where denotes the velocity of the particle α, eα represents the potential and kinetic energy of the particle α, and Sα denotes the atomic stress of the particle α. Subsequently, using the Green–Kubo relation, EMD simulations were carried out to compute κ:
where kB represents the Boltzmann constant, and T means the equilibrium temperature.
The component of molecular stress tensor Pij for SACF (ij = xy, xz, and yz directions) is defined as:
where mα is the mass of the particle α, vαi and vαj are the velocities of the particle α, rαβ denotes the relative position of the particle α about particle β, and Fαβ represents the force operating on the particle α as a result of the interaction with particle β. Then η was computed by EMD simulation as Equation (10):
3. Results and Discussion
In this study, the calculated zero-pressure densities were equal to 2.86 g/cm3, 2.77 g/cm3, 2.67 g/cm3, and 2.56 g/cm3, respectively, at 2500 K, 3000 K, 3500 K, and 4000 K, decreasing with the increasing temperature. Notably, the predicted density values at 2500 K and 3000 K were consistent with the experimental values of 2.81 g/cm3 and 2.78 g/cm3, which were measured, respectively, by the neutron scattering measurements [] and aerodynamic-levitation technique [], indicating the efficiency of the optimized parameters of the BMH potential.
3.1. Structural Properties
At 2500 K, 3000 K, 3500 K, and 4000 K, the position (rαβ) and the full width at half maximum (FWHM) of the initial peak in each PPDF for the configurations with three different densities are shown in Table 2. The positions of the first peaks associated with the Al-O, Al-Al, and O-O correlations all agreed well with the experimental, ab initio and MD simulation results. As displayed in Figure 2, when at a fixed temperature, the initial peaks in the gAl-O correlations (Figure 2a,e) shifted to larger values with the density increasing, while those in the gO-O (Figure 2b,f) and gAl-Al (Figure 2c,g) correlations moved toward smaller values, demonstrating the increase in rAl-O, and the decrease in rO-O and rAl-Al. Meanwhile, the initial peaks in gAl-Al and gAl-O became broader, while those turned narrower in gO-O, which could be observed more intuitively in Table 2. Simultaneously, for the configurations at zero pressure or with a constant density (ρ = 2.81 g/cm3 or ρ = 3.17 g/cm3), changes in rαβ also happened as the temperature increased, with rAl-Al increasing and rAl-O decreasing. Regarding rO-O, it increased along with the temperature for the zero-pressure densities, whereas it was found to be declined when at a constant density. Additionally, for all the Al-O, Al-Al, and O-O correlations, the FWHM of the initial peaks grew along with the temperature. Compared to those at 3000 K, the intensities of the initial peaks of all the gαβ(r) were shown to be lower at 4000 K.

Table 2.
Position (rαβ) and full width at half maximum (FWHM) of the initial peak in partial pair distribution functions for liquid alumina from this MD simulation and the data from experiments and ab initio simulation.
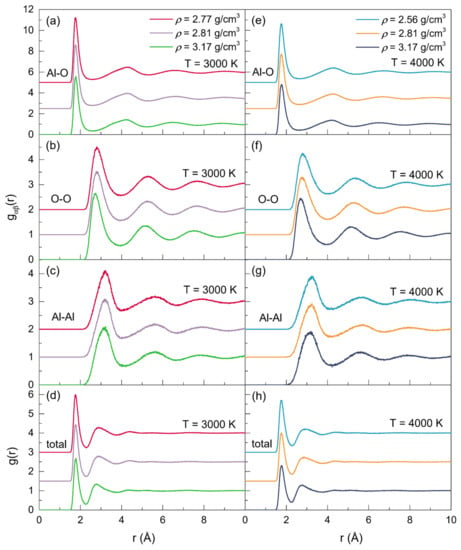
Figure 2.
Partial and total pair distribution functions for the configurations of liquid alumina with three densities, respectively, at 3000 K and 4000 K.
Table 3 demonstrated that for the atom pairs of Al-O, the average coordination numbers (Zαβ) were approximately located at ~4, consistent with the experimental, ab initio and MD simulation findings. For all the atom pairs of α-β, Zαβ increased along with the density at each temperature. However, when at zero pressure or a fixed density, Zαβ roughly decreased as the temperatures rose from 2500 K to 4000 K.

Table 3.
The average coordination number (Zαβ) for liquid alumina from this MD simulation and the data from experiments and ab initio simulation.
Figure 3 displays the coordination number distributions for the atom pairs of Al-O, O-Al, O-O and Al-Al, respectively, at 3000 K and 4000 K. It can be observed that for the Al-O pairs, the coordination numbers (Figure 3a) were distributed between 2 and 6. Besides AlO4, there was also a certain amount of AlO3 and AlO5 present. With the temperature increasing, the fractions of AlO2 and AlO3 increased, whereas those of AlO4, AlO5 and AlO6 decreased, demonstrating a structural transition on AlOn. Moreover, when at a fixed temperature, some changes in the coordination number on AlOn also can be observed as the density rose, with a general decrease in the fractions of AlO3 and AlO4, accompanying an increase in those of AlO5, indicating the trend of structural transition on the elemental units from a tetrahedral network to an octahedral network. These variations in the percentages of AlOn enabled the ZAl-O to decrease with increasing temperature, and to increase along with density, in accordance with the findings in Table 3. The coordination numbers of O-Al (Figure 3b) also had a narrow distribution, with a range between 1 and 5. In contrast, the coordination numbers for O-O (Figure 3c) and Al-Al (Figure 3d) exhibited broader ranges, with 4 to 15, and 3 to 13, respectively.
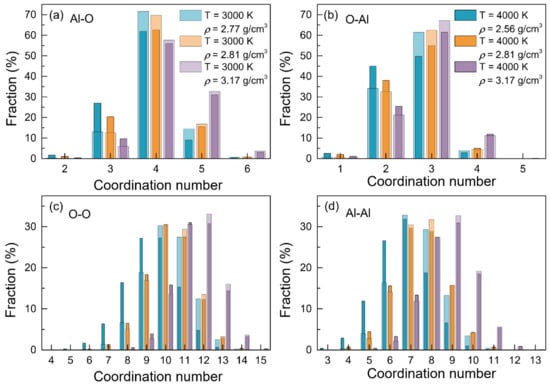
Figure 3.
Coordination number distributions for the configurations of liquid alumina with three densities respectively at 3000 K and 4000 K.
The bond-angle distributions, as seen in Figure 4, revealed details about the polyhedral geometry and packing within the structure of liquid alumina. The bond-angel distributions of O-Al-O and Al-O-Al, respectively, can be applied to examine the intra- and inter-polyhedral connectivity. According to Skinner’s experiment [], the presence of AlO4 was associated with peaks around 101° and 106° in the bond-angle distribution of O-Al-O, while AlO5 corresponded to the main peak at 86°, following a minor one over the degrees of 140–170°. As shown in Figure 4b, at 3000 K, the main peaks in the bond-angle distributions of O-Al-O, located around 97.17°, 97.02°, and 91.75°, respectively, for ρ = 2.77 g/cm3, ρ = 2.81 g/cm3, and ρ = 3.17 g/cm3. With the temperature increasing to 4000 K, these peaks moved to the smaller degrees of 95.80° for ρ = 2.56 g/cm3, 93.44° for ρ = 2.81 g/cm3, and 89.25° for ρ = 3.17 g/cm3. These O-Al-O angles, together with the ZAl-O that was equal to about 4, characterized the liquid alumina as being composed of disordered (AlO4)5- tetrahedral units. Moreover, it could be inferred that the initial peaks in the bond-angle distributions of O-Al-O, which ranged from 89.25° to 97.17°, should be primarily attributed to the existence of both AlO4 and AlO5. While at 3000 K or 4000 K, with the density increasing, the initial peaks shifted toward smaller degrees, and the minor peaks at about 165° intensified, both of which indicated the enhancing proportions of AlO5, in line with the findings of the Al-O coordination number distributions (Figure 3a). Meanwhile, as the temperature increased, the initial peaks also changed to lower degrees, which might be due to the relatively high AlO3 percentages.
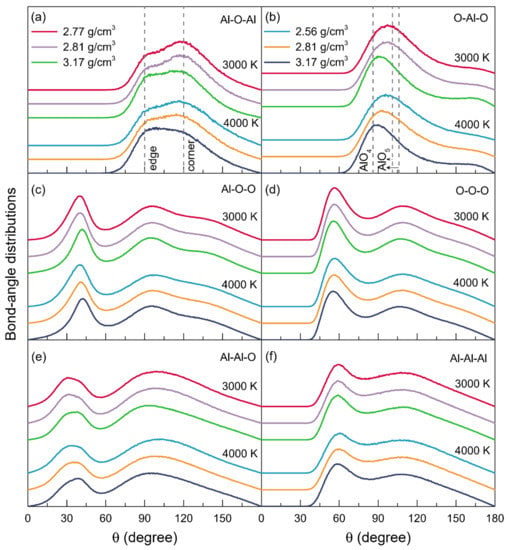
Figure 4.
Bond-angle distributions for the models of liquid alumina with three densities at 3000 K and 4000 K, respectively.
The Al-O-Al bond-angle distributions at 3000 K and 4000 K are shown in Figure 4a. At both 3000 K and 4000 K, there were two main peaks in each Al-O-Al bond-angle distribution: the one approximately distributed at 93° corresponded to the linkages of AlO5-AlO5 or AlO5-AlO4 by edge-sharing [], while the other one located at 119° was attributed to the oxygen atoms that were three-fold coordinated, and linked by their corners to AlO4 or AlO5 []. The intensity ratio between the peak around 93° and the one at 119° (I93°/I119°) increased along with the density or temperature, indicating the increasing fractions of the edge-sharing networks.
3.2. Vibrational Properties
Figure 5 displays the partial and total VDOSs for the configurations of liquid alumina with three densities, respectively, at 3000 K and 4000 K. It is clear that the VDOS spectra at 3000 K ranged from 0 to 50 THz, while those at 4000 K had wider ranges, up to about 55 THz. There were two principal bands in each VDOS spectrum, divided at frequencies between 15 and 20 THz. In accordance with the findings of Vashishta et al. [], the Al atom vibrations largely produced the band with lower frequencies, whereas the O atom vibrations provided the band with higher frequencies. Additionally, similar to those for other amorphous networks that were predominantly made up of basic tetrahedrons [], both the modes of bond-bending and vibrations of inter-tetrahedra were related to the lower frequency bands, while the bonding-stretching modes and vibrations of intra-tetrahedra were associated with the higher frequency bands [].
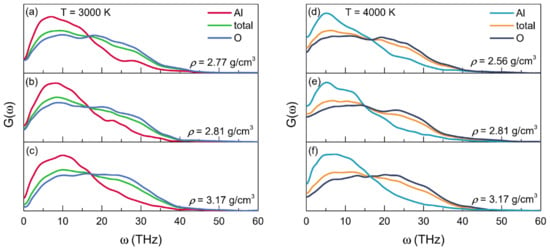
Figure 5.
Partial and total vibrational density of states (VDOS) for the configurations of liquid alumina at (a–c) 3000 K and (d–f) 4000 K, with three densities at each temperature.
3.3. Transport Properties
3.3.1. Self-Diffusion Coefficient
The time dependence of MSDs and the density dependence of self-diffusion coefficients at temperatures of 2500 K, 3000 K, 3500 K, and 4000 K are illustrated in Figure 6. Al atoms moved more quickly than O atoms when they were present at the same density and temperature, as evidenced by the self-diffusion coefficients of Al atoms being slightly larger than that of O atoms, as shown in Table 4. The distinct diffusion mechanisms that occurred between Al and O particles could be able to explain this phenomenon. In addition to being in the free states, the breakdown or reformation of Al-O bonds influenced the diffusions of Al particles, while the transitions between the bridging and the nonbridging, often needing higher energies, affected the diffusions of O particles []. Table 4 displays the numerical values for the self-diffusion coefficients. Significantly, the results for the configuration at 2500 K and 2.81 g/cm3 agreed well with those calculated by Jahn et al. [] using MD simulations based on an advanced ionic model type potential. For the models at zero pressure or with a fixed density, the self-diffusion coefficients increased along with the temperature. Meanwhile, it also can be observed that the self-diffusion coefficients generally decreased with density increasing.
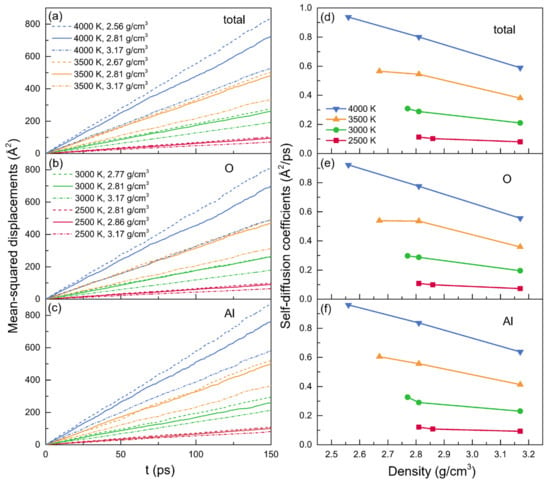
Figure 6.
(a–c) The mean-squared displacements (MSDs) and (d–f) the averaged self-diffusion coefficients (D) for liquid alumina at temperatures of 2500 K, 3000 K, 3500 K and 4000 K, with three densities at each temperature.

Table 4.
Self-diffusion coefficients for liquid alumina at the temperature ranging from 2500 K to 4000 K.
3.3.2. Thermal Conductivity
The normalized heat-current autocorrelation functions (HCACFs) and thermal conductivities (κ) of liquid alumina are given as functions of correlation time in Figure 7 and Figure 8, respectively, at temperatures of 2500 K, 3000 K, 3500 K and 4000 K. Arima et al. reported that the thermal conductivities would be better estimated when the corresponding normalized HCACFs settled to zero or a constant value []. The normalized HCACFs in this investigation gradually decreased to negative until ultimately decaying to zero (Figure 7), confirming the reliability of the simulated thermal conductivity results.
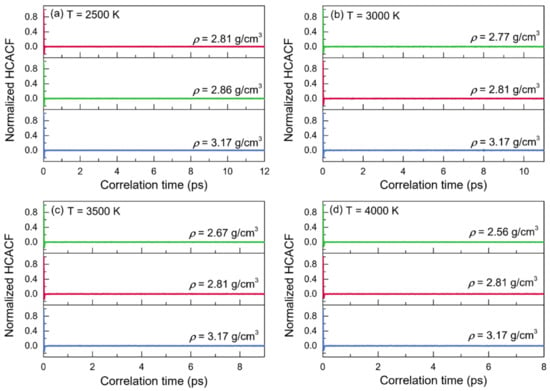
Figure 7.
Normalized heat-current autocorrelations (HCACFs) for the configurations of liquid alumina with three different densities at (a) 2500 K, (b) 3000 K, (c) 3500 K and (d) 4000 K, respectively.
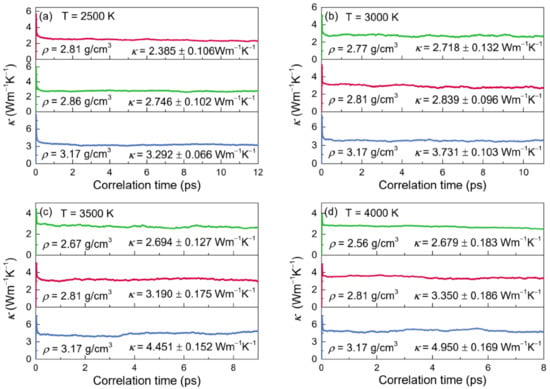
Figure 8.
Thermal conductivities (κ) for the configurations of liquid alumina with three different densities at (a) 2500 K, (b) 3000 K, (c) 3500 K and (d) 4000 K, respectively.
It took a few picoseconds, as shown in Figure 8, for the curves of κ to stabilize at a specified value, which was accepted to be the value of thermal conductivity. As the influence of phonons grew with the temperature, the curves of κ required less time to reach the constant values, and the correlations dissipated more quickly as well. These findings matched those reported by Alexander et al. [], who investigated the thermal conductivities for the actinide dioxides of UO2, and ThO2 using the EMD calculations. Thus, by averaging the related curves from 6 to 12 ps at 2500 K, from 3 to 11 ps at 3000 K, from 3 to 9 ps at 3500 K and from 3 to 8 ps at 4000 K, the thermal conductivity values were determined. When at a fixed temperature, κ enhanced with density increasing. Meanwhile, it raised along with temperature while at the density of 2.81g/cm3 or 3.17 g/cm3, but declined as the temperature increased for the zero-pressure densities.
3.3.3. Viscosity
The normalized stress autocorrelation functions (SACFs) and viscosities (η) for the configurations of liquid alumina at temperatures from 2500 K to 4000 K are shown in Figure 9 and Figure 10, respectively. The normalized SACF curves fell monotonically and quickly declined to zero, taking just 6 ps at 2500 K, 2.5 ps at 3000 K, 1.5 ps at 3500 K, and even less than 1 ps at 4000 K. Similar to the cases of the thermal conductivities, the time taken by the viscosities curves to reach a stable value decreased with the temperature increasing, along with the decline of the duration at this stable value. Therefore, the viscosity values of η were achieved by averaging the values between 11 and 18 ps at 2500 K, between 3 and 9 ps at 3000 K, between 2 and 7 ps at 3500 K, and between 1 and 5 ps at 4000 K. As can be seen, the viscosity values increased along with density at each temperature. Moreover, for the configurations at zero pressure or with a constant density, they declined quickly when the temperature increased. Moreover, it was worth noting that the predicted viscosity value of 25.23 mPa·s at 2500 K with the density of 2.81g/cm3, was in good accordance with the experimental value of 25.6 mPa·s given by Paradis et al. [], who tested the viscosities of molten alumina by the electrostatic levitation and multi-beam radiative heating techniques. Furthermore, the calculated viscosities of the models at 2500 K with densities of 2.81 g/cm3 and 2.86 g/cm3, as well as those at 3000 K with densities of 2.77 g/cm3 and 2.81 g/cm3 (Figure 10), were all very close to the results obtained by the density-function theory based on electronic structure calculations [].
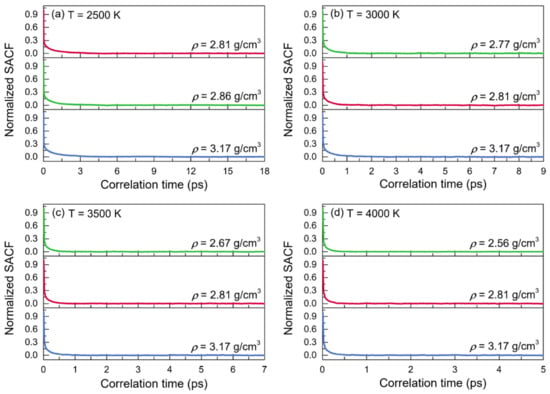
Figure 9.
Normalized stress autocorrelation functions (SACFs) for the configurations of liquid alumina with three different densities at (a) 2500 K, (b) 3000 K, (c) 3500 K, and (d) 4000 K, respectively.
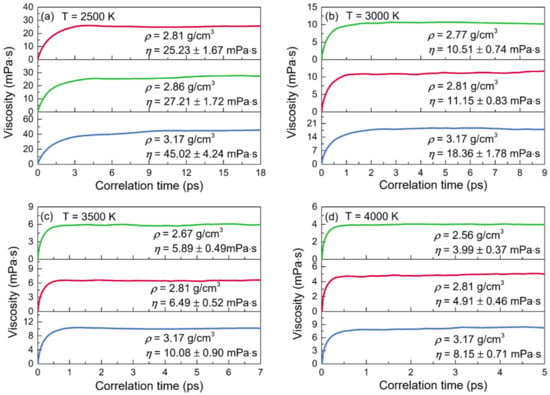
Figure 10.
Viscosities (η) for the configurations of liquid alumina with three different densities at (a) 2500 K, (b) 3000 K, (c) 3500 K, and (d) 4000 K, respectively.
4. Conclusions
Using molecular dynamics simulations, the structural, vibrational, and transport characteristics of liquid alumina were investigated, with the temperature increasing from 2500 K to 4000 K. Configurations with densities of 2.81 g/cm3 and 3.17 g/cm3, as well as the relaxed ones with nearly zero pressure, were explored at intervals of 500 K. Transformations in structural, vibrational, and transport characteristics were discussed in relation to the changes in temperatures or densities.
The newly optimized parameters associated with the Born–Mayer–Huggins potential with were taken to calculate the atomic interactions. Although they were originally developed for aluminosilicate (AS), the findings of this paper proved their efficiency in characterizing the structure and some dynamical features of the pure liquid alumina.
The structure of liquid alumina was primarily made up of the slightly disordered AlO4 tetrahedral units, with tiny fractions of AlO2 and AlO6, as well as a certain amount of AlO3 and AlO5. Structural transitions on the elemental units occurred as either the temperature or density increased. The explorations of the intermediate-range order revealed the two primary approaches that the elemental units being connected to each other: sharing edge or corner.
By applying the Fourier transform to the velocity autocorrelation function, the vibrational density of states (VDOS) was calculated, which presented two principal frequency bands, one with the higher frequency bands from the vibrations of O atoms, relating to the bonding-stretching modes and vibrations of intra-tetrahedra, while the other with the lower frequency ones from the vibrations of Al atoms, associating with the modes of bond-bending and vibrations of inter-tetrahedra.
The self-diffusion coefficient (D) was estimated by the linear behavior of the mean-squared displacement over a long time, and by using the Green–Kubo relation, the thermal conductivity (κ) and viscosity (η) were calculated through the EMD simulations. When at a fixed temperature, the thermal conductivities and viscosities increased with the density, although the self-diffusion coefficients for both Al and O particles decreased. Meanwhile, changes in temperatures also affected the transport coefficients. For the models with the density of 2.81g/cm3 or 3.17 g/cm3, with the increasing temperature, D and κ were discovered to be enhanced, whereas η declined, while for the zero-pressure models, D also increased along with the temperature, but κ and η decreased. Notably, the viscosity at 2500 K with the density of 2.81 g/cm3 equaling 25.23 mPa·s was in line with the experimental finding of 25.6 mPa·s.
Author Contributions
Conceptualization, X.Z., Y.Z. (Yufeng Zhou) and Y.Z. (Yumin Zhang); data curation, X.Z. and Y.D.; software, X.Z.; writing—original draft, X.Z.; writing—review and editing, X.Z. and Y.Z. (Yufeng Zhou). All authors have read and agreed to the published version of the manuscript.
Funding
This research received no external funding.
Institutional Review Board Statement
Not applicable.
Data Availability Statement
The parameters for the Born–Mayer–Huggins potential used in this manuscript were reported in Bouhadja’s paper, defined in the references section as []. New data are available from the corresponding authors upon reasonable request.
Acknowledgments
This work was supported by the Science Foundation of the National Key Laboratory of Science and Technology on Advanced Composites in Special Environments.
Conflicts of Interest
The authors declare no conflict of interest.
References
- Xue, C.; Wang, D.; Zhang, J. Wear Mechanisms and Notch Formation of Whisker-Reinforced Alumina and Sialon Ceramic Tools during High-Speed Turning of Inconel 718. Materials 2022, 15, 3860. [Google Scholar] [CrossRef] [PubMed]
- Medvedovski, E. Alumina-mullite ceramics for structural applications. Ceram. Int. 2006, 32, 369–375. [Google Scholar] [CrossRef]
- Bermejo, R.; Sánchez-Herencia, A.J.; Llanes, L.; Baudín, C. High-temperature mechanical behaviour of flaw tolerant alumina-zirconia multilayered ceramics. Acta Mater. 2007, 55, 4891–4901. [Google Scholar] [CrossRef]
- Shi, Y.; Wang, S.; Li, Y.; Yang, F.; Yu, H.; Chu, Y.; Li, T.; Yin, H. Improving Anti-Coking Properties of Ni/Al2O3 Catalysts via Synergistic Effect of Metallic Nickel and Nickel Phosphides in Dry Methane Reforming. Materials 2022, 15, 3044. [Google Scholar] [CrossRef] [PubMed]
- Netskina, O.; Mucha, S.; Veselovskaya, J.; Bolotov, V.; Komova, O.; Ishchenko, A.; Bulavchenko, O.; Prosvirin, I.; Pochtar, A.; Rogov, V. CO2 methanation: Nickel-alumina catalyst prepared by solid-state combustion. Materials 2021, 14, 6789. [Google Scholar] [CrossRef]
- Alayat, A.; Echeverria, E.; Sotoudehniakarani, F.; Mcllroy, D.N.; McDonald, A.G. Alumina coated silica nanosprings (ns) support based cobalt catalysts for liquid hydrocarbon fuel production from syngas. Materials 2019, 12, 1810. [Google Scholar] [CrossRef]
- Wang, W.; Chen, J.; Sun, X.; Sun, G.; Liang, Y.; Bi, J. Influence of Additives on Microstructure and Mechanical Properties of Alumina Ceramics. Materials 2022, 15, 2956. [Google Scholar] [CrossRef]
- Krell, A.; Blank, P.; Wagner, E.; Bartels, G. Advances in the grinding efficiency of sintered alumina abrasives. J. Am. Ceram. Soc. 1996, 79, 763–769. [Google Scholar] [CrossRef]
- Al Qader, H.; Jasim, A.M.; Salim, H.; Xing, Y.; Stalla, D. Enhanced Mechanical and Durability Properties of Cement Mortar by Using Alumina Nanocoating on Carbon Nanofibers. Materials 2022, 15, 2768. [Google Scholar] [CrossRef]
- Li, W.; Chen, K.; Liu, L.; Yang, Y.; Zhu, S. Effect of SiO2-Al2O3 Glass Composite Coating on the Oxidation Behavior of Ti60 Alloy. Materials 2020, 13, 5085. [Google Scholar] [CrossRef]
- Ksiazek, M.; Boron, L.; Tchorz, A. Study on the Microstructure, Mechanical Properties, and Erosive Wear Behavior of HVOF Sprayed Al2O3-15 wt.% TiO2 Coating with NiAl Interlayer on Al-Si Cast Alloy. Materials 2020, 13, 4122. [Google Scholar] [CrossRef]
- Tang, Y.; Ge, G.; Li, Y.; Huang, L. Effect of Al2O3 with different nanostructures on the insulating properties of epoxy-based composites. Materials 2020, 13, 4235. [Google Scholar] [CrossRef]
- Tian, B.L.; Chen, C.; Li, Y.R.; Zhang, W.L.; Liu, X.Z. Sodium beta-alumina thin films as gate dielectrics for AlGaN/GaN metal-insulator-semiconductor high-electron-mobility transistors. Chin. Phys. B 2012, 21, 126102. [Google Scholar] [CrossRef]
- Sedghi, A.; Riahi-Noori, N.; Hamidnezhad, N.; Salmani, M.R. Effect of chemical composition and alumina content on structure and properties of ceramic insulators. Bull. Mater. Sci. 2014, 37, 321–325. [Google Scholar] [CrossRef]
- Mardare, A.I.; Kaltenbrunner, M.; Sariciftci, N.S.; Bauer, S.; Hassel, A.W. Ultra-thin anodic alumina capacitor films for plastic electronics. Phys. Status Solidi (a) 2012, 209, 813–818. [Google Scholar] [CrossRef]
- Mozalev, A.; Sakairi, M.; Takahashi, H.; Habazaki, H.; Hubálek, J. Nanostructured anodic-alumina-based dielectrics for high-frequency integral capacitors. Thin Solid Films 2014, 550, 486–494. [Google Scholar] [CrossRef]
- Jani, A.M.M.; Losic, D.; Voelcker, N.H. Nanoporous anodic aluminium oxide: Advances in surface engineering and emerging applications. Prog. Mater Sci. 2013, 58, 636–704. [Google Scholar] [CrossRef]
- Golubović, A.; Nikolić, S.; Đurić, S.; Valčić, A. The growth of sapphire single crystals. J. Serb. Chem. Soc. 2001, 66, 411–418. [Google Scholar] [CrossRef]
- Farr, W.G.; Creedon, D.L.; Goryachev, M.; Benmessai, K.; Tobar, M.E. Ultrasensitive microwave spectroscopy of paramagnetic impurities in sapphire crystals at millikelvin temperatures. Phys. Rev. B 2013, 88, 224426. [Google Scholar] [CrossRef]
- Schneider, S. Cooperative determination of the melting point of alumina. Pure Appl. Chem. 1970, 21, 115–122. [Google Scholar] [CrossRef][Green Version]
- Ansell, S.; Krishnan, S.; Weber, J.R.; Felten, J.J.; Nordine, P.C.; Beno, M.A.; Price, D.L.; Saboungi, M.L. Structure of Liquid Aluminum Oxide. Phys. Rev. Lett. 1997, 78, 464–466. [Google Scholar] [CrossRef]
- Waseda, Y.; Sugiyama, K.; Toguri, J. Direct determination of the local structure in molten alumina by high temperature X-ray diffraction. Z. Naturforsch. A Phys. Sci. 1995, 50, 770–774. [Google Scholar] [CrossRef]
- Hennet, L.; Thiaudiere, D.; Gailhanou, M.; Landron, C.; Coutures, J.P.; Price, D.L. Fast X-ray scattering measurements on molten alumina using a 120 curved position sensitive detector. Rev. Sci. Instrum. 2002, 73, 124–129. [Google Scholar] [CrossRef]
- Landron, C.; Hennet, L.; Jenkins, T.; Greaves, G.; Coutures, J.; Soper, A. Liquid alumina: Detailed atomic coordination determined from neutron diffraction data using empirical potential structure refinement. Phys. Rev. Lett. 2001, 86, 4839. [Google Scholar] [CrossRef] [PubMed]
- Landron, C.; Soper, A.; Jenkins, T.; Greaves, G.; Hennet, L.; Coutures, J. Measuring neutron scattering structure factor for liquid alumina and analysing the radial distribution function by empirical potential structural refinement. J. Non·Cryst. Solids 2001, 293, 453–457. [Google Scholar] [CrossRef]
- Coutures, J.P.; Massiot, D.; Bessada, C.; Echegut, P.; Taulelle, F. Etude par RMN 27A1 d’aluminates liquides dans le domaine 1600–2100 °C. C.R. Acad. Sci. Paris 1990, 310, 1041. [Google Scholar]
- Florian, P.; Massiot, D.; Poe, B.; Farnan, I.; Coutures, J.P. A time resolved 27Al NMR study of the cooling process of liquid alumina from 2450 C to crystallisation. Solid State Nucl. Magn. Reson. 1995, 5, 233–238. [Google Scholar] [CrossRef]
- Poe, B.T.; McMillan, P.F.; Cote, B.; Massiot, D.; Coutures, J.P. Silica-alumina liquids: In-situ study by high-temperature aluminum-27 NMR spectroscopy and molecular dynamics simulation. J. Phys. Chem. 1992, 96, 8220–8224. [Google Scholar] [CrossRef]
- Skinner, L.B.; Barnes, A.C.; Salmon, P.S.; Hennet, L.; Fischer, H.E.; Benmore, C.J.; Kohara, S.; Weber, J.R.; Bytchkov, A.; Wilding, M.C. Joint diffraction and modeling approach to the structure of liquid alumina. Phys. Rev. B 2013, 87, 024201. [Google Scholar] [CrossRef]
- Enderby, J.; Ansell, S.; Krishnan, S.; Price, D.; Saboungi, M.L. The electrical conductivity of levitated liquids. Appl. Phys. Lett. 1997, 71, 116–118. [Google Scholar] [CrossRef]
- Paradis, P.-F.; Ishikawa, T.; Saita, Y.; Yoda, S. Non-contact thermophysical property measurements of liquid and undercooled alumina. Jpn. J. Appl. Phys. 2004, 43, 1496. [Google Scholar] [CrossRef]
- Paradis, P.F.; Ishikawa, T. Surface tension and viscosity measurements of liquid and undercooled alumina by containerless techniques. Jpn. J. Appl. Phys. 2005, 44, 5082. [Google Scholar] [CrossRef]
- Glorieux, B.; Millot, F.; Rifflet, J. Surface tension of liquid alumina from contactless techniques. Int. J. Thermophys. 2002, 23, 1249–1257. [Google Scholar] [CrossRef]
- Krishnan, S.; Weber, J.R.; Schiffman, R.A.; Nordine, P.C.; Reed, R.A. Refractive index of liquid aluminum oxide at 0.6328 μm. J. Am. Ceram. Soc. 1991, 74, 881–883. [Google Scholar] [CrossRef]
- Vashishta, P.; Kalia, R.K.; Nakano, A.; Rino, J.P. Interaction potentials for alumina and molecular dynamics simulations of amorphous and liquid alumina. J. Appl. Phys. 2008, 103, 083504. [Google Scholar] [CrossRef]
- Van Hoang, V.; Oh, S.K. Structure and diffusion simulation of liquid Al2O3. Phys. B 2004, 352, 342–352. [Google Scholar] [CrossRef]
- Van Hoang, V. Molecular dynamics study on structure and properties of liquid and amorphous Al2O3. Phys. Rev. B 2004, 70, 134204. [Google Scholar] [CrossRef]
- Ahuja, R.; Belonoshko, A.; Johansson, B. Melting and liquid structure of aluminum oxide using a molecular-dynamics simulation. Phy. Rev. E 1998, 57, 1673. [Google Scholar] [CrossRef]
- San Miguel, M.A.; Sanz, J.F.; Alvarez, L.J.; Odriozola, J.A. Molecular-dynamics simulations of liquid aluminum oxide. Phys. Rev. B 1998, 58, 2369. [Google Scholar] [CrossRef]
- Van Hoang, V.; Oh, S.K. Computer simulation of the structural transformation in liquid Al2O3. J. Phys. Condens. Matter 2005, 17, 3025. [Google Scholar] [CrossRef]
- Hung, P.; Vinh, L.; Nghiep, D.; Nguyen, P. Computer simulation of liquid Al2O3. J. Phys. Condens. Matter 2006, 18, 9309. [Google Scholar] [CrossRef]
- Sergio, D.; Gonzalo, G. Structural, elastic, vibrational and electronic properties of amorphous Al2O3 from ab initio calculations. J. Phys. Condens. Matter 2011, 23, 495401. [Google Scholar]
- Hemmati, M.; Wilson, M.; Madden, P.A. Structure of liquid Al2O3 from a computer simulation model. J. Phys. Chem. B 1999, 103, 4023–4028. [Google Scholar] [CrossRef]
- Nhan, N.T.; Hung, P.K.; Nghiep, D.M.; Thang, T.Q.; Kim, H.S. Molecular dynamics study on local structure of amorphous and liquid Al2O3. Met. Mater. Int. 2006, 12, 167–172. [Google Scholar] [CrossRef]
- Hoang, V.V.; Oh, S.K. Simulation of pressure-induced phase transition in liquid and amorphous Al2O3. Phys. Rev. B 2005, 72, 54209. [Google Scholar] [CrossRef]
- Hoang, V.V. About an order of liquid-liquid phase transition in simulated liquid Al2O3. Phys. Lett. A 2005, 335, 439–443. [Google Scholar] [CrossRef]
- Gheribi, A.E.; Serva, A.; Salanne, M.; Machado, K.; Zanghi, D.; Bessada, C.; Chartrand, P. Study of the partial charge transport properties in the molten alumina via molecular dynamics. ACS Omega 2019, 4, 8022–8030. [Google Scholar] [CrossRef]
- Bouhadja, M.; Jakse, N. Structural and dynamic properties of aluminosilicate melts: A molecular dynamics study. J. Phys. Condens. Matter 2019, 32, 104002. [Google Scholar] [CrossRef]
- Thompson, A.P.; Aktulga, H.M.; Berger, R.; Bolintineanu, D.S.; Brown, W.M.; Crozier, P.S.; In’t Veld, P.J.; Kohlmeyer, A.; Moore, S.G.; Nguyen, T.D. LAMMPS-a flexible simulation tool for particle-based materials modeling at the atomic, meso, and continuum scales. Comput. Phys. Commun. 2022, 271, 108171. [Google Scholar] [CrossRef]
- Sodeifian, G.; Razmimanesh, F. Diffusional interaction behavior of NSAIDs in lipid bilayer membrane using molecular dynamics (MD) simulation: Aspirin and Ibuprofen. J. Biomol. Struct. Dyn. 2019, 37, 1666–1684. [Google Scholar] [CrossRef]
- Billinge, S.J. The atomic pair distribution function: Past and present. Z. Krist.-Cryst. Mater. 2004, 219, 117–121. [Google Scholar] [CrossRef]
- Terban, M.W.; Billinge, S.J. Structural analysis of molecular materials using the pair distribution function. Chem. Rev. 2021, 122, 1208–1272. [Google Scholar] [CrossRef]
- Hoppe, R. The coordination number-an “inorganic chameleon”. Angew. Chem. Int. Edit. 1970, 9, 25–34. [Google Scholar] [CrossRef]
- Ishimaru, M.; Yoshida, K.; Kumamoto, T.; Motooka, T. Molecular-dynamics study on atomistic structures of liquid silicon. Phys. Rev. B 1996, 54, 4638. [Google Scholar] [CrossRef]
- Charati, S.; Stern, S. Diffusion of gases in silicone polymers: Molecular dynamics simulations. Macromolecules 1998, 31, 5529–5535. [Google Scholar] [CrossRef]
- Malek, K.; Sahimi, M. Molecular dynamics simulations of adsorption and diffusion of gases in silicon-carbide nanotubes. J. Chem. Phys. 2010, 132, 014310. [Google Scholar] [CrossRef]
- Rudyak, V.Y.; Krasnolutskii, S.L.; Ivanov, D.A. Molecular dynamics simulation of nanoparticle diffusion in dense fluids. Microfluid. Nanofluid. 2011, 11, 501–506. [Google Scholar] [CrossRef]
- Qiao, Z.; Feng, H.; Zhou, J. Molecular dynamics simulations on the melting of gold nanoparticles. Phase Transi. 2014, 87, 59–70. [Google Scholar] [CrossRef]
- Zhang, C.; Yang, X. Molecular dynamics simulation of ethanol/water mixtures for structure and diffusion properties. Fluid Phase Equilib. 2005, 231, 1–10. [Google Scholar] [CrossRef]
- Ju, Y.Y.; Zhang, Q.M.; Gong, Z.Z.; Ji, G.F. Molecular dynamics simulation of self-diffusion coefficients for liquid metals. Chin. Phys. B 2013, 22, 083101. [Google Scholar] [CrossRef]
- Shi, C.; Alderman, O.L.; Berman, D.; Du, J.; Neuefeind, J.; Tamalonis, A.; Weber, J.R.; You, J.; Benmore, C.J. The structure of amorphous and deeply supercooled liquid alumina. Front. Mater. 2019, 6, 38. [Google Scholar] [CrossRef]
- Jahn, S.; Madden, P.A. Structure and dynamics in liquid alumina: Simulations with an ab initio interaction potential. J. Non·Cryst. Solids 2007, 353, 3500–3504. [Google Scholar] [CrossRef]
- Giacomazzi, L.; Pasquarello, A. Vibrational spectra of vitreous SiO2 and vitreous GeO2 from first principles. J. Phys. Condens. Matter 2007, 19, 415112. [Google Scholar] [CrossRef] [PubMed]
- Bell, R. The dynamics of disordered lattices. Rep. Prog. Phys. 1972, 35, 1315. [Google Scholar] [CrossRef]
- Liang, Y.; Richter, F.M.; Davis, A.M.; Watson, E.B. Diffusion in silicate melts: I. Self diffusion in CaO-Al2O3-SiO2 at 1500 °C and 1 GPa. Geochim. Cosmochim. Acta 1996, 60, 4353–4367. [Google Scholar] [CrossRef]
- Jahn, S.; Madden, P. Atomic dynamics of alumina melt: A molecular dynamics simulation study. Condens. Matter Phys. 2008, 11, 169–178. [Google Scholar] [CrossRef][Green Version]
- Arima, T.; Yamasaki, S.; Inagaki, Y.; Idemitsu, K. Evaluation of thermal properties of UO2 and PuO2 by equilibrium molecular dynamics simulations from 300 to 2000 K. J. Alloys Compd. 2005, 400, 43–50. [Google Scholar] [CrossRef]
- Alexander, J.S.; Maxwell, C.; Pencer, J.; Saoudi, M. Equilibrium molecular dynamics calculations of thermal conductivity: A “how-to” for the beginners. CNL Nucl. Rev. 2020, 9, 11–25. [Google Scholar] [CrossRef]
- Jahn, S.; Madden, P.A.; Wilson, M. Transferable interaction model for Al2O3. Phys. Rev. B 2006, 74, 024112. [Google Scholar] [CrossRef]
Publisher’s Note: MDPI stays neutral with regard to jurisdictional claims in published maps and institutional affiliations. |
© 2022 by the authors. Licensee MDPI, Basel, Switzerland. This article is an open access article distributed under the terms and conditions of the Creative Commons Attribution (CC BY) license (https://creativecommons.org/licenses/by/4.0/).