Article

Solubilization and Thermodynamic Analysis of Isotretinoin in Eleven Different Green Solvents at Different Temperatures

1
Department of Pharmaceutics, College of Pharmacy, King Saud University, Riyadh 11451, Saudi Arabia
2
Department of Clinical Pharmacy, College of Pharmacy, King Saud University, Riyadh 11451, Saudi Arabia
*
Author to whom correspondence should be addressed.
Materials 2022, 15(22), 8274; https://doi.org/10.3390/ma15228274
Submission received: 9 October 2022 / Revised: 17 November 2022 / Accepted: 18 November 2022 / Published: 21 November 2022
(This article belongs to the Special Issue Development and Application of Greener Organic Solvents)

Abstract

:
The solubilization and thermodynamic analysis of isotretinoin (ITN) in eleven distinct green solvents, such as water, methyl alcohol (MeOH), ethyl alcohol (EtOH), 1-butyl alcohol (1-BuOH), 2-butyl alcohol (2-BuOH), ethane-1,2-diol (EG), propane-1,2-diol (PG), polyethylene glycol-400 (PEG-400), ethyl acetate (EA), Transcutol-HP (THP), and dimethyl sulfoxide (DMSO) was studied at several temperatures and a fixed atmospheric pressure. The equilibrium approach was used to measure the solubility of ITN, and the Apelblat, van’t Hoff, and Buchowski–Ksiazczak λh models were used to correlate the results. The overall uncertainties were less than 5.0% for all the models examined. The highest ITN mole fraction solubility was achieved as 1.01 × 10⁻¹ in DMSO at 318.2 K; however, the least was achieved as 3.16 × 10⁻⁷ in water at 298.2 K. ITN solubility was found to be enhanced with an increase in temperature and the order in which it was soluble in several green solvents at 318.2 K was as follows: DMSO (1.01 × 10⁻¹) > EA (1.73 × 10⁻²) > PEG-400 (1.66 × 10⁻²) > THP (1.59 × 10⁻²) > 2-BuOH (6.32 × 10⁻³) > 1-BuOH (5.88 × 10⁻³) > PG (4.83 × 10⁻³) > EtOH (3.51 × 10⁻³) > EG (3.49 × 10⁻³) > MeOH (2.10 × 10⁻³) > water (1.38 × 10⁻⁶). ITN–DMSO showed the strongest solute–solvent interactions when compared to the other ITN and green solvent combinations. According to thermodynamic studies, ITN dissolution was endothermic and entropy-driven in all of the green solvents tested. The obtained outcomes suggested that DMSO appears to be the best green solvent for ITN solubilization.

1. Introduction

Isotretinoin (ITN) (chemical structure: Figure 1; IUPAC name: (2Z,4E,6E,8E)-3,7-dimethyl-9-(2,6,6-trimethylcyclohexen-1-yl)nona-2,4,6,8-tetraenoic acid; molecular formula: C20H28O2; molar mass: 300.44 g mol−1, PubChem ID: 5282379, and CAS number: 4759-48-2) is commercially available as yellow-orange to orange crystalline powder [1,2]. It is a cis configurational isomer of retinoic acid, commonly known as 13-cis-retenoic acid [1,3]. Since ITN plays an important role in controlling gene expression, it was found to be suitable for the treatment of various cancers [4,5]. It was also found to be useful in treating various skin diseases such as acne, psoriasis, and skin carcinoma [6,7,8,9,10]. It is claimed to be the best medication for the treatment of acne [10,11]. Recently, a practical method for the oral administration of ITN in pediatric neuroblastoma patients was discovered as the patient was not able to swallow commercially available tablets or capsules [12].
ITN is a highly lipophilic compound and possesses poor solubility in water, which results in difficulties in its formulation development [13,14]. It is uncommon to find information about ITN’s solubility and other physicochemical properties in the literature. Industries have a larger need for solubility data, solubility parameters, and other physicochemical data of weakly water-soluble compounds in aqueous and organic solvents [15,16,17,18]. Some lipid-based formulations such as microemulsions, microemulsion gels, and self-nanoemulsifying formulations were examined to alter the physicochemical and fundamental properties of ITN [19,20,21,22,23,24]. At room temperature, the solubility of ITN was reported in certain green solvents, including propane-1,2-diol (PG), polyethylene glycol-400 (PEG-400), and Transcutol-P (THP) [20,23].
However, the temperature-dependent solubility data and thermodynamic characteristics of ITN in examined environmentally friendly/green solvents, including water, methyl alcohol (MeOH), ethyl alcohol (EtOH), 1-butyl alcohol (1-BuOH), 2-butyl alcohol (2-BuOH), ethane-1,2-diol (EG), PG, PEG-400, ethyl acetate (EA), THP, and DMSO have not yet been published. Therefore, new solubility data and thermodynamic parameters for ITN in eleven different environmentally friendly solvents—water, MeOH, EtOH, 1-BuOH, 2-BuOH, EG, PG, PEG-400, EA, THP, and DMSO—at a fixed atmospheric pressure (101.1 kPa) and at temperatures ranging from 298.2 to 318.2 K are reported in the current work. To assess the way ITN dissolves in various green solvents, “apparent thermodynamic analysis” was used. The solubility and physicochemical data found in this study may be useful for the purification, recrystallization, drug discovery, pre-formulation evaluation, and dosage form design of ITN.

2. Materials and Methods

2.1. Materials

ITN working compound was provided by BOC Sciences (Shirley, NY, USA). MeOH, EtOH, 1-BuOH, 2-BuOH, EG, PG, and PEG-400 were procured from Fisher Chemical (Loughborough, UK). EA and DMSO were acquired from Sigma Aldrich (Darmstadt, Germany). THP was obtained from Gattefosse (Lyon, France). The Milli-Q unit was used to obtain ultra-pure water. Supplementary Table S1 provides an overview of each material’s specifics.

2.2. Analytical Methodology for Determination of ITN

A laboratory-developed and validated high-performance liquid chromatography (HPLC) approach was utilized to determine ITN in all in vitro samples. ITN analysis was carried out using a UV–Vis detector at a wavelength of 354 nm. ITN was subjected to the analysis using an HPLC system (Waters, Milford, MA, USA) at room temperature (298.2 K). For the HPLC determination of ITN, a Nucleodur (150 × 4.6 mm, 5 μm) RP C18 column was utilized. The green solvent mixture of ethyl alcohol and ethyl acetate (50:50, v/v) flowed at a flow speed of 1.0 mL min−1. The green solvent mixture was freshly made, filtered through a 0.45 µm nylon filter, and then degassed before analysis. A 20 µL injection volume was used. By plotting ITN concentrations against the measured HPLC area, the ITN calibration plot was created. The ITN calibration curve was linear between 0.2 and 80 µg g−1, with a determination coefficient (R2) of 0.9994. ITN has a regression line equation of y = 75,179x + 59,230, where x and y are the measured HPLC area and ITN concentration, respectively.

2.3. Characterization of Solid Phases of ITN

The solid phases of pure ITN and equilibrated ITN (the sample obtained from the equilibrated MeOH) were characterized using differential scanning calorimetry (DSC), Fourier transforms infrared (FTIR) spectroscopy, and X-ray diffraction (XRD) studies. The equilibrated ITN was recovered from MeOH via slow evaporation [17,18]. DSC measurements were performed using a DSC-60 Instrument (Shimadzu, Tokyo, Japan) to obtain DSC spectra for both samples. Pure indium was used as the calibration reference and the apparatus was calibrated between 283.2 K and 773.2 K. Aluminum pans were used to hold the precisely measured 4.0 mg of pure and equilibrated ITN that were hermetically sealed with the aid of aluminum lids and a crimper. An empty aluminum pan was used as a reference for the thermal scanning of both pure and equilibrated ITN. Both samples’ DSC spectra were captured at a nitrogen flow rate of 40 mL min−1. For each sample, the heating rate was set to 10 K min−1. Both samples were heated to a temperature between 298.2 and 523.2 K. Using TA-60WS thermal analysis software (Shimadzu, Tokyo, Japan), various thermal parameters for both samples were calculated [25].
Utilizing the KBr disc method as described in the literature [26], the absorption spectra in the range of 300 cm–1–4000 cm–1 were acquired for FTIR spectral analyses. The samples were examined using a Diffractometer (Rigaku Inc. Tokyo, Japan) fitted with Cu-K radiation of 1.5406 for XRD measurements. In the 2–60° diffraction angle (2θ) range with a 0.02° step size, both ITN samples were investigated [18]. The potential conversions of ITN into different physical states, including polymorphs, solvates, and hydrates, among others, were investigated using the DSC, FTIR, and XRD investigations.

2.4. ITN Solubility Determination

At different temperatures and fixed pressure, the solubility of ITN in eleven different green solvents was determined using an equilibrium saturation method [27]. ITN was added in excess and combined with known quantities of each green solvent. The resulting mixture underwent a 10 min vortexing process. In a Water Shaker Bath (Daihan Scientific Co. Ltd., Seoul, Republic of Korea), the prepared samples were shaken at 100 rpm for 72 h [28,29]. After achieving equilibrium, each sample was collected, filtered, and centrifuged for 30 min at 5000 rpm. The supernatant was withdrawn carefully, diluted (when necessary), and used to determine ITN content in each sample by HPLC approach at 354 nm. The measured mole fraction solubility (xe) of ITN was obtained with the help of the following equation [25,26]:
x e = m 1 / M 1 m 1 / M 1 + m 2 / M 2
where m1 = ITN mass; m2 = green solvent mass; M1 = ITN molar mass; and M2 = green solvent molar mass. The solvent masses were taken on mass basis and calibration curve was also made on mass mass−1 basis. As a result, the density of solvents was not taken into consideration for the calculation of mole fraction solubility.

2.5. Determination of Solubility Parameters

Under normal conditions of temperature and pressure, the molecules with identical solubility characteristics may achieve the greatest solubility in the sample matrices [30]. Hence, this research assessed several solubility parameters for ITN and other environmentally friendly solvents. The overall “Hansen solubility parameter (HSP)” of ITN was calculated using the following equation [30,31,32]:
δ 2 = δ d 2 + δ p 2 + δ h 2
where δ = total HSP of ITN; δd = dispersion HSP of ITN; δp = polar HSP of ITN; and δh = hydrogen-bonded HSP of ITN.
The values of δ, δd, δp, and δh for ITN were calculated by entering the simplified molecular input line entry system (SMILES) into the HSPiP program (version 4.1.07, Louisville, KY, USA). ITN’s PubChem database was used to obtain the SMLIES. The values of δ, δd, δp, and δh for other green solvents, on the other hand, were derived from reference [17].
The “van Krevelen and Hoftyzer solubility parameter (Δ   δ ¯ ) ” was calculated utilizing the following equation [33]:
Δ   δ ¯ = δ d 2 2 δ d 1 2 + δ p 2 2 δ p 1 2 + δ h 2 2 δ h 1 2 1 / 2
ITN and a particular green solvent are denoted by subscripts 1 and 2, respectively. According to a prior publication, the molecule will be most soluble in the green solvent if Δ   δ ¯ < 5.0 MPa1/2 [33,34].
The “three dimensional (3D) solubility parameter space (Ra)” was determined with the help of the following equation [35,36]:
R a 2 = 4 δ d 2 δ d 1 2 + δ p 2 δ p 1 2 + δ h 2 δ h 1 2
According to a prior publication, the molecule will be most soluble in the green solvent if Ra < 5.6 MPa1/2 [35].
The HSP sphere for ITN using eleven distinct green solvents was also determined using HSPiP program. The HSP sphere or interaction radius (R0) was obtained using HSP sphere [37,38]. The relative energy difference (RED) was calculated with the help of HSP sphere using the following equation [39,40]:
R E D = R a R 0
The “Greenhalgh’s solubility parameter (∆δ)” was determined with the help of the following equation [41]:
Δ δ = δ 2 δ 1
According to a prior publication, the molecule will be most soluble in the green solvent if ∆δ < 7.0 MPa1/2 [31,41].

2.6. Ideal Solubility of ITN and Solute–Solvent Interactions

The purpose of calculating an ideal solubility (xidl) was to determine activity coefficients of ITN, which were further used to describe solute–solvent interactions. The xidl of ITN at different temperatures was determined with the help of the following equation [42]:
ln   x idl = Δ H fus T fus T R T fus T + Δ C p R [ T fus T T + ln T T fus ]  
where ∆Cp is the difference between the molecular heat capacities of the solid phase and liquid state of ITN; Tfus is the ITN fusion temperature; ∆Hfus is the ITN fusion enthalpy; and R is the universal gas constant. The ∆Cp for ITN was calculated with the help of the following equation [42,43]:
Δ C p = Δ H fus T fus
The Tfus and ∆Hfus for ITN were determined as 452.7 K and 7.64 kJ mol−1, respectively, by DSC analysis. Utilizing Equation (7), the ∆Cp for ITN was calculated as 16.67 J mol−1 K−1. Now, utilizing Equation (6), the xidl data for ITN were derived.
The “activity coefficients (γi)” for ITN in eleven different green solvents at different temperatures were determined with the help of the following equation [42,44]:
γ i = x idl x e
Based on the recorded γi values of ITN at different temperatures, ITN–solvent molecular interactions were determined.

2.7. ITN Solubility Correlation Using Computational Models

Computational modeling of the measured solubility of ITN is essential for practical validations [45,46]. In order to connect the measured ITN solubility data, “Apelblat, van’t Hoff, and Buchowski–Ksiazczak λh models” were used [31,47,48,49,50,51]. The “Apelblat model solubility (xApl)” of ITN was determined with the help of the following equation [47,48]:
ln   x Apl = A + B T + C ln T
where A, B, and C are the model coefficients derived from the measured ITN solubility values listed in Table 1, utilizing multivariate regression analysis [31]. Root mean square deviation (RMSD) and R2 were used to correlate xe and xApl values of ITN. The RMSD of ITN was calculated utilizing its reported formula [18].
The “van’t Hoff model solubility (xvan’t)” of ITN was determined with the help of the following equation [31]:
ln   x van t = a + b T
where a and b are the “van’t Hoff model” coefficients that were established using the least squares method [52].
The “Buchowski–Ksiazczak λh solubility (xλh)” for ITN was determined with the help of the following equation [49,50]:
ln   [ 1 + λ ( 1 x λ h ) x λ h ] = λ h   [ 1 T 1 T fus ]
where λ and h are the model coefficients of “Buchowski–Ksiazczak λh model”.

2.8. Thermodynamic Analysis

Apparent thermodynamic analysis was applied to estimate the thermodynamic properties of ITN in eleven different green solvents. The “van’t Hoff and Krug et al. analysis” was used to identify three different parameters for ITN [44,53,54]. The apparent standard enthalpy (ΔsolH0) for ITN in eleven different green solvents was determined at the mean harmonic temperature (Thm) of 308 K using “van’t Hoff analysis” with the help of the following equation [44,53]:
ln   x e 1 T 1 T hm P = Δ sol H 0 R
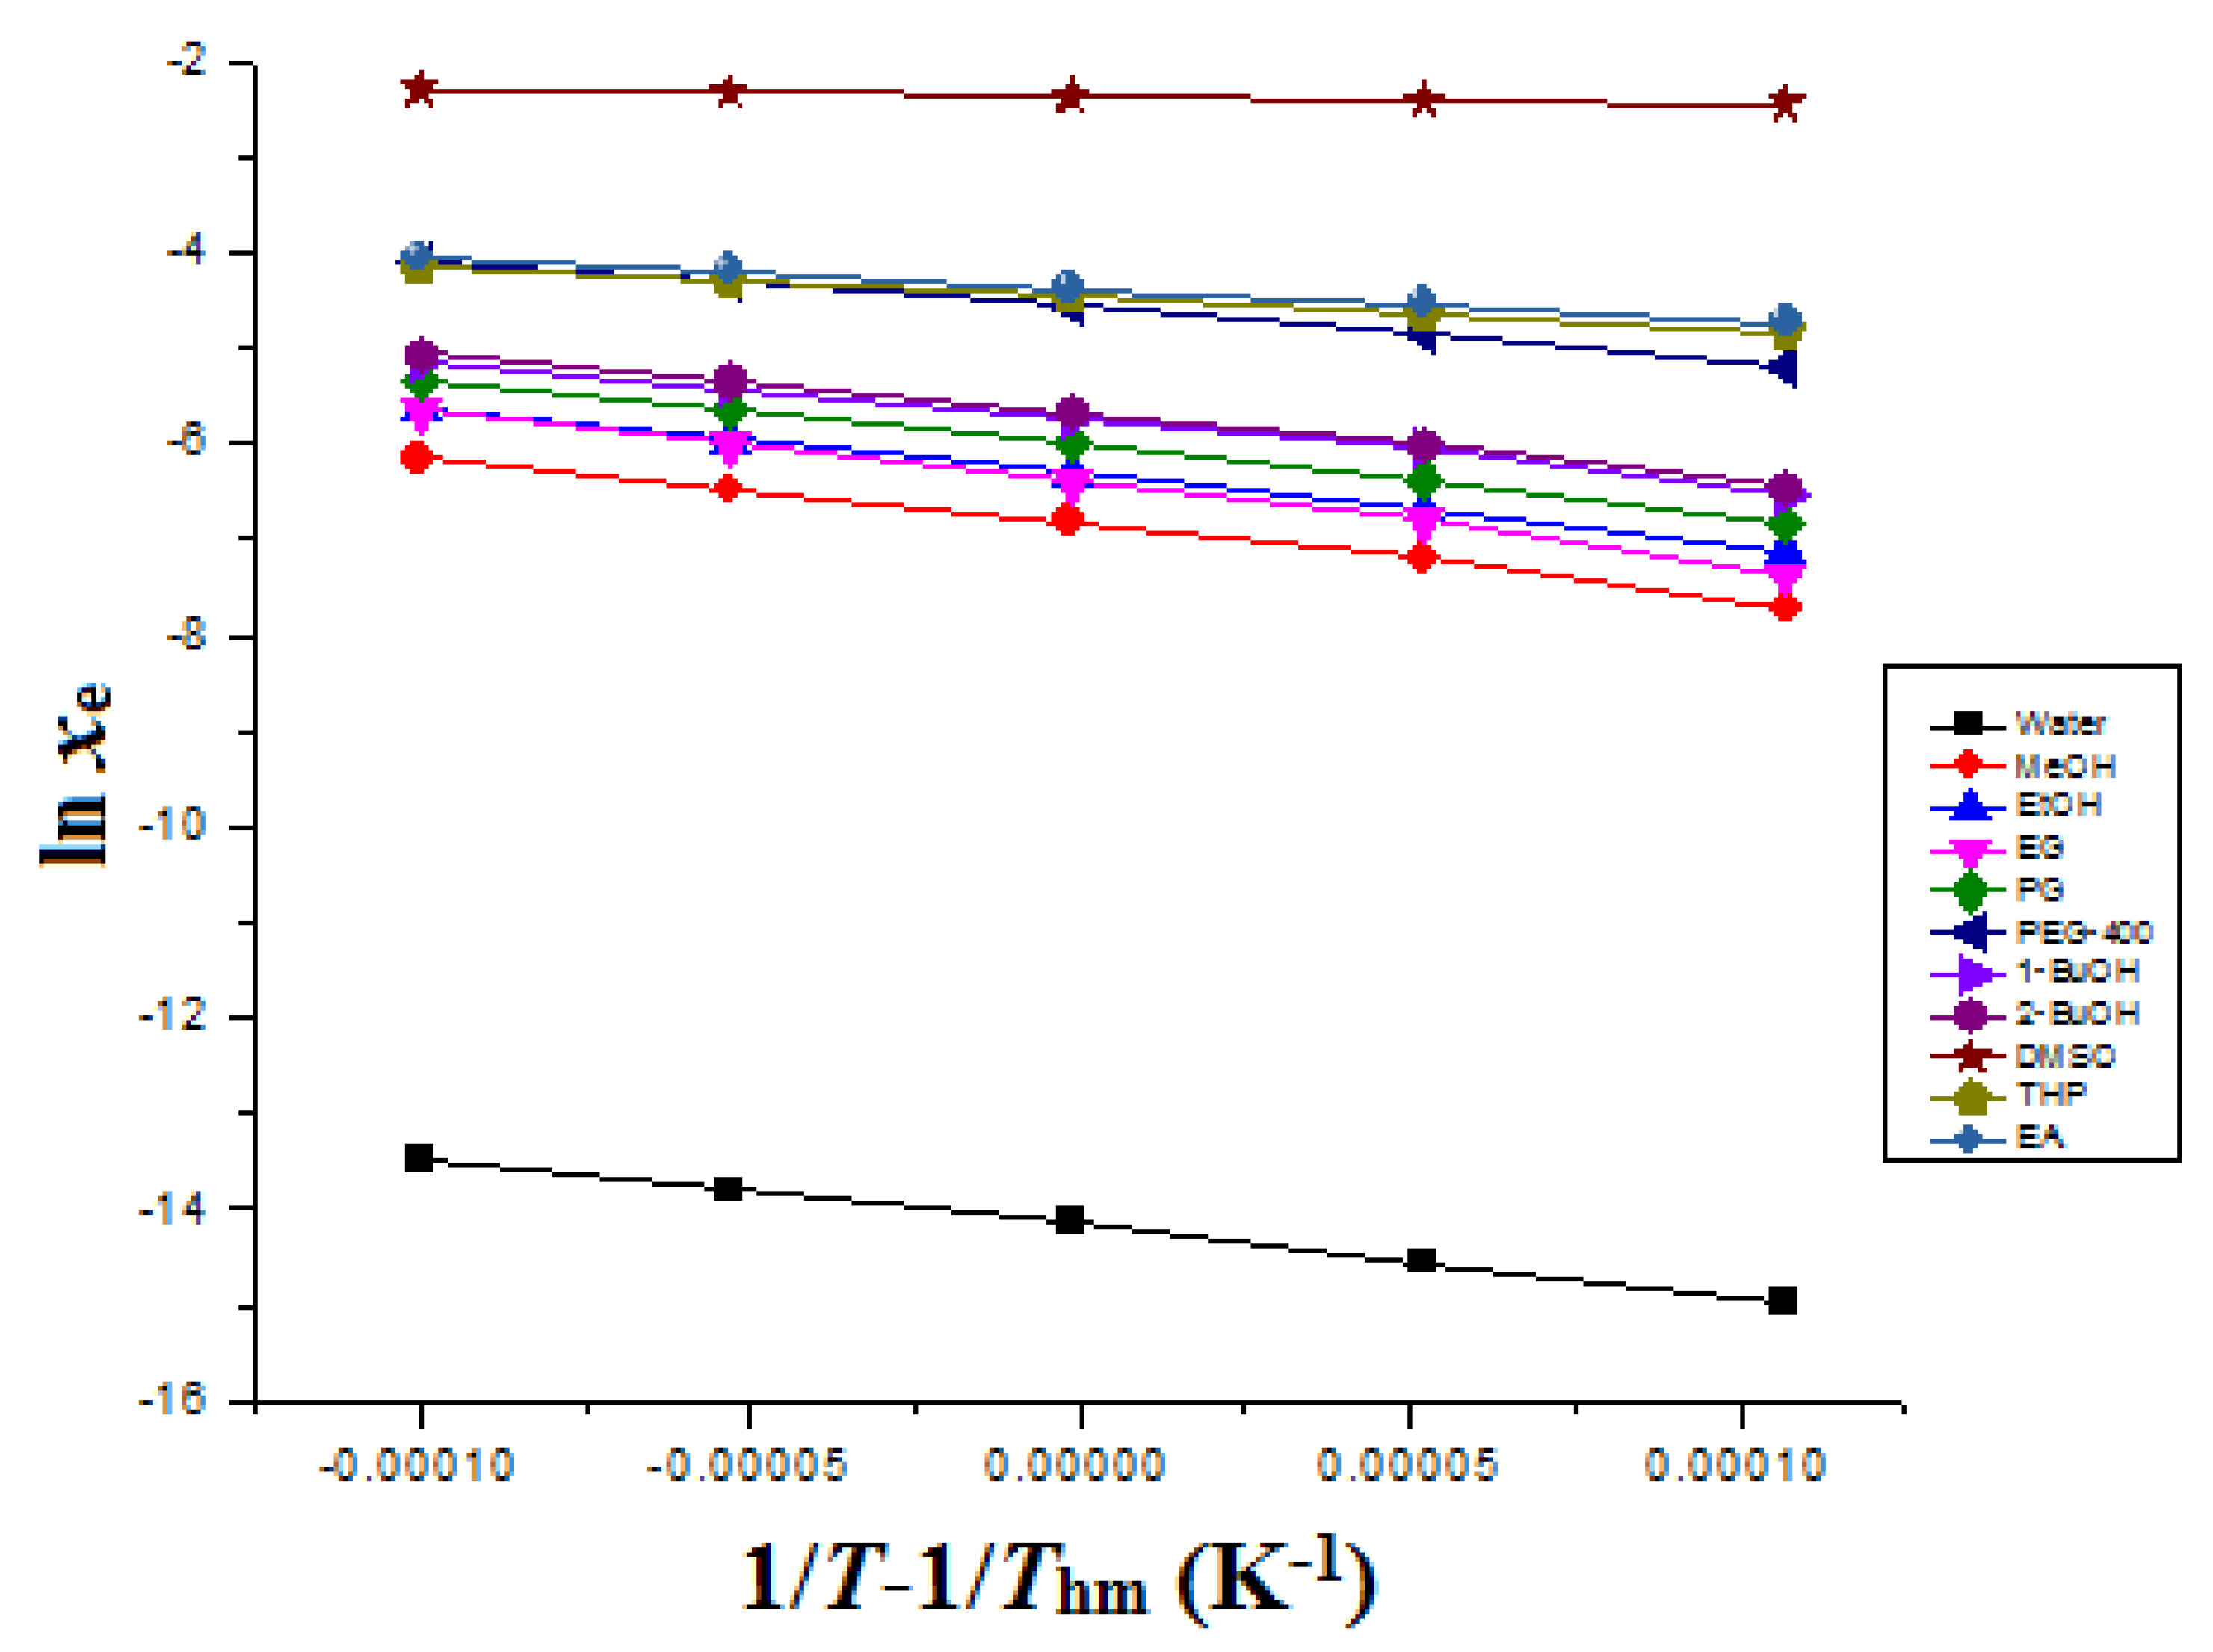
The ΔsolH0 for ITN was obtained from “van’t Hoff” graphs plotted between ln xe values of ITN and 1 T 1 T hm . The van’t Hoff graphs for ITN in eleven different green solvents are mentioned in Figure 2. The ΔsolH0 for ITN was determined at Thm according to “van’t Hoff analysis” (Equation (13)) instead of the standard temperature of 298.2 K [44,53].
Additionally, at Thm = 308 K, the apparent standard Gibbs energy (ΔsolG0) for ITN in eleven different green solvents was also estimated using the “Krug et al. analysis” with the help of the following Equation (14) [53]:
Δ sol G 0 = R T hm × intercept
where the intercept values for ITN in eleven different green solvents were obtained from “van’t Hoff plots” mentioned in Figure 2.
The apparent standard entropy (ΔsolS0) for ITN dissolution was determined with the help of the following equation [44,53,54]:
Δ sol S 0 = Δ sol H 0 Δ sol G 0 T hm

2.9. Statistical Analysis

The Kruskal–Wallis test was utilized, followed by Denn’s test for statistical comparison. GraphpadInstat software (San Diego, CA, USA) was used for this analysis. The p < 0.05 was considered a significant value.

3. Results and Discussion

3.1. Characterization of Solid Phases of ITN

Pure and equilibrated ITN recovered from MeOH was used to characterize the solid phases of ITN using DSC, FTIR, and XRD spectrum analyses. Figure 3 displays the DSC spectrum of ITN in the pure and equilibrated samples. The endothermic peak of pure ITN in the DSC spectra, which corresponds to the Tfus value of ITN, was visible at 452.70 K (Figure 2). It was discovered that the pure ITN’s ∆Hfus value was 7.64 kJ mol−1. The endothermic peak of equilibrated ITN at 450.2 K, which denotes the Tfus of equilibrated ITN, was also seen in the DSC spectra of equilibrated ITN (recovered from MeOH). It was discovered that the equilibrated ITT’s ∆Hfus was 8.18 kJ mol−1. Pure and equilibrated ITN were found to have identical DSC spectra and thermal characteristics (p > 0.05). The Tfus of ITN was reported in the range of 450.20–457.82 K [1,2,3,19,23]. The Tfus of ITN was recorded to be 450.20 K by Ghorab and Babiker [3]. Berbenni et al. obtained the Tfus of ITN as 453.20 K [1]. Guimaraes et al. reported the Tfus of ITN as 454.29 K [19]. However, Ascenso et al. and Chavda et al. reported the Tfus of ITN as 457.30 K and 457.82 K, respectively [2,23]. ITN’s measured Tfus value at 452.70 K matched that found in the literature [1,2,3,19,23].
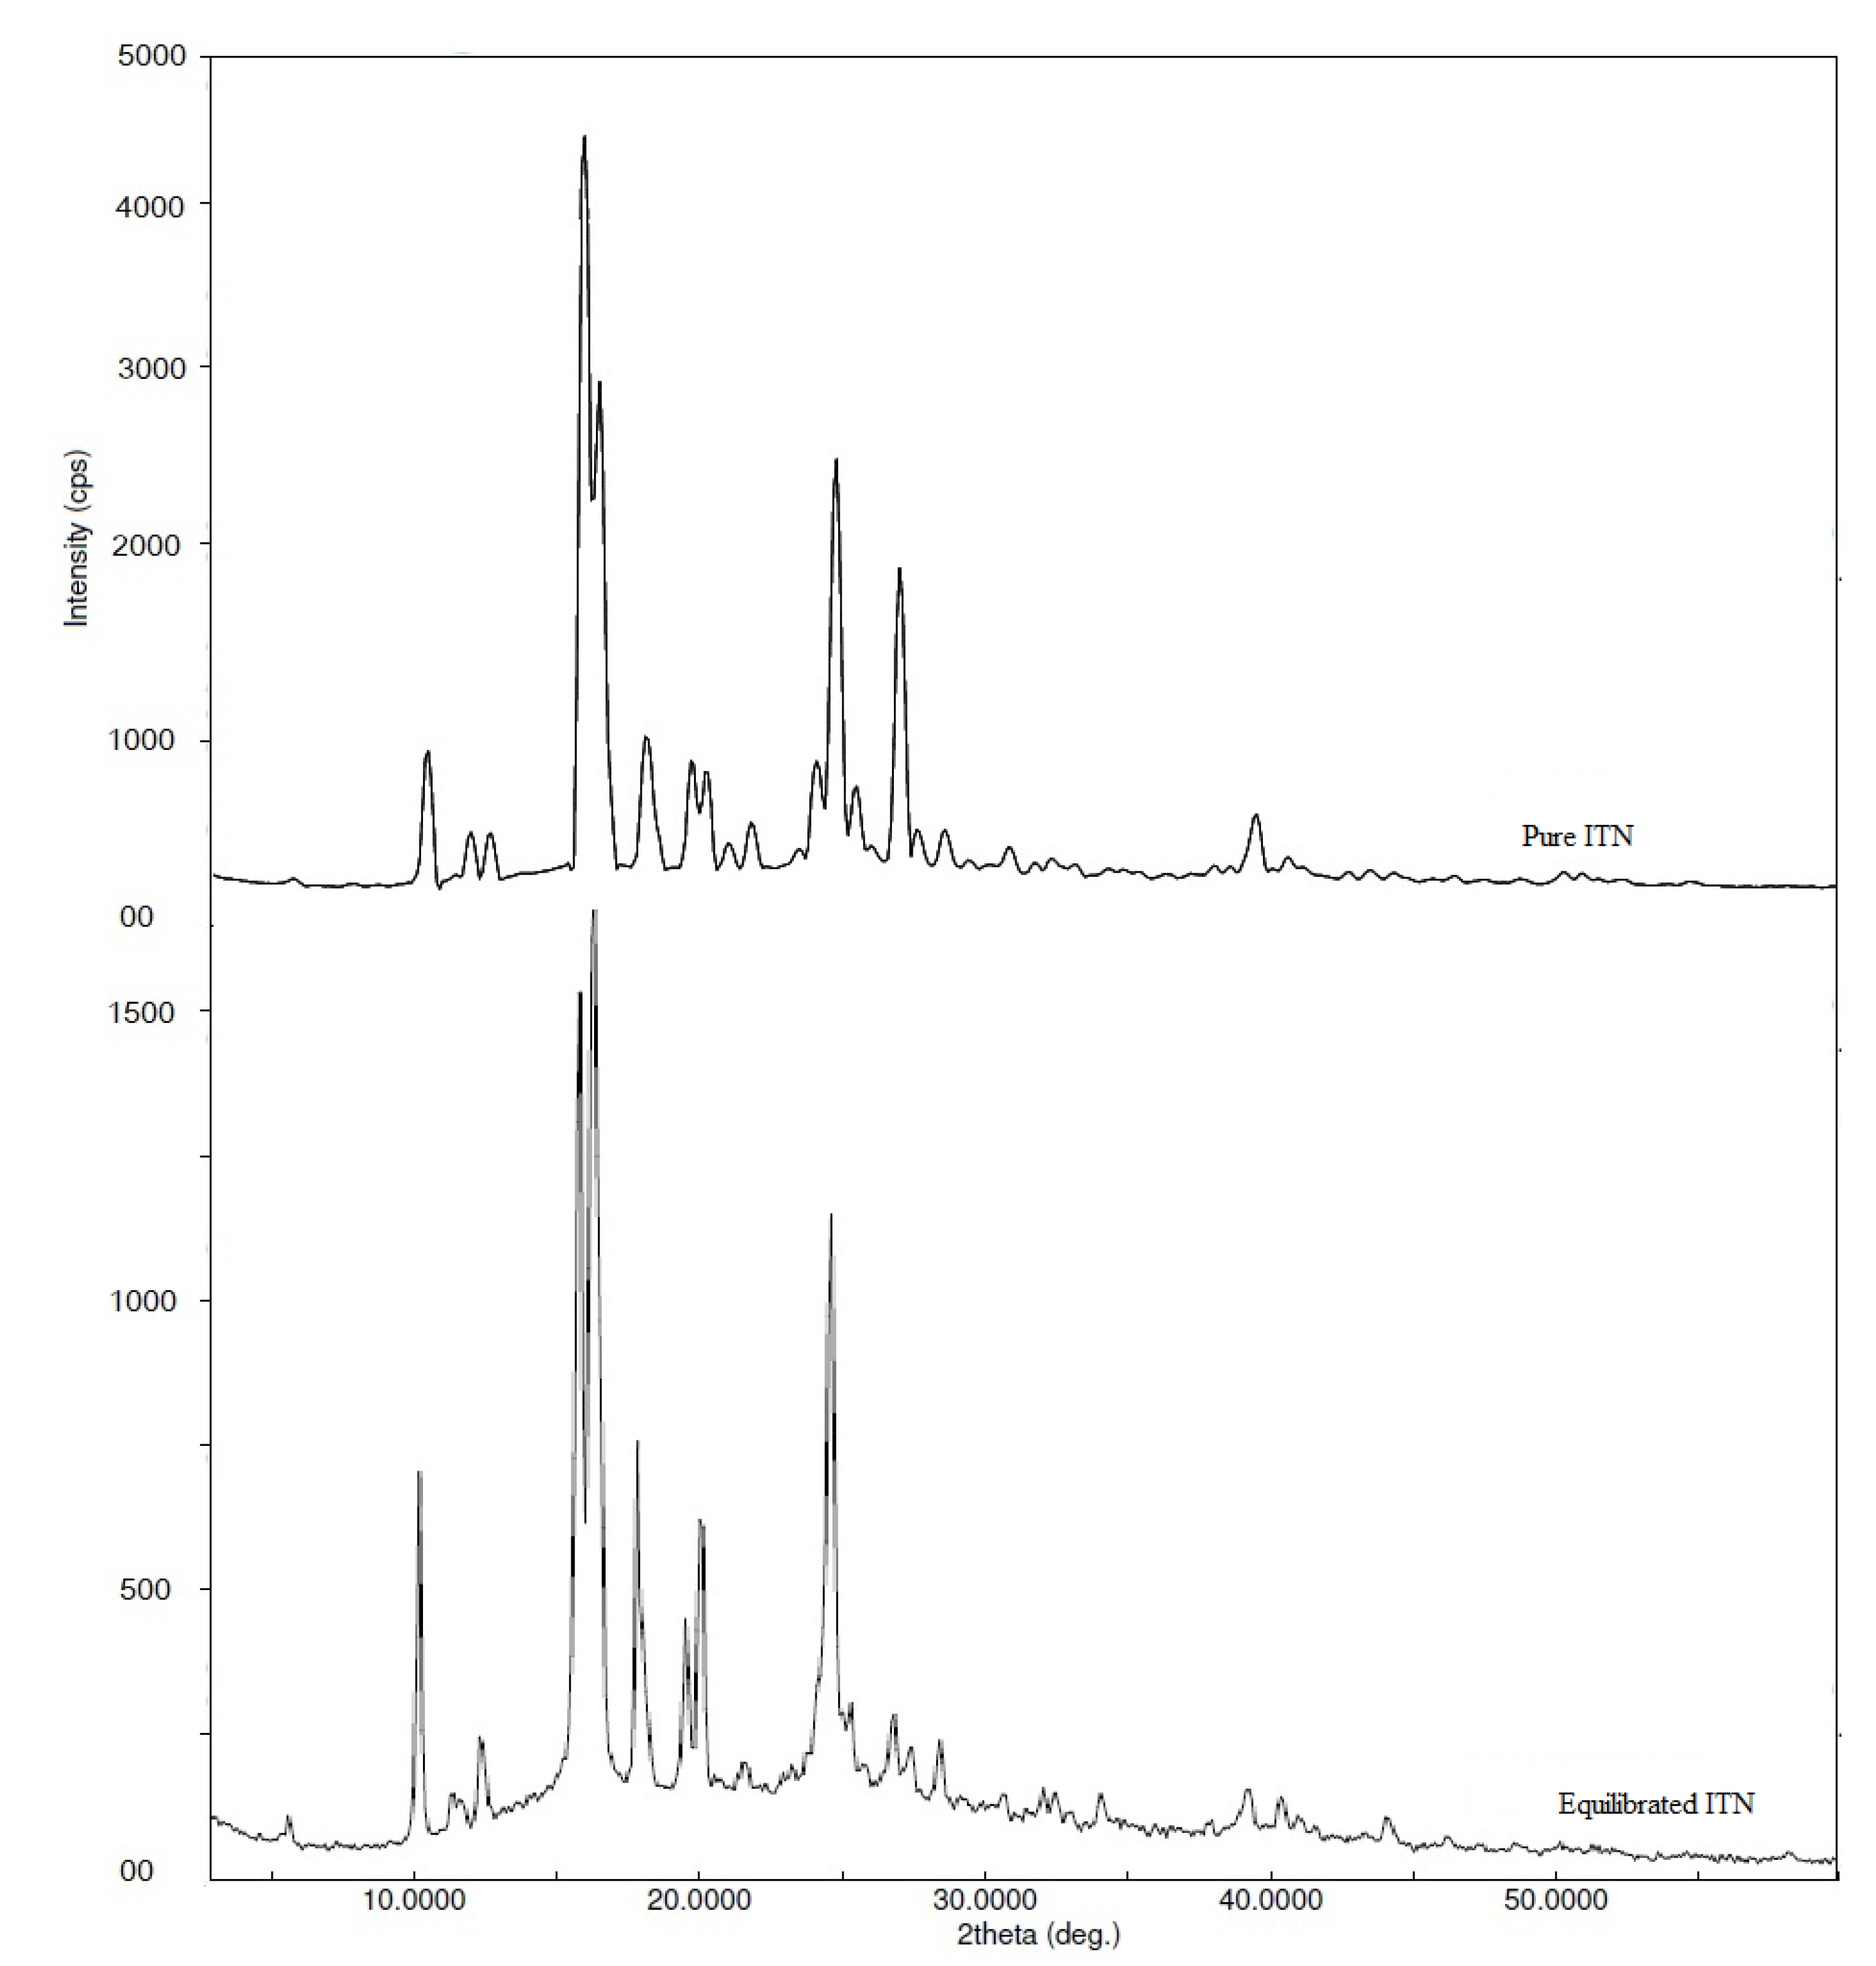
The FTIR spectra of pure and equilibrated ITN are shown in Figure 4. The crystalline nature of pure ITN was revealed by the distinct ITN characteristic peaks in the FTIR spectra of pure ITN at various wave numbers (Figure 4). Equilibrated ITN’s FTIR spectra showed identical ITN characteristics peaks at various wave numbers after being recovered from MeOH (Figure 4), proving that it is also crystalline. The XRD spectra of pure and equilibrated ITN are shown in Figure 5. Pure ITN’s XRD spectrum revealed a number of characteristic peaks of ITN at various 2θ values, proving that it is crystallized (Figure 5). The XRD curve of equilibrated ITN obtained from MeOH displayed similar feature peaks of ITN at varied 2θ values, indicating that the substance is crystalline (Figure 5). ITN was not transformed into solvates, polymorphs, or hydrates after equilibrium, according to the results of the DSC, FTIR, and XRD analyses. Given that the experimental settings for other green solvents were comparable, it was also anticipated that ITN would retain its crystalline form in other solvents as well.

3.2. Measured Solubility of ITN

Table 1 contains the solubility data for ITN in eleven different environmentally friendly solvents at various temperatures and constant air pressure. ITN’s equilibrium solubility in various environmentally friendly solvents, such as PG, PEG-400, and THP, is documented [20,23]. However, it has not yet been possible to measure the temperature-dependent solubility data of ITN in water, MeOH, EtOH, 1-BuOH, 2-BuOH, EG, PG, PEG-400, THP, EA, and DMSO. According to Patel et al. [20], the equilibrium solubility of ITN in PG at 298.2 K is 4.11 mg g−1 (converted to 1.04 × 10⁻³ in mole fraction). In this work, the mole fraction solubility of ITN in PG at 298.2 K was calculated to be 1.07 × 10⁻³. According to Patel et al. [20], the equilibrium solubility of ITN in THP at 298.2 K is 18.00 mg g−1 or 7.97 × 10⁻³ in mole fraction. In addition, Chavda et al. [23] observed that the equilibrium solubility of ITN in THP at 298.2 K was 52.3 mg mL−1 (equivalent to 2.21 × 10⁻² in mole fraction). The mole fraction solubility of ITN in THP was calculated in this paper to be 8.06 × 10⁻³ at 298.2 K. According to Chavda et al. [23], the equilibrium solubility of ITN in PEG-400 at 298.2 K is 12.2 mg mL−1 (translated to 1.78 × 10⁻² in mole fraction). In this work, the mole fraction solubility of ITN in PEG-400 at 298.2 K was calculated to be 5.56 × 10⁻³. The solubility of ITN in PG and THP that was observed was in agreement with that reported by Patel et al. [20]. The solubility of ITN in THP and PEG-400, however, differed significantly from that which Chavda et al. [23] observed. These variations could be explained by variations in experimental parameters such as shaking frequency, equilibrium duration, and ITN measurement analytical technique [1,9]. The shaking frequency of the solubility measurement could influence the equilibrium time and hence the solubility of the drug.
The results shown in Table 1 are in good accord with other studies [28,29] in that ITN’s solubility significantly increased with the rise in temperature in all the green solvents evaluated (p < 0.05) [28,29]. At 318.2 K, the sequence of ITN solubility in eleven distinct green solvents was as follows: DMSO (1.01 × 10⁻¹) > EA (1.73 × 10⁻²) > PEG-400 (1.66 × 10⁻²) > THP (1.59 × 10⁻²) > 2-BuOH (6.32 × 10⁻³) > 1-BuOH (5.88 × 10⁻³) > PG (4.83 × 10⁻³) > EtOH (3.51 × 10⁻³) > EG (3.49 × 10⁻³) > MeOH (2.10 × 10⁻³) > water (1.38 × 10⁻⁶). The mole fraction solubility of ITN was higher in nonpolar green solvents, such as DMSO, EA, PEG-400, THP, 2-BuOH, 1-BuOH, PG, EtOH, EG, and MeOH as compared to water. This was probably because ITN had a –COOH group, which could have strong molecular solvation with nonpolar green solvents. The ITN solubility in 1-BuOH and 2-BuOH was not considerably different because of the similar molecular structures and molar masses of 1-BuOH and 2-BuOH (p > 0.05). Furthermore, the polarity of 1-BuOH and 2-BuOH is also not considerably different (p > 0.05). The solubility of ITN in PG was slightly higher than EG because the polarity of PG is slightly lower than EG (p > 0.05). The solubility of ITN in EtOH was slightly higher than MeOH because the polarity of EtOH is slightly lower than MeOH (p > 0.05). However, the solubility of ITN in PEG-400, THP, EA, and DMSO was considerably higher than its solubility in other green solvents examined (p < 0.05). This was probably because PEG-400, THP, EA, and DMSO have lower polarity compared to the other green solvents examined [55]. DMSO may be the best green solvent for ITN solubilization because it had the highest ITN solubility among the other investigated green solvents.

3.3. Determination of HSPs

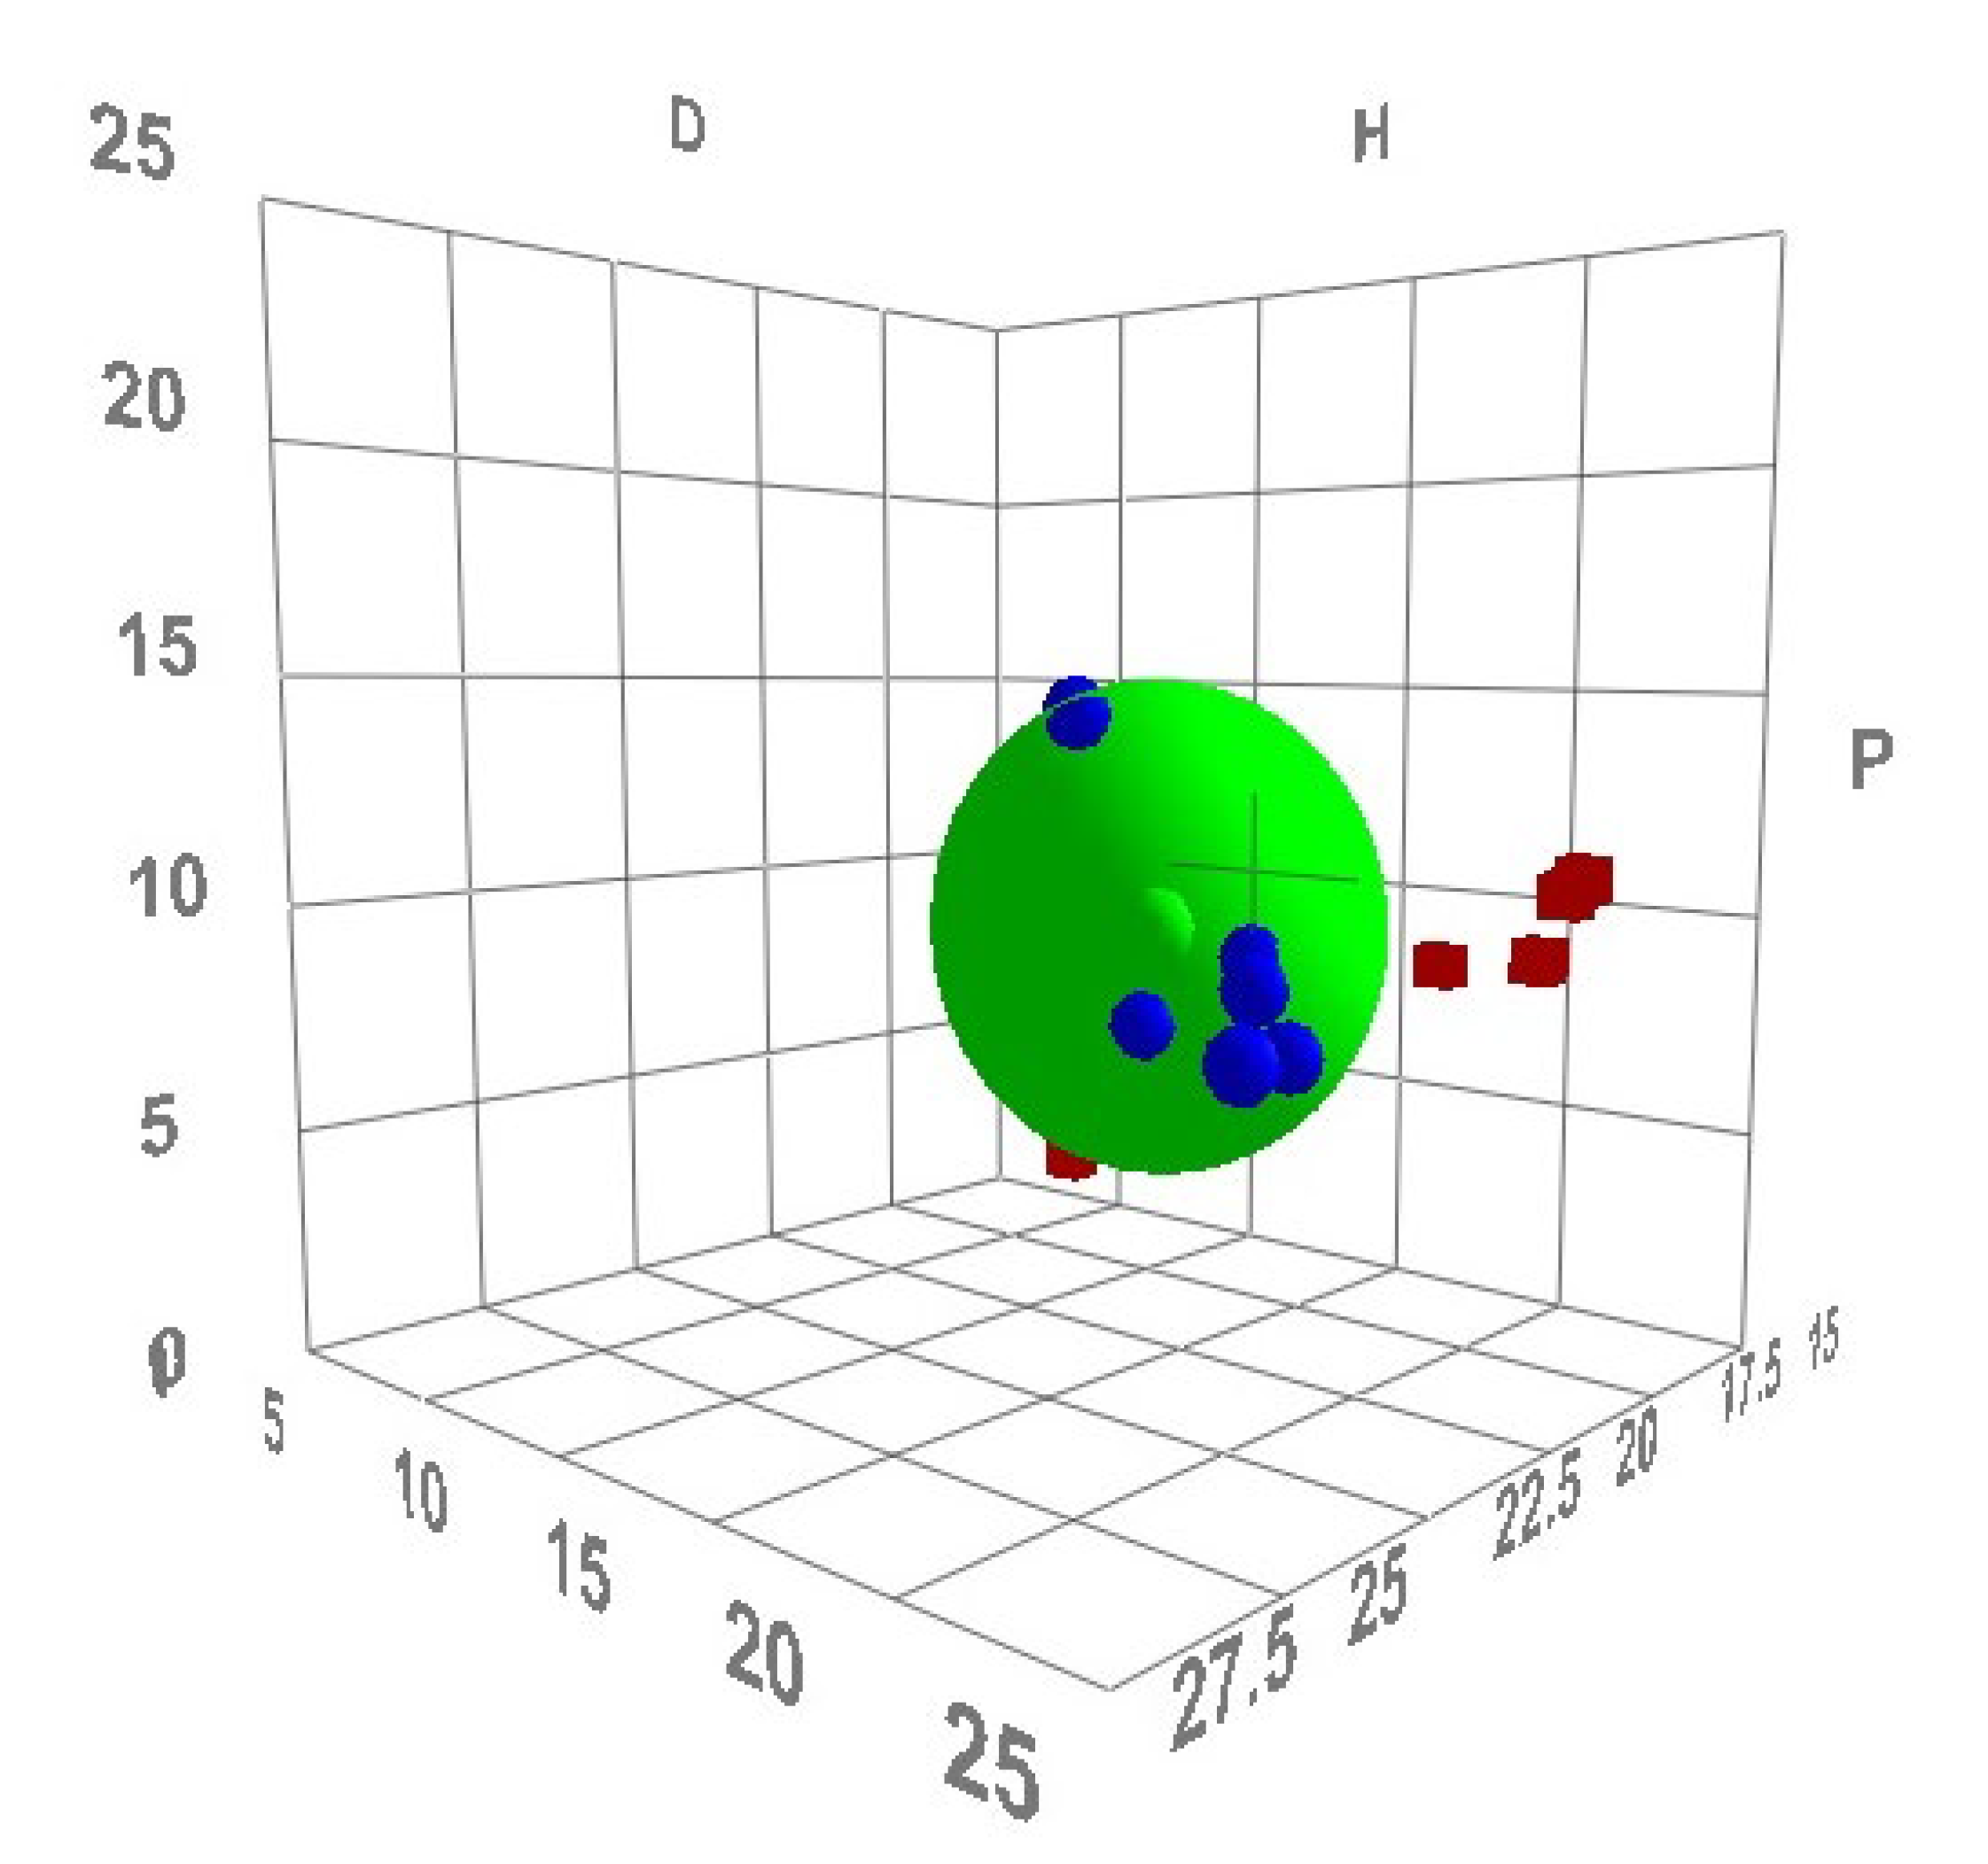
“HSPiP software” was used to compute a number of HSPs for ITN. We used reference [17] to obtain the HSPs of eleven distinct environmentally friendly solvents. In Table 2, the results of the HSPs are listed. With a value δ value of 19.30 MPa1/2, ITN was discovered to have a low polarity. Six environmentally friendly solvents were identified as having identical δ values and being dependable for ITN solubilization: 1-BuOH, 2-BuOH, EA, DMSO, THP, and PEG-400 (Table 2). Water did not appear to be acceptable for ITN solubilization with a δ value of 47.80 MPa1/2. It was discovered that the solute will be most soluble in the green solvent if Δ   δ ¯ is < 5.0 MPa1/2 [33,34]. The Δ   δ ¯ value for four environmentally friendly solvents, including 2-BuOH (Δ   δ ¯ = 5.92 MPa1/2), THP (Δ   δ ¯ = 6.49 MPa1/2), PEG-400 (Δ   δ ¯ = 6.05 MPa1/2), and EA (Δ   δ ¯ = 3.58 MPa1/2), was close to the reported value, suggesting that these environmentally friendly solvents are appropriate for ITN solubilization, in accordance with this theory. It was also discovered that the solute will be most soluble in the green solvent if Ra is <5.6 MPa1/2 [35,36]. The Ra value for three environmentally friendly solvents, such as 2-BuOH (Ra = 6.69 MPa1/2), THP (Ra = 6.87 MPa1/2), and EA (Ra = 4.86 MPa1/2), was close to the reported value, suggesting that these environmentally friendly solvents are appropriate for ITN solubilization, in accordance with this theory. The 3D diagram for the HSP sphere generated using the HSPiP program is presented in Figure 6. The green solvents enclosed within the sphere are considered good solvents and the green solvents that are outside of the sphere are considered bad solvents. Using the values of Ra and R0, the RED for eleven distinct green solvents was determined and the data are presented in Table 2. The green solvents with a RED < 1.00 are considered good solvents. However, green solvents with a RED > 1.00 are considered bad solvents [39,40]. According to the HSP sphere and recorded RED values, the green solvents of 1-BuOH 2-BuOH, DMSO, THP, PEG-400, and EA were considered good solvents. However, the green solvents of water, MeOH, EtOH, EG, and PG were considered bad solvents. According to Greenhalgh’s principle, if ∆δ is < 7.0 MPa1/2, the solubility of the solute in the specific solvent will be higher. The insolubility of the solute is indicated by the value of ∆δ > 10.0 MPa1/2 [41]. Water had the greatest Δδ value (∆δ = 28.50 MPa1/2), suggesting that the ITN was completely insoluble in it. However, the Δδ value was determined to be within the specified range in EtOH (∆δ = 6.10 MPa1/2), 1-BuOH (Δδ = 3.60 MPa1/2), 2-BuOH (Δδ = 3.50 MPa1/2), DMSO (Δδ = 4.30 MPa1/2), THP (Δδ = 2.10 MPa1/2), PEG-400 (Δδ = 0.40 MPa1/2), and EA (Δδ = 1.20 MPa1/2), suggesting that ITN is completely soluble in all these green solvents, in accord with this principle [41].

3.4. Assessment of Solute–Solvent Interactions

Table 1 shows the xidl data for ITN at five distinct temperatures. At 298.2–318.2 K, the xidl values for ITN were recorded as 4.28 × 10⁻¹ to 4.88 × 10⁻². For ITN, it was discovered that the xidl values were considerably higher than the xe values in water (p < 0.05). On the other hand, it was discovered that ITN’s xidl values were rather near to its xe values in DMSO. These results demonstrated that DMSO was suitable for ITN solubility. Table 3 provides the γi values for ITN in eleven distinct green solvents at various temperatures. The γi values for ITN were discovered to be significantly higher in water compared to the green solvents. The γi values of ITN in eleven different green solvents considerably decreased with an increase in temperature (p < 0.05). The lowest γi values for ITN were discovered in DMSO. Based on these outcomes, ITN–DMSO was found to have the highest solute–solvent interactions when compared to other ITN–solvent combinations.

3.5. ITN Solubility Correlation Using Computational Models

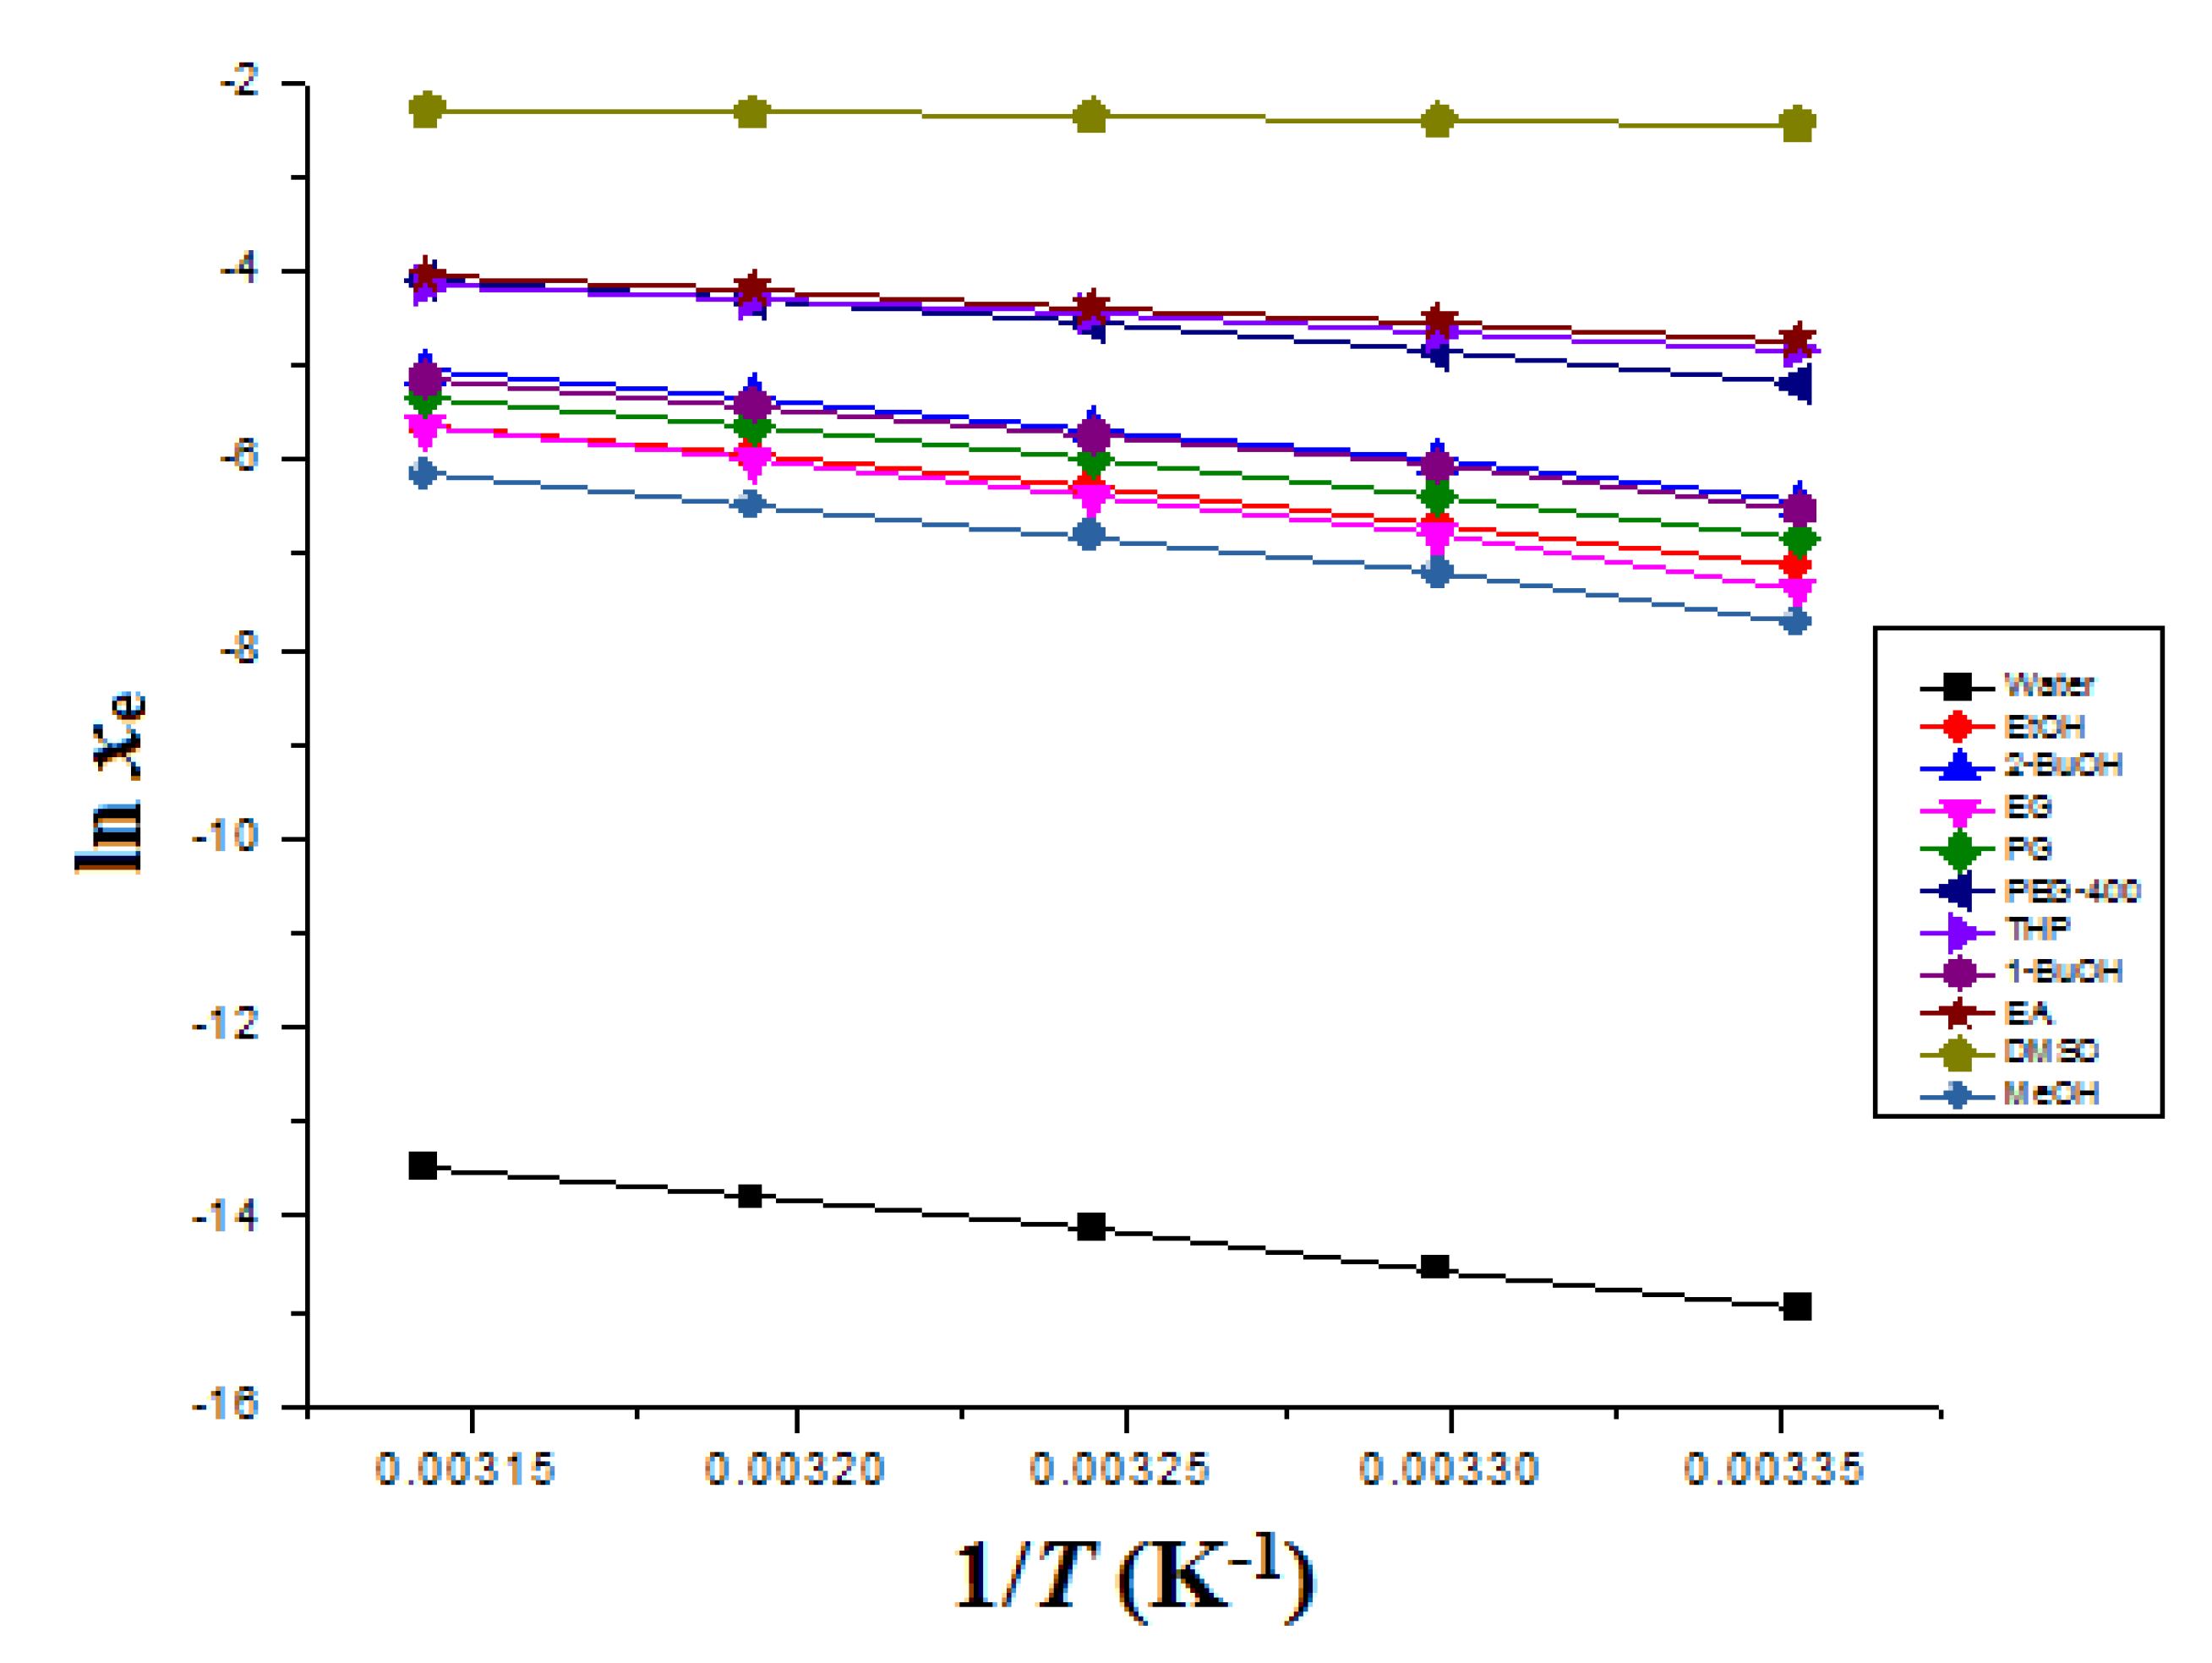
The computational approaches used for correlation were the “van’t Hoff, Apelblat, and Buchowski–Ksiazaczak λh models” [31,47,48,49,50,51]. As a function of 1/T, Figure 7 displays the data for the graphical comparison between the xe and xApl values of ITN in eleven distinct green solvents. This comparison indicated a high correlation between the xe and xApl data of ITN in these eleven distinct green solvents. Table 4 provides an illustration of the results of the Apelblat model correlation. ITN’s overall RMSD was discovered to be 2.00%. R2 values ranged from 0.9984 to 0.9999 for ITN in eleven distinct environmentally friendly solvents. The observed solubility data for ITN in eleven distinct green solvents were found to be strongly correlated with the Apelblat model, as evidenced by the low RMSD and high R2 values.
The graph in Figure S1 compares the xe and xvan’t values of ITN in eleven distinct green solvents as a function of 1/T and also shows a strong correlation between the two sets of data for ITN across all green solvents. Table 5 illustrates the findings of the “van’t Hoff model” analysis for ITN in eleven distinct environmentally friendly solvents. ITN was found to have an overall RMSD of 3.56% in eleven distinct green solvents. R2 values ranged from 0.9919 to 0.9999 for ITN in eleven distinct environmentally friendly solvents. The observed solubility data of ITN in eleven distinct green solvents were again shown to be well correlated with the “van’t Hoff model” by the low RMSD and high R2 values.
The results of the “Buchowski-Ksiazaczak λh” computation for ITN in eleven distinct environmentally friendly solvents are shown in Table 6. The overall RMSD for ITN was computed to be 4.41% in eleven distinct environmentally friendly solvents. The low RMSD values once more showed that the “Buchowski-Ksiazaczak λh model” and the measured solubility data of ITN in eleven distinct green solvents correlated very well. Finally, the solubility correlation of ITN showed good performance from all three computational approaches.

3.6. Apparent Thermodynamic Analysis

The van’t Hoff plots, shown in Figure 2, were used to determine the ΔsolH0 values for ITN in eleven distinct environmentally friendly solvents. Table 7 presents the findings of an apparent thermodynamic analysis of ITN in eleven distinct environmentally friendly solvents. The ITN ΔsolH0 values were determined to be positive values between 6.382 and 66.90 kJ mol−1 in eleven distinct green solvents. It was also discovered that the ITX ΔsolG0 values in eleven distinct environmentally friendly solvents were positive and ranged from 6.071 to 36.33 kJ mol−1. As a result of the ITN measured solubility being maximum in DMSO and minimum in water, respectively, it was found that the ITN ΔsolG0 values were minimal in DMSO and greatest in water. ITN dissolution was endothermic in all of the green solvents tested, according to the positive values of ΔsolH0 for ITN [56,57]. ITN ΔsolS0 values were similarly found to be positive and ranged from 1.009 to 163.8 J mol−1 K−1 in eleven distinct green solvents, indicating an entropy-driven ITN dissolution across the board [56]. The ITN dissolution was proposed as an endothermic and entropy-driven process in all green solvents evaluated based on the positive values of ΔsolH and ΔsolS0 [56,57].

4. Conclusions

We reported on the solubility information, HSPs, and thermodynamic quantities of ITN in eleven distinct environmentally friendly solvents. The solid-state form of ITN was confirmed by the DSC, FTIR, and XRD investigations, which showed no change in ITN after equilibrium. The “van’t Hoff, Apelblat, and Buchowski-Ksiazczak λh models” found that the findings on ITN solubility were substantially associated. ITN became more soluble in each of the tested green solvents with an increase in temperature. ITN was soluble in eleven distinct environmentally friendly solvents in the following order: DMSO > EA > PEG-400 > THP > 2-BuOH > 1-BuOH > PG > EtOH > EG > MeOH > water at 318.2 K. The results of the activity coefficients showed that ITN–DMSO had the greatest molecular interactions when compared to other combinations of ITN and green solvents. Analyses of the apparent thermodynamic data revealed an “endothermic and entropy-driven dissolution” of ITN in all the green solvents tested. DMSO is recommended as the best green solvent for the solubilization of ITN based on all these results and discoveries. As a result, pre-formulation research and the design of ITN dosage forms can use DMSO as a viable green solvent.

Supplementary Materials

The following supporting information can be downloaded at: https://www.mdpi.com/article/10.3390/ma15228274/s1, Figure S1: Correlation of measured solubility data of ITN with “van’t Hoff model” in eleven different green solvents as a function of 1/T; symbols represent the experimental solubility data of ITN and the solid lines represent the solubility data of ITN calculated by “van’t Hoff model”; Table S1: The specifications of materials.

Author Contributions

Conceptualization, F.S. and A.A.; methodology, N.H., S.A. and W.A.M.; software, I.A.A.; validation, W.A.M., S.A. and A.A.; formal analysis, M.A.; investigation, N.H. and F.S.; resources, W.A.M.; data curation, M.A.; writing—original draft preparation, F.S.; writing—review and editing, W.A.M., A.A. and S.A.; visualization, W.A.M.; supervision, F.S.; project administration, F.S.; funding acquisition, W.A.M. All authors have read and agreed to the published version of the manuscript.

Funding

This research project was supported by the Deputyship for Research & Innovation, “Ministry of Education” in Saudi Arabia through the project number IFKSURG-2-494 and APC was supported by the IFKSURG.

Institutional Review Board Statement

Not applicable.

Informed Consent Statement

Not applicable.

Data Availability Statement

This study did not report any data.

Acknowledgments

The authors extend their appreciation to the Deputyship for Research & Innovation, “Ministry of Education” in Saudi Arabia for funding this research work through project number IFKSURG-2-494.

Conflicts of Interest

The authors declare no conflict of interest.

References

  1. Berbenni, V.; Marini, A.; Bruni, G.; Cardini, A. Thermoanalytical and spectroscopic characterization of solid-state retinoic acid. Int. J. Pharm. 2001, 221, 123–141. [Google Scholar] [CrossRef]
  2. Ascenso, A.; Guedes, R.; Bernardino, R.; Diogo, H.; Carvalho, F.A.; Santos, N.C.; Silva, A.M.; Marques, H.C. Complexation and full characterization of the tretinoin and dimethyl-βeta-cyclodextrin complex. Aaps Pharmscitech 2011, 12, 553–563. [Google Scholar] [CrossRef] [PubMed]
  3. Ghorab, M.M.; Babiker, M.E. Formulation and in-vitro evaluation of isotretinoin tablets. J. Chem. Pharm. Res. 2012, 4, 2817–2831. [Google Scholar]
  4. Muccio, D.D.; Brouillette, W.J.; Alam, M.; Vaezi, M.F.; Sani, B.P.; Venepally, P.; Reddy, L.; Li, E.; Norris, A.W.; Simpson-Herren, L.; et al. Conformationally defined 6-s-trans-retinoic acid analogs. 3. Structure–activity relationships for nuclear receptor binding, transcriptional activity, and cancer chemopreventive activity. J. Med. Chem. 1996, 39, 3625–3635. [Google Scholar] [CrossRef] [PubMed]
  5. Muccio, D.D.; Brouillette, W.J.; Breritman, T.R.; Taimi, M.; Emanuel, P.D.; Zhang, X.; Chen, G.; Sani, B.P.; Venepally, P.; Reddy, L.; et al. Conformationally defined retinoic acid analogues. 4. Potential new agents for acute promyelocytic and juvenile myelomonocytic leukemias. J. Med. Chem. 1998, 41, 1679–1687. [Google Scholar] [CrossRef] [PubMed]
  6. Levin, A.H.; Bos, M.E.; Zusi, F.C.; Nair, X.; Whiting, G.; Bouquin, P.; Tetrault, G.; Carrol, F.I. Evaluation of retinoids as therapeutic agents in dermatology. Pharm. Res. 1994, 11, 192–200. [Google Scholar]
  7. Anadolu, R.Y.; Sen, T.; Tarimci, N.; Birol, A.; Erdem, C. Improved efficacy and tolerability of retinoic acid in acne vulgaris: A new topical formulation with cyclodextrin complex psi. Eur. J. Acad. Dermatol. Venereol. 2004, 18, 416–421. [Google Scholar] [CrossRef]
  8. Loveday, S.M.; Singh, H. Recent advances in technologies for vitamin A protection in foods. Trends Food Sci. Technol. 2008, 19, 657–668. [Google Scholar] [CrossRef]
  9. Gollnick, H.; Zouboulis, C.C. Not all acne is acne vulgaris. Dtsch. Aerztebl. Int. 2014, 111, 301–312. [Google Scholar] [CrossRef]
  10. Espinosa, N.I.; Cohen, P.R. Acne vulgaris: A patient and physician’s experience. Dermatol. Ther. 2020, 10, 1–14. [Google Scholar] [CrossRef]
  11. Fallah, H.; Rademaker, M. Isotretenoin for acne vulgaris—An update on adverse effects and laboratory monitoring. J. Dermatol. Treat. 2022, 33, 2414–2424. [Google Scholar] [CrossRef]
  12. Alwhaibi, A.; Alenazi, M.; Almadi, B.; Alotaibi, A.; Alshehri, S.M.; Shakeel, F. A practical method for oral administration of pediatric oncology patient: A case study of neuroblastoma. J. Oncol. Pharm. Pract. 2022. [Google Scholar] [CrossRef]
  13. Tan, X.; Meltzer, N.; Lindebaum, S. Solid-state stability studies of 13-cis-retinoic acid and all-trans-retinoic acid using microcalorimetry and HPLC analysis. Pharm. Res. 1992, 9, 1203–1208. [Google Scholar] [CrossRef]
  14. Yap, K.L.; Liu, X.; Thenmozhiyal, J.C.; Ho, P.C. Characterization of the 13-cis-retinoic acid/cyclodextrin inclusion complexes by phase solubility, photostability, physicochemical and computational analysis. Eur. J. Pharm. Sci. 2005, 25, 49–56. [Google Scholar] [CrossRef]
  15. Dadmand, S.; Kamari, F.; Acree, W.E., Jr.; Jouyban, A. Solubility prediction of drugs in binary solvent mixtures at various temperatures using a minimum number of experimental data points. AAPS PharmSciTech. 2019, 20, E10. [Google Scholar] [CrossRef]
  16. Razaei, H.; Rahimpour, E.; Zhao, H.; Martinez, F.; Barzegar-Jalali, M.; Jouyban, A. Solubility of baclofen in some neat and mixed solvents at different temperatures. J. Mol. Liq. 2022, 347, E118352. [Google Scholar] [CrossRef]
  17. Shakeel, F.; Haq, N.; Alsarra, I.A. Equilibrium solubility determination, Hansen solubility parameters and solution thermodynamics of cabozantinib malate in different monosolvents of pharmaceutical importance. J. Mol. Liq. 2021, 324, E115146. [Google Scholar] [CrossRef]
  18. Ahad, A.; Shakeel, F.; Raish, M.; Ahmad, A.; Jardan, Y.A.B.; Al-Jenoobi, F.I.; Al-Mohizea, A.M. Thermodynamic solubility profile of temozolomide in different commonly used pharmaceutical solvents. Molecules 2022, 27, 1437. [Google Scholar] [CrossRef]
  19. Guimarãesa, C.A.; Mena, F.; Mena, B.; Quenca-Guillena, J.S.; Matos, J.D.R.; Mercuri, L.P.; Braz, A.B.; Rossetti, F.C.; Kedor-Hackmann, E.R.M.; Santoro, M.I.R.M. Comparative physical–chemical characterization of encapsulated lipid-based isotretinoin products assessed by particle size distribution and thermal behavior analyses. Thermochim. Acta 2010, 505, 73–78. [Google Scholar] [CrossRef]
  20. Patel, M.R.; Patel, R.B.; Parikh, J.R.; Patel, B.G. HPTLC method for estimation of isotretinoin in topical formulations, equilibrium solubility screening, and in vitro permeation study. J. Liq. Chromatogr. Relat. Technol. 2011, 34, 1783–1799. [Google Scholar] [CrossRef]
  21. Patel, M.R.; Patel, R.B.; Parikh, J.R.; Patel, B.G. Improving the isotretinoin photostability by incorporating in microemulsion matrix. ISRN Pharm. 2011, 2011, E838016. [Google Scholar] [CrossRef] [PubMed]
  22. Patel, M.R.; Patel, R.B.; Parikh, J.R.; Patel, B.G. Novel isotretinoin microemulsion-based gel for targeted topical therapy of acne: Formulation consideration, skin retention and skin irritation studies. Appl. Nanosci. 2016, 6, 539–553. [Google Scholar] [CrossRef]
  23. Chavda, H.; Patel, J.; Chavada, D.; Dave, S.; Patel, A.; Patel, C. Self-nanoemulsifying powder of isotretinoin: Preparation and characterization. J. Powder Technol. 2013, 2013, E108569. [Google Scholar] [CrossRef]
  24. Hosny, K.M.; Al Nahyah, K.S.; Alhakamy, N.A. Self-nanoemulsion loaded with a combination of isotretinoin, an antiacne drug, and quercetin: Preparation, optimization, and in vivo assessment. Pharmaceutics 2021, 13, E46. [Google Scholar]
  25. Alqarni, M.H.; Haq, N.; Alam, P.; Abdel-Kader, M.S.; Foudah, A.I.; Shakeel, F. Solubility data, Hansen solubility parameters and thermodynamic behavior of pterostilbene in some pure solvents and different (PEG-400 + water) cosolvent compositions. J. Mol. Liq. 2021, 331, E115700. [Google Scholar] [CrossRef]
  26. Ahad, A.; Shakeel, F.; Raish, M.; Al-Jenoobi, F.I.; Al-Mohizea, A.M. Solubility and thermodynamic analysis of antihypertensive agent nitrendipine in different pure solvents at the temperature range of 298.15 to 318.15 K. APPS PharmSciTech. 2017, 18, 2737–2743. [Google Scholar] [CrossRef]
  27. Higuchi, T.; Connors, K.A. Phase-solubility techniques. Adv. Anal. Chem. Instr. 1965, 4, 117–122. [Google Scholar]
  28. Ortiz, C.P.; Cardenas-Torres, R.E.; Martinez, F.; Delgado, D.R. Solubility of sulfamethazine in the binary mixture of acetonitrile + methanol from 278.15 to 318.15 K: Measurement, dissolution thermodynamics, preferential solvation, and correlation. Molecules 2021, 26, 7588. [Google Scholar] [CrossRef]
  29. Shen, J.; Liang, X.; Lei, H. Measurements, thermodynamic modeling, and a hydrogen bonding study on the solubilities of metoprolol succinate in organic solvents. Molecules 2018, 23, 2469. [Google Scholar] [CrossRef]
  30. Kitak, T.; Dumicic, A.; Planinsek, O.; Sibanc, R.; Srcic, S. Determination of solubility parameters of ibuprofen and ibuprofen lysinate. Molecules 2015, 20, 21549–21568. [Google Scholar] [CrossRef]
  31. Zhang, C.; Jouyban, A.; Zhao, H.; Farajtabar, A.; Acree, W.E., Jr. Equilibrium solubility, Hansen solubility parameter, dissolution thermodynamics, transfer property and preferential solvation of zonisamide in aqueous binary mixtures of ethanol, acetonitrile, isopropanol and N,N-dimethylformamide. J. Mol. Liq. 2021, 326, E115219. [Google Scholar] [CrossRef]
  32. He, H.; Wan, Y.; Sun, R.; Zhang, P.; Jiang, G.; Sha, J.; Li, Y.; Li, T.; Ren, B. Piperonylonitrile solubility in thirteen pure solvents: Correlation, Hansen solubility parameters solvent effect and thermodynamic analysis. J. Chem. Thermodyn. 2020, 150, E106191. [Google Scholar] [CrossRef]
  33. Van Krevelen, D.W.; te Nijenhuis, K. Properties of Polymers: Their Correlation with Chemical Structure, their Numerical Estimation and Prediction from Additive Group Contributions; Elsevier: Amsterdam The Netherlands; Tokyo, Japan, 2009; p. 189. [Google Scholar]
  34. Güner, A. The algorithmic calculations of solubility parameter for the determination of interactions in dextran/certain polar solvent systems. Eur. Polym. J. 2004, 40, 1587–1594. [Google Scholar] [CrossRef]
  35. Mohammad, M.A.; Alhalaweh, A.; Velaga, S.P. Hansen solubility parameter as a tool to predict cocrystal formation. Int. J. Pharm. 2011, 407, 63–71. [Google Scholar] [CrossRef]
  36. Chen, J.; Zhao, H.; Farajtabar, A.; Zhu, P.; Jouyban, A.; Acree, W.E., Jr. Equilibrium solubility of amrinone in aqueous co-solvent solutions reconsidered: Quantitative molecular surface, inter/intra-molecular interactions and solvation thermodynamics analysis. J. Mol. Liq. 2022, 355, E118995. [Google Scholar] [CrossRef]
  37. Rios, M.D.D.I.; Ramos, E.H.; Canavaciolo, V.G.; Murillo, R.V.; Carrion, K.P.; de Cardenas, L.Z. Obtaining a fraction of sugarcane wax rich in policosanol by using ethanol as solvent: Results interpretation through Hansen’s solubility theory. ACS Omega 2022, 7, 27324–27333. [Google Scholar] [CrossRef]
  38. Benazzouz, A.; Moity, L.; Pierlot, C.; Sergent, M.; Molinier, V.; Aubry, J.-M. Selection of a greener set of solvents evenly spread in the Hansen space by space-filling design. Ind. Eng. Chem. Res. 2013, 52, 16585–16597. [Google Scholar] [CrossRef]
  39. Rios, M.D.D.I.; Ramos, E.H. Determination of the Hansen solubility parameters and hansen sphere radius with the aid of the solver add-in of microsoft excel. SN Appl. Sci. 2020, 2, E676. [Google Scholar] [CrossRef]
  40. Gharagheizi, F. New procedure to calculate the Hansen solubility parameters of polymers. J. Appl. Polym. Sci. 2007, 103, 31–36. [Google Scholar] [CrossRef]
  41. Greenhalgh, D.J.; Williams, A.C.; Timmins, P.; York, P. Solubility parameters as predictors of miscibility in solid dispersions. J. Pharm. Sci. 1999, 88, 1182–1190. [Google Scholar] [CrossRef]
  42. Tinjaca, D.A.; Martinez, F.; Almanza, O.A.; Jouyban, A.; Acree, W.E. Solubility, correlation, dissolution thermodynamics and preferential solvation of meloxicam in aqueous mixtures of 2-propanol. Pharm. Sci. 2022, 28, 130–144. [Google Scholar] [CrossRef]
  43. Hildebrand, J.H.; Prausnitz, J.M.; Scott, R.L. Regular and Related Solutions; Van Nostrand Reinhold: New York, NY, USA, 1970. [Google Scholar]
  44. Manrique, Y.J.; Pacheco, D.P.; Martínez, F. Thermodynamics of mixing and solvation of ibuprofen and naproxen in propylene glycol + water cosolvent mixtures. J. Sol. Chem. 2008, 37, 165–181. [Google Scholar] [CrossRef]
  45. Zhang, Y.; Shi, X.; Yu, Y.; Zhao, S.; Song, H.; Chen, A.; Shang, Z. Preparation and characterization of vanillin cross-linked chitosan microspheres of pterostilbene. Int. J. Polym. Anal. Charact. 2014, 19, 83–93. [Google Scholar] [CrossRef]
  46. Mohammadian, E.; Rahimpour, E.; Martinez, F.; Jouyban, A. Budesonide solubility in polyethylene glycol 400 + water at different temperatures: Experimental measurement and mathematical modelling. J. Mol. Liq. 2019, 274, 418–425. [Google Scholar] [CrossRef]
  47. Apelblat, A.; Manzurola, E. Solubilities of o-acetylsalicylic, 4-aminosalicylic, 3,5-dinitrosalicylic and p-toluic acid and magnesium-DL-aspartate in water from T = (278–348) K. J. Chem. Thermodyn. 1999, 31, 85–91. [Google Scholar] [CrossRef]
  48. Manzurola, E.; Apelblat, A. Solubilities of L-glutamic acid, 3-nitrobenzoic acid, acetylsalicylic, p-toluic acid, calcium-L-lactate, calcium gluconate, magnesium-DL-aspartate, and magnesium-L-lactate in water. J. Chem. Thermodyn. 2002, 34, 1127–1136. [Google Scholar] [CrossRef]
  49. Ksiazczak, A.; Moorthi, K.; Nagata, I. Solid-solid transition and solubility of even n-alkanes. Fluid Phase Equilib. 1994, 95, 15–29. [Google Scholar] [CrossRef]
  50. Tong, Y.; Wang, Z.; Yang, E.; Pan, B.; Jiang, J.; Dang, P.; Wei, H. Determination and correlation of solubility and solution thermodynamics of ethenzamide in different pure solvents. Fluid Phase Equilib. 2016, 427, 549–556. [Google Scholar] [CrossRef]
  51. Alyamani, M.; Alshehri, S.; Alam, P.; Wani, S.U.D.; Ghoneim, M.M.; Shakeel, F. Solubility and solution thermodynamics of raloxifene hydrochloride in various (DMSO + water) compositions. Alex. Eng. J. 2022, 61, 9119–9128. [Google Scholar] [CrossRef]
  52. Shakeel, F.; Alshehri, S. Solubilization, Hansen solubility parameters, solution thermodynamics and solvation behavior of flufenamic acid in (Carbitol + water) mixtures. Processes 2020, 8, 1224. [Google Scholar] [CrossRef]
  53. Krug, R.R.; Hunter, W.G.; Grieger, R.S. Enthalpy-entropy compensation. 2. Separation of the chemical from the statistic effect. J. Phys. Chem. 1976, 80, 2341–2351. [Google Scholar] [CrossRef]
  54. Holguín, A.R.; Rodríguez, G.A.; Cristancho, D.M.; Delgado, D.R.; Martínez, F. Solution thermodynamics of indomethacin in propylene glycol + water mixtures. Fluid Phase Equilib. 2012, 314, 134–139. [Google Scholar] [CrossRef]
  55. Shakeel, F.; Haq, N.; Radwan, A.A.; Alanazi, F.K.; Alsarra, I.A. Solubility and thermodynamic analysis of N′-(1-(N-(methyl)benzylaminomethyl)-2-oxoindolin-3-ylidene)-2-(benzyloxy) benzohydrazide in different neat solvents at different temperatures. J. Mol. Liq. 2016, 220, 108–112. [Google Scholar] [CrossRef]
  56. Haq, N.; Alghaith, A.F.; Alshehri, S.; Shakeel, F. Solubility and thermodynamic data of febuxostat in various mono solvents at different temperatures. Molecules 2022, 27, 4043. [Google Scholar] [CrossRef]
  57. Shakeel, F.; Haq, N.; Alsarra, I.; Alshehri, S. Solubility data, solubility parameters and thermodynamic behavior of an antiviral drug emtricitabine in different pure solvents: Molecular understanding of solubility and dissolution. Molecules 2021, 26, 746. [Google Scholar] [CrossRef]
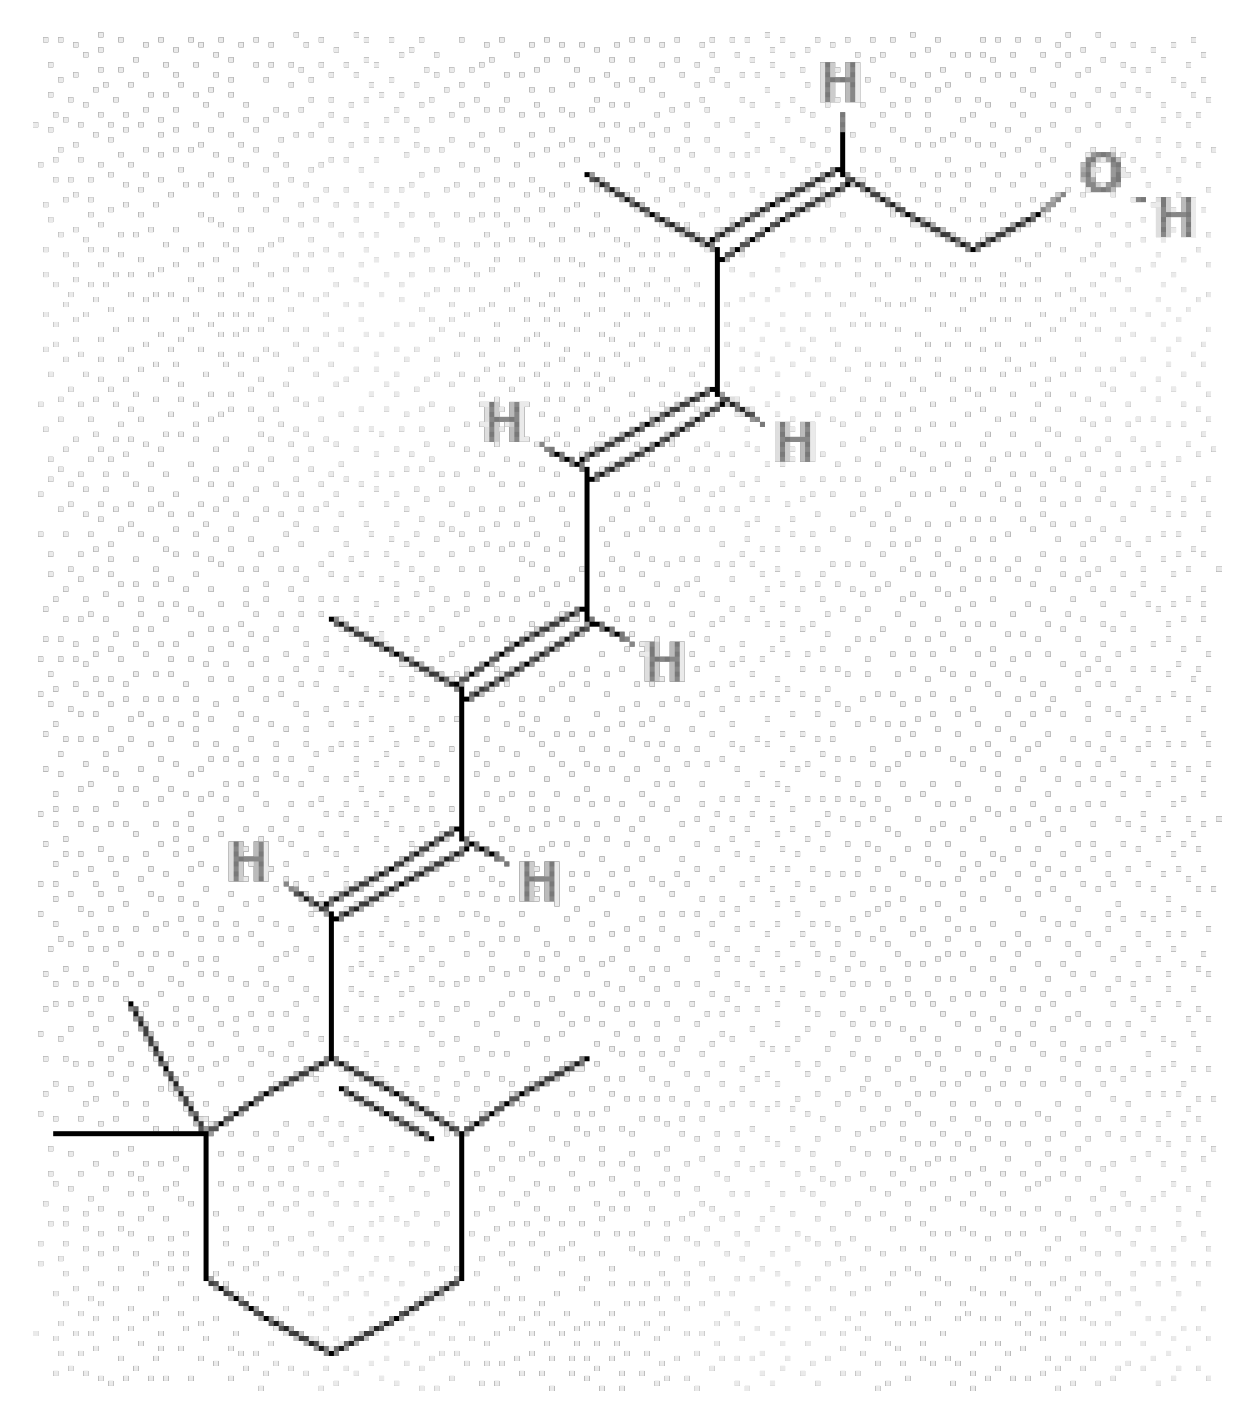
Figure 1. Chemical structure of isotretinoin (ITN).
Materials 15 08274 g001
Figure 2. van’t Hoff curves for ITN in eleven distinct green solvents.
Materials 15 08274 g002
Figure 3. Differential scanning calorimetry (DSC) spectrum of pure and equilibrated ITN recovered from MeOH.
Materials 15 08274 g003
Figure 4. Fourier transform infrared (FTIR) spectrum of (A) pure ITN and (B) equilibrated ITN obtained from MeOH.
Materials 15 08274 g004
Figure 5. X-ray diffraction (XRD) patterns of pure and equilibrated ITN obtained from MeOH.
Materials 15 08274 g005
Figure 6. HSP sphere generated using HSPiP program.
Materials 15 08274 g006
Figure 7. Experimental ITN solubility data in eleven distinct green solvents are correlated with the “Apelblat model” as a function of 1/T. Symbols indicate measured ITN solubility data, whereas solid lines indicate “Apelblat model” ITN solubility data.
Materials 15 08274 g007
Table 1. Measured solubility (xe) and ideal solubility (xidl) data of isotretinoin (ITN) in mole fraction in eleven different green solvents (GS) at 298.2–318.2 K and 101.1 kPa a.
GSxe
T = 298.2 KT = 303.2 KT = 308.2 KT = 313.2 KT = 318.2 K
Water3.16 × 10−74.80 × 10−77.20 × 10−71.02 × 10−61.38 × 10−6
MeOH4.45 × 10−47.45 × 10−41.09 × 10−31.54 × 10−32.10 × 10−3
EG6.27 × 10−41.11 × 10−31.65 × 10−32.47 × 10−33.49 × 10−3
EtOH8.06 × 10−41.24 × 10−31.83 × 10−32.59 × 10−33.51 × 10−3
PG1.07 × 10−31.71 × 10−32.52 × 10−33.53 × 10−34.88 × 10−3
1-BuOH1.46 × 10−32.33 × 10−33.19 × 10−34.42 × 10−35.88 × 10−3
2-BuOH1.56 × 10−32.46 × 10−33.44 × 10−34.83 × 10−36.32 × 10−3
PEG-4005.56 × 10−37.92 × 10−31.06 × 10−21.33 × 10−21.66 × 10−2
THP8.06 × 10−39.64 × 10−31.14 × 10−21.36 × 10−21.59 × 10−2
EA8.82 × 10−31.07 × 10−21.25 × 10−21.52 × 10−21.73 × 10−2
DMSO8.64 × 10−28.95 × 10−29.29 × 10−29.74 × 10−21.01 × 10−1
xidl4.28 × 10−14.43 × 10−14.58 × 10−14.73 × 10−14.88 × 10−1
a The relative uncertainties ur are ur(T) = 0.014, ur(p) = 0.003, and ur(xe) = 0.015.
Table 2. Several solubility parameters of ITN and eleven distinct green solvents at 298.2 K.
ComponentsHSPsRa */MPa1/2δδ/MPa1/2δ */MPa1/2RED (Ra/R0)
δd/MPa1/2δp/MPa1/2δh/MPa1/2δ/MPa1/2
ITN17.602.607.5019.30----
Water15.5016.0042.3047.8037.5237.3428.505.30
MeOH17.4010.6022.4030.3016.9116.9111.001.94
EG18.0011.1023.4031.6018.0418.0312.302.12
EtOH16.208.4017.6025.4011.9711.736.101.23
PG17.409.1021.7029.2015.6215.619.901.81
1-BuOH15.906.3015.2022.909.198.713.600.97
2-BuOH15.805.4012.4020.806.695.923.500.86
PEG-40014.607.509.4018.907.976.050.400.99
THP16.307.2011.9021.406.876.492.100.54
EA15.705.607.0018.104.863.581.200.97
DMSO17.4014.207.3023.6011.6011.604.300.99
* These numbers were computed between ITN and appropriate green solvent.
Table 3. Activity coefficients (γi) of ITN in eleven different green solvents at 298.2–318.2 K.
GSγi
T = 298.2 KT = 303.2 KT = 308.2 KT = 313.2 KT = 318.2 K
Water1,356,095923,995.2636,792.1464,426.5354,487.0
MeOH961.7445594.1927417.5994306.6269232.0172
EG682.7352397.7430277.6888191.4309139.6863
EtOH531.2276357.3747249.5203182.1199139.1357
PG399.4916257.8128181.3776133.9927101.0275
1-BuOH291.8713189.5621143.3259107.081983.05753
2-BuOH273.9716180.1061133.121197.8882077.29692
PEG-40077.0632655.9291242.9463535.3344029.40221
THP53.1525045.9715839.9206534.6699930.56384
EA48.5830341.2908636.6244831.1046128.22605
DMSO4.9578334.9522774.9301694.8600744.820541
Table 4. ITN Apelblat model results in terms of model parameters (A, B and C), R2, and root mean square deviation (RMSD) for eleven distinct green solvents.
GSABCR2Overall RMSD (%)
Water869.29−46,552−127.800.9996
MeOH1593.1−79,662−234.080.9992
EG1573.8−79,404−230.790.9990
EtOH956.05−50,146−139.530.9998
PG1209.3−61,839−177.050.9995
1-BuOH1229.9−62,257−180.370.99872.00
2-BuOH1302.4−65,672−191.070.9997
PEG-4001196.9−59,554−175.930.9989
THP36.256−4654.6−4.47030.9999
EA304.76−16,944−44.3480.9984
DMSO−112.624405.316.7430.9985
Table 5. ITN van’t Hoff model results in terms of model parameters (a and b), R2, and RMSD for eleven distinct green solvents.
GSabR2Overall RMSD (%)
Water8.6318−7030.10.9977
MeOH16.792−7290.00.9929
EG19.677−8047.20.9939
EtOH16.372−6997.20.9975
PG17.000−7094.90.9957
1-BuOH15.287−6488.50.99393.56
2-BuOH15.703−6574.90.9945
PEG-40012.166−5163.40.9919
THP6.1159−3261.40.9999
EA6.0950−3225.90.9972
DMSO0.11760−766.580.9952
Table 6. ITN “Buchowski-Ksiazaczak λh model” data for eleven distinct green solvents.
GSλhOverall RMSD (%)
Water8.897401192.10
MeOH0.31100023,440.5
EG0.9006008935.37
EtOH0.08490082,417.0
PG0.32790021,637.3
1-BuOH0.045800141,6704.41
2-BuOH0.13470048,959.9
PEG-4000.23950021,559.1
THP0.08840036,893.6
EA0.030900104,398
DMSO0.5758001331.34
Table 7. Apparent thermodynamic parameters (ΔsolH0, ΔsolG0, and ΔsolS0) along with R2 values for ITN in eleven distinct green solvents b.
GSΔsolH0/kJ mol−1ΔsolG0/kJ mol−1ΔsolS0/J mol−1 K−1R2
Water58.5236.3372.030.9976
MeOH60.6817.59139.80.9927
EG66.9016.50163.80.9937
EtOH58.2516.24136.30.9974
PG59.0615.44141.60.9966
1-BuOH54.0114.78127.30.9937
2-BuOH54.9014.61130.70.9944
PEG-40042.9811.76101.30.9917
THP27.1511.4450.970.9999
EA26.8511.2050.790.9972
DMSO6.3826.0711.0090.9954
b The relative uncertainties are usolH0) = 0.040, usolG0) = 0.048 and usolS0) = 0.050.
Publisher’s Note: MDPI stays neutral with regard to jurisdictional claims in published maps and institutional affiliations.