
Dynamic Response and Numerical Simulation of Closed-Cell Al Foams

Abstract
1. Introduction
2. Materials and Methods
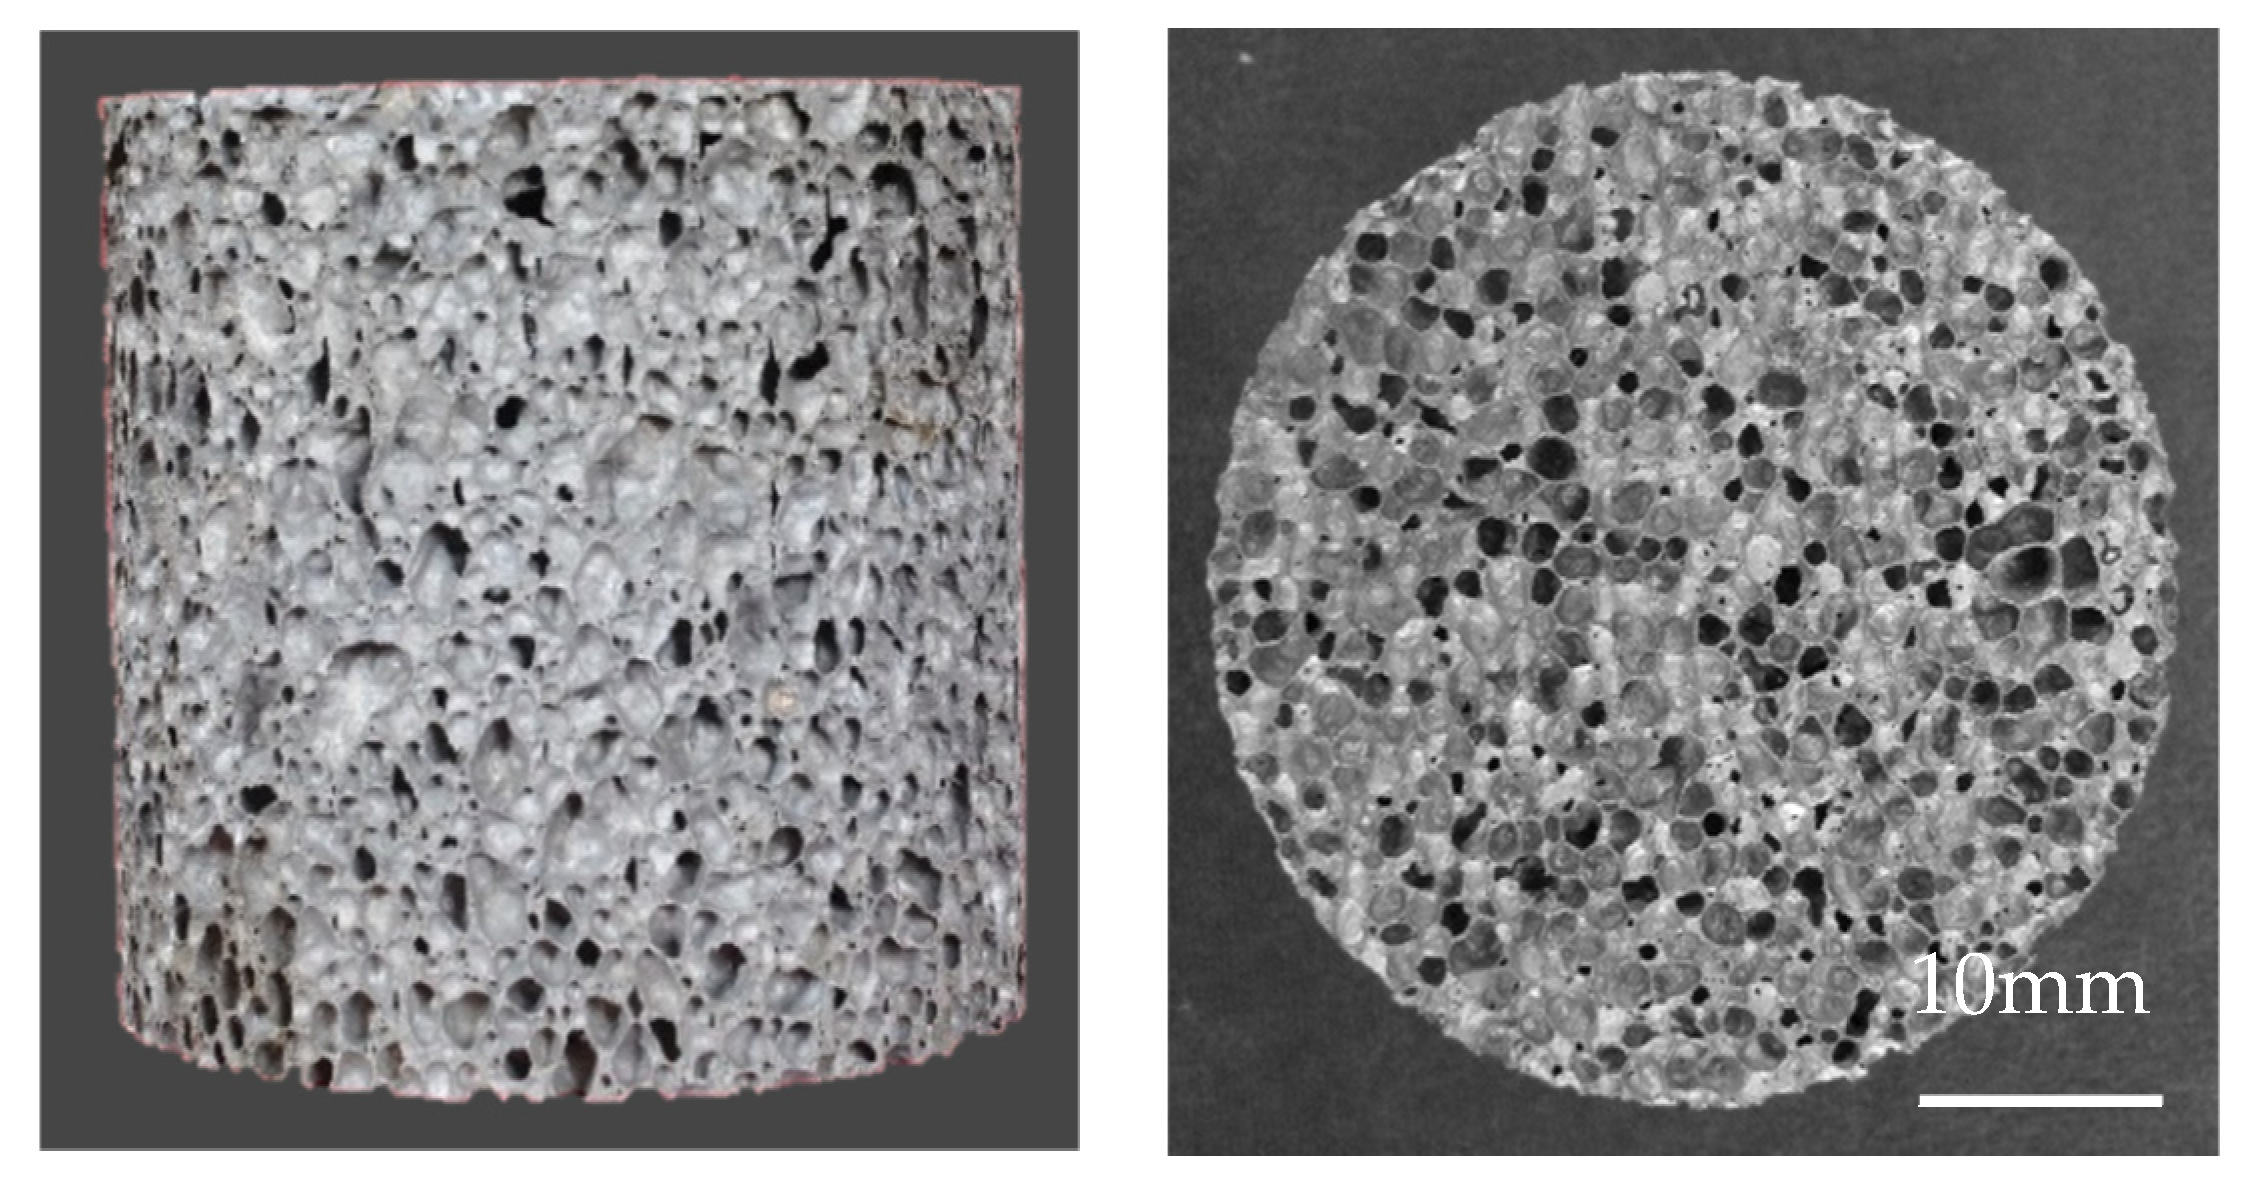
2.1. Materials and Specimens
2.2. Testing Method
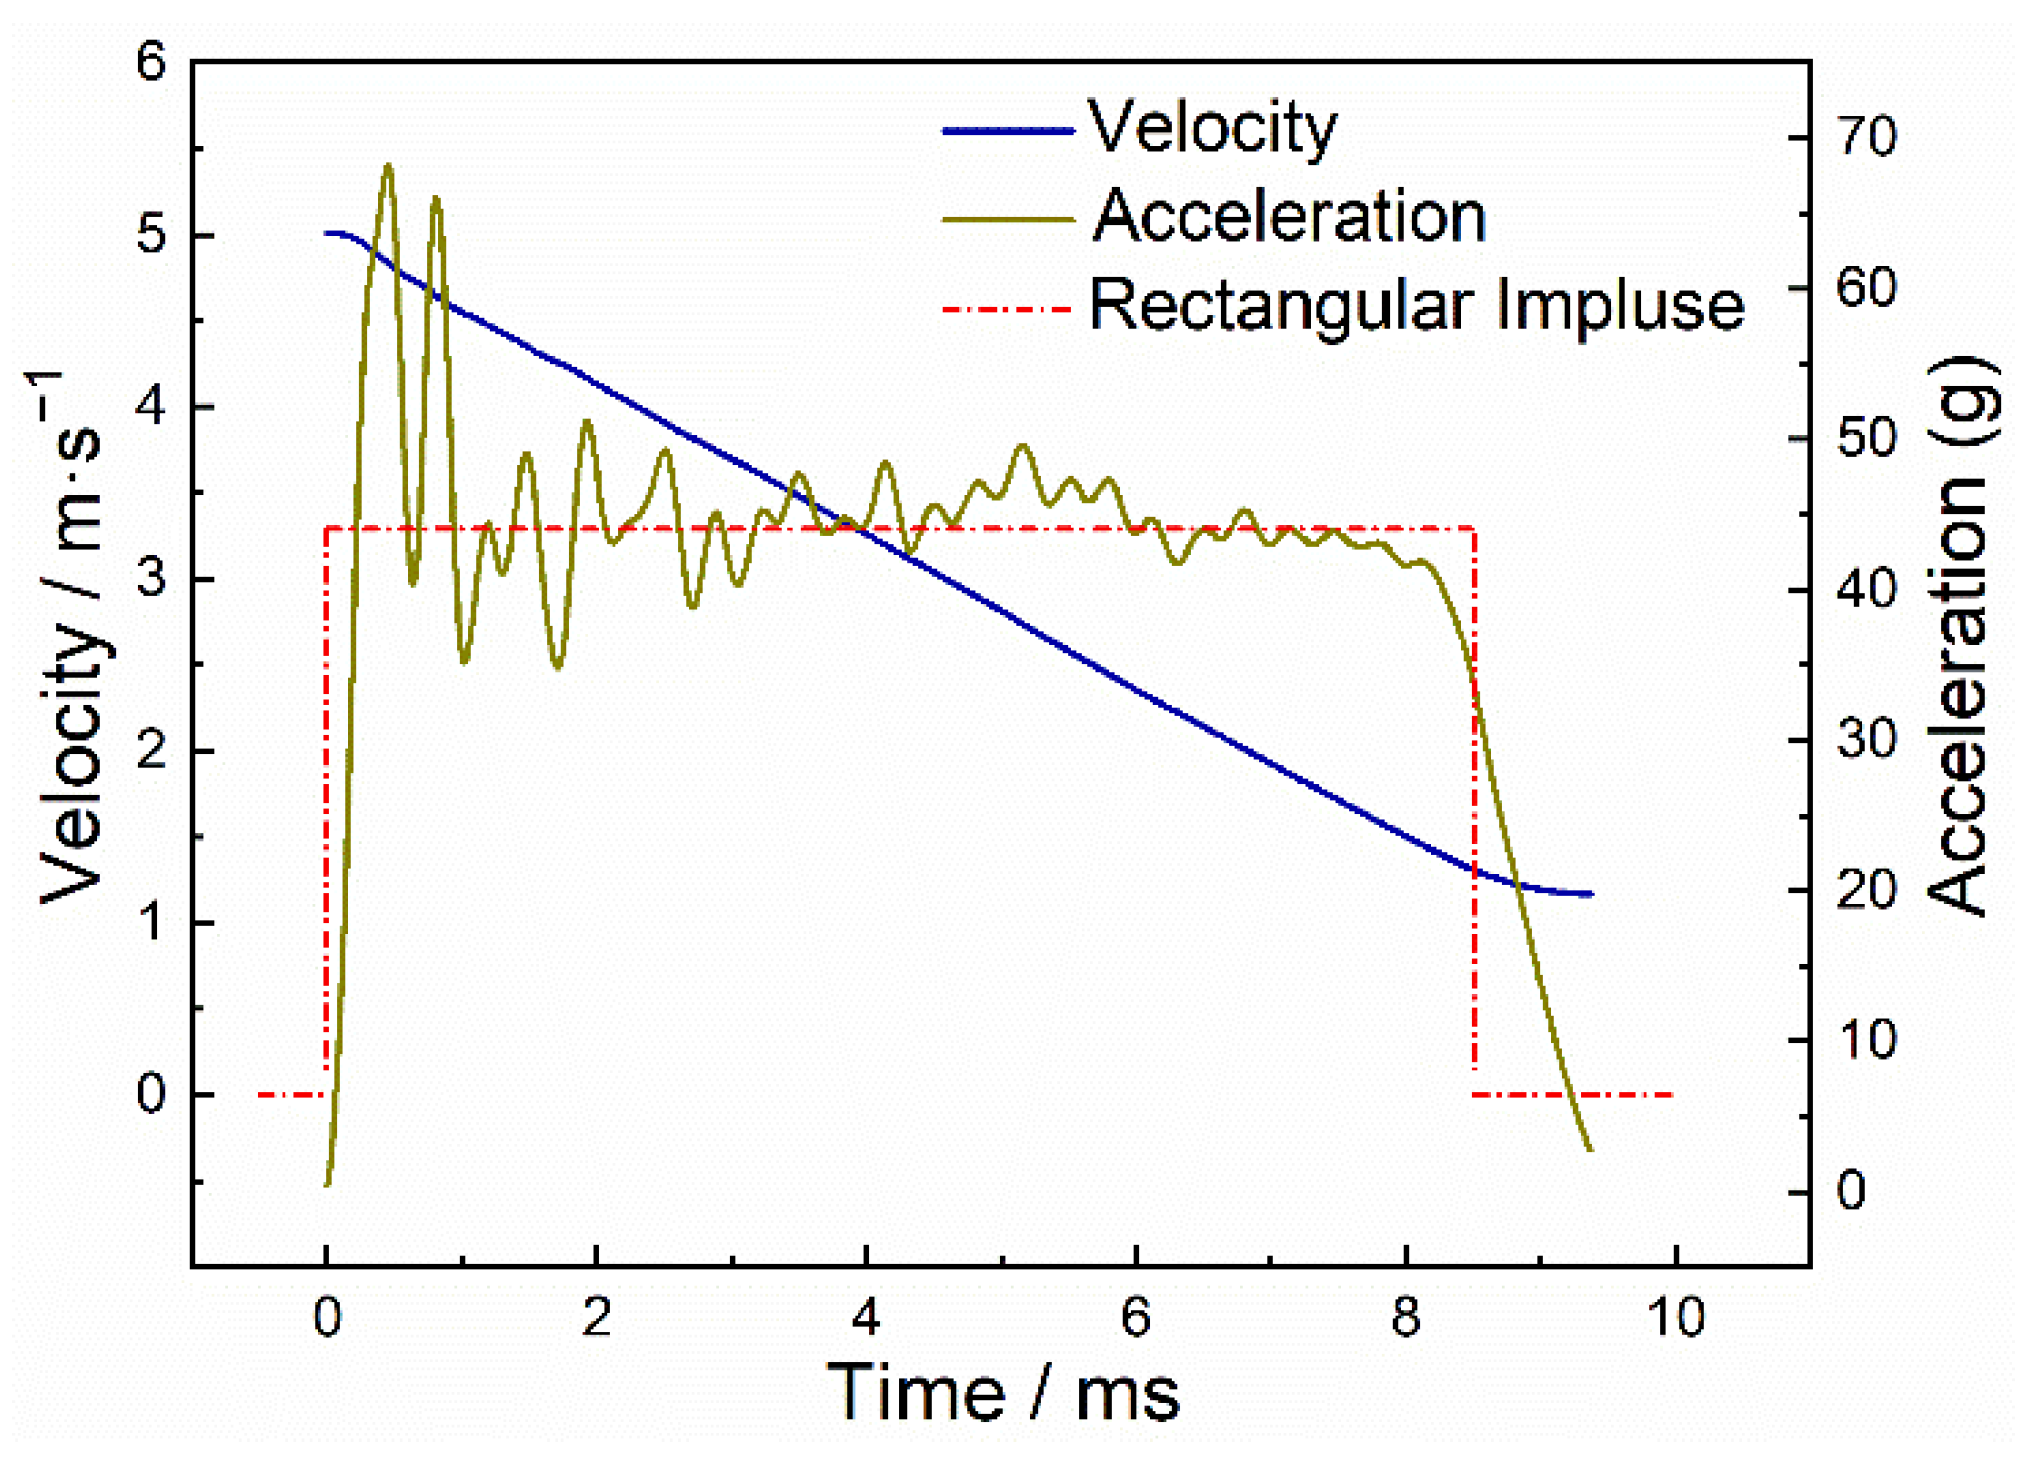
2.3. Experimental Principles and Data Processing
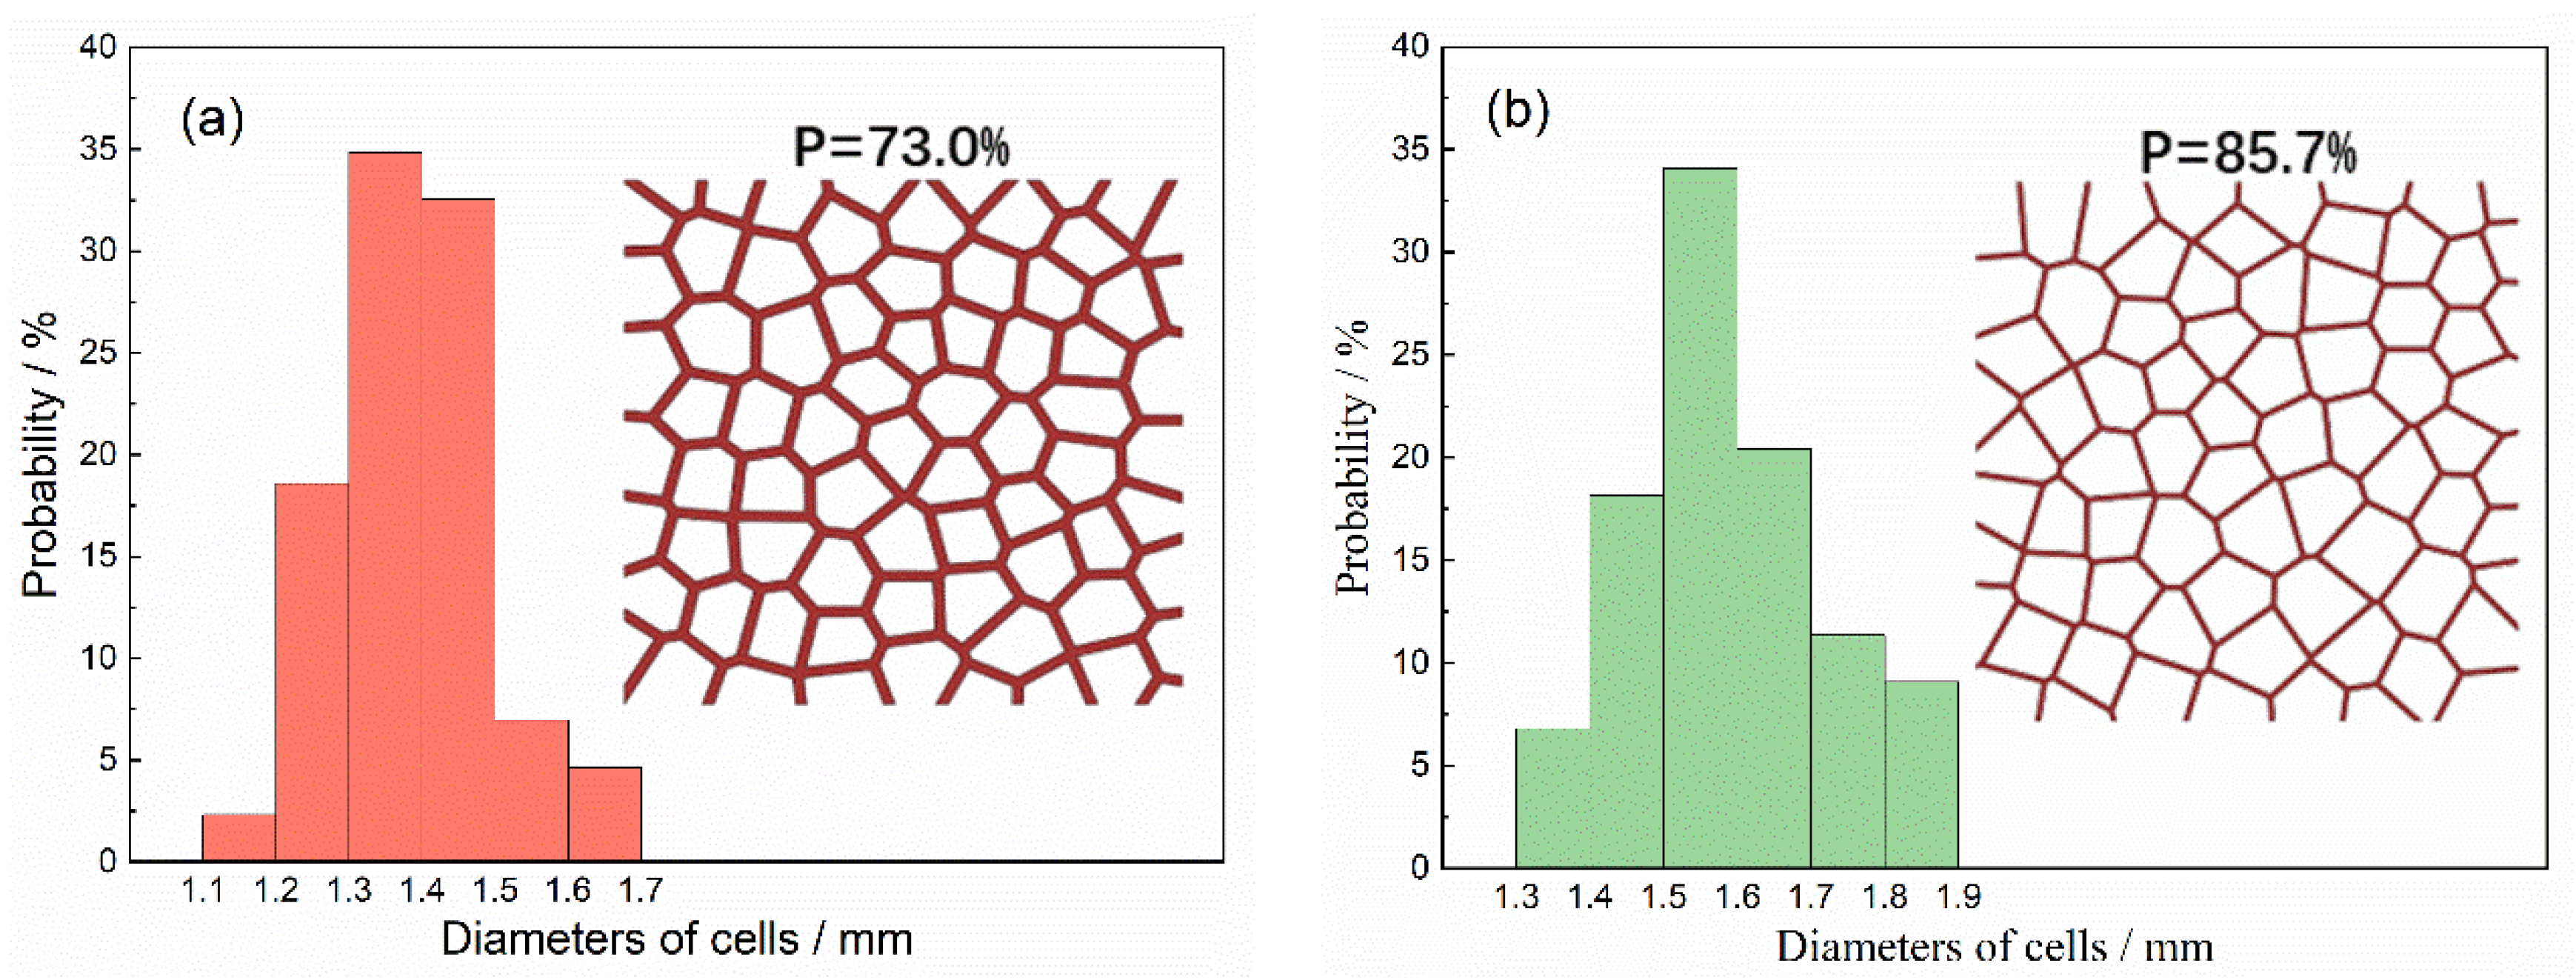
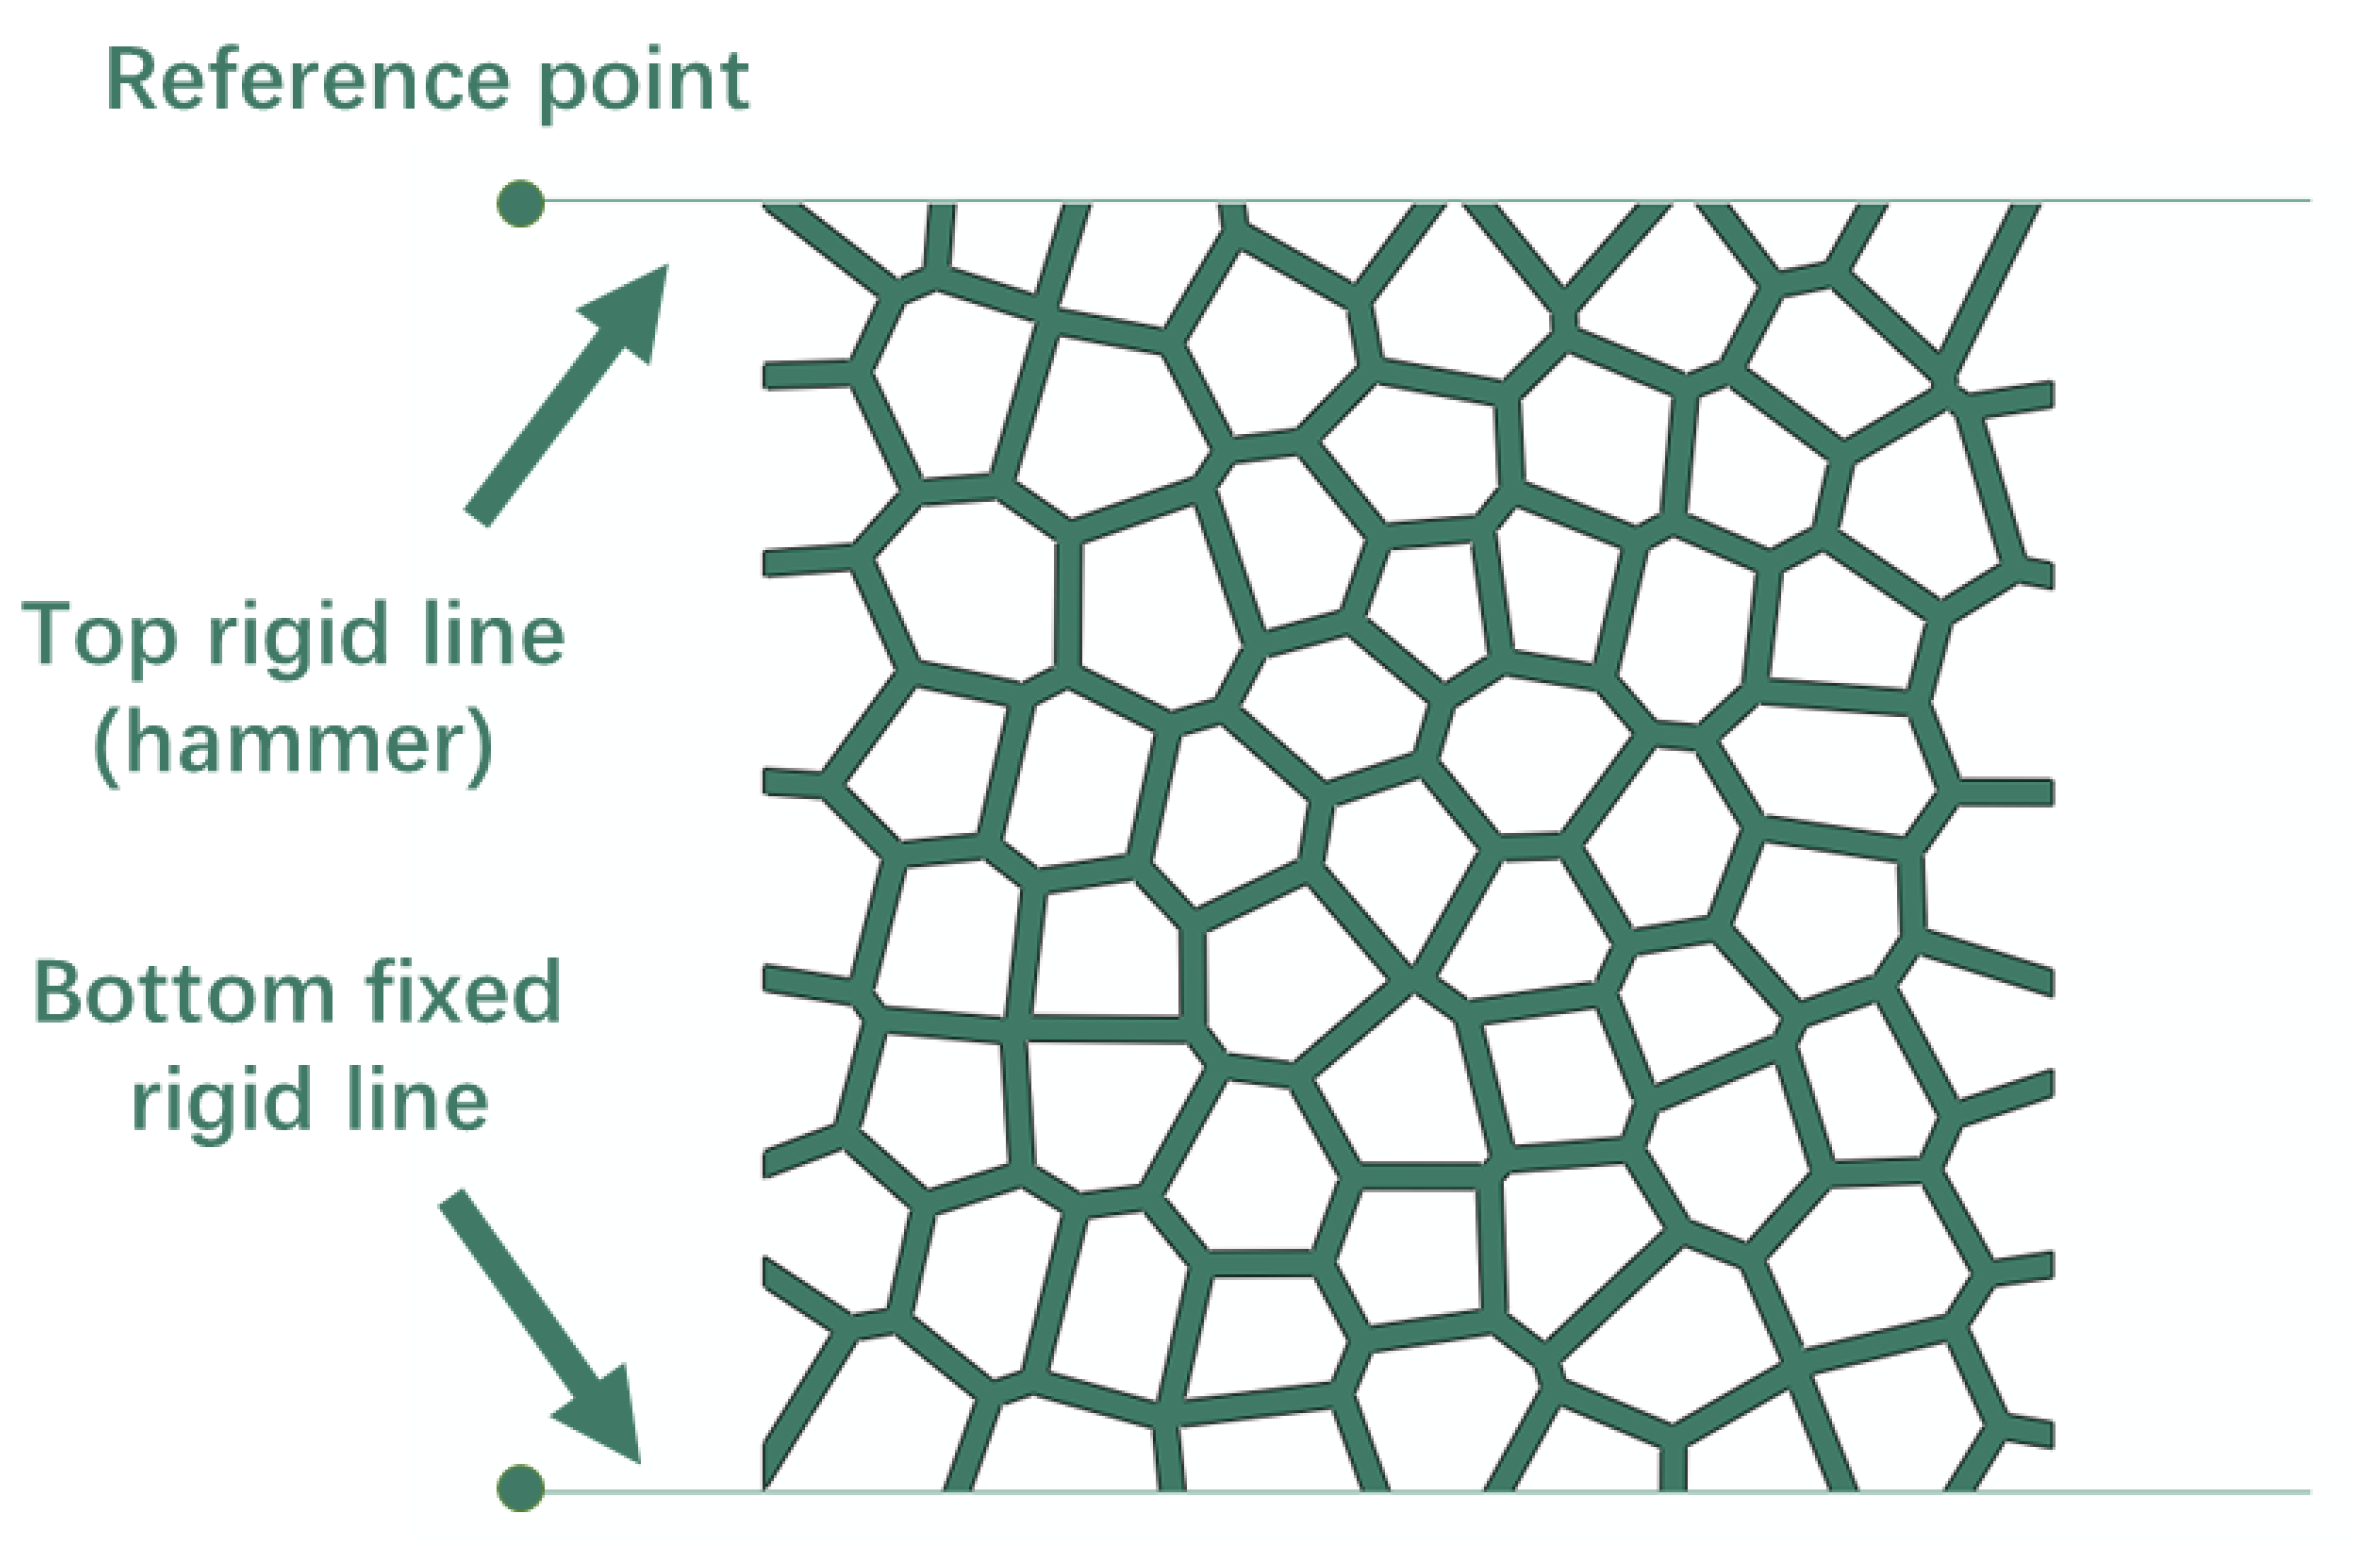
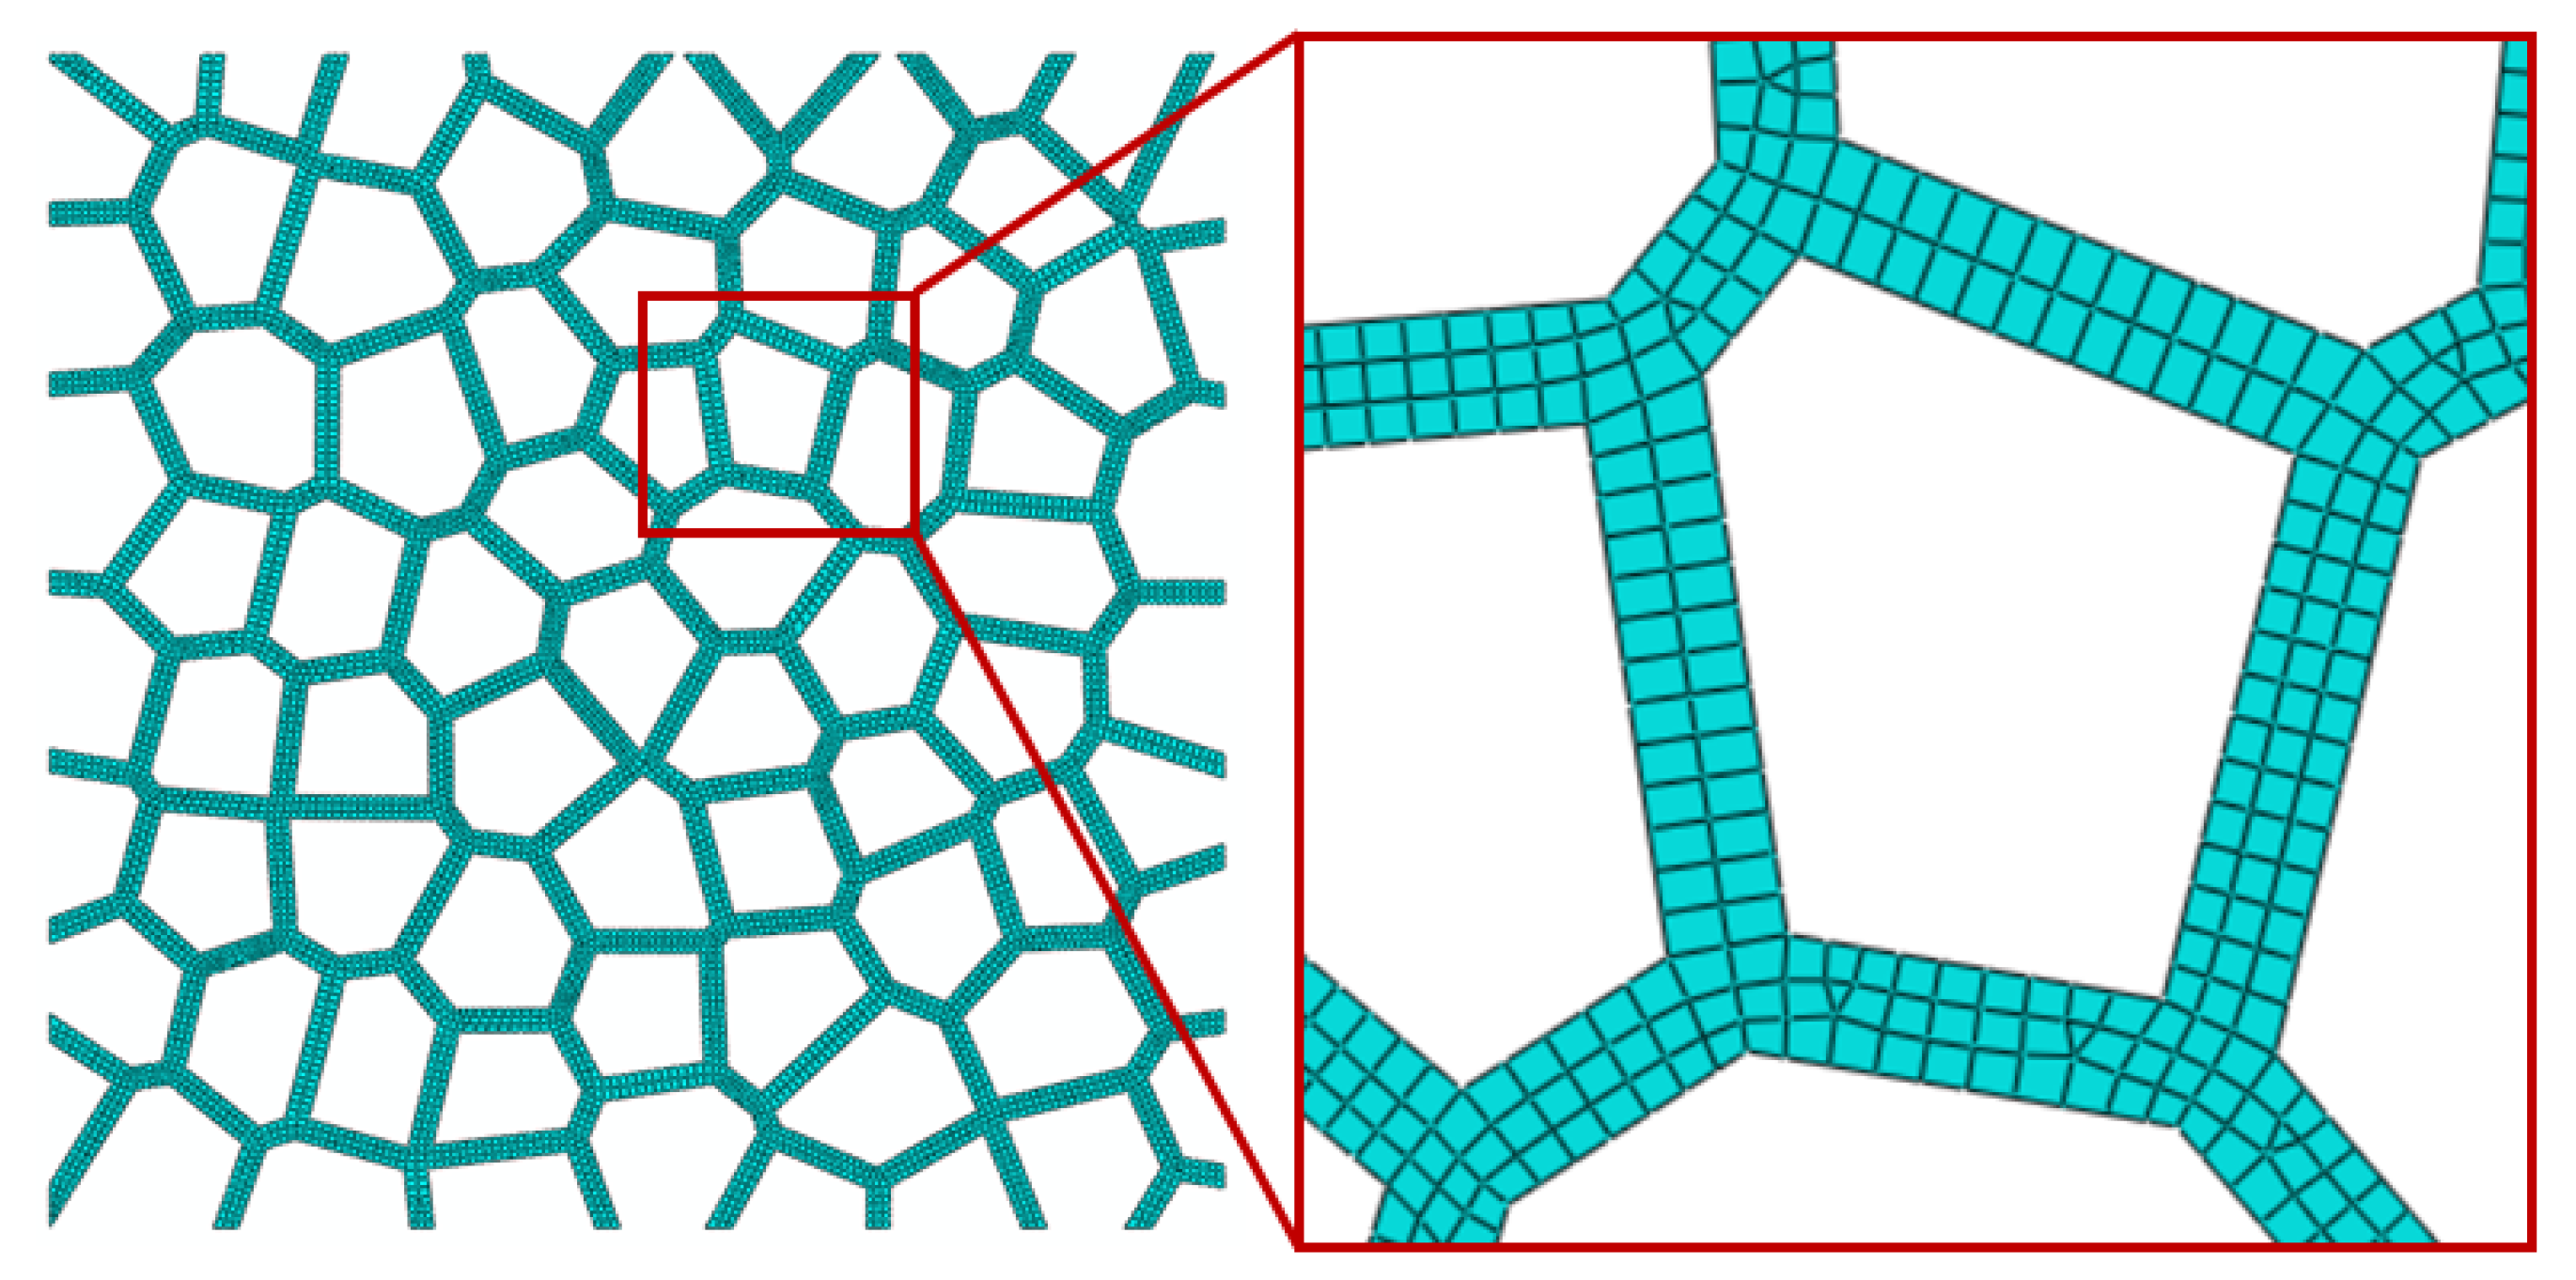
2.4. Finite Element Models
3. Results and Discussion
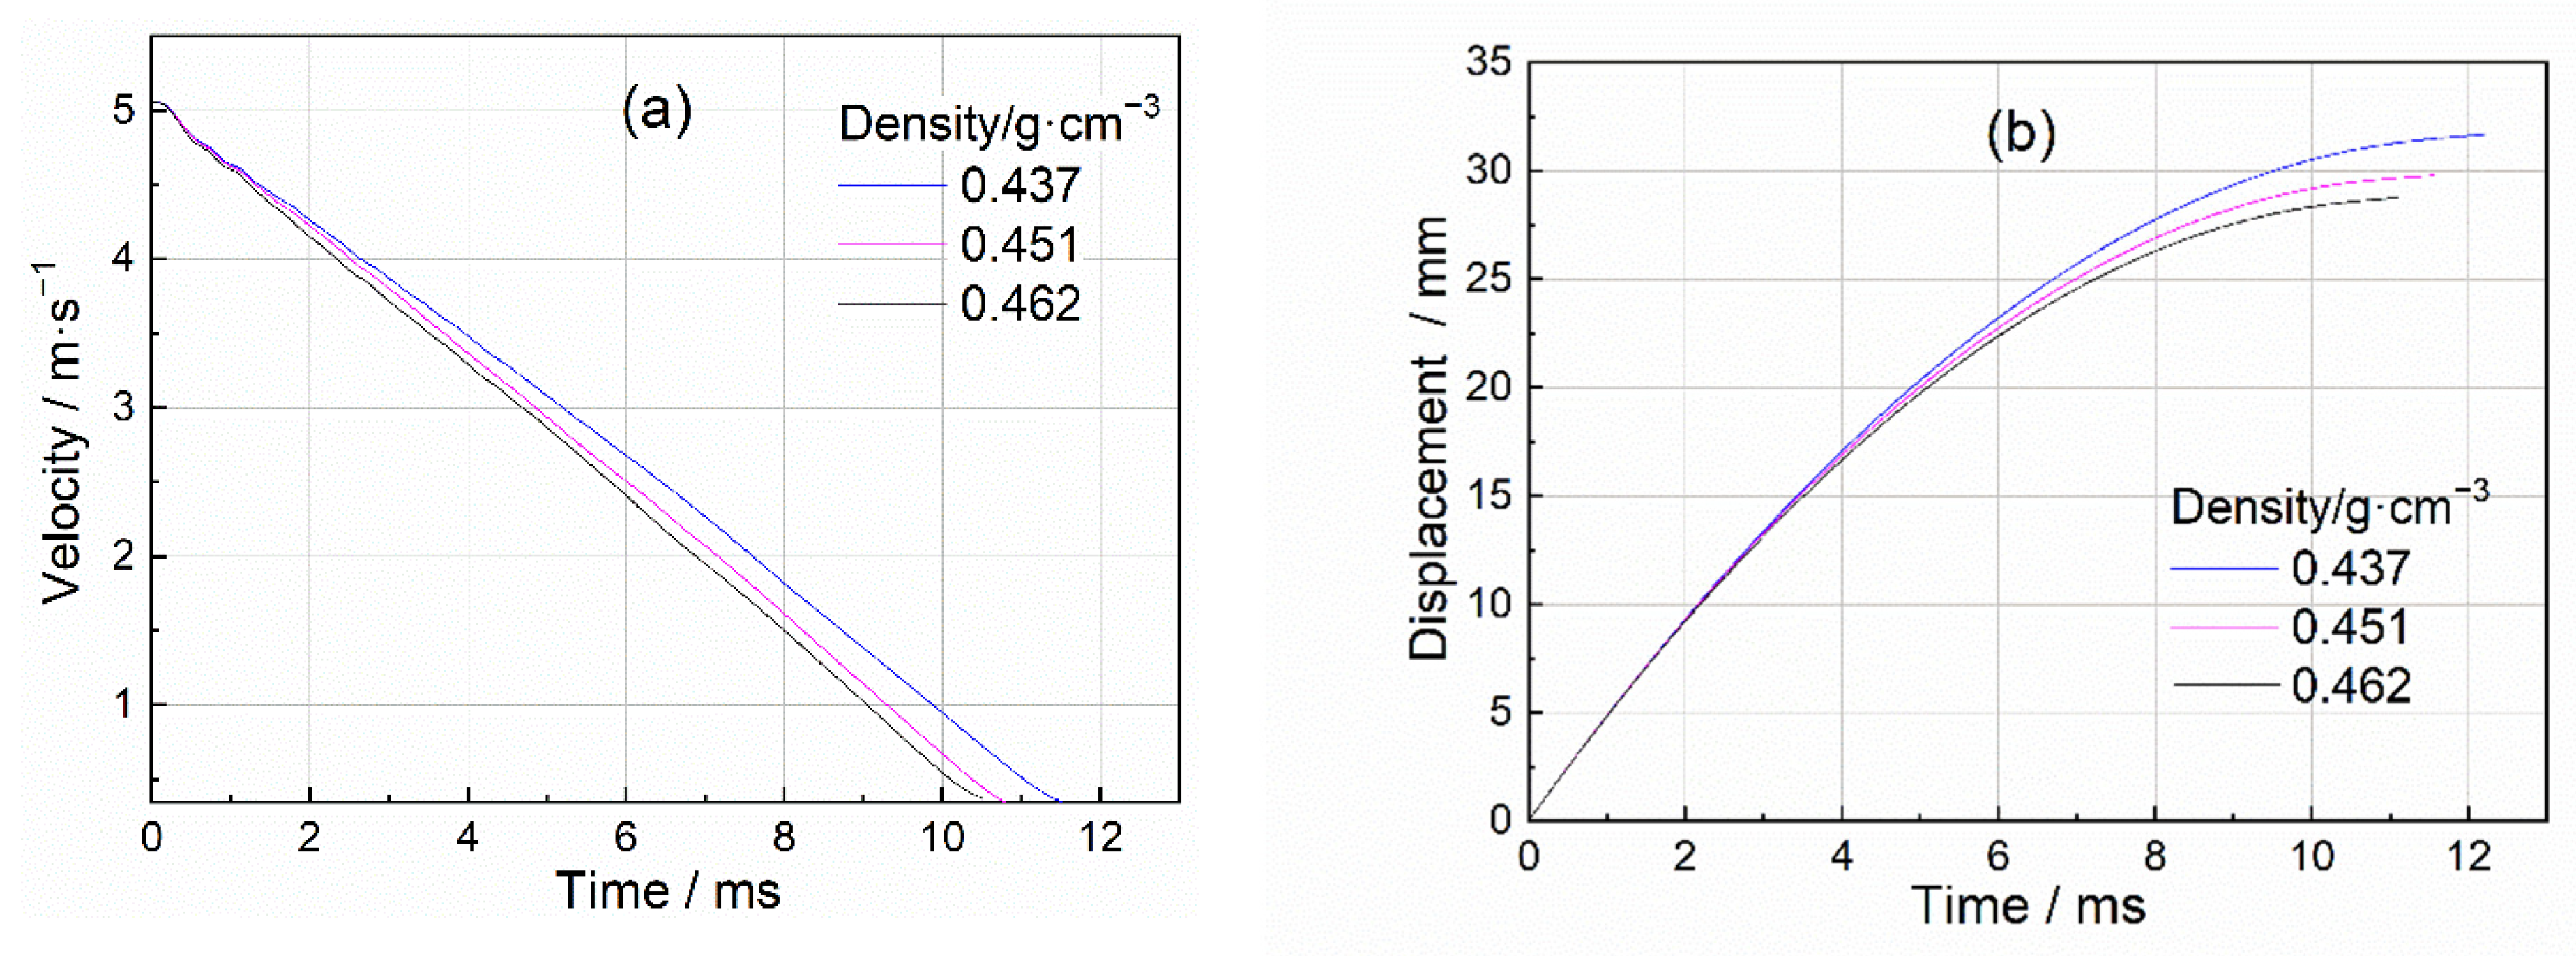
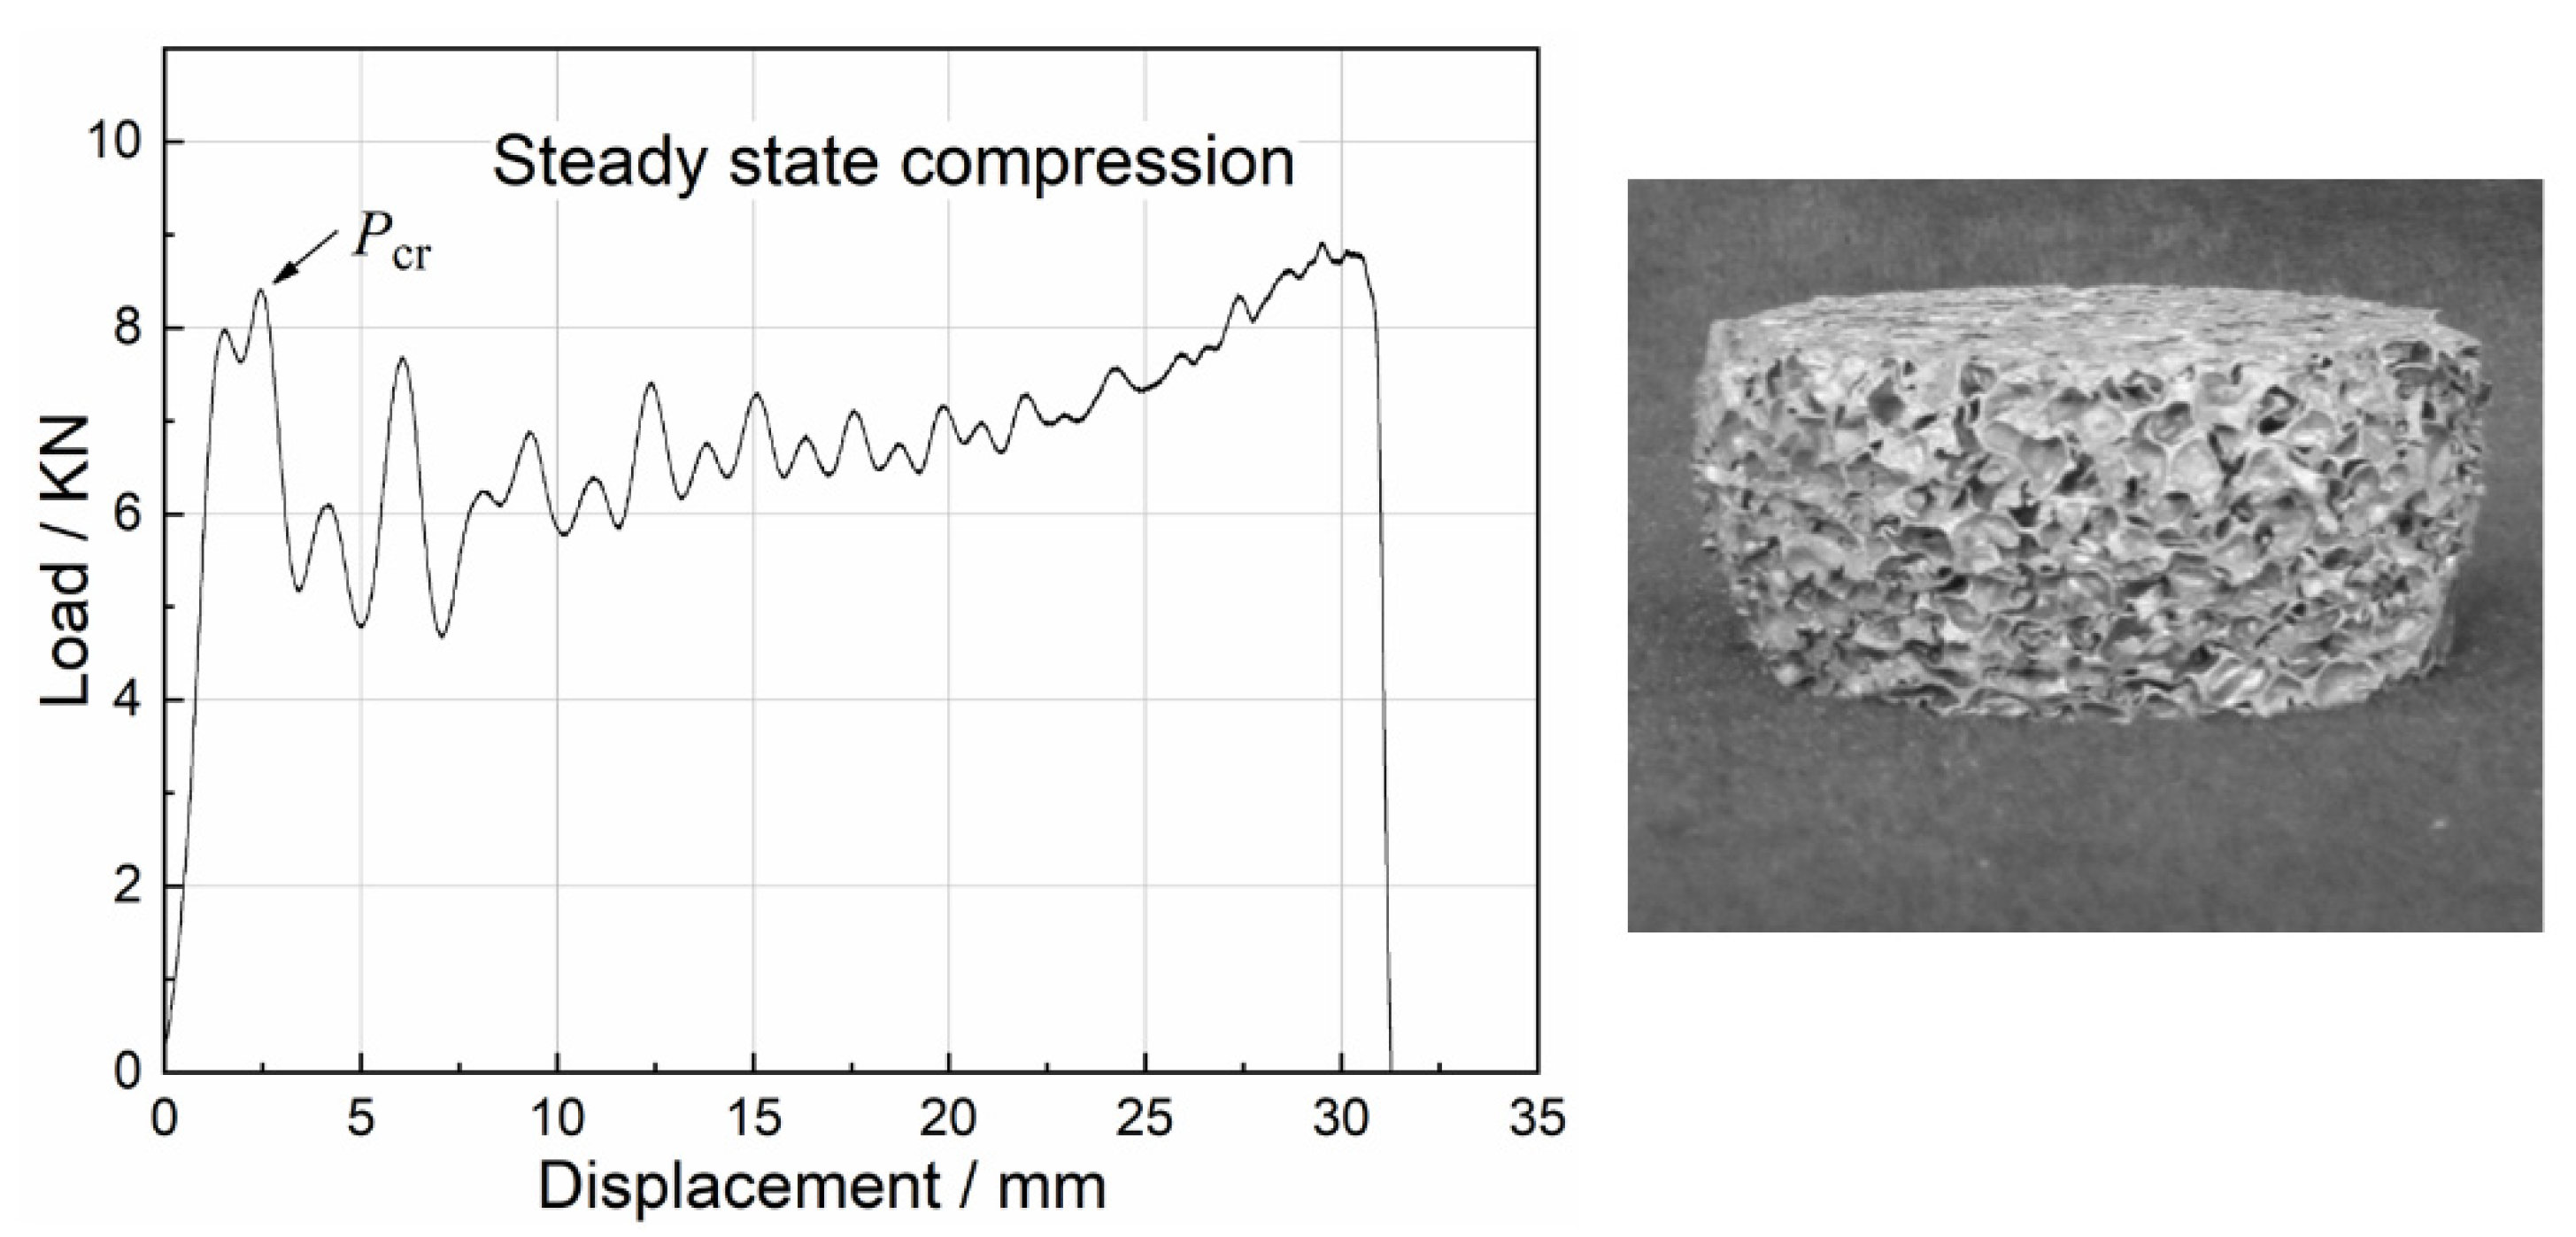
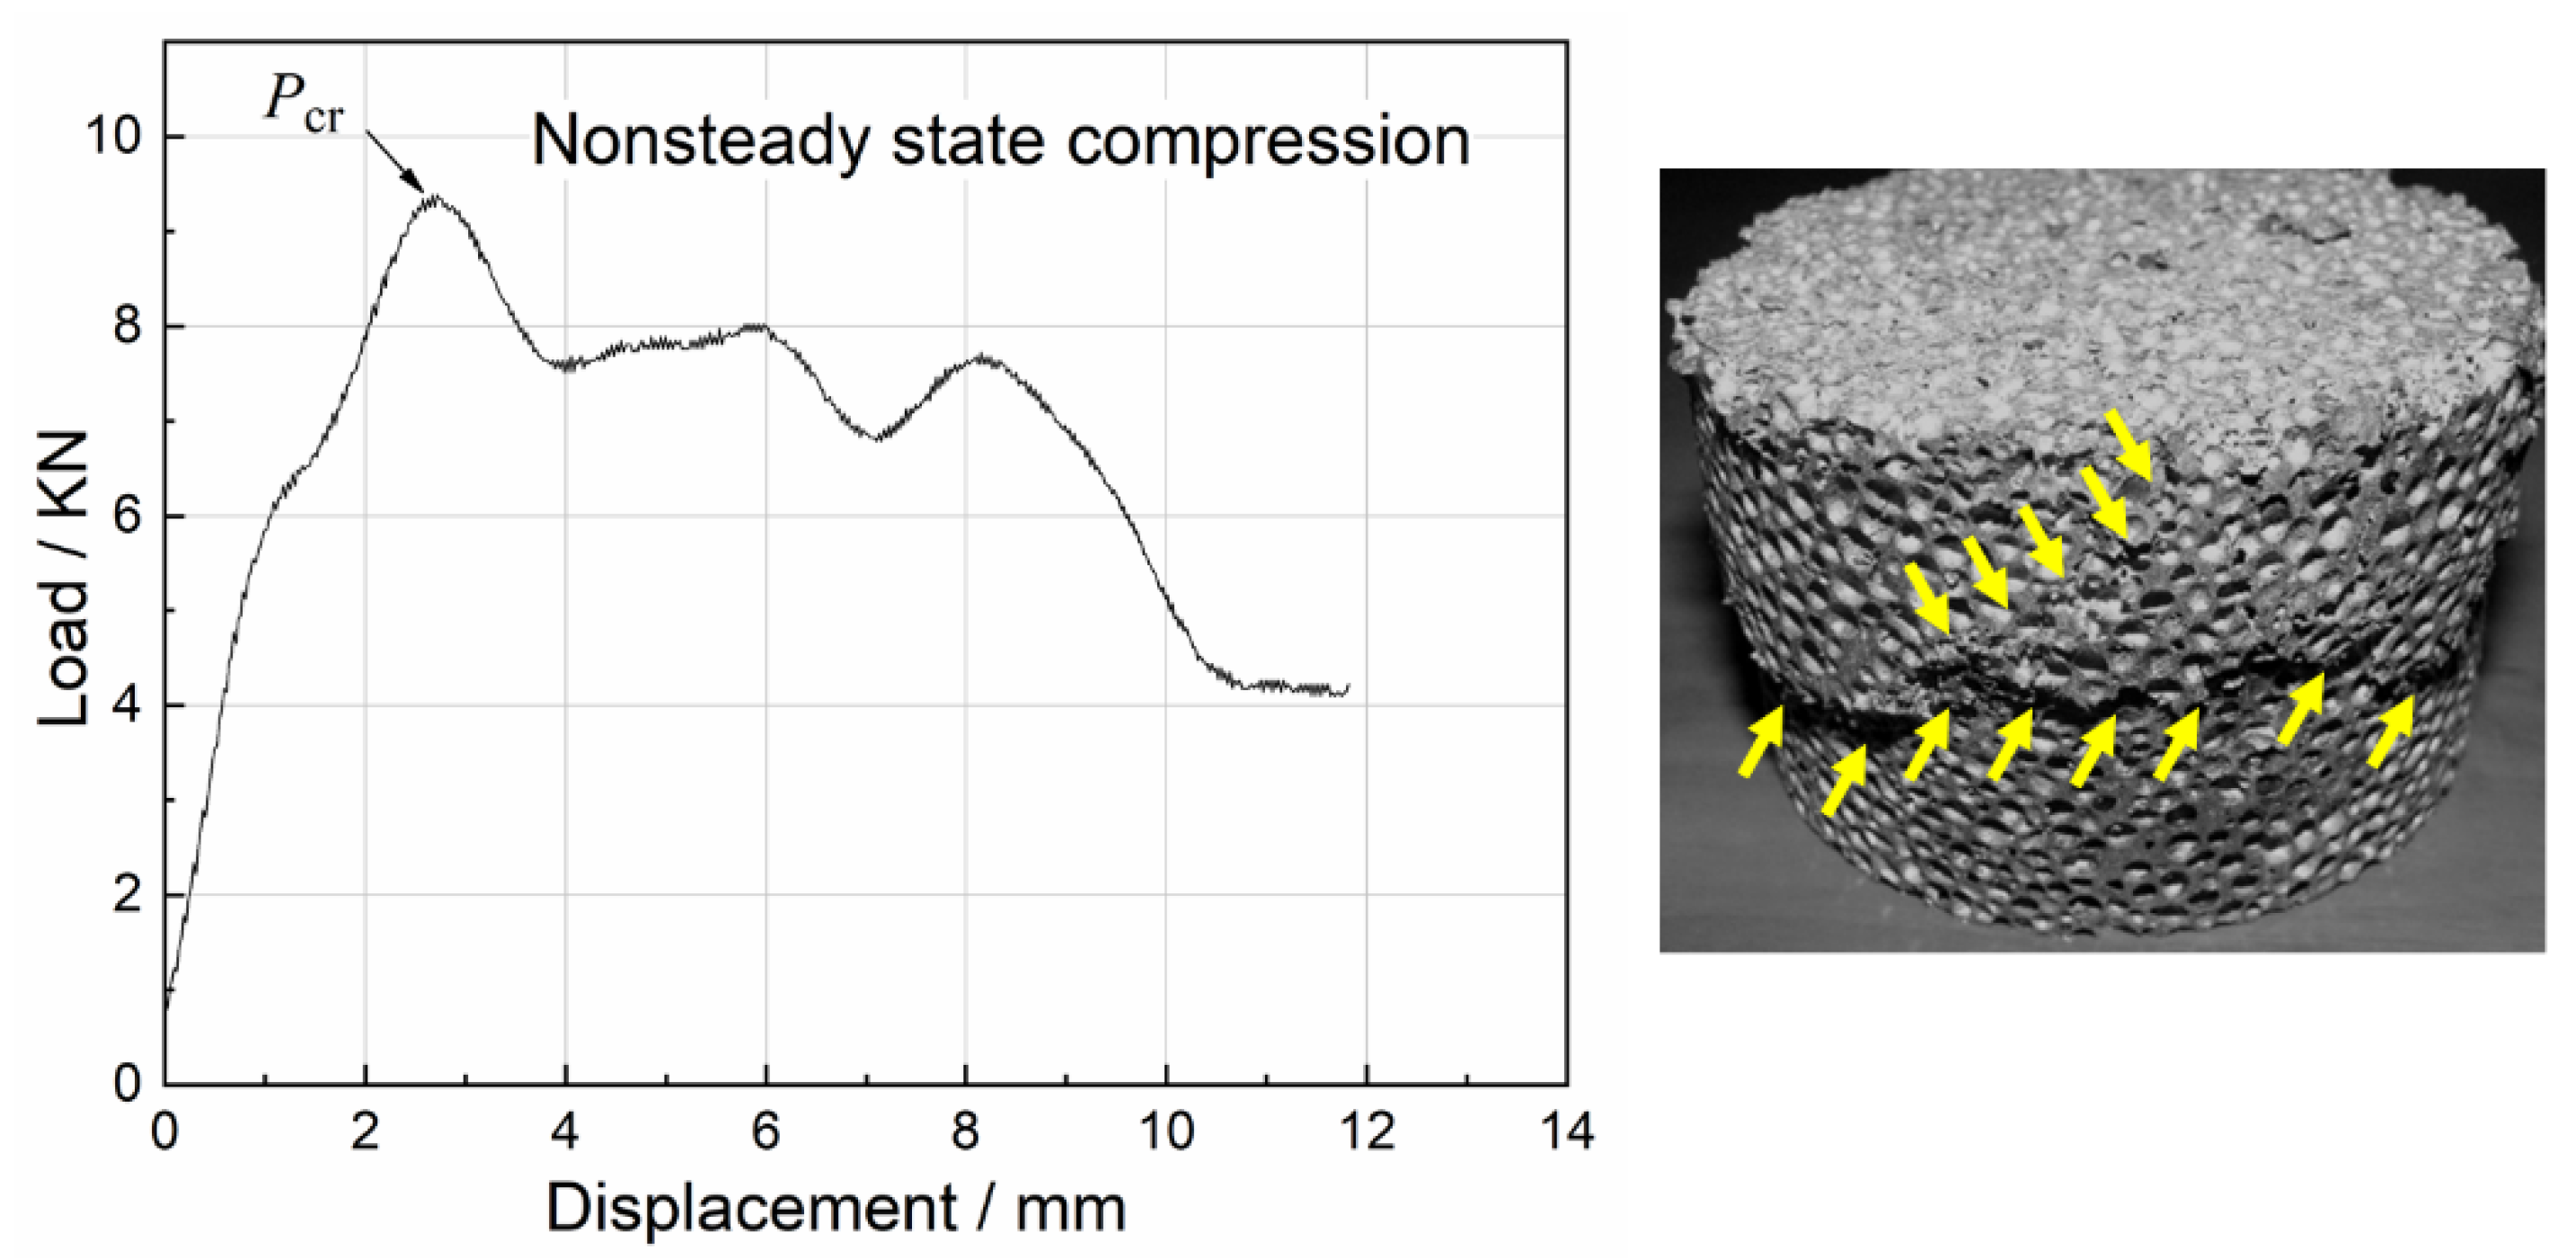
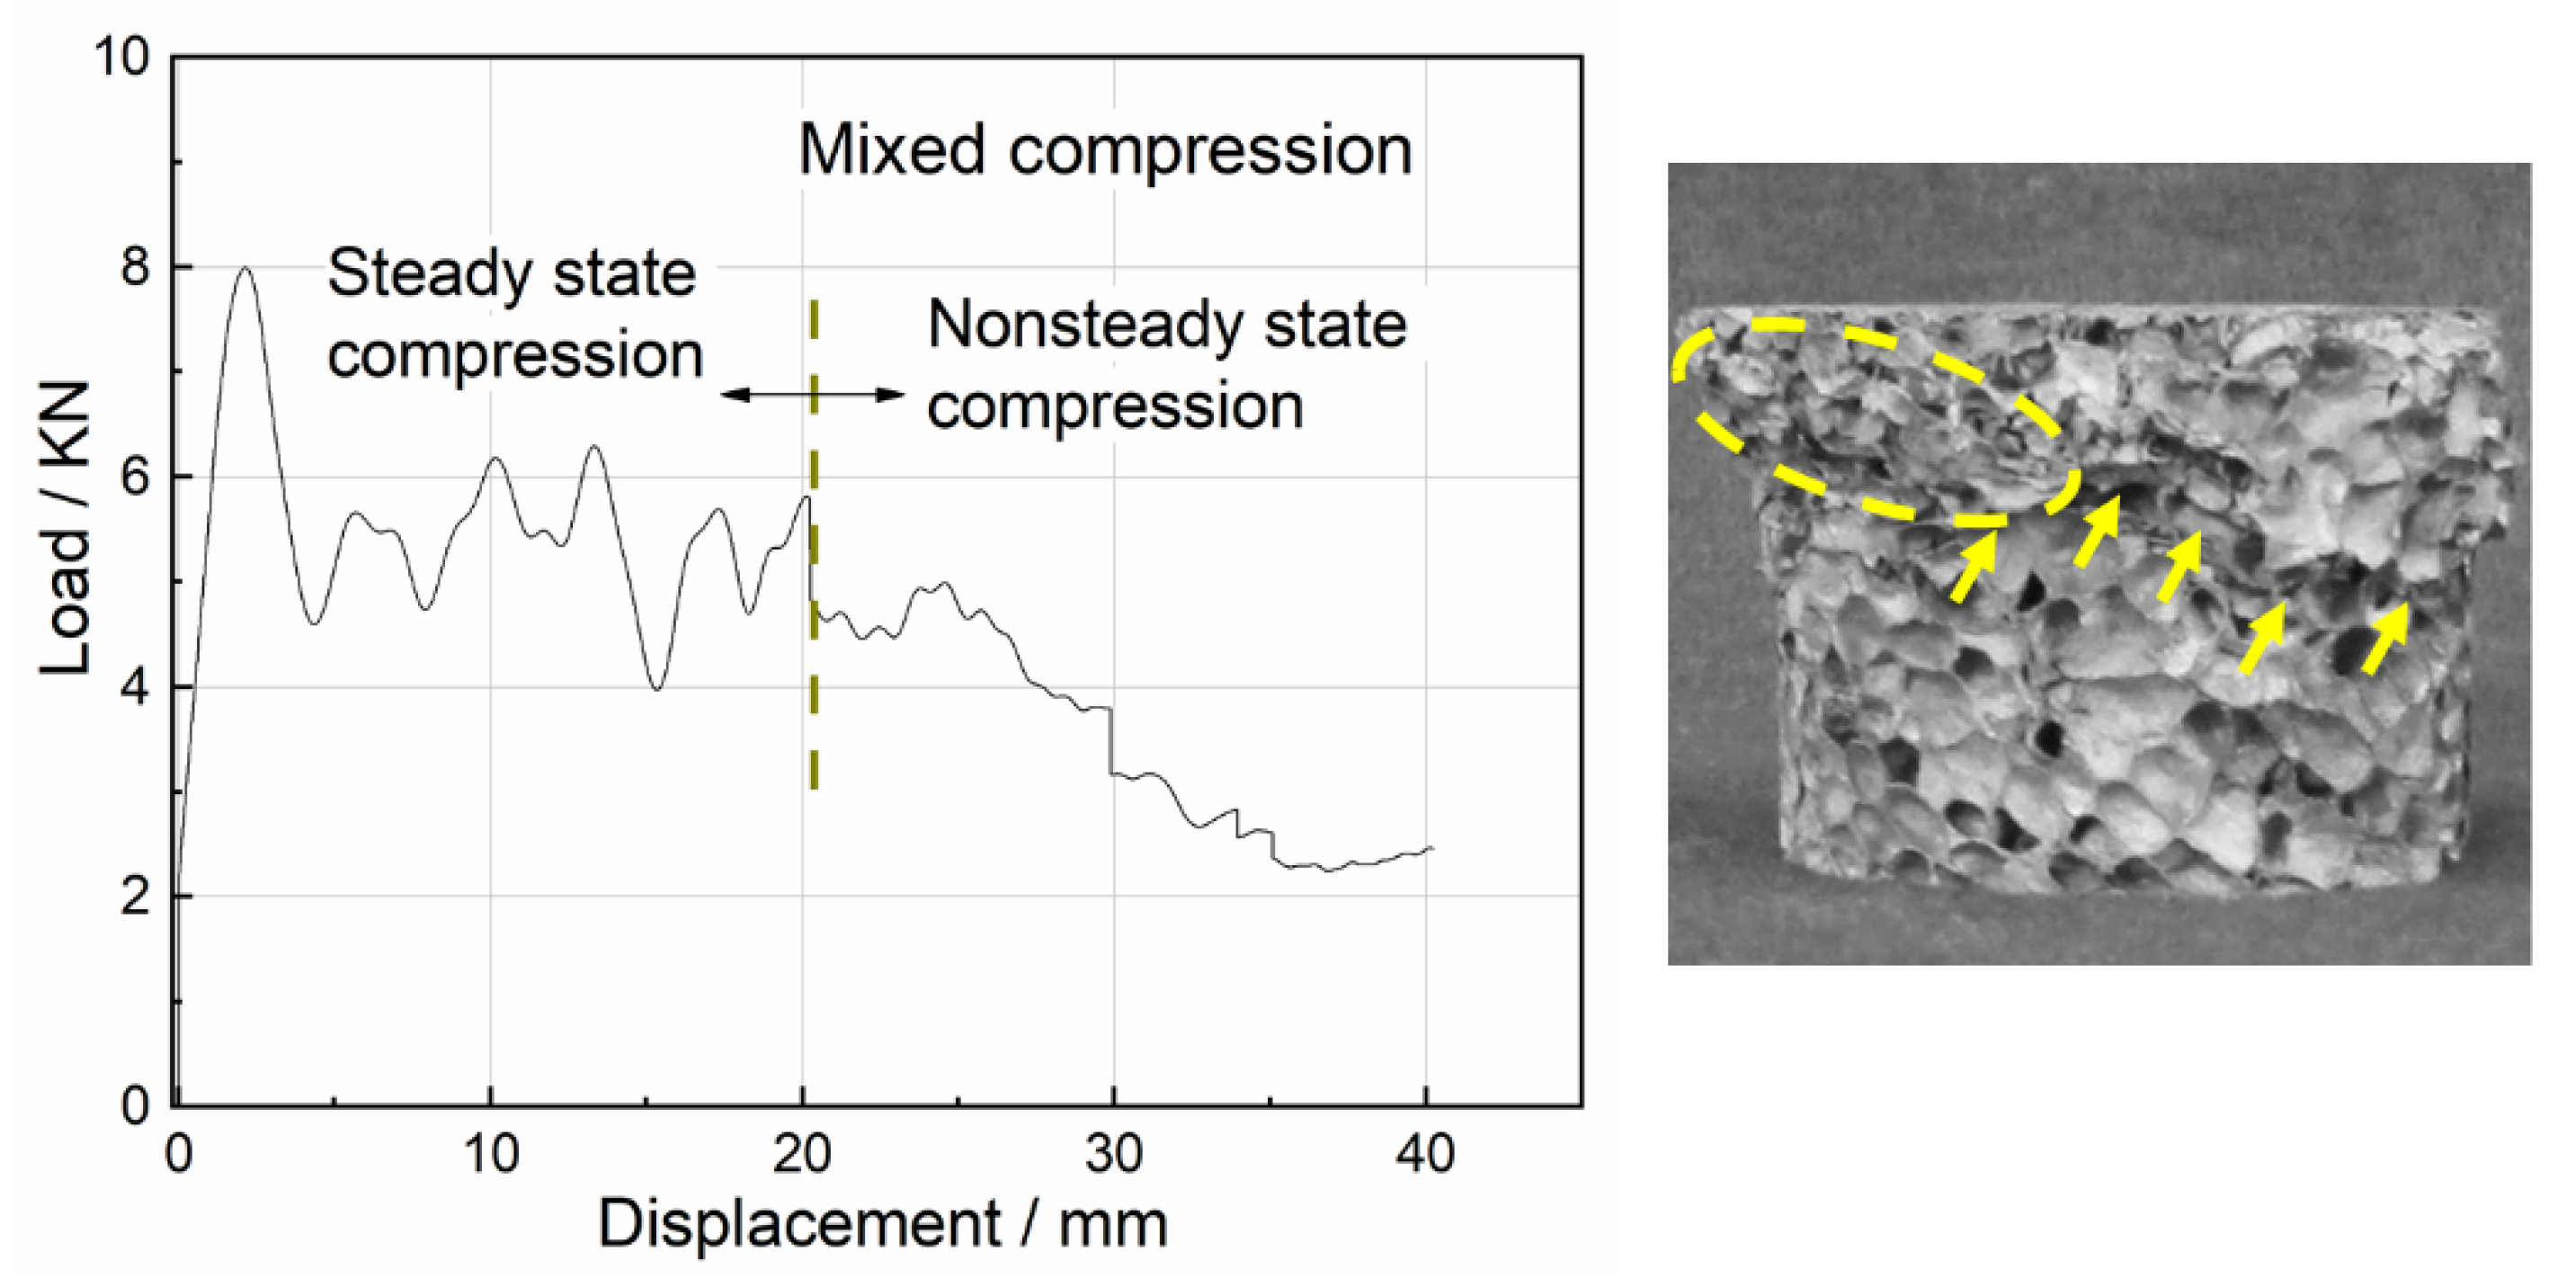
3.1. Uniaxial Impact Test Curves
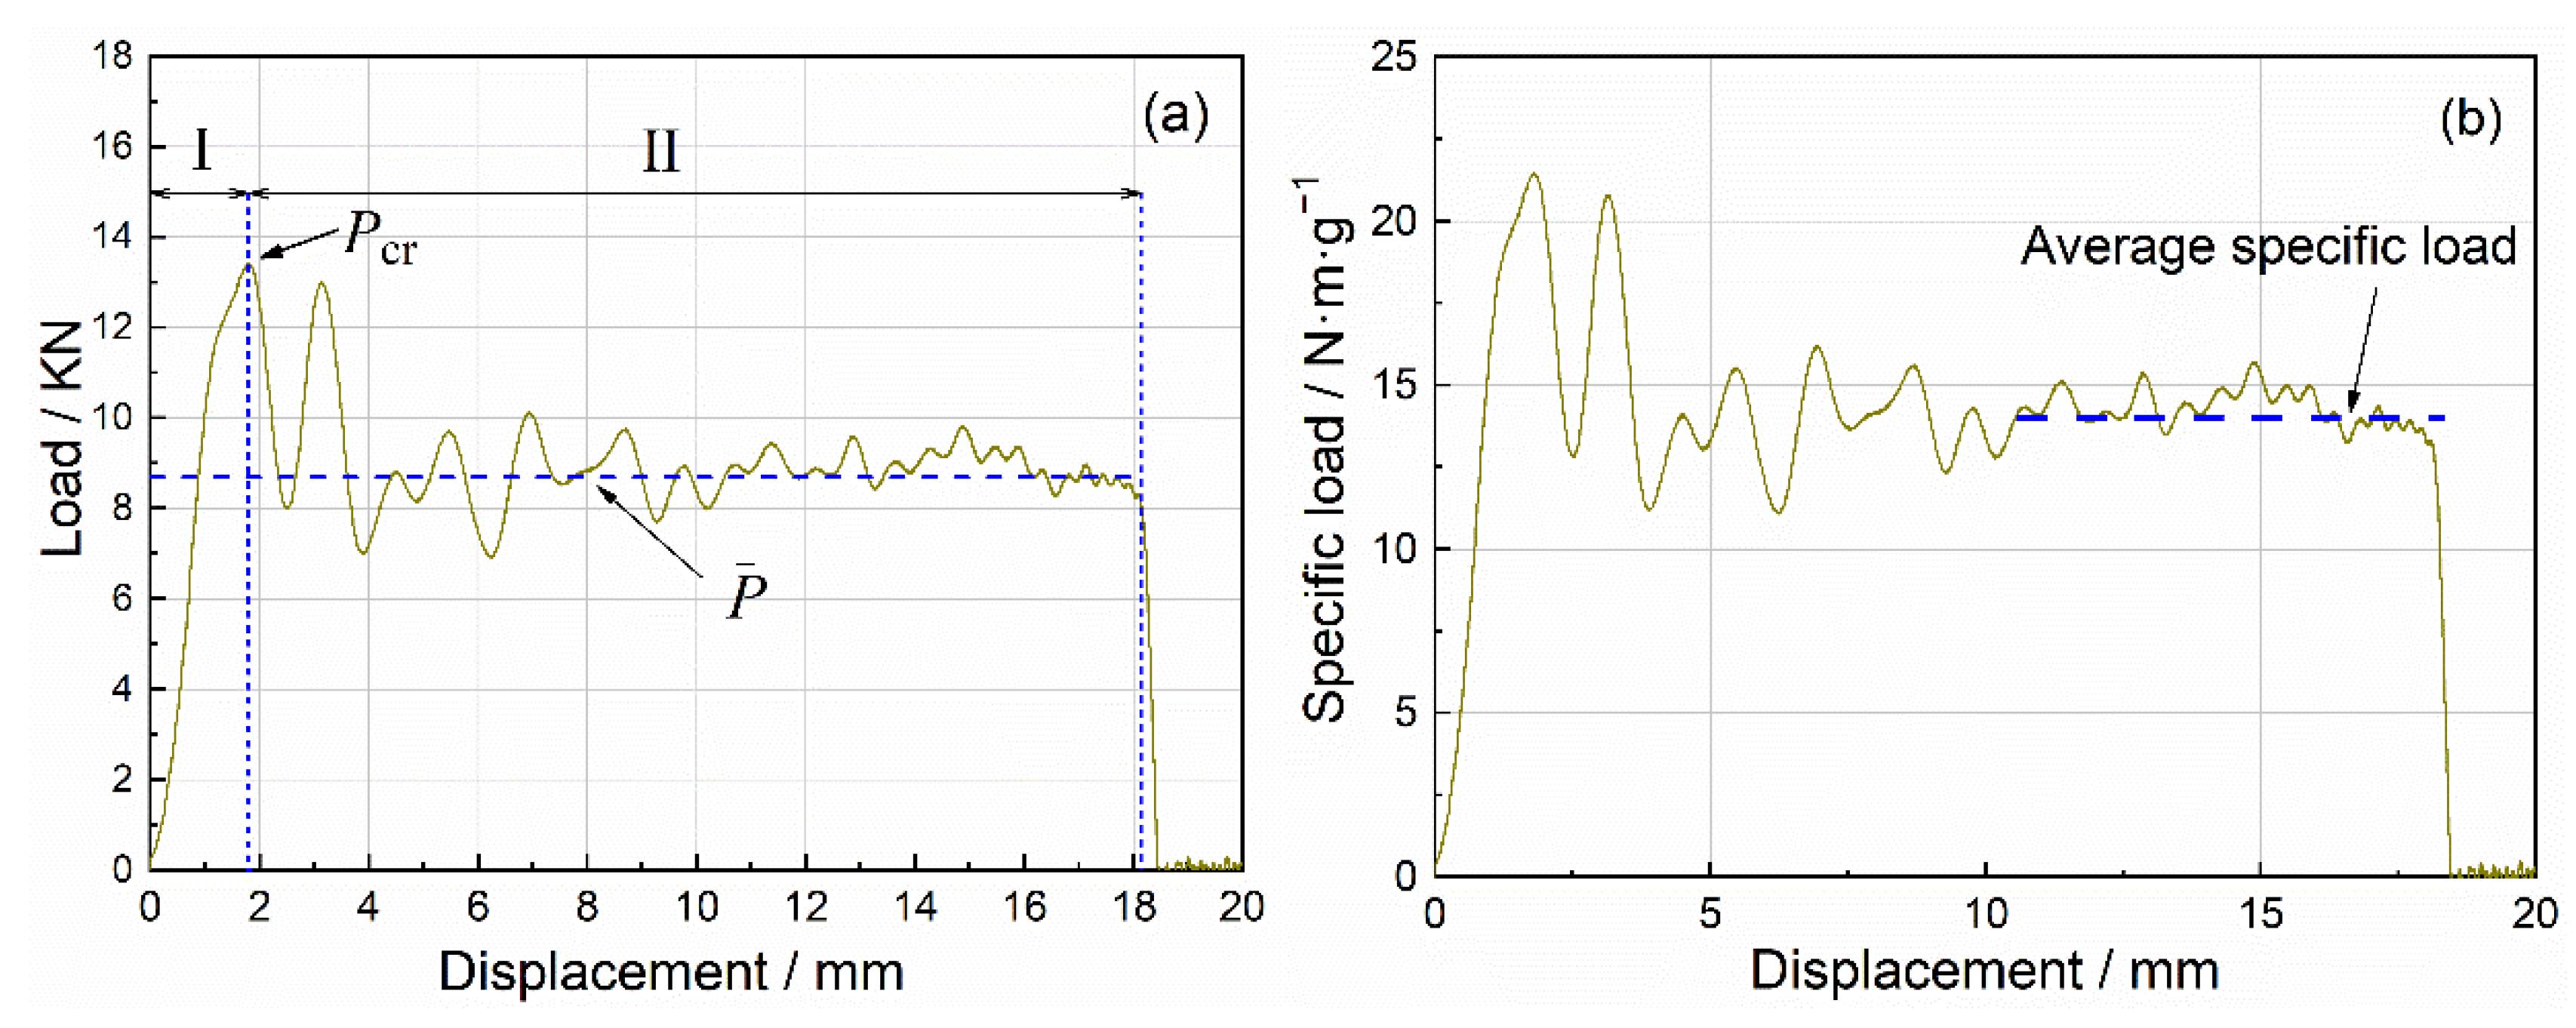
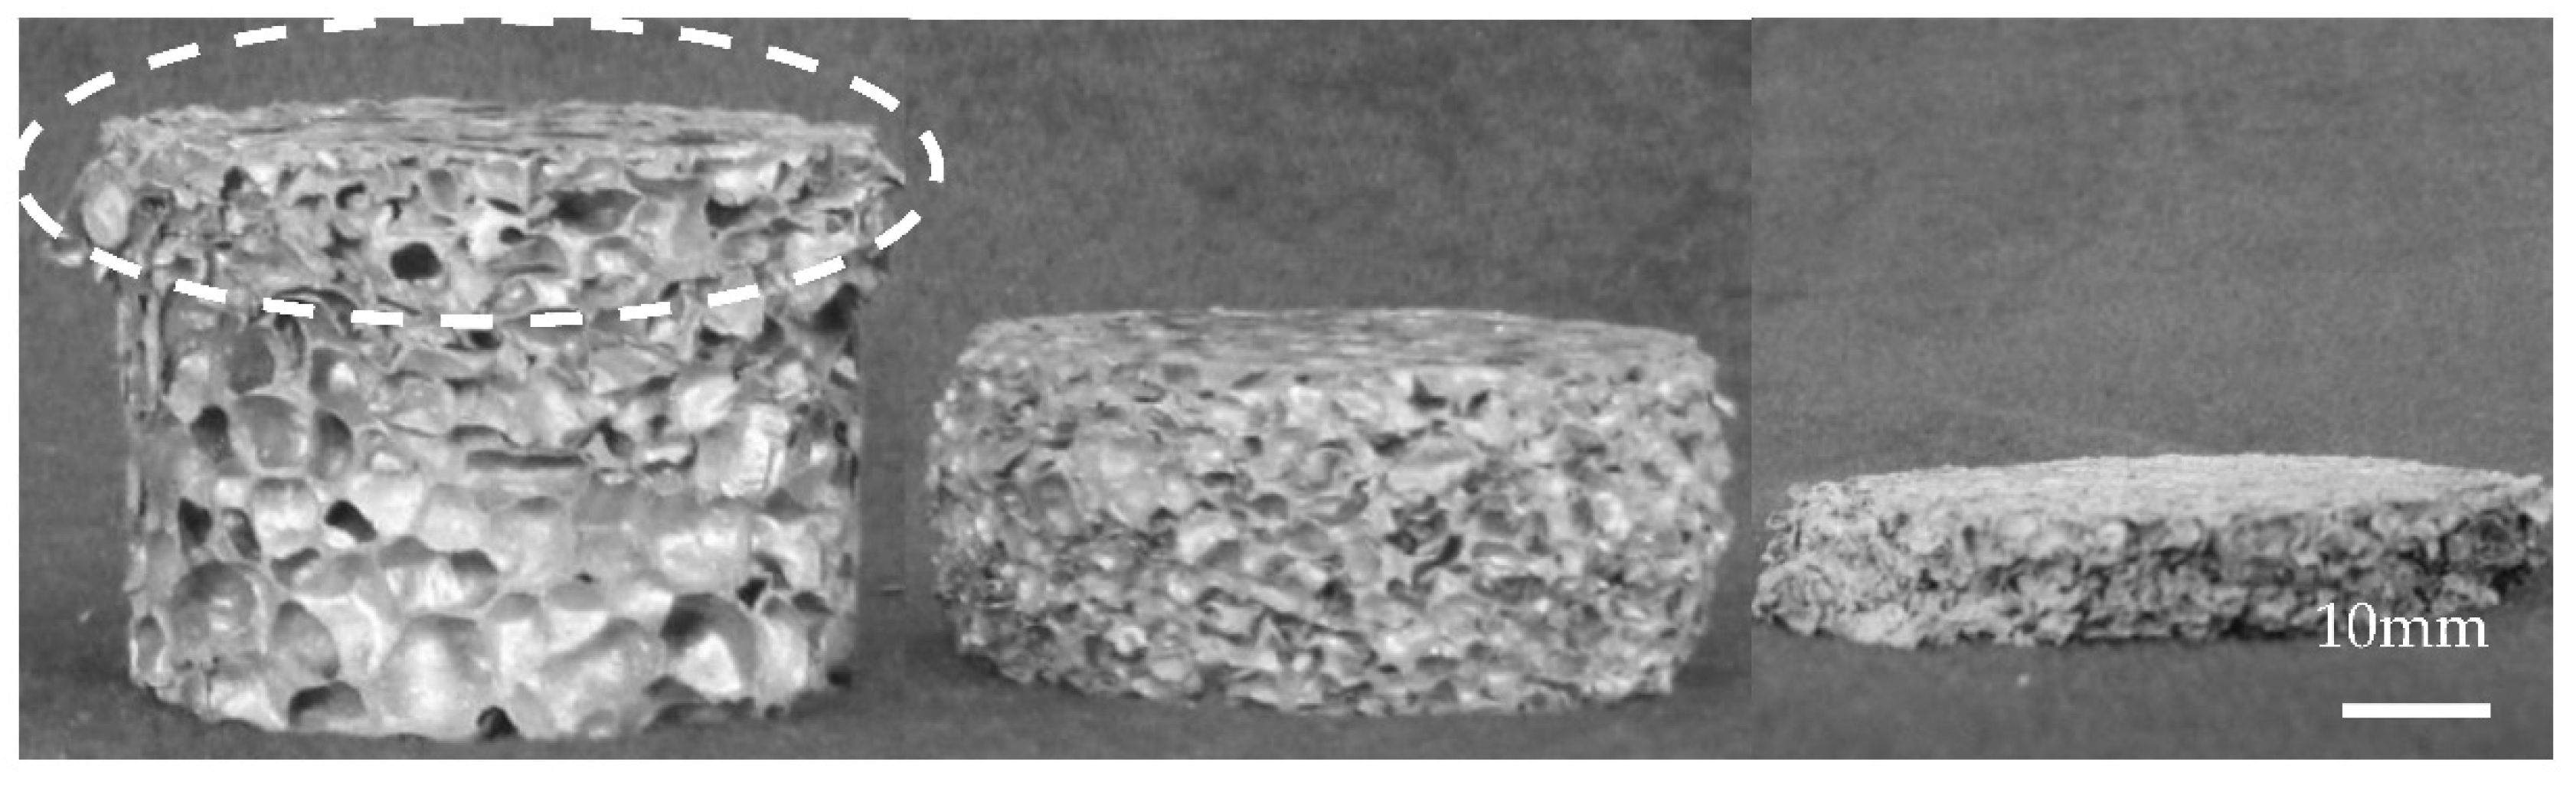
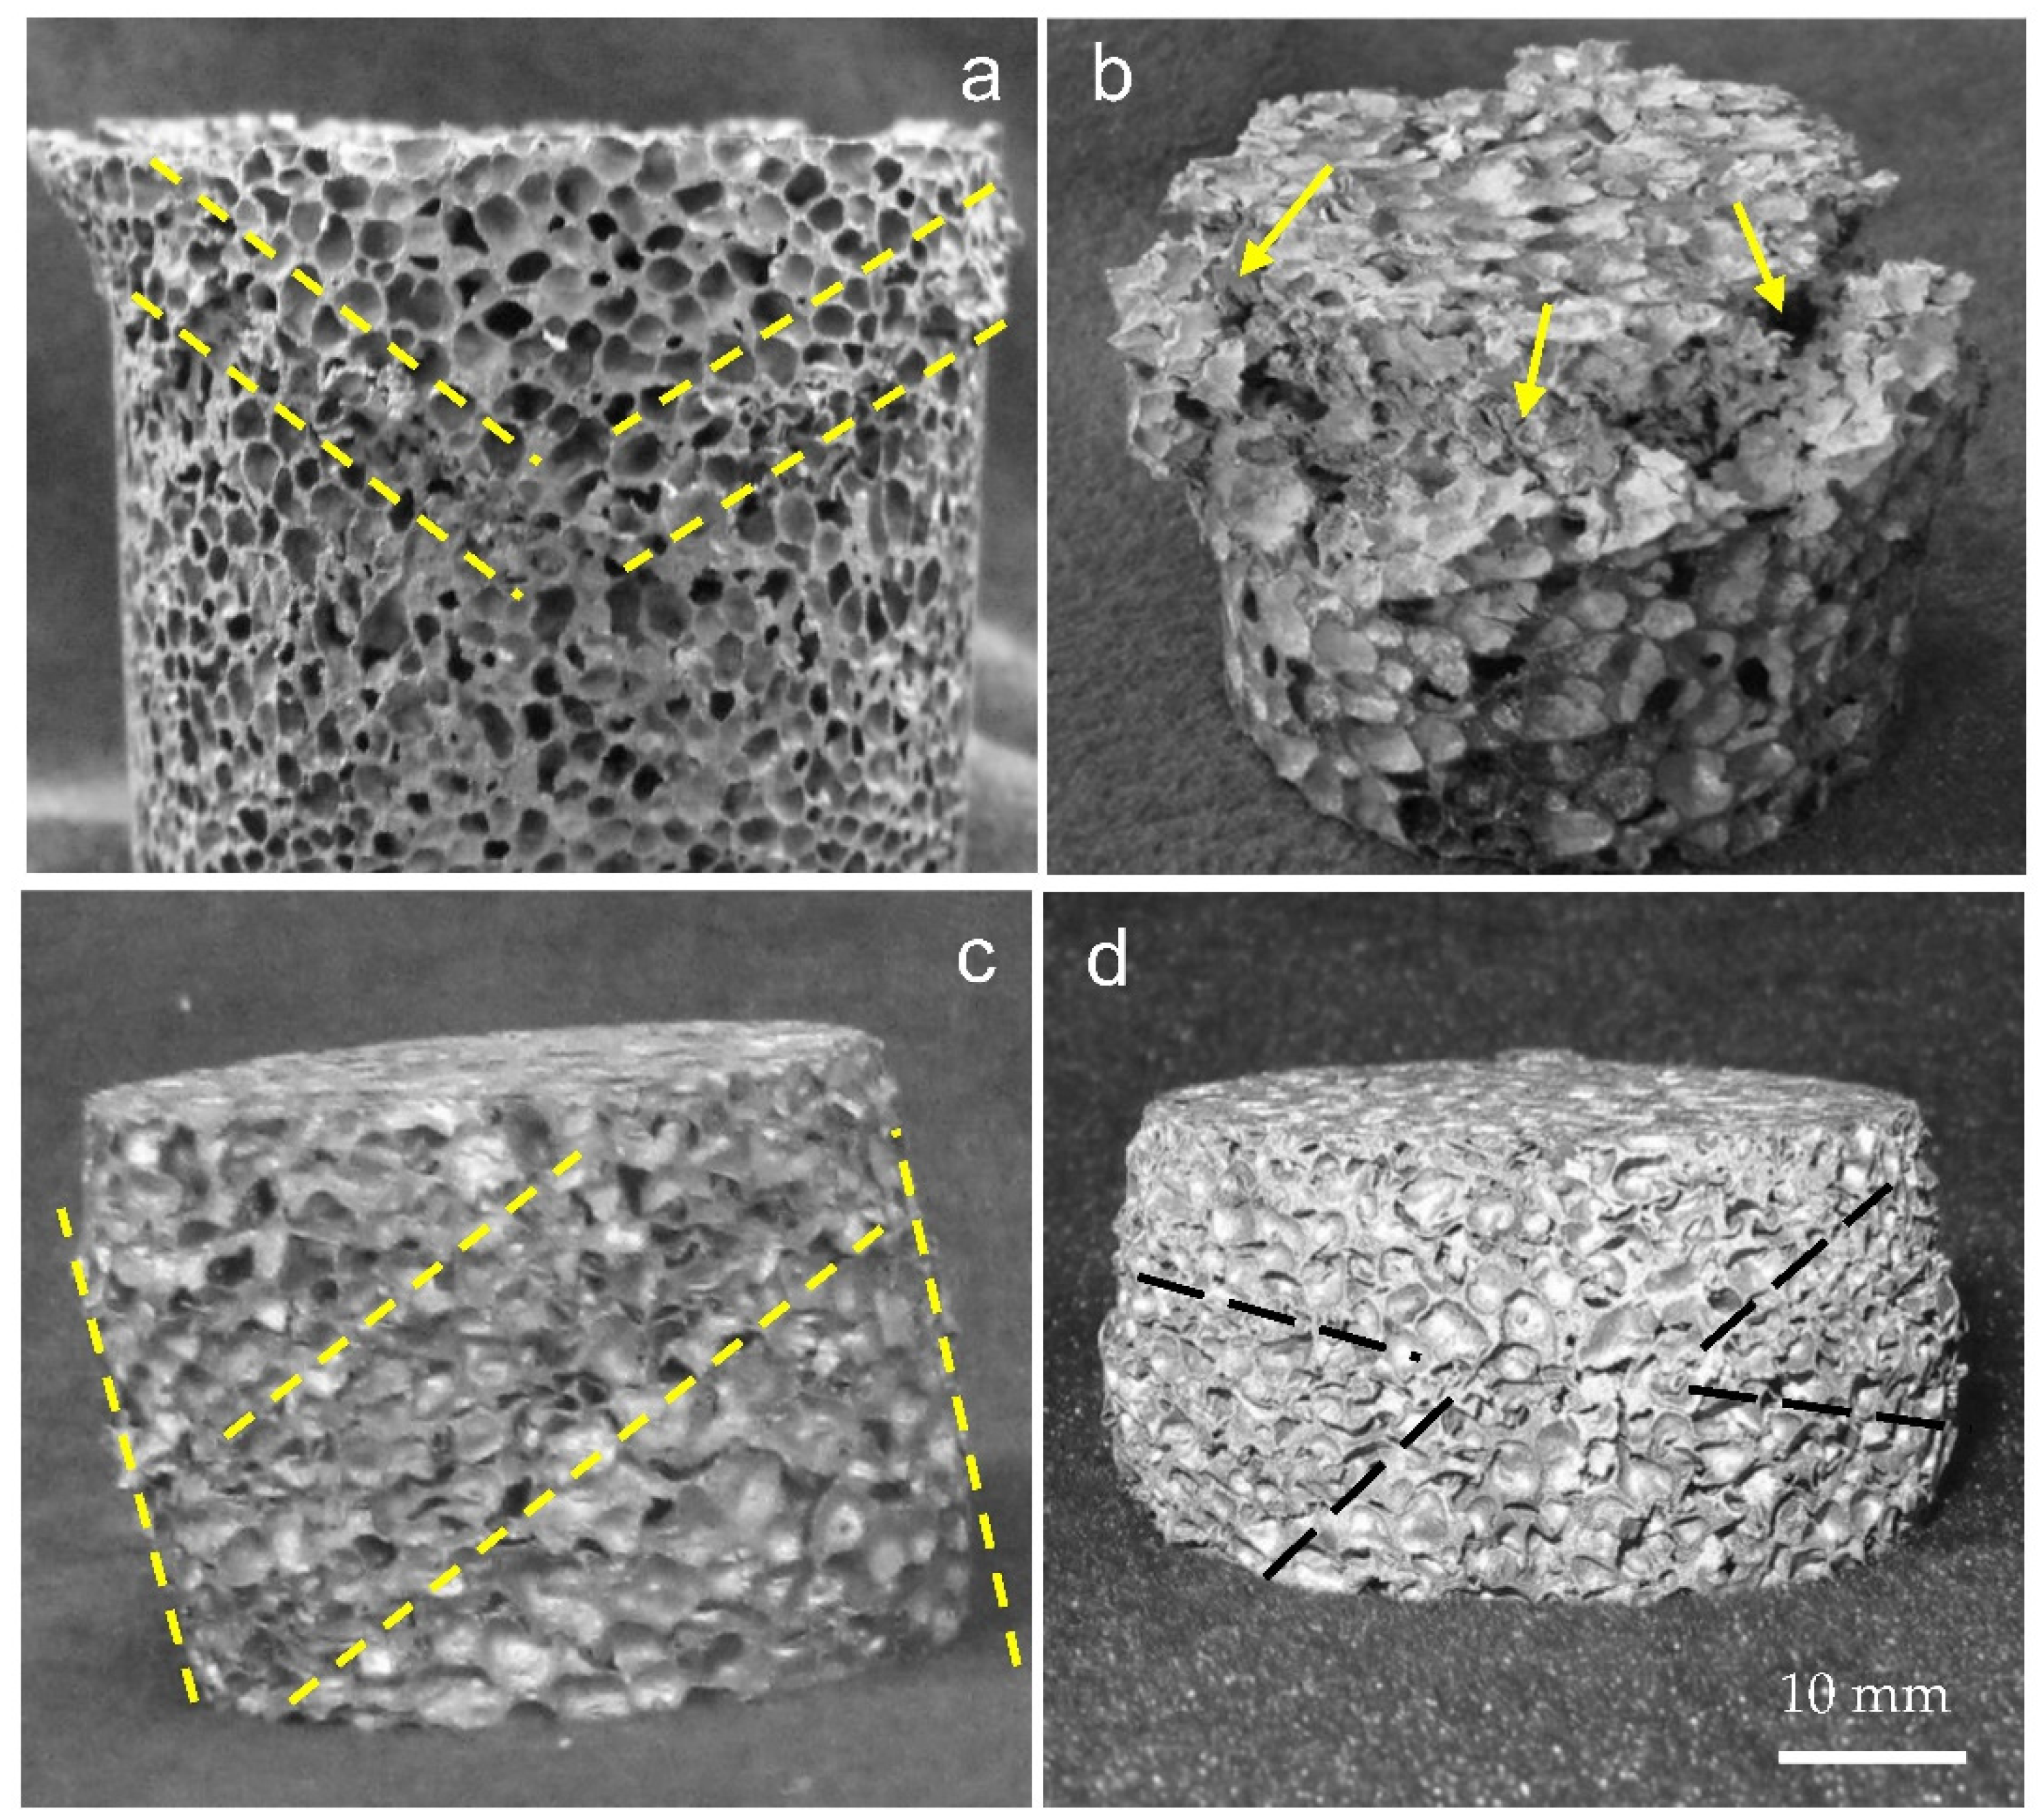
3.2. Compression Damage Behaviors
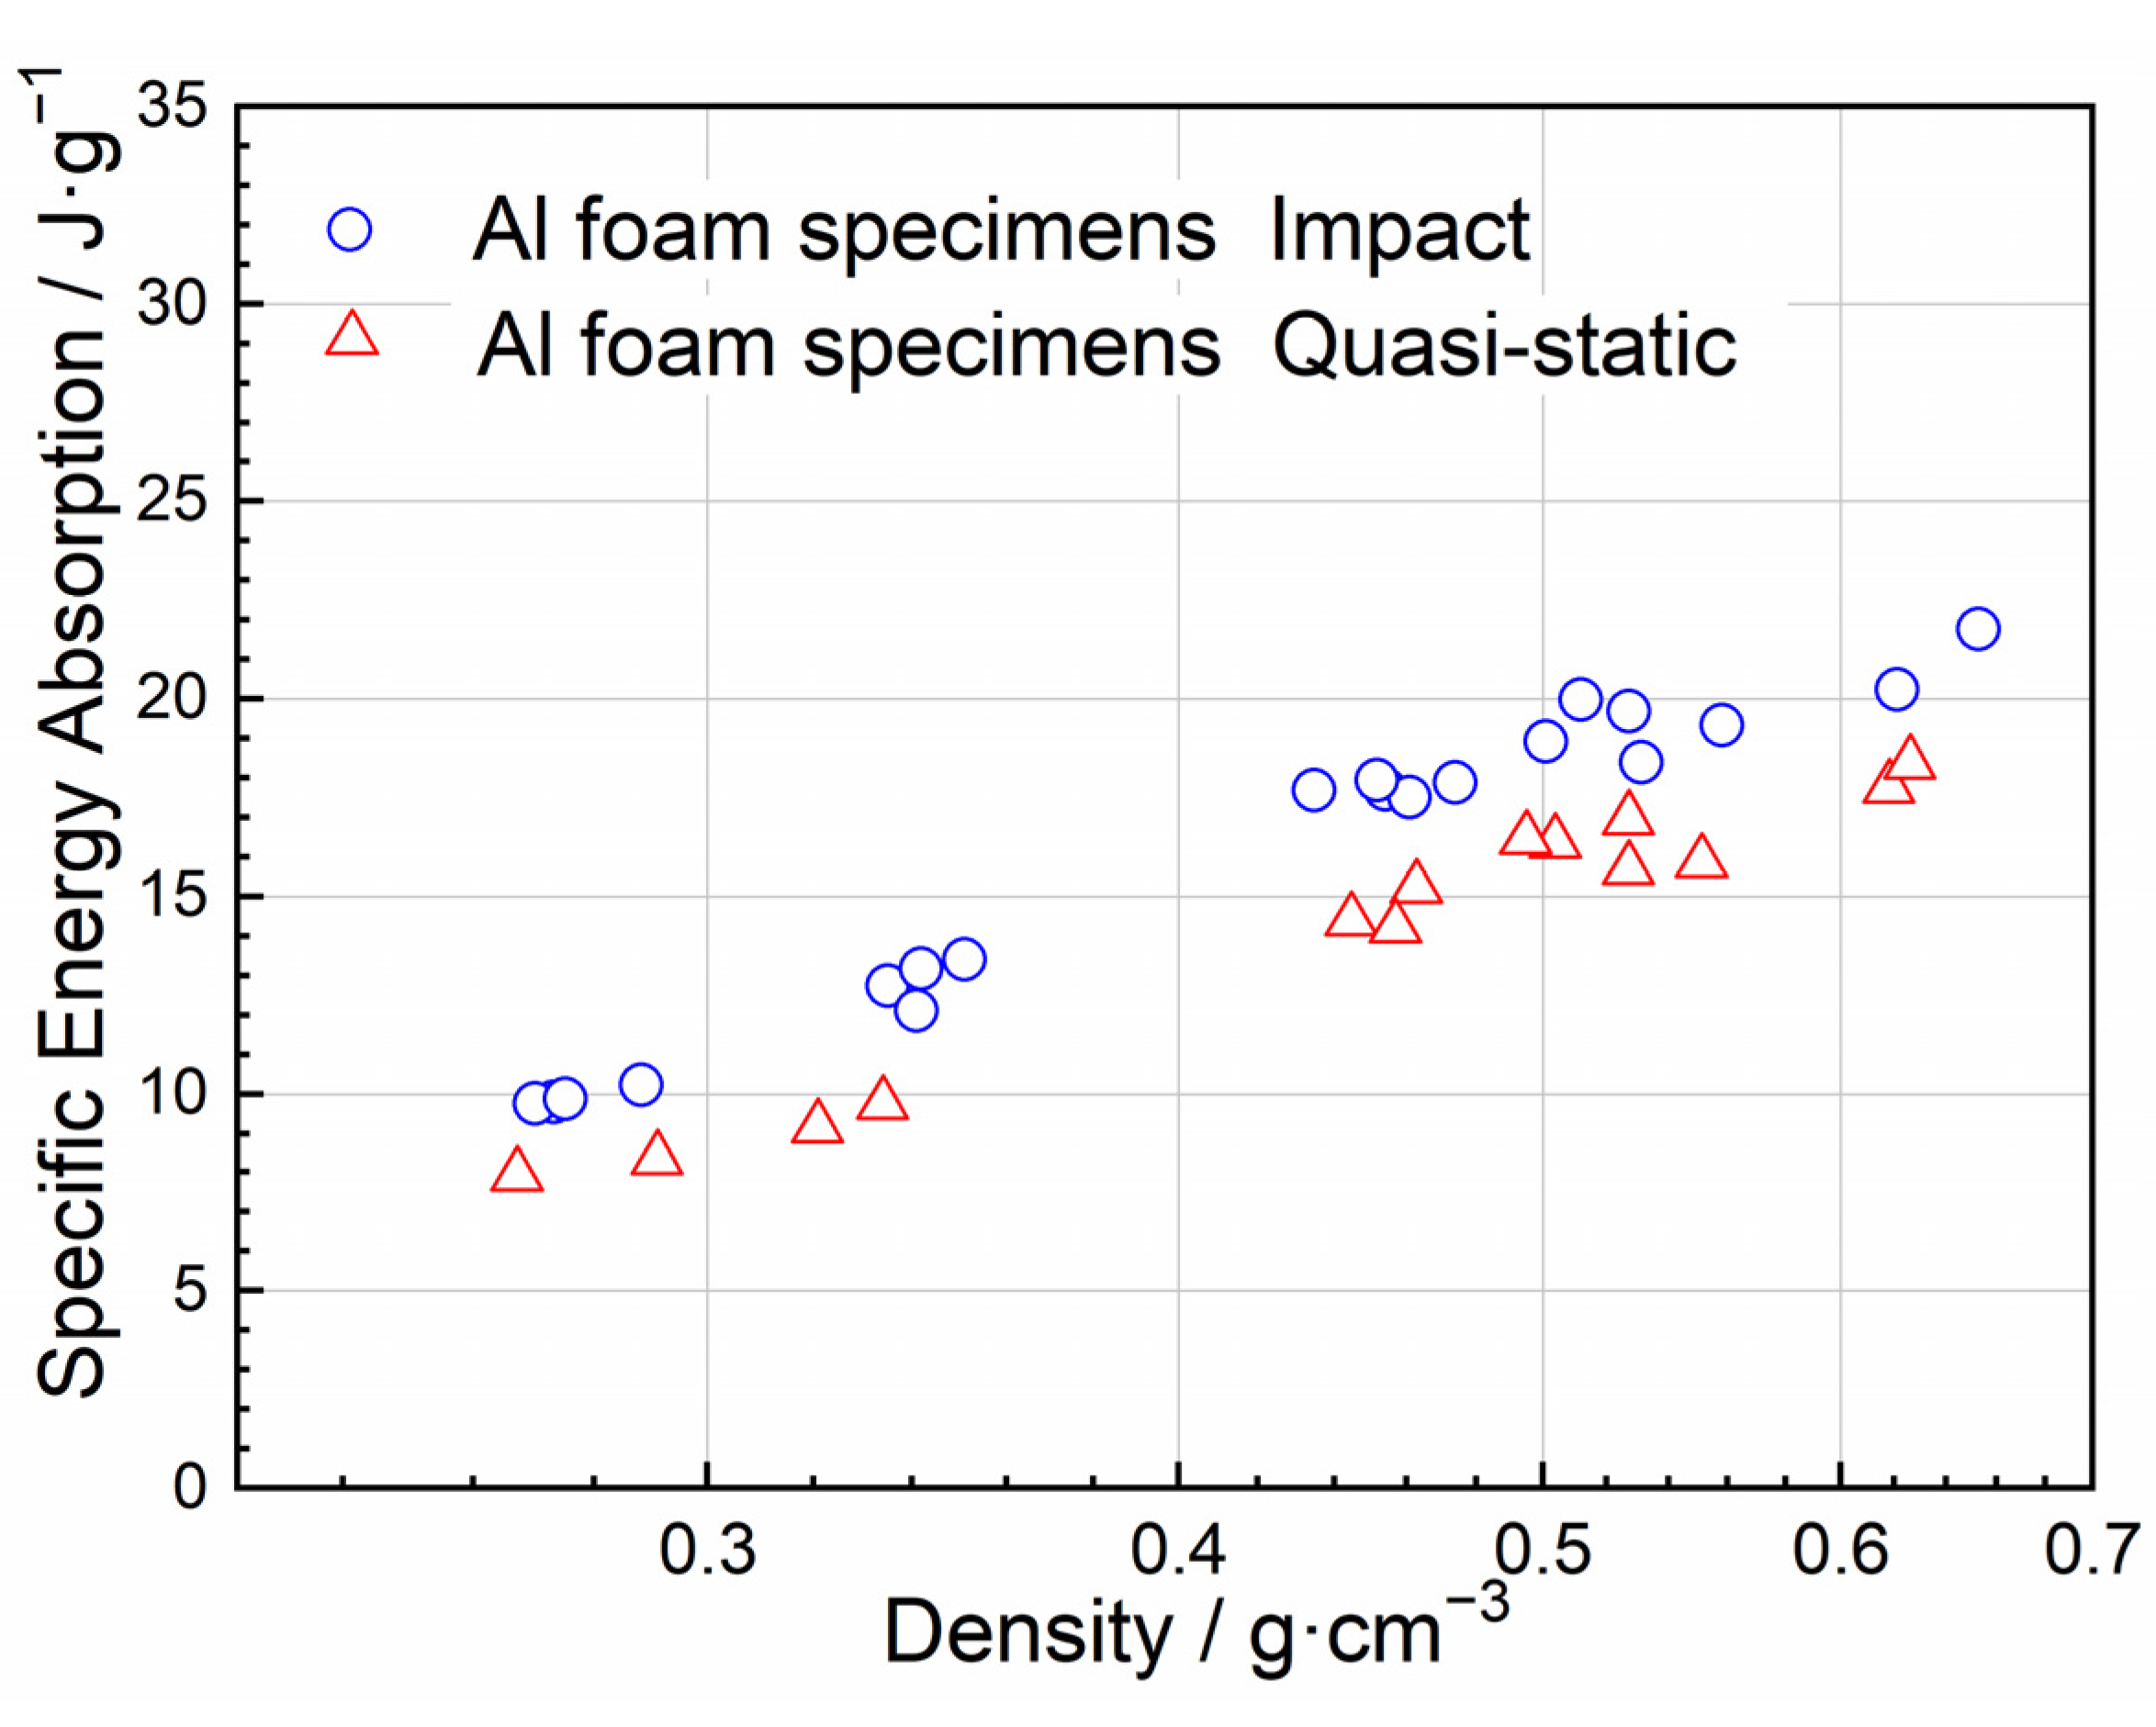
3.3. Energy Absorption Analysis
3.4. Impact Performance’s Velocity Sensitivity
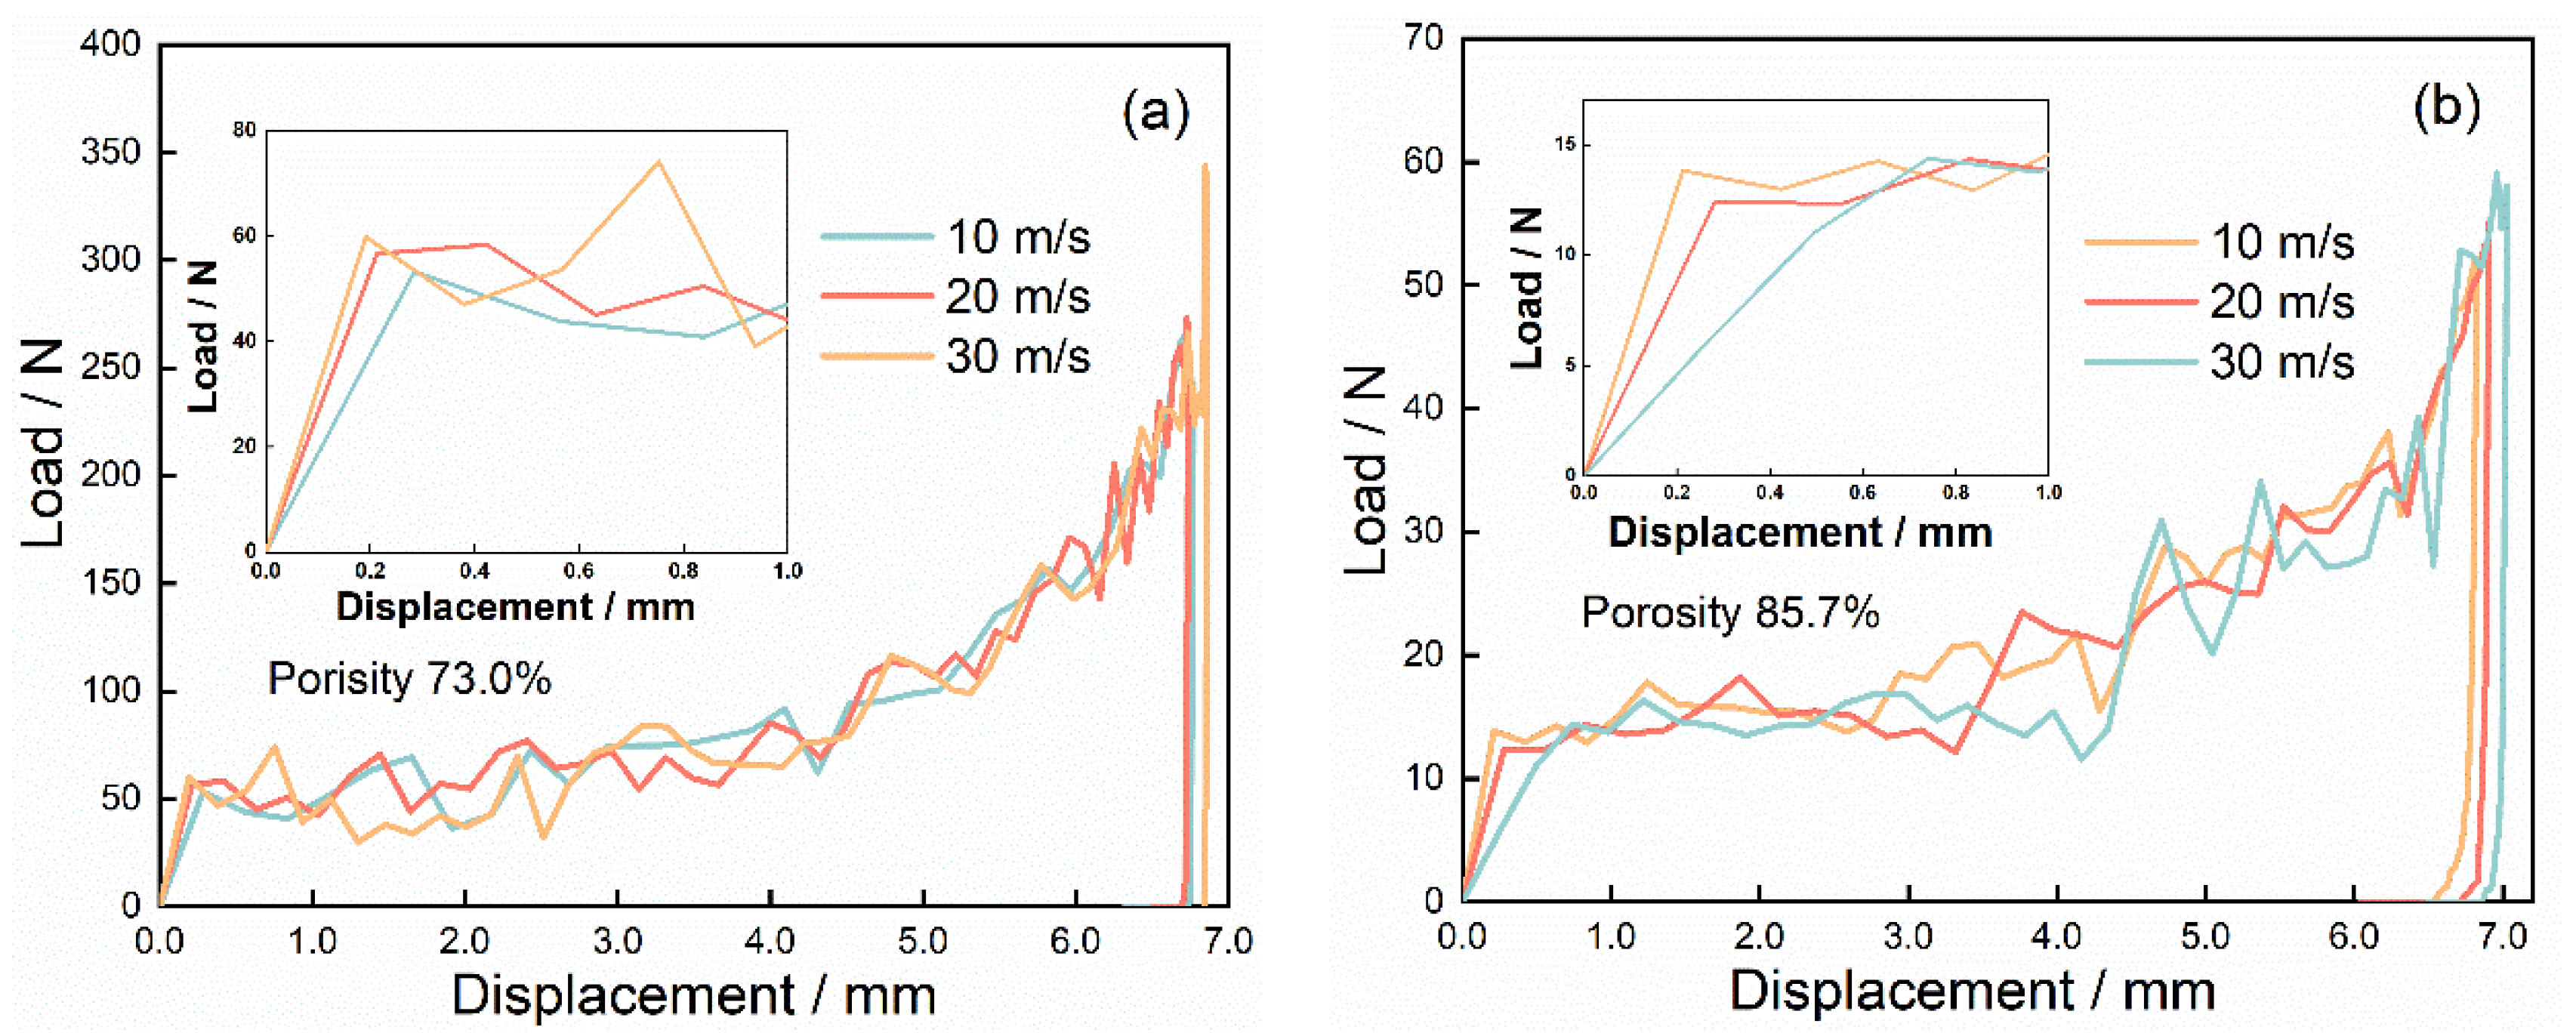
3.5. Simulation Results
4. Conclusions
- (1)
- The constant initial kinetic energy of 246.84 ± 3.27 J was subjected to the drop hammer impact system to ensure the tested specimen could fully absorb the energy.
- (2)
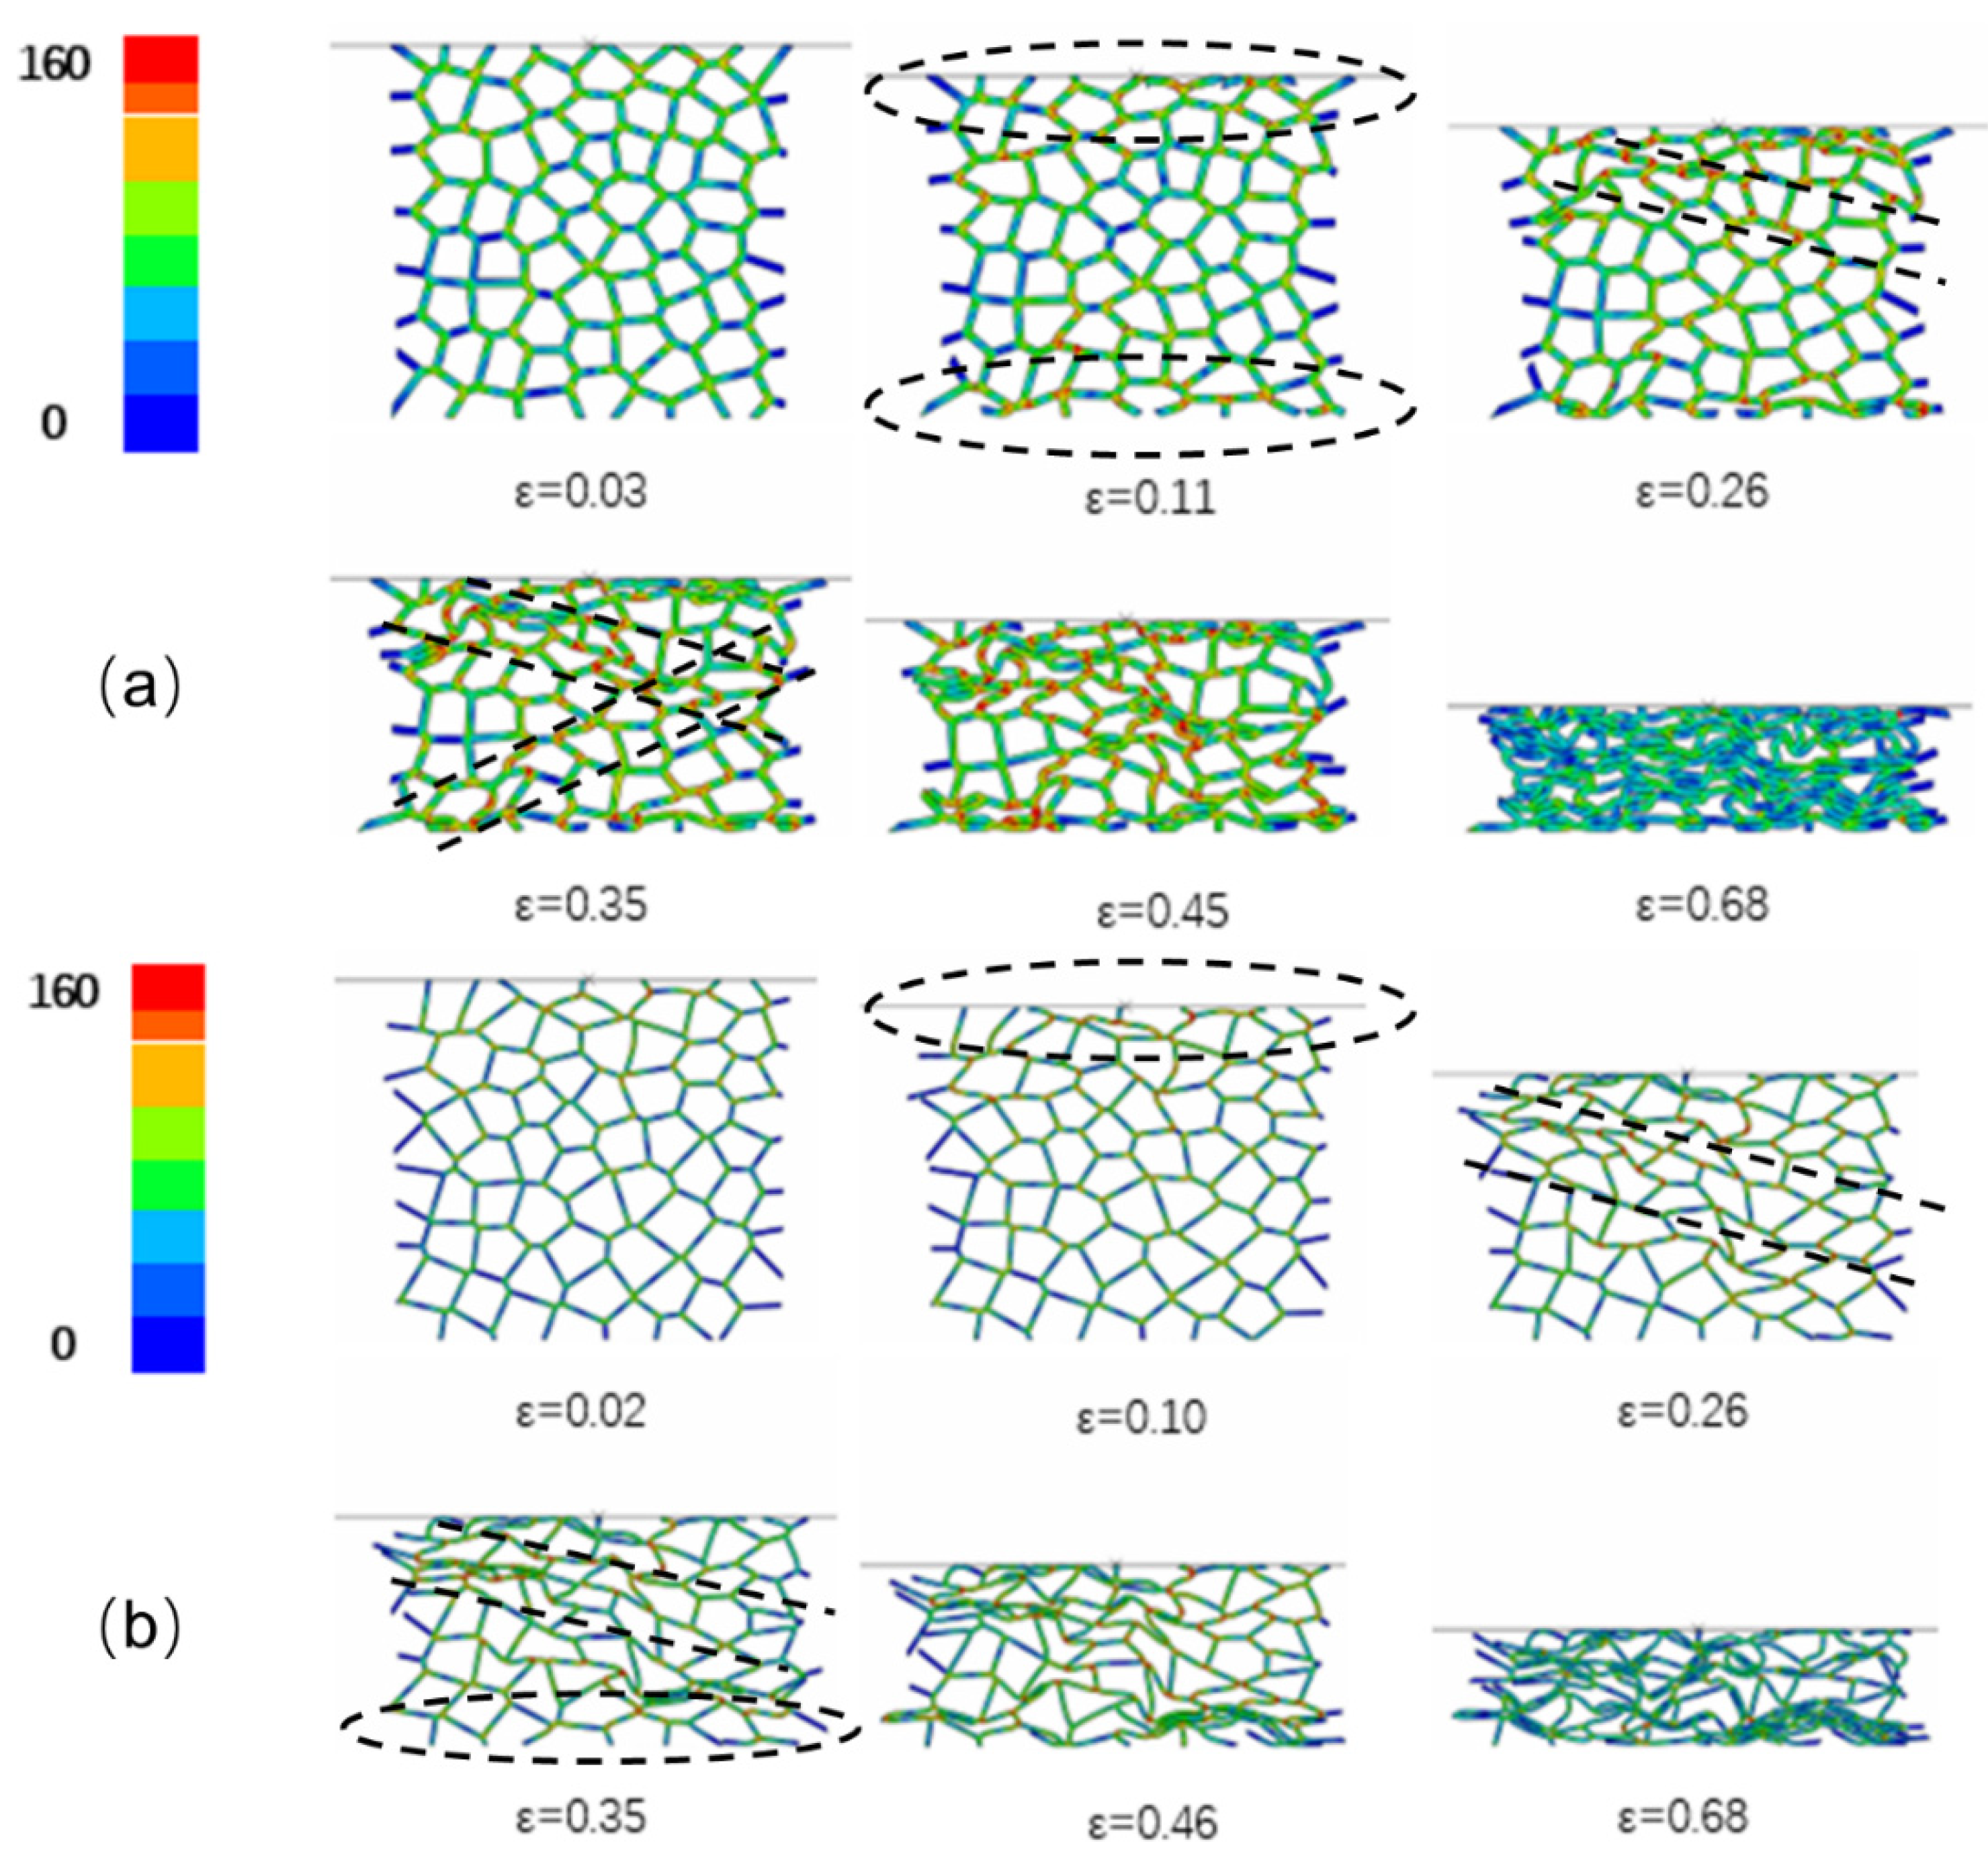
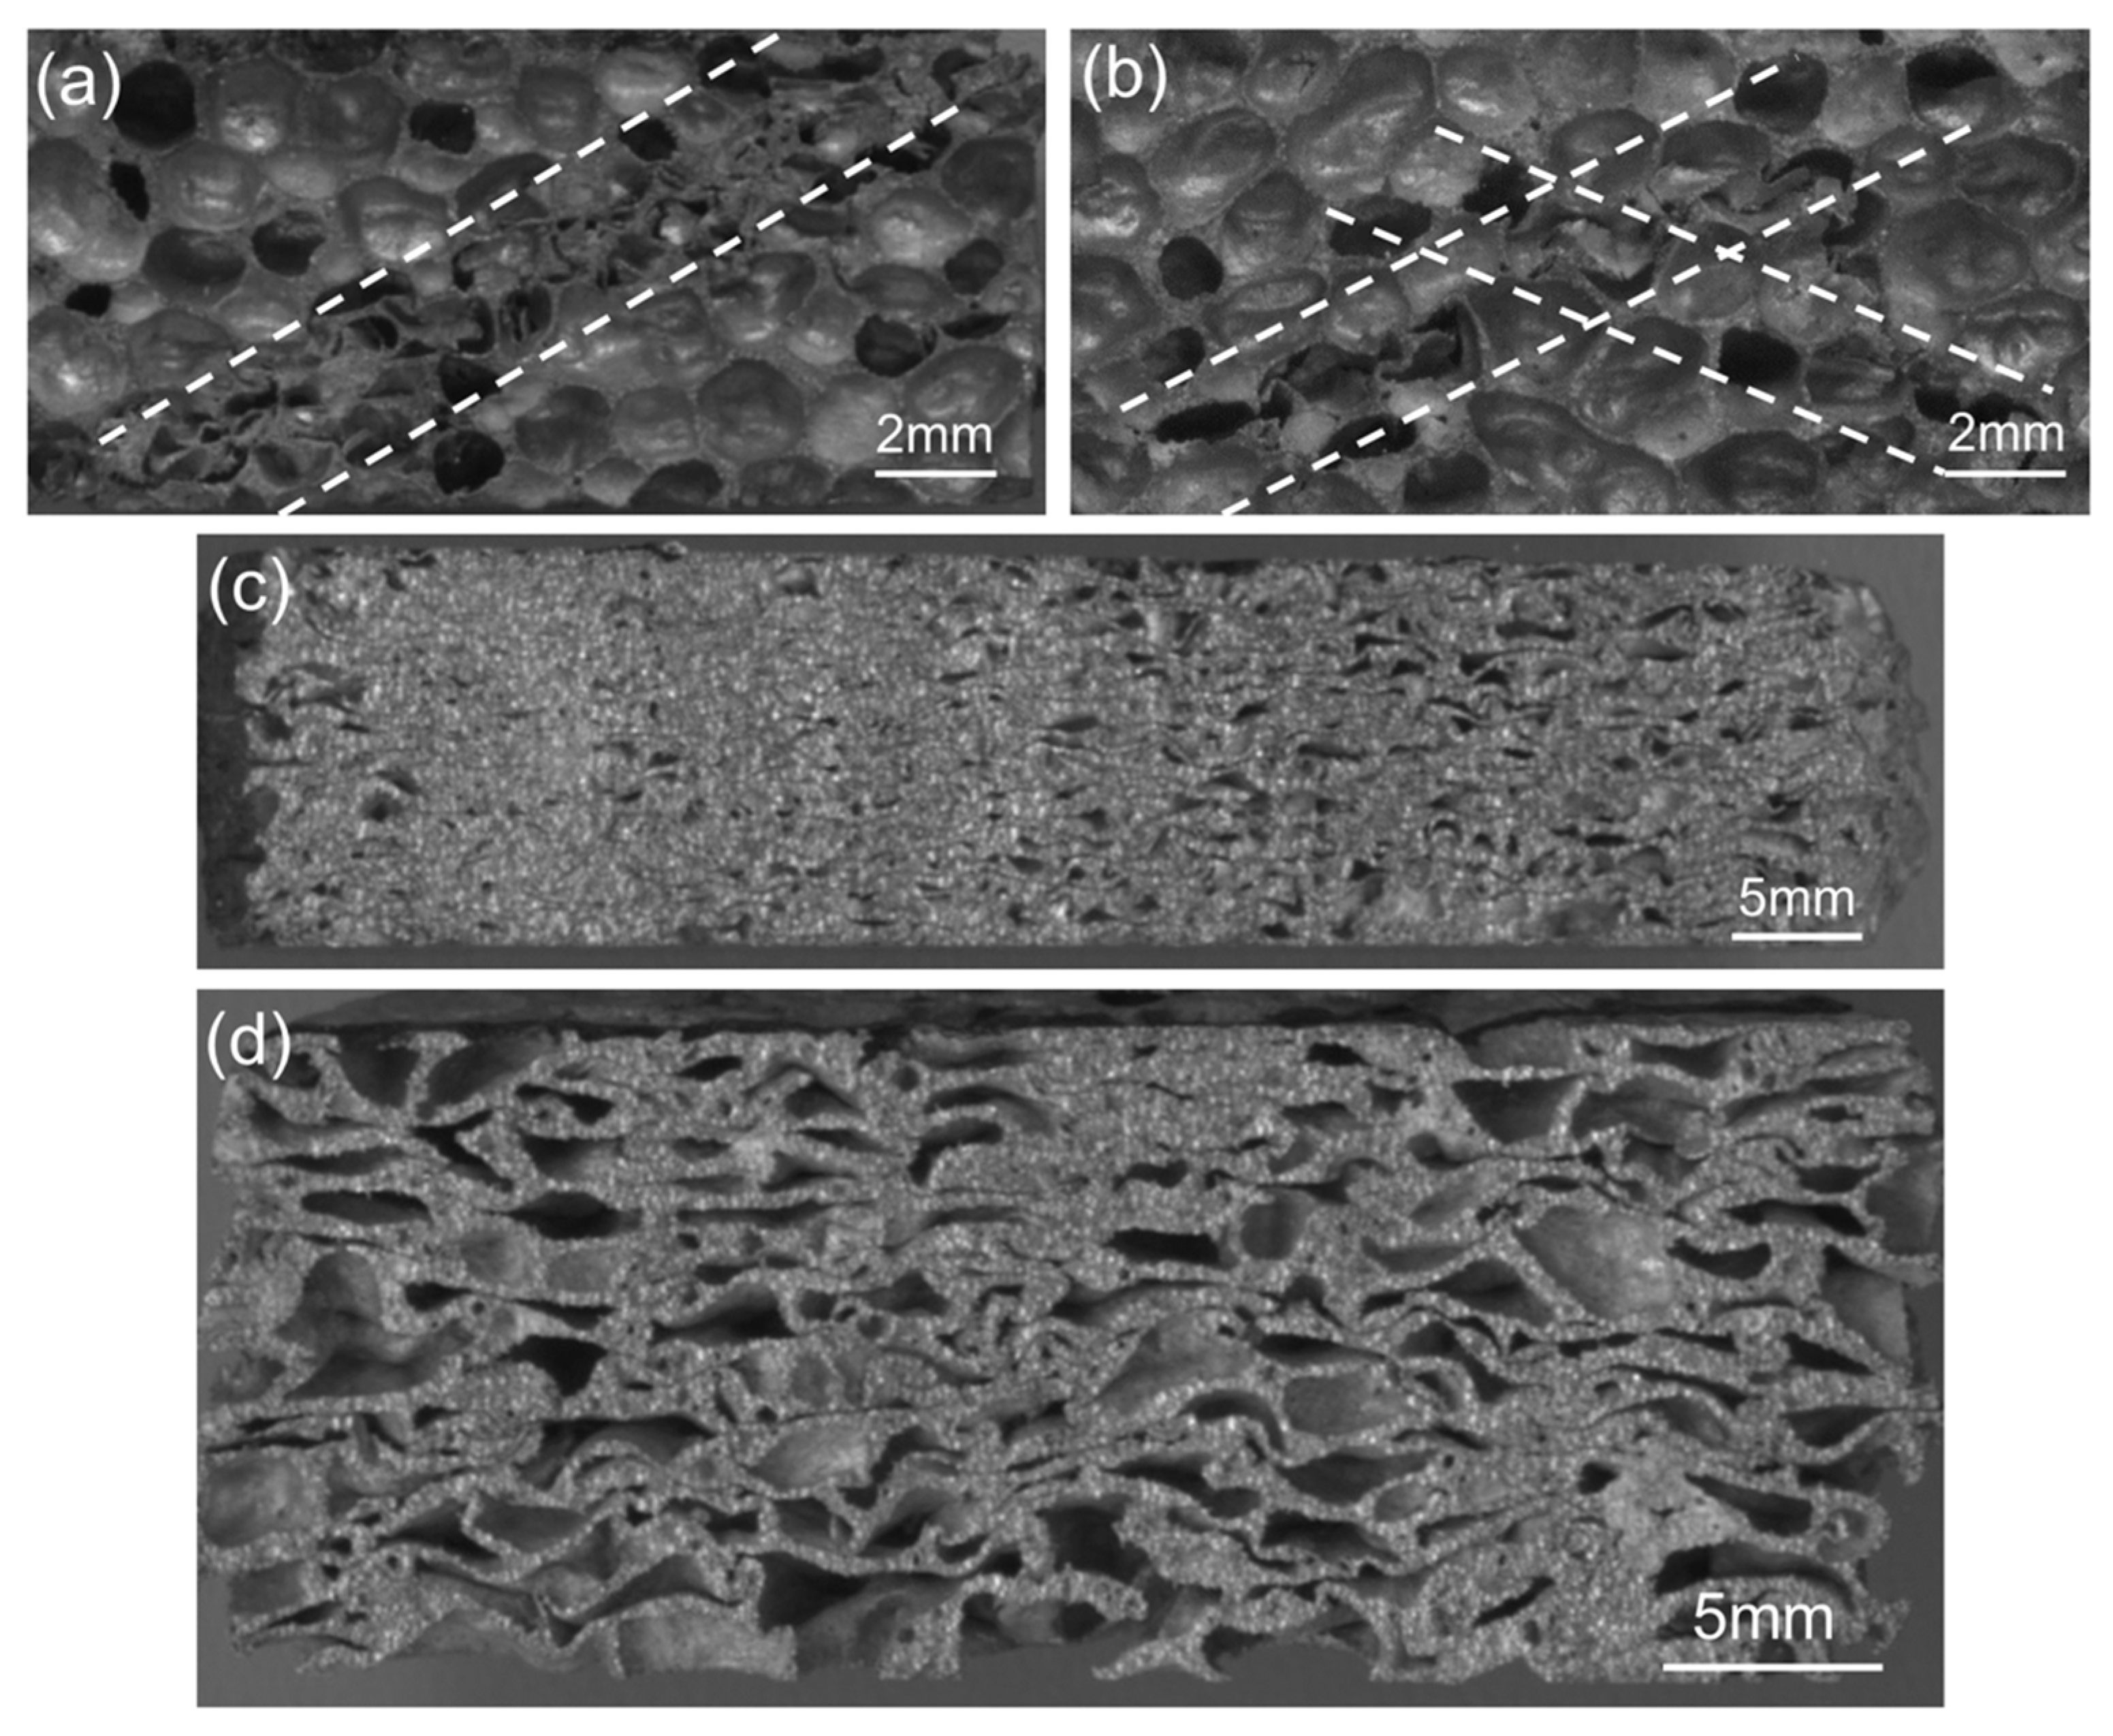
- During uniaxial impact crushing, specimens with different densities presented three damage modes containing steady state compression, nonsteady state compression, and mixed compression. In addition, the closed-cell Al foam specimens that underwent steady-state compression showed two deformation stages: the initial compression stage and the progressive crushing stage. Four failure modes during uniaxial impact were also found, representing separate energy absorption mechanisms.
- (3)
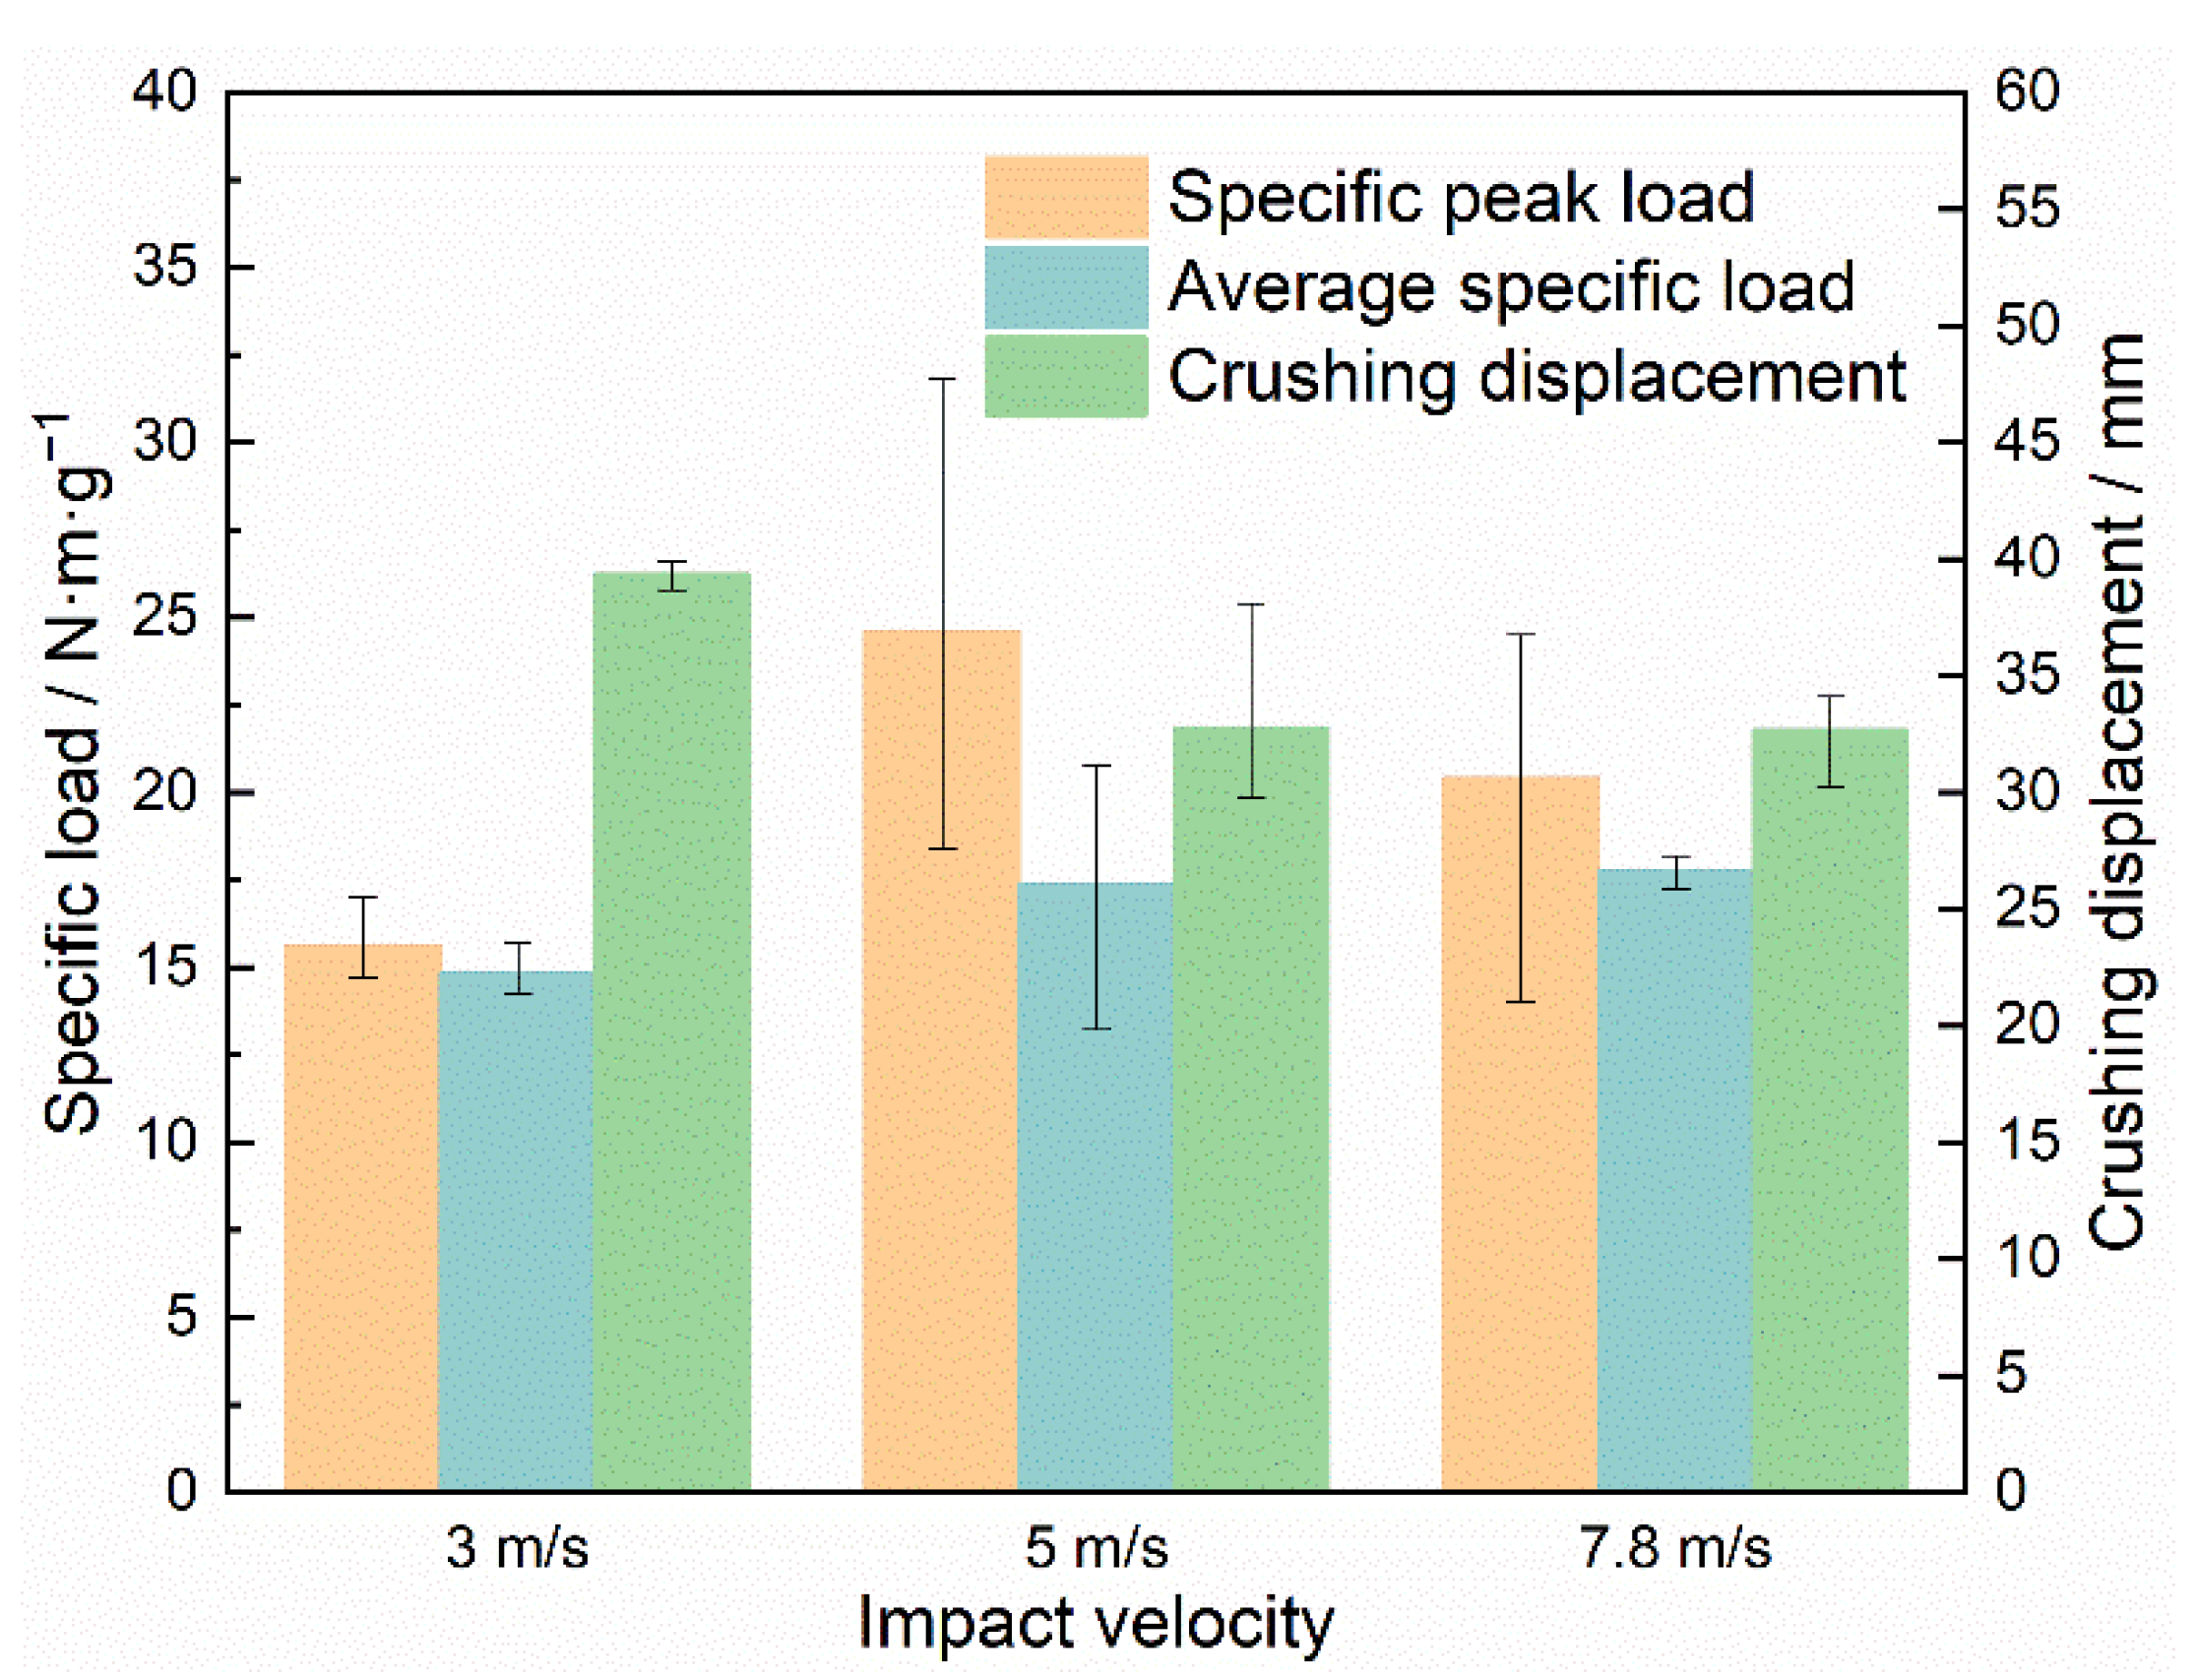
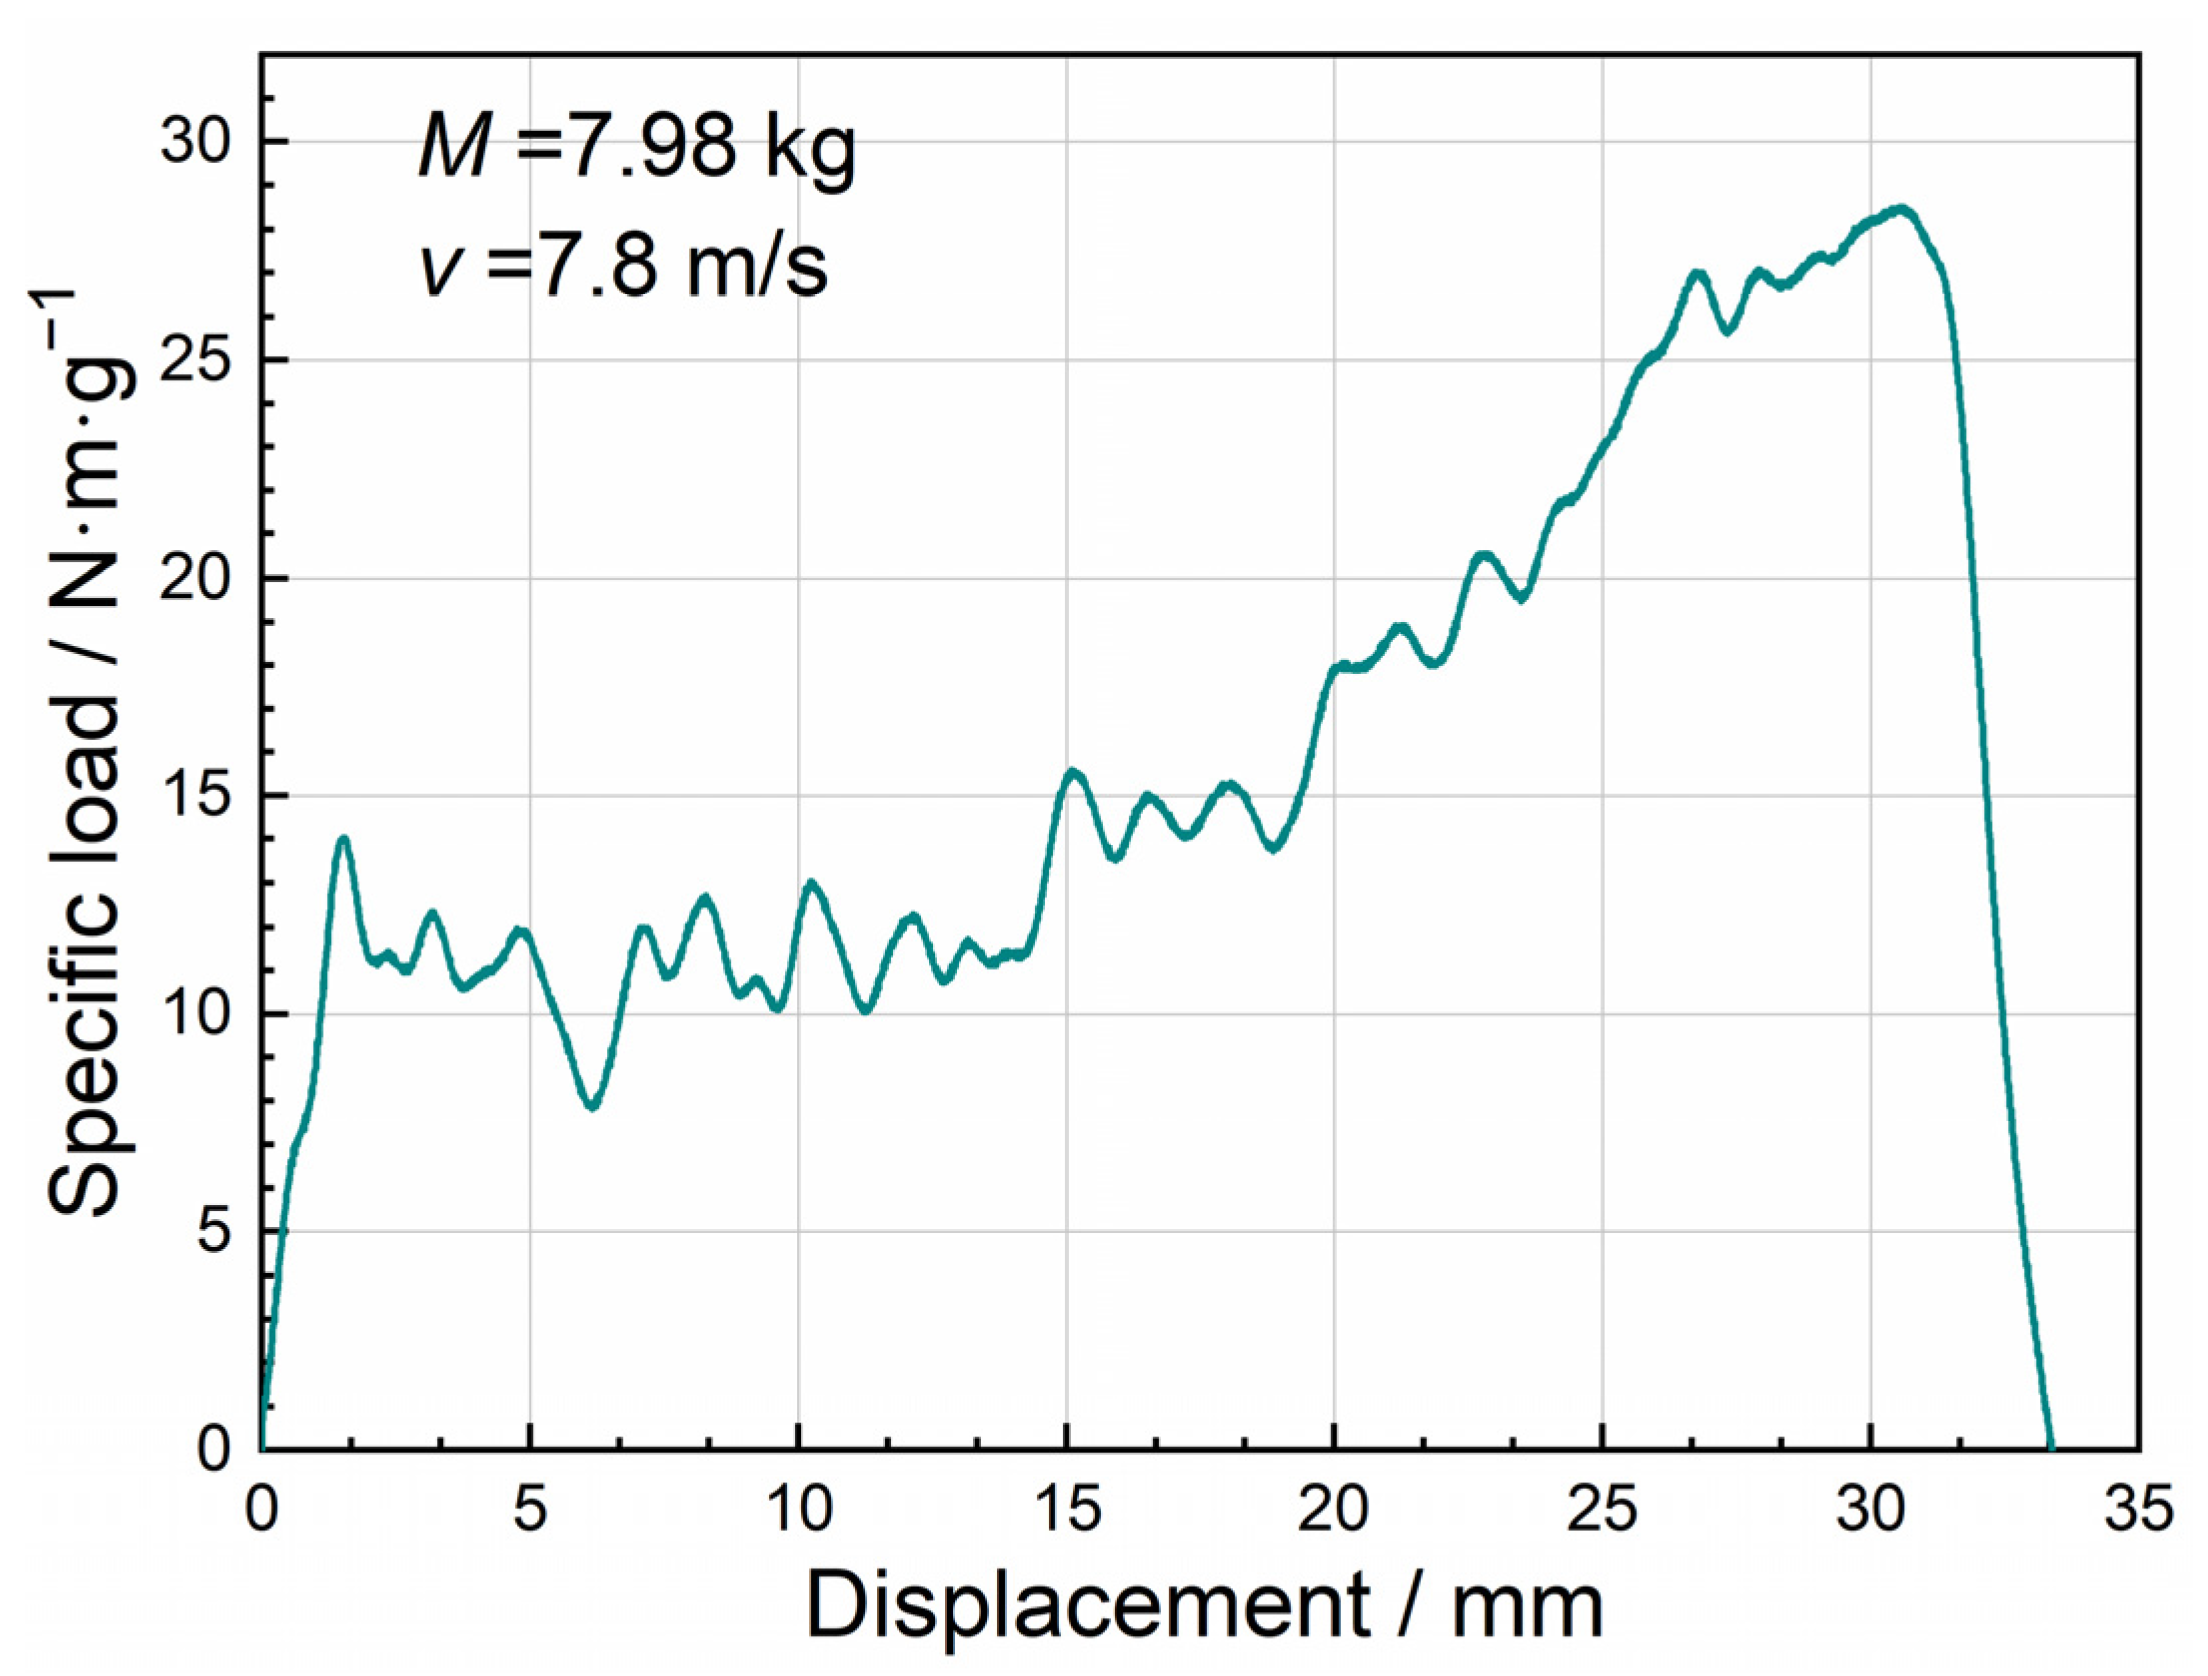
- The average specific loads increased from 14.83 N·m·g−1 to 17.74 N·m·g−1 as the impact velocities increased, while the specific peak loads did not exhibit significant impact velocity dependence.
- (4)
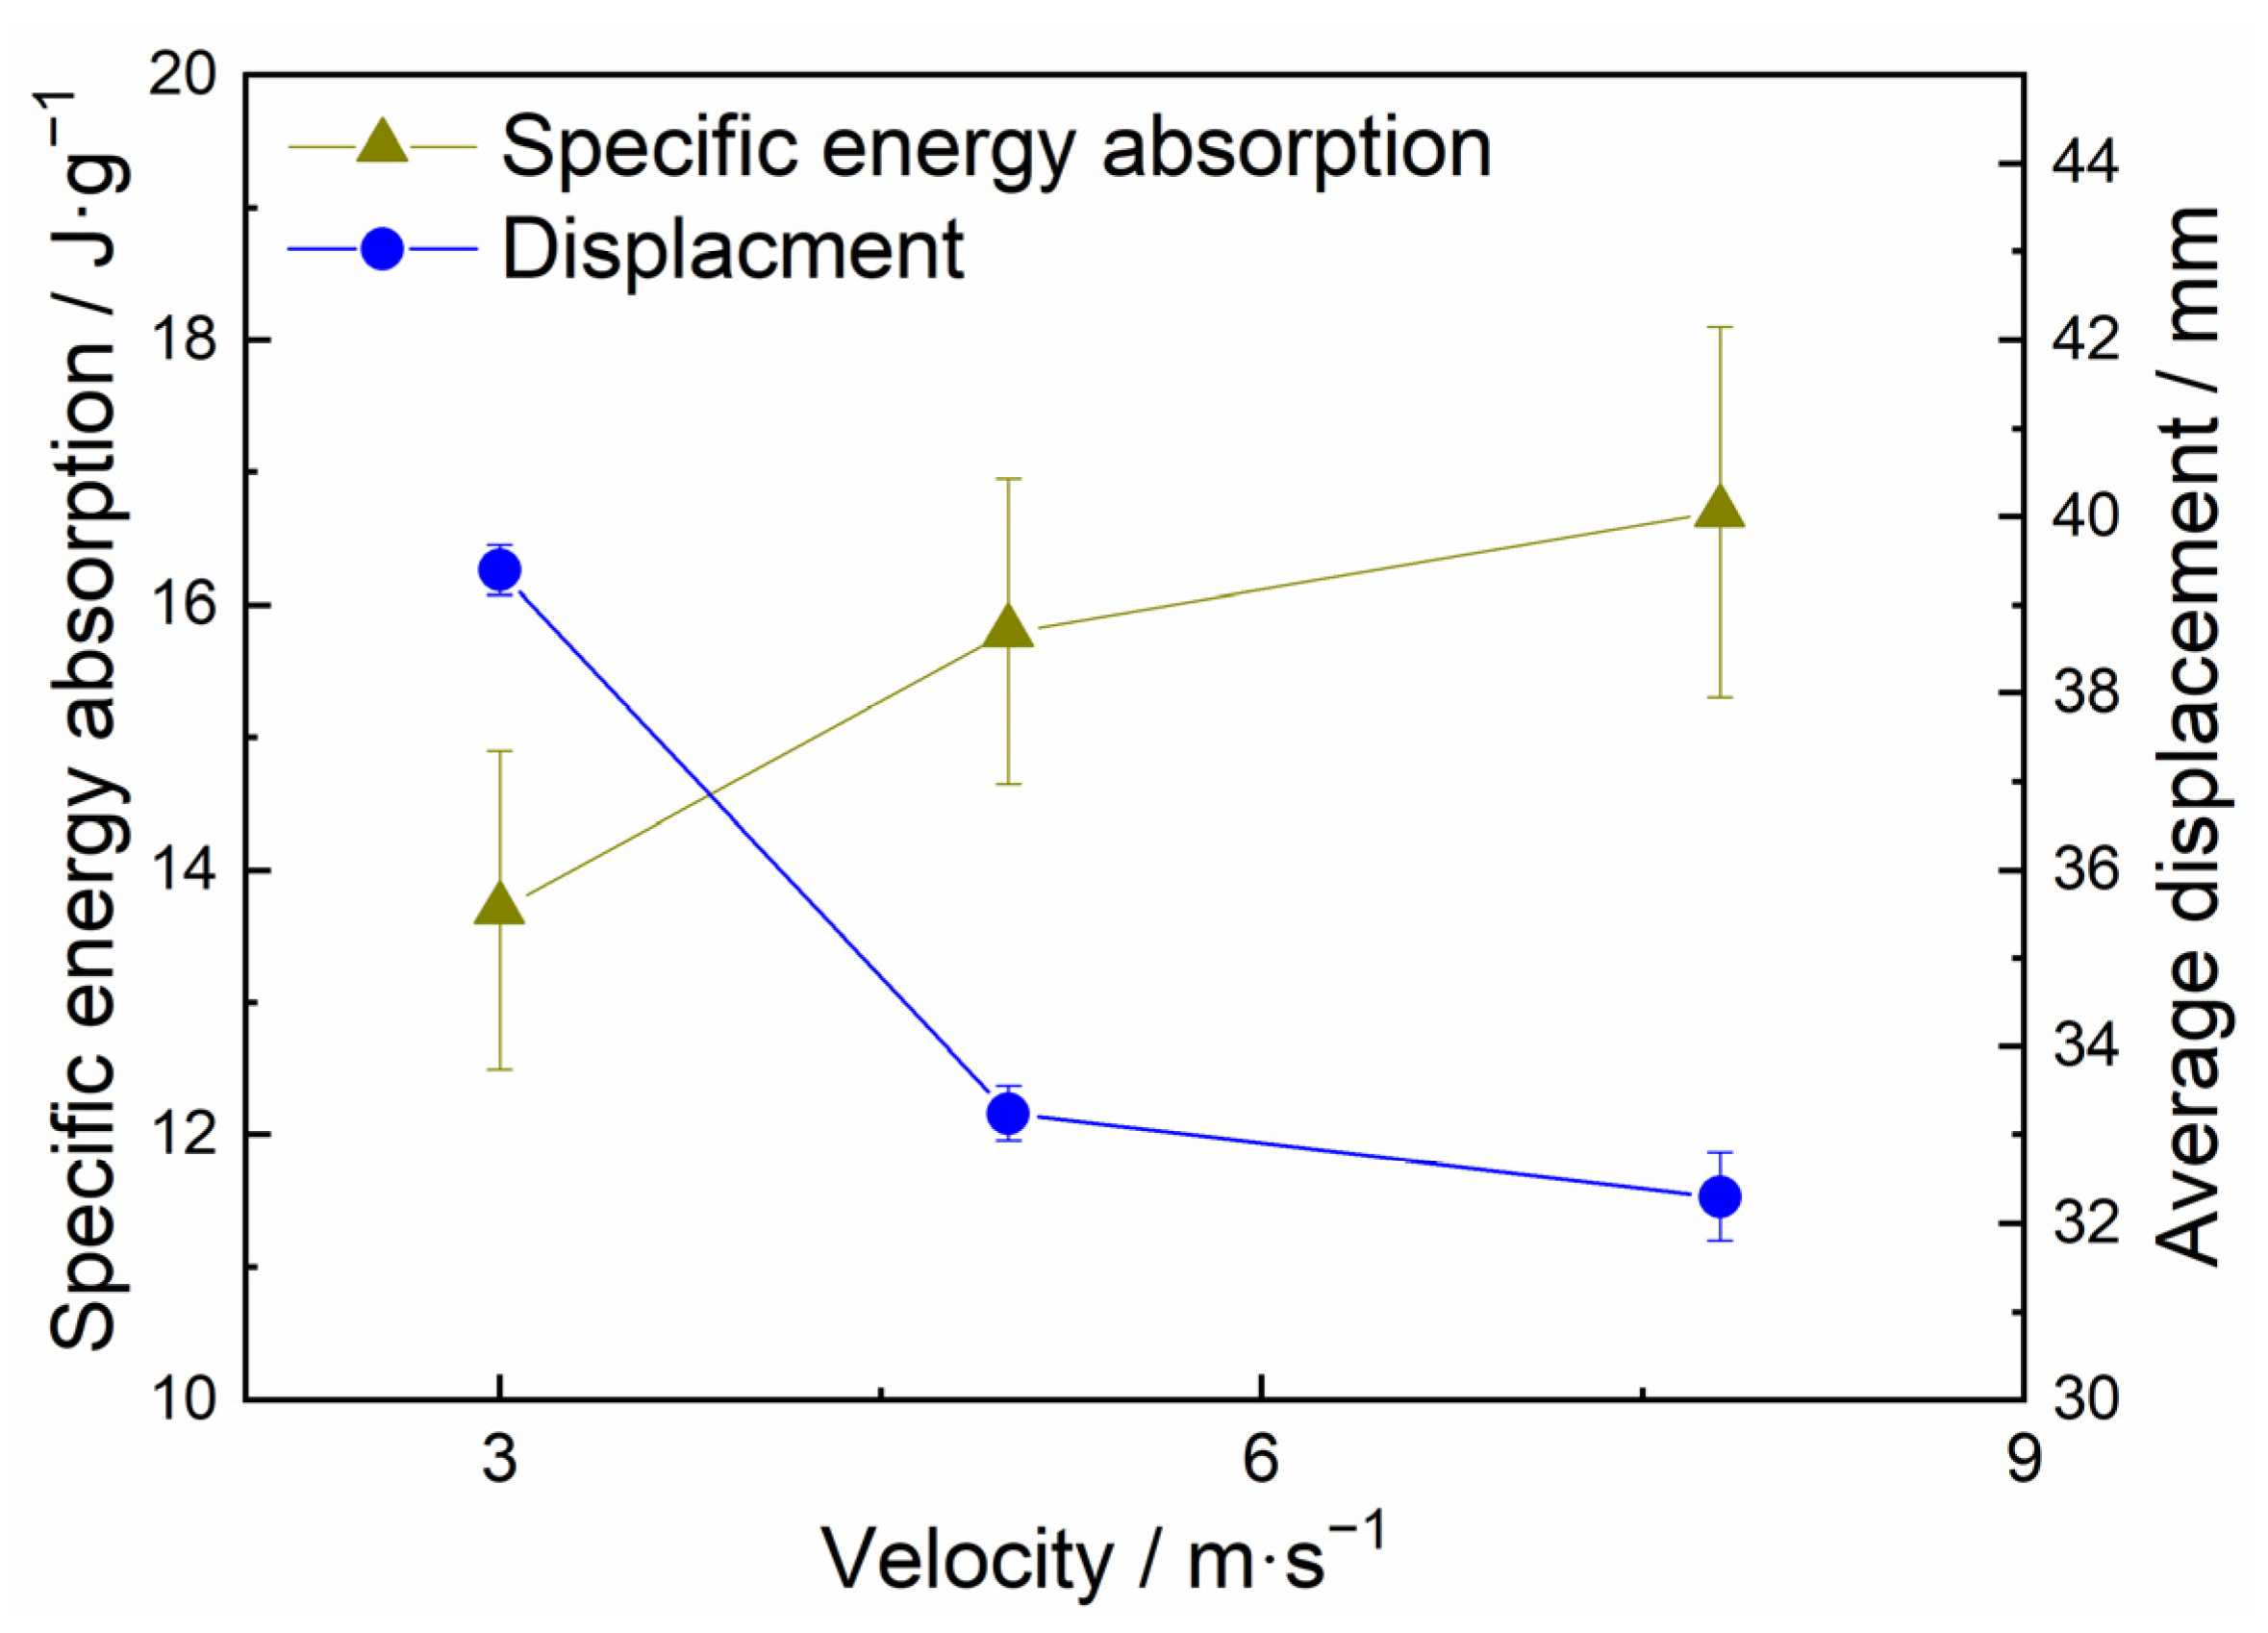
- The dynamic-specific energy absorption value was higher than the quasi-static value. Additionally, the specific energy absorption of the specimens increased with the increasing density (0.267 g/cm3–0.653 g/cm3) and the impact velocity. However, the specimens with higher specific energy absorption seemed not to indicate better cushioning performance due to the shorter crushing displacement.
- (5)
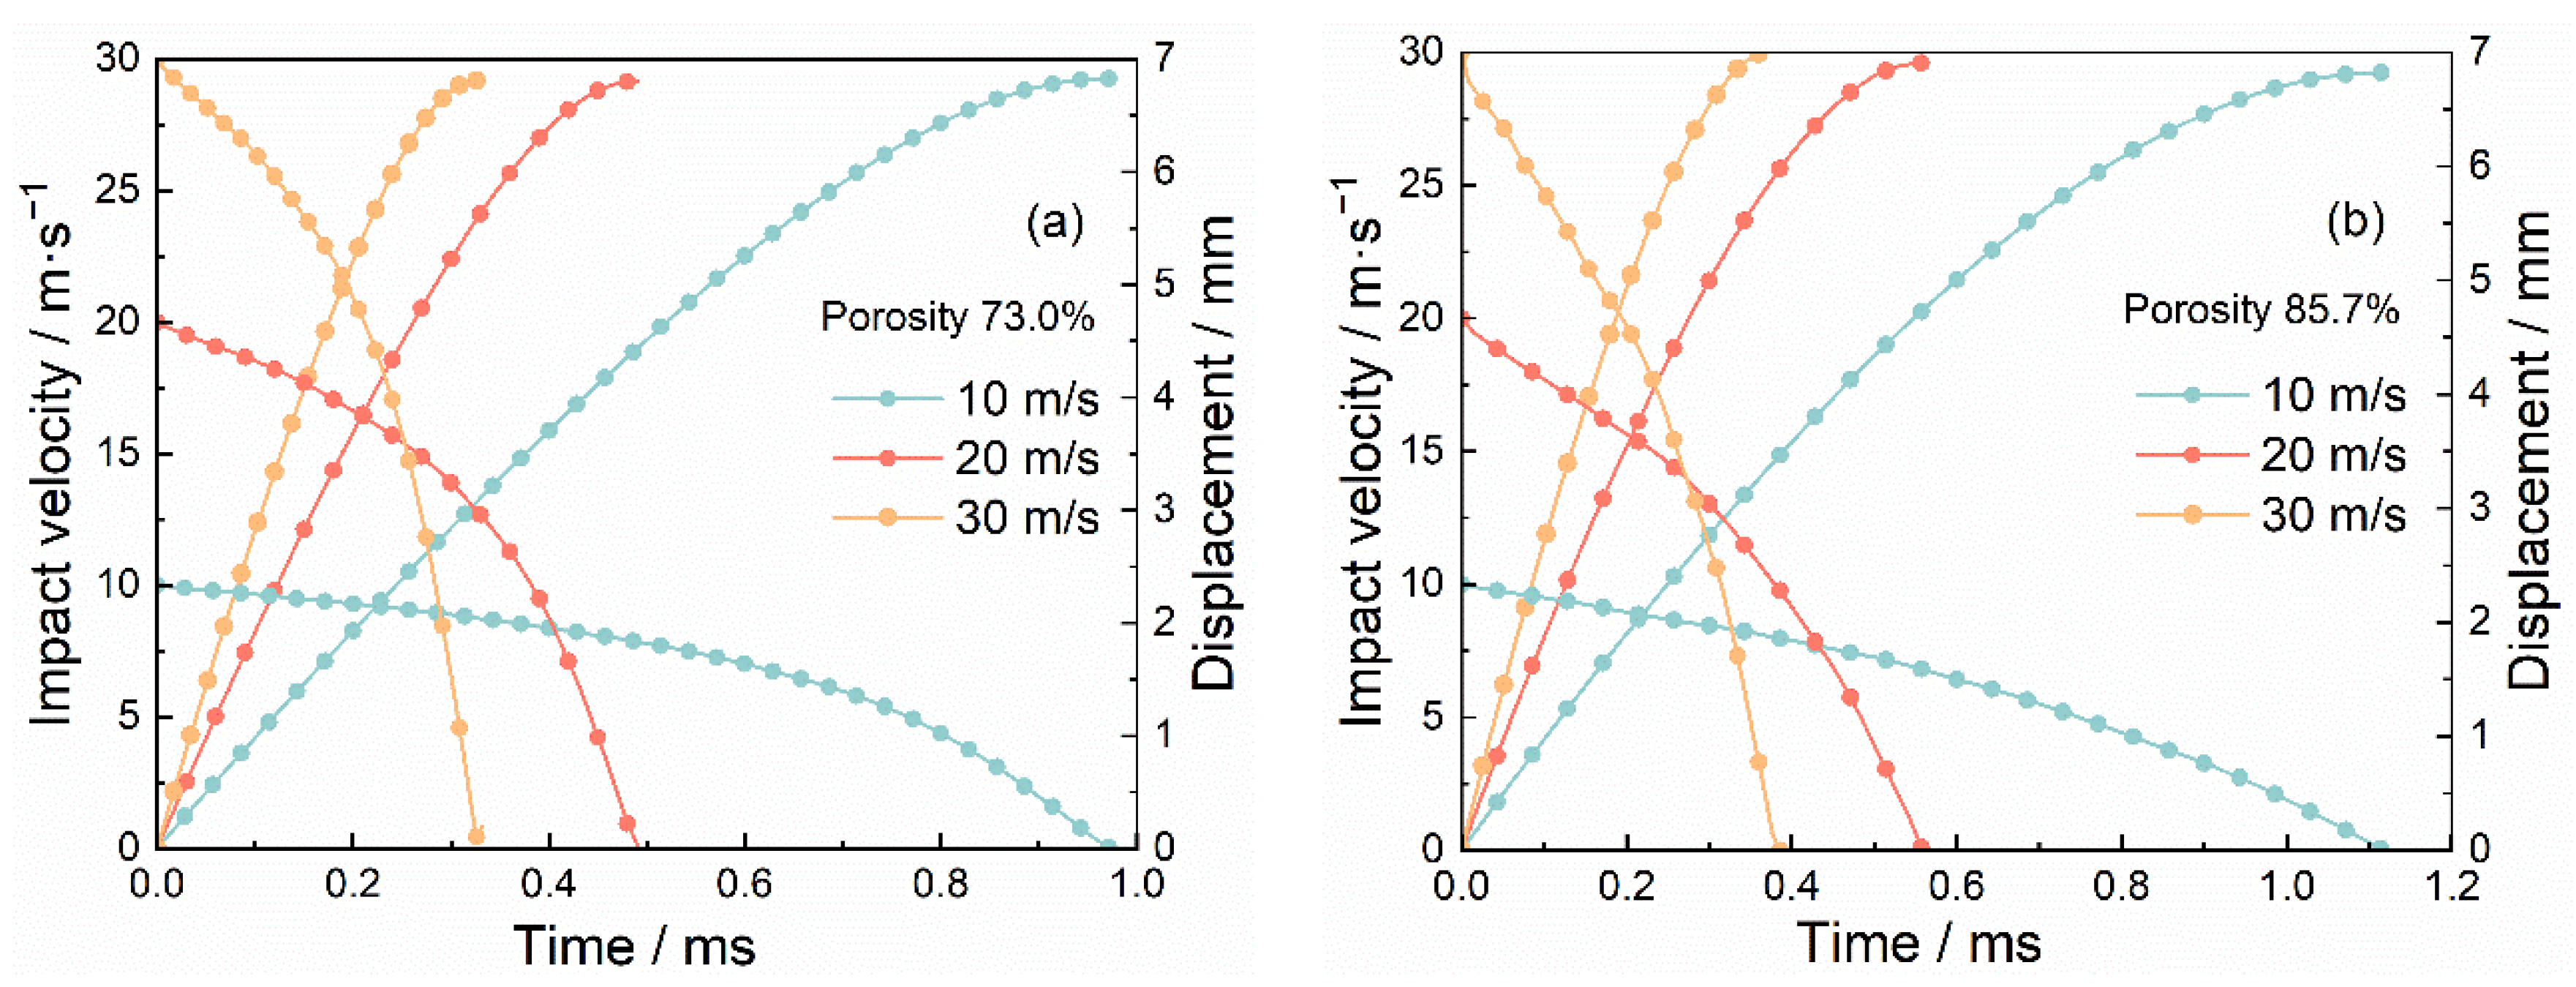
- The uniaxial impact simulations of two-dimensional (2D) Voronoi-based foam specimens with 73.0% and 85.7% porosity were conducted at higher impact velocities of 10 m/s, 20 m/s, and 30 m/s.
- (6)
- The simulation results of impact properties and deformation behavior agreed reasonably well with the experimental results, exhibiting similar velocity insensitivity of peak loads and deformation morphologies during uniaxial impact.
- (7)
- The numerical impact deformation process of closed-cell Al foam specimens could be summarized sequentially as end deformation and internal progressive deformation through the formation of multiple deformation bands.
Author Contributions
Funding
Conflicts of Interest
References
- Wan, T.; Liu, Y.; Zhou, C.; Chen, X.; Li, Y. Fabrication, properties, and applications of open-cell aluminum foams: A review. J. Mater. Sci. Technol. 2020, 62, 11–24. [Google Scholar] [CrossRef]
- Jinnapat, A.; Kennedy, A.R. The manufacture of spherical salt beads and their use as dissolvable templates for the production of cellular solids via a powder metallurgy route. J. Alloys Compd. 2010, 499, 43–47. [Google Scholar] [CrossRef]
- Papantoniou, I.G.; Markopoulos, A.P.; Pantelis, D.I.; Manolakos, D.E. Application of Aluminium Flakes in Fabrication of Open-Cell Aluminium Foams by Space Holder Method. Materials 2018, 11, 1420. [Google Scholar] [CrossRef] [PubMed]
- Marx, J.; Rabiei, A. Overview of Composite Metal Foams and Their Properties and Performance. Adv. Eng. Mater. 2017, 19, 1600776. [Google Scholar] [CrossRef]
- Jones, N. Recent Studies on the Dynamic Plastic Behavior of Structures. Appl. Mech. Rev. 1989, 42, 95–115. [Google Scholar] [CrossRef]
- Banhart, J. Manufacture, characterisation and application of cellular metals and metal foams. Prog. Mater. Sci. 2001, 46, 559–632. [Google Scholar] [CrossRef]
- Ashby, M.F.; Evans, A.G.; Fleck, N.A.; Gibson, L.J.; Hutchinson, J.W.; Wadley, H.N.G. Metal Foams: A Design Guide; Butterworth-Heinemann: Oxford, UK, 2000. [Google Scholar]
- Rajendran, R.; Sai, K.P.; Chandrasekar, B.; Gokhale, A.; Basu, S. Preliminary investigation of aluminium foam as an energy absorber for nuclear transportation cask. Mater. Des. 2008, 29, 1732–1739. [Google Scholar] [CrossRef]
- Gibson, L.J.; Ashby, M.F. Cellular Solids: Structure and Properties, 2nd ed.; Cambridge University Press: Cambridge, UK, 1997. [Google Scholar]
- Brothers, A.H.; Dunand, D.C. Mechanical properties of a density-graded replicated aluminum foam. Mater. Sci. Eng. A 2008, 489, 439–443. [Google Scholar] [CrossRef]
- Hassani, A.; Habibolahzadeh, A.; Bafti, H. Production of graded aluminum foams via powder space holder technique. Mater. Des. 2012, 40, 510–515. [Google Scholar] [CrossRef]
- Chen, Y.; Das, R.; Battley, M. Effects of cell size and cell wall thickness variations on the stiffness of closed-cell foams. Int. J. Solid Struct. 2015, 52, 150–164. [Google Scholar] [CrossRef]
- Chen, Y.; Das, R.; Battley, M. Effects of cell size and cell wall thickness variations on the strength of closed-cell foams. Int. J. Eng. Sci. 2017, 120, 220–240. [Google Scholar] [CrossRef]
- Zhu, H.; Hobdell, J.; Windle, A. Effects of cell irregularity on the elastic properties of open-cell foams. Acta Mater. 2000, 48, 4893–4900. [Google Scholar] [CrossRef]
- Andersons, J.; Kirpluks, M.; Stiebra, L.; Cabulis, U. Anisotropy of the stiffness and strength of rigid low-density closed-cell polyisocyanurate foams. Mater. Des. 2016, 92, 836–845. [Google Scholar] [CrossRef]
- Mu, Y.; Yao, G.; Liang, L.; Luo, H.; Zu, G. Deformation mechanisms of closed-cell aluminum foam in compression. Scr. Mater. 2010, 63, 629–632. [Google Scholar] [CrossRef]
- Song, H.-W.; Wan, Z.-M.; Xie, Z.-M.; Du, X.-W. Axial impact behavior and energy absorption efficiency of composite wrapped metal tubes. Int. J. Impact Eng. 2000, 24, 385–401. [Google Scholar] [CrossRef]
- Liu, H.; Cao, Z.; Luo, H.; Shi, J.; Yao, G. Performance of closed-cell aluminum foams subjected to impact loading. Mater. Sci. Eng. A 2012, 570, 27–31. [Google Scholar] [CrossRef]
- Liang, C.; Zhao, Y.Y. Experimental and analytical study on homogeneous and layered Al matrix syntactic foams under impact. Int. J. Impact Eng. 2021, 153, 103861. [Google Scholar] [CrossRef]
- Woldesenbet, E. Low velocity impact properties of nanoparticulate syntactic foams. Mater. Sci. Eng. A 2008, 496, 217–222. [Google Scholar] [CrossRef]
- Calladine, C.; English, R. Strain-rate and inertia effects in the collapse of two types of energy-absorbing structure. Int. J. Mech. Sci. 1984, 26, 689–701. [Google Scholar] [CrossRef]
- Zhao, H.; Elnasri, I.; Abdennadher, S. An experimental study on the behaviour under impact loading of metallic cellular materials. Int. J. Mech. Sci. 2005, 47, 757–774. [Google Scholar] [CrossRef]
- Hanssen, A.; Langseth, M.; Hopperstad, O. Static and dynamic crushing of circular aluminium extrusions with aluminium foam filler. Int. J. Impact Eng. 2000, 24, 475–507. [Google Scholar] [CrossRef]
- Ramachandra, S.; Sudheer, K.P.; Ramamurty, U. Impact energy absorption in an Al foam at low velocities. Scr. Mater. 2003, 49, 741–745. [Google Scholar] [CrossRef]
- Tan, P.J.; Reid, S.R.; Harrigan, J.J.; Zou, Z.; Li, S. Dynamic compressive strength properties of aluminum foams. Part I—experimental data and observations. J. Mech. Phys. Solids 2005, 53, 2174–2205. [Google Scholar] [CrossRef]
- Yang, K.; Yang, X.; Liu, E.; Shi, C.; Ma, L.; He, C.; Li, Q.; Li, J.; Zhao, N. High strain rate dynamic compressive properties and deformation behavior of Al matrix composite foams reinforced by in-situ grown carbon nanotubes. Mater. Sci. Eng. A 2018, 729, 487–495. [Google Scholar] [CrossRef]
- Guo, C.; Zou, T.; Shi, C.; Yang, X.; Zhao, N.; Liu, E.; He, C. Compressive properties and energy absorption of aluminum composite foams reinforced by in-situ generated MgAl2O4 whiskers. Mater. Sci. Eng. A 2015, 645, 1–7. [Google Scholar] [CrossRef]
- Movahedi, N.; Vesenjak, M.; Krstulović-Opara, L.; Belova, I.V.; Murch, G.E.; Fiedler, T. Dynamic compression of functionally-graded metal syntactic foams. Compos. Struct. 2021, 261, 113308. [Google Scholar] [CrossRef]
- Wang, Y.; Liu, Q.; Zhang, B.; Zhang, H.; Jin, Y.; Zhong, Z.; Ye, J.; Ren, Y.; Ye, F.; Wang, W. Dynamic compressive response and impact resistance of bioinspired nacre-like 2024Al/B4C composites. Mater. Sci. Eng. A 2021, 831, 142261. [Google Scholar] [CrossRef]
- Balch, D.K.; Dunand, D.C. Load partitioning in aluminum syntactic foams containing ceramic microspheres. Acta Mater. 2006, 54, 1501–1511. [Google Scholar] [CrossRef]
- Luong, D.D.; Strbik, O.M.; Hammond, V.H.; Gupta, N.; Cho, K. Development of high performance lightweight aluminum alloy/SiC hollow sphere syntactic foams and compressive characterization at quasi-static and high strain rates. J. Alloys Compd. 2013, 550, 412–422. [Google Scholar] [CrossRef]
- Kader, M.; Islam, M.; Saadatfar, M.; Hazell, P.; Brown, A.; Ahmed, S.; Escobedo, J. Macro and micro collapse mechanisms of closed-cell aluminium foams during quasi-static compression. Mater. Des. 2017, 118, 11–21. [Google Scholar] [CrossRef]
- Nayyeri, M.J.; Mirbagheri, S.M.H.; Fatmehsari, D.H. Compressive behavior of tailor-made metallic foams (TMFs): Numerical simulation and statistical modeling. Mater. Des. 2015, 84, 223–230. [Google Scholar] [CrossRef]
- Zheng, Z.; Wang, C.; Yu, J.; Reid, S.R.; Harrigan, J.J. Dynamic stress—Strain states for metal foams using a 3D cellular model. J. Mech. Phys. Solids 2014, 72, 93–114. [Google Scholar] [CrossRef]
- Sun, G.; Wang, E.; Wang, H.; Xiao, Z.; Li, Q. Low-velocity impact behaviour of sandwich panels with homogeneous and stepwise graded foam cores. Mater. Des. 2018, 160, 1117–1136. [Google Scholar] [CrossRef]
- Roszkos, C.S.; Bocko, J.; Kula, T.; Šarloši, J. Static and dynamic analyses of aluminum foam geometric models using the homogenization procedure and the FEA. Compos. Part B Eng. 2019, 171, 361–374. [Google Scholar] [CrossRef]
- Belardi, V.; Fanelli, P.; Trupiano, S.; Vivio, F. Multiscale analysis and mechanical characterization of open-cell foams by simplified FE modeling. Eur. J. Mech. A Solids 2021, 89, 104291. [Google Scholar] [CrossRef]
- Wang, E.; Sun, G.; Zheng, G.; Li, Q. Characterization of initial and subsequent yield behaviors of closed-cell aluminum foams under multiaxial loadings. Compos. Part B Eng. 2020, 202, 108247. [Google Scholar] [CrossRef]
- Petit, C.; Maire, E.; Meille, S.; Adrien, J. Two-scale study of the fracture of an aluminum foam by X-ray tomography and finite element modeling. Mater. Des. 2017, 120, 117–127. [Google Scholar] [CrossRef]
- Jung, A.; Diebels, S. Microstructural characterisation and experimental determination of a multiaxial yield surface for open-cell aluminium foams. Mater. Des. 2017, 131, 252–264. [Google Scholar] [CrossRef]
- Zhang, J.; Wang, Z.; Zhao, L. Dynamic response of functionally graded cellular materials based on the Voronoi model. Compos. Part B Eng. 2016, 85, 176–187. [Google Scholar] [CrossRef]
- Marvi-Mashhadi, M.; Lopes, C.; Llorca, J. High fidelity simulation of the mechanical behavior of closed-cell polyurethane foams. J. Mech. Phys. Solids 2020, 135, 103814. [Google Scholar] [CrossRef]
- Yu, H.; Guo, Z.; Li, B.; Yao, G.; Luo, H.; Liu, Y. Research into the effect of cell diameter of aluminum foam on its compressive and energy absorption properties. Mater. Sci. Eng. A 2007, 454–455, 542–546. [Google Scholar] [CrossRef]
- Roberts, A.; Garboczi, E. Elastic properties of model random three-dimensional open-cell solids. J. Mech. Phys. Solids 2002, 50, 33–55. [Google Scholar] [CrossRef]


| Porosity of Specimen | Initial Kinetic Energy (J) | Impact Velocity (m/s) | Mass of Hammer (Kg) | Step Time (s) |
|---|---|---|---|---|
| 73.0% | 0.6 | 10 | 0.0120 | 0.0010 |
| 73.0% | 0.6 | 20 | 0.0030 | 0.0007 |
| 73.0% | 0.6 | 30 | 0.0014 | 0.0004 |
| 85.7% | 0.15 | 10 | 0.00300 | 0.0010 |
| 85.7% | 0.15 | 20 | 0.00075 | 0.0007 |
| 85.7% | 0.15 | 30 | 0.00033 | 0.0004 |
| Specimen’s Porosity (%) | Impact Velocity (m/s) | Peak Load (N) | Crushing Displacement (mm) | Energy Absorption (J) |
|---|---|---|---|---|
| 73.0 | 10 | 53.88 | 6.77 | 0.603 |
| 73.0 | 20 | 56.25 | 6.73 | 0.599 |
| 73.0 | 30 | 61.12 | 6.86 | 0.601 |
| 85.7 | 10 | 13.70 | 6.82 | 0.146 |
| 85.7 | 20 | 12.50 | 6.90 | 0.145 |
| 85.7 | 30 | 14.26 | 7.02 | 0.143 |
Publisher’s Note: MDPI stays neutral with regard to jurisdictional claims in published maps and institutional affiliations. |
© 2022 by the authors. Licensee MDPI, Basel, Switzerland. This article is an open access article distributed under the terms and conditions of the Creative Commons Attribution (CC BY) license (https://creativecommons.org/licenses/by/4.0/).
Share and Cite
Xia, Y.; Shi, J.; Mu, Y. Dynamic Response and Numerical Simulation of Closed-Cell Al Foams. Materials 2022, 15, 8207. https://doi.org/10.3390/ma15228207
Xia Y, Shi J, Mu Y. Dynamic Response and Numerical Simulation of Closed-Cell Al Foams. Materials. 2022; 15(22):8207. https://doi.org/10.3390/ma15228207
Chicago/Turabian StyleXia, Yinzheng, Jianchao Shi, and Yongliang Mu. 2022. "Dynamic Response and Numerical Simulation of Closed-Cell Al Foams" Materials 15, no. 22: 8207. https://doi.org/10.3390/ma15228207
APA StyleXia, Y., Shi, J., & Mu, Y. (2022). Dynamic Response and Numerical Simulation of Closed-Cell Al Foams. Materials, 15(22), 8207. https://doi.org/10.3390/ma15228207