Article

Performance of an Innovative Low-Cost Recycled Filling (LCRF) in Anaerobic Treatment of Dairy Effluent—A Pilot-Scale Study

by
Marcin Zieliński
1,*,
Marcin Dębowski
1 and
Joanna Kazimierowicz
2
1
Department of Environmental Engineering, Faculty of Geoengineering, University of Warmia and Mazury in Olsztyn, 10-720 Olsztyn, Poland
2
Department of Water Supply and Sewage Systems, Faculty of Civil Engineering and Environmental Sciences, Bialystok University of Technology, 15-351 Bialystok, Poland
*
Author to whom correspondence should be addressed.
Materials 2022, 15(21), 7815; https://doi.org/10.3390/ma15217815
Submission received: 5 September 2022 / Revised: 28 October 2022 / Accepted: 1 November 2022 / Published: 5 November 2022
(This article belongs to the Special Issue Environmentally-Friendly Materials in Wastewater Treatment)

Abstract

:
The rapid growth in dairy production leads to increasing outputs of high-load effluent, necessitating new methods of treating such waste. Anaerobic processes have been increasingly popular but are hamstrung by limited nutrient removal efficiency. The aim of the present study was to investigate whether low-cost recycled filling (LCRF) improves the anaerobic treatment of dairy effluent. The addition of LCRF was found to increase both COD removal (86.1 ± 2.6%–92.8 ± 1.6%) and Ptot. removal (22.1 ± 3.5% to 36.9 ± 4.6%) from the wastewater. The LCRF ensured near-neutral pH and stabilized the structure of the anaerobic microbe community (including Archaea) across all pollutant loads tested. This translated to efficient biogas production and high methane content in the LCRF reactors, peaking at 0.35 ± 0.01 m3/kg CODremoved and 68.2 ± 0.6% (respectively) in the best-performing variant.

1. Introduction

According to the Food and Agriculture Organization of the United Nations (FAO) data from 2020, the global market for milk is approximately 852 million tons and is steadily growing [1,2]. The largest producers are India, the European Union (EU) and the USA, at 196.2 million, 167.4 million and 99.2 million tons produced, respectively. The Organization for Economic Co-operation and Development (OECD) expects global annual milk production to reach 997 million tons by 2029 [3,4]. This growth in milk production goes hand in hand with the increased generation of wastewater, whose properties make it dangerous to aquatic ecosystems [5,6]. According to the European Dairy Association (EDA), liquid waste from dairy production mostly consists of waste milk and process waste (including industrial cleaning and rinsing water), with small volumes of sanitary wastewater [7,8]. Milk and fat losses during cheese production are estimated at 0.2% and 0.1% (respectively), whereas during drinking milk production, are 1.9% and 0.7%, respectively [8]. Dairy wastewater contains large amounts of organic and biogenic compounds, though actual levels observed have proven highly variable due to differences in water volumes used, types of dairy produced, and processing methods [9]. Water input needed to produce 1 m3 of processed milk can be anywhere from 1 to 10 m3, leading to differences in wastewater output and pollutant concentrations [10].
The high pollutant levels in dairy wastewater can aggravate eutrophication and degradation of natural water bodies if discharged directly into the environment [11]. Therefore, effective methods are needed to remove pollutants and prevent negative impacts on receiving water bodies [12]. Anaerobic wastewater treatment (AWT) is one such process, which has been growing in popularity [13]. The prevalence of anaerobic digesters stems from their many major advantages over aerobic activated-sludge or biofilter processes. [14]. The most frequently cited benefits are: effective treatment of high-OLR sewage, ability to accommodate high OLRs, relatively small size and space requirements as well as markedly lower investment and operation costs compared with aerobic technologies [15]. Anaerobic systems generate less surplus sludge, provide better sludge stabilization and lead to improved sanitary indicators, which directly facilitates neutralization and management. A key feature is their ability to produce methane-rich biogas, which can be harnessed for energetic purposes [16].
The low nitrogen and phosphorus removal rates of AWT are considered to be its biggest drawbacks [17]. These biogenic substances are the main factors responsible for the rapid eutrophication and degradation of natural water bodies [18]. Fixation of nitrogen and phosphorus in digesters is driven solely by the growth of bacterial biomass, of which they are important building blocks. The N and P removal percentage is usually within single digits [19]. The resultant anaerobically treated effluent cannot be discharged directly to a receiving water body, as it exceeds permissible concentrations of N and P. Therefore, there is a real need to seek new and improved processes for better organic compound removal, nutrient take-up and biogas production.
The aim of the present study was to test waste-derived, low-cost filling in the treatment of real-world dairy wastewater in pilot-scale anaerobic reactors as well as to establish how different digester loadings affect organic compound removal, nutrient take-up, biogas composition and yield as well as the structure of the bacterial taxa. Anaerobic digestion (AD) performance was compared against lightweight expanded clay aggregate filling (LECAF) reactors.

2. Materials and Methods

2.1. Location

LCRF performance was tested on real-world dairy effluent in pilot-scale anaerobic reactors located in the Zakład Mleczarski Sp. z o.o. dairy production facility in Łaszczów, Poland (N 50°31′35.915″, E 23°42′58.623″). The factory produces skimmed-milk powder, sweetened condensed milk, whey powder, ripened Dutch cheeses, mozzarella cheeses, cagliata cheeses and butter.

2.2. Experimental Design

The experiment was divided into 2 series with different fillings (packing) used in the anaerobic reactors. Lightweight expanded clay aggregate filling (LECAF) was used in series 1, whereas low-cost recycled filling (LCRF) was tested in series 2. The pilot-scale experiment was run for 10 months. For the first 2 months, the microbes gradually adapted to the medium, and bacterial microflora was allowed to build up on the surface of the tested fillings. Then, the exact experiment was performed for the subsequent 8 months, designed to assess the wastewater treatment performance and biogas production capacity. Each experimental series included 5 process variants (V) with different organic load rates (OLRs) in the digesters. OLR was changed every two months: V1–3.0 kg COD/m3·d (months 0–2, adaptation), V2–4.0 kg COD/m3·d (months 3–4), V3–5.0 kg COD/m3·d (months 5–6), V4–6.0 kg COD/m3·d (months 7–8), and V5–7.0 kg COD/m3·d (months 8–10). Hydraulic retention time (HRT) was systematically reduced to achieve the progressively higher OLRs: V1–48 h, V2–36 h, V3–29 h, V4–24 h, and V5–20 h.

2.3. Materials

2.3.1. Dairy Wastewater

The dairy wastewater used for the experiment was sourced from the retention tank of the on-site wastewater treatment system at the dairy factory (HRT = 24 h). A pumping system conveyed the effluent to the experimental pilot-scale bioreactors. The profile of the raw dairy wastewater is given in Table 1.

2.3.2. Anaerobic Sludge

Anaerobic sludge (AS) was sourced from an enclosed digester chamber in which activated sludge from an aerobic treatment system (dairy-factory oxidation ditch) was anaerobically digested. The process parameters for the digester were: OLR = 2.5 kg VS/m3·d, HRT = 20 d and temperature = 37 °C. AS levels in the digester were maintained at an average 4000 ± 500 g dry mass/m3. The fillings (LECAF, LCRF) were inoculated with AS over a period of 20 weeks, as the experimental system was fed with the dairy effluent + sludge mixture. AS concentration in the wastewater was kept at approximately 2000 ± 400 g dry mass/m3. The AS profile is given in Table 2.

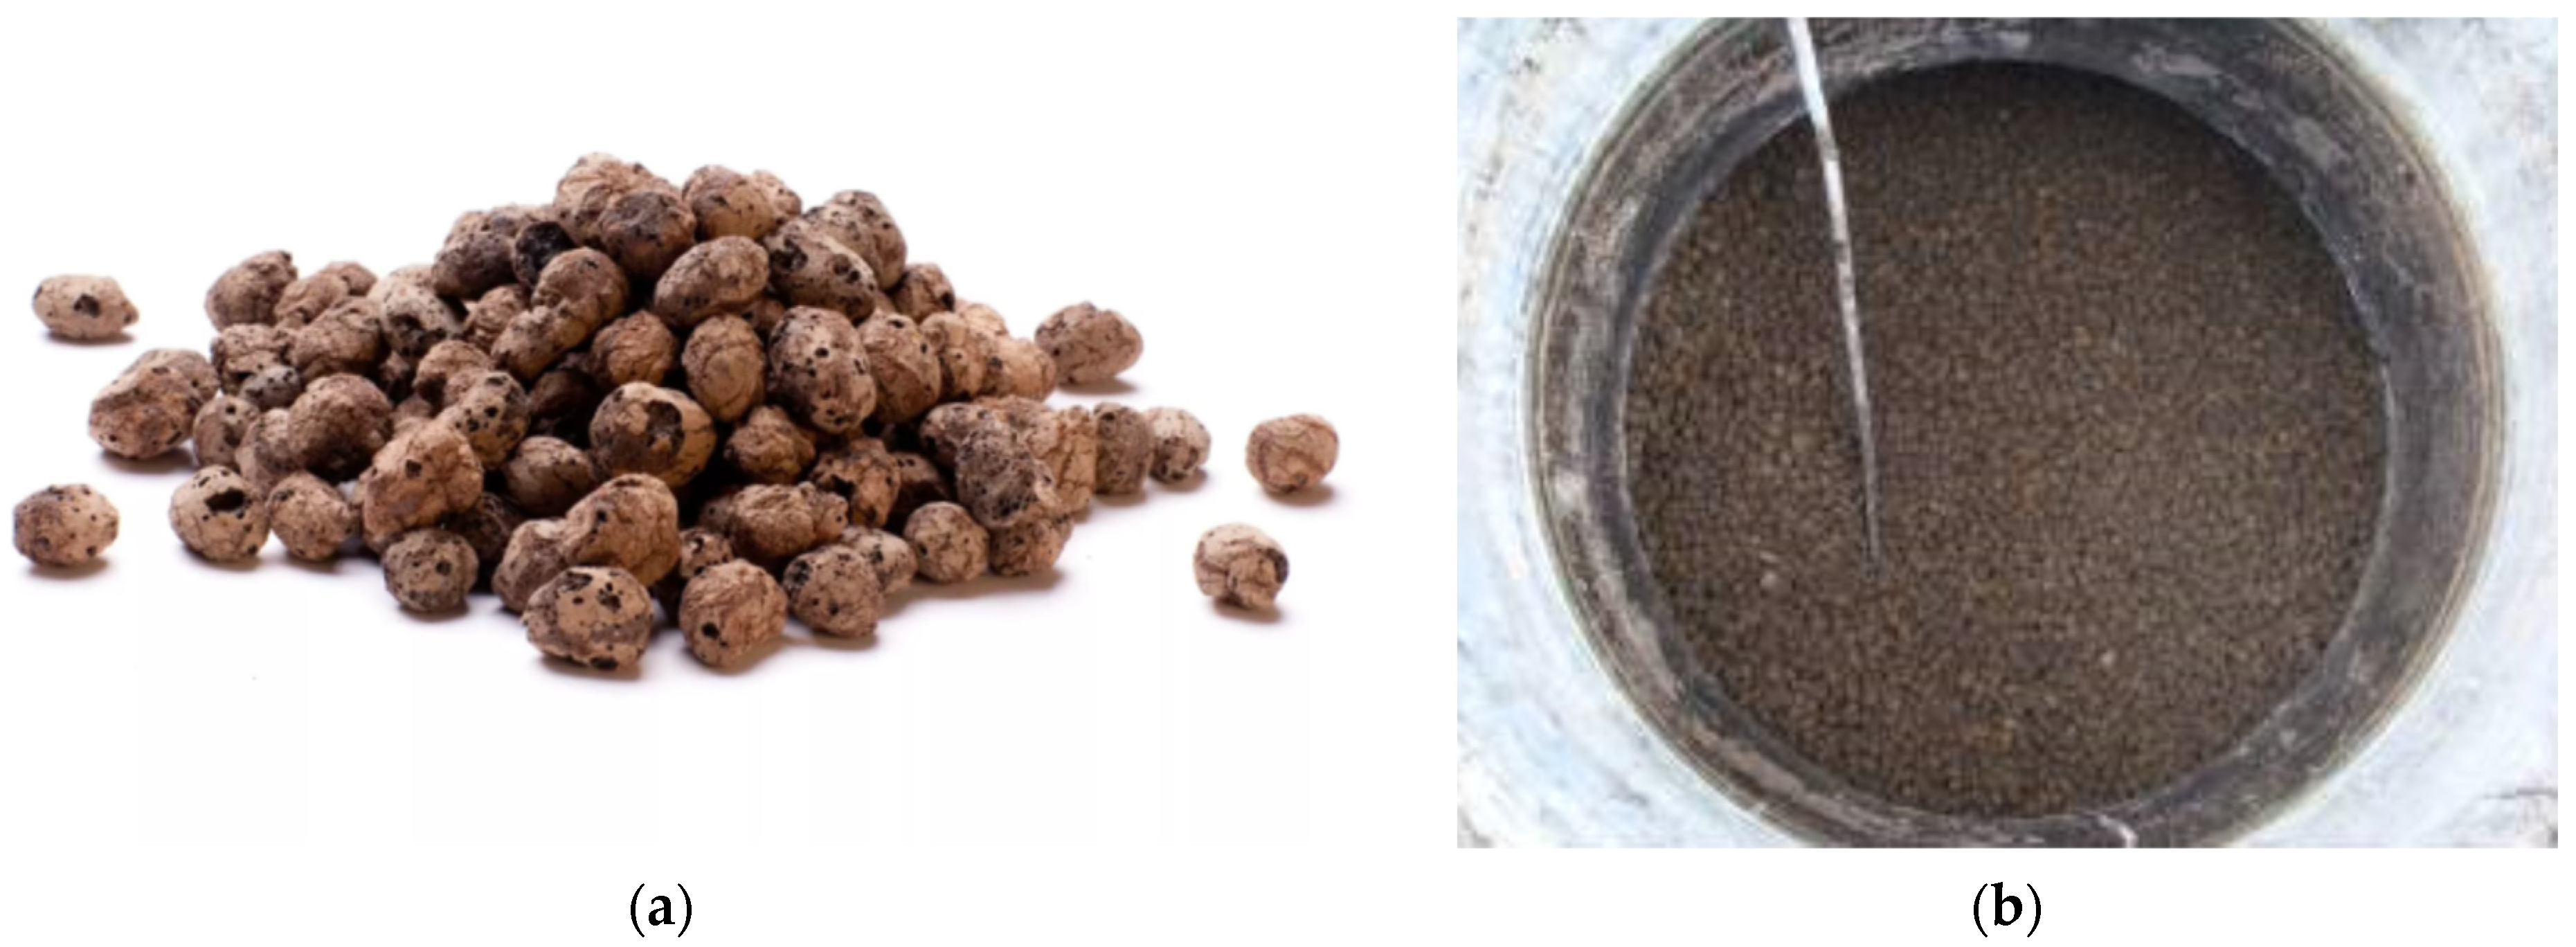
2.3.3. Lightweight Expanded Clay Aggregate Filling (LECAF)

In variant 1, the anaerobic reactors were packed with 10-20R light expanded clay aggregate (LECA® Sp. z o.o., Gniew, Poland). LECA is a porous, lightweight and tough ceramic aggregate made by heating and expanding loamy clay in rotary kilns at 1150 °C (Figure 1). Key parameters of the filling were as follows: EN 15732 and EN 13055-1 compliant, particle size: 8–20 mm, shape: round, bulk density (loose): 246–333 kg/m3 (averaging approximately 290 kg/m3), minimum crushing strength: 0.75 N/mm2, tensile strength > 500 kPa, heat transfer coefficient: 0.095–0160 W/mK, critical angle of repose: 45°, absorption capacity < 35%, CE 04/EN 13055-1/0770-CPR-2370-05-17, freeze resistance < 0.8%. The light aggregate behaves similarly to a fluid. The reactors were packed with 3.0 m3 of LECA.

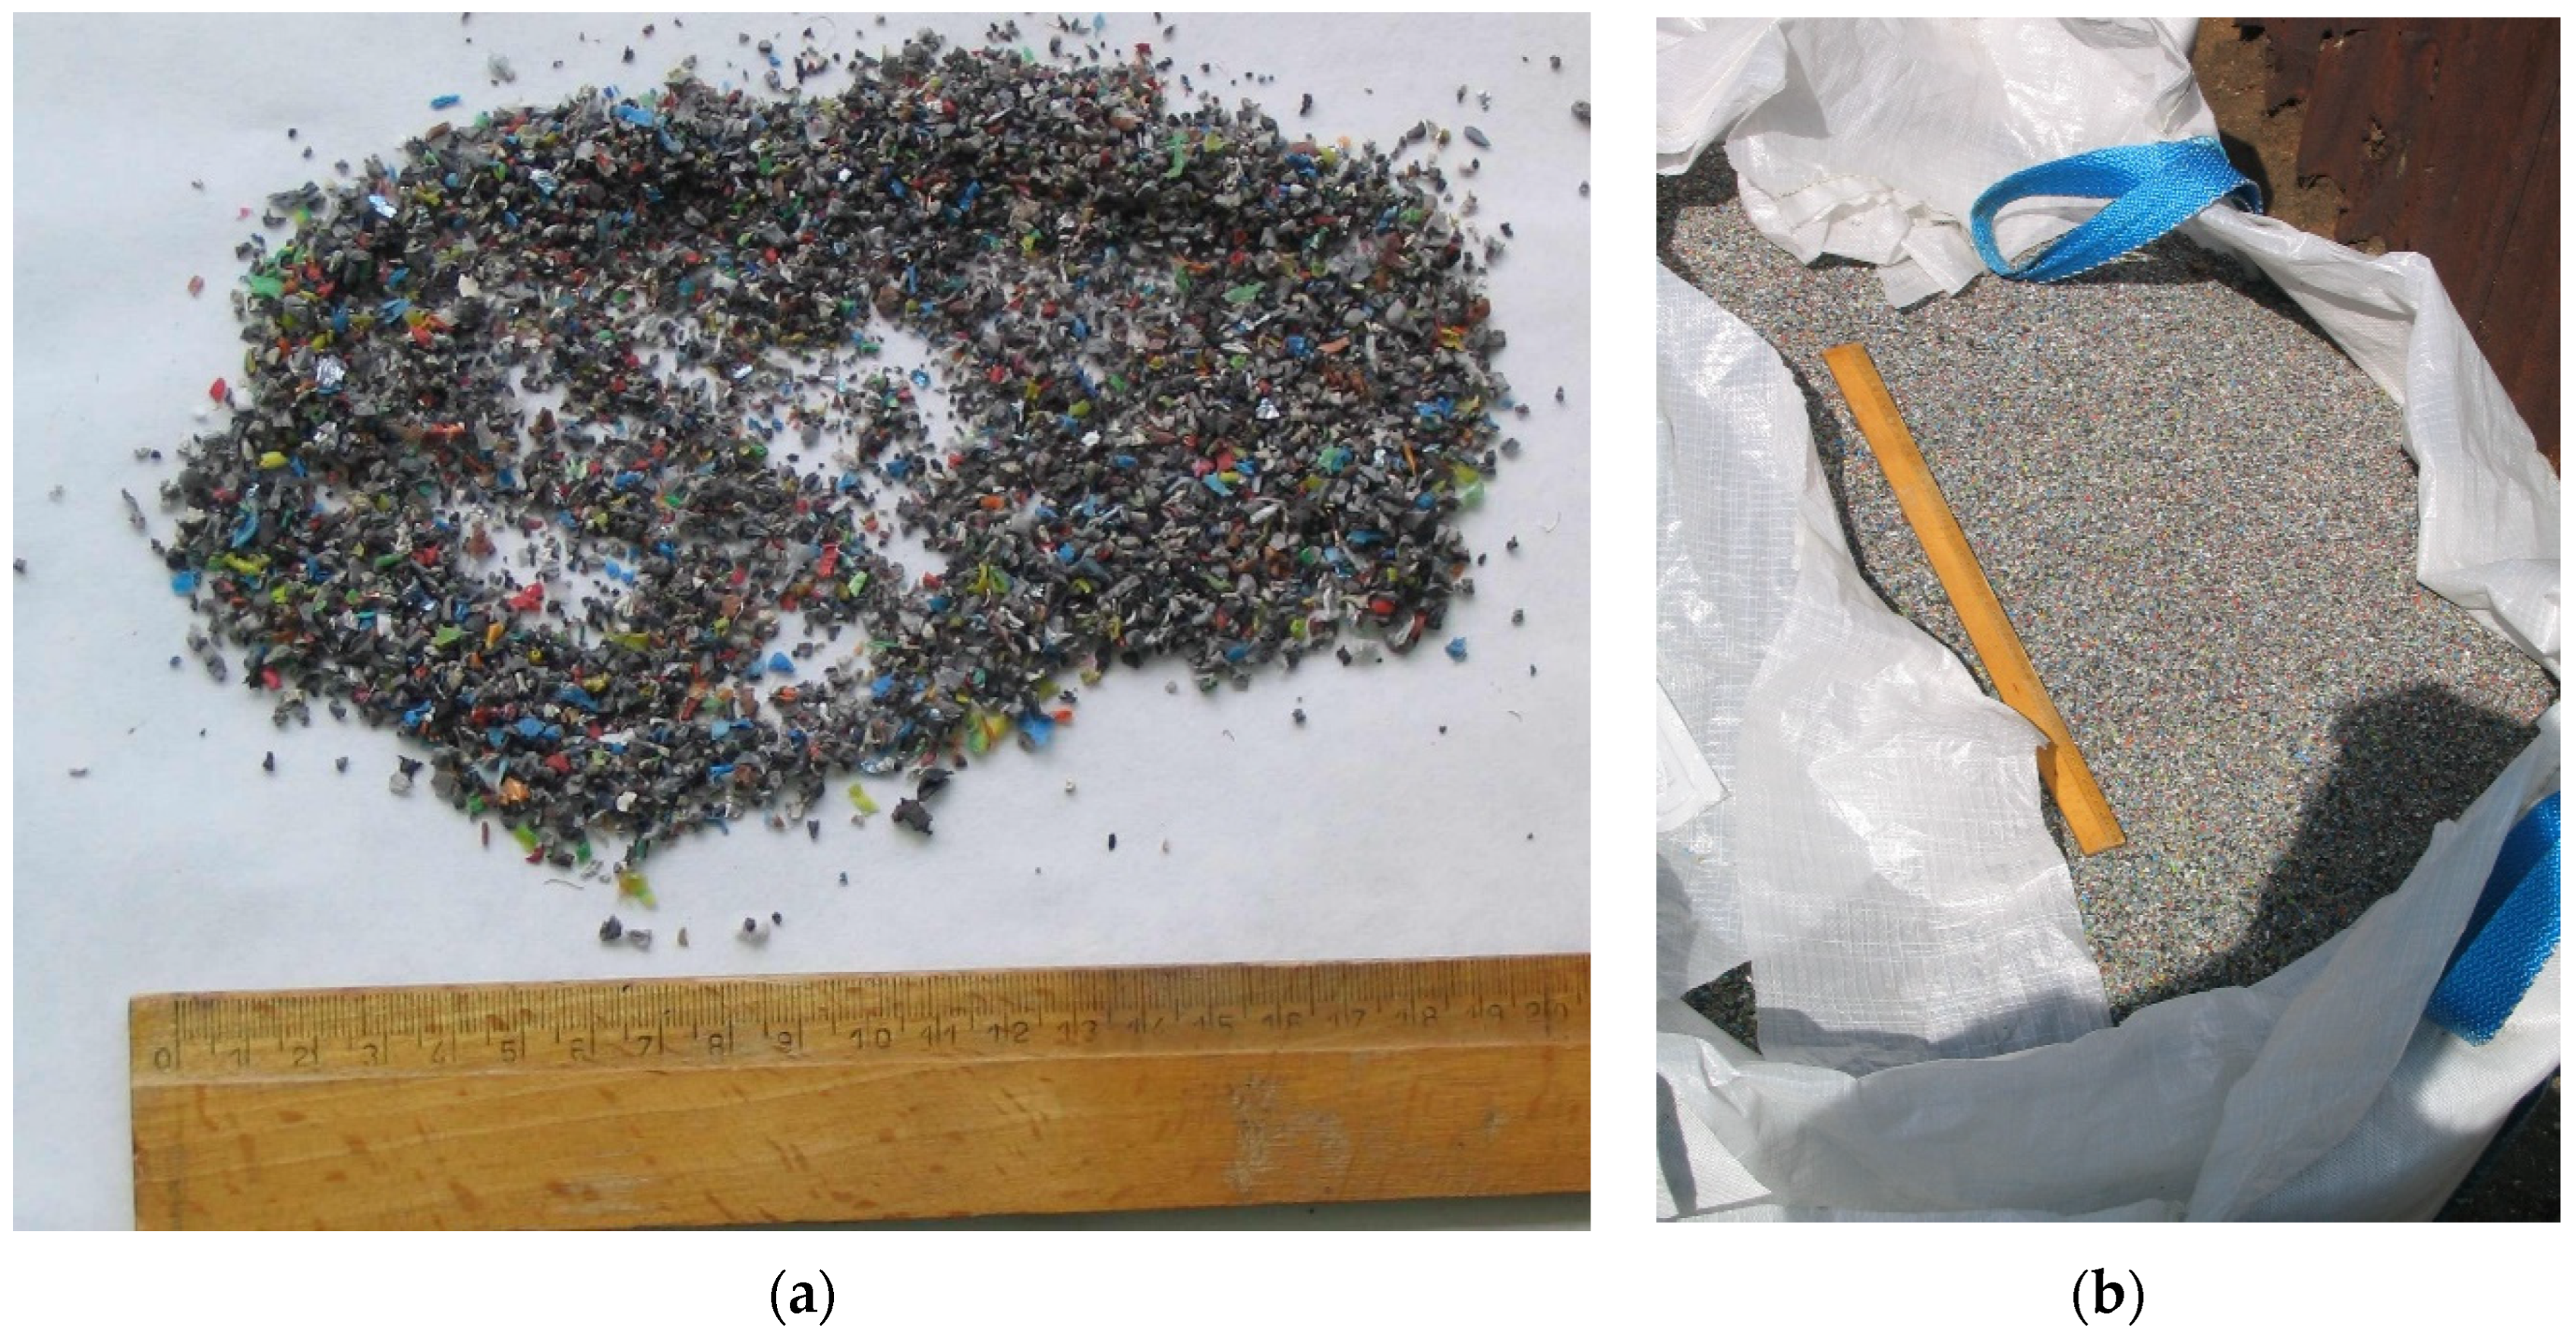
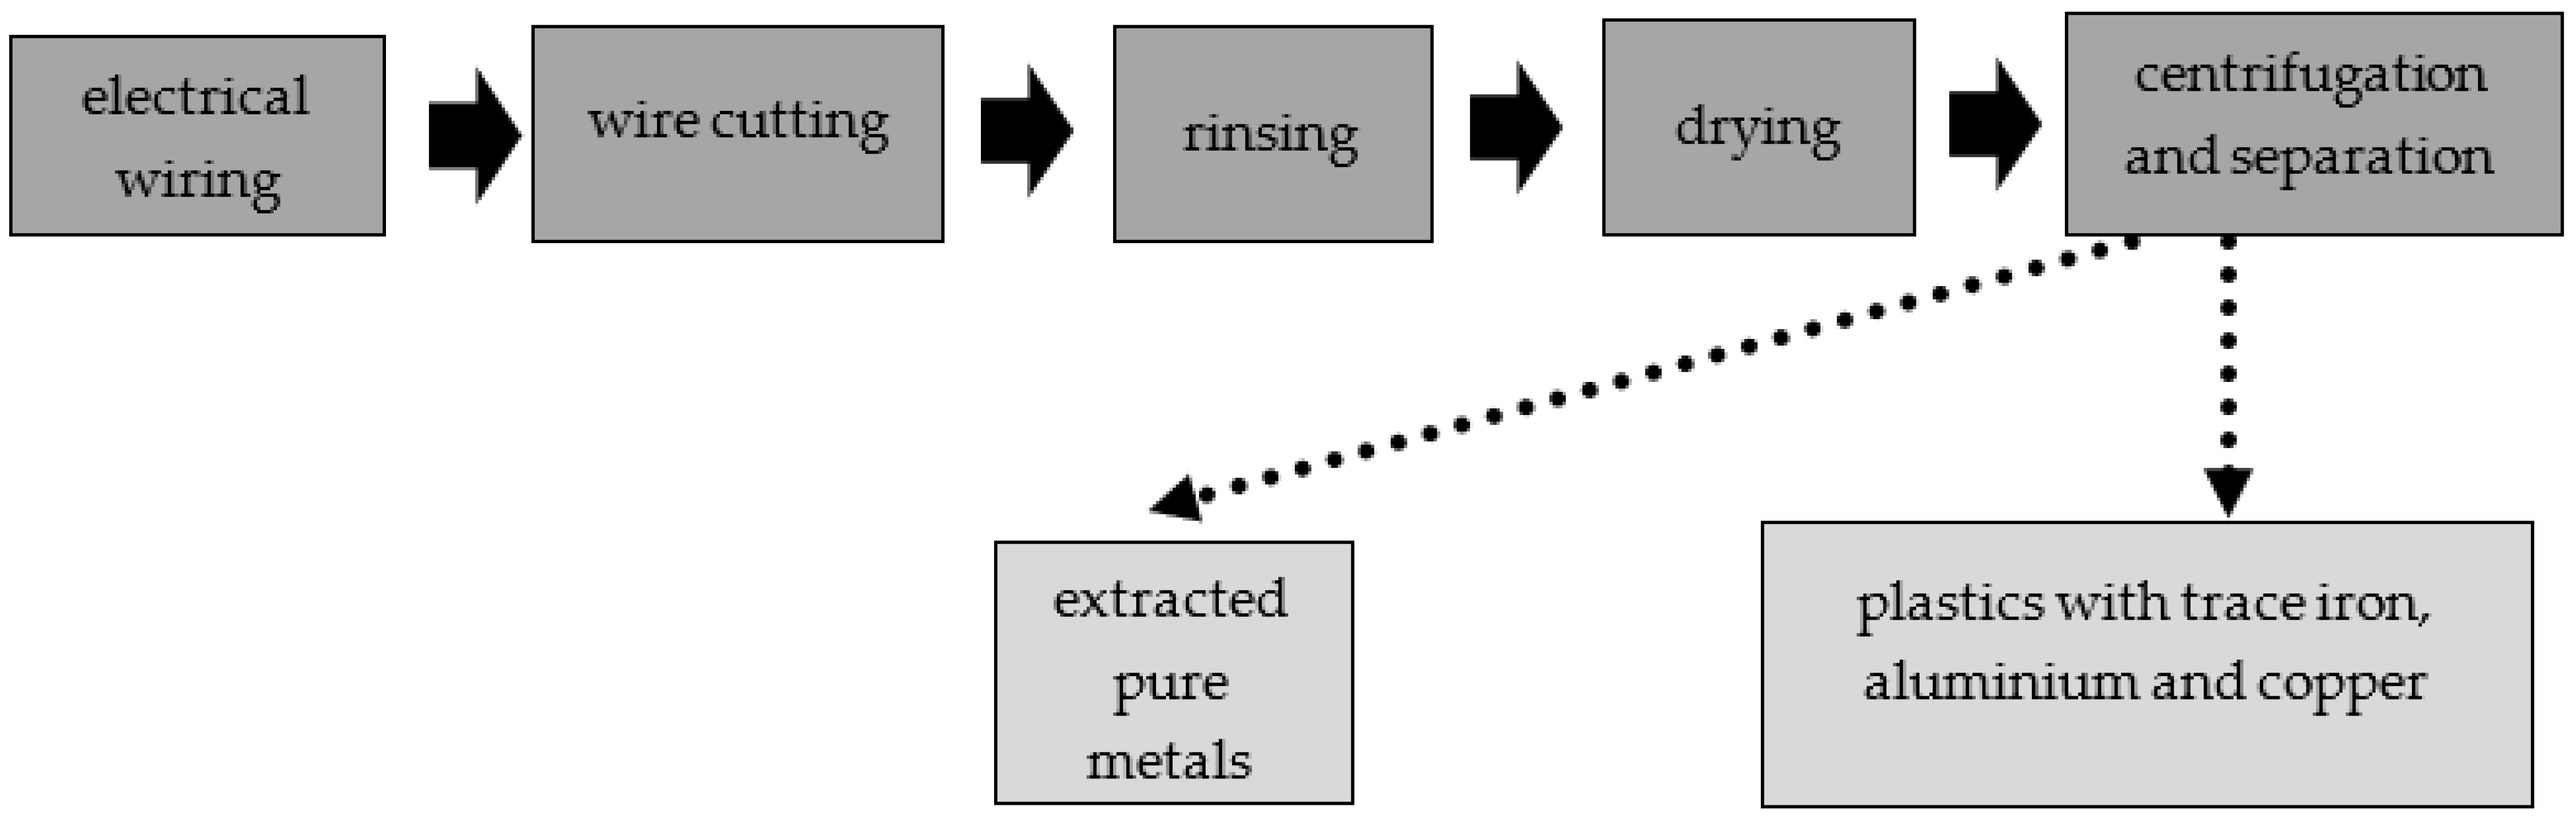
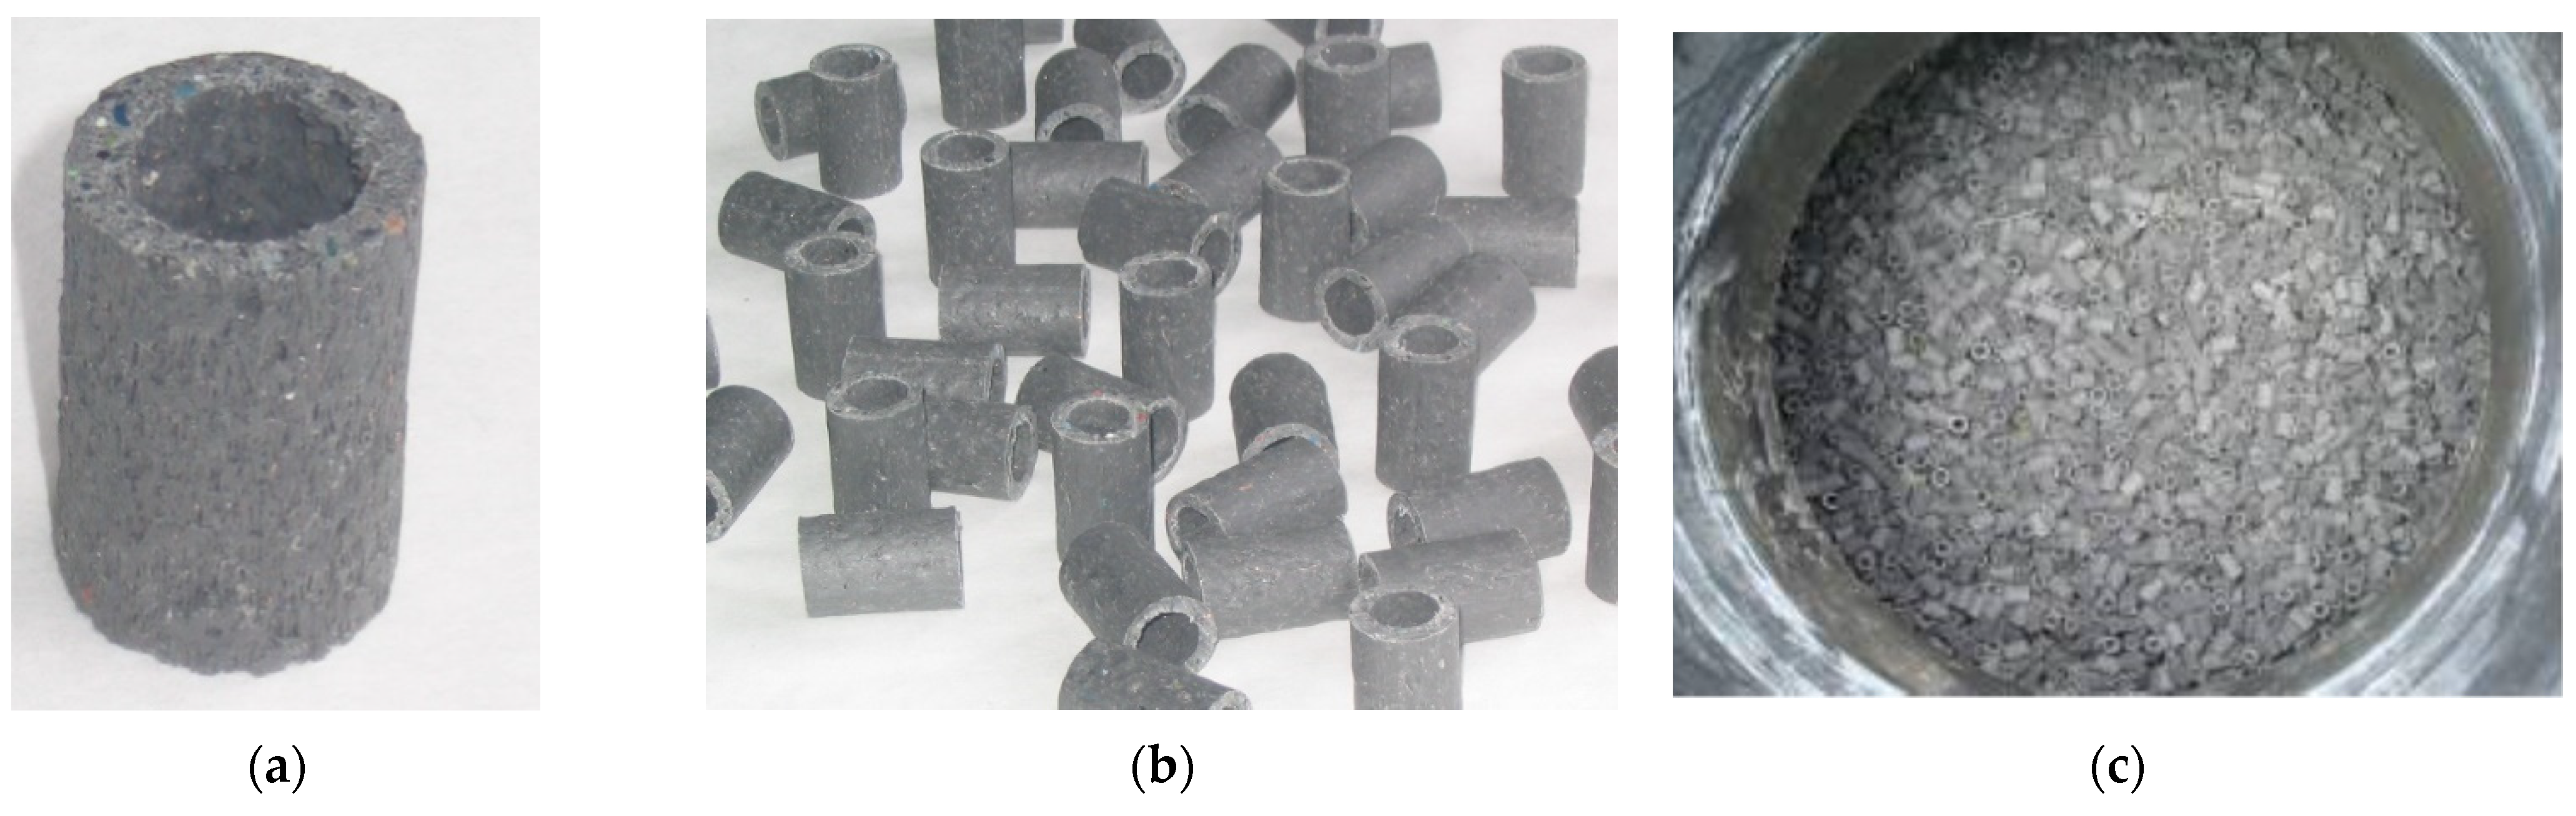
2.3.4. Low-Cost Recycled Filling (LCRF)

The LCRF was made from commercially available waste (leftover mixed plastics from metal recycling of scrap wiring and electrical systems, mostly junked cars). The waste plastics consisted of various insulating materials (normal rubber, silicone rubber, halogen-free material, cross-linked polyethylene, organohalogen material, softened PVC coating and heat-resistant softened PVC coating), as well as some iron, copper and aluminum. The metal accounted for approximately 10% of the material by weight, including approximately 5 %w/w aluminum, 3%w/w iron and 2%w/w copper (Figure 2). To obtain the material for the LCRF, the electrical wires were first shredded. The disintegrated waste was then rinsed (to purge it of any contaminants) and dried. The resultant intermediate was passed through a system of centrifuges and sieves to separate and filter out waste plastics containing trace iron, copper and aluminum. The step-by-step preparation of the LCRF material is presented in Figure 3.
The waste was processed in a mixer mill (RG-1820, Wartacz P.H.U., Wroclaw, Poland), to ensure consistent structure and quality of the final product. The substrate mixture was melted at a temperature of 110 °C to 160 °C into a uniform plastic mass. This mass was then fed through a single-screw extruder with a closed-tube pressing module (T-32-25, ZMC Metalchem Sp. z o.o., Cracow, Poland). The processed material was cut with a circular knife (N-100, Zamak Mercator Sp. z o.o., Skawina, Poland) to a length of 24 mm. Finally, the pieces were placed in a cooling trough (18 ± 2 °C) to bring their temperature down. LCRF elements are presented in Figure 4. The anaerobic reactors were filled with 3.0 m3 LCRF. The technical parameters of the LCRF structures are as follows: height: 24 mm, inner diameter: 10 mm, outer diameter: 18 mm, bulk density: 300 kg/m3, active surface area: 500 m2/m3, lengthwise crush strength: 0.04 N/mm2, widthwise crush strength: 3.2 N/mm2 and volatile matter content: 65%.

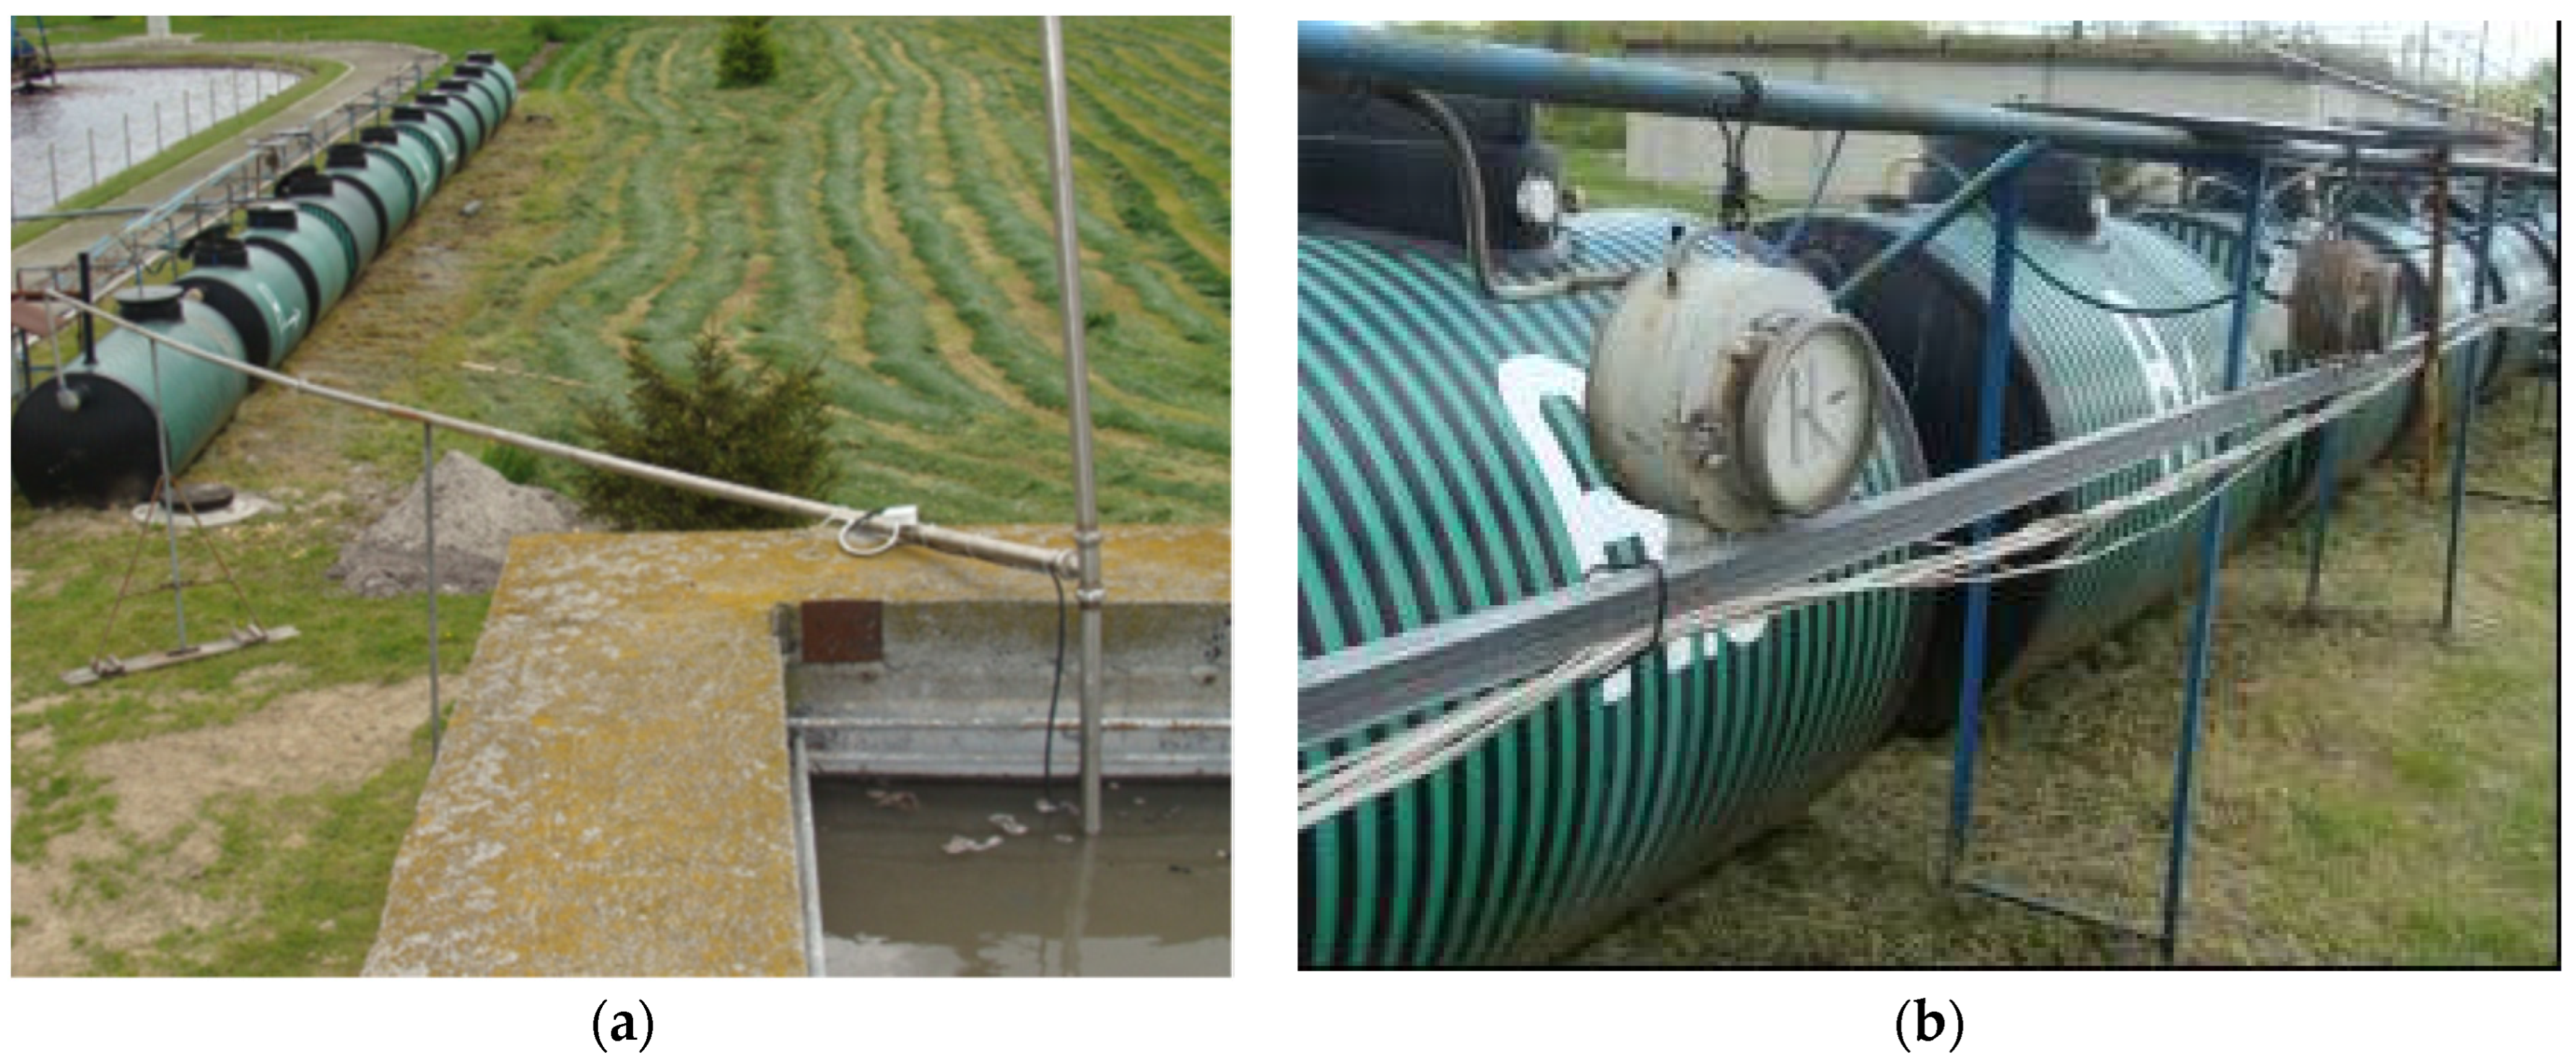
2.4. Pilot-Scale Anaerobic Reactor Station

Raw dairy effluent was conveyed into a retention basin with an active volume of V = 5000 m3. From there, the wastewater was pumped via ø 50 mm hoses into the experimental anaerobic reactor system. A single anaerobic reactor had an active volume of V = 3.0 m3 (in addition to the space taken up by the filling). The entire system was made up of six anaerobic tanks. Three were packed with LECAF (series 1) and the other three with LCRF (series 2). The wastewater feed was placed at the bottom of the anaerobic reactors to maintain an upflow. The temperature in the pilot-scale station was kept at 37 °C. The retention tank and the station’s raw-wastewater pumping system are presented in Figure 5a. The experimental anaerobic reactors are presented in Figure 5b.

2.5. Analytical Methods

The chemical oxygen demand (COD), total nitrogen (TN) and total phosphorus (TP) in the wastewater and effluent were analyzed once every 24 h using a spectrophotometer (Hach DR 6000, Düsseldorf, Germany). The content of total solids (TS) was determined gravimetrically. The pH was measured with a pH meter (1000 L, VWR International, Radnor, PA, USA). Biogas flow rate was measured continuously using a digital gas flow meter (Aalborg Instruments & Controls, Inc., Orangeburg, NY, USA). Biogas composition was analyzed once every 7 days using a GMF 430 m (GasData, UK) and a gas chromatograph (GC, 7890A Agilent, Santa Clara, CA, USA) equipped with a thermal conductivity detector (TCD). The GC was fitted with two Hayesep Q columns (80/100 mesh), two molecular sieve columns (60/80 mesh) and a Porapak Q column (80/100) operating at a temperature of 70 °C. The temperature at the injection and detector ports was 150 °C and 250 °C, respectively. Helium and argon were used as the carrier gases at a flow rate of 15 mL/min. Samples for molecular profiling of the bacterial community were extracted from filling elements at the end of each variant. The molecular analysis was performed to determine the percentage of ammonia-oxidizing bacteria (AOB) in the biofilm using the fluorescent in situ hybridization (FISH) technique [20].

2.6. Statistical Analysis

The statistical analysis was conducted using STATISTICA 13.3 PL. One-way analysis of variance (ANOVA) was used to determine significant differences across the groups. Significant differences between the variables were determined with Tukey’s HSD (p = 0.05). The experimental variants and analyses were carried out in triplicate.

3. Results and Discussion

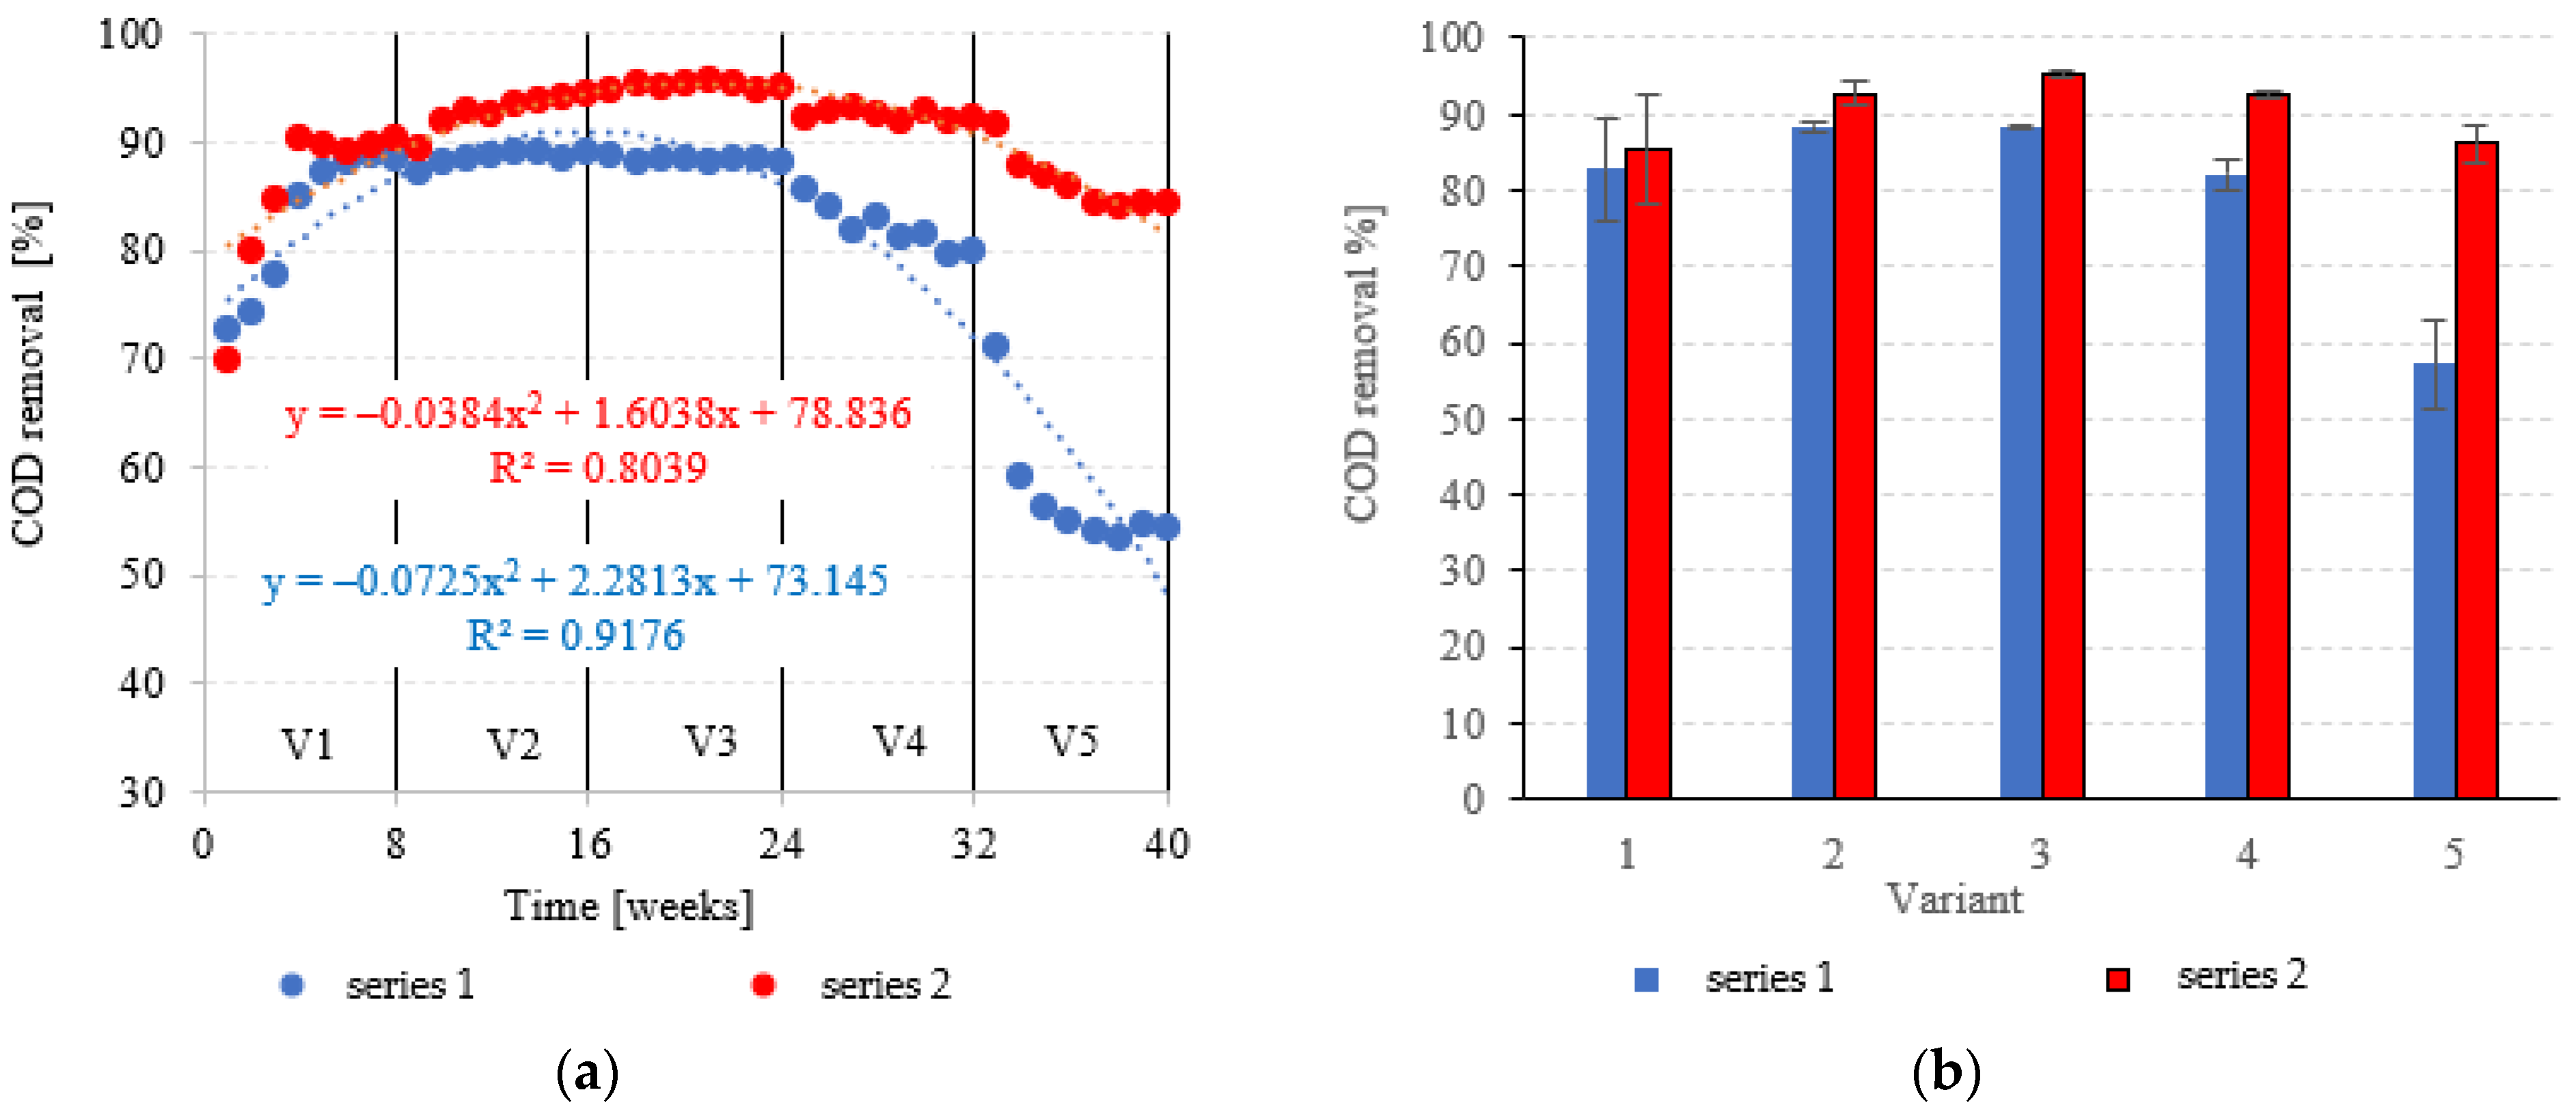
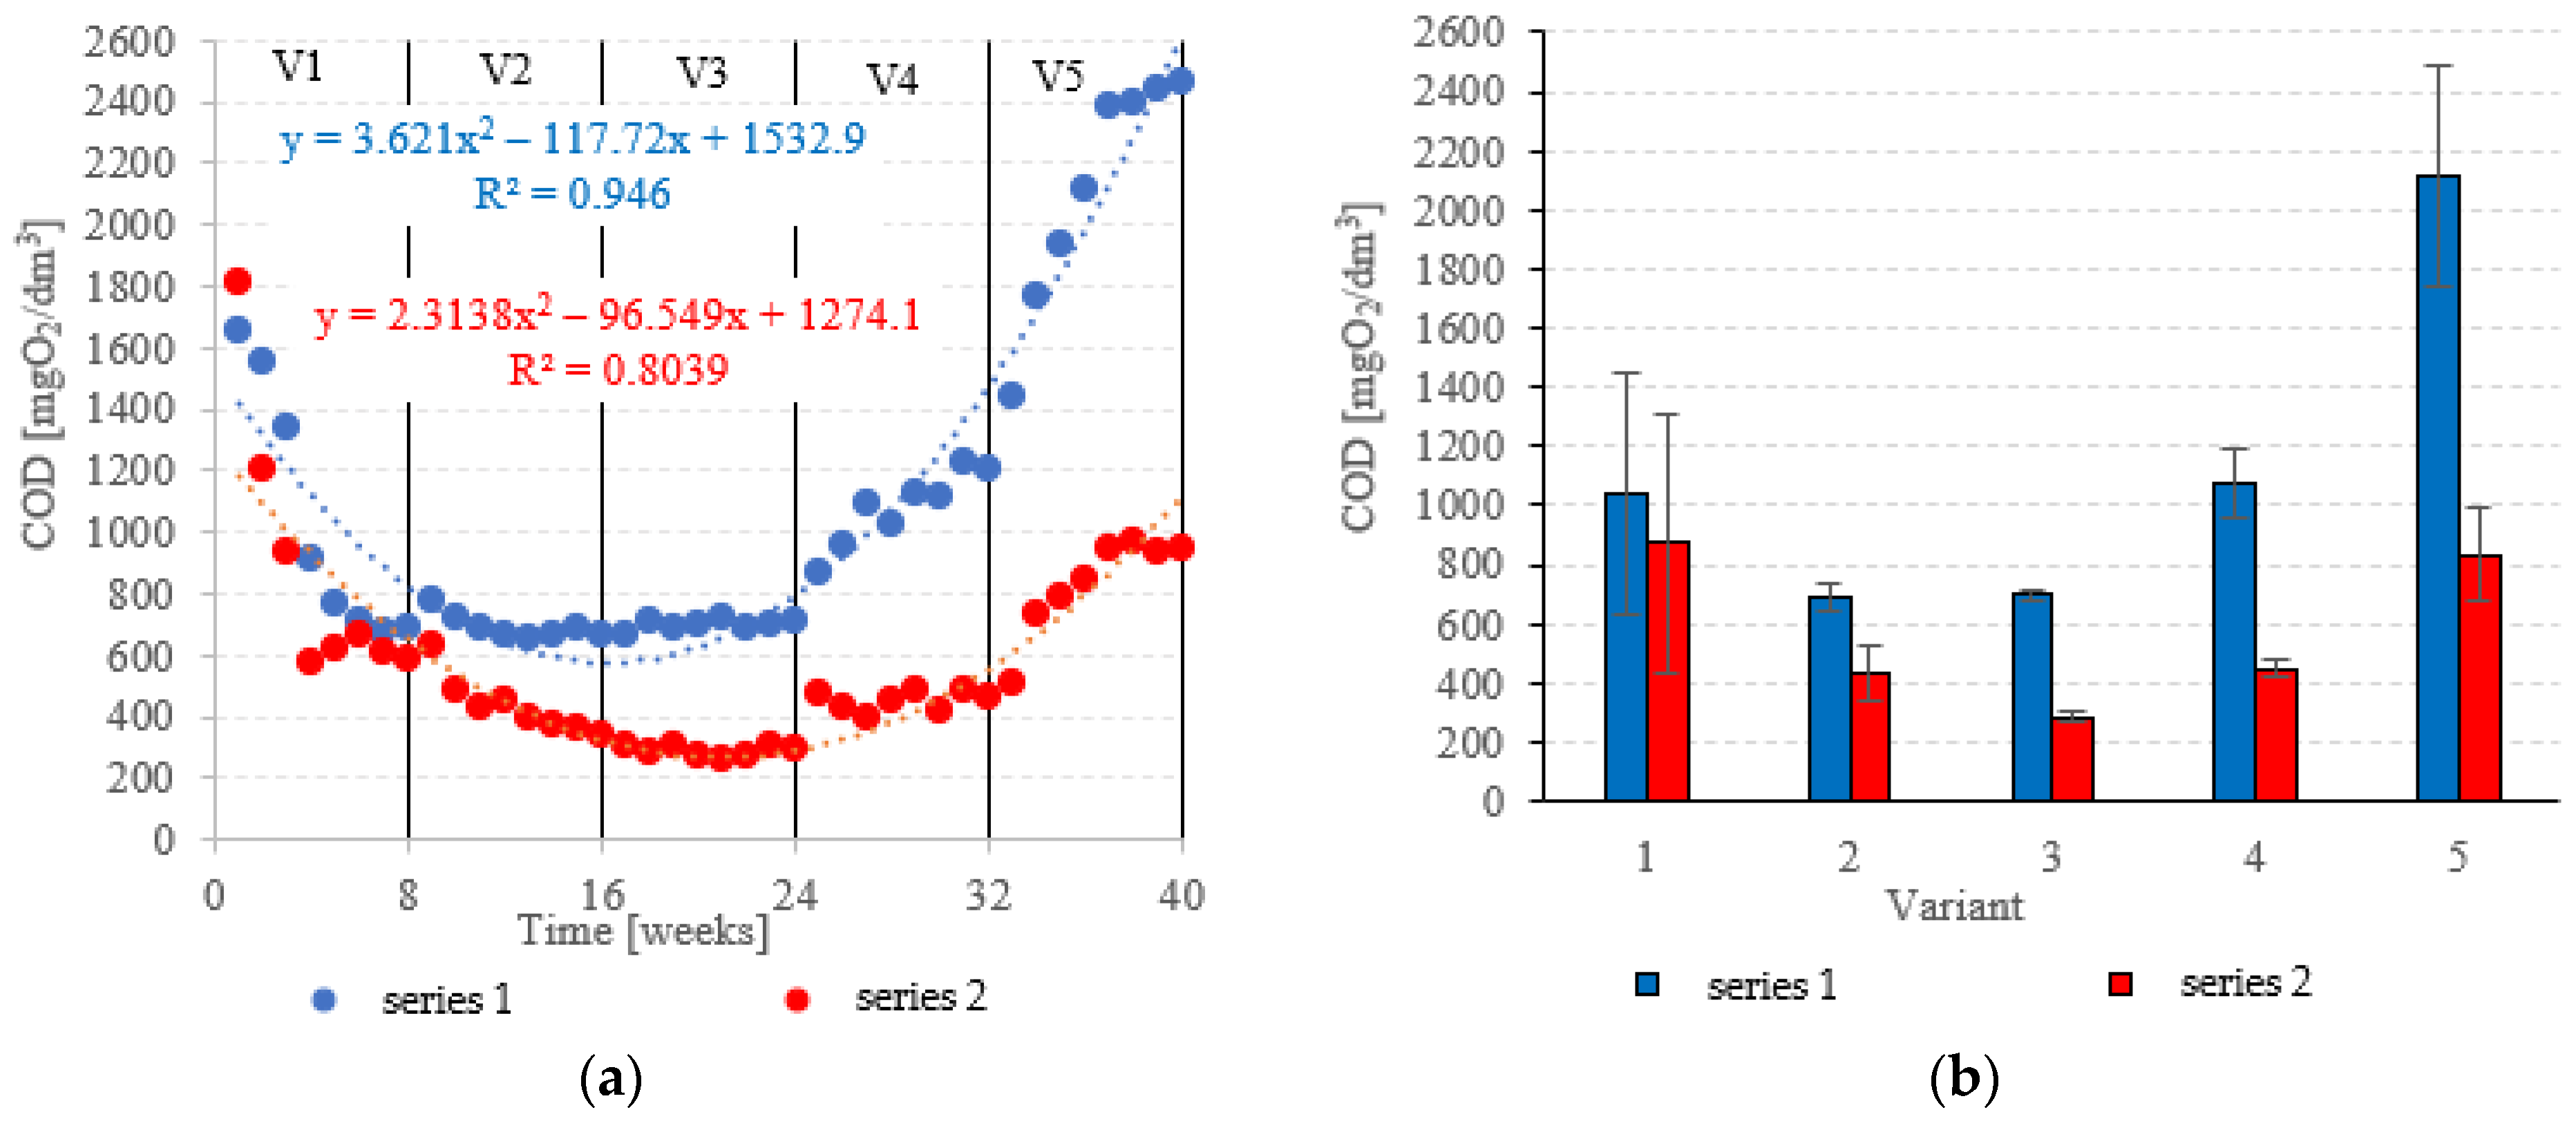
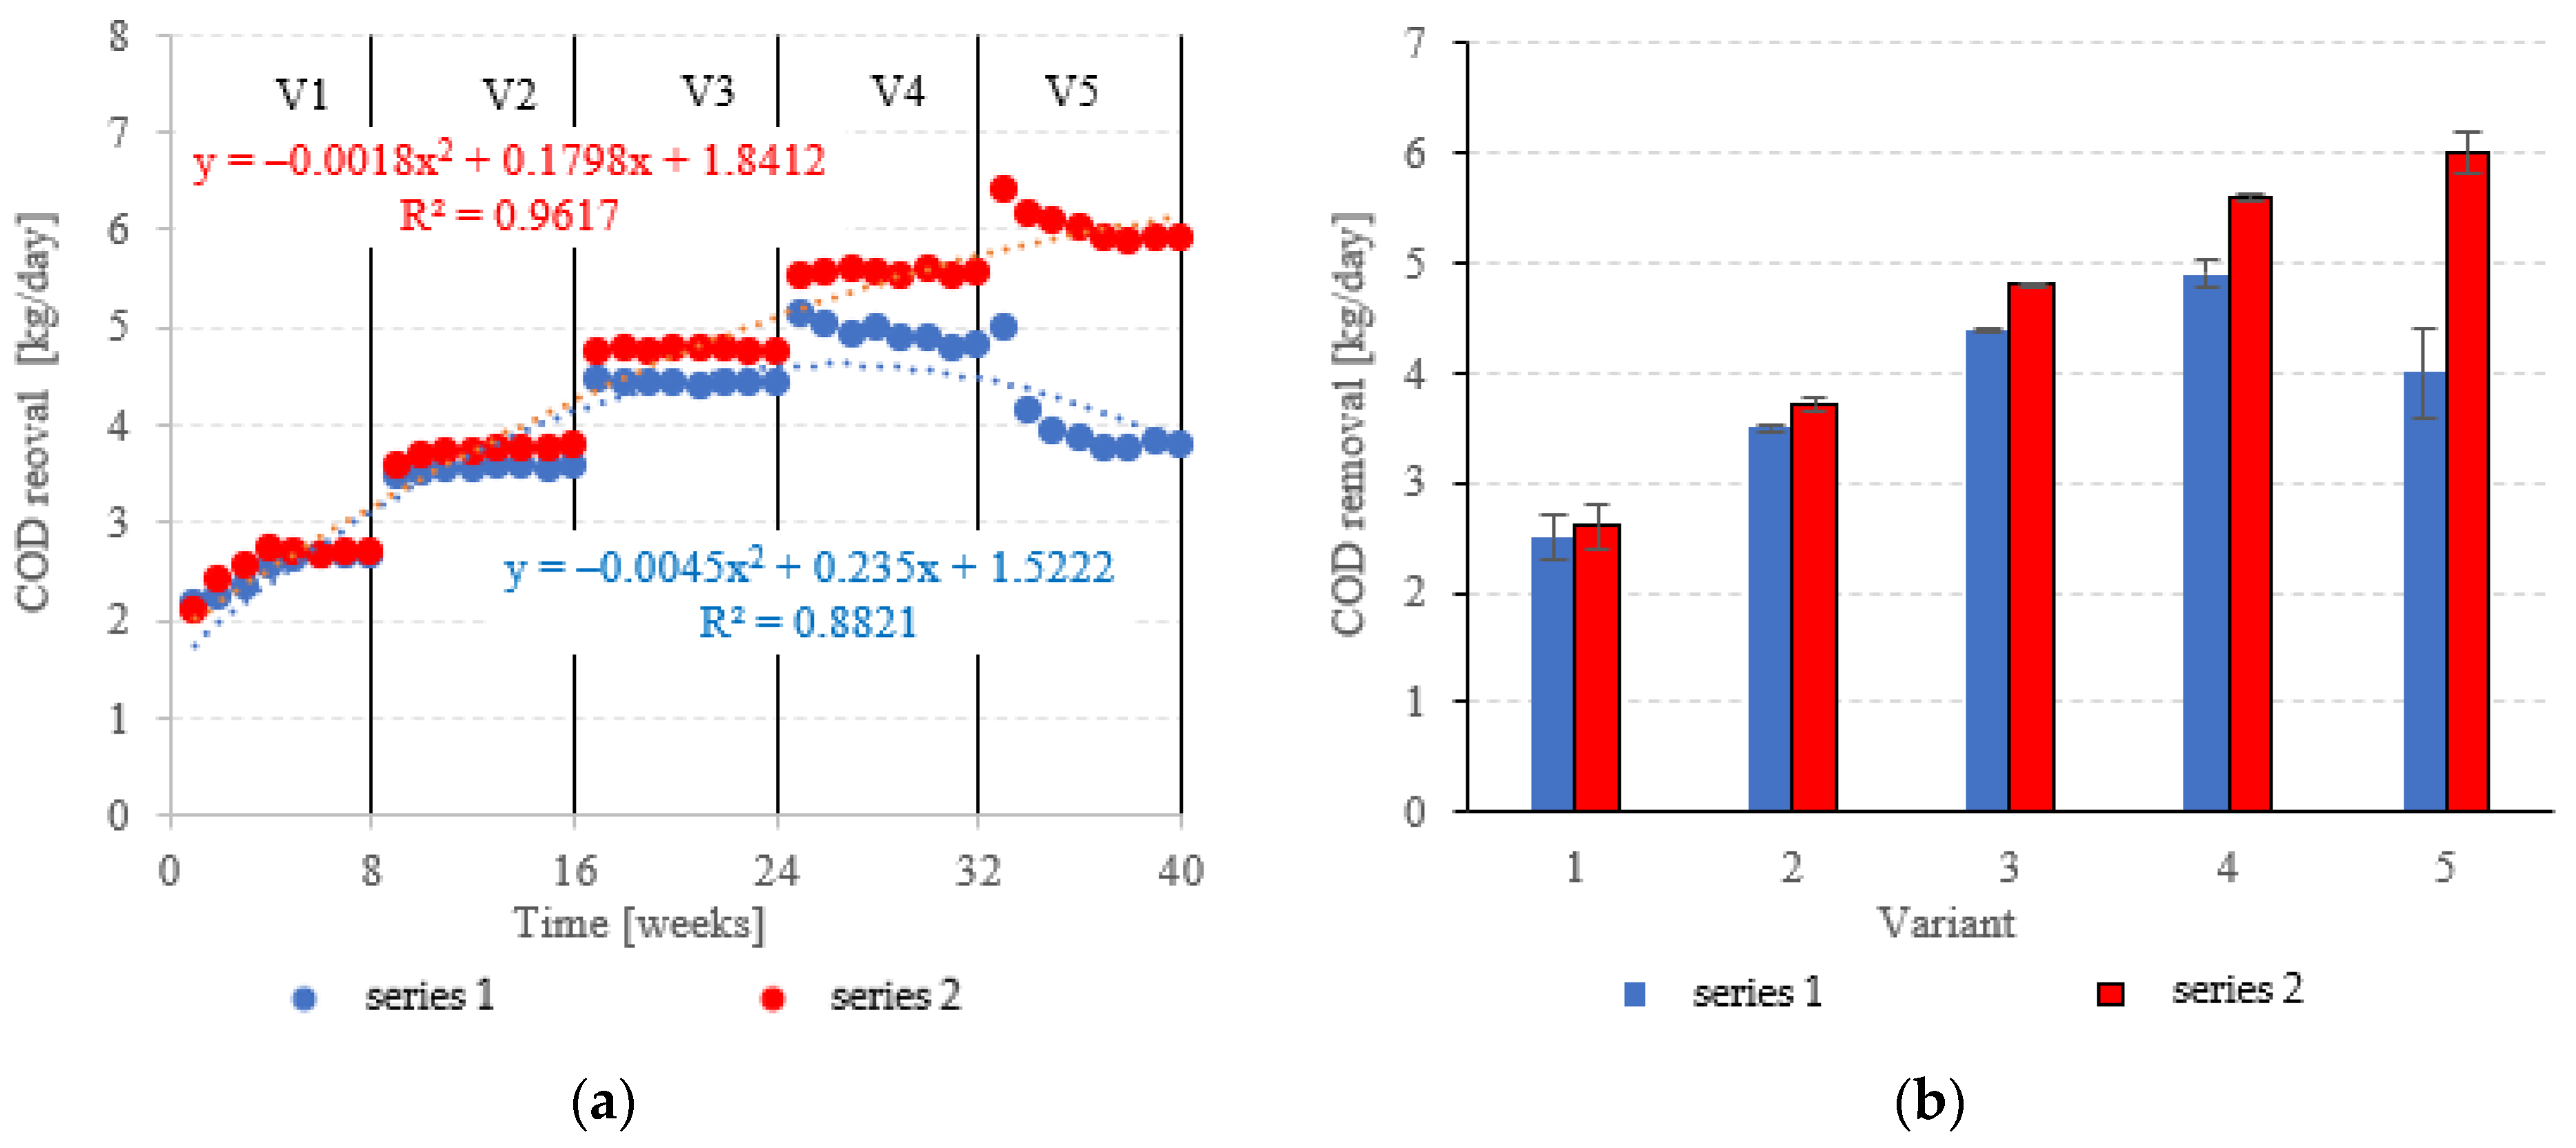
3.1. Organic Matter Removal

COD in the influent was 6020 ± 595 mgO2/dm3. COD removal in series 1 (LECAF) reached 82.8 ± 6.8% during the adaptation period (V1). In V1–V2, biodegradation efficiency ranged from 88.5 ± 0.7% to 88.4 ± 0.3% (Figure 6a,b), resulting in COD levels in the final effluent of approximately 700 mgO2/dm3 (Figure 7a,b). V4 suffered a significant drop in removal rates (82.1 ± 2.0%), but a much more dramatic decline (Figure 6a,b) occurred after increasing the OLR to 7.0 kg COD/m3·d (V5) when COD removal dropped to 57.2 ± 5.9%, leading to an increase in COD in the treated effluent to a level of 2120 ± 370 mgO2/dm3 (Figure 7a,b). The LCRF used in series 2 led to a significantly better and more consistent wastewater treatment performance within the tested OLR range of 4.0 kg COD/m3·d to 7.0 kg COD/m3·d. COD removal ranged from 95.2 ± 0.3% in V3 to 86.1 ± 2.6% in V5 (Figure 6a,b). COD in the final effluent was below 900 mgO2/dm3 across all LCRF variants (Figure 7a,b). Many different anaerobic reactor designs are used to treat dairy wastewater [21]. The literature data indicate that organic removal rates as high as 98% can be achieved at loads of up to 9.8 kg COD/m3·d, provided a very long HRT is maintained (142 days) [22]. Researchers have also considered anaerobic filter and fluidized beds [23,24,25,26]. Purushothaman et al. [25] have used a fluidized-bed reactor to biodegrade dairy effluent on a wood-particle medium, removing 84% COD at 30 °C and pH 7. Kundu et al. [27] treated simulated dairy effluent in a fluidized-bed anaerobic reactor, achieving a COD of 78% at an OLR of 8 kg COD/m3·d. Dębowski et al. [28] employed an innovative multi-section horizontal flow anaerobic reactor (HFAR) to treat dairy effluent, removing approximately 85% COD at 1.0–2.0 kg COD/m3·d OLR. Others [23] have shown that inverse fluidization could also be employed in AD of dairy effluent, achieving a 90% COD removal rate with an OLR of 10 kg COD/m3·d.
COD removed in the LECAF series ranged from 2.5 ± 0.2 kg COD/day (adaptation period) to 4.9 ± 0.12 kg COD/day at 6.0 kg COD/m3·d OLR. In the LCRF series, the removal rate was 2.6 ± 0.22 kg COD/day in V1 to 6.0 ± 0.18 kg COD/day in V5 (Figure 8a,b). LCRF was also shown to maintain high treatment performance in the upper range of OLRs. A significant, but relatively small decline in COD removal was noted for 7.0 kg COD/m3·d OLR (Figure 8a,b). In contrast, the biodegradation of organics in the LECAF series was significantly impaired as early as V4, and increasing the OLR to 7.0 kg COD/m3·d led to an even sharper drop in performance (Figure 8a,b). Studies to date have estimated COD removal in packed anaerobic reactors at between 65% and 97.5% [29,30,31]. Najafpour et al. [32] investigated trends in organics removal from dairy effluent across an OLR range of 7.9 to 45.42 kg COD/m3·d. The best COD removal rates (97.5% and 88%) were recorded for 48 and 36 h HRT, respectively. The process performed substantially worse at 25 kg COD/m3·d OLR. A study on a magneto-active hybrid anaerobic biofilm reactor produced the highest COD removal rates (80%) at the OLR range of 6.0–8.0 kg COD/m3·d [33]. In an anaerobic baffled and biofilm reactor with magneto-active filling, COD removal was found to vary between 77% and 86% at an OLR of 10 kg COD/m3·d [34]. In other types of reactors, high COD removal rates of over 1000 kg COD/d were observed within the OLR range of 15 to 25 kg COD/m3·d [35].

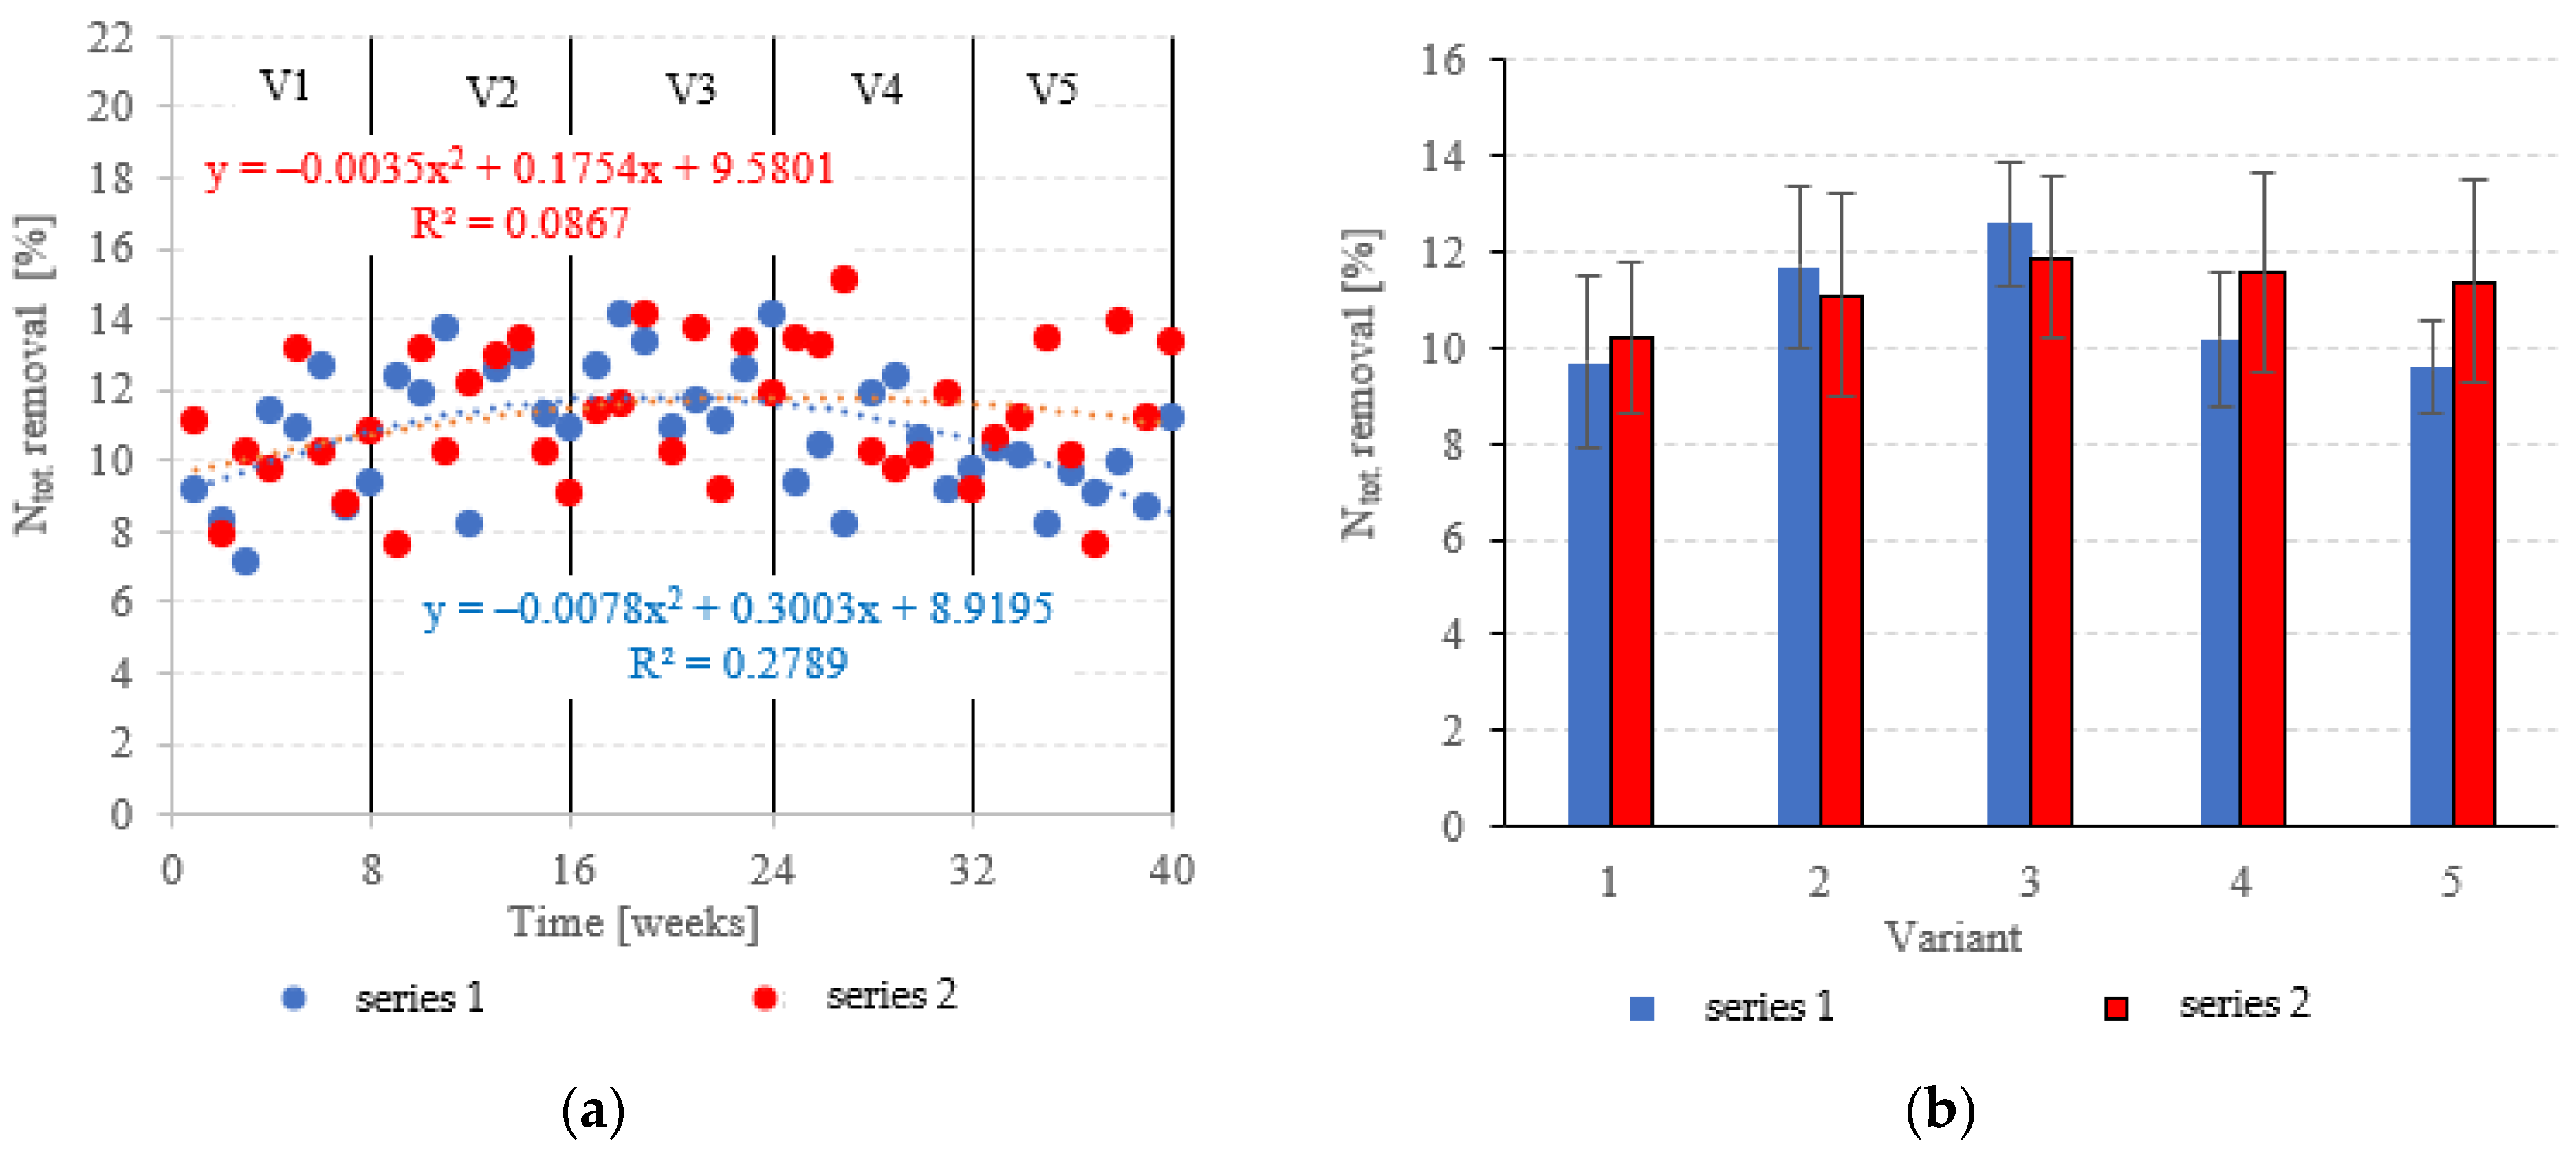
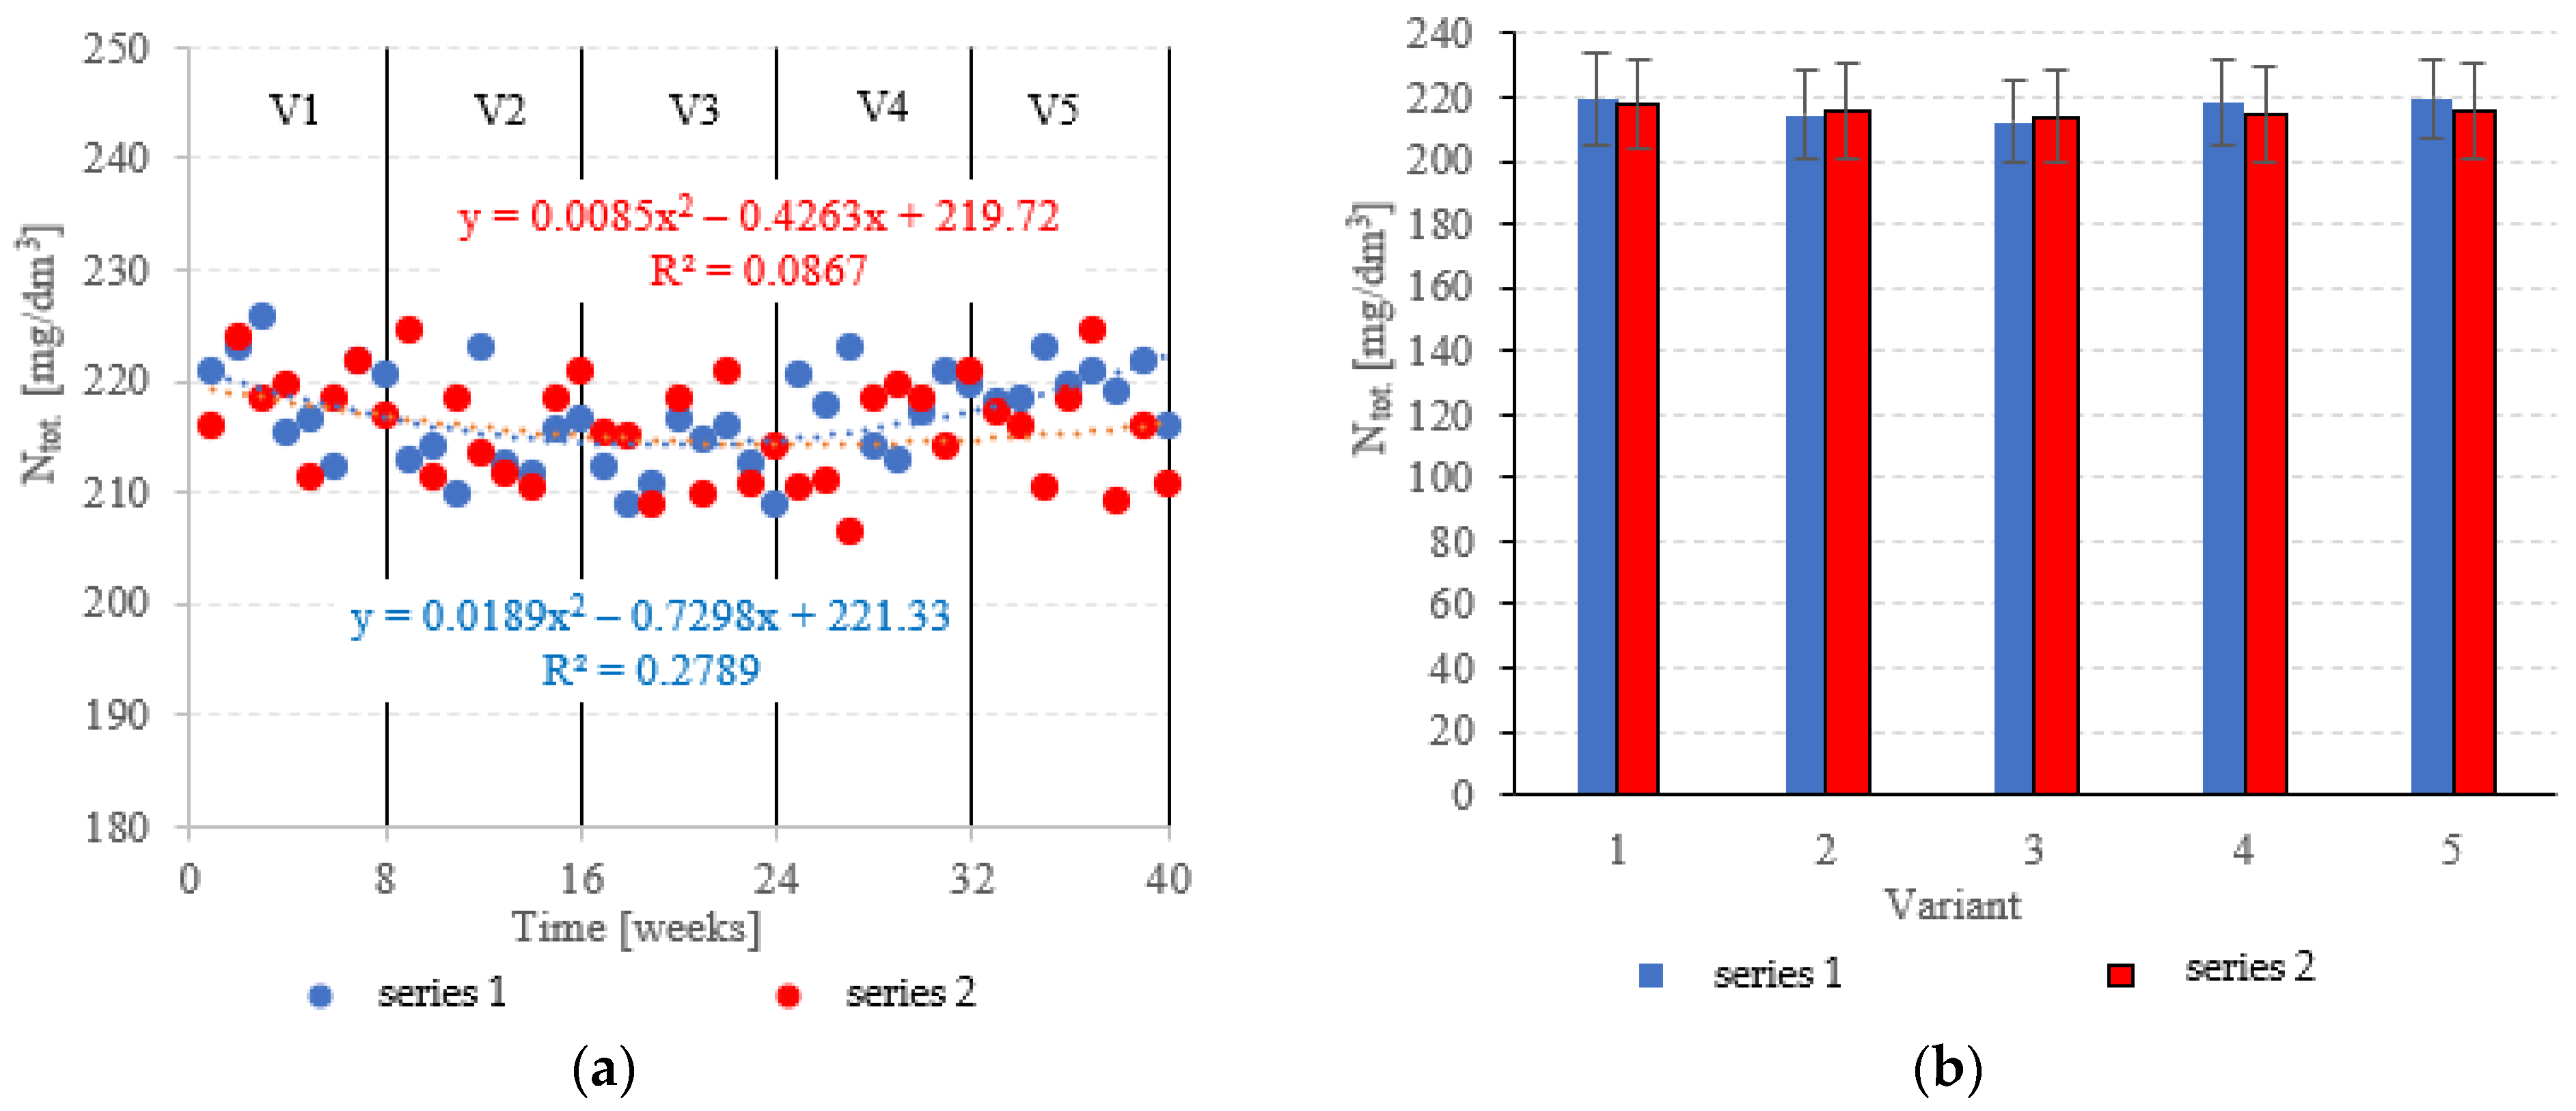
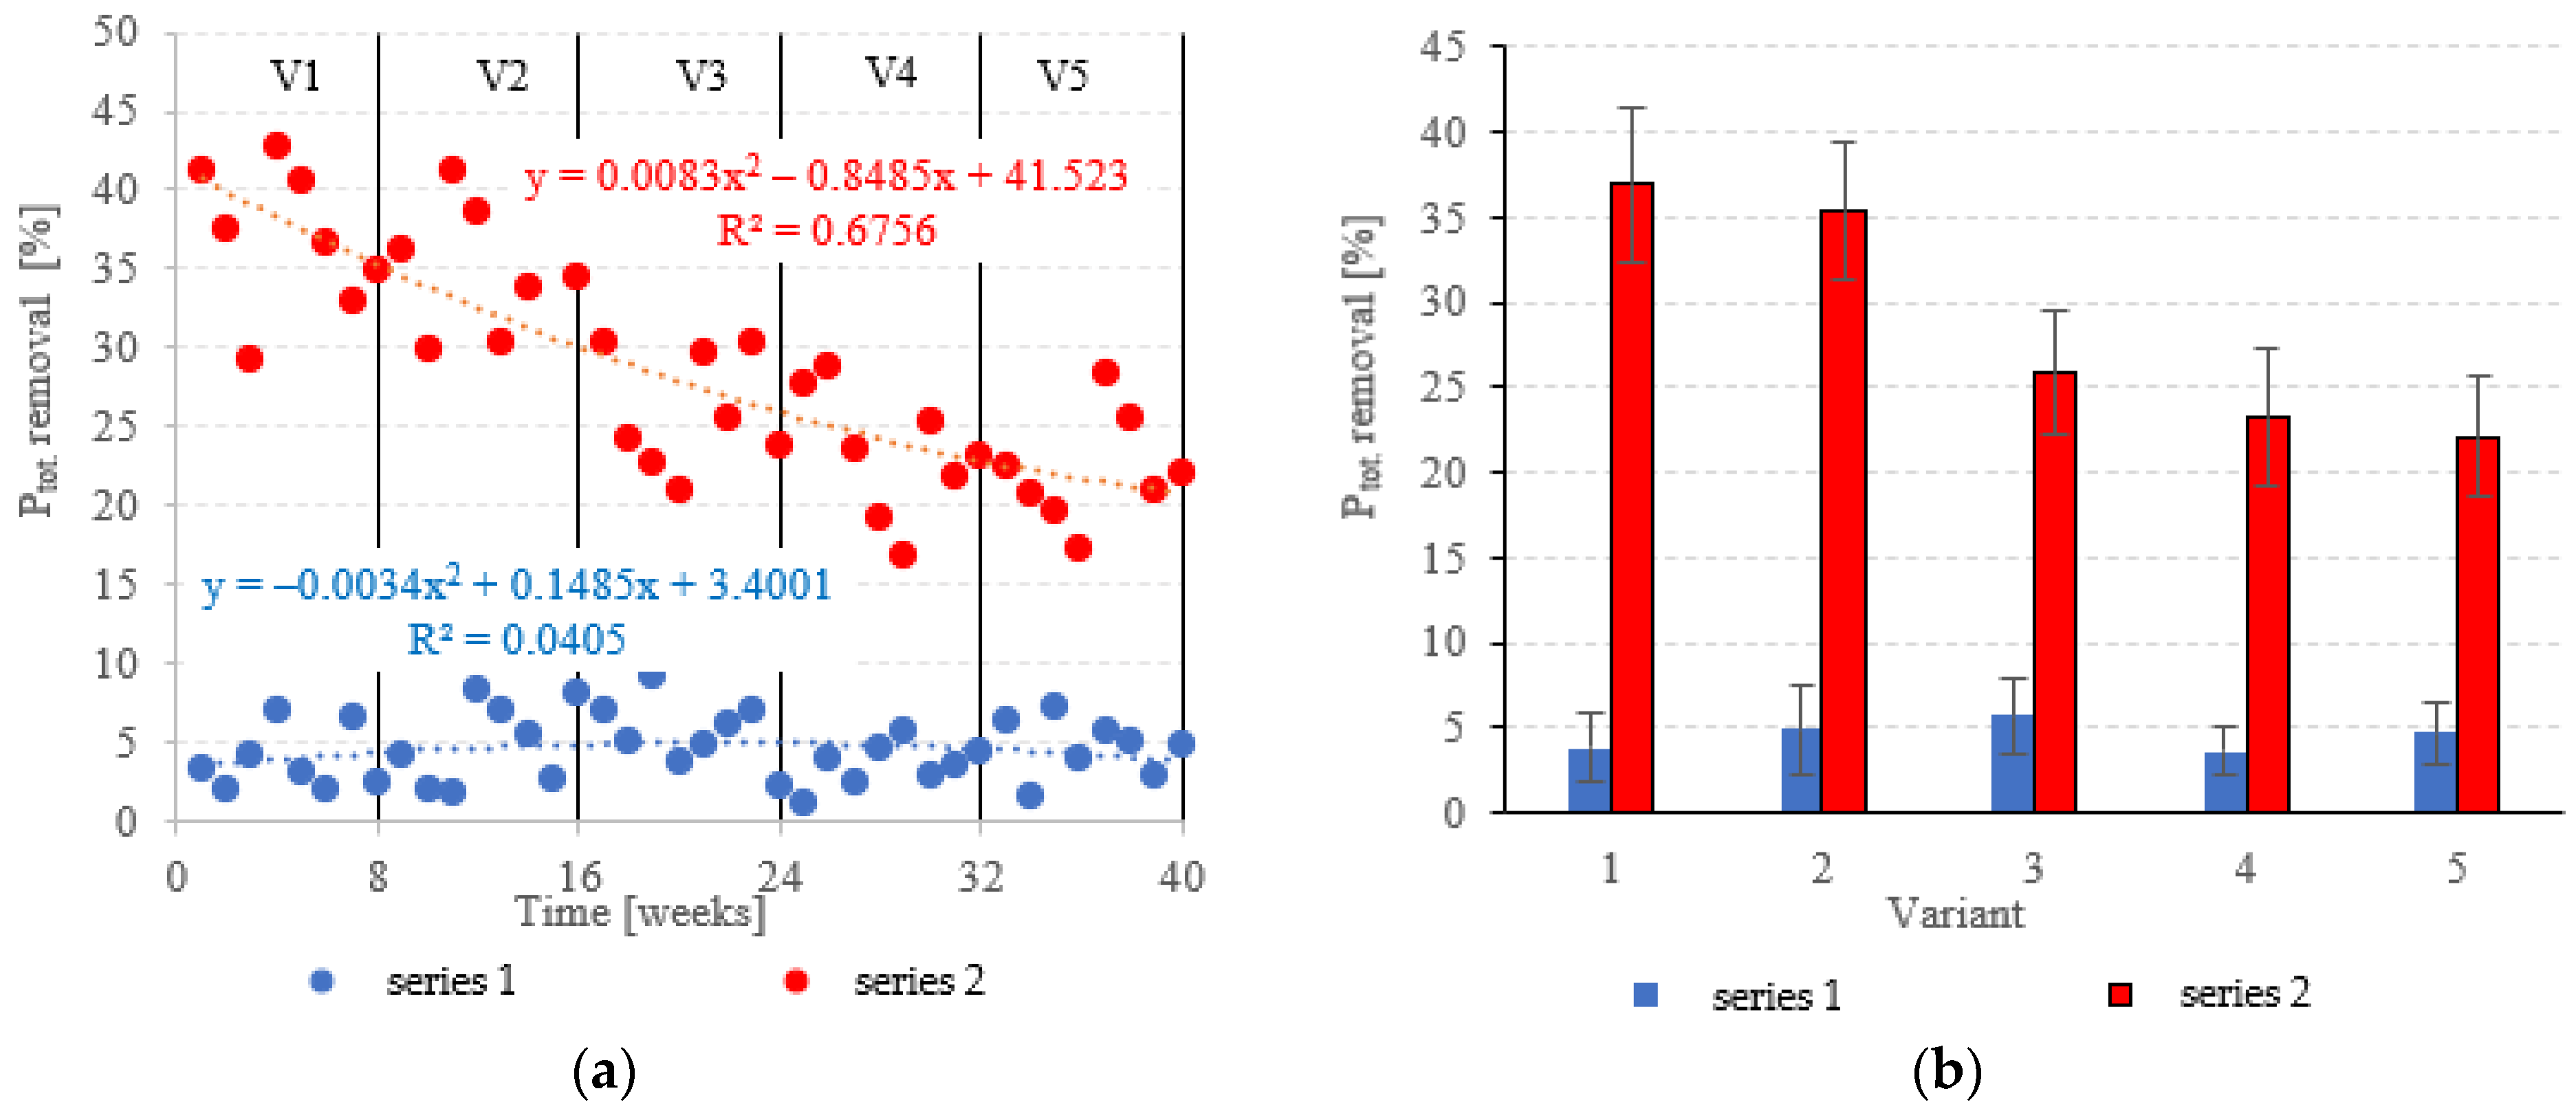
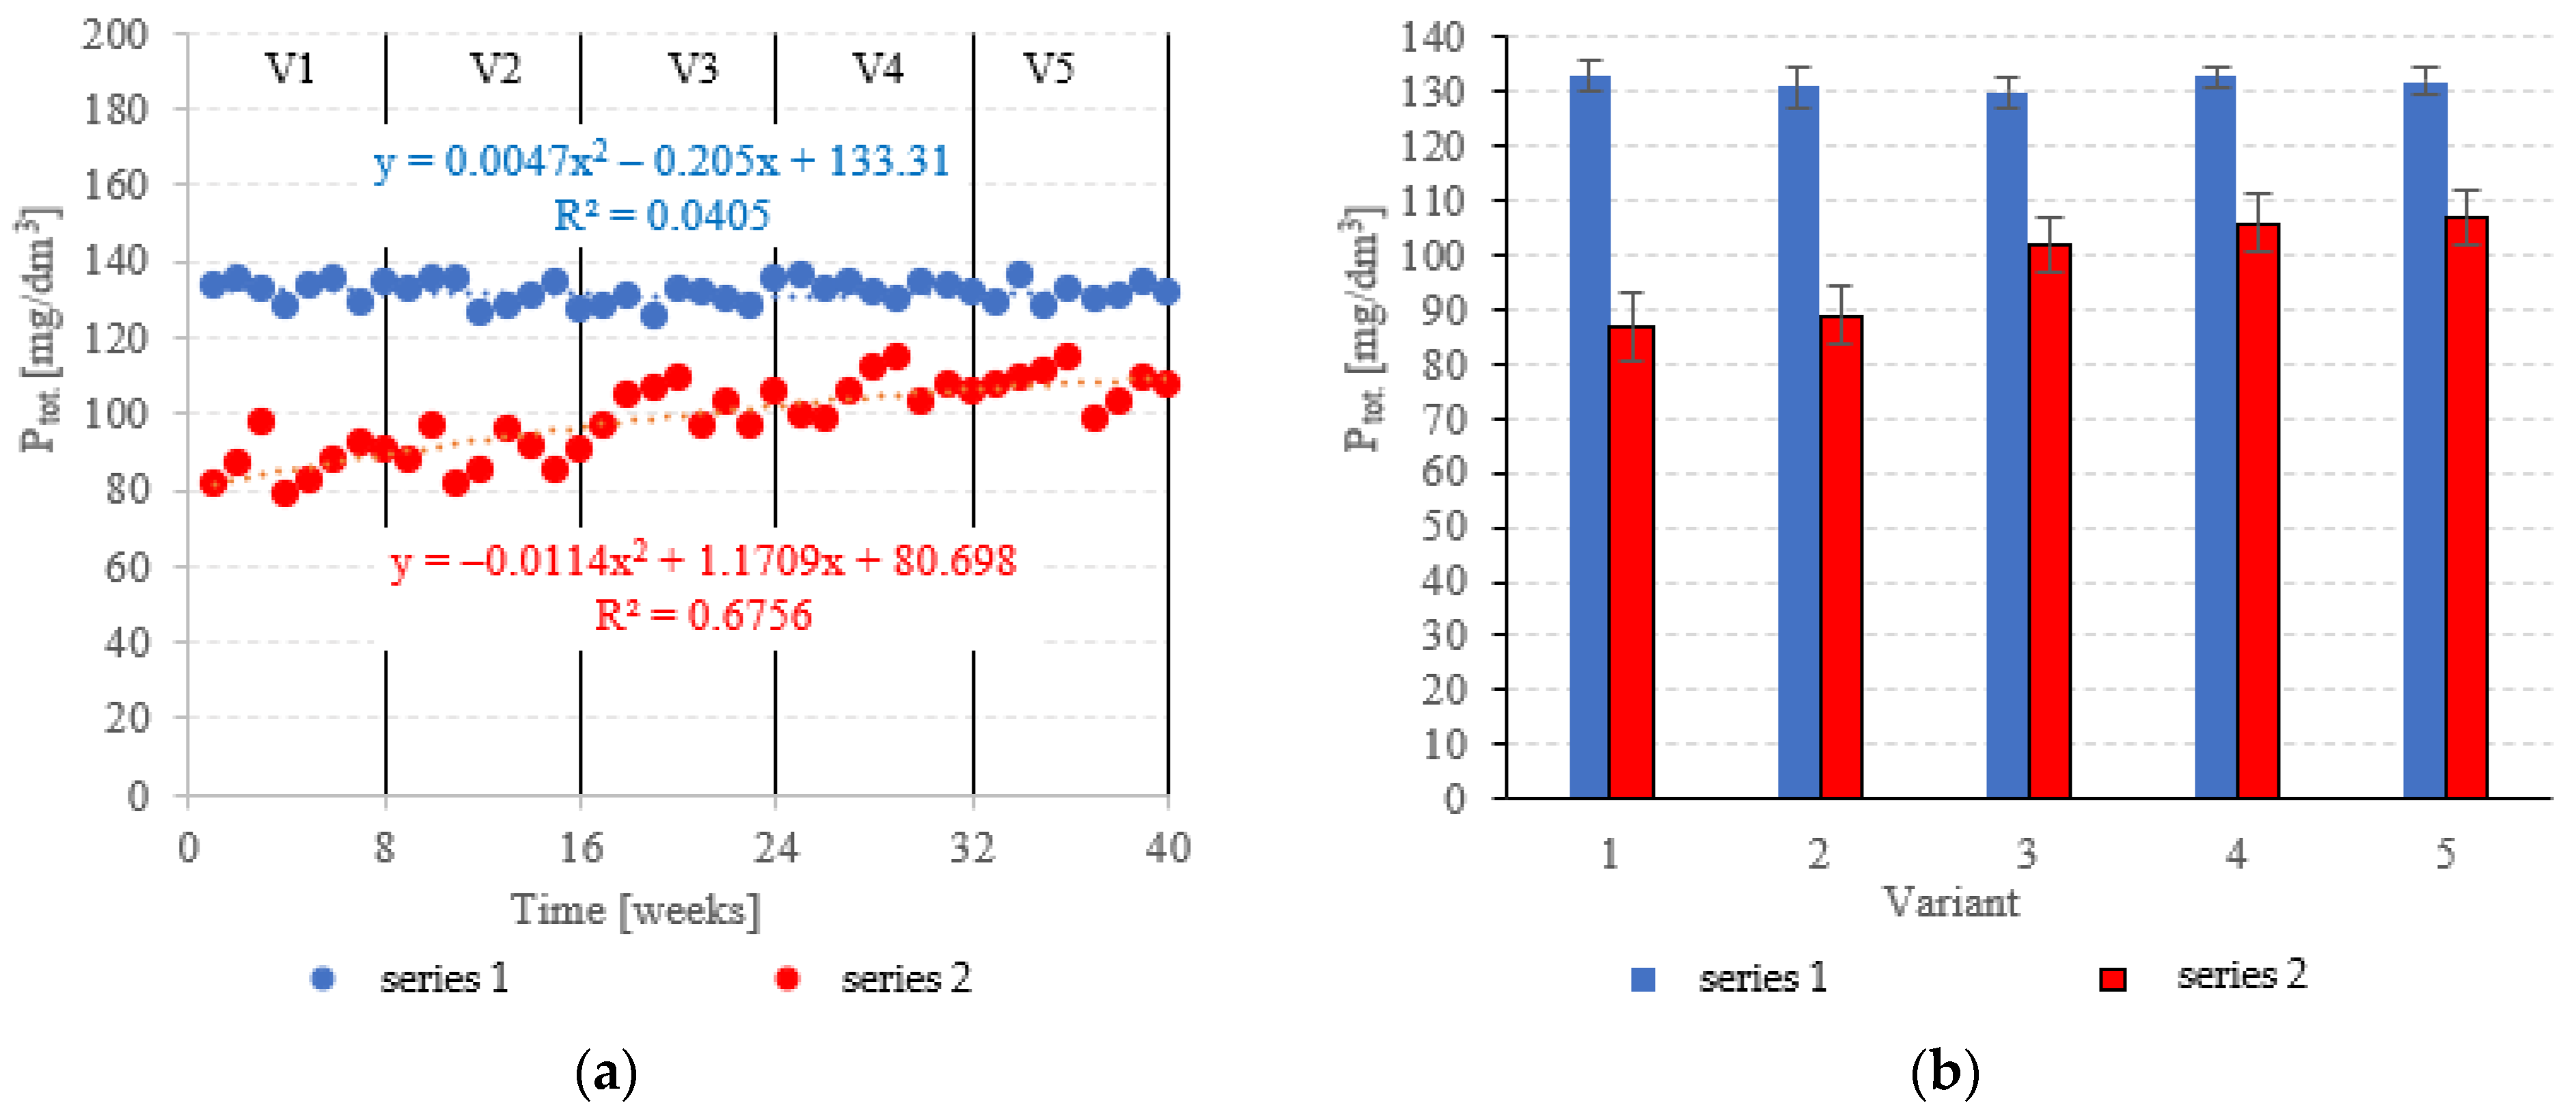
3.2. Biogenic Pollutant Removal

Neither the choice of filling nor the OLR was found to significantly correlate with Ntot. removal from dairy effluent (Figure 9a,b). In series 1 (LECAF), Ntot removal ranged from 9.6 ± 1.0% in V5 to 12.6 ± 1.3% in V3 (Figure 9a,b), with final concentrations of 219.6 ± 2.3 mgNtot./dm3 to 212.5 ± 3.0 mgNtot./dm3 (Figure 10a,b). Series 2 (LCRF) produced similar results–Ntot. removal fell within the narrow range of 10.2 ± 1.6% (adaptation period–V1) to 11.9 ± 1.7% in the OLR = 5.0 kg COD/m3·d variant (Figure 9a,b). The final effluent contained between 214.0 ± 4.2 mgNtot./dm3 and 218.2 ± 3.8 mgNtot./dm3 (Figure 10a,b).
Anaerobic nitrogen removal has been shown to be an inefficient process fueled exclusively by microbial biomass growth [36]. In AD reactors, organic N species can only be converted into ammoniacal nitrogen [37], so further processing is necessary to remove nitrogen completely from the wastewater [38]. It has been posited that improving N removal in anaerobic wastewater treatment (AWT) systems is one of the biggest challenges for researchers [39,40]. Studies so far have looked at upgrading anaerobic processes with activated sludge [41], plant filters [42], zeolites [43], absorption methods [44], struvite production [45] or intensive microalgal cultivation systems [46].
The LECAF anaerobic reactors had little success in removing Ptot., with removal rates falling within the narrow range of 3.6 ± 1.4% to 5.7 ± 2.2% (Figure 11a,b). The rates were statistically similar across all OLR variants. Concentrations of Ptot. in the final effluent of series 1 (all variants) exceeded 130 mgPtot./dm3 (Figure 12a,b). The LCRF reactors performed much better in removing Ptot.. The removal efficiencies in V1 and V2 were 36.9 ± 4.6% and 35.4 ± 4.0%, respectively (Figure 11a,b), which translates to Ptot. in the final effluent of less than 90.0 mgPtot./dm3 (Figure 12a,b). The higher OLRs of the subsequent variants had a significant negative effect on Ptot. removal rates, which finally stabilized at 22.1 ± 3.5%–25.9 ± 3.7% (Figure 11a,b), with P levels in the final effluent at 102 ± 5.1 mgPtot./dm3 to 107 ± 4.8 mgPtot./dm3 (Figure 12a,b).
Mineralization is the only process by which N and P are removed under fermentative conditions [47]. The only way by which anaerobic bacteria can remove nitrogen and phosphorus is by absorbing them into their cells—a time-consuming process, as the microbes themselves are slow to grow [48]. Of course, converting organic P species into orthophosphates makes it easier to remove them in subsequent treatments [49]. Methods used to this end include an aerobic pass (activated sludge step) [50], biological beds, hydrophyte-based treatments, chemical precipitation with iron- or clay-based inorganic coagulants [51,52] and microalgae [46]. One approach increasingly discussed in the literature is the use of active fillings to promote phosphorus removal directly in the digester [53]. Many designs have been tested for dairy effluent treatment, including magneto-active hybrid anaerobic biofilm reactors (MA-HABRs) [33], anaerobic moving biofilm reactors (AMBRs) with iron-containing supports [54], anaerobic reactors with active filling (AF) heated with microwave radiation (EMR) [55] as well as anaerobic baffled and biofilm reactors with magneto-active packing media [34]. Removal performance has been reported to vary between 64.4% and 90.7%, depending on treatment parameters [29]. One of the reported drawbacks of active fillings for P removal is the issue of passivation–anaerobic biofilms forming a barrier around the packing media and reducing contact with the wastewater [56]. Consequently, the effectiveness of such packings often decreases the longer a reactor operates [19]. Another limitation is the depletion of the packing’s sorption capacity, after which it needs to be replaced or regenerated [29].

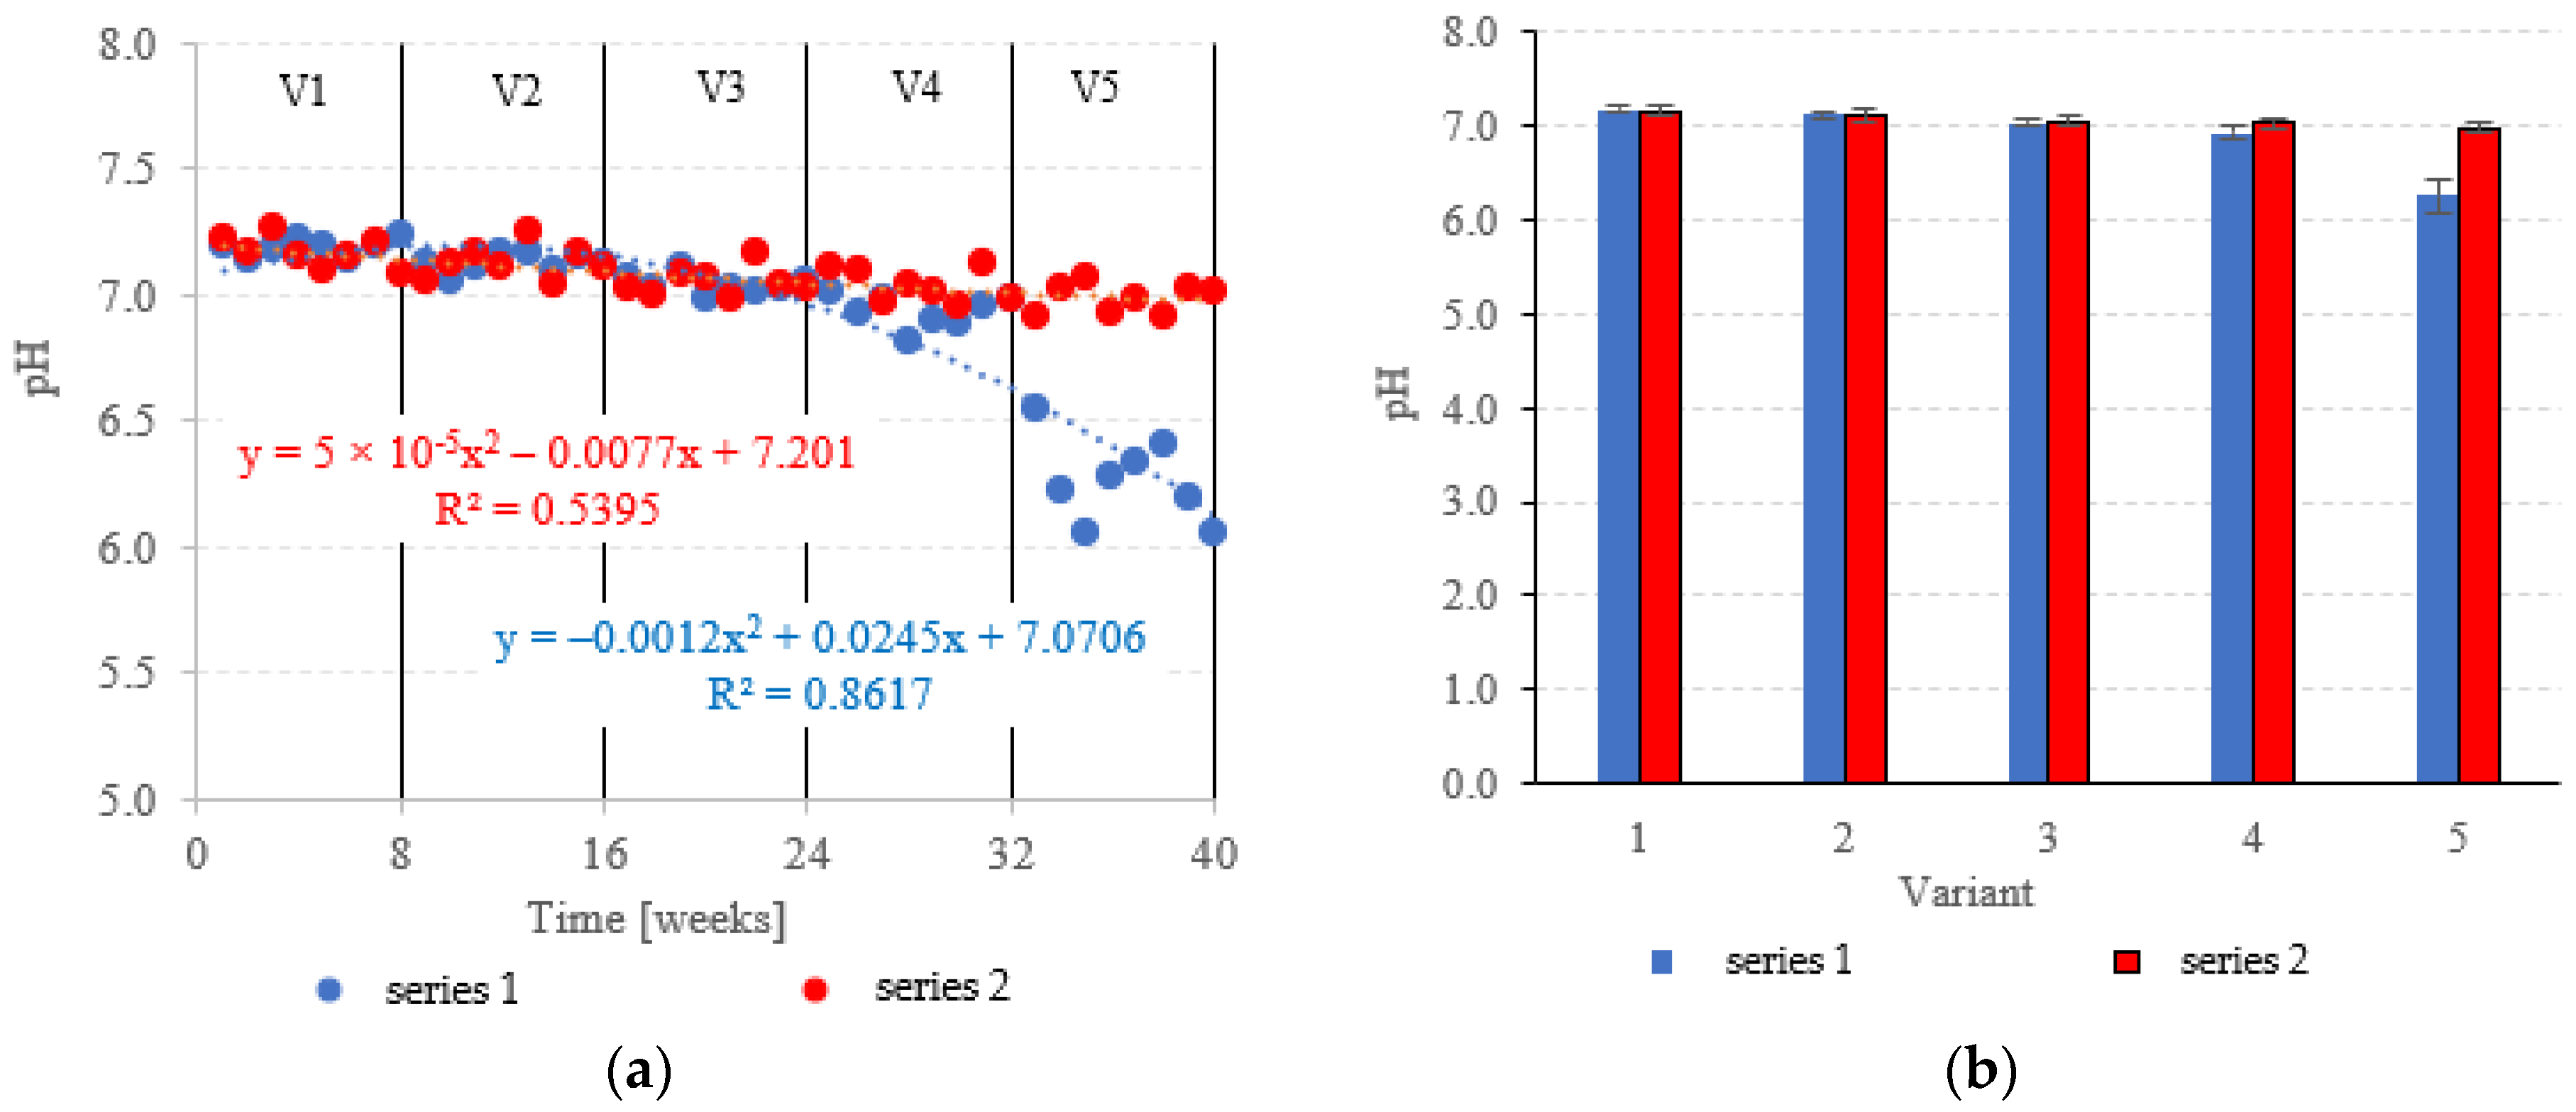
3.3. Evolution of pH and Bacterial Community

The pH was fairly stable across variants V1–V4 of the LECAF series, ranging from 6.93 ± 0.07 to 7.19 ± 0.03 (Figure 13a,b). Increasing the OLR to 7.0 kg COD/m3·d resulted in a sharp decrease in pH to 6.26 ± 0.17 (Figure 13a,b). LCRF reactors proved to be more resistant to OLR increases, with pH holding steady at a near-neutral level across all treatment variants. The pH fluctuated within the narrow range of 6.98 ± 0.06 in V5 to 7.17 ± 0.06 in V1 (Figure 13a,b). The stepwise increases of the OLR from 4.0 kg COD/m3·d to 7.0 kg COD/m3·d produced a consistent but non-significant decrease in average pH. The pH is a major determinant of AD performance [57]. A near-neutral pH in an anaerobic medium signifies that the hydrolysis, acidic and methanogenic phases of anaerobic conversion have reached an equilibrium [58]. It has been demonstrated that pH decreases are primarily driven by the accumulation of volatile fatty acids (VFAs), which are produced at the acidogenesis stage [59]. This usually happens at excessively high OLRs [60]. Decreased pH inhibits the activity of methanogenic bacteria, effectively reducing biogas production and pollutant removal rates [61]. This trend has been demonstrated by Zieliński et al. [35] in a study that examined dairy effluent treatment in a microwave radiation heated (MRH) multi-section hybrid anaerobic reactor (M-SHAR) and a conventional reactor. The reactor operated at steady state within the OLR range of 15 kg COD/m3·d to 20 kg COD/m3·d. Higher OLRs led to significant decreases in pH, negatively impacting digestion efficiency. Biogas yields dropped from 433 dm3/d (MRH reactor) and 384 dm3/d (conventionally heated reactor) to 324 dm3/d and 260 dm3/d, respectively [35]. Cheng et al. [62] have also shown a significant correlation between OLR and AD performance. OLR was found to have little adverse effect on the effluent quality and organic matter removal at levels up to 9.72 kg COD/m3·d. However, as the OLR was increased further to 14.58 kg COD/m3·d, the biogas production rate decreased significantly to 1.35 dm3/dm3·d [62]. Sanchez et al. [63] have also demonstrated that while higher OLRs can boost methane generation, they can also lead to system failure (due to the accumulation of VFAs and free ammonia) and decreased pH [63].
The anaerobic bacterial community was directly affected by the increasing OLRs, decreasing HRTs and the resultant changes in the reactor conditions, as shown in Table 3. The changing parameters had a particularly pronounced effect in the LECAF series. In variants V1–V3, the taxonomic structure consisted of 67 ± 11%–69 ± 9% Bacteria and 28 ± 5%–29 ± 7% Archaea. Methanosarcinaceae and Methanosaeta populations were also stable (14 ± 2%–15 ± 3% and 9 ± 2%–9 ± 3%, respectively). As the OLR reached 6.0 kg COD/m3·d, the taxonomic structure of anaerobic bacteria started to experience more serious disruptions—the proportion of Bacteria rose to 70 ± 7%, while methane-producing microbes became significantly less abundant (Archaea–26 ± 6%, Methanosarcinaceae–13 ± 2% Methanosaeta–7 ± 2%). The sharp decrease in pH in V5 led to further depopulation of methanogens in the bacterial community, especially for two of the monitored groups—Archaea (20 ± 3%) and Methanosarcinaceae (10 ± 3%). Conversely, the taxonomic composition of the LCRF series did not change significantly in response to OLR changes. The share of bacteria ranged from 66 ± 3% in V3 to 68.7 ± 7% in V1. Archaea became progressively more abundant in the anaerobic microbial community (from 27 ± 5% in V1 to 33 ± 5% in V4), whereas Methanosarcinaceae rose from 14 ± 3% to 17 ± 4%. Only Methanosaeta showed statistically significant variation—from 6 ± 2% to 11 ± 3% of the Archaea community. Other authors have also noted that changing OLRs and pH can induce a disruption in the taxonomic composition of the anaerobic bacterial community [54,64]. Zielińska et al. [54] have investigated taxonomic evolution in an anaerobic reactor used for treating dairy effluent. Changes in process parameters were found to decrease methanogenic bacteria populations, thus impacting the quality and yields of the resultant biogas [54]. Our findings are also corroborated by Boonapatcharoen et al. [64], who noted that an OLR increase from 1.0 to 6.0 kg COD/m3·d during anaerobic treatment of cassava starch wastewater caused bacteria to more than double, whereas Archaea to become markedly less abundant [64].

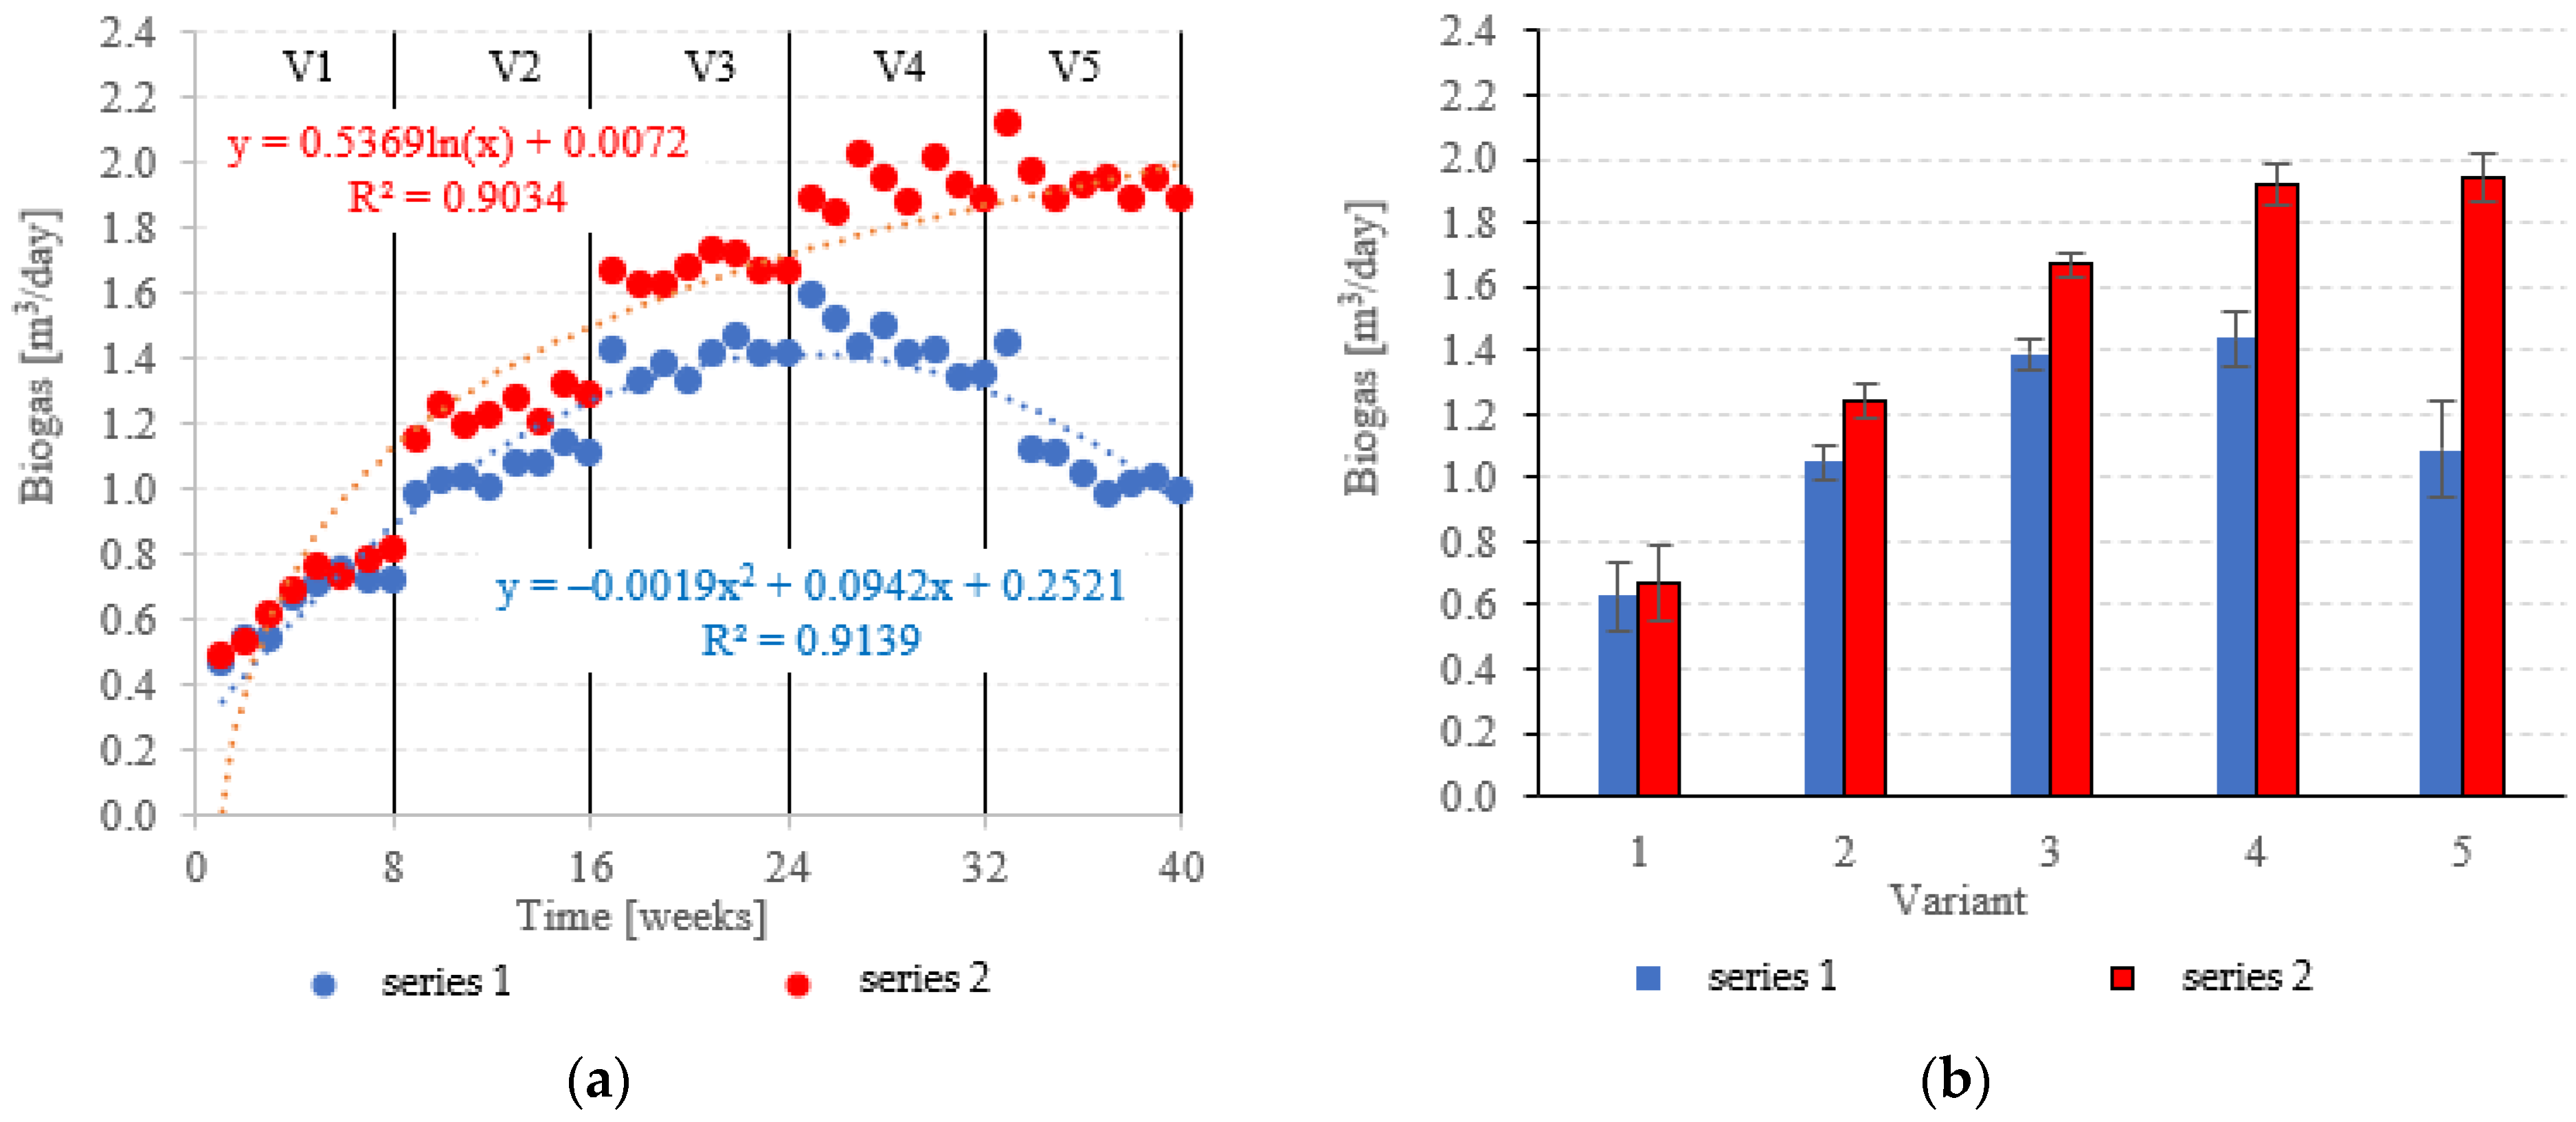
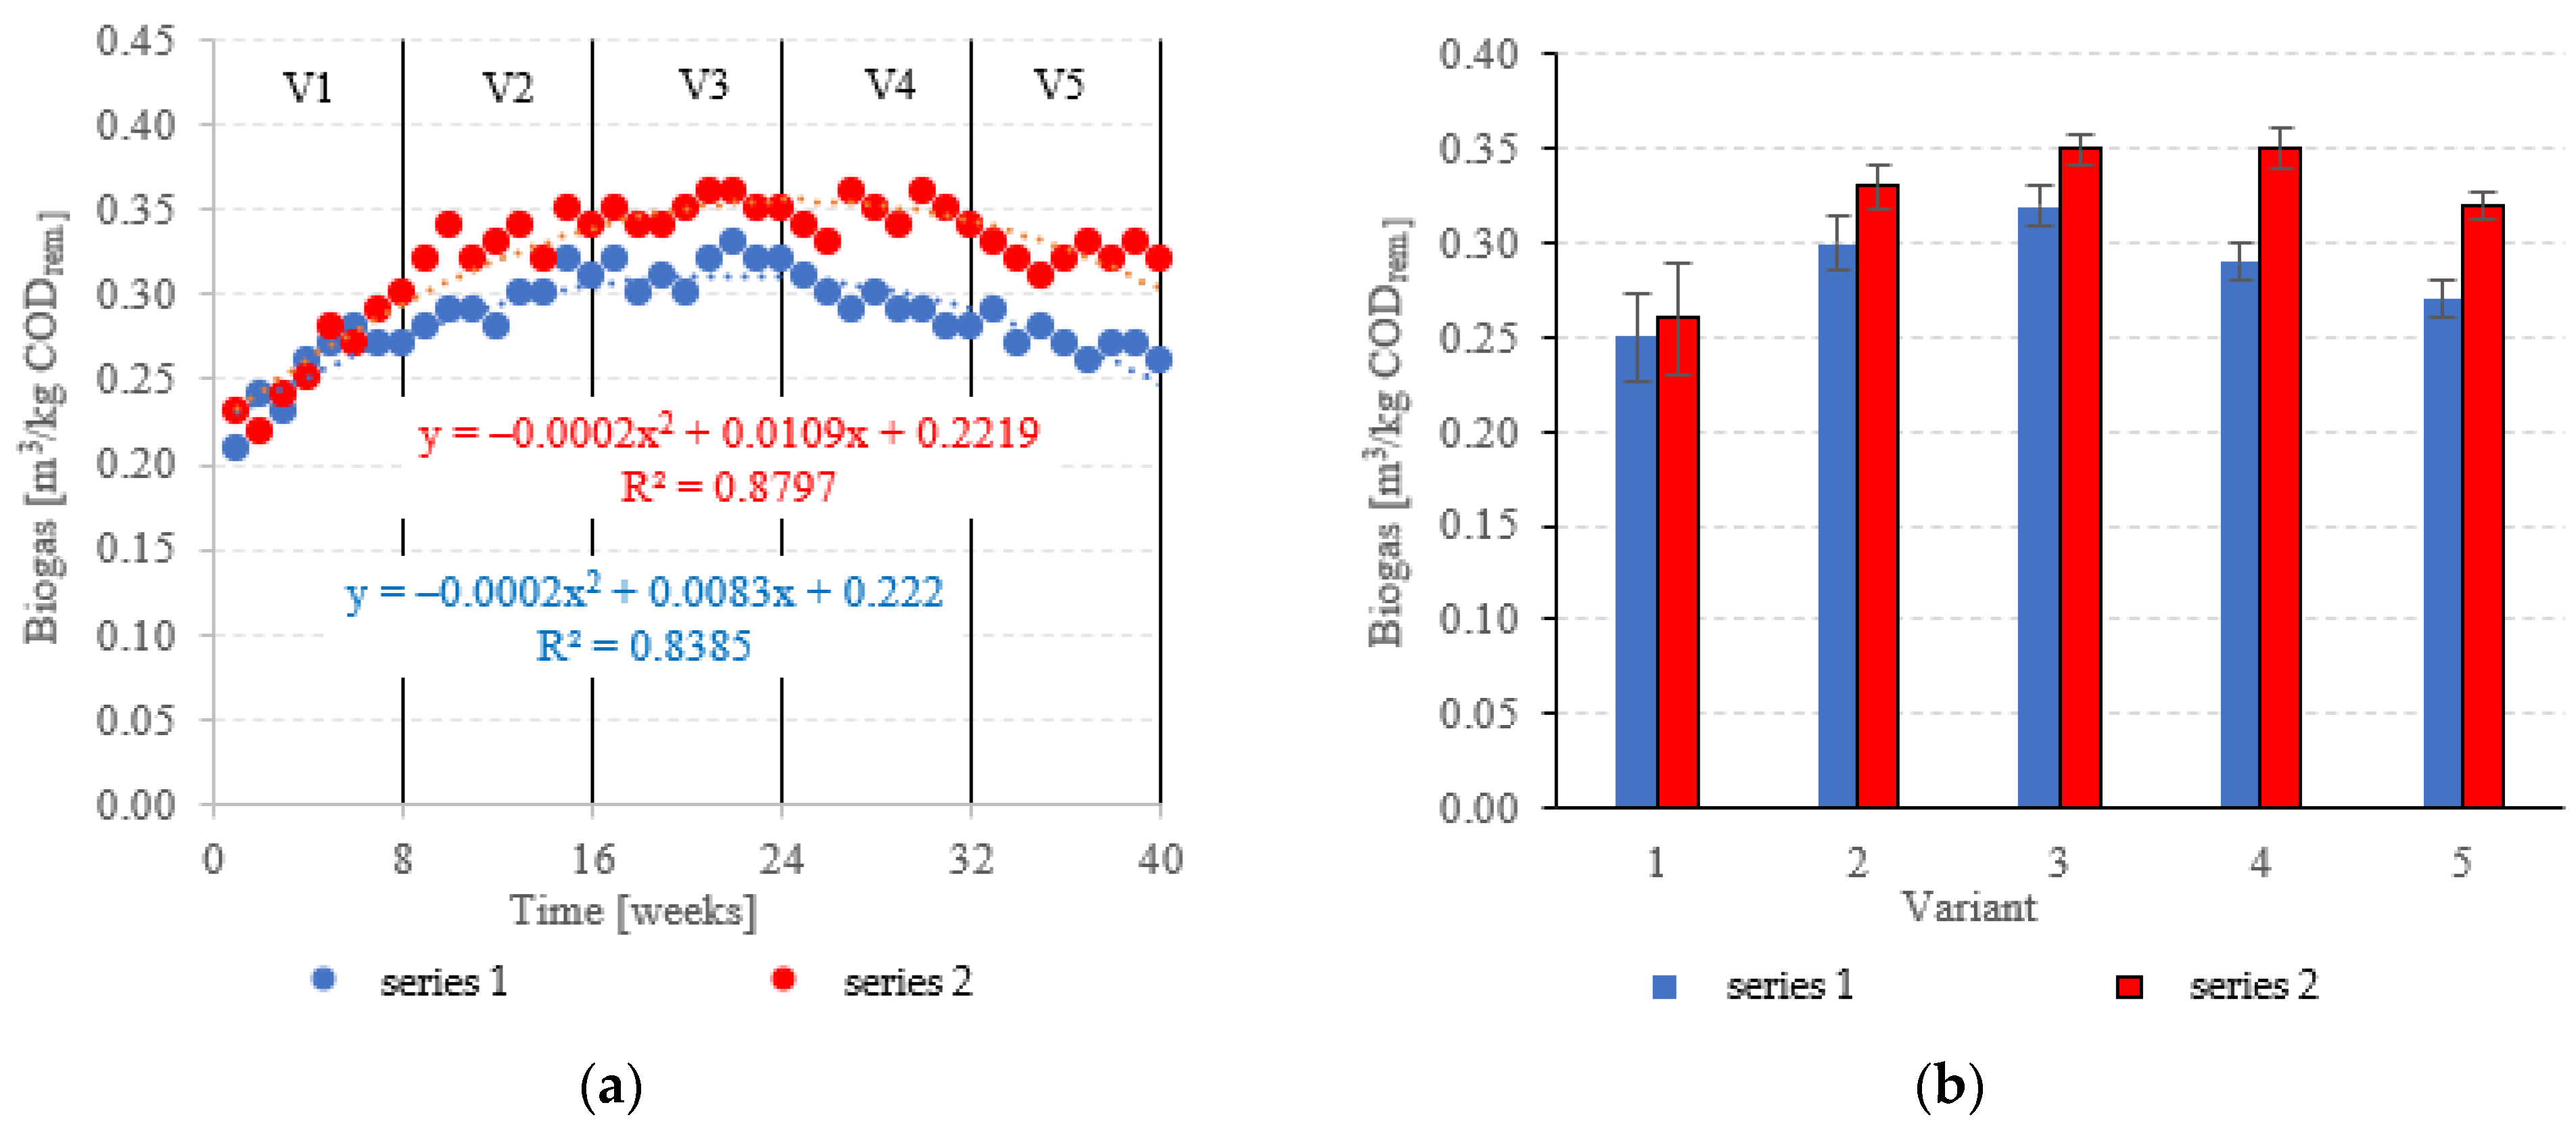
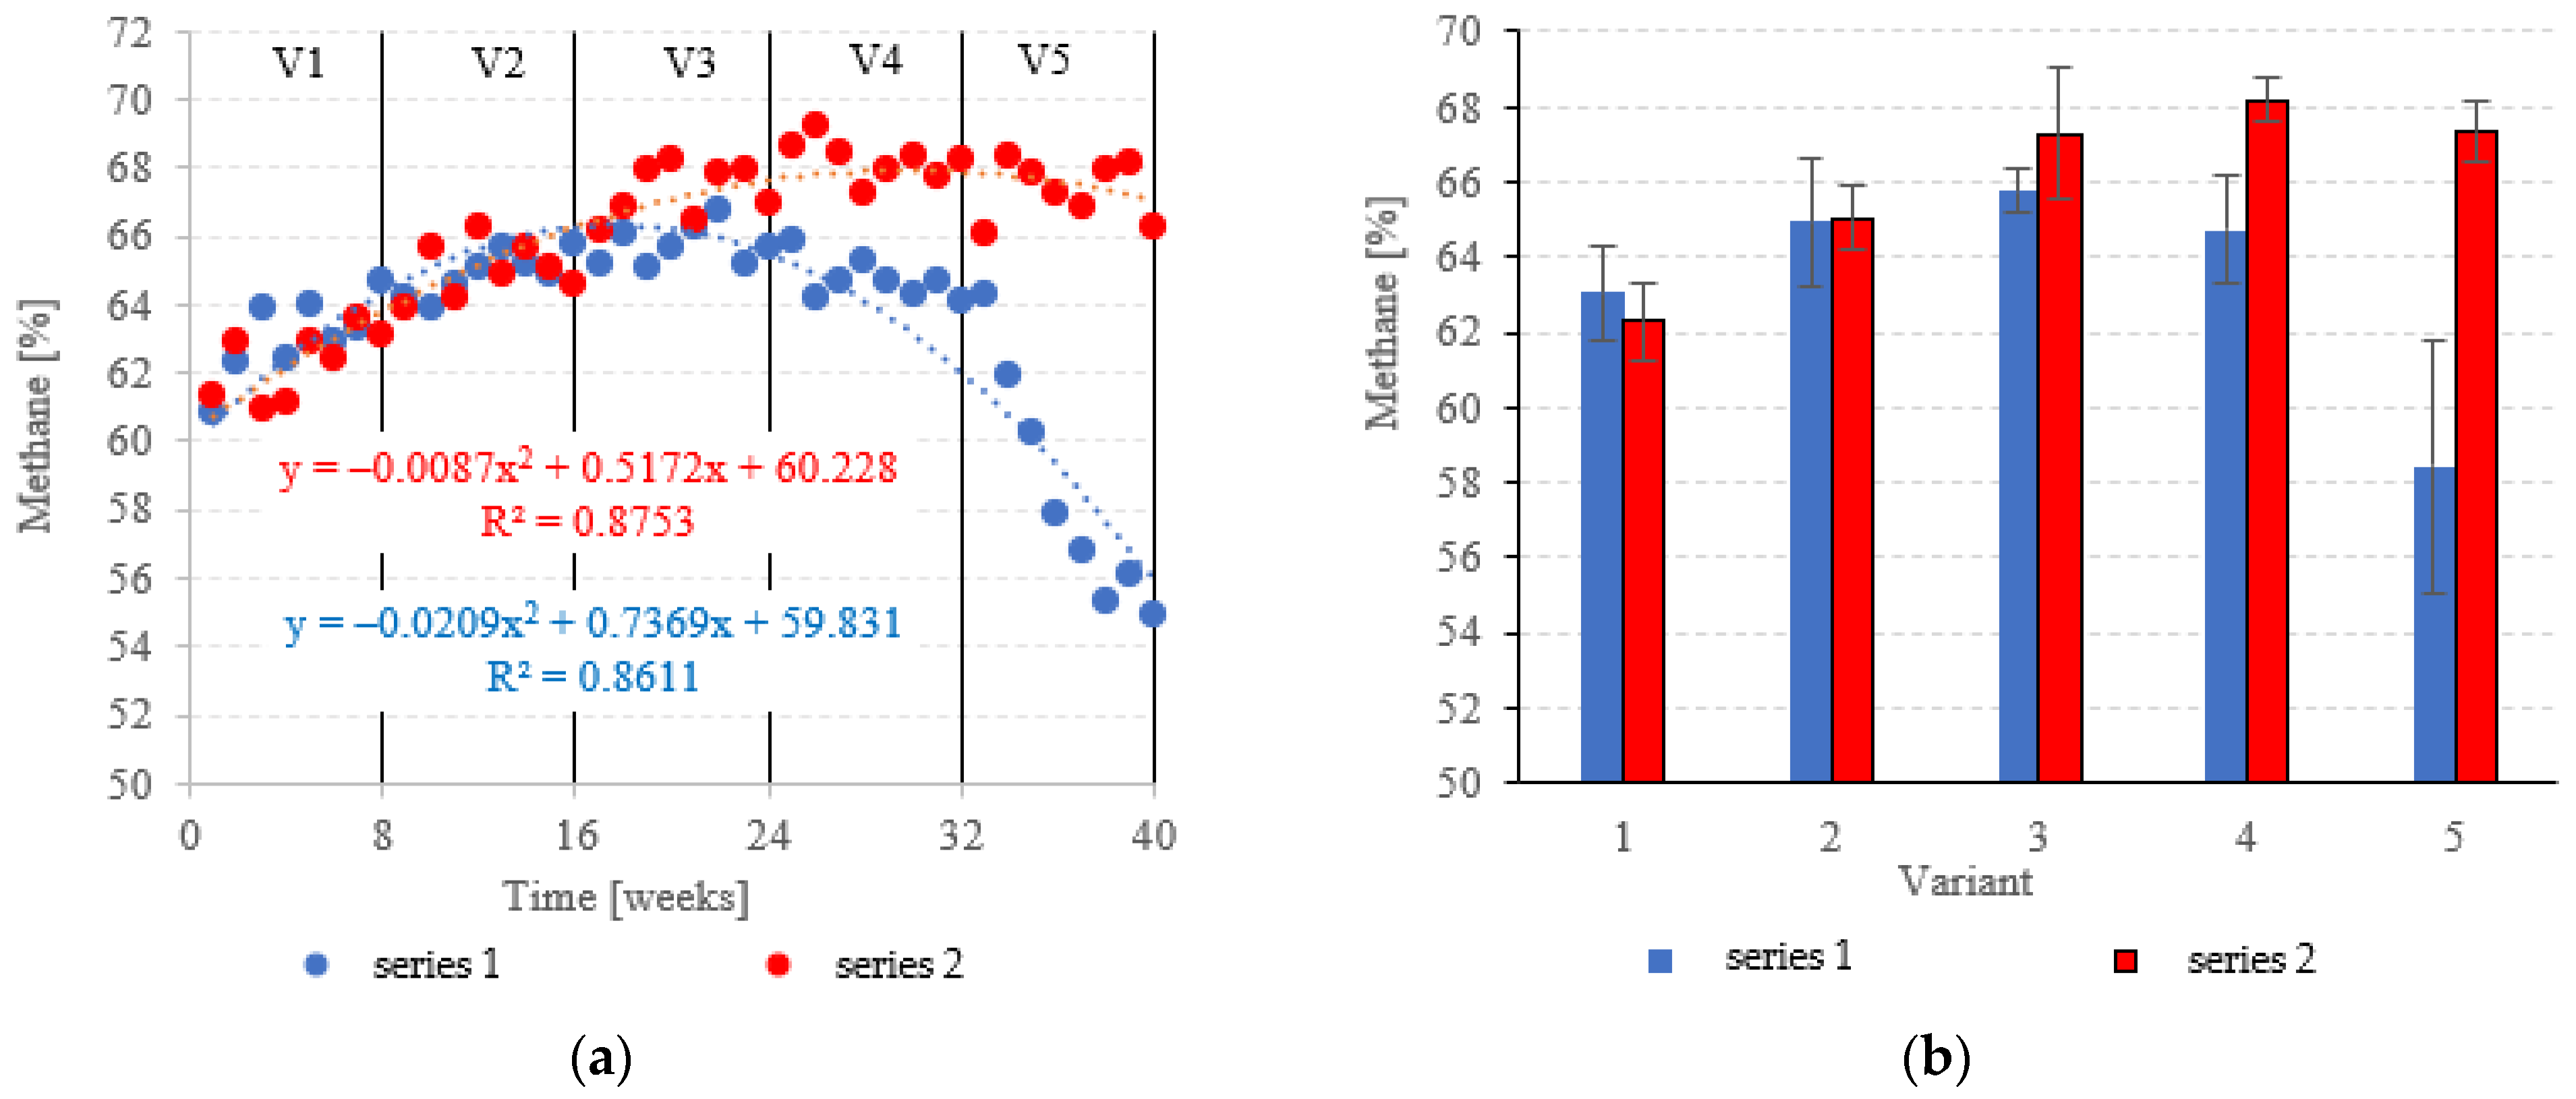
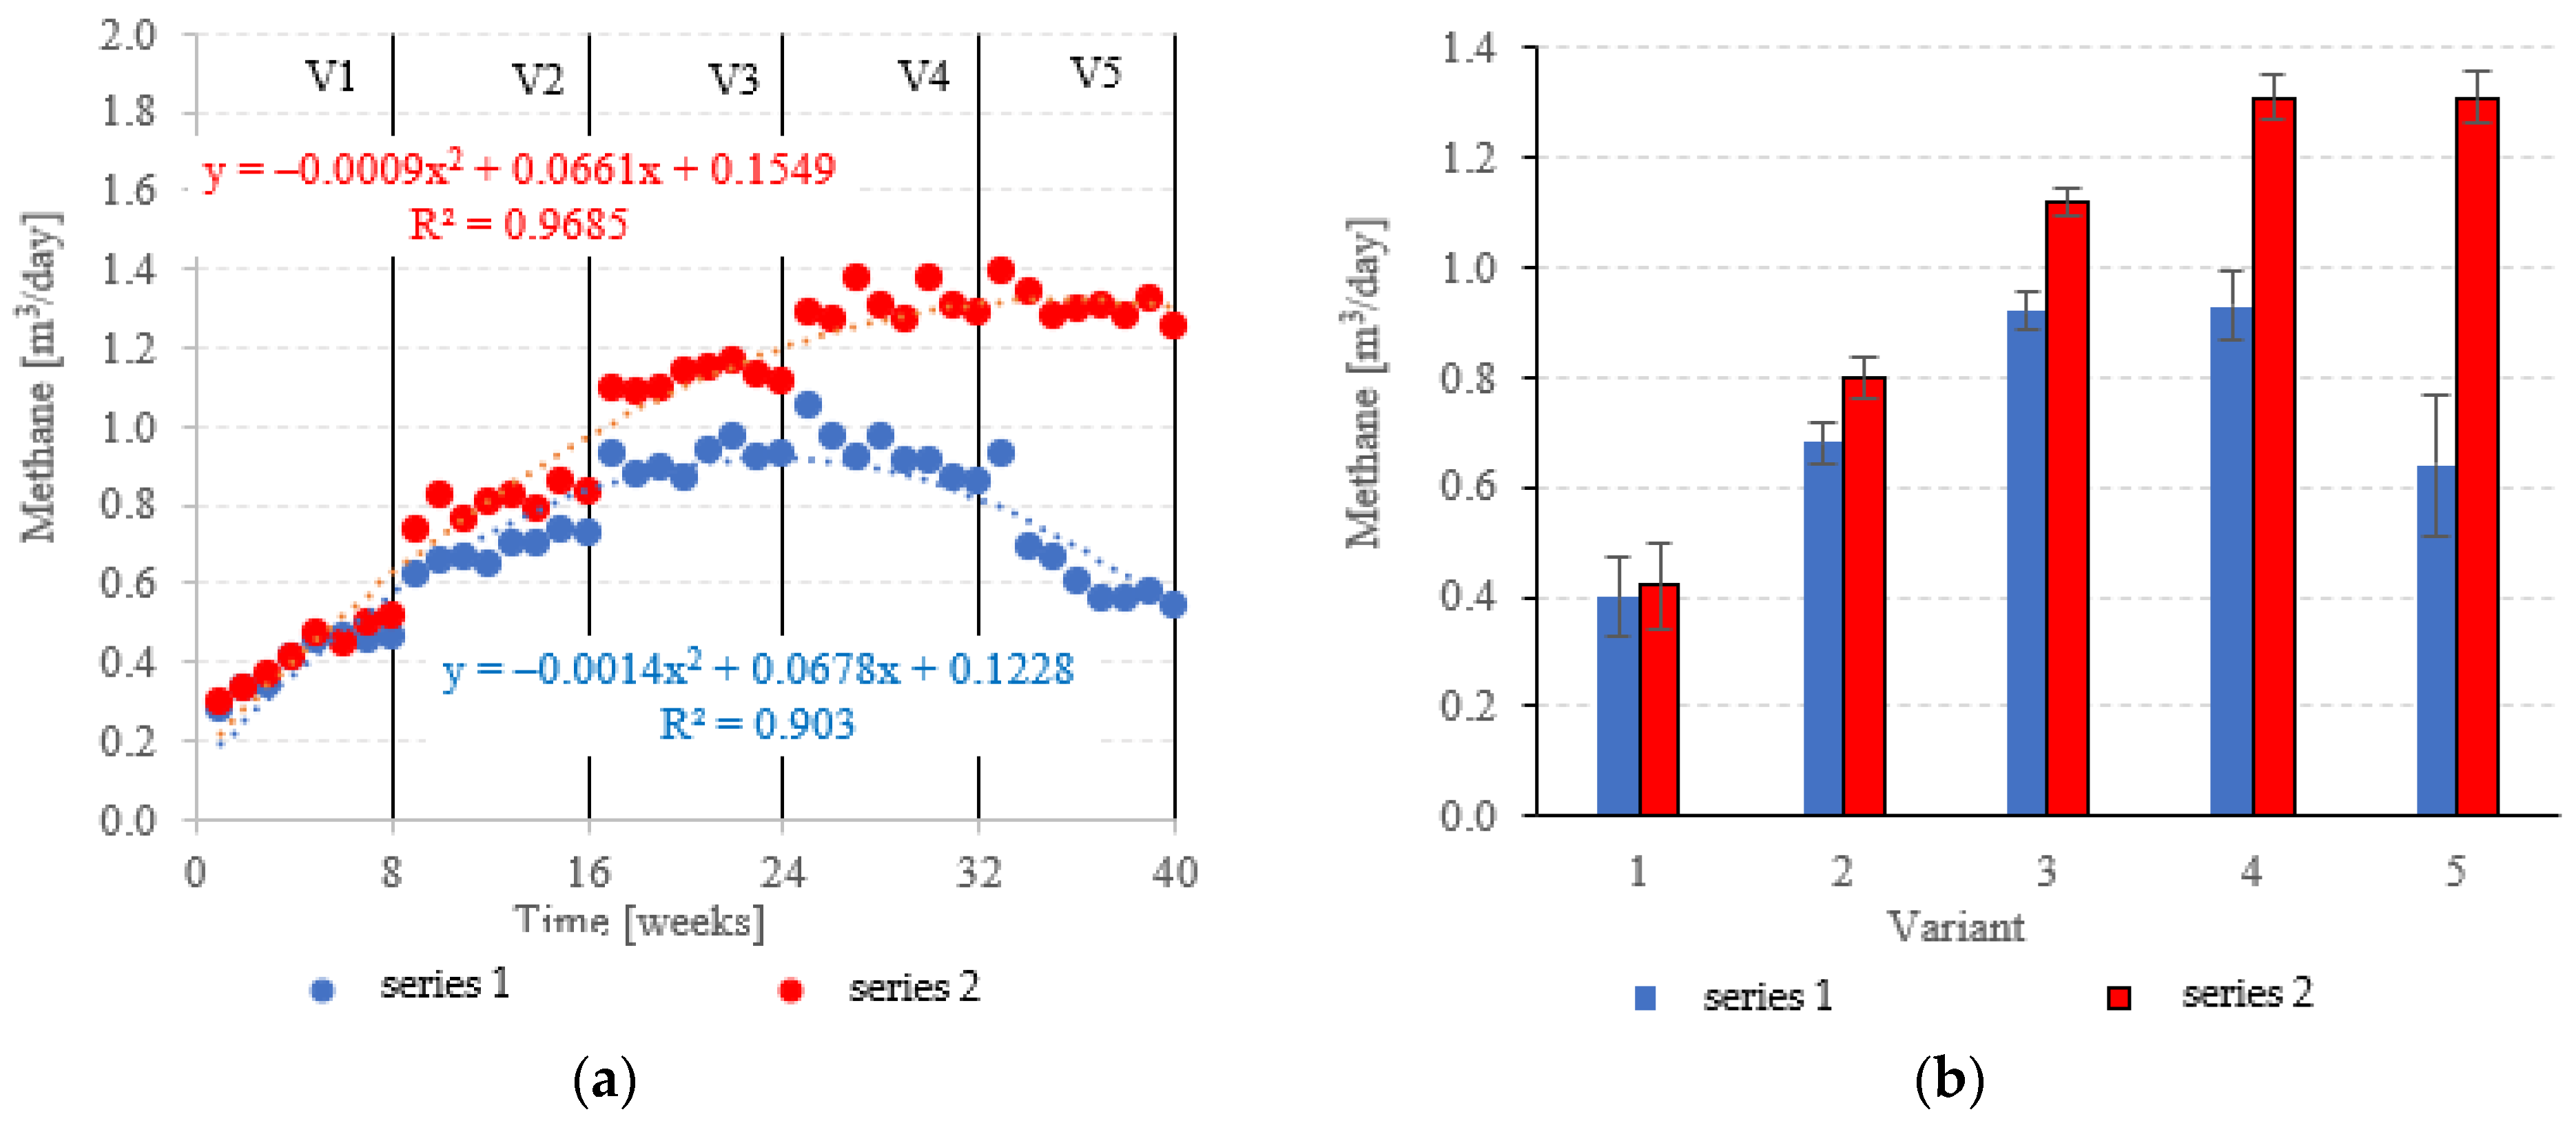
3.4. Biogas and Methane Production

Biogas production in anaerobic reactors is directly affected by the type of filling used, OLR, HRT, conditions in the medium and changes in the microbial populations. Across all of the experimental variants, the LCRF reactors proved superior in terms of digestion performance, with biogas production between 0.67 ± 0.12 m3/d in V1 to 1.92 ± 0.06 m3/d in V4 (Figure 14a,b). The highest OLR (7.0 kg COD/m3·d) did not produce significant further increases in biogas production, peaking at 1.94 ± 0.08 m3/d (Figure 14a,b). The LCRF series was also fairly stable in terms of specific biogas production per organic load removed, which ranged from 0.26 ± 0.03 m3/kg CODremoved in V1 to 0.35 ± 0.01 m3/kg CODremoved in V4 (Figure 15a,b). The LECAF reactors produced much lower yields of biogas. Specific biogas production peaked at 0.32 ± 0.01 m3/kg CODremoved in V3 (Figure 15a,b), whereas the highest daily biogas yield of 1.44 ± 0.09 m3/d was noted in V4 (Figure 14a,b). The digestion process in series 1 was significantly impaired when the OLR reached 7.0 kg COD/m3·d. This variant (V5) yielded 0.27 ± 0.01 m3/kg CODremoved (Figure 15a,b) and 1.09 ± 0.15 m3/d (Figure 14a,b). In a study by Dębowski et al. [33], simulated dairy effluent treated in a magneto-active hybrid anaerobic biofilm reactor yielded a maximum of 0.31 m3 biogas/kg CODremoved at OLR = 6.0 kg COD/m3·d. OLR increases within the range of 5.0 kg COD/m3·d to 10 kg COD/m3·d were found to impact biogas production. OLRs of 5.0 to 7.0 kg COD/m3·d produced biogas yields of 0.30 m3/kg CODremoved. At the 8.0 kg COD/m3·d threshold, biogas production in the MA-HAB reactor started to decrease, with the lowest yields (0.12 m3/kg CODremoved) recorded for OLR = 10 kg COD/m3·d. Other researchers have also found that active filling had a positive effect on biogas production from model dairy effluent. AF has been demonstrated to improve performance within the COD range of 4.0 kg COD/m3 to 6.0 kg COD/m3. The effect on biogas production was similar across all AF types [55].
At OLRs between 3.0 kg COD/m3·d and 5.0 kg COD/m3·d, CH4 in the biogas was similar across both types of fillings. CH4 fractions ranged from 63.0 ± 1.2% (V1) to 65.8 ± 0.6% (V3) in series 1 (LECAF), and from 62.3 ± 1.0% (V1) to 67.3 ± 1.7% (V3) in series 2 (LECAF) (Figure 16a,b). However, methane levels started to severely diverge at 6.0 kg COD/m3·d OLR and 7.0 kg COD/m3·d OLR. Variants 4 and 5 of series 1 produced 64.7 ± 1.4% and 58.4 ± 3.4%, respectively, whereas the same variants of series 2 yielded 68.2 ± 0.6% and 67.3 ± 0.8%, respectively (Figure 16a,b). Biogas production rates and CH4 fractions translate directly into daily methane yields. The LCRF series produced higher daily CH4 output across all variants, with the sole exception of V1 (adaptation period). The CH4 levels ranged from 0.80 ± 0.04 m3/d in V2 to 1.31 ± 0.04 m3/d in V4 and V5 (Figure 17a,b). By comparison, production in the LECAF reactor ranged from 0.64 ± 0.13 m3/d (V5) to 0.93 ± 0.06 m3/d (V4) (Figure 17a,b). CH4 production efficiency in relation to the COD removed was presented in Table 4.
Other studies on anaerobic treatment of dairy effluent have noted greatly disparate levels of CH4 in the biogas—reported fractions range from 25.8 to 83.8% [54]. This variable is driven by multiple factors, including reactor type, process parameters and influent profile [65]. Notably, the filling was used in the top-performing reactors (83.8% CH4 in the biogas), as reported by Zielińska et al. [54].

4. Conclusions

The present study shows that LCRF ensures high COD removal performance (between 95.2 ± 0.3% and 86.1 ± 2.6%). The LCRF continued to run at steady state even at the highest of the tested OLRs (7.0 kg COD/m3·d), whereas the same load induced reactor failure and reduced COD removal (57.2 ± 5.9%) in the LECAF series.
There was little difference in N removal between the two processes. Removal rates ranged between 9.6 ± 1.0% and 12.6 ± 1.3% across all OLRs and both types of filling. On the other hand, P removal was significantly improved by the LCRF (22.1 ± 3.5% to 26.9 ± 4.6%, depending on the OLR). The LECAF anaerobic reactors had little success in removing Ptot., with removal rates falling within the narrow range of 3.6 ± 1.4% to 5.7 ± 2.2%.
The LCRF reactors proved to be more resistant to OLR increases, with pH holding steady at a near-neutral level and anaerobic bacterial community composition remaining stable across all treatment variants. In the LECAF reactor, on the other hand, the increasing OLRs and decreasing HRTs led to decreased pH and disruptions of the anaerobic bacterial community.
Across all of the experimental variants, the LCRF reactors proved superior in terms of digestion performance, with biogas production ranging from 0.67 ± 0.12 m3/d to 1.94 ± 0.08 m3/d (depending on the OLR). LCRF reactors also produced more methane in the biogas at the two highest OLRs, with fractions of 68.2 ± 0.6% and 67.3 ± 0.8%.

Author Contributions

Conceptualization, M.Z. and M.D.; Methodology, M.Z. and M.D.; Validation, M.Z.; Formal analysis, M.Z. and M.D.; Investigation, M.Z.; Resources, M.Z., M.D. and J.K.; Data curation, M.Z.; Writing—original draft preparation, M.D. and J.K.; Writing—review and editing, M.Z., M.D. and J.K.; Visualization, M.D. and J.K.; Supervision, M.Z.; Project administration, M.Z. and M.D.; Funding acquisition, M.Z. All authors have read and agreed to the published version of the manuscript.

Funding

The manuscript was supported by the Minister of Education and Science in the range of the program entitled “Regional Initiative of Excellence” for the years 2019–2023, project no. 010/RID/2018/19, amount of funding: 12,000,000 PLN and the work WZ/WB-IIŚ/3/2022, funded by the Minister of Education and Science.

Institutional Review Board Statement

Not applicable.

Informed Consent Statement

Not applicable.

Data Availability Statement

Not applicable.

Conflicts of Interest

The authors declare no conflict of interest.

References

  1. Food and Agriculture Organization of the United Nations. Dairy Market Review, March 2020; FAO: Rome, Italy, 2020. [Google Scholar]
  2. Carolina Rafanhin Sousa, A.; Nascimento Makara, C.; Canniatti Brazaca, L.; Carrilho, E. A Colorimetric Microfluidic Paper-Based Analytical Device for Sulfonamides in Cow Milk Using Enzymatic Inhibition. Food Chem. 2021, 356, 129692. [Google Scholar] [CrossRef] [PubMed]
  3. OECD-FAO. OECD-FAO Agricultural Outlook 2020–2029; FAO: Rome, Italy, 2020. [Google Scholar]
  4. Pope, D.H.; Karlsson, J.O.; Baker, P.; McCoy, D. Examining the Environmental Impacts of the Dairy and Baby Food Industries: Are First-Food Systems a Crucial Missing Part of the Healthy and Sustainable Food Systems Agenda Now Underway? Int. J. Environ. Res. Public Health 2021, 18, 12678. [Google Scholar] [CrossRef] [PubMed]
  5. Karolinczak, B.; Abrowski, W.D.; Zyłka, R.; Dymaczewski, Z.; Zuorro, A. Evaluation of Dairy Wastewater Treatment Systems Using Carbon Footprint Analysis. Energies 2021, 14, 5366. [Google Scholar] [CrossRef]
  6. Żyłka, R.; Karolinczak, B.; Dąbrowski, W. Structure and Indicators of Electric Energy Consumption in Dairy Wastewater Treatment Plant. Sci. Total Environ. 2021, 782, 146599. [Google Scholar] [CrossRef]
  7. The European Dairy Association (EDA). Product Environmental Footprint Category Rules for Dairy Products; EDA: Brussel, Belgium, 2018. [Google Scholar]
  8. Stasinakis, A.S.; Charalambous, P.; Vyrides, I. Dairy Wastewater Management in EU: Produced Amounts, Existing Legislation, Applied Treatment Processes and Future Challenges. J. Environ. Manag. 2022, 303, 114152. [Google Scholar] [CrossRef]
  9. Vasina, A.I.; Basamykina, A.N. Local Wastewater Treatment Plant for Dairy Production: Challenges and Solutions. IOP Conf. Ser. Earth Environ. Sci. 2022, 988, 032077. [Google Scholar] [CrossRef]
  10. Bhuvaneshwari, S.; Majeed, F.; Jose, E.; Mohan, A. Different Treatment Methodologies and Reactors Employed for Dairy Effluent Treatment—A Review. J. Water Process Eng. 2022, 46, 102622. [Google Scholar] [CrossRef]
  11. Sathya, K.; Nagarajan, K.; Carlin Geor Malar, G.; Rajalakshmi, S.; Raja Lakshmi, P. A Comprehensive Review on Comparison among Effluent Treatment Methods and Modern Methods of Treatment of Industrial Wastewater Effluent from Different Sources. Appl. Water Sci. 2022, 12, 70. [Google Scholar] [CrossRef]
  12. Kaur, N. Different Treatment Techniques of Dairy Wastewater. Groundw. Sustain. Dev. 2021, 14, 100640. [Google Scholar] [CrossRef]
  13. Sinha, S.; Srivastava, A.; Mehrotra, T.; Singh, R. A Review on the Dairy Industry Waste Water Characteristics, Its Impact on Environment and Treatment Possibilities. Emerg. Issues Ecol. Environ. Sci. 2019, 73–84. [Google Scholar] [CrossRef]
  14. Ashraf, A.; Ramamurthy, R.; Rene, E.R. Wastewater Treatment and Resource Recovery Technologies in the Brewery Industry: Current Trends and Emerging Practices. Sustain. Energy Technol. Assess. 2021, 47, 101432. [Google Scholar] [CrossRef]
  15. Aziz, A.; Basheer, F.; Sengar, A.; Irfanullah; Khan, S.U.; Farooqi, I.H. Biological Wastewater Treatment (Anaerobic-Aerobic) Technologies for Safe Discharge of Treated Slaughterhouse and Meat Processing Wastewater. Sci. Total Environ. 2019, 686, 681–708. [Google Scholar] [CrossRef] [PubMed]
  16. Kong, Z.; Wu, J.; Rong, C.; Wang, T.; Li, L.; Luo, Z.; Ji, J.; Hanaoka, T.; Sakemi, S.; Ito, M.; et al. Large Pilot-Scale Submerged Anaerobic Membrane Bioreactor for the Treatment of Municipal Wastewater and Biogas Production at 25 °C. Bioresour. Technol. 2021, 319, 124123. [Google Scholar] [CrossRef] [PubMed]
  17. Zhang, M.; Leung, K.T.; Lin, H.; Liao, B. Effects of Solids Retention Time on the Biological Performance of a Novel Microalgal-Bacterial Membrane Photobioreactor for Industrial Wastewater Treatment. J. Environ. Chem. Eng. 2021, 9, 105500. [Google Scholar] [CrossRef]
  18. Preisner, M.; Neverova-Dziopak, E.; Kowalewski, Z. Analysis of Eutrophication Potential of Municipal Wastewater. Water Sci. Technol. 2020, 81, 1994–2003. [Google Scholar] [CrossRef] [PubMed]
  19. Dębowski, M.; Zieliński, M. Technological Effectiveness of Sugar-Industry Effluent Methane Fermentation in a Fluidized Active Filling Reactor (FAF-R). Energies 2020, 13, 6626. [Google Scholar] [CrossRef]
  20. Del’Duca, A.; Cesar, D.E.; Diniz, C.G.; Abreu, P.C. Evaluation of the Presence and Efficiency of Potential Probiotic Bacteria in the Gut of Tilapia (Oreochromis niloticus) Using the Fluorescent In Situ Hybridization Technique. Aquaculture 2013, 388–391, 115–121. [Google Scholar] [CrossRef]
  21. Ji, S.; Ma, W.; Wei, Q.; Zhang, W.; Jiang, F.; Chen, J. Integrated ABR and UASB System for Dairy Wastewater Treatment: Engineering Design and Practice. Sci. Total Environ. 2020, 749, 142267. [Google Scholar] [CrossRef]
  22. Mendez, R.; Blazquez, R.; Lorenzo, F.; Lema, J.M. Anaerobic Treatment of Cheese Whey: Start-up and Operation. Water Sci. Technol. 1989, 21, 1857–1860. [Google Scholar] [CrossRef]
  23. Arnaiz, C.; Buffiere, P.; Elmaleh, S.; Lebrato, J.; Moletta, R. Anaerobic Digestion of Dairy Wastewater by Inverse Fluidization: The Inverse Fluidized Bed and the Inverse Turbulent Bed Reactors. Environ. Technol. 2008, 24, 1431–1443. [Google Scholar] [CrossRef]
  24. Bella, K.; Rao, P.V. Anaerobic Digestion of Dairy Wastewater: Effect of Different Parameters and Co-Digestion Options—A Review. Biomass Convers. Biorefin. 2021, 2021, 1–26. [Google Scholar] [CrossRef]
  25. Purushothaman, K.; Jena, H.M. Biological Treatment of Synthetic Dairy Wastewater in FBBR. J. Indian Chem. Soc. 2020, 97, 2847–2853. [Google Scholar]
  26. Suksomboon, R.; Junsiri, C.; Tangjitjaroenkit, S.; El-Moselhy, M.M.; Padungthon, S. Mathematical Models of a Fluidized Bed Bioreactor Using Granular Activated Carbon (FBBR-GAC) for Wastewater Treatment. Eng. Appl. Sci. Res. 2019, 46, 183–191. [Google Scholar]
  27. Kundu, K.; Bergmann, I.; Hahnke, S.; Klocke, M.; Sharma, S.; Sreekrishnan, T.R. Carbon Source—A Strong Determinant of Microbial Community Structure and Performance of an Anaerobic Reactor. J. Biotechnol. 2013, 168, 616–624. [Google Scholar] [CrossRef] [PubMed]
  28. Debowski, M.; Zielinski, M.; Kisielewska, M.; Kazimierowicz, J. Evaluation of Anaerobic Digestion of Dairy Wastewater in an Innovative Multi-Section Horizontal Flow Reactor. Energies 2020, 13, 2392. [Google Scholar] [CrossRef]
  29. Dębowski, M.; Zieliński, M.; Kazimierowicz, J. Anaerobic Reactor Filling for Phosphorus Removal by Metal Dissolution Method. Materials 2022, 15, 2263. [Google Scholar] [CrossRef]
  30. Puñal, A.; Méndez-Pampín, R.J.; Lema, J.M. Characterization and Comparison of Biomasses from Single- and Multi-Fed Upflow Anaerobic Filters. Bioresour. Technol. 1999, 68, 293–300. [Google Scholar] [CrossRef]
  31. Ratusznei, S.M.; Rodrigues, J.A.D.; Zaiat, M. Operating Feasibility of Anaerobic Whey Treatment in a Stirred Sequencing Batch Reactor Containing Immobilized Biomass. Water Sci. Technol. 2003, 48, 179–186. [Google Scholar] [CrossRef]
  32. Najafpour, G.; Najafpour, G.D.; Hashemiyeh, B.A.; Asadi, M.; Ghasemi, M.B. Biological Treatment of Dairy Wastewater in an Upflow Anaerobic Sludge-Fixed Film Bioreactor. J. Agric. Environ. Sci. 2008, 4, 251–257. [Google Scholar]
  33. Dębowski, M.; Zieliński, M.; Kisielewska, M.; Krzemieniewski, M.; Makowska, M.; Grądkowski, M.; Tor-Świątek, A. Simulated Dairy Wastewater Treatment in a Pilot Plant Scale Magneto-Active Hybrid Anaerobic Biofilm Reactor (Ma-Habr). Braz. J. Chem. Eng. 2018, 35, 553–562. [Google Scholar] [CrossRef] [Green Version]
  34. Kisielewska, M.; Dȩbowski, M.; Zieliński, M.; Krzemieniewski, M. Enhancement of Dairy Wastewater Treatment in a Combined Anaerobic Baffled and Biofilm Reactor with Magneto-Active Packing Media. J. Ecol. Eng. 2018, 19, 165–171. [Google Scholar] [CrossRef]
  35. Zieliński, M.; Dębowski, M.; Kazimierowicz, J. Microwave Radiation Influence on Dairy Waste Anaerobic Digestion in a Multi-Section Hybrid Anaerobic Reactor (M-SHAR). Processes 2021, 9, 1772. [Google Scholar] [CrossRef]
  36. Ma, H.; Guo, Y.; Qin, Y.; Li, Y.Y. Nutrient Recovery Technologies Integrated with Energy Recovery by Waste Biomass Anaerobic Digestion. Bioresour. Technol. 2018, 269, 520–531. [Google Scholar] [CrossRef]
  37. Zhao, S.; Li, P.; Fang, H.; Song, L.; Li, D.; Liu, R.; Niu, Q. Enhancement Methane Fermentation of Enteromorpha Prolifera Waste by Saccharomyces Cerevisiae: Batch Kinetic Investigation, Dissolved Organic Matter Characterization, and Synergistic Mechanism. Environ. Sci. Pollut. Res. 2020, 27, 16254–16267. [Google Scholar] [CrossRef] [PubMed]
  38. Szwarc, K.; Szwarc, D.; Zieliński, M. Removal of Biogenic Compounds from the Post-Fermentation Effluent in a Culture of Chlorella Vulgaris. Environ. Sci. Pollut. Res. 2020, 27, 111–117. [Google Scholar] [CrossRef] [Green Version]
  39. Lee, H.S.; Tang, Y.; Rittmann, B.E.; Zhao, H.P. Anaerobic Oxidation of Methane Coupled to Denitrification: Fundamentals, Challenges, and Potential. Crit. Rev. Environ. Sci. Technol. 2018, 48, 1067–1093. [Google Scholar] [CrossRef]
  40. Tang, J.; Wang, X.C.; Hu, Y.; Pu, Y.; Huang, J.; Ngo, H.H.; Zeng, Y.; Li, Y. Nutrients Removal Performance and Sludge Properties Using Anaerobic Fermentation Slurry from Food Waste as an External Carbon Source for Wastewater Treatment. Bioresour. Technol. 2019, 271, 125–135. [Google Scholar] [CrossRef]
  41. Ai, S.; Liu, H.; Wu, M.; Zeng, G.; Yang, C. Roles of Acid-Producing Bacteria in Anaerobic Digestion of Waste Activated Sludge. Front. Environ. Sci. Eng. 2018, 12, 3. [Google Scholar] [CrossRef]
  42. Toyama, T.; Hanaoka, T.; Tanaka, Y.; Morikawa, M.; Mori, K. Comprehensive Evaluation of Nitrogen Removal Rate and Biomass, Ethanol, and Methane Production Yields by Combination of Four Major Duckweeds and Three Types of Wastewater Effluent. Bioresour. Technol. 2018, 250, 464–473. [Google Scholar] [CrossRef]
  43. Lin, R.; Cheng, J.; Yang, Z.; Ding, L.; Zhang, J.; Zhou, J.; Cen, K. Enhanced Energy Recovery from Cassava Ethanol Wastewater through Sequential Dark Hydrogen, Photo Hydrogen and Methane Fermentation Combined with Ammonium Removal. Bioresour. Technol. 2016, 214, 686–691. [Google Scholar] [CrossRef]
  44. Lu, Y.; Li, X.; Chen, Y.; Wang, Y.; Zhu, G.; Zeng, R.J. The Indispensable Role of Assimilation in Methane Driven Nitrate Removal. Sci. Total Environ. 2020, 746, 141089. [Google Scholar] [CrossRef] [PubMed]
  45. Liu, X.; Yang, H.; Chang, J.; Bai, Y.; Shi, L.; Su, B.; Han, J.; Liang, D. Re-Hydrolysis Characteristics of Alkaline Fermentation Liquid from Waste Activated Sludge: Feasibility as a Carbon Source for Nitrogen Removal. Process Saf. Environ. Prot. 2022, 165, 230–240. [Google Scholar] [CrossRef]
  46. Kisielewska, M.; Zielinski, M.; Debowski, M.; Kazimierowicz, J.; Romanowska-Duda, Z.; Dudek, M. Effectiveness of Scenedesmus sp. Biomass Grow and Nutrients Removal from Liquid Phase of Digestates. Energies 2020, 13, 1432. [Google Scholar] [CrossRef]
  47. Cristina, G.; Camelin, E.; Garofalo, S.F.; Salomone, F.; Pugliese, M.; Gullino, M.L.; Tommasi, T.; Fino, D. Time-Based Evaluation of Bioavailable Phosphorus in a Calcareous Soil after the Application of Anaerobically Digested Sewage Sludge. Biomass Convers. Biorefin. 2022, 1, 4361–4373. [Google Scholar] [CrossRef]
  48. Zhen, X.; Luo, M.; Li, Z.; Lin, Z.; Zhang, Y.; Feng, L.; Kang, J. The Sustainable Utilization of Anaerobic Digestion Effluents Treating in Suspended Filler Algae Assisted Systems. Sustain. Energy Technol. Assess. 2022, 53, 102354. [Google Scholar] [CrossRef]
  49. Li, L.; Pang, H.; He, J.; Zhang, J. Characterization of Phosphorus Species Distribution in Waste Activated Sludge after Anaerobic Digestion and Chemical Precipitation with Fe3+ and Mg2+. Chem. Eng. J. 2019, 373, 1279–1285. [Google Scholar] [CrossRef]
  50. Chuda, A.; Ziemiński, K. Challenges in Treatment of Digestate Liquid Fraction from Biogas Plant. Performance of Nitrogen Removal and Microbial Activity in Activated Sludge Process. Energies 2021, 14, 7321. [Google Scholar] [CrossRef]
  51. Akhiar, A.; Guilayn, F.; Torrijos, M.; Battimelli, A.; Shamsuddin, A.H.; Carrère, H. Correlations between the Composition of Liquid Fraction of Full-Scale Digestates and Process Conditions. Energies 2021, 14, 971. [Google Scholar] [CrossRef]
  52. Vaneeckhaute, C.; Lebuf, V.; Michels, E.; Belia, E.; Vanrolleghem, P.A.; Tack, F.M.G.; Meers, E. Nutrient Recovery from Digestate: Systematic Technology Review and Product Classification. Waste Biomass Valoriz. 2017, 8, 21–40. [Google Scholar] [CrossRef] [Green Version]
  53. von Sperling, M.; Almeida, P.G.S.; Bressani-Ribeiro, T.; Chernicharo, C.A.L. Post-Treatment of Anaerobic Effluents. In Anaerobic Reactors for Sewage Treatment: Design, Construction and Operation; IWA Publishing: London, UK, 2019; pp. 275–338. [Google Scholar] [CrossRef]
  54. Zielińska, M.; Zieliński, M.; Dębowski, M. Organic Compounds and Phosphorus Removal from Dairy Wastewater by Biofilm on Iron-Containing Supports. J. Environ. Eng. 2017, 144, 04017087. [Google Scholar] [CrossRef]
  55. Zieliński, M.; Dębowski, M.; Krzemieniewski, M.; Brudniak, A.; Kisielewska, M. Possibility of Improving Technological Effectiveness of Dairy Wastewater Treatment through Application of Active Fillings and Microwave Radiation. J. Water Chem. Technol. 2016, 38, 618–627. [Google Scholar] [CrossRef]
  56. You, G.; Wang, C.; Hou, J.; Wang, P.; Xu, Y.; Miao, L.; Liu, J. Effects of Zero Valent Iron on Nitrate Removal in Anaerobic Bioreactor with Various Carbon-to-Nitrate Ratios: Bio-Electrochemical Properties, Energy Regulation Strategies and Biological Response Mechanisms. Chem. Eng. J. 2021, 419, 129646. [Google Scholar] [CrossRef]
  57. Bhuvaneswari, A.; Asha, B. Influence of pH in an Anaerobic Baffled Reactor for Treating Real Textile Dye Wastewater. Turk. J. Comput. Math. Educ. 2021, 12, 4972–4977. [Google Scholar]
  58. Wang, X.; Li, Y.; Zhang, Y.; Pan, Y.R.; Li, L.; Liu, J.; Butler, D. Stepwise pH Control to Promote Synergy of Chemical and Biological Processes for Augmenting Short-Chain Fatty Acid Production from Anaerobic Sludge Fermentation. Water Res. 2019, 155, 193–203. [Google Scholar] [CrossRef] [PubMed] [Green Version]
  59. Sarkar, O.; Rova, U.; Christakopoulos, P.; Matsakas, L. Influence of Initial Uncontrolled pH on Acidogenic Fermentation of Brewery Spent Grains to Biohydrogen and Volatile Fatty Acids Production: Optimization and Scale-Up. Bioresour. Technol. 2021, 319, 124233. [Google Scholar] [CrossRef] [PubMed]
  60. Vázquez-Fernández, A.; Suárez-Ojeda, M.E.; Carrera, J. Review about Bioproduction of Volatile Fatty Acids from Wastes and Wastewaters: Influence of Operating Conditions and Organic Composition of the Substrate. J. Environ. Chem. Eng. 2022, 10, 107917. [Google Scholar] [CrossRef]
  61. Nelabhotla, A.B.T.; Dinamarca, C. Bioelectrochemical CO2 Reduction to Methane: MES Integration in Biogas Production Processes. Appl. Sci. 2019, 9, 1056. [Google Scholar] [CrossRef] [Green Version]
  62. Cheng, H.; Hiro, Y.; Hojo, T.; Li, Y.Y. Upgrading Methane Fermentation of Food Waste by Using a Hollow Fiber Type Anaerobic Membrane Bioreactor. Bioresour. Technol. 2018, 267, 386–394. [Google Scholar] [CrossRef]
  63. Sánchez, E.; Borja, R.; Travieso, L.; Martín, A.; Colmenarejo, M.F. Effect of Organic Loading Rate on the Stability, Operational Parameters and Performance of a Secondary Upflow Anaerobic Sludge Bed Reactor Treating Piggery Waste. Bioresour. Technol. 2005, 96, 335–344. [Google Scholar] [CrossRef]
  64. Boonapatcharoen, N.; Meepian, K.; Chaiprasert, P.; Techkarnjanaruk, S. Molecular Monitoring of Microbial Population Dynamics during Operational Periods of Anaerobic Hybrid Reactor Treating Cassava Starch Wastewater. Microb. Ecol. 2007, 54, 21–30. [Google Scholar] [CrossRef]
  65. Jiao, C.; Hu, Y.; Zhang, X.; Jing, R.; Zeng, T.; Chen, R.; Li, Y.-Y. Process Characteristics and Energy Self-Sufficient Operation of a Low-Fouling Anaerobic Dynamic Membrane Bioreactor for up-Concentrated Municipal Wastewater Treatment. Sci. Total Environ. 2022, 843, 156992. [Google Scholar] [CrossRef] [PubMed]
Figure 1. Light expanded clay aggregate used as anaerobic reactor filling in the experimental variant 1 ((a) general view of the grains; (b) LECA in the digester).
Materials 15 07815 g001
Figure 2. Waste material used to produce the LCF ((a) particle size and structure; (b) transport and storage container).
Materials 15 07815 g002
Figure 3. Step-by-step preparation of material for the active filling.
Materials 15 07815 g003
Figure 4. LCRF elements ((a) a single LCRF piece with visible porosity; (b) extruded filling; (c) LCRF in the anaerobic reactor).
Materials 15 07815 g004
Figure 5. Anaerobic Reactor Station ((a) retention basin with influent pumping system; (b) anaerobic reactors).
Materials 15 07815 g005
Figure 6. COD removal ((a) changes throughout the experiment; (b) average across experimental variants).
Materials 15 07815 g006
Figure 7. COD in the treated effluent ((a) throughout the experiment; (b) average across experimental variants).
Materials 15 07815 g007
Figure 8. COD removed ((a) throughout the experiment; (b) average across experimental variants).
Materials 15 07815 g008
Figure 9. Ntot. removal ((a) changes throughout the experiment; (b) average across experimental variants).
Materials 15 07815 g009
Figure 10. Ntot. in the treated effluent ((a) throughout the experiment; (b) average across experimental variants).
Materials 15 07815 g010
Figure 11. Ptot. removal ((a) changes throughout the experiment; (b) average across experimental variants).
Materials 15 07815 g011
Figure 12. Ptot. in the treated effluent ((a) throughout the experiment; (b) average across experimental variants).
Materials 15 07815 g012
Figure 13. pH in the anaerobic reactors ((a) changes throughout the experiment; (b) average across experimental variants).
Materials 15 07815 g013
Figure 14. Biogas production ((a) changes throughout the experiment; (b) average across experimental variants).
Materials 15 07815 g014
Figure 15. Specific biogas production ((a) changes throughout the experiment; (b) average specific across experimental variants).
Materials 15 07815 g015
Figure 16. CH4 content ((a) changes throughout the experiment; (b) average across experimental variants).
Materials 15 07815 g016
Figure 17. CH4 yields ((a) daily throughout the experiment; (b) average daily across experimental variants).
Materials 15 07815 g017
Table 1. Profile of the raw influent fed into the anaerobic reactors.
ParameterUnitMean Value
COD[mg O2/dm3]6020 ± 595
BOD5[mg O2/dm3]5317 ± 455
Total P[mg P/dm3]138.2 ± 35.1
Total N[mg N/dm3]242.9 ± 51.4
TSS[mg/dm3]512 ± 94
pH-7.75 ± 0.62
Table 2. Characteristics of the anaerobic sludge inoculum used in the study.
ParameterUnitValue
Water content(%)98.8 ± 0.2
Total solids(g/dm3)29.8 ± 1.7
Mineral solids(g/dm3)8.6 ± 0.4
Volatile solids(g/dm3)21.2 ± 0.6
Filtrate COD(mgO2/dm3)630 ± 27.0
Total P in filtrate(mgTP/dm3)51.0 ± 7.2
Total N in filtrate(mgTN/dm3)89.2 ± 10.1
pH-7.27 ± 0.12
Table 3. Composition of the microbial community in the digesters across experimental variants.
Consortium [%]Series 1
V1V2V3V4V5
Bacteria (EUB338)69 ± 968 ± 767 ± 1170 ± 774 ± 8
Archaea (ARC915)28 ± 529 ± 729 ± 326 ± 620 ± 3
Methanosarcinaceae (MSMX860)14 ± 215 ± 314 ± 213 ± 210 ± 3
Methanosaeta (MX825)9 ± 29 ± 39 ± 37 ± 26 ± 2
Consortium [%]Series 2
V1V2V3V4V5
Bacteria (EUB338)68 ± 767 ± 466 ± 366 ± 868 ± 5
Archaea (ARC915)27 ± 528 ± 232 ± 633 ± 531 ± 3
Methanosarcinaceae (MSMX860)14 ± 313 ± 517 ± 217 ± 416 ± 4
Methanosaeta (MX825)6 ± 28 ± 311 ± 311 ± 510 ± 2
Table 4. CH4 production efficiency in relation to the COD removed.
SeriesS1
VariantV1V2V3V4V5
CH4 [kg/kg CODrem.]0.113 ± 0.0170.140 ± 0.0100.151 ± 0.0080.134 ± 0.0070.112 ± 0.007
SeriesS2
VariantV1V2V3V4V5
CH4 [kg/kg CODrem.]0.116 ± 0.0210.153 ± 0.0090.168 ± 0.0060.170 ± 0.0080.154 ± 0.005
Publisher’s Note: MDPI stays neutral with regard to jurisdictional claims in published maps and institutional affiliations.

