
Influence of Mixed Na2O/K2O on Chemical Durability and Spectral Properties of P2O5-Al2O3-BaO-K2O-Na2O-Nd2O3 Phosphate Glasses

 ,
,
Abstract
1. Introduction
2. Experiment Details
2.1. Sample Preparation
2.2. Experimental Method
3. Results and Discussion
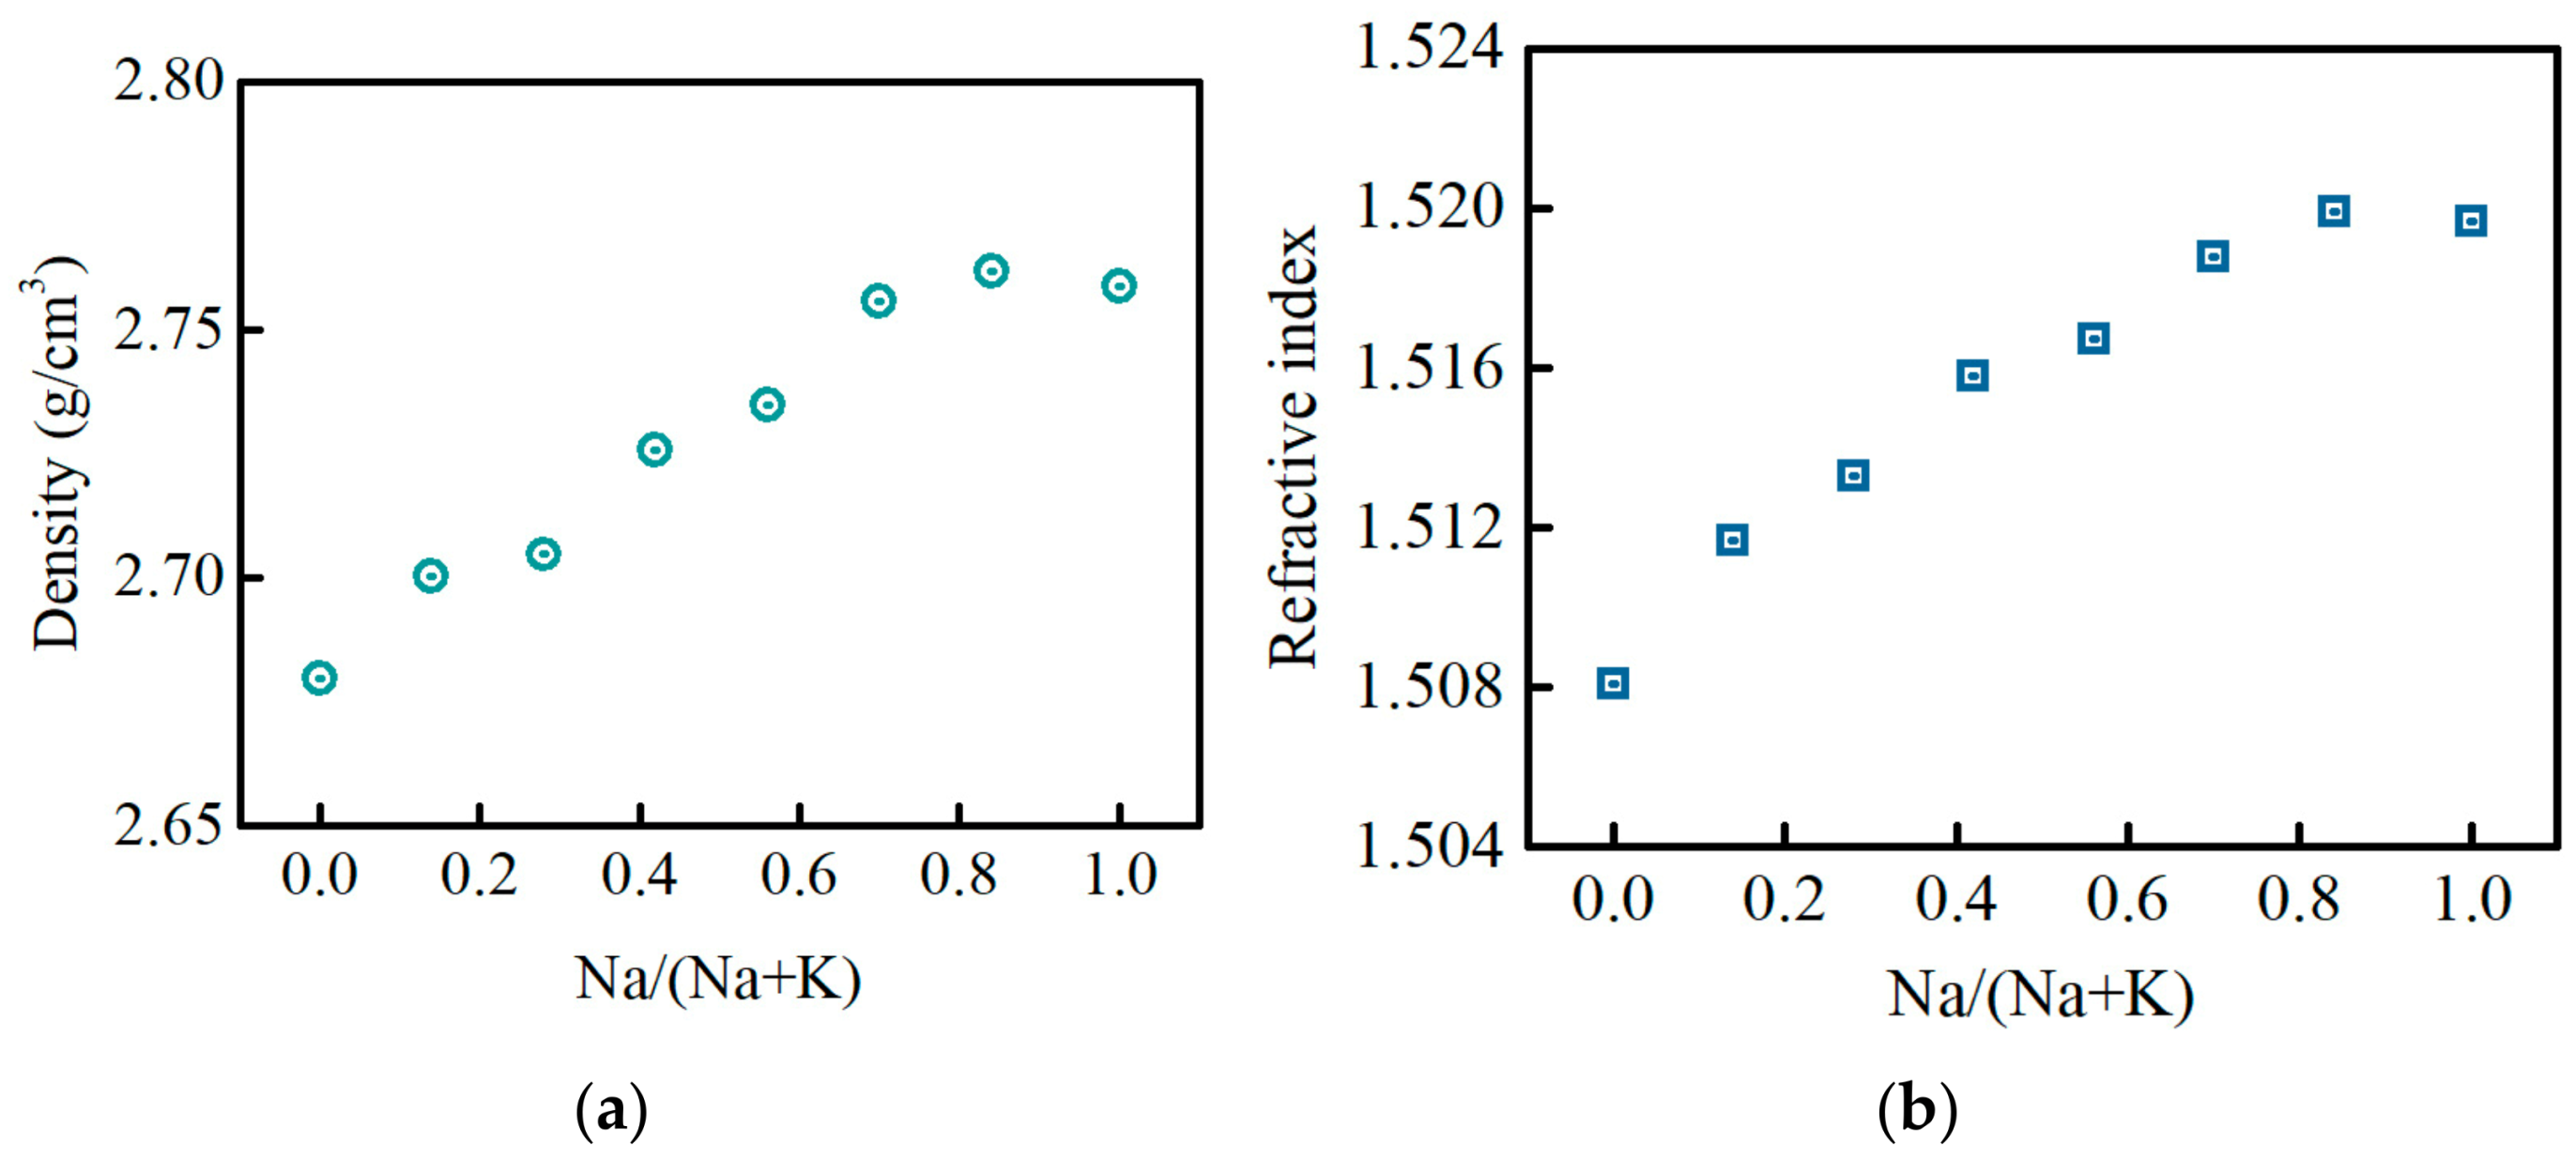
3.1. Density and Refractive Index
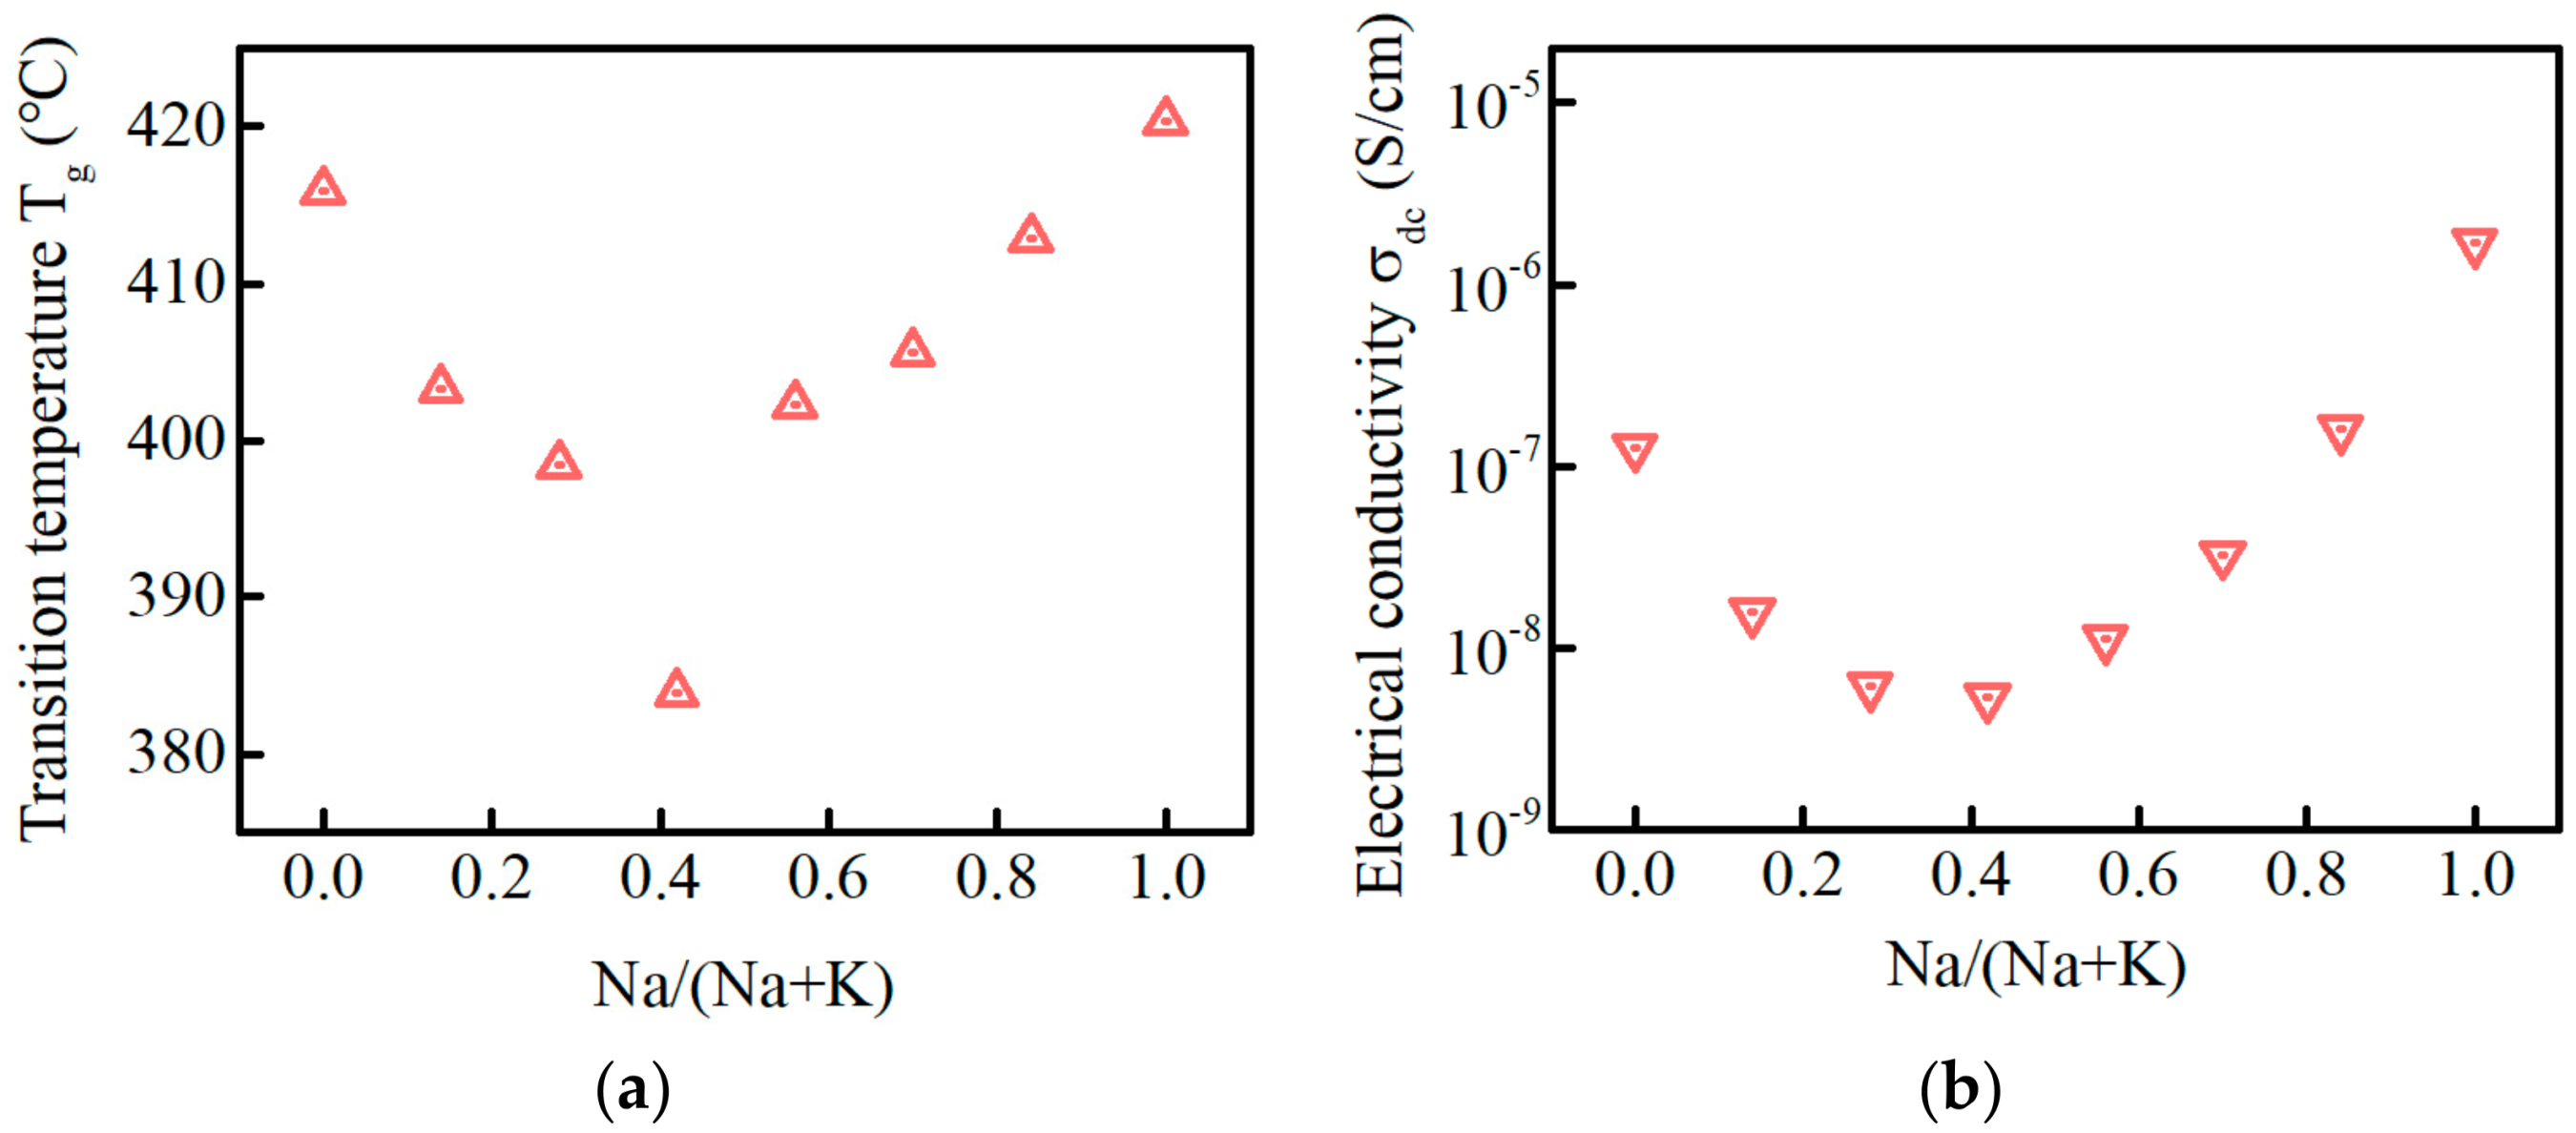
3.2. Glass Transition Temperature and DC Conductivity
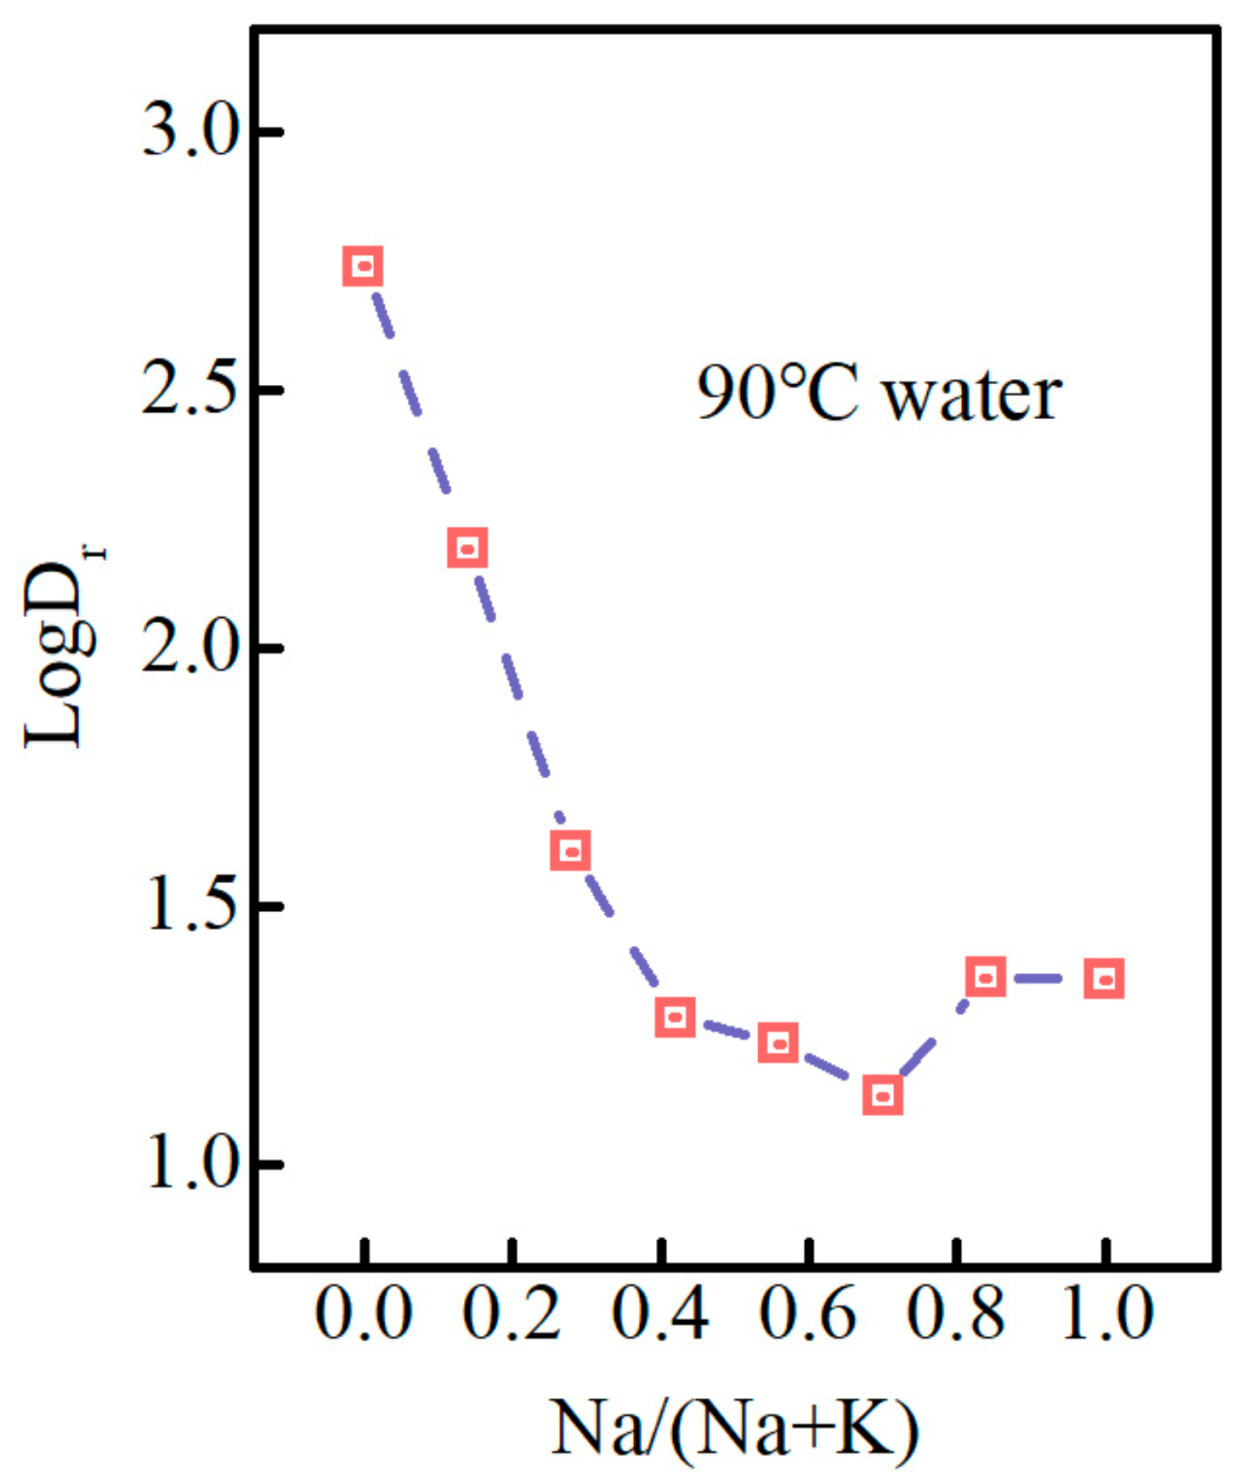
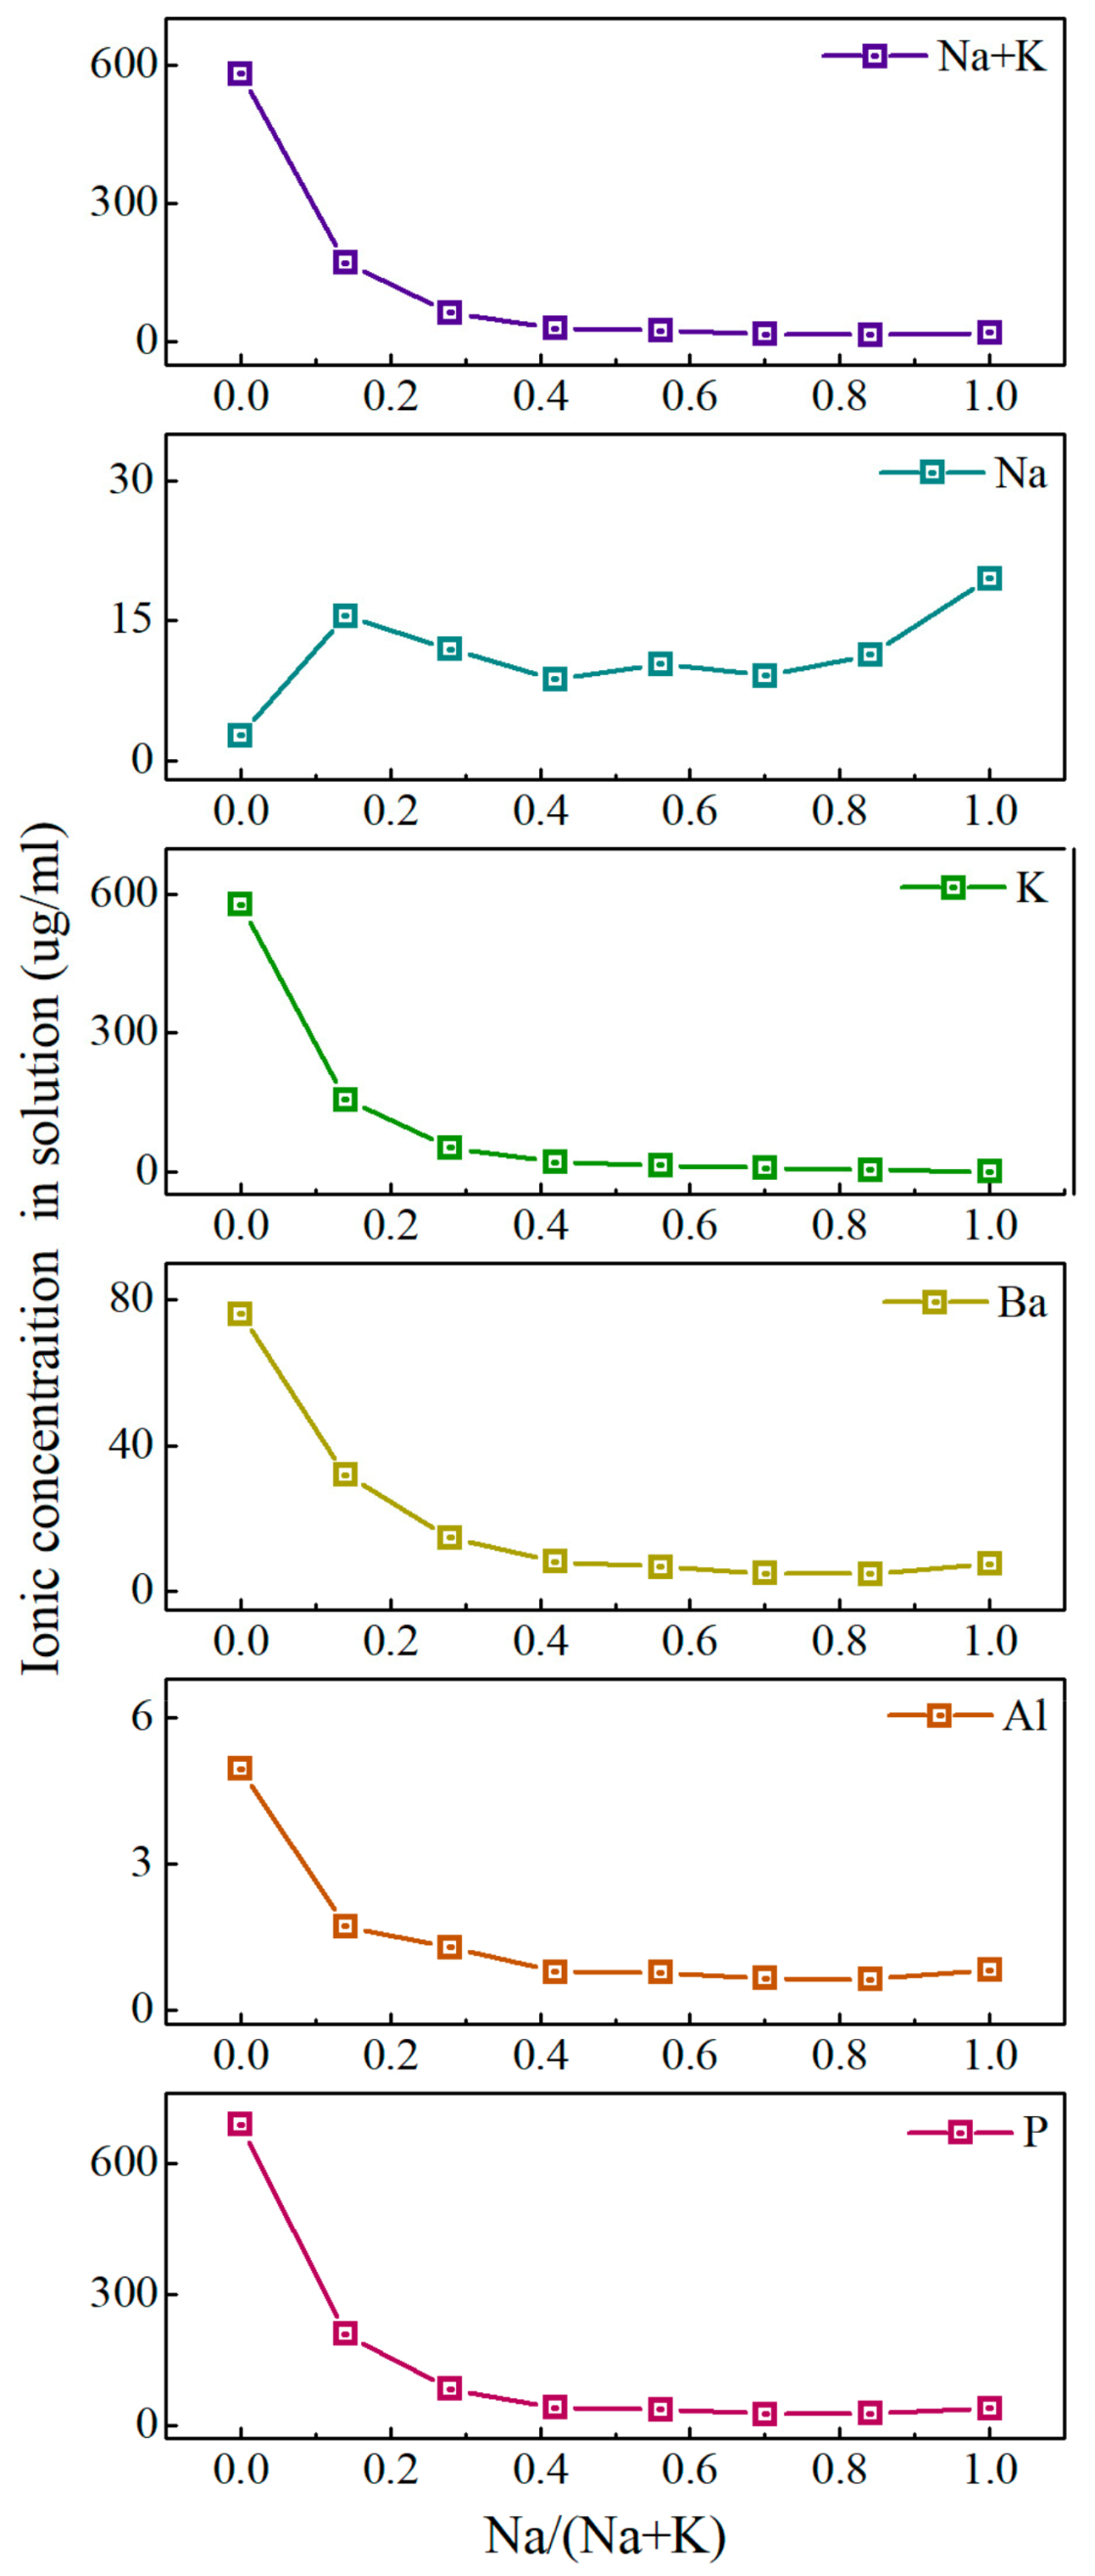
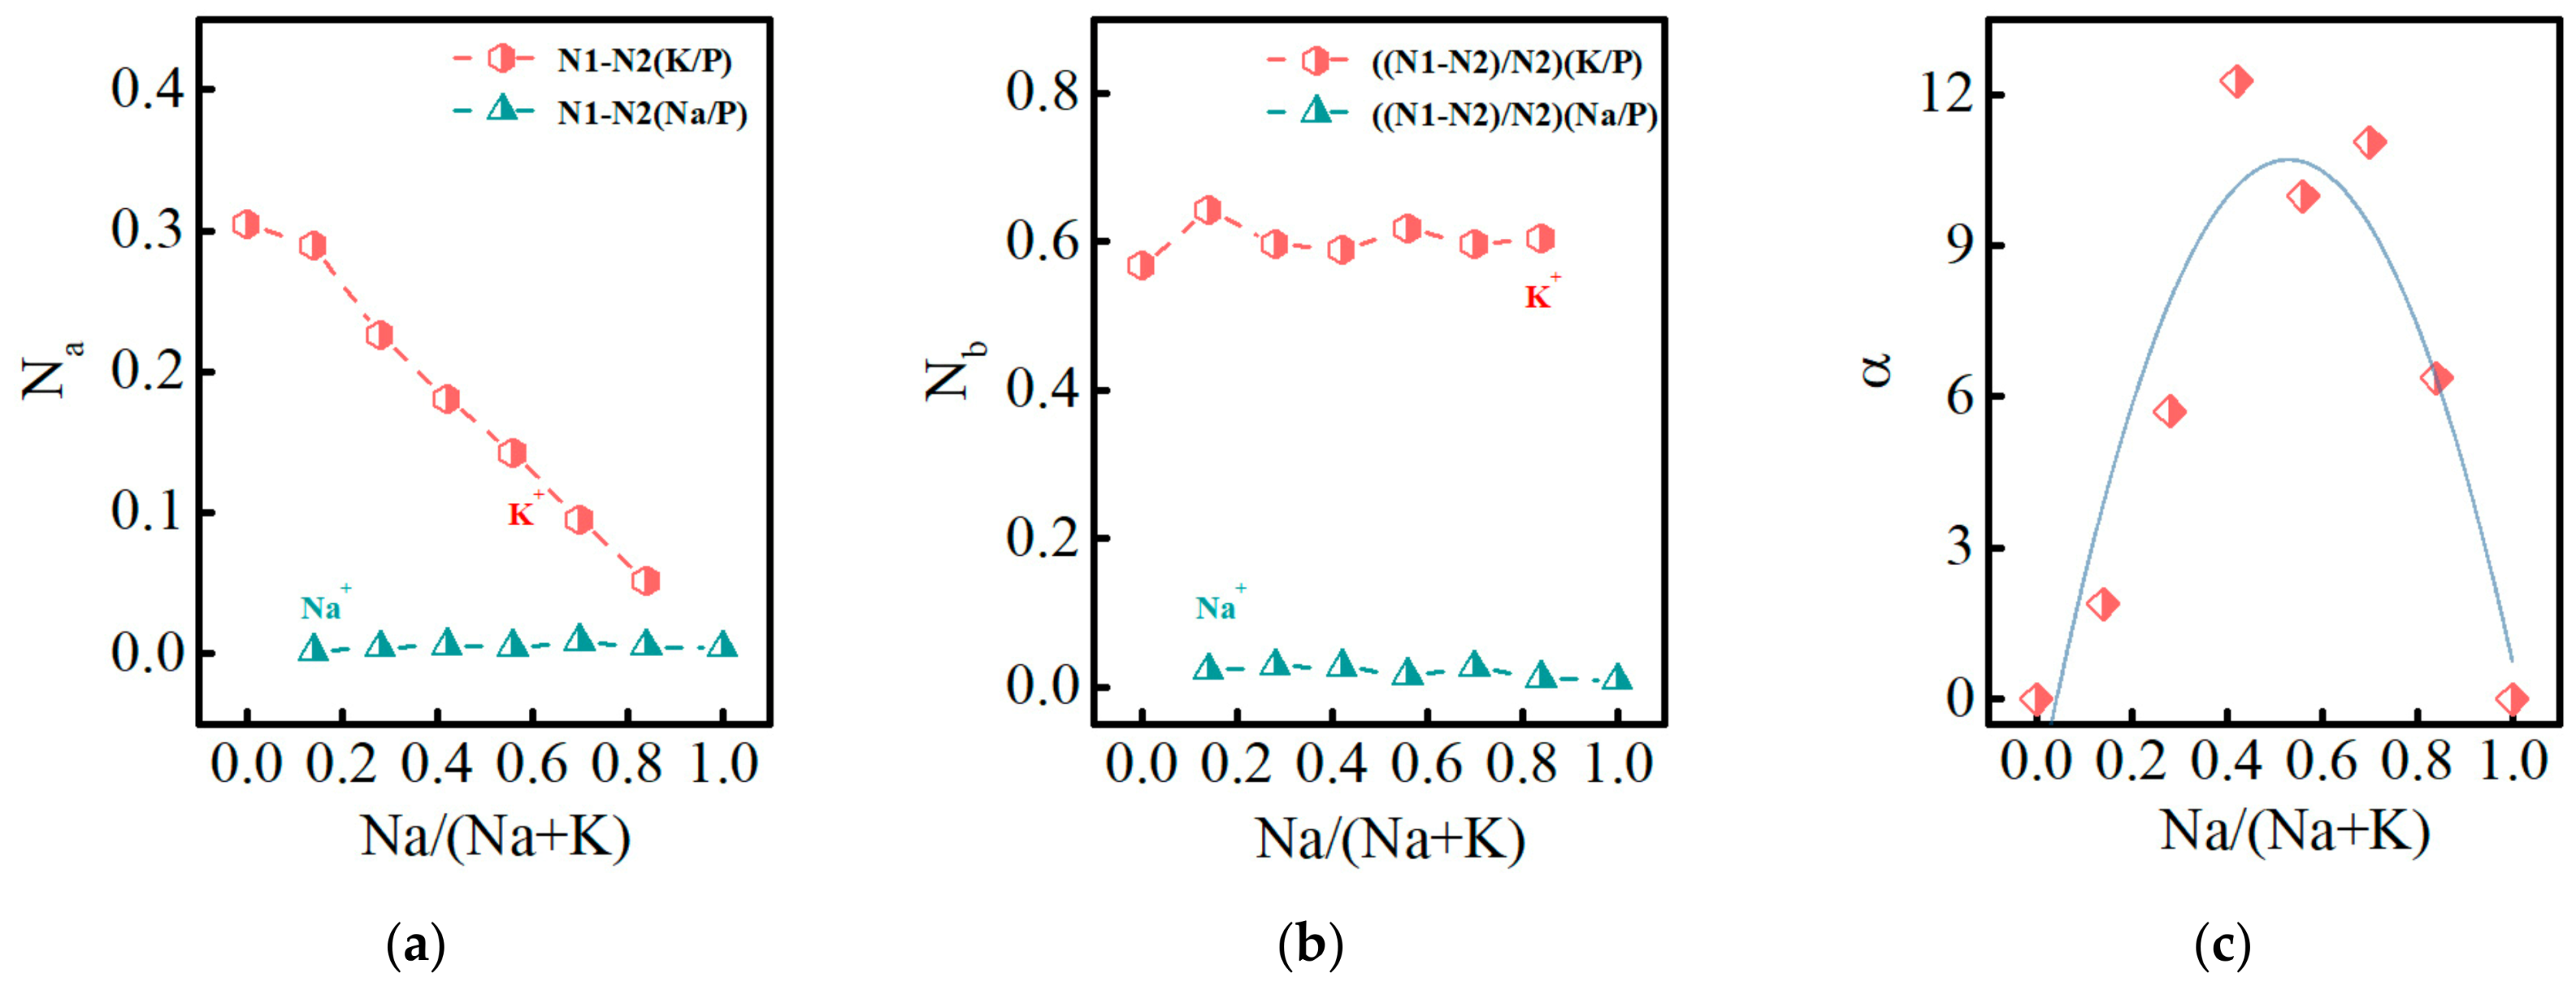
3.3. Glass Dissolution Rate and Ion Release Concentration in Solution
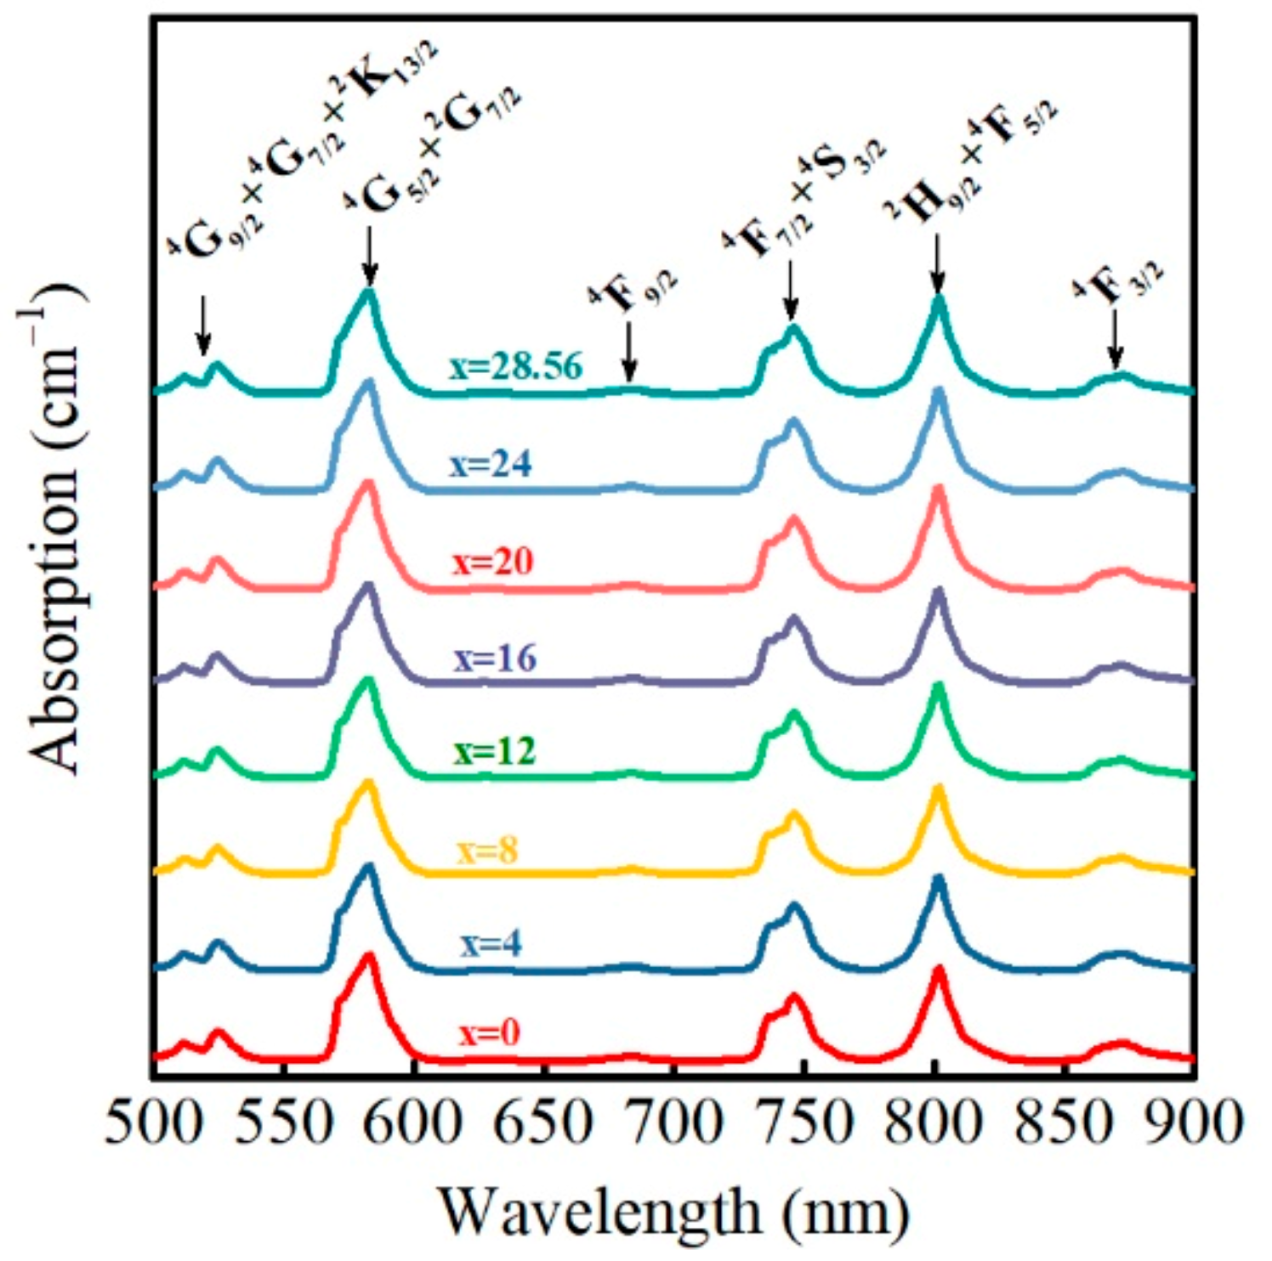
3.4. Absorption Spectrum
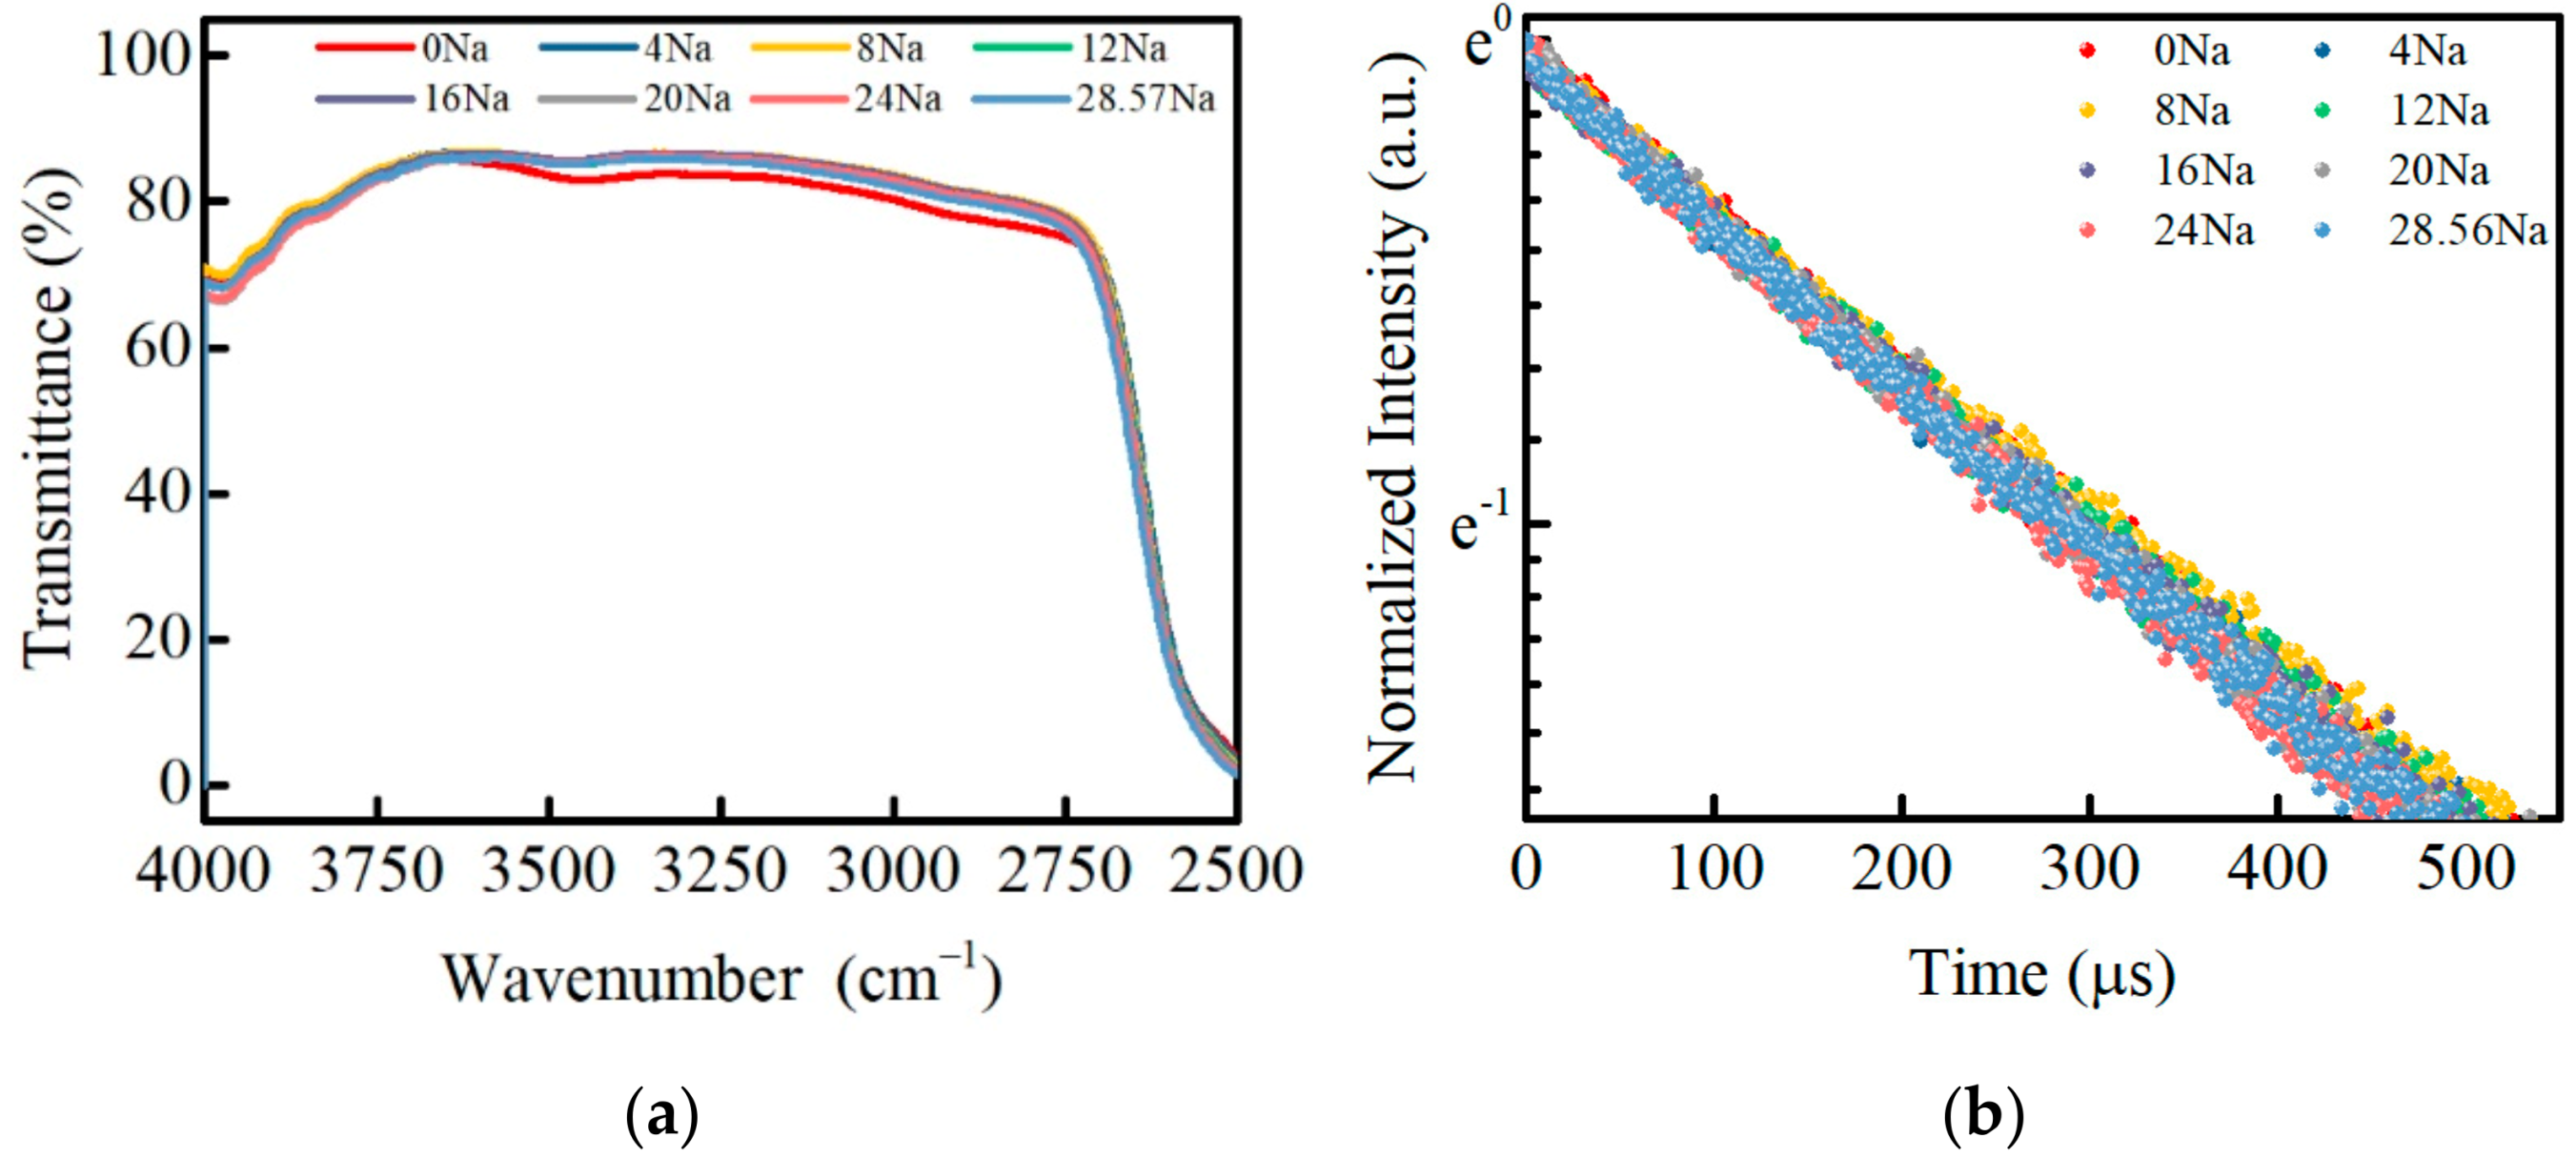
3.5. Infrared Transmittance and Fluorescence Lifetime
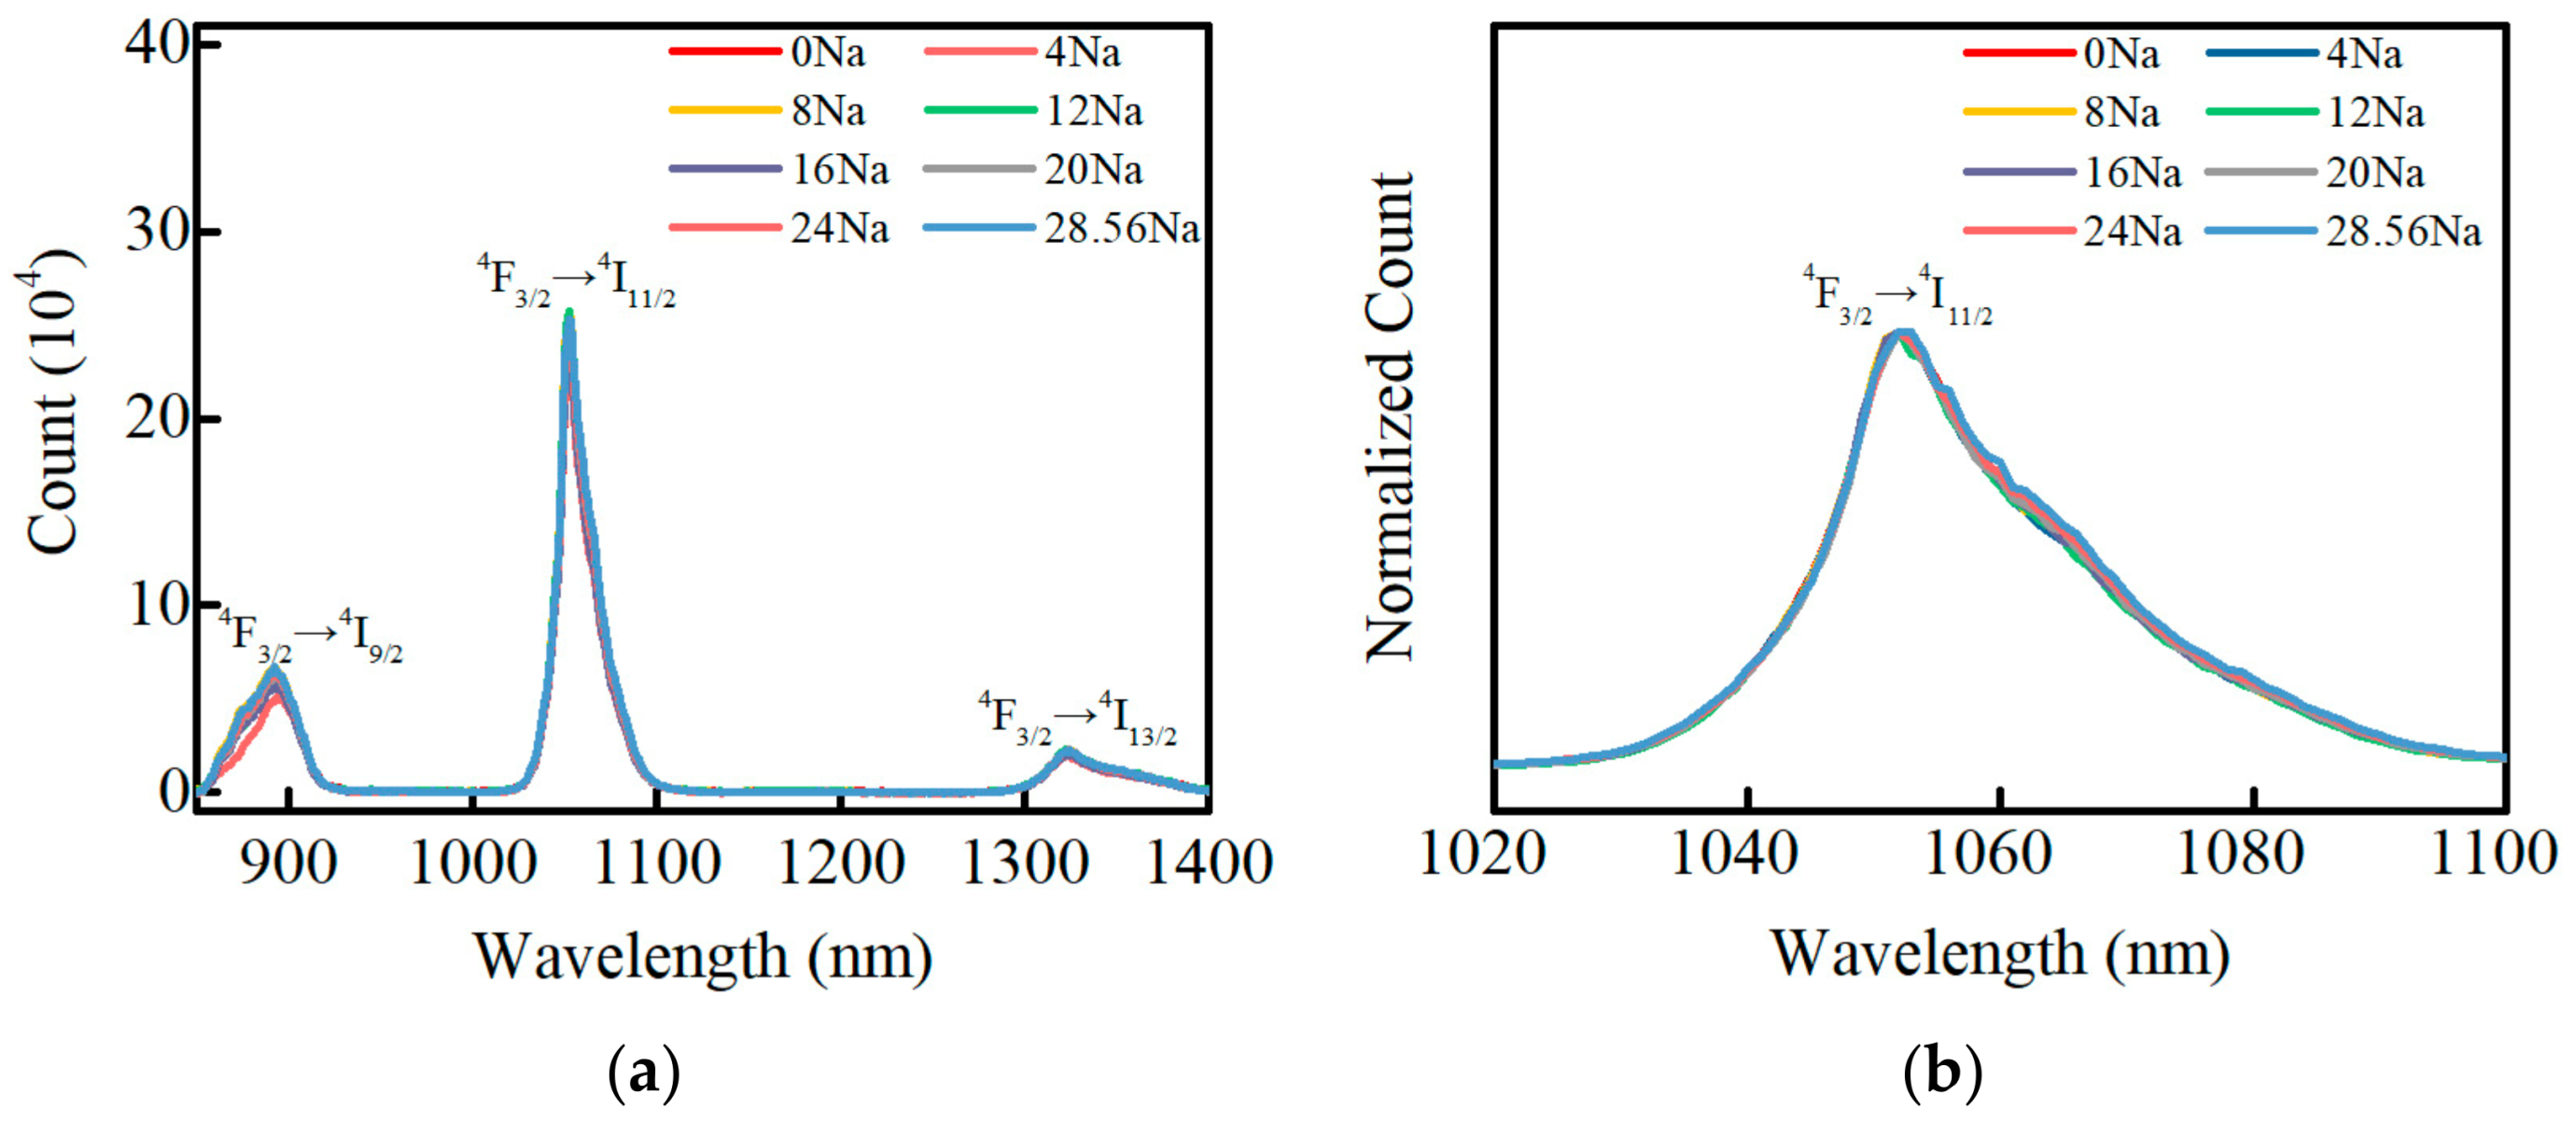
3.6. Fluorescence Properties
3.7. Optimized Matrix Glass When Na/Na+K = 0.7
4. Conclusions
Author Contributions
Funding
Institutional Review Board Statement
Informed Consent Statement
Data Availability Statement
Conflicts of Interest
References
- Lion, C. The LMJ program: An overview. J. Phys. Conf. Ser. 2010, 244, 012003. [Google Scholar] [CrossRef]
- Caird, J.; Agrawal, V.; Bayramian, A.; Beach, R.; Britten, J.; Chen, D.; Cross, R.; Ebbers, C.; Erlandson, A.; Feit, M.; et al. Nd:Glass Laser Design for Laser ICF Fission Energy (LIFE). Fusion. Sci. Technol. 2009, 56, 607–617. [Google Scholar] [CrossRef]
- Campbell, J.; Hawley-Fedder, R.; Stolz, C.; Menapace, J.; Borden, M.; Whitman, P.; Yu, J.; Runkel, M.; Riley, M.; Feit, M.; et al. NIF optical materials and fabrication technologies: An overview. Proc. SPIE 2004, 5341, 84–101. [Google Scholar] [CrossRef]
- Campbell, J.; Suratwala, T.; Thorsness, C.; Hayden, J.; Thorne, A.; Cimino, J.; Marker Iii, A.; Takeuchi, K.; Smolley, M.; Ficini-Dorn, G. Continuous melting of phosphate laser glasses. J. Non.-Cryst. Solids 2000, 263, 342–357. [Google Scholar] [CrossRef]
- Suratwala, T.; Miller, P.; Ehrmann, P.; Steele, R. Polishing slurry induced surface haze on phosphate laser glasses. J. Non.-Cryst. Solids 2005, 351, 2091–2101. [Google Scholar] [CrossRef]
- Chen, H.; Qian, M.; Chen, Y.; Wang, X.; Tang, J.; Wen, L.; Hu, J.; Chen, W.; Chen, S.; Hu, L. Monolithic edge-cladding process for the elliptical disk of N31-type Nd-doped high-power laser glass. High Power Laser Sci. Eng. 2022, 10, E14. [Google Scholar] [CrossRef]
- Hu, L.; He, D.; Chen, H.; Wang, X.; Meng, T.; Wen, L.; Hu, J.; Xu, Y.; Li, S.; Chen, Y.; et al. Research and development of neodymium phosphate laser glass for high power laser application. Opt. Mater 2017, 63, 213–220. [Google Scholar] [CrossRef]
- Campbell, J.H.; Suratwala, T.I. Nd-doped phosphate glasses for high-energy/high-peak-power lasers. J. Non.-Cryst. Solids 2000, 263, 318–341. [Google Scholar] [CrossRef]
- Brow, R.K.; Kirkpatrick, R.J. and Turner, G.L. Local Structure of xAl2O3 (1 −x) NaPO3 Glasses: An NMR and XPS Study. J. Am. Ceram. Soc. 1990, 73, 2293–2300. [Google Scholar] [CrossRef]
- Brow, R.K. Nature of Alumina in Phosphate Glass: I, Properties of Sodium Aluminophosphate Glass. J. Am. Ceram. Soc. 1993, 76, 913–918. [Google Scholar] [CrossRef]
- Damodaran, K.; Delaye, J.-M.; Kalinichev, A.G.; Gin, S. Deciphering the non-linear impact of Al on chemical durability of silicate glass. Acta Mater 2022, 225, 117478. [Google Scholar] [CrossRef]
- Huang, W.; Jiang, J. Synthesis, characterization and optical studies of mixed alkali phosphate glasses containing MnO2. Chin. J. Phys. 2022, 77, 81–91. [Google Scholar] [CrossRef]
- Ahmadi, F.; Hussin, R.; Ghoshal, S.K. Physical and structural properties of dysprosium ion doped phosphate glasses. Optik 2021, 227, 166000. [Google Scholar] [CrossRef]
- Bengisu, M.; Brow, R.K.; Yilmaz, E.; Moguš-Milanković, A.; Reis, S.T. Aluminoborate and aluminoborosilicate glasses with high chemical durability and the effect of P2O5 additions on the properties. J. Non.-Cryst. Solids 2006, 352, 3668–3676. [Google Scholar] [CrossRef]
- Shoaib, M.; Rooh, G.; Chanthima, N.; Sareein, T.; Kim, H.J.; Kothan, S.; Kaewkhao, J. Luminescence behavior of Nd3+ions doped ZnO-BaO-(Gd2O3/GdF3)- P2O5 glasses for laser material applications. J. Lumin. 2021, 236, 118139. [Google Scholar] [CrossRef]
- Song, J.; Wu, D.; Zhang, C.; Ming, Q.; Imanzadeh, M. Investigation of mixed alkali effect on the DC electrical conductivity, structural, and physical properties of phosphate glasses containing MnO2. J. Phys. Chem. Solids 2022, 167, 110759. [Google Scholar] [CrossRef]
- Rathan, S.V.; Murugaraj, R.; Govindaraj, G.; Aravinth, K.; Ramasamy, P. Miniaturization of thermal, glass formation, and electrical properties with contrive scaling in mixed alkali (Li(1-x) Nax)5TiP3O12 (0.0≤x≤1.0) phosphate glasses. J. Non.-Cryst. Solids 2022, 591, 121735. [Google Scholar] [CrossRef]
- Behrends, F.; Eckert, H. Mixed-Alkali Effects in Aluminophosphate Glasses: A Re-examination of the System [xNa2O(1–x)Li2O]0.46[yAl2O3(1–y)P2O5]0.54. J. Phys. Chem. C 2011, 115, 17175–17183. [Google Scholar] [CrossRef]
- Pereira, L.F.P.; Bodiang, K.; Nunes, E.H.M.; Mear, F.O.; Delevoye, L.; Montagne, L. Molybdenum Influence on the Mixed-Alkali Effect of Lithium–Sodium Phosphate Glasses. J. Phys. Chem. C 2018, 122, 15886–15891. [Google Scholar] [CrossRef]
- Swenson, J.; Matic, A.; Brodin, A.; Börjesson, L.; Howells, W.S. Structure of mixed alkali phosphate glasses by neutron diffraction and Raman spectroscopy. Phys. Rev. B 1998, 58, 11331–11337. [Google Scholar] [CrossRef]
- DILMORE, M.F.; CLARK, D.E.; HENCH, L.L. Chemical Durability of Na2O-K2O-CaO-SiO2 Glasses. J. Am. Ceram. Soc. 1978, 61, 439–443. [Google Scholar] [CrossRef]
- Zhifang, W.; Nai, Z.; Bo, M.; Zhongxin, S. Study of the mixed alkali effect on chemical durability of alkali silicate glasses. J. Non.-Cryst. Solids 1986, 84, 468–476. [Google Scholar] [CrossRef]
- Sinton, C.W.; LaCourse, W.C. Experimental survey of the chemical durability of commercial soda-lime-silicate glasses. Mater Res. Bull. 2001, 36, 2471–2479. [Google Scholar] [CrossRef]
- Yang, R.; Wang, Y.; Hao, X.; Zhan, J.; Liu, S. Influence of alkali and alkali-earth metal oxide substitutions on the properties of lithium–iron–phosphate glasses. J. Non.-Cryst. Solids 2011, 357, 2192–2196. [Google Scholar] [CrossRef]
- Fang, X. Properties of mixed Na2O and K2O iron phosphate glasses. J. Non.-Cryst. Solids 2000, 263, 293–298. [Google Scholar] [CrossRef]
- Guo, H.W.; Wang, X.F.; Gong, Y.X.; Gao, D.N. Mixed alkali effect in xK2O-(30−x) Na2O-30P2O5-40ZnO glasses. J. Non.-Cryst. Solids 2010, 356, 2109–2113. [Google Scholar] [CrossRef]
- Es-soufi, H.; Bih, L. Effect of TiO2 on the chemical durability and optical properties of Mo-based phosphate glasses. J. Non.-Cryst. Solids 2021, 558, 120655. [Google Scholar] [CrossRef]
- Li, A.; Hu, Y.; Liu, Z.; Zhang, X.; Deng, W.; Wang, H.; Li, M.; Wang, M. The effect of mixed La-Y doping on water resistance of phosphate glass. J. Non.-Cryst. Solids 2020, 527, 119727. [Google Scholar] [CrossRef]
- Tsuchida, J.E.; Ferri, F.A.; Pizani, P.S.; Martins Rodrigues, A.C.; Kundu, S.; Schneider, J.F.; Zanotto, E.D. Ionic conductivity and mixed-ion effect in mixed alkali metaphosphate glasses. Phys. Chem. Chem. Phys. 2017, 19, 6594–6600. [Google Scholar] [CrossRef]
- Bunde, A.; Ingram, M.D.; Maass, P. The dynamic structure model for ion transport in glasses. J. Non.-Cryst. Solids 1994, 172–174, 1222–1236. [Google Scholar] [CrossRef]
- Lodesani, F.; Menziani, M.C.; Hijiya, H.; Takato, Y.; Urata, S.; Pedone, A. Structural origins of the Mixed Alkali Effect in Alkali Aluminosilicate Glasses: Molecular Dynamics Study and its Assessment. Sci. Rep. 2020, 10, 2906. [Google Scholar] [CrossRef] [PubMed]
- Douglas, R.W.; El-Shamy, T. Reaction of Glass with Aqueous Solutions. J. Am. Ceram. Soc. 1967, 50, 1–8. [Google Scholar] [CrossRef]
- Oey, T.; Frederiksen, K.F.; Mascaraque, N.; Youngman, R.; Balonis, M.; Smedskjaer, M.M.; Bauchy, M.; Sant, G. The role of the network-modifier’s field-strength in the chemical durability of aluminoborate glasses. J. Non.-Cryst. Solids 2019, 505, 279–285. [Google Scholar] [CrossRef]
- SEN, S.; TOOLEY, F.V. Effect of Na2O/K2O Ratio on Chemical Durability of Alkali-Lime-Silica Glasses. J. Am. Ceram. Soc. 1955, 38, 175–177. [Google Scholar] [CrossRef]
- Ratnakaram, Y.C.; Srihari, N.V.; Kumar, A.V.; Naidu, D.T.; Chakradhar, R.P. Optical absorption and photoluminescence properties of Nd3+ doped mixed alkali phosphate glasses-spectroscopic investigations. Spectrochim. Acta A Mol. Biomol. Spectrosc 2009, 72, 171–177. [Google Scholar] [CrossRef]
- Ismail, M.M.; Batisha, I.K.; Zur, L.; Chiasera, A.; Ferrari, M.; Lukowiak, A. Optical properties of Nd3+-doped phosphate glasses. Opt. Mater 2020, 99, 109591. [Google Scholar] [CrossRef]
- Chen, Y.; Lin, Z.; Wang, Y.; Wang, M.; Zhang, L.; Jiao, Y.; Dong, H.; Wang, S.; Yu, C.; Hu, L. Nd3+-doped silica glass and fiber prepared by modified sol-gel method. Chin. Opt. Lett. 2022, 20, 091601. [Google Scholar] [CrossRef]
- Judd, B.R. Optical absorption intensities of rare-earth ions. Phys. Rev. 1962, 127, 750. [Google Scholar] [CrossRef]
- Ofelt, G. Intensities of crystal spectra of rare-earth ions. J. Chem. Phys. 1962, 37, 511–520. [Google Scholar] [CrossRef]
- Takebe, H.; Nageno, Y.; Morinaga, K. Compositional Dependence of Judd-Ofelt Parameters in Silicate, Borate, and Phosphate Glasses. J. Am. Ceram. Soc. 1995, 78, 1161–1168. [Google Scholar] [CrossRef]
- Hehlen, M.P.; Brik, M.G.; Krämer, K.W. 50th anniversary of the Judd–Ofelt theory: An experimentalist’s view of the formalism and its application. J. Lumin. 2013, 136, 221–239. [Google Scholar] [CrossRef]
- Kolobkova, E.; Alkhlef, A.; Dinh, B.M.; Yasukevich, A.S.; Dernovich, O.P.; Kuleshov, N.V.; Nikonorov, N. Spectral properties of Nd3+ ions in the new fluoride glasses with small additives of the phosphates. J. Lumin. 2019, 206, 523–529. [Google Scholar] [CrossRef]
- Marino, A.E.; Arrasmith, S.R.; Gregg, L.L.; Jacobs, S.D.; Chen, G.; Duc, Y. Durable phosphate glasses with lower transition temperatures. J. Non.-Cryst. Solids 2001, 289, 37–41. [Google Scholar] [CrossRef]
- Falcoz, F. Roadmap at Amplitude of 0.1 Hz kJ-class laser for Shock applications. Proc. SPIE 2021, 11666, 116660B. [Google Scholar] [CrossRef]


| Sample | P2O5 | Al2O3 | BaO | K2O | Na2O | Nd2O3 | O/P Ratio |
|---|---|---|---|---|---|---|---|
| PKN0 | 55.03 | 7.60 | 5.82 | 29.54 | 0.3 | 1.69 | 3.07 |
| PKN4 | 55.12 | 8.32 | 5.94 | 24.88 | 4.01 | 1.73 | 3.09 |
| PKN8 | 55.96 | 7.80 | 5.86 | 21.17 | 7.75 | 1.45 | 3.06 |
| PKN12 | 55.82 | 8.06 | 5.88 | 17.16 | 11.51 | 1.57 | 3.07 |
| PKN16 | 55.87 | 8.21 | 5.85 | 12.90 | 15.61 | 1.56 | 3.07 |
| PKN20 | 56.33 | 7.78 | 5.91 | 8.93 | 19.34 | 1.71 | 3.06 |
| PKN24 | 56.63 | 7.43 | 5.97 | 4.80 | 23.52 | 1.62 | 3.04 |
| PKN28.56 | 57.21 | 7.27 | 5.98 | 0.07 | 27.88 | 1.59 | 3.03 |
| Sample | Dissolution Rate Dr (μg·cm−2·h−1) | logDr | P5+ (μg/mL) | Al3+ (μg/mL) | Ba2+ (μg/mL) | K+ (μg/mL) | Na+ (μg/mL) |
|---|---|---|---|---|---|---|---|
| PKN0 | 549.167 | 2.74 | 687.7 | 4.95 | 76.14 | 578.5 | 2.74 |
| PKN4 | 158.833 | 2.19 | 209.4 | 1.72 | 32.03 | 155.2 | 15.56 |
| PKN8 | 40.210 | 1.60 | 84.28 | 1.29 | 14.71 | 50.9 | 11.99 |
| PKN12 | 19.167 | 1.28 | 41.29 | 0.78 | 8.13 | 20.16 | 8.74 |
| PKN16 | 17.083 | 1.23 | 36.67 | 0.77 | 6.81 | 13.69 | 10.4 |
| PKN20 | 13.542 | 1.13 | 25.91 | 0.65 | 4.97 | 6.56 | 9.12 |
| PKN24 | 22.917 | 1.36 | 27.07 | 0.63 | 4.85 | 3.68 | 11.37 |
| PKN28.56 | 22.710 | 1.36 | 39.72 | 0.82 | 7.51 | 0 | 19.52 |
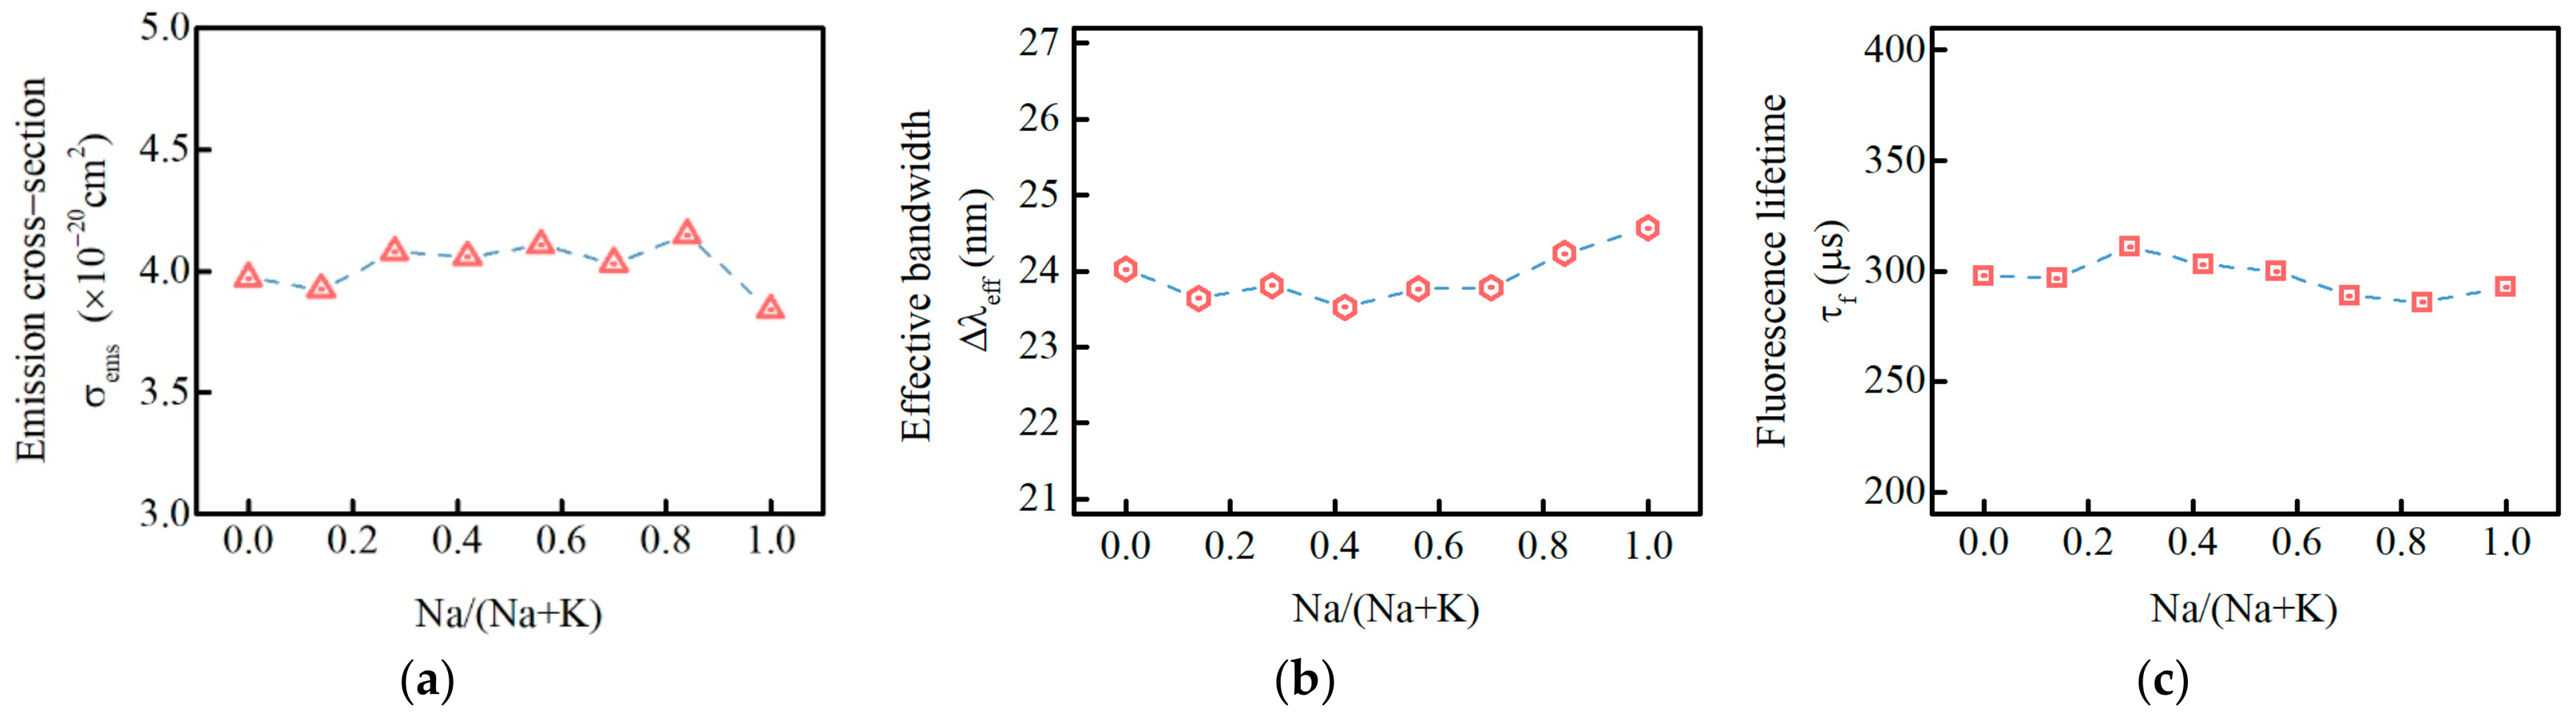
| Sample | Ω2 (10−20 cm2) | Ω4 (10−20 cm2) | Ω6 (10−20 cm2) | σems (10−20 cm2) | τrad (μs) | τf (μs) | ∑Arad (s−1) | Δλeff (nm) | β (%) | η (%) |
|---|---|---|---|---|---|---|---|---|---|---|
| PKN0 | 3.79 | 5.7 | 4.92 | 3.97 | 364 | 298 | 2750 | 24.02 | 48.5 | 82 |
| PKN4 | 3.47 | 5.51 | 4.78 | 3.93 | 372 | 297 | 2685 | 23.65 | 48.5 | 80 |
| PKN8 | 3.38 | 5.78 | 4.99 | 4.08 | 355 | 311 | 2819 | 23.81 | 48.5 | 88 |
| PKN12 | 3.26 | 5.66 | 4.9 | 4.06 | 360 | 303 | 2780 | 23.53 | 48.5 | 84 |
| PKN16 | 2.95 | 5.82 | 4.99 | 4.11 | 351 | 300 | 2849 | 23.77 | 48.5 | 85 |
| PKN20 | 3.12 | 5.67 | 4.91 | 4.03 | 357 | 289 | 2802 | 23.79 | 48.5 | 81 |
| PKN24 | 3.24 | 5.95 | 5.14 | 4.15 | 340 | 286 | 2943 | 24.23 | 48.5 | 84 |
| PKN28.56 | 3.14 | 5.57 | 4.83 | 3.84 | 362 | 293 | 2759 | 24.57 | 48.5 | 81 |
Publisher’s Note: MDPI stays neutral with regard to jurisdictional claims in published maps and institutional affiliations. |
© 2022 by the authors. Licensee MDPI, Basel, Switzerland. This article is an open access article distributed under the terms and conditions of the Creative Commons Attribution (CC BY) license (https://creativecommons.org/licenses/by/4.0/).
Share and Cite
Ma, X.; Xu, Y.; Cheng, J.; Sun, S.; Chen, Y.; Wang, X.; Chen, W.; Chen, S.; Hu, L. Influence of Mixed Na2O/K2O on Chemical Durability and Spectral Properties of P2O5-Al2O3-BaO-K2O-Na2O-Nd2O3 Phosphate Glasses. Materials 2022, 15, 7439. https://doi.org/10.3390/ma15217439
Ma X, Xu Y, Cheng J, Sun S, Chen Y, Wang X, Chen W, Chen S, Hu L. Influence of Mixed Na2O/K2O on Chemical Durability and Spectral Properties of P2O5-Al2O3-BaO-K2O-Na2O-Nd2O3 Phosphate Glasses. Materials. 2022; 15(21):7439. https://doi.org/10.3390/ma15217439
Chicago/Turabian StyleMa, Xiben, Yongchun Xu, Jimeng Cheng, Shiyu Sun, Youkuo Chen, Xin Wang, Wei Chen, Shubin Chen, and Lili Hu. 2022. "Influence of Mixed Na2O/K2O on Chemical Durability and Spectral Properties of P2O5-Al2O3-BaO-K2O-Na2O-Nd2O3 Phosphate Glasses" Materials 15, no. 21: 7439. https://doi.org/10.3390/ma15217439
APA StyleMa, X., Xu, Y., Cheng, J., Sun, S., Chen, Y., Wang, X., Chen, W., Chen, S., & Hu, L. (2022). Influence of Mixed Na2O/K2O on Chemical Durability and Spectral Properties of P2O5-Al2O3-BaO-K2O-Na2O-Nd2O3 Phosphate Glasses. Materials, 15(21), 7439. https://doi.org/10.3390/ma15217439