
Evaluating the Strength and Impact of Raw Ingredients of Cement Mortar Incorporating Waste Glass Powder Using Machine Learning and SHapley Additive ExPlanations (SHAP) Methods

 , , , ,
Abstract
1. Introduction
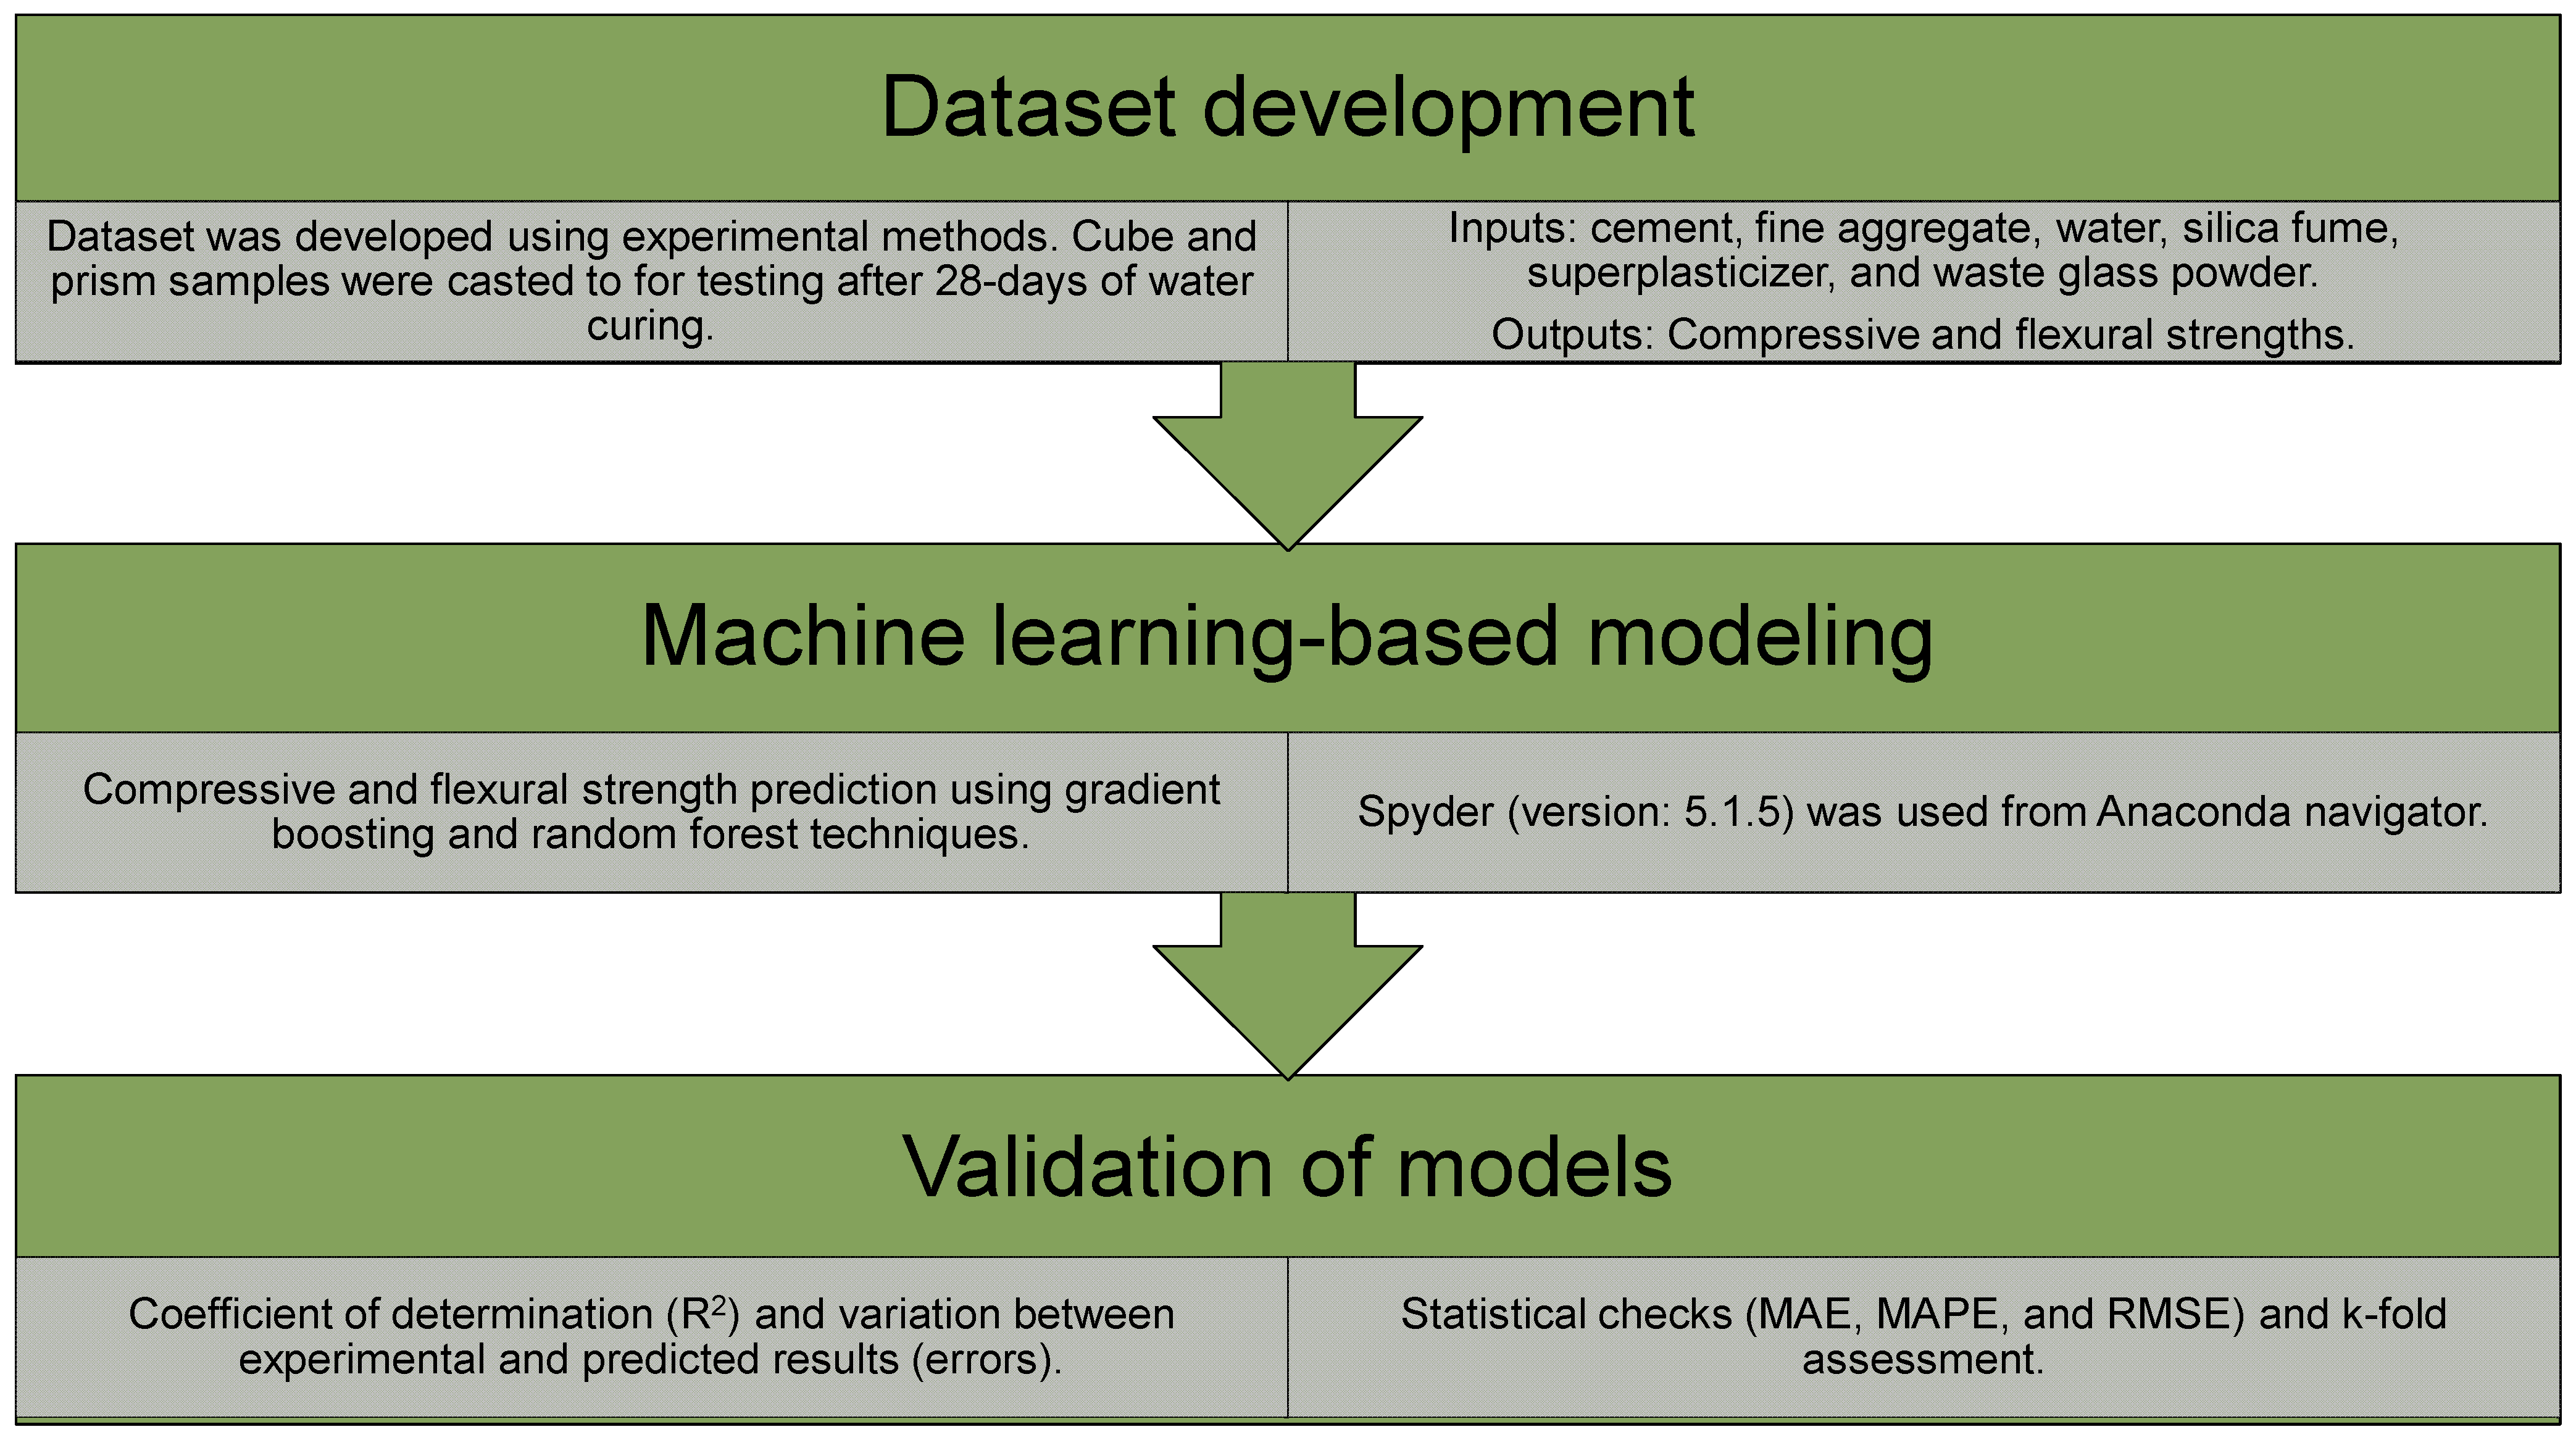
2. Research Methods
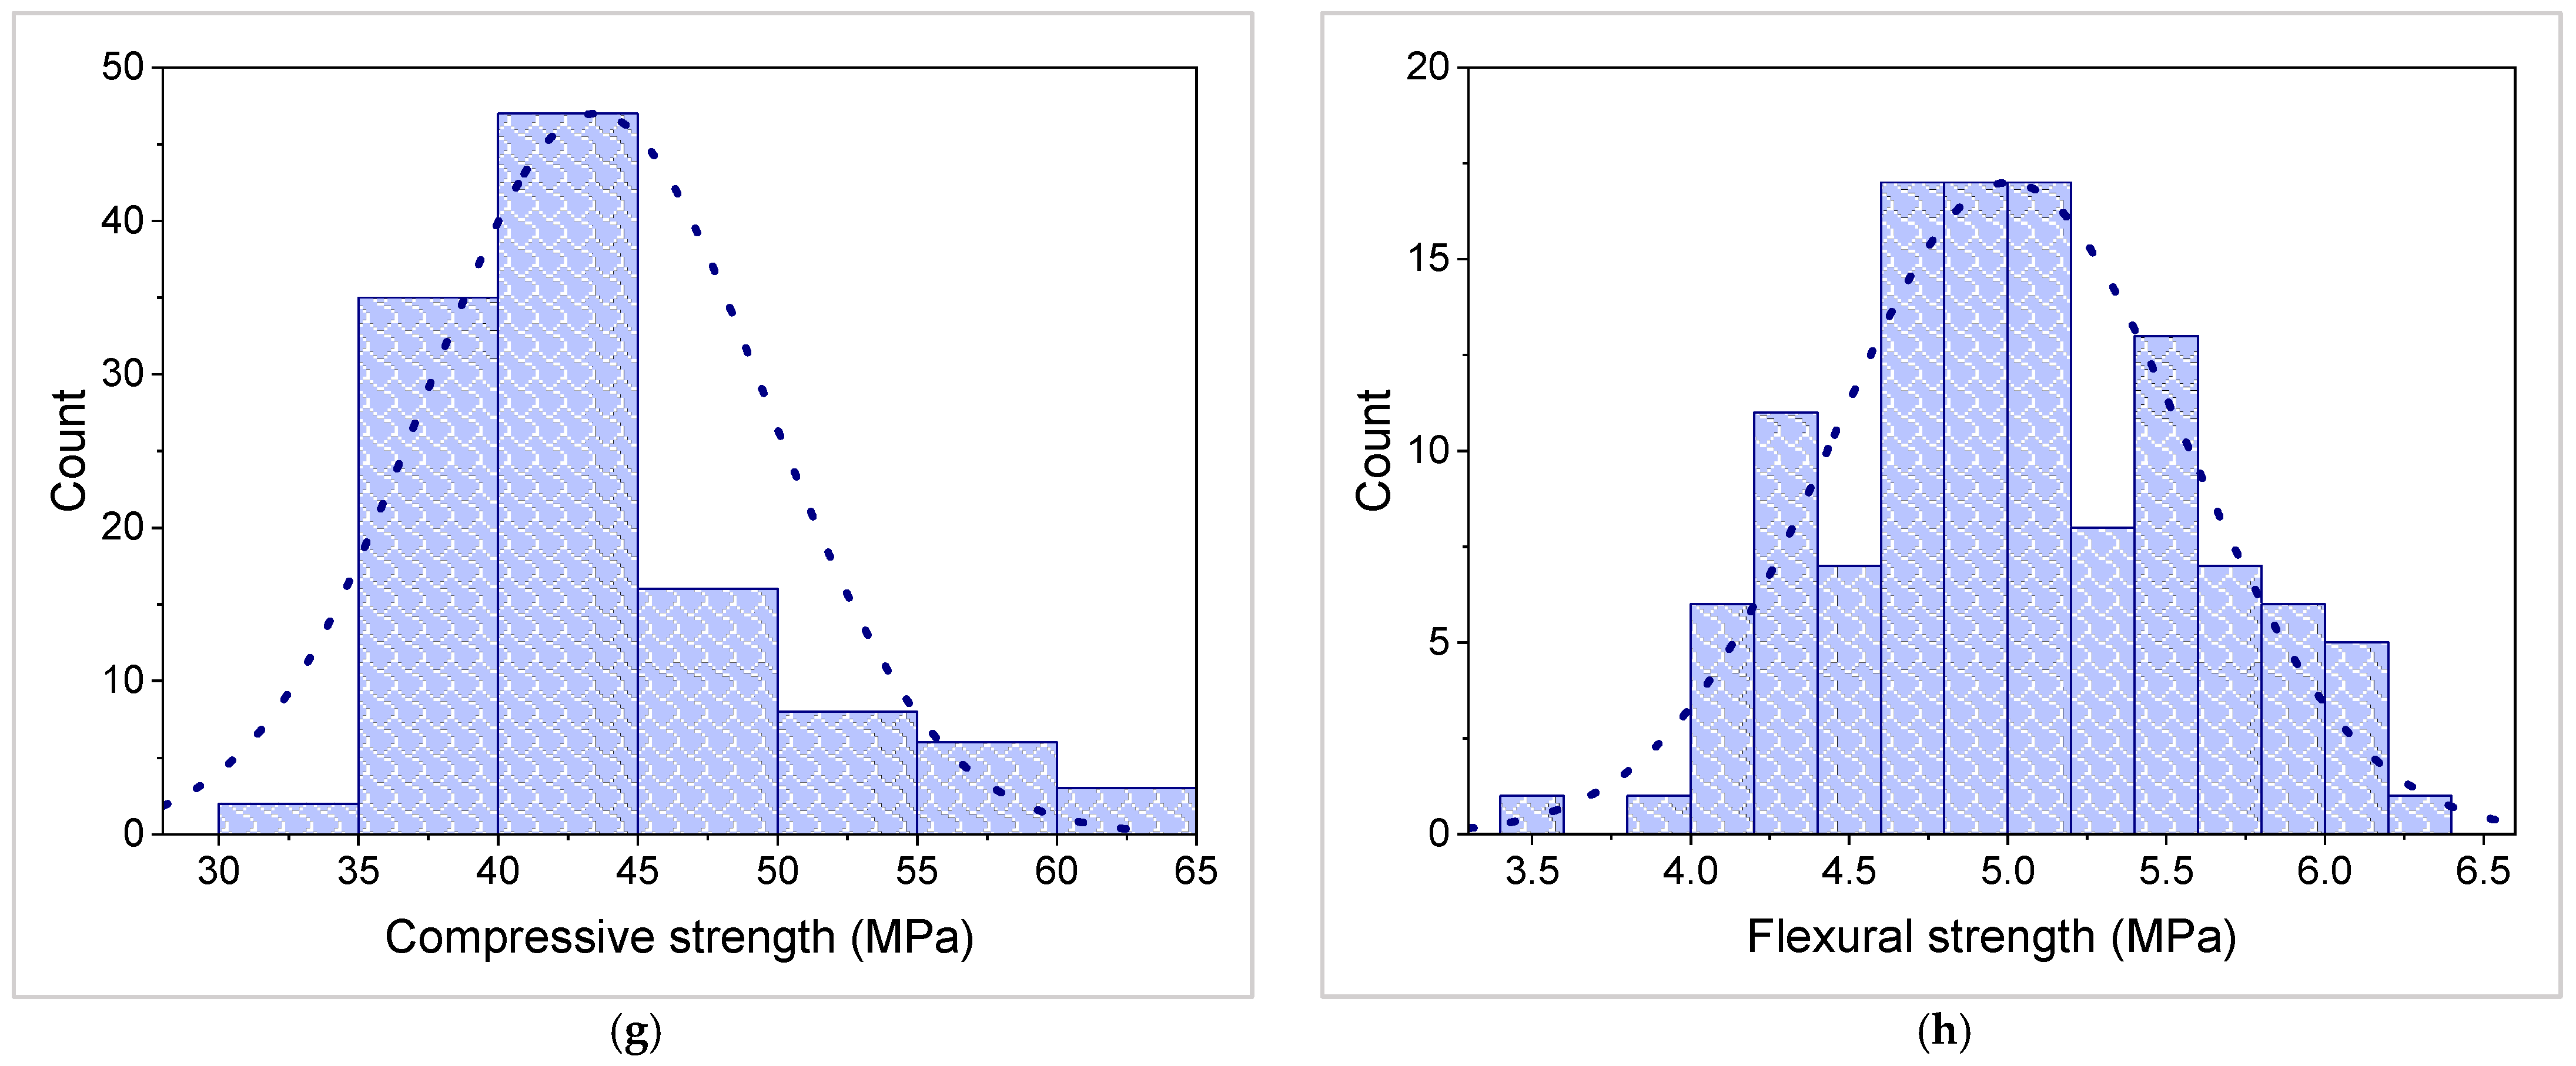
2.1. Dataset Used for Modeling
2.2. Machine Learning-Based Modeling
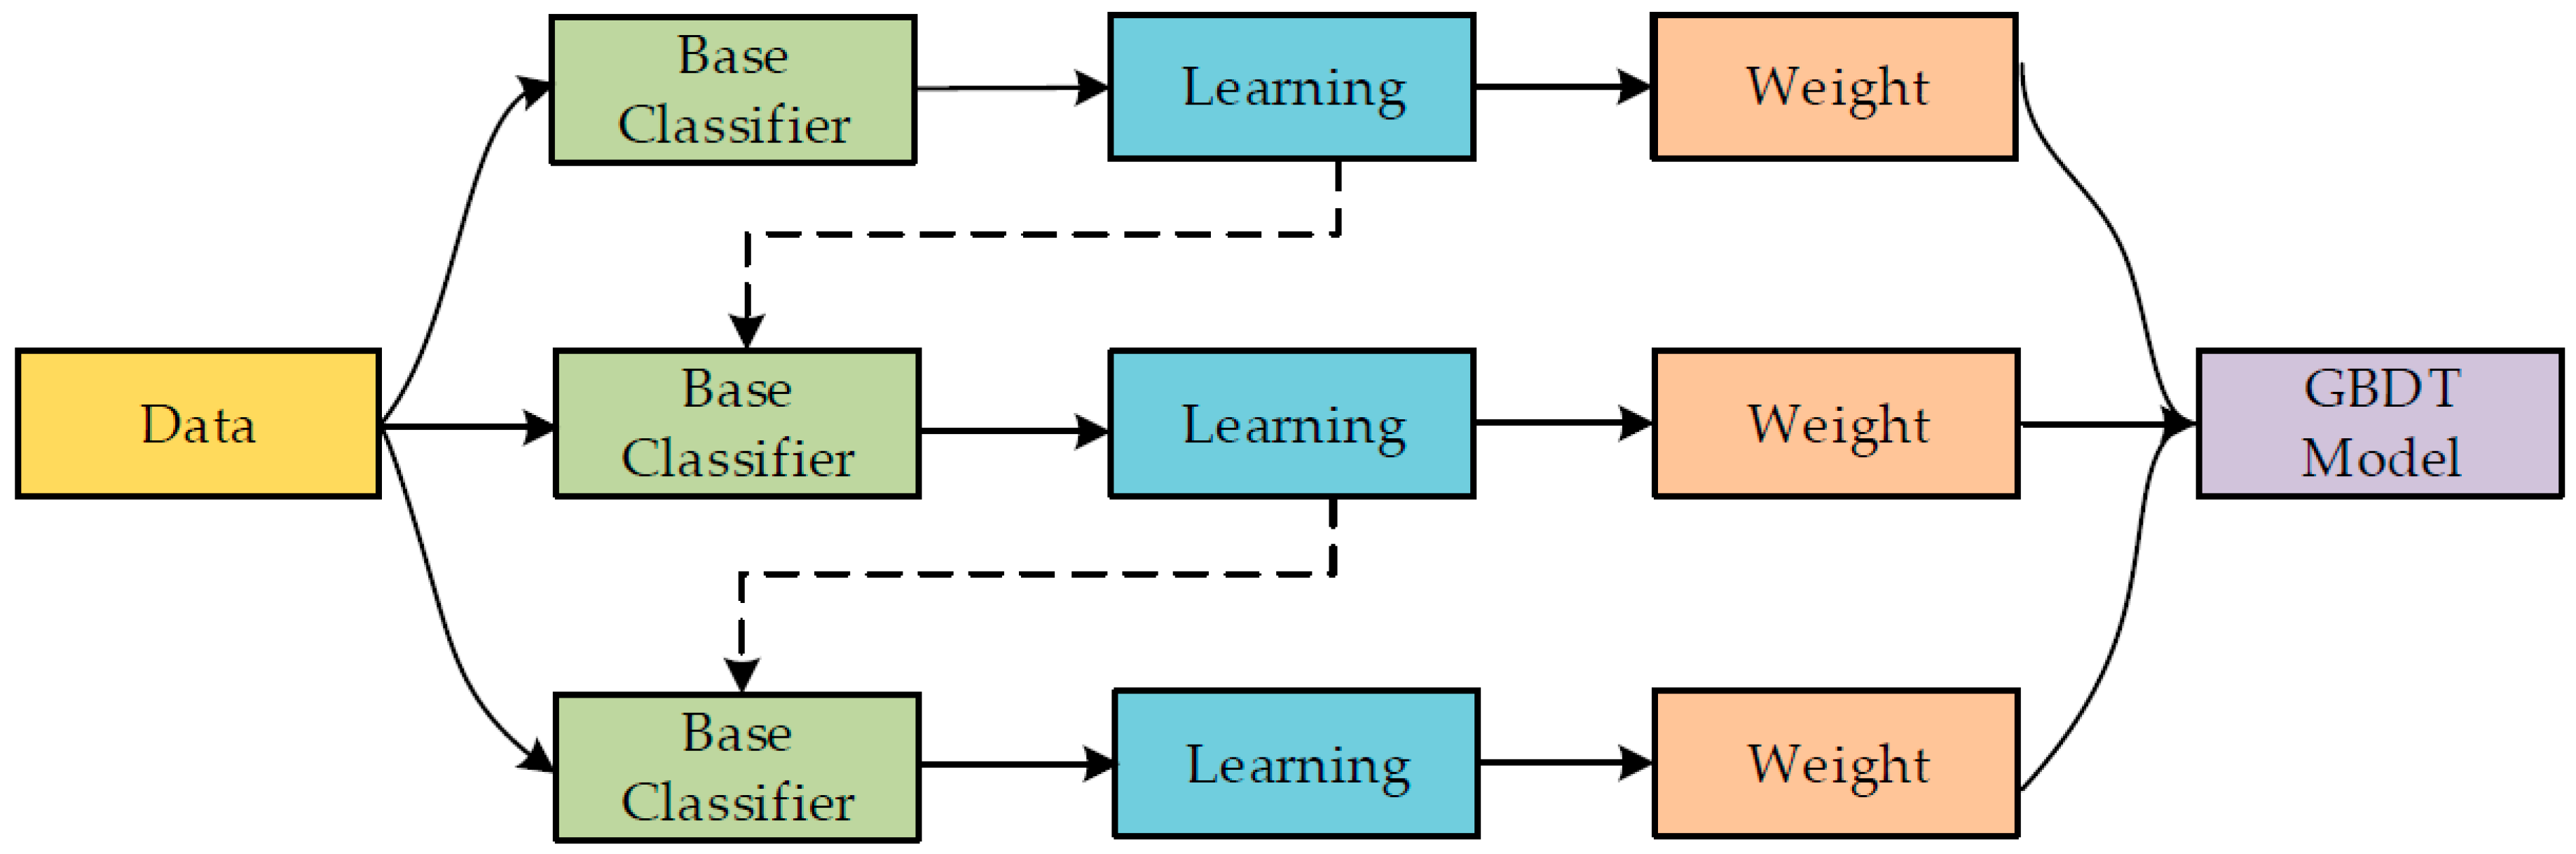
2.2.1. Gradient Boosting Regressor
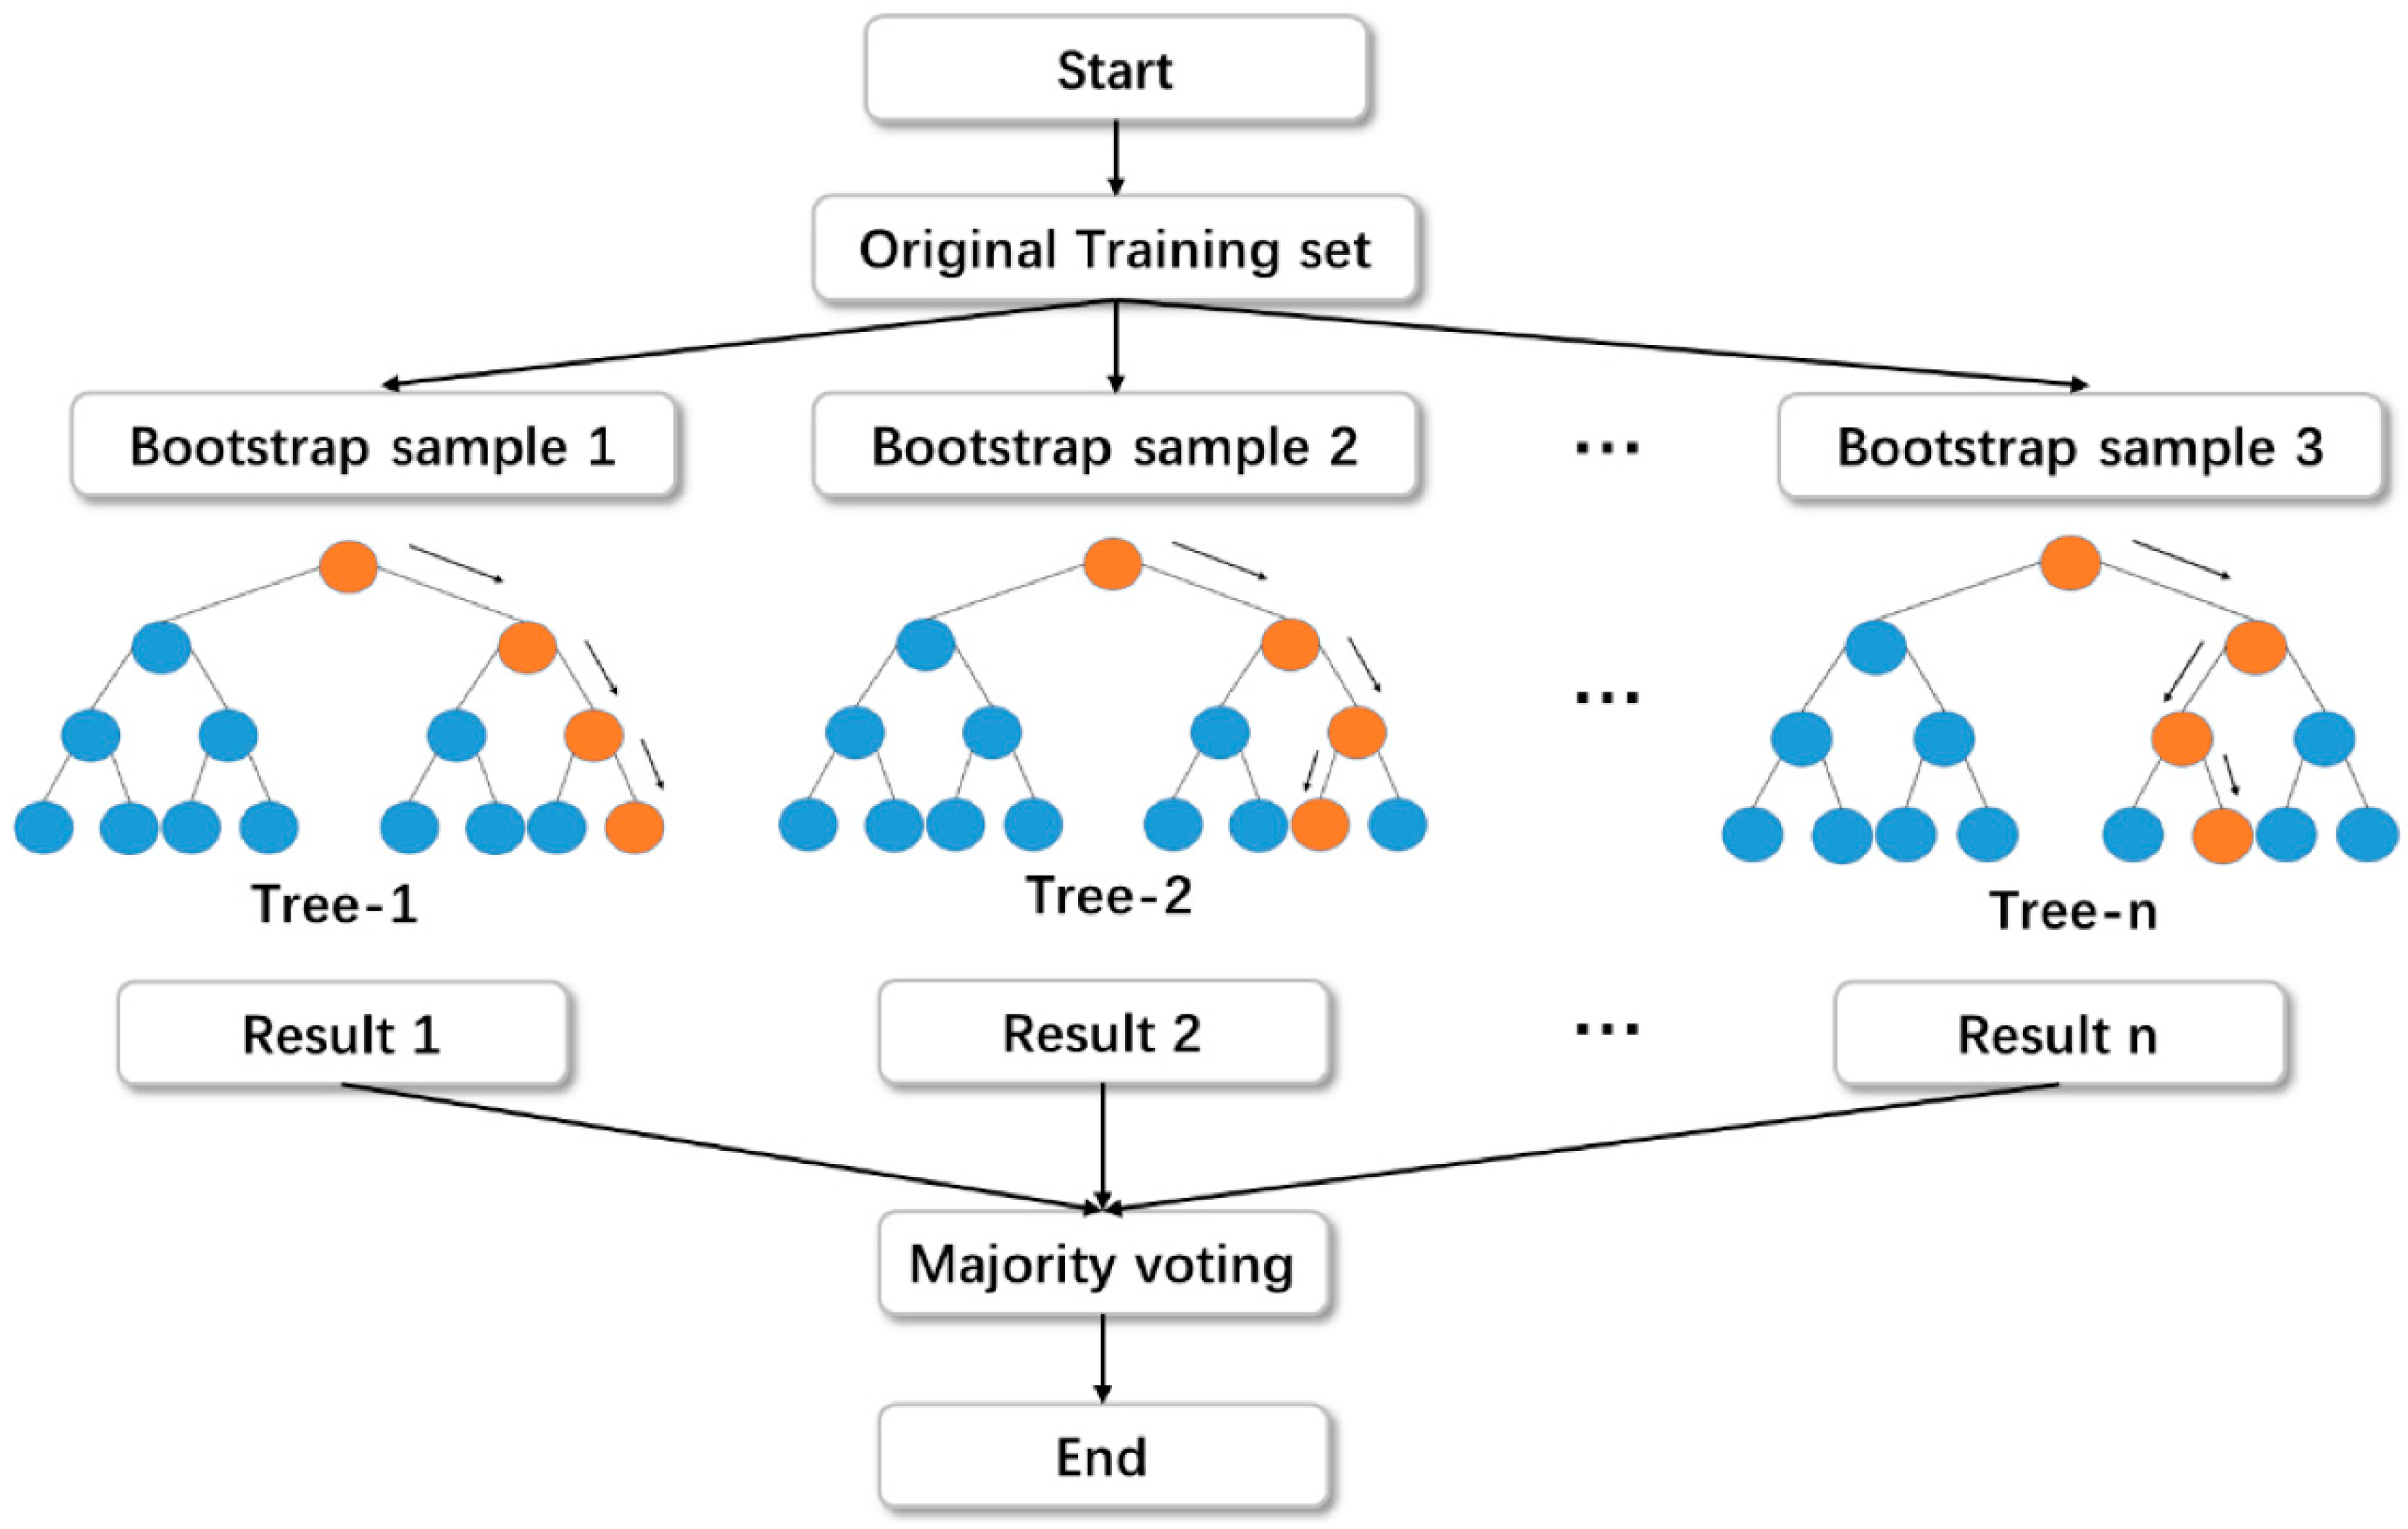
2.2.2. Random Forest Regressor
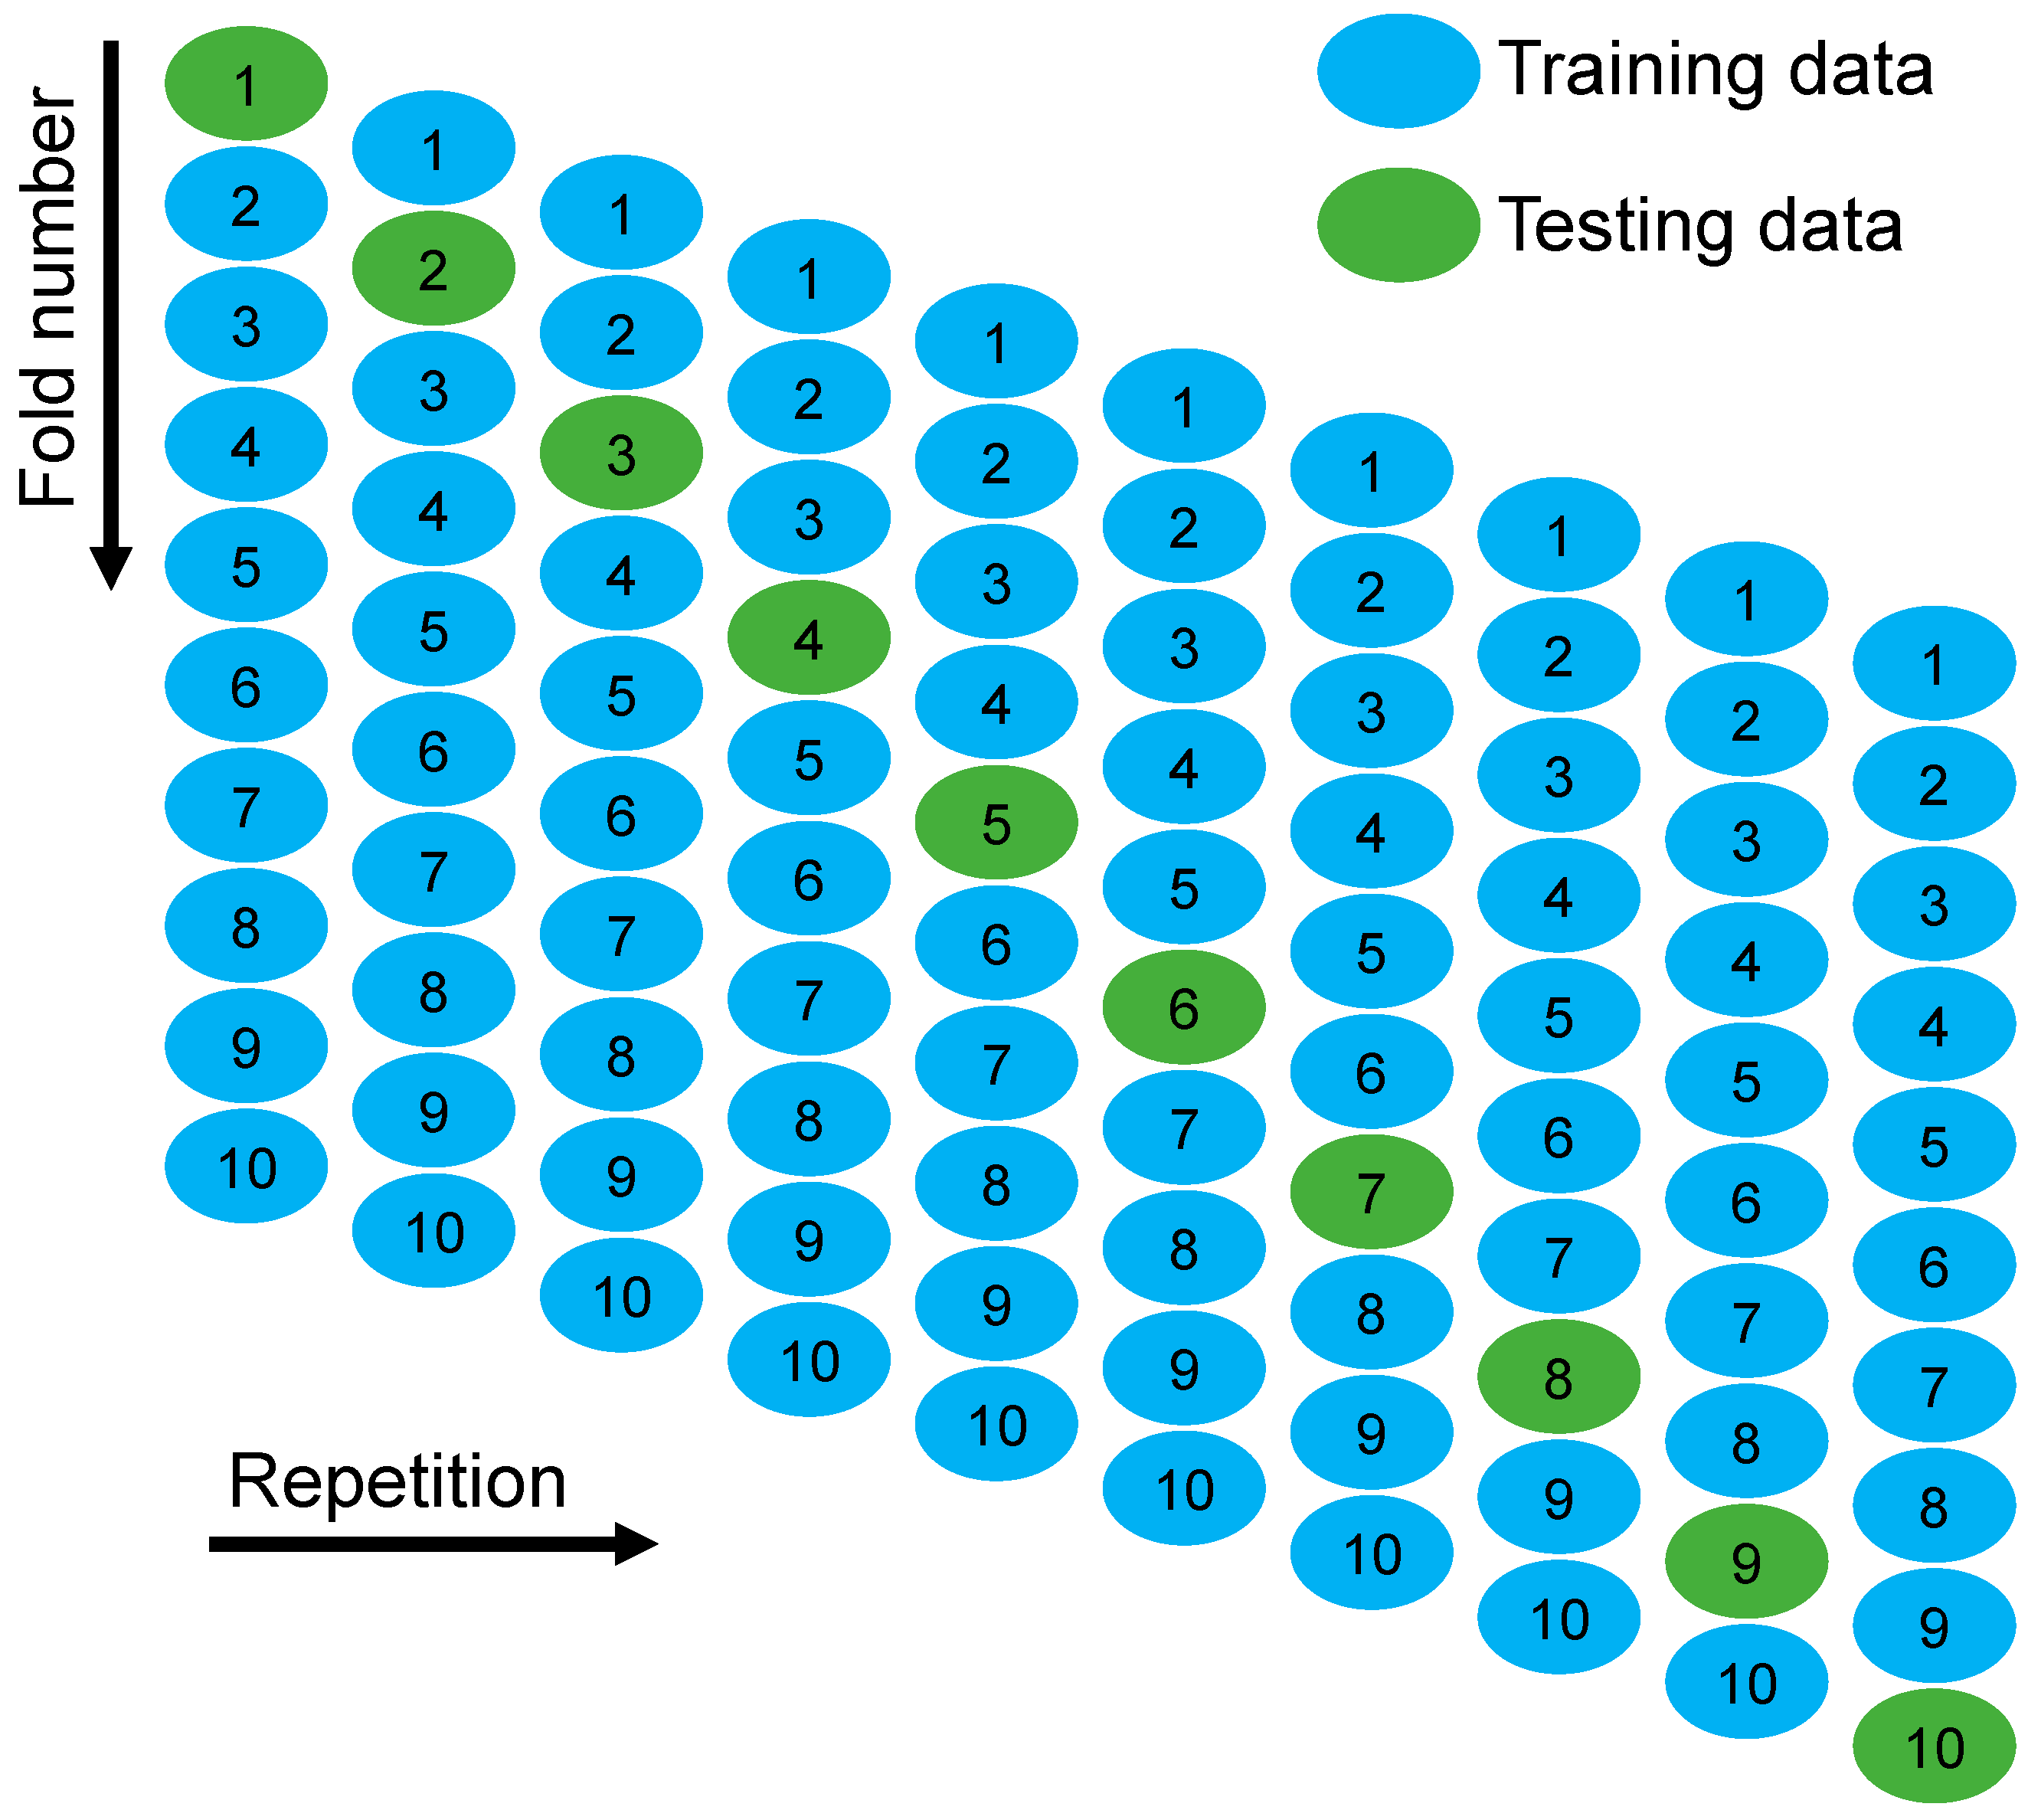
2.2.3. Validation of Machine Learning-Based Models
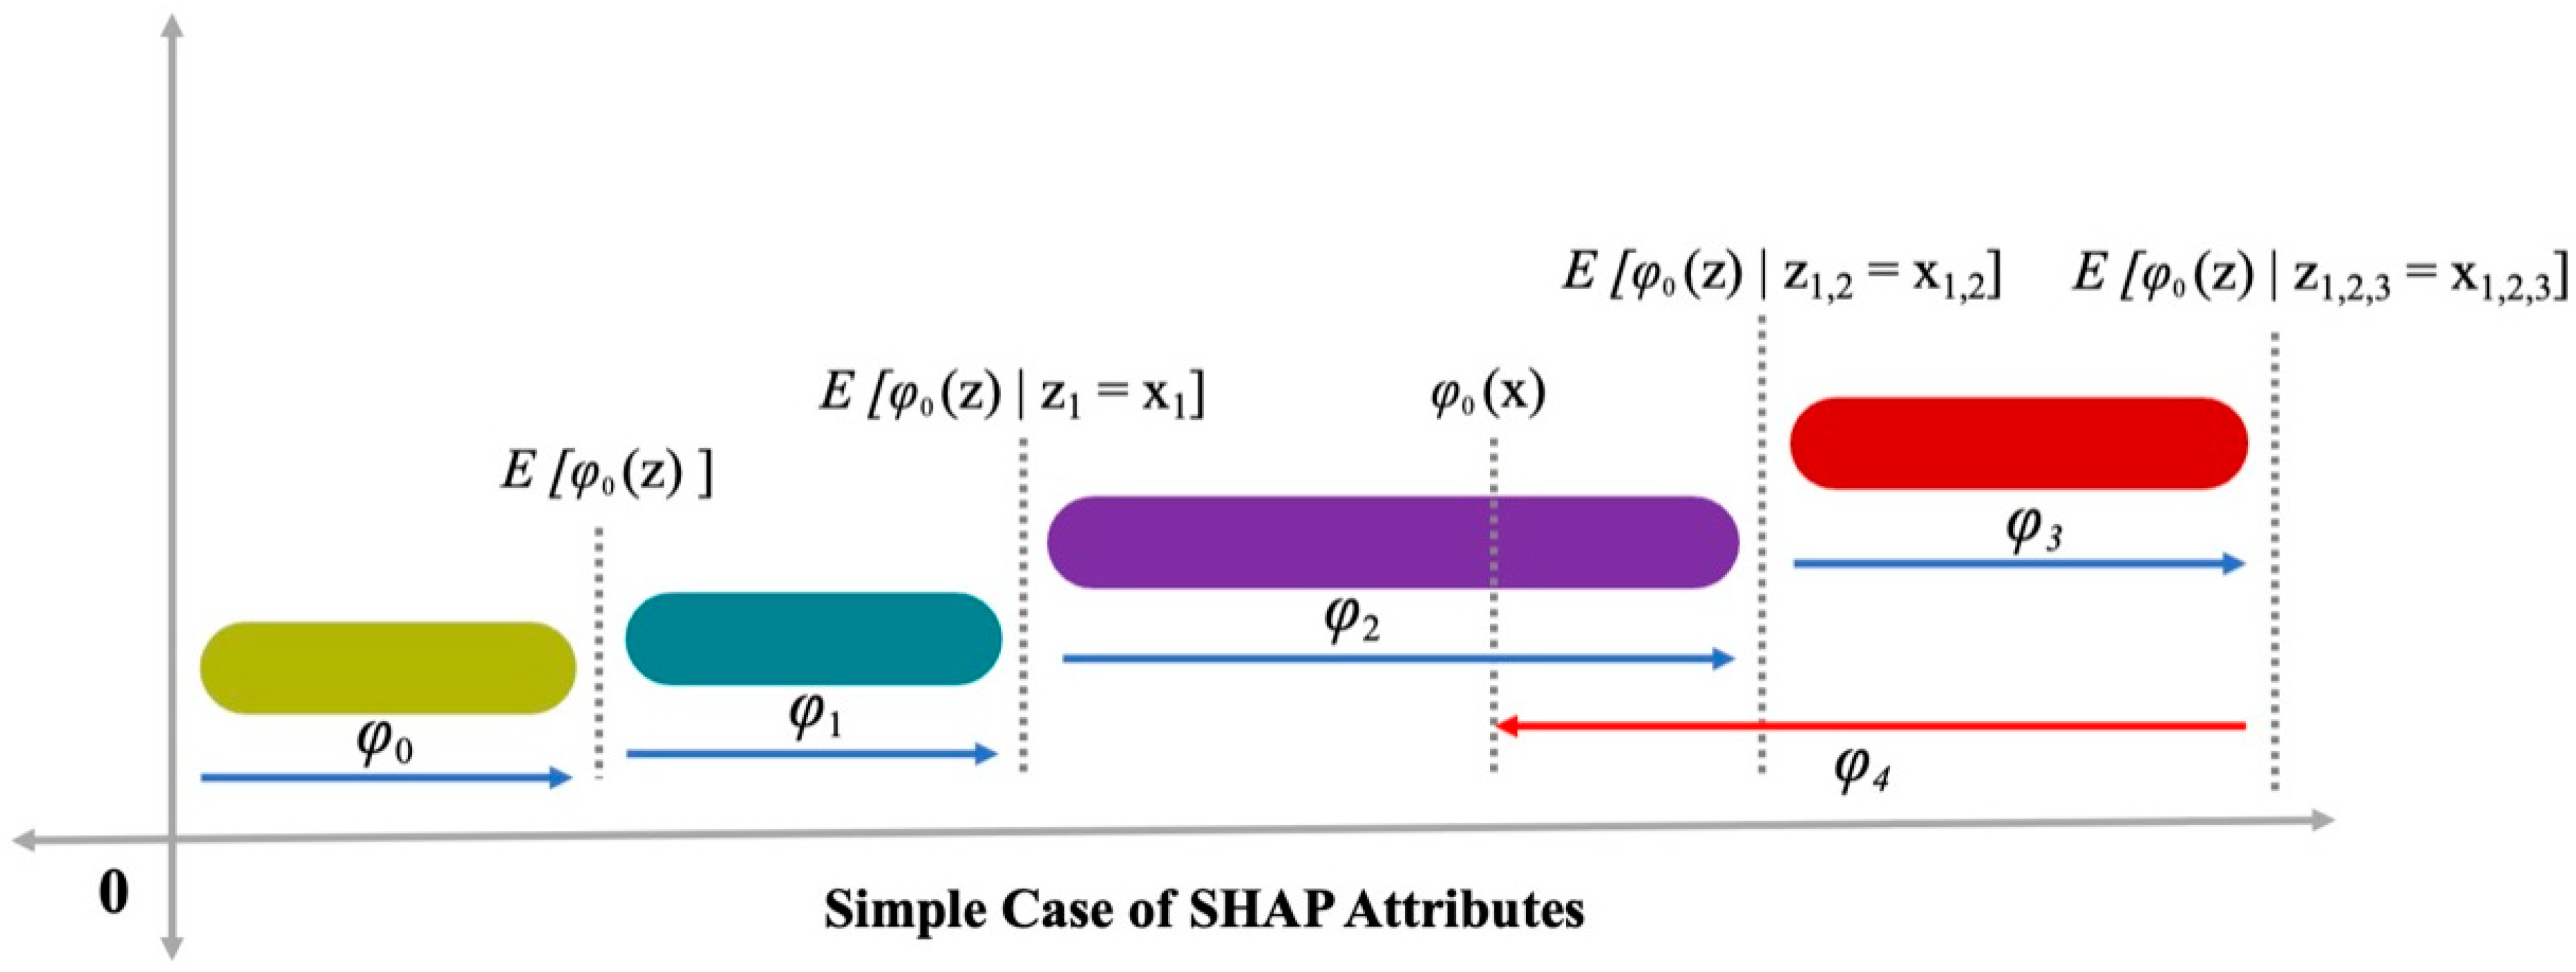
2.3. SHAP Analysis
- 𝑆 = the ingredient subset,
- = ingredient 𝑗
- 𝑝 = the ingredient number in the model.
- = the input feature number
- = the constant.
3. Results and Analysis
3.1. Compressive Strength Models
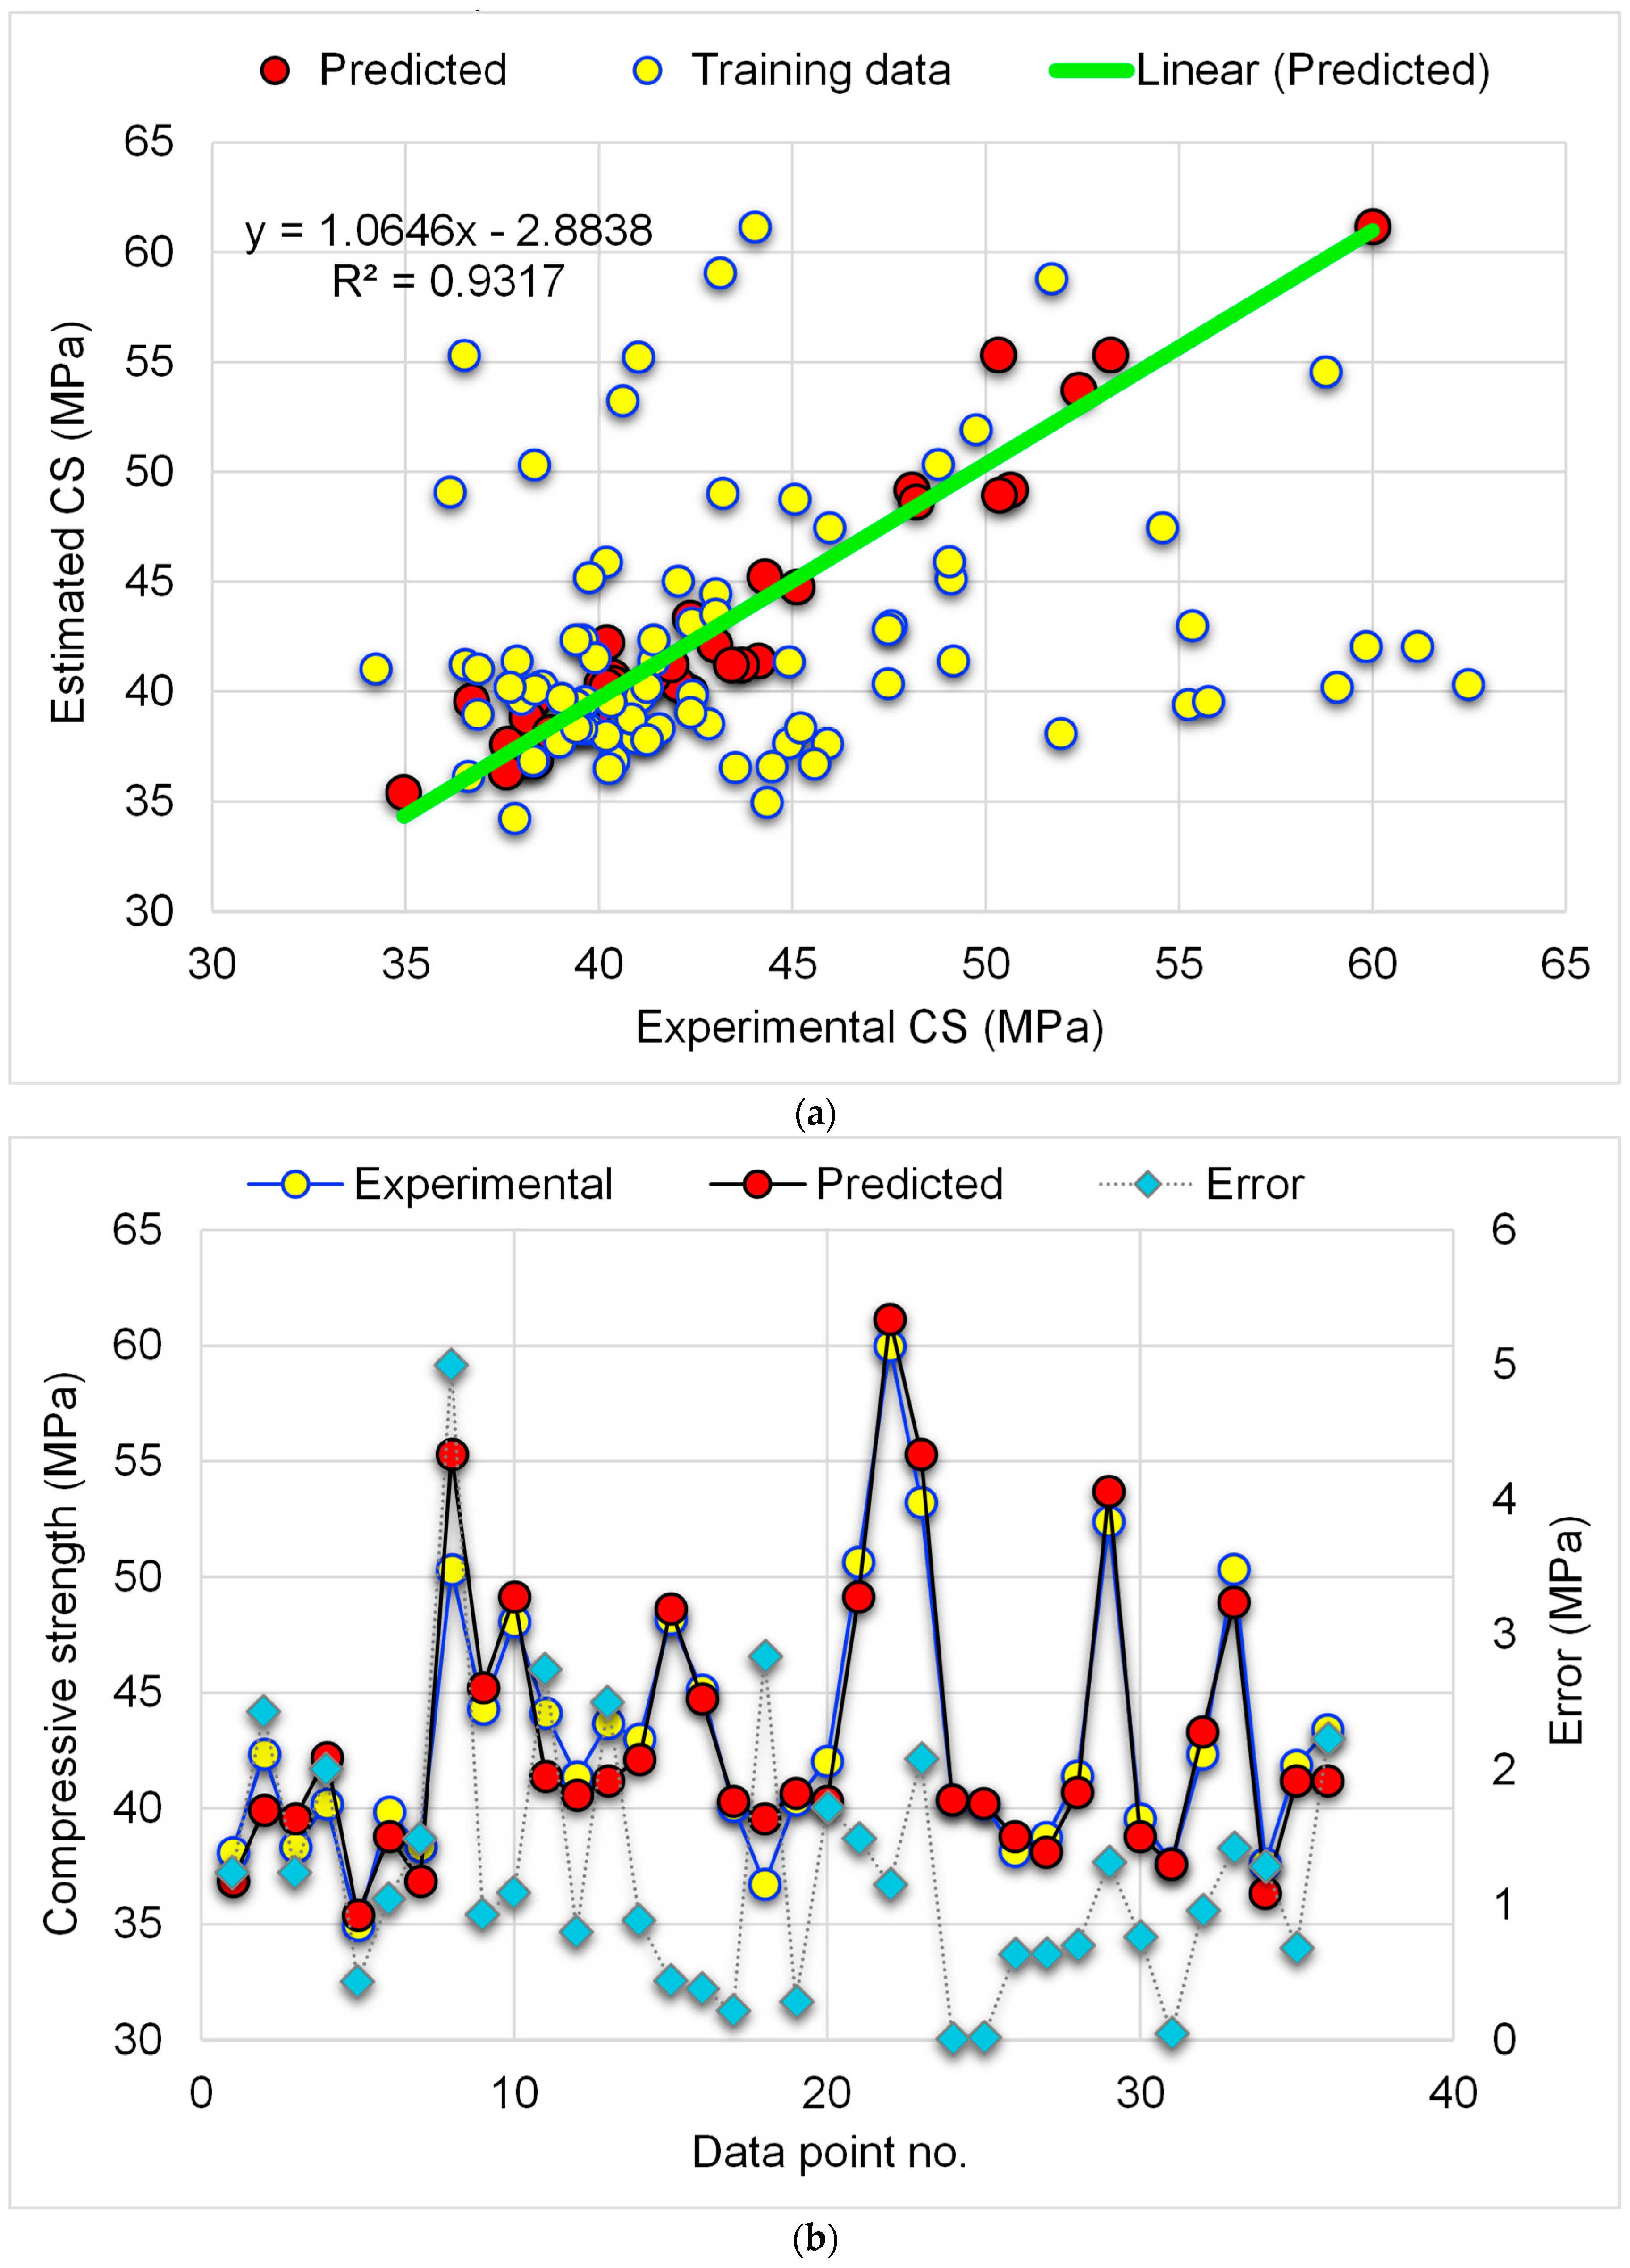
3.1.1. Gradient Boosting Regressor Model
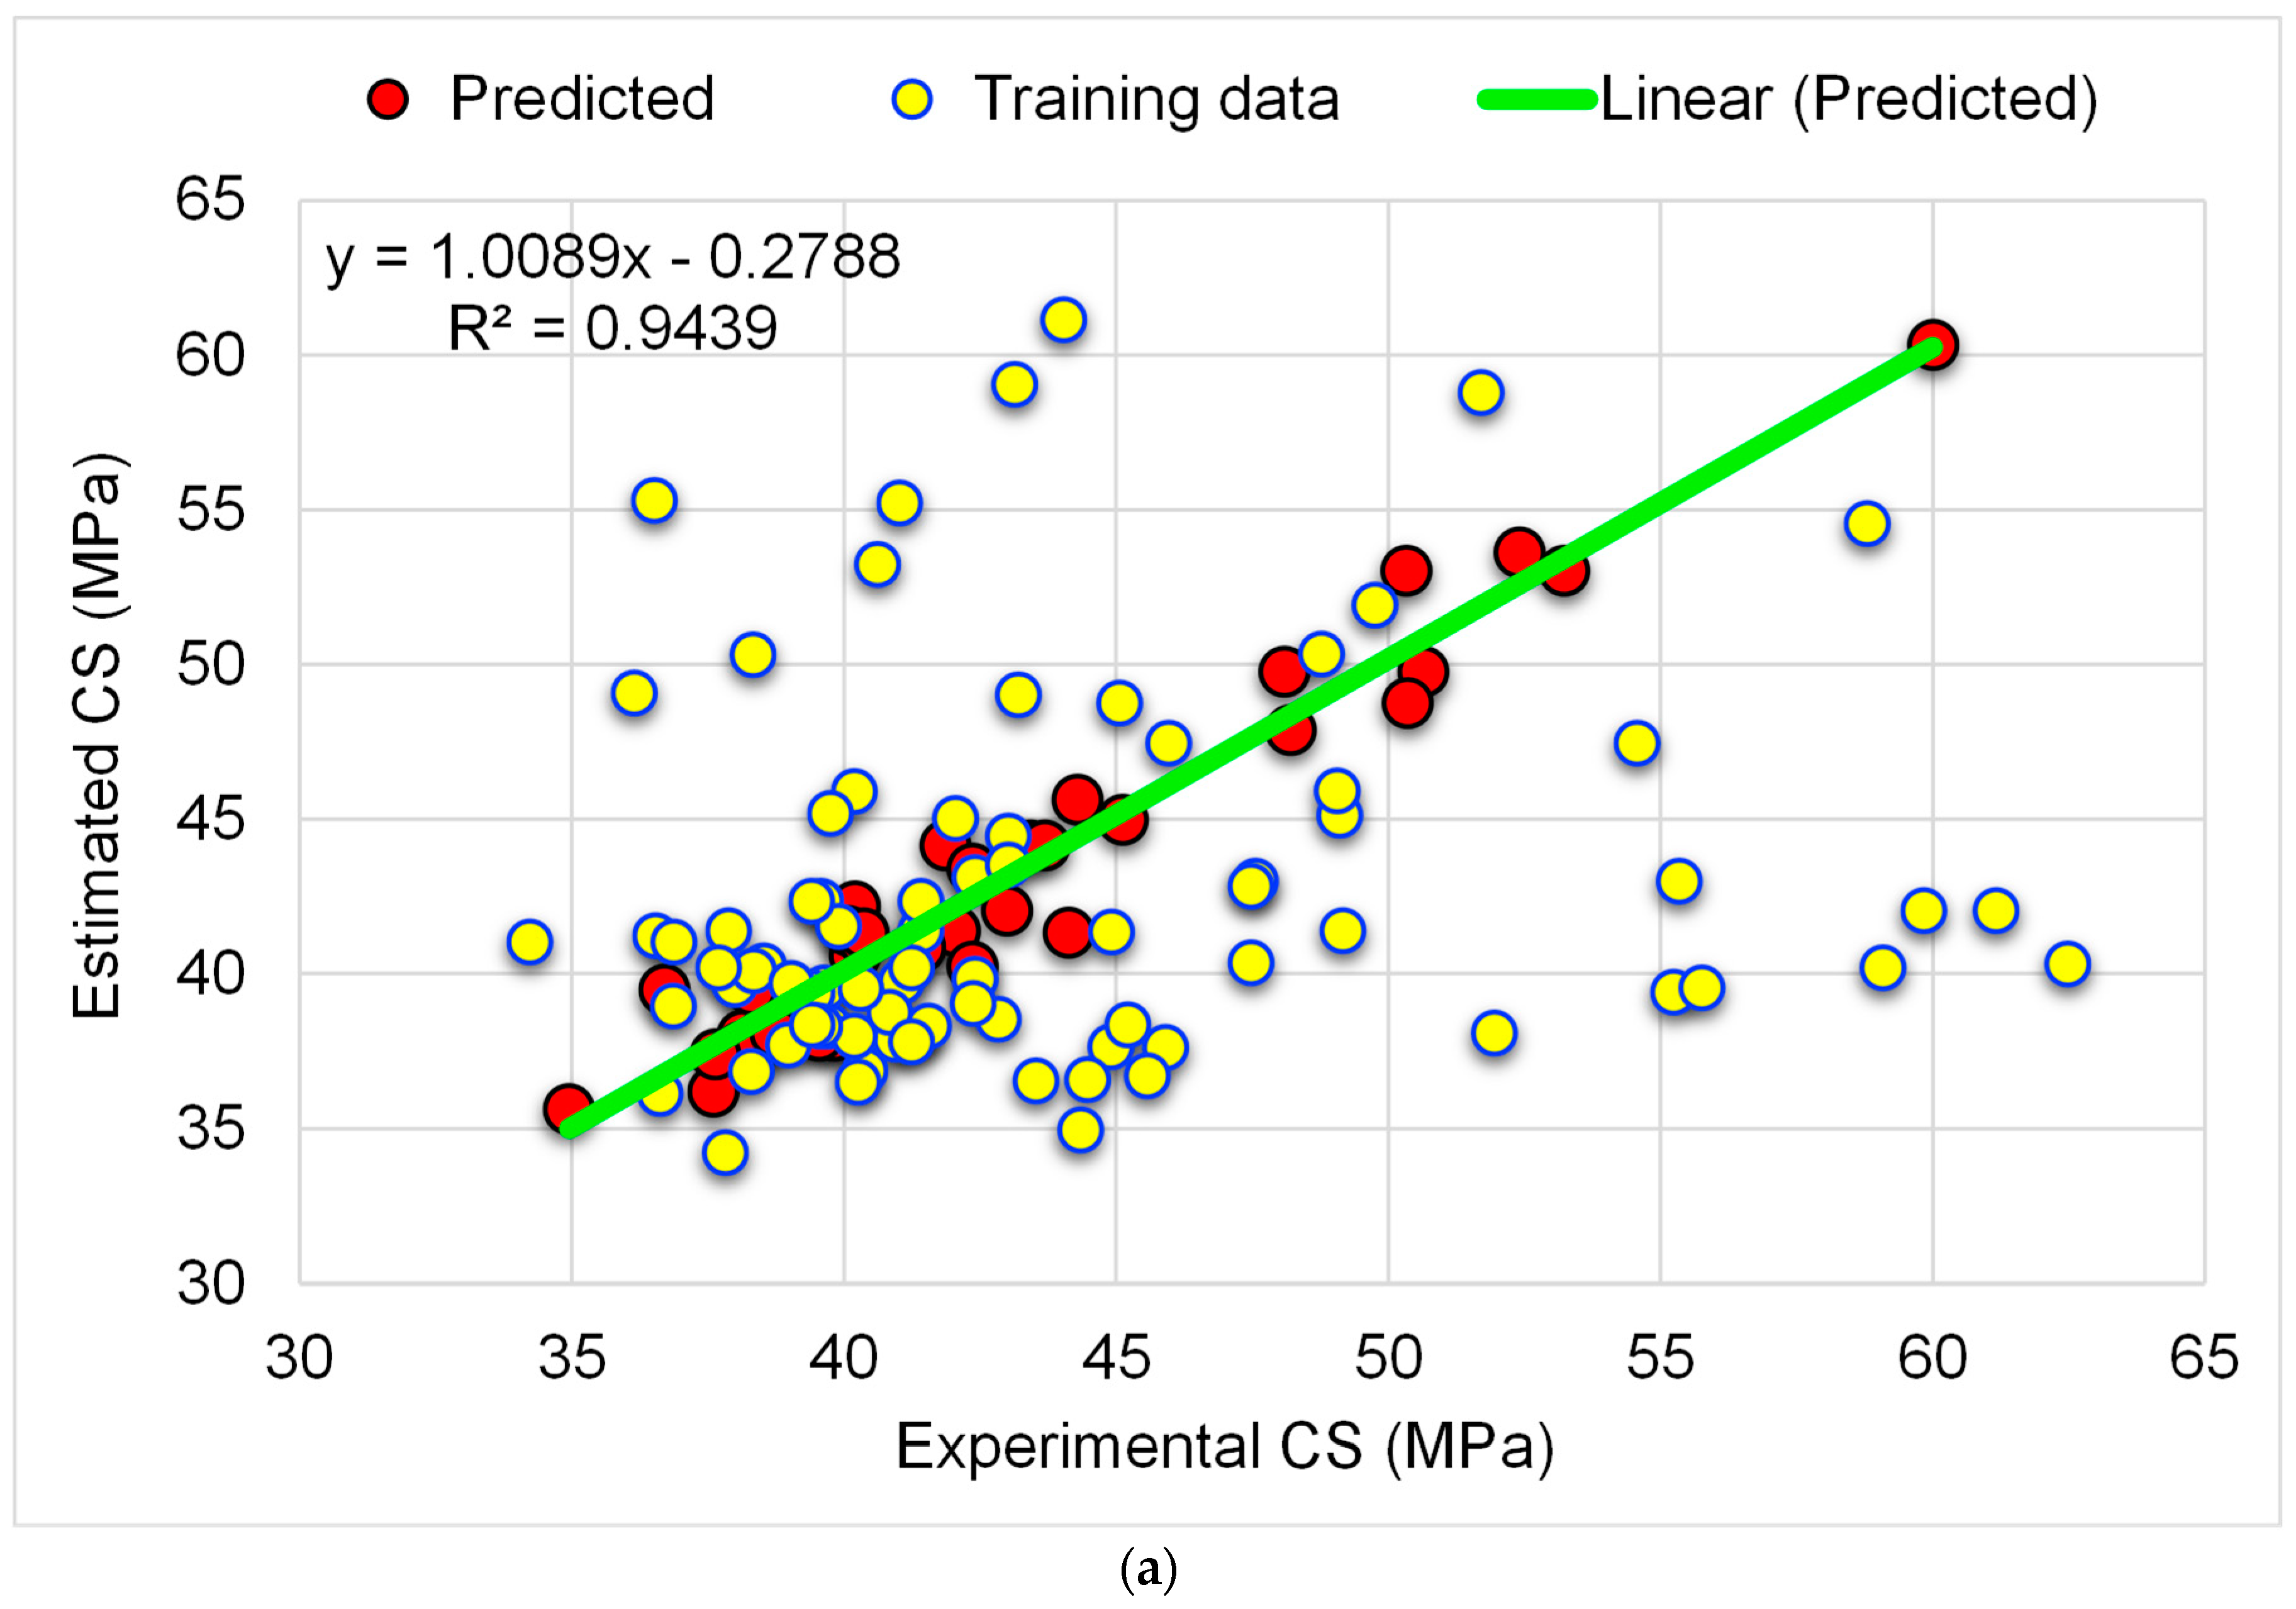
3.1.2. Random Forest Regressor Model
3.2. Flexural Strength Models
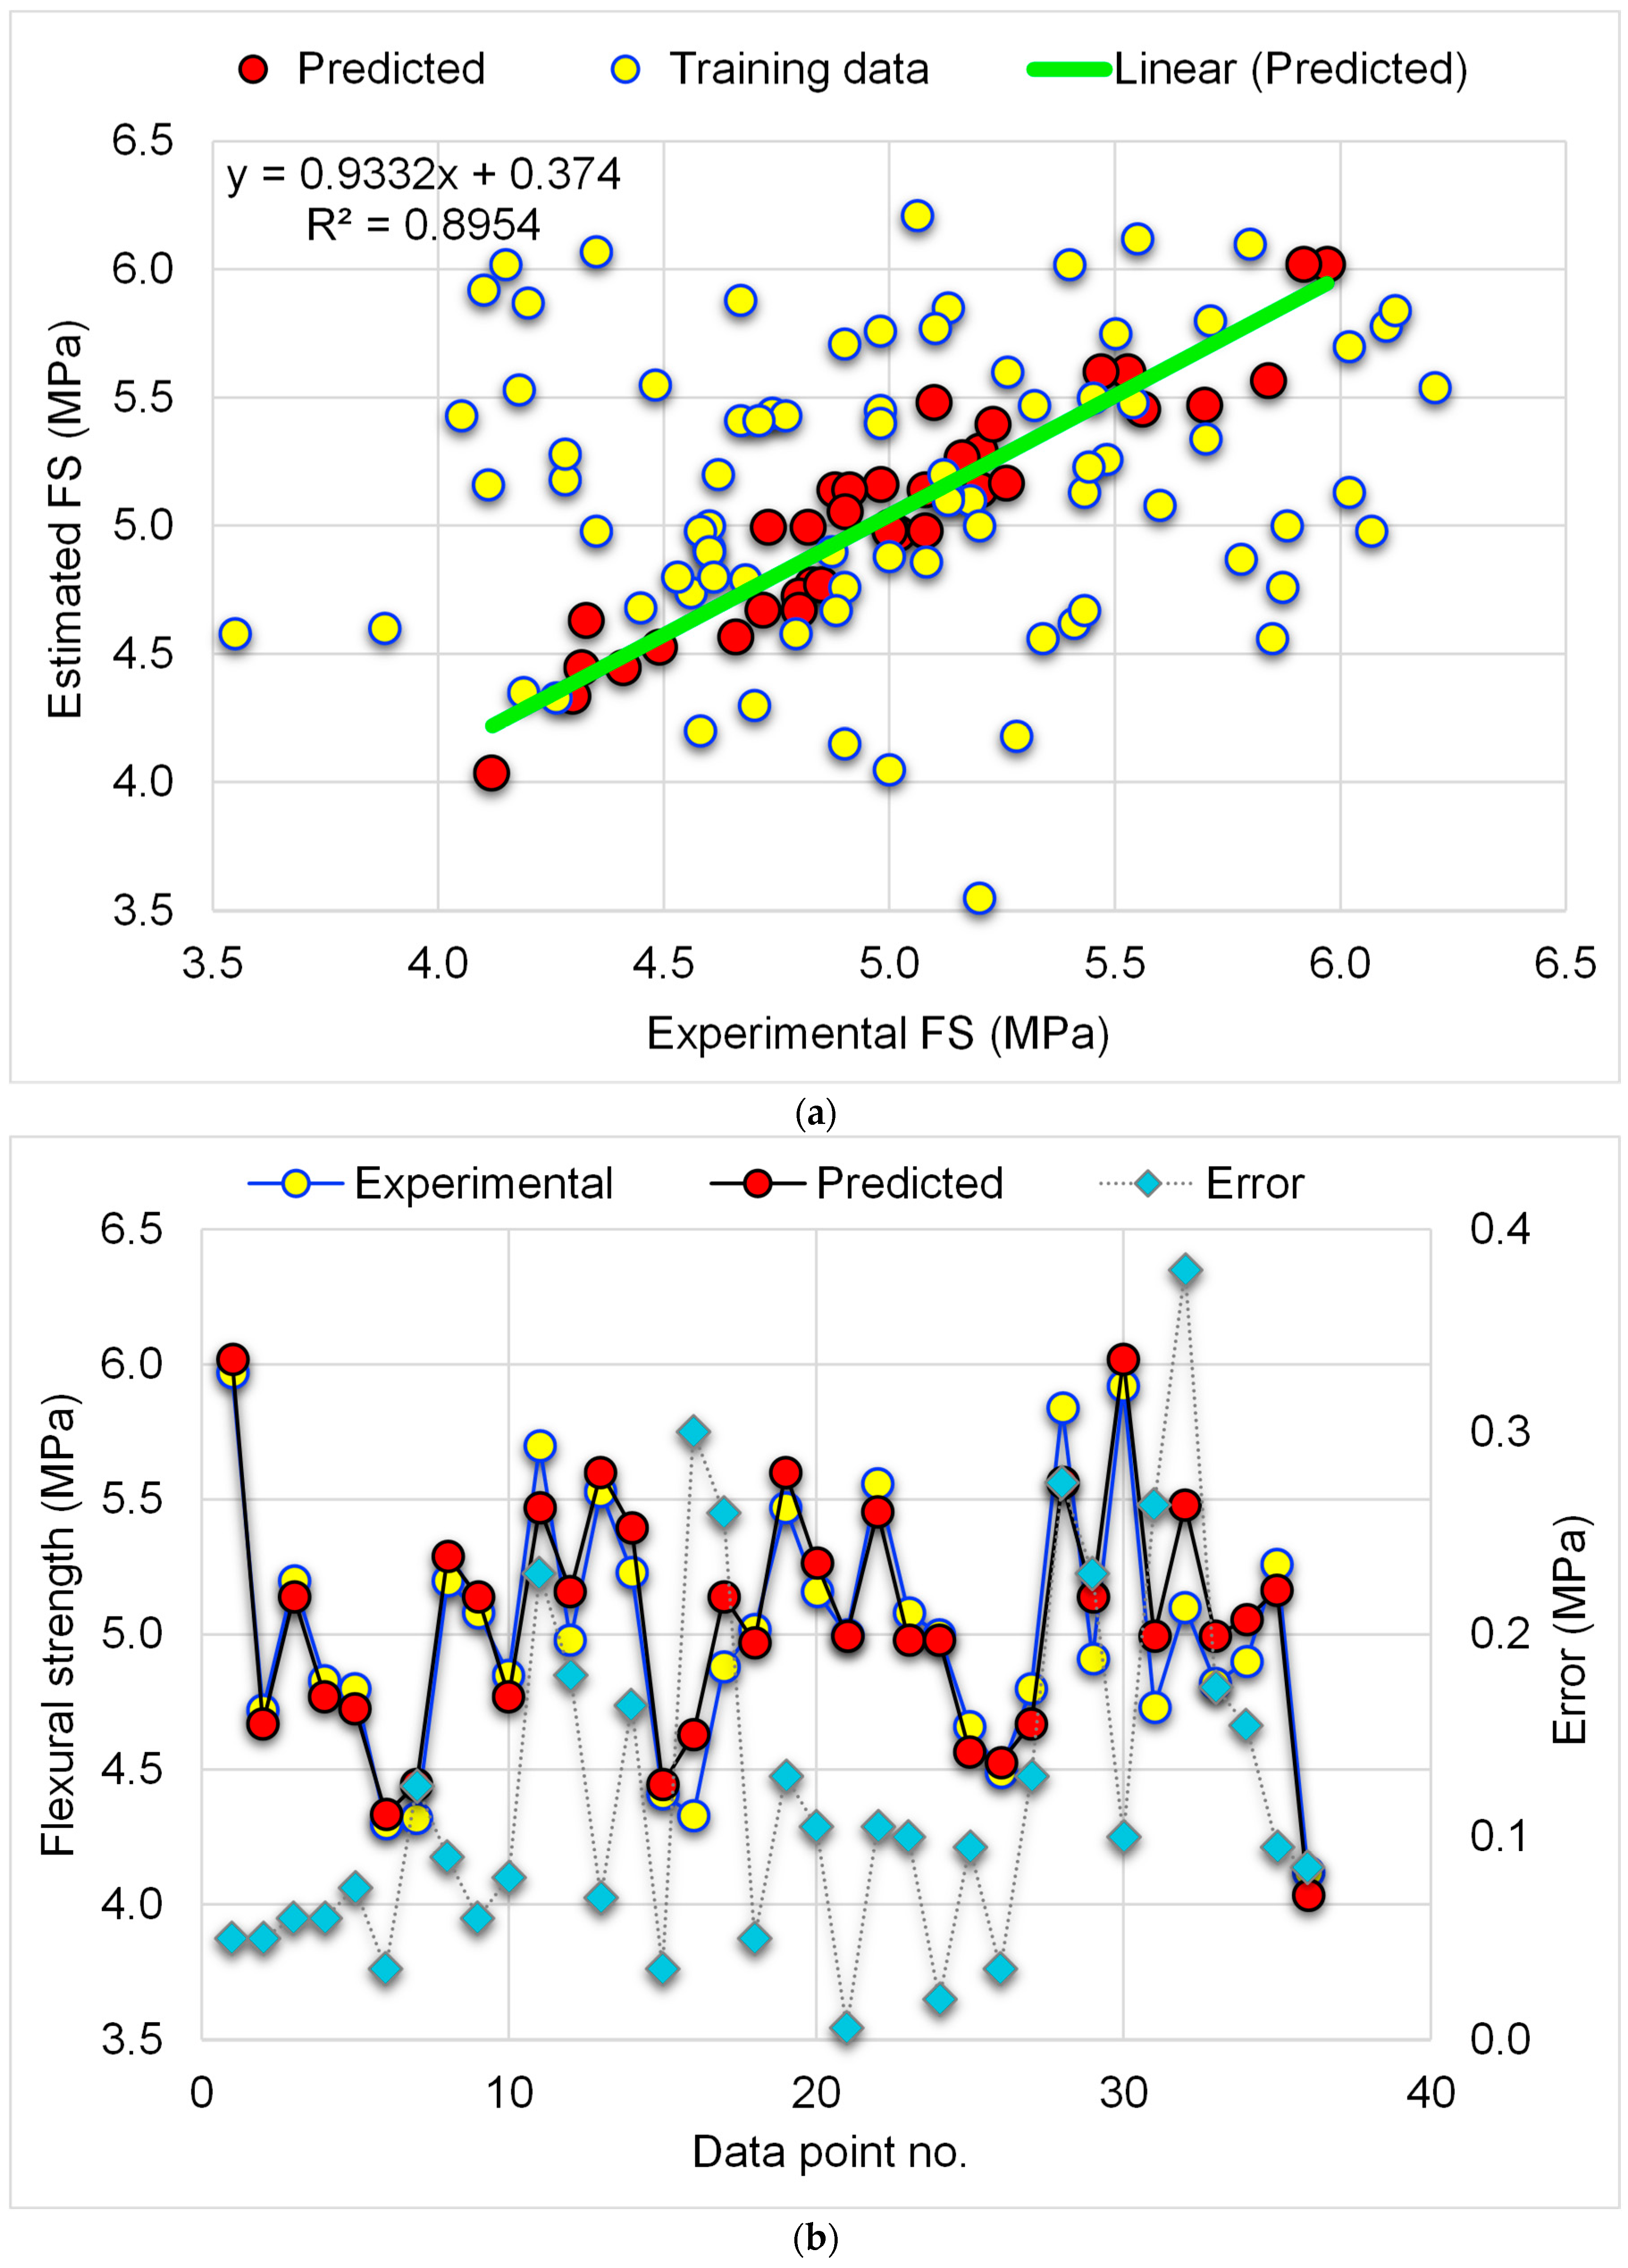
3.2.1. Gradient Boosting Regressor Model
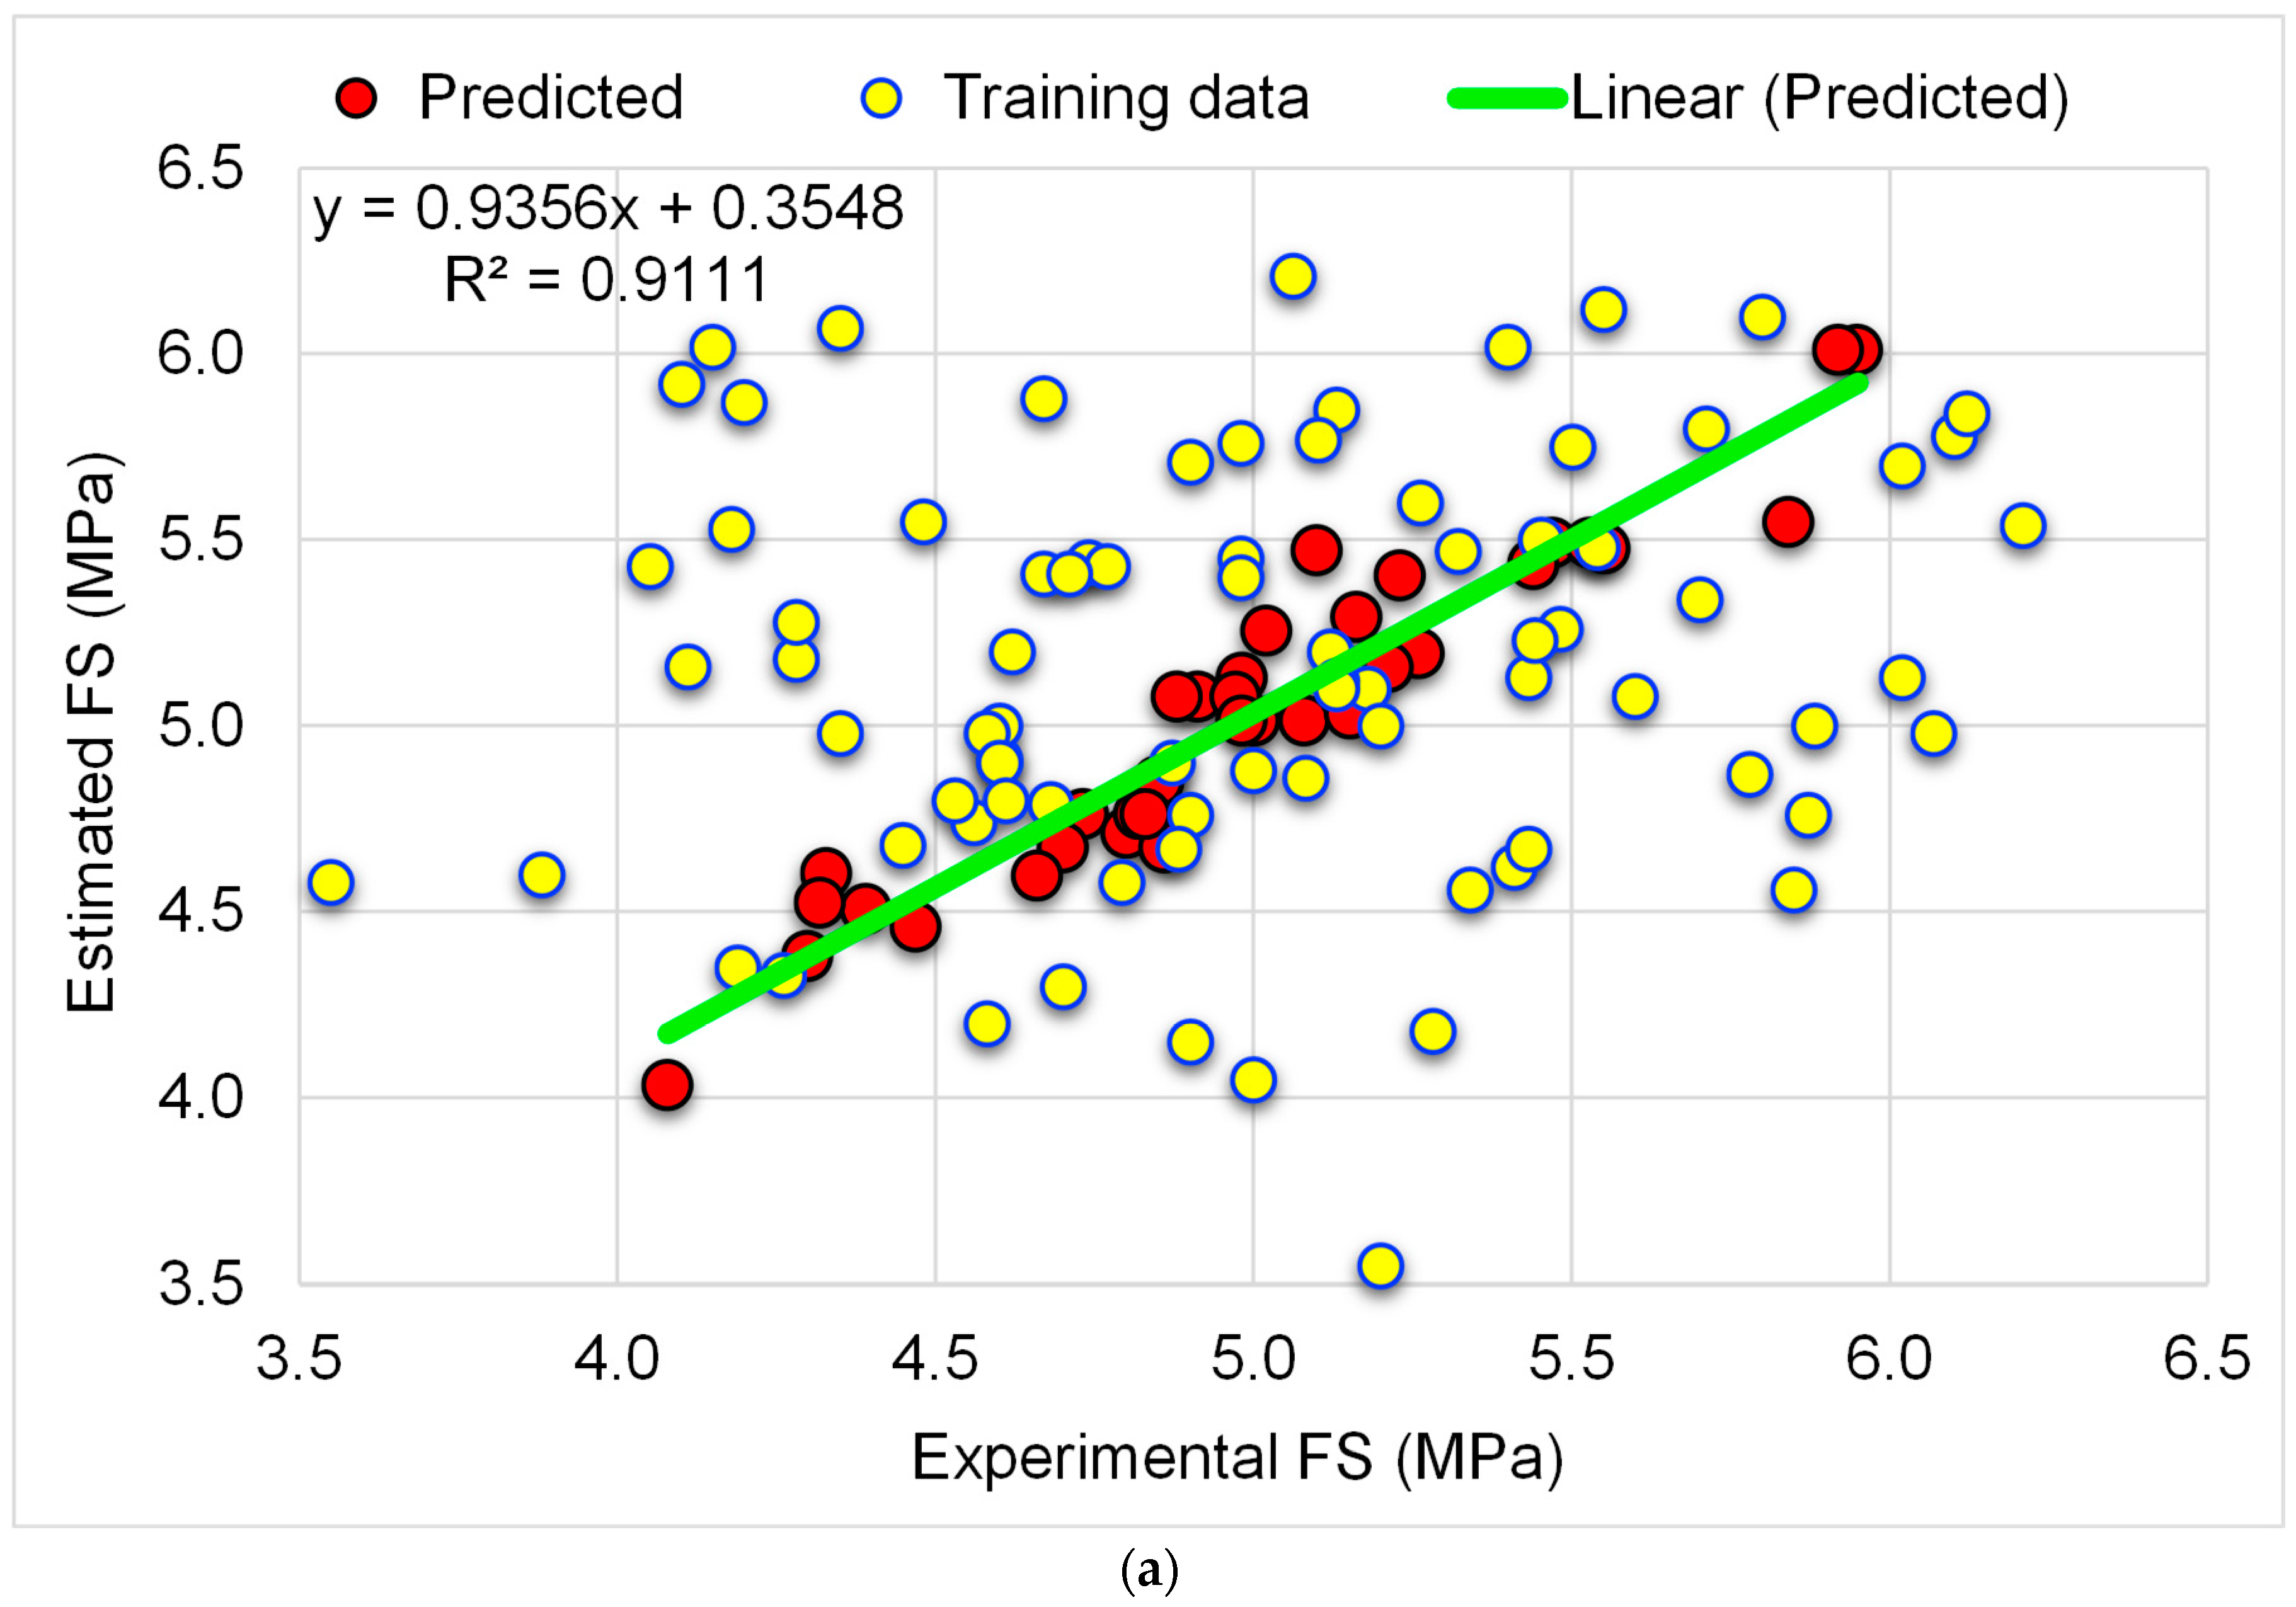
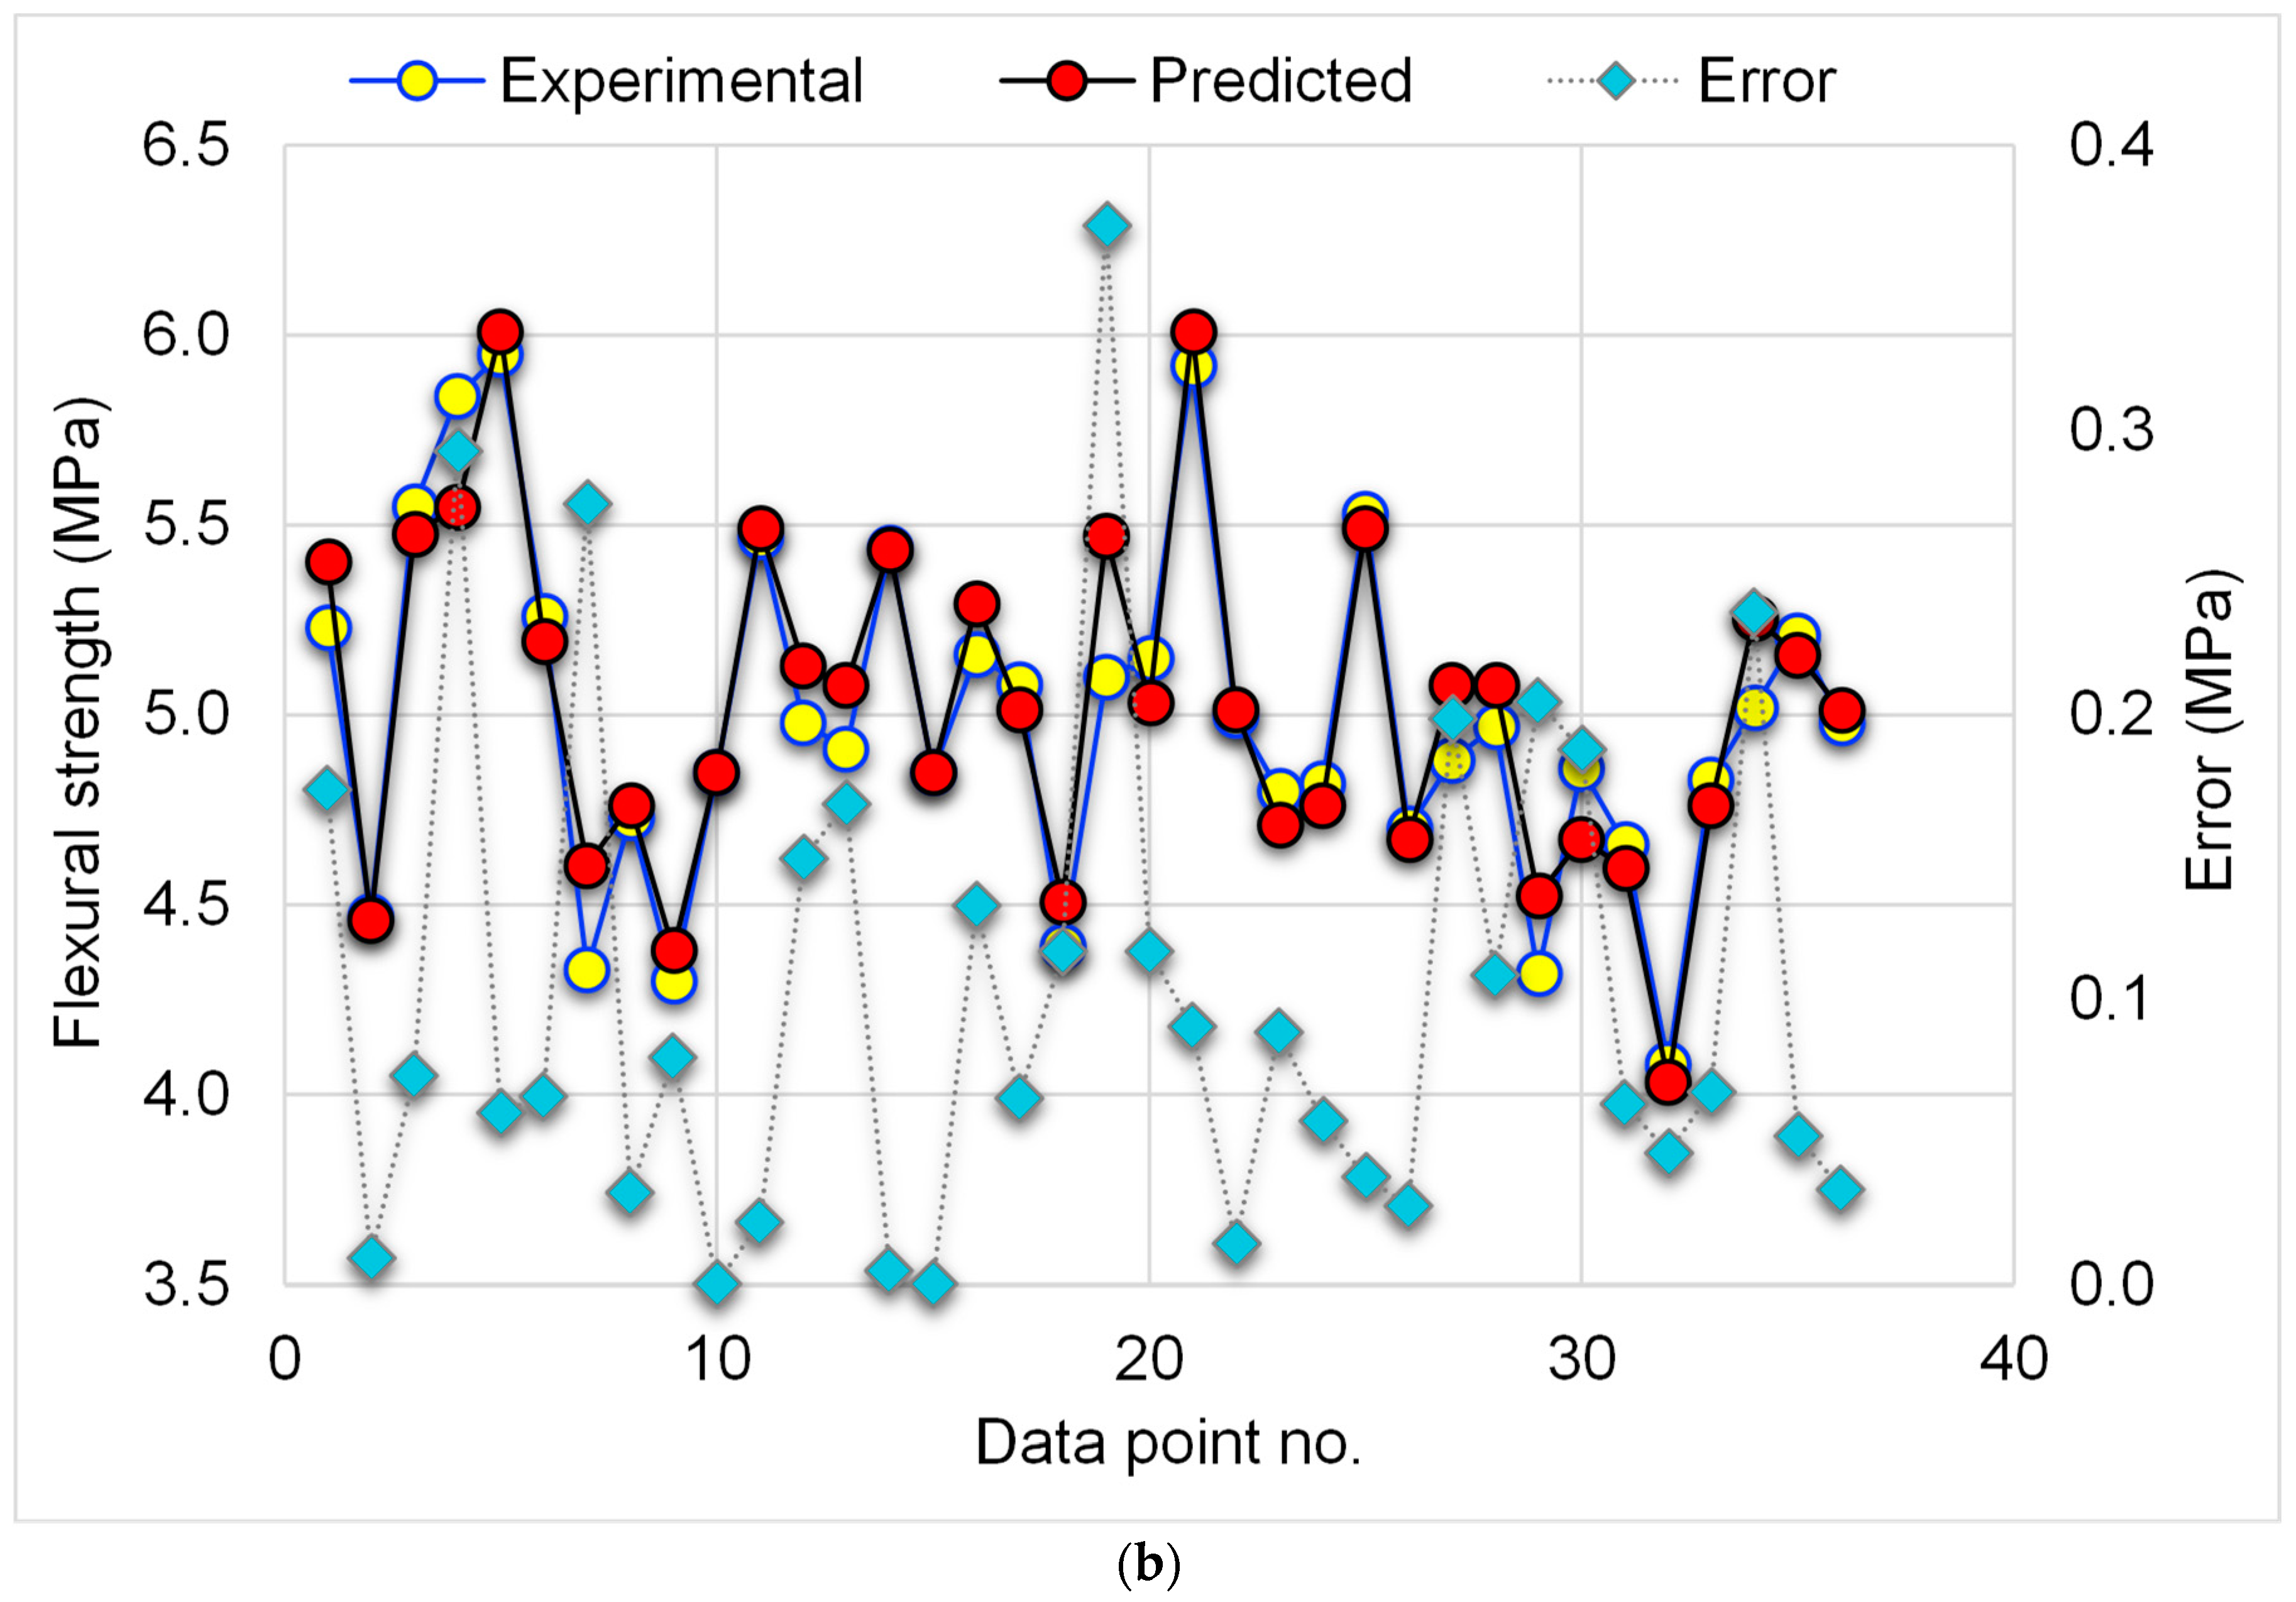
3.2.2. Random Forest Regressor Model
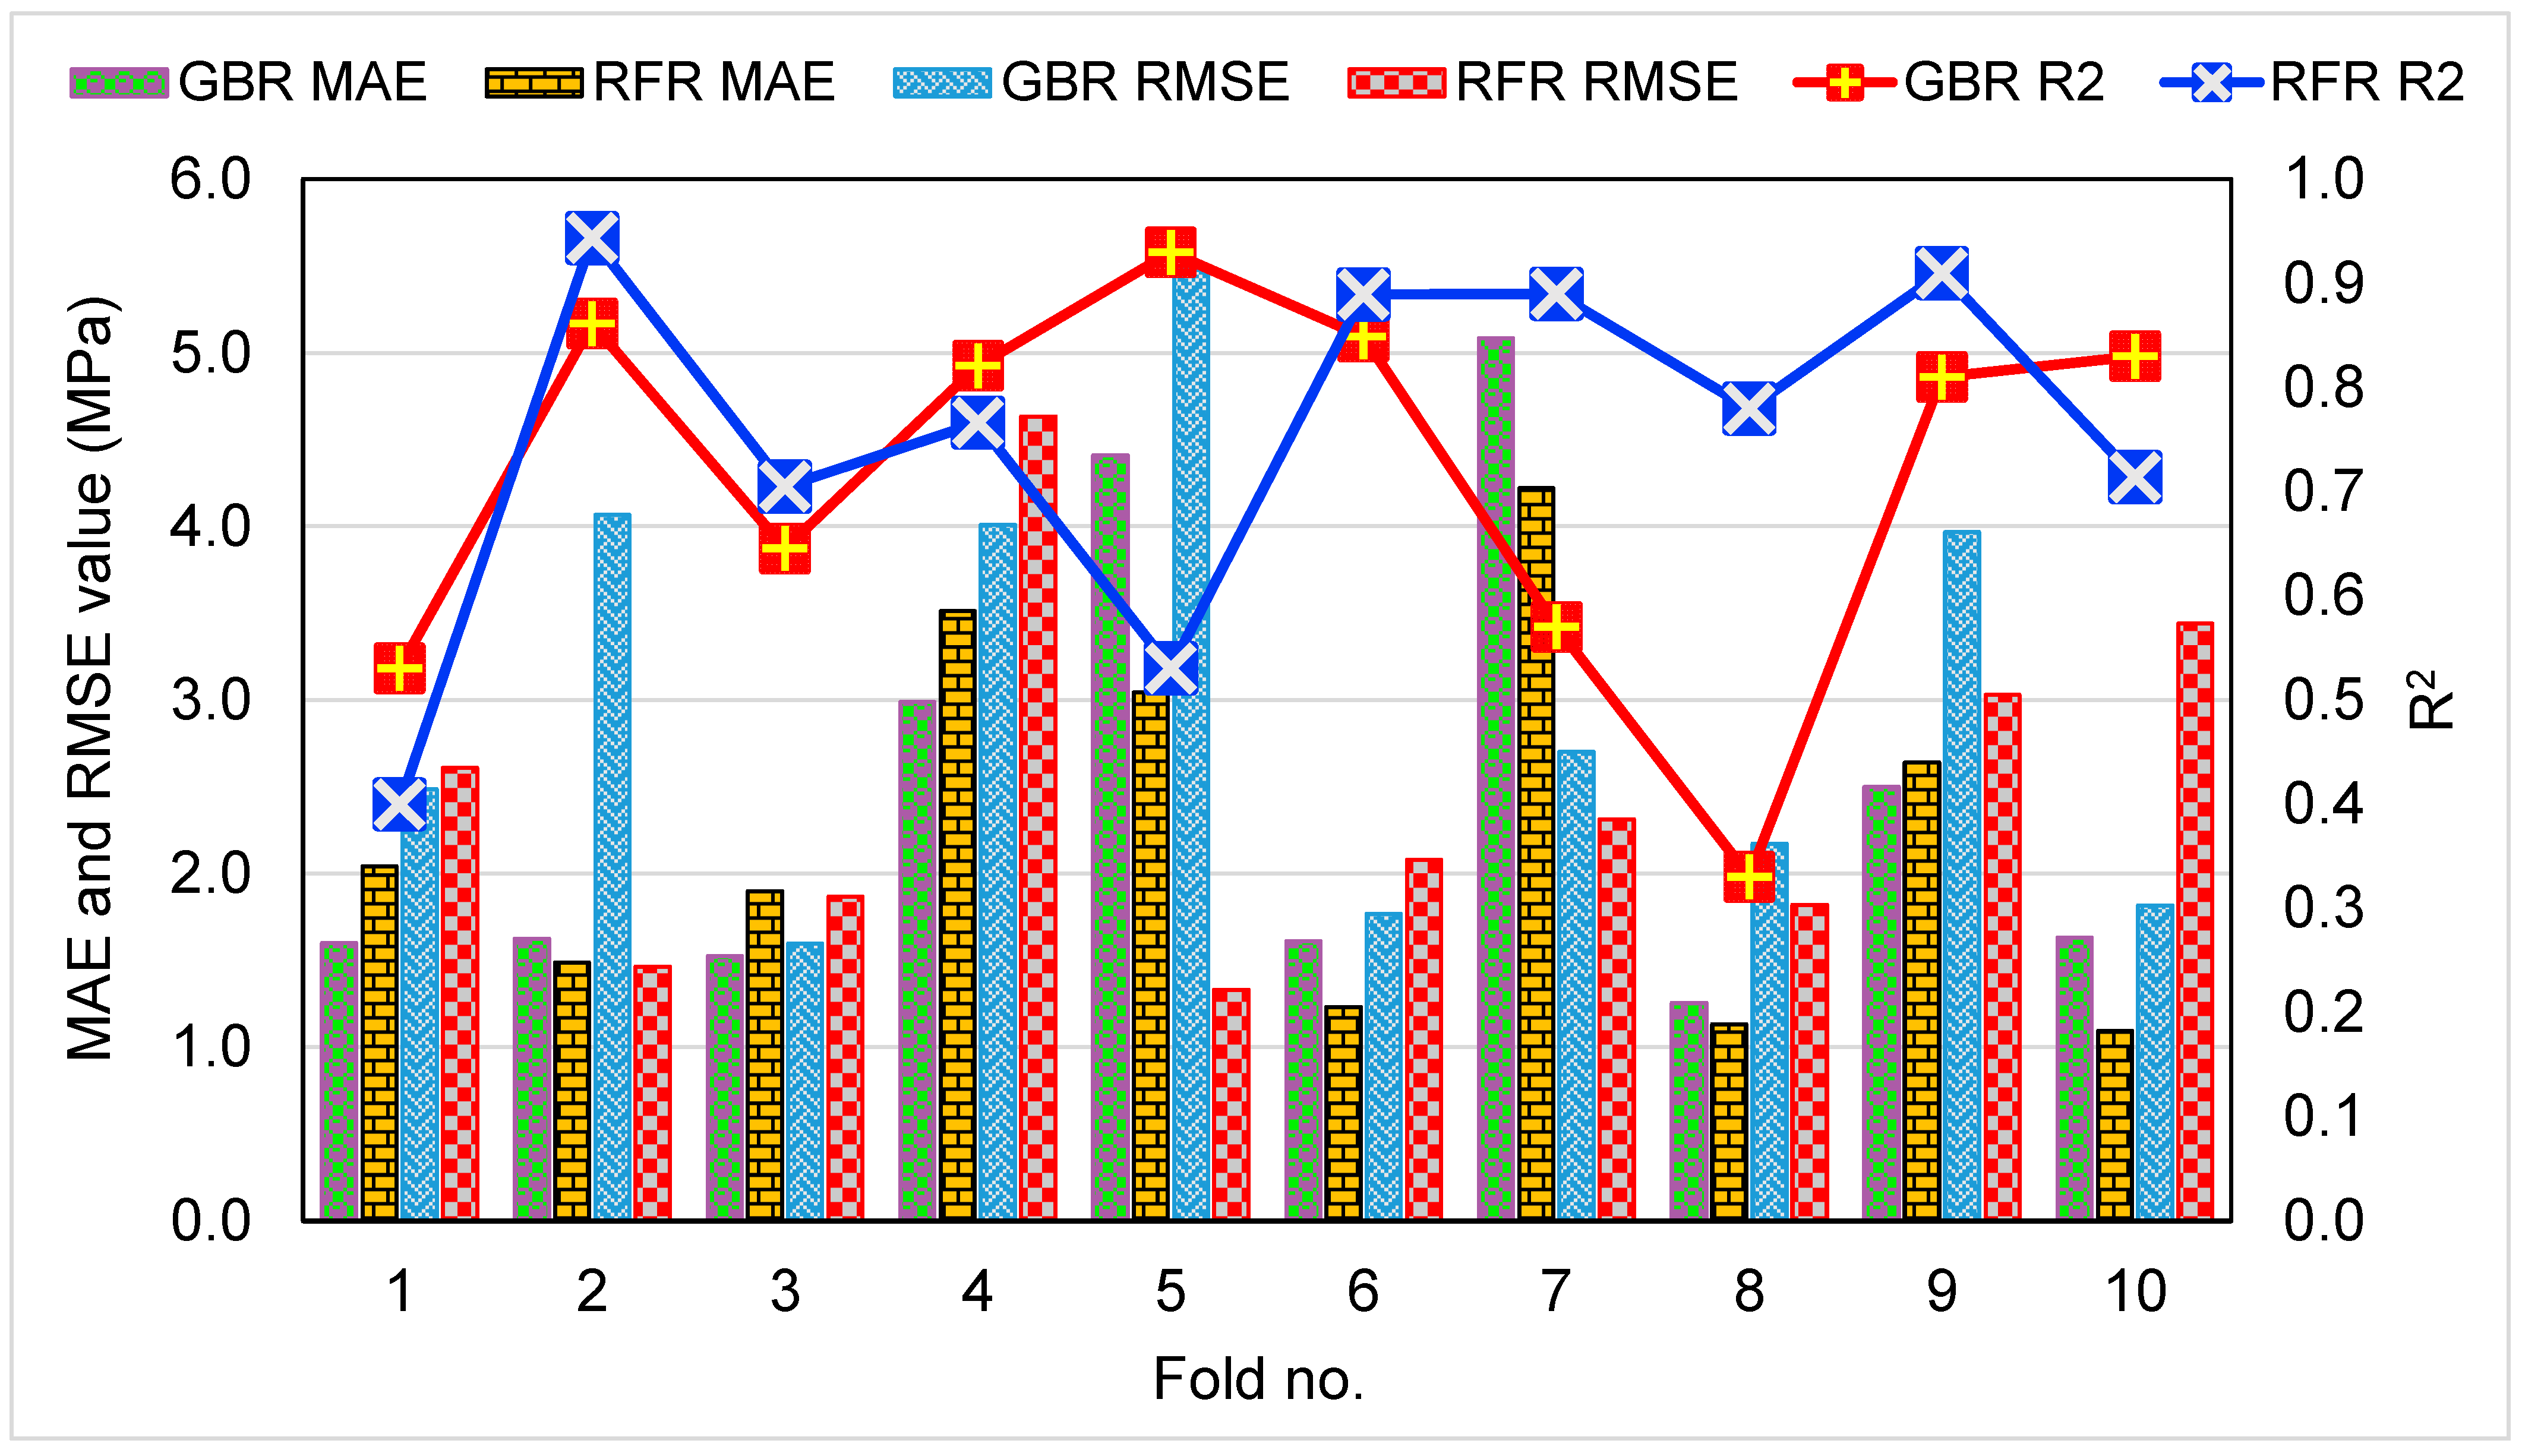
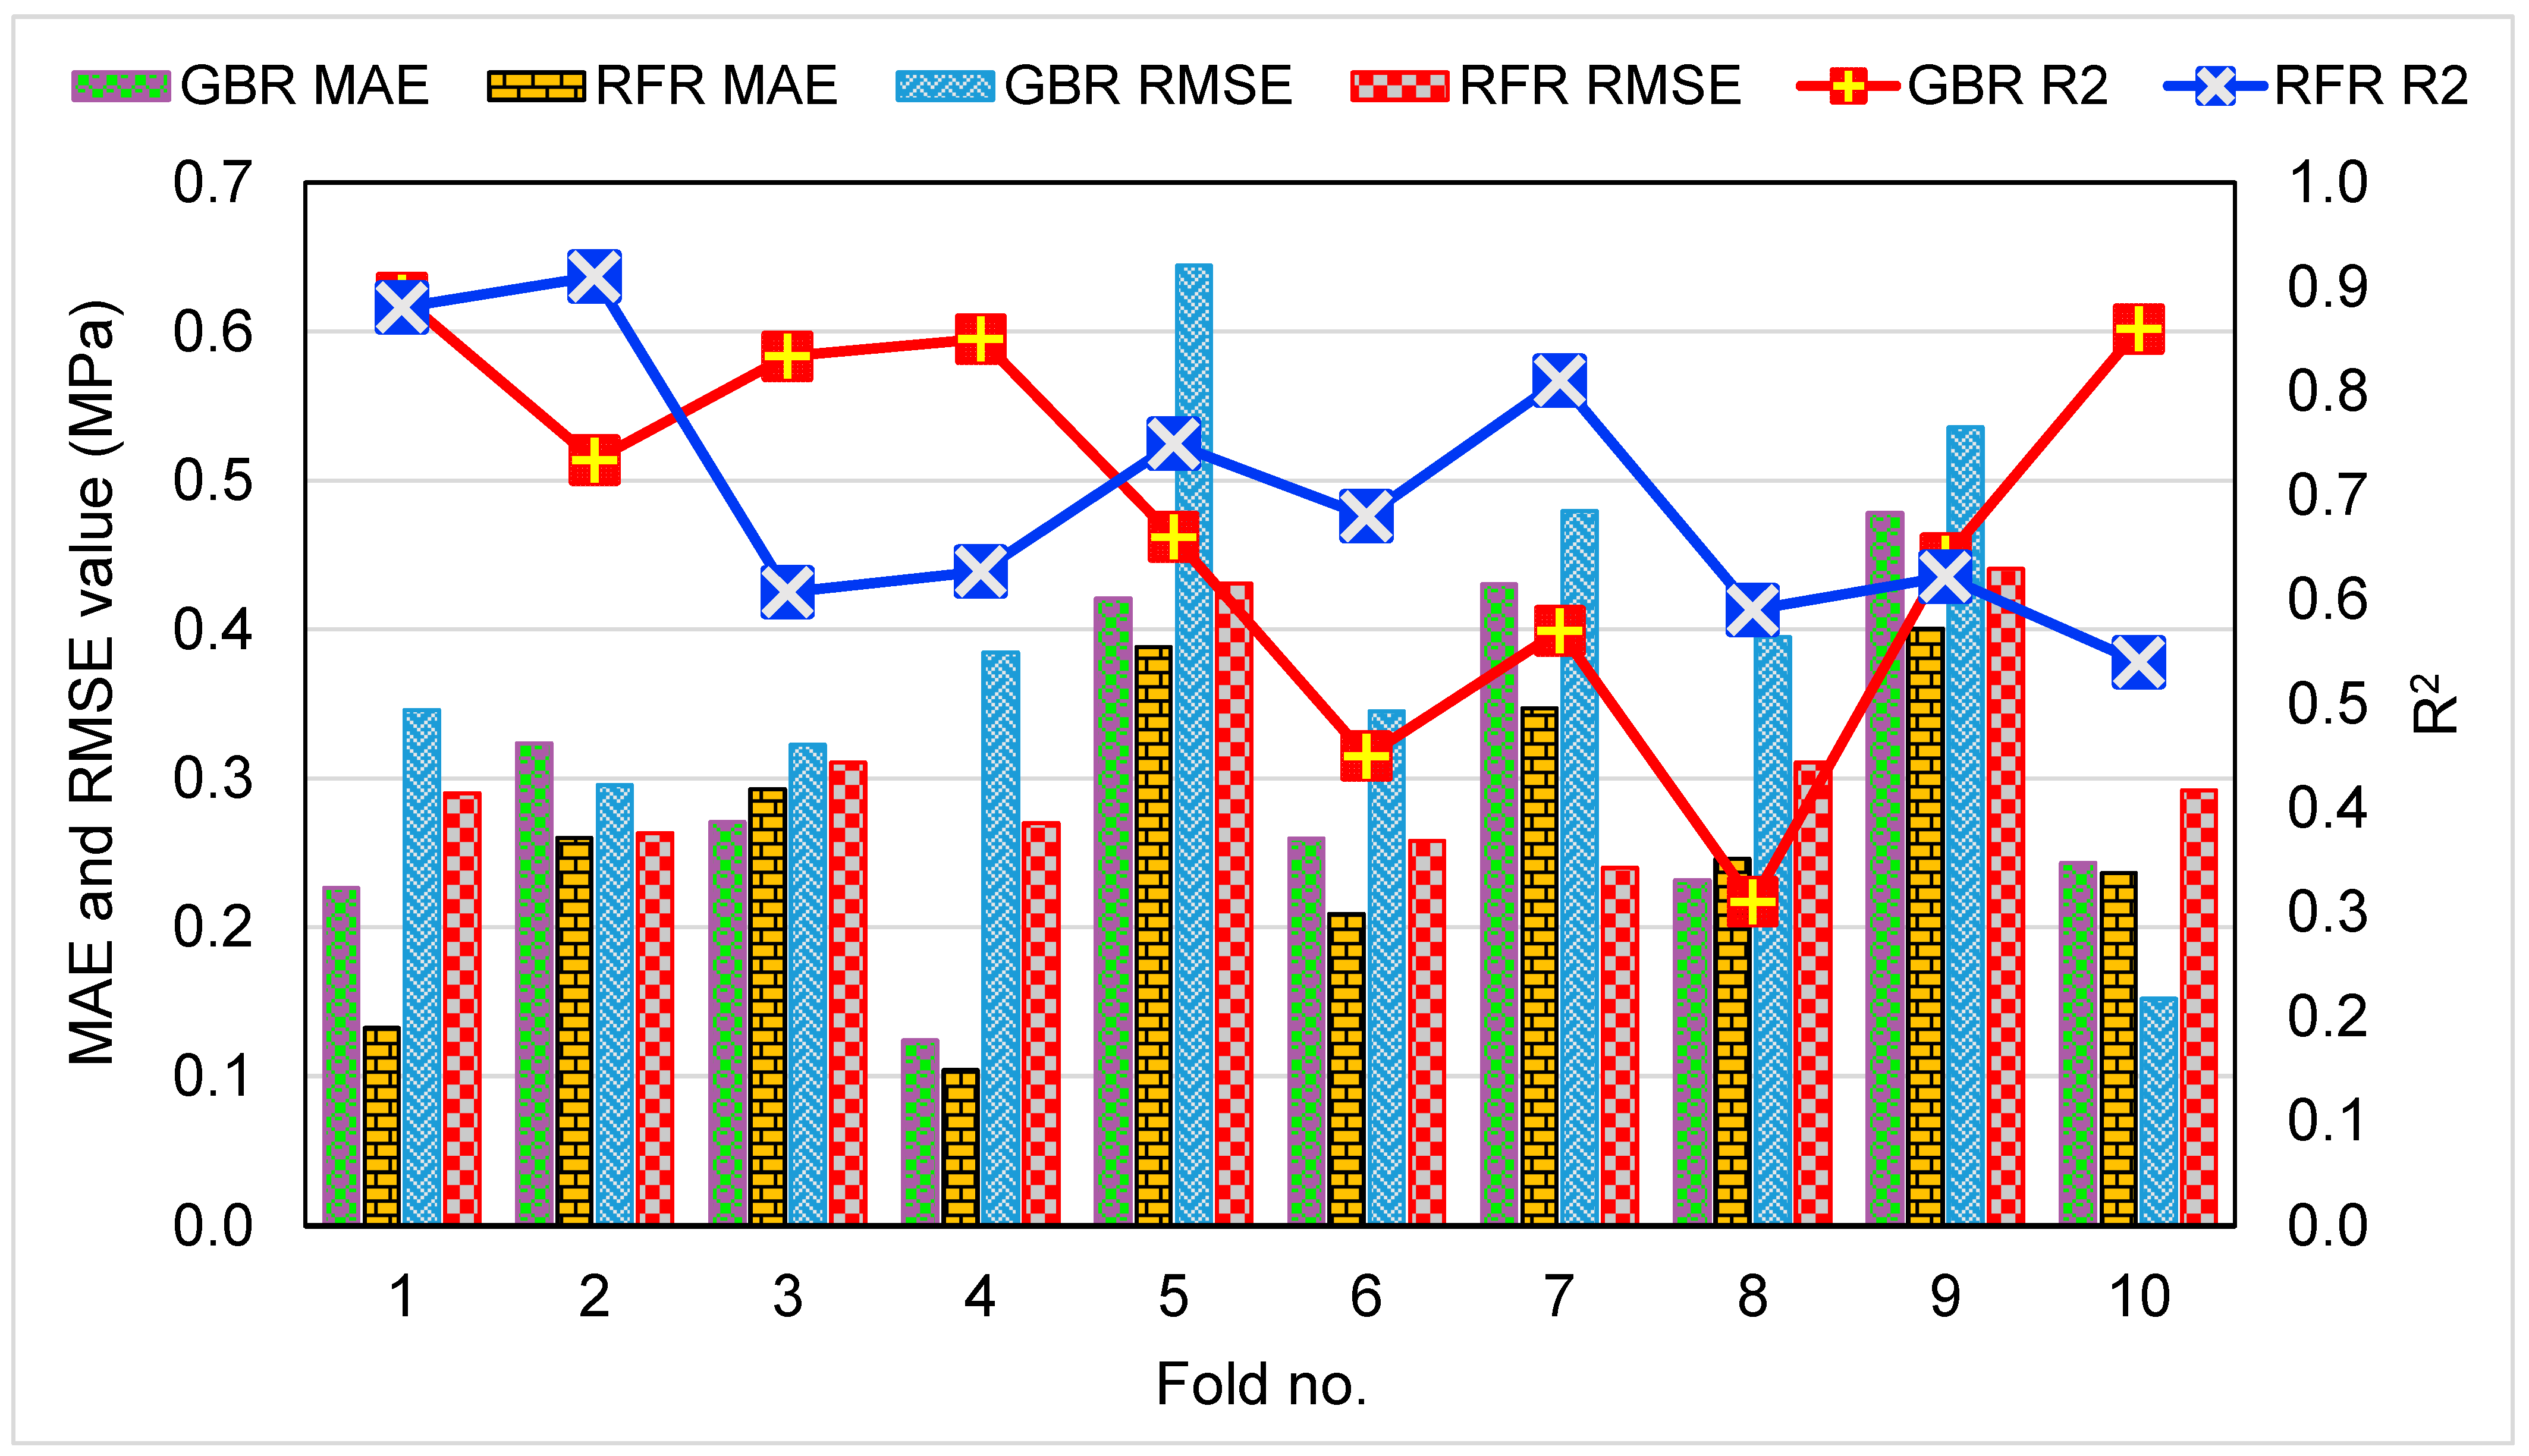
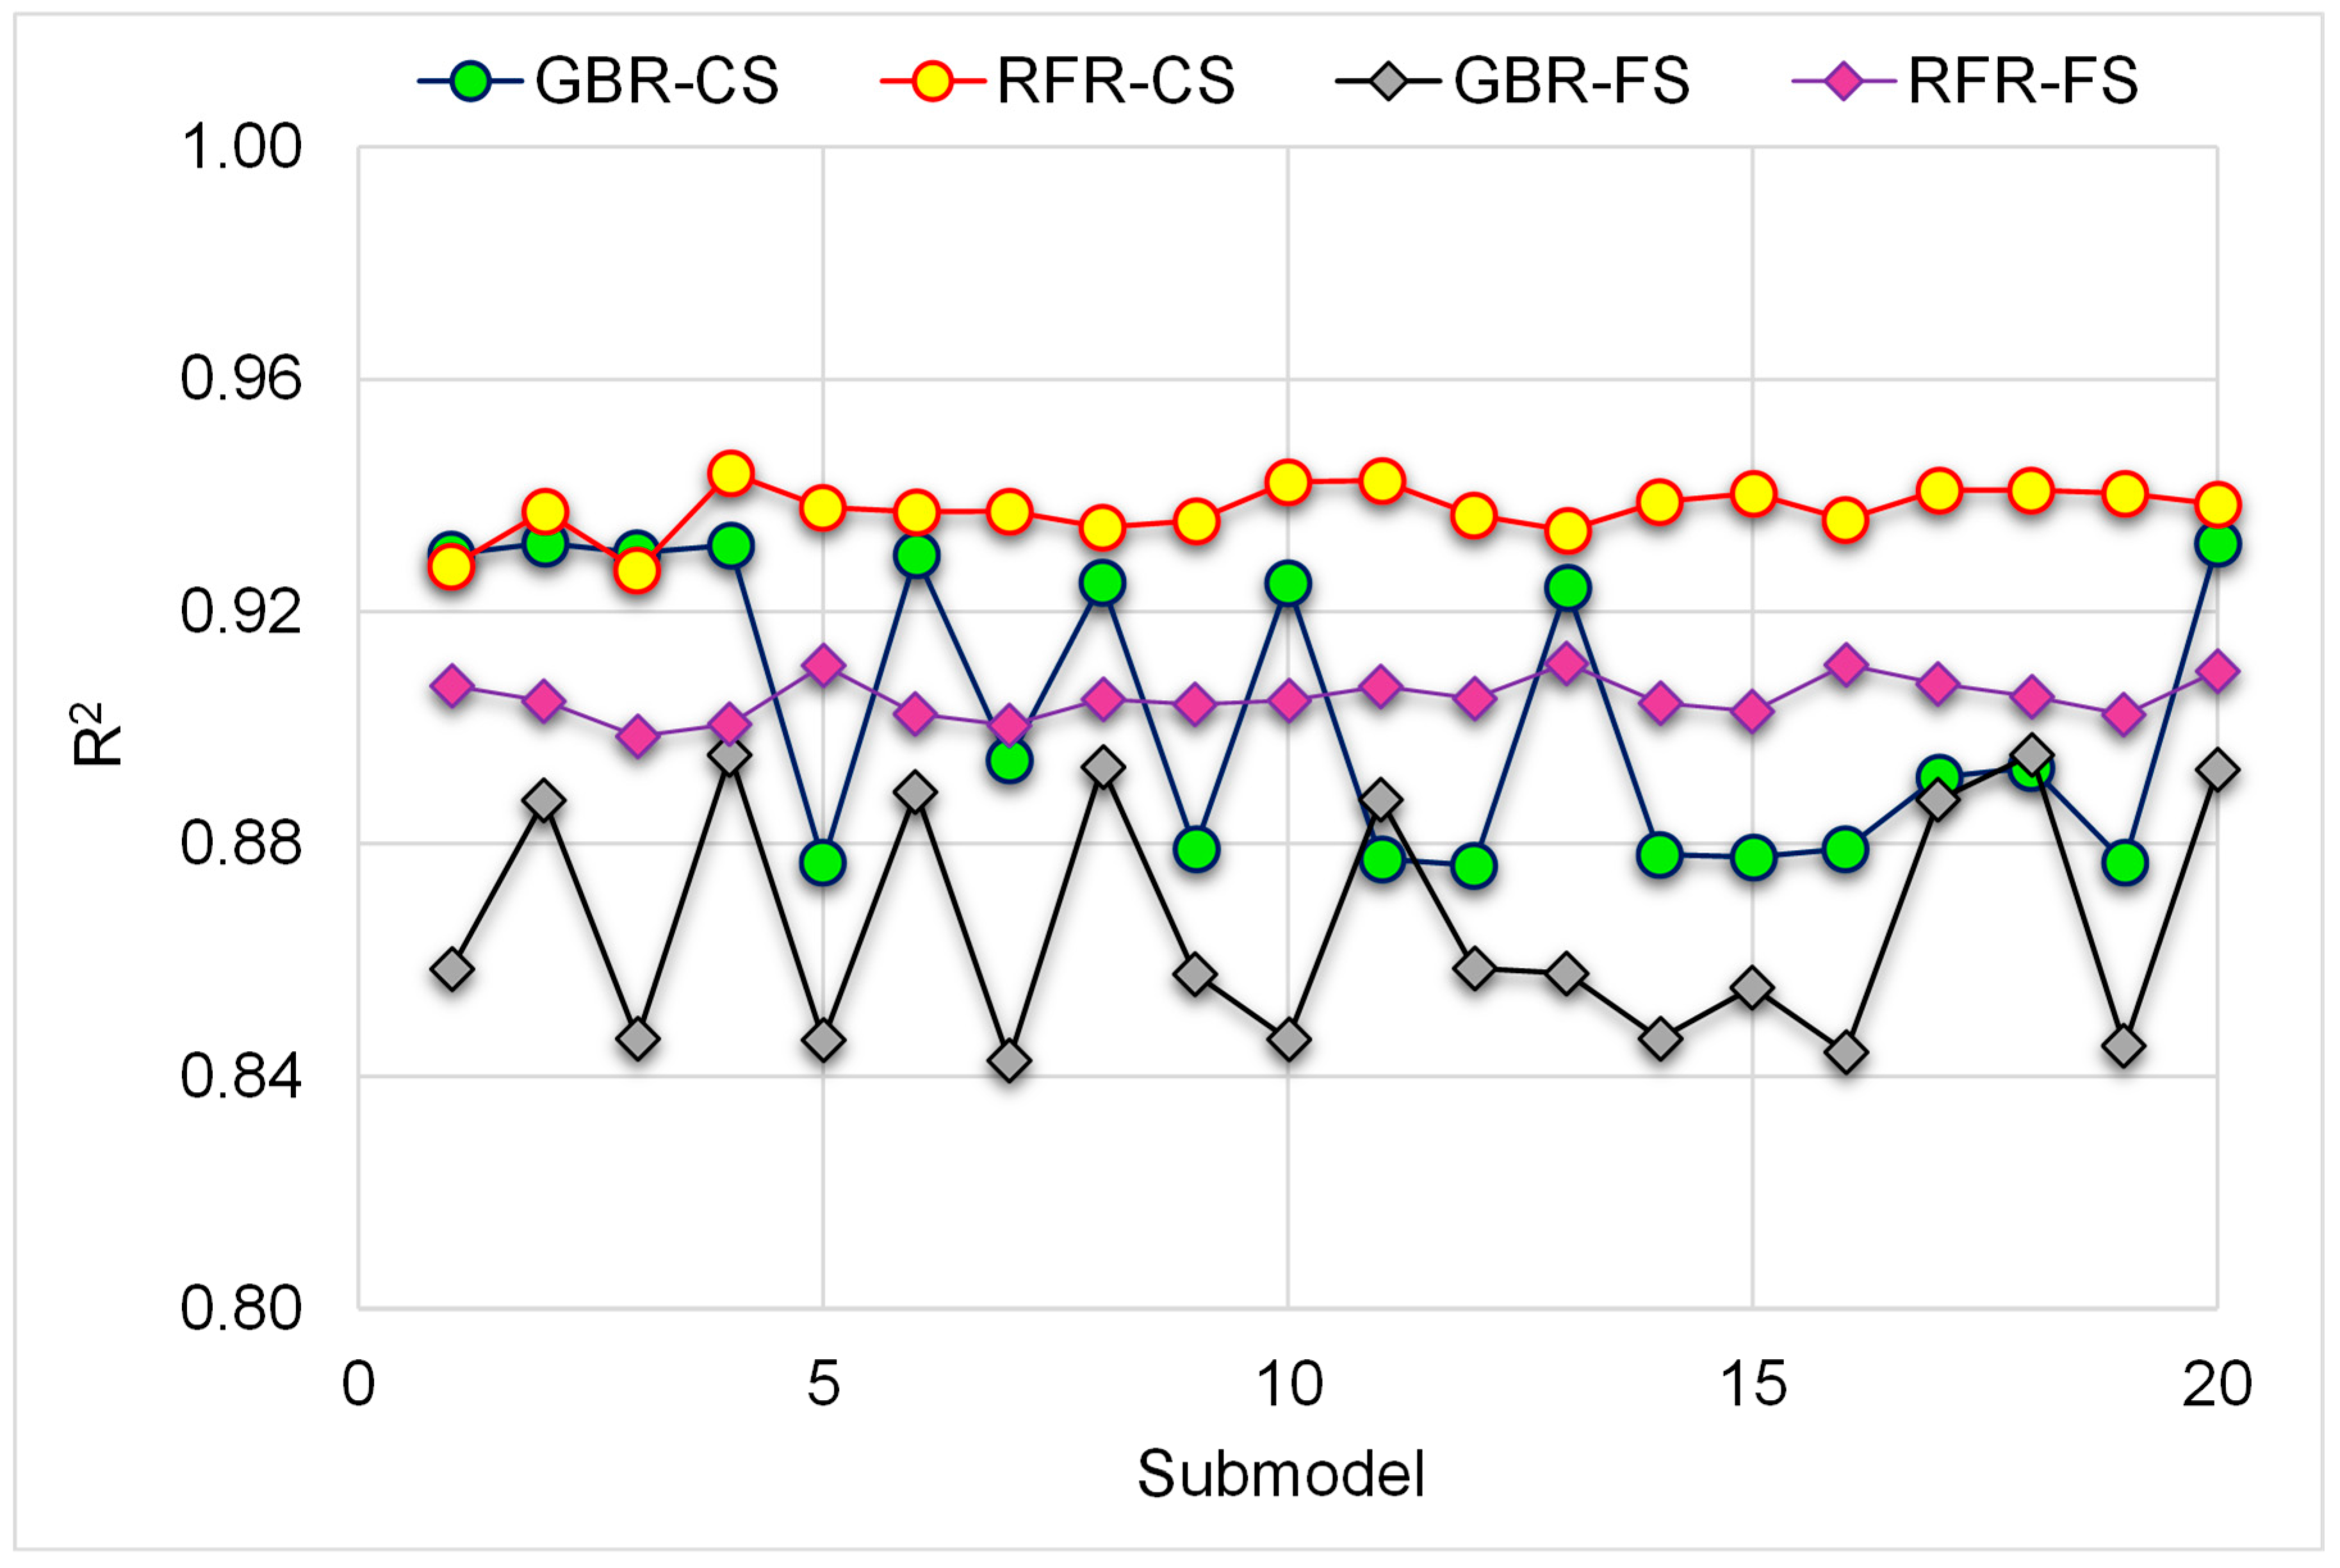
3.3. Validation of Machine Learning Models
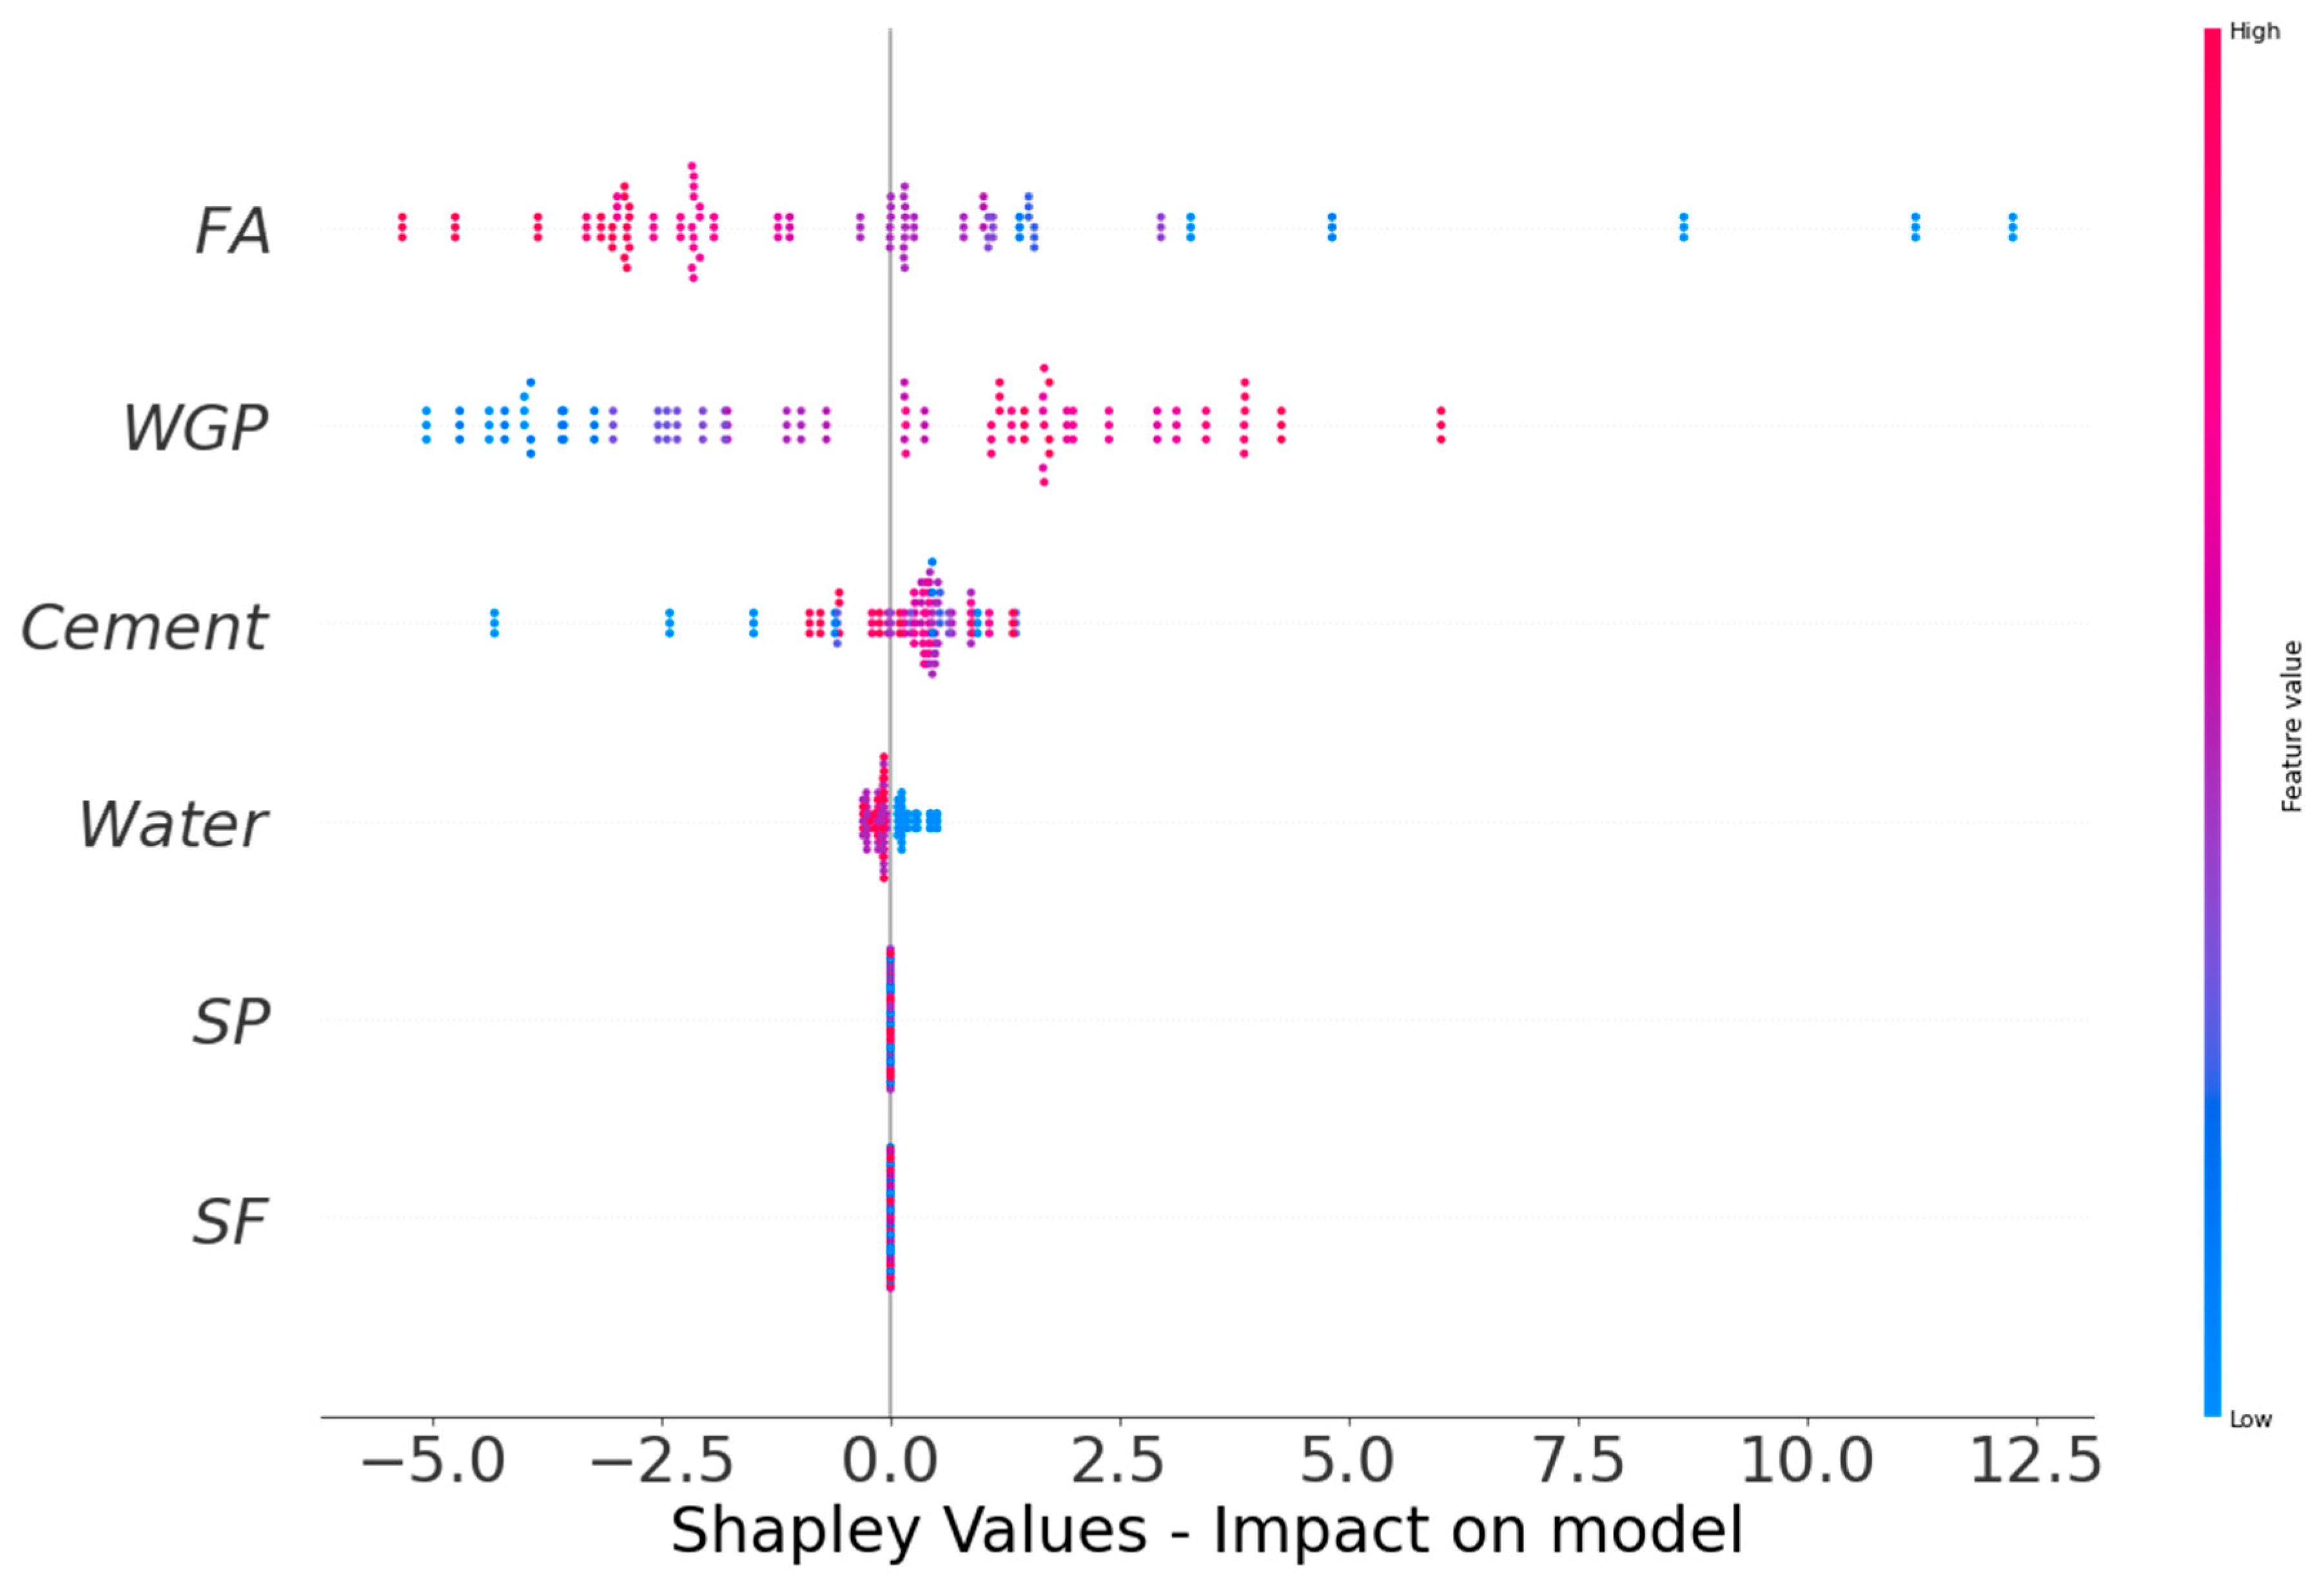
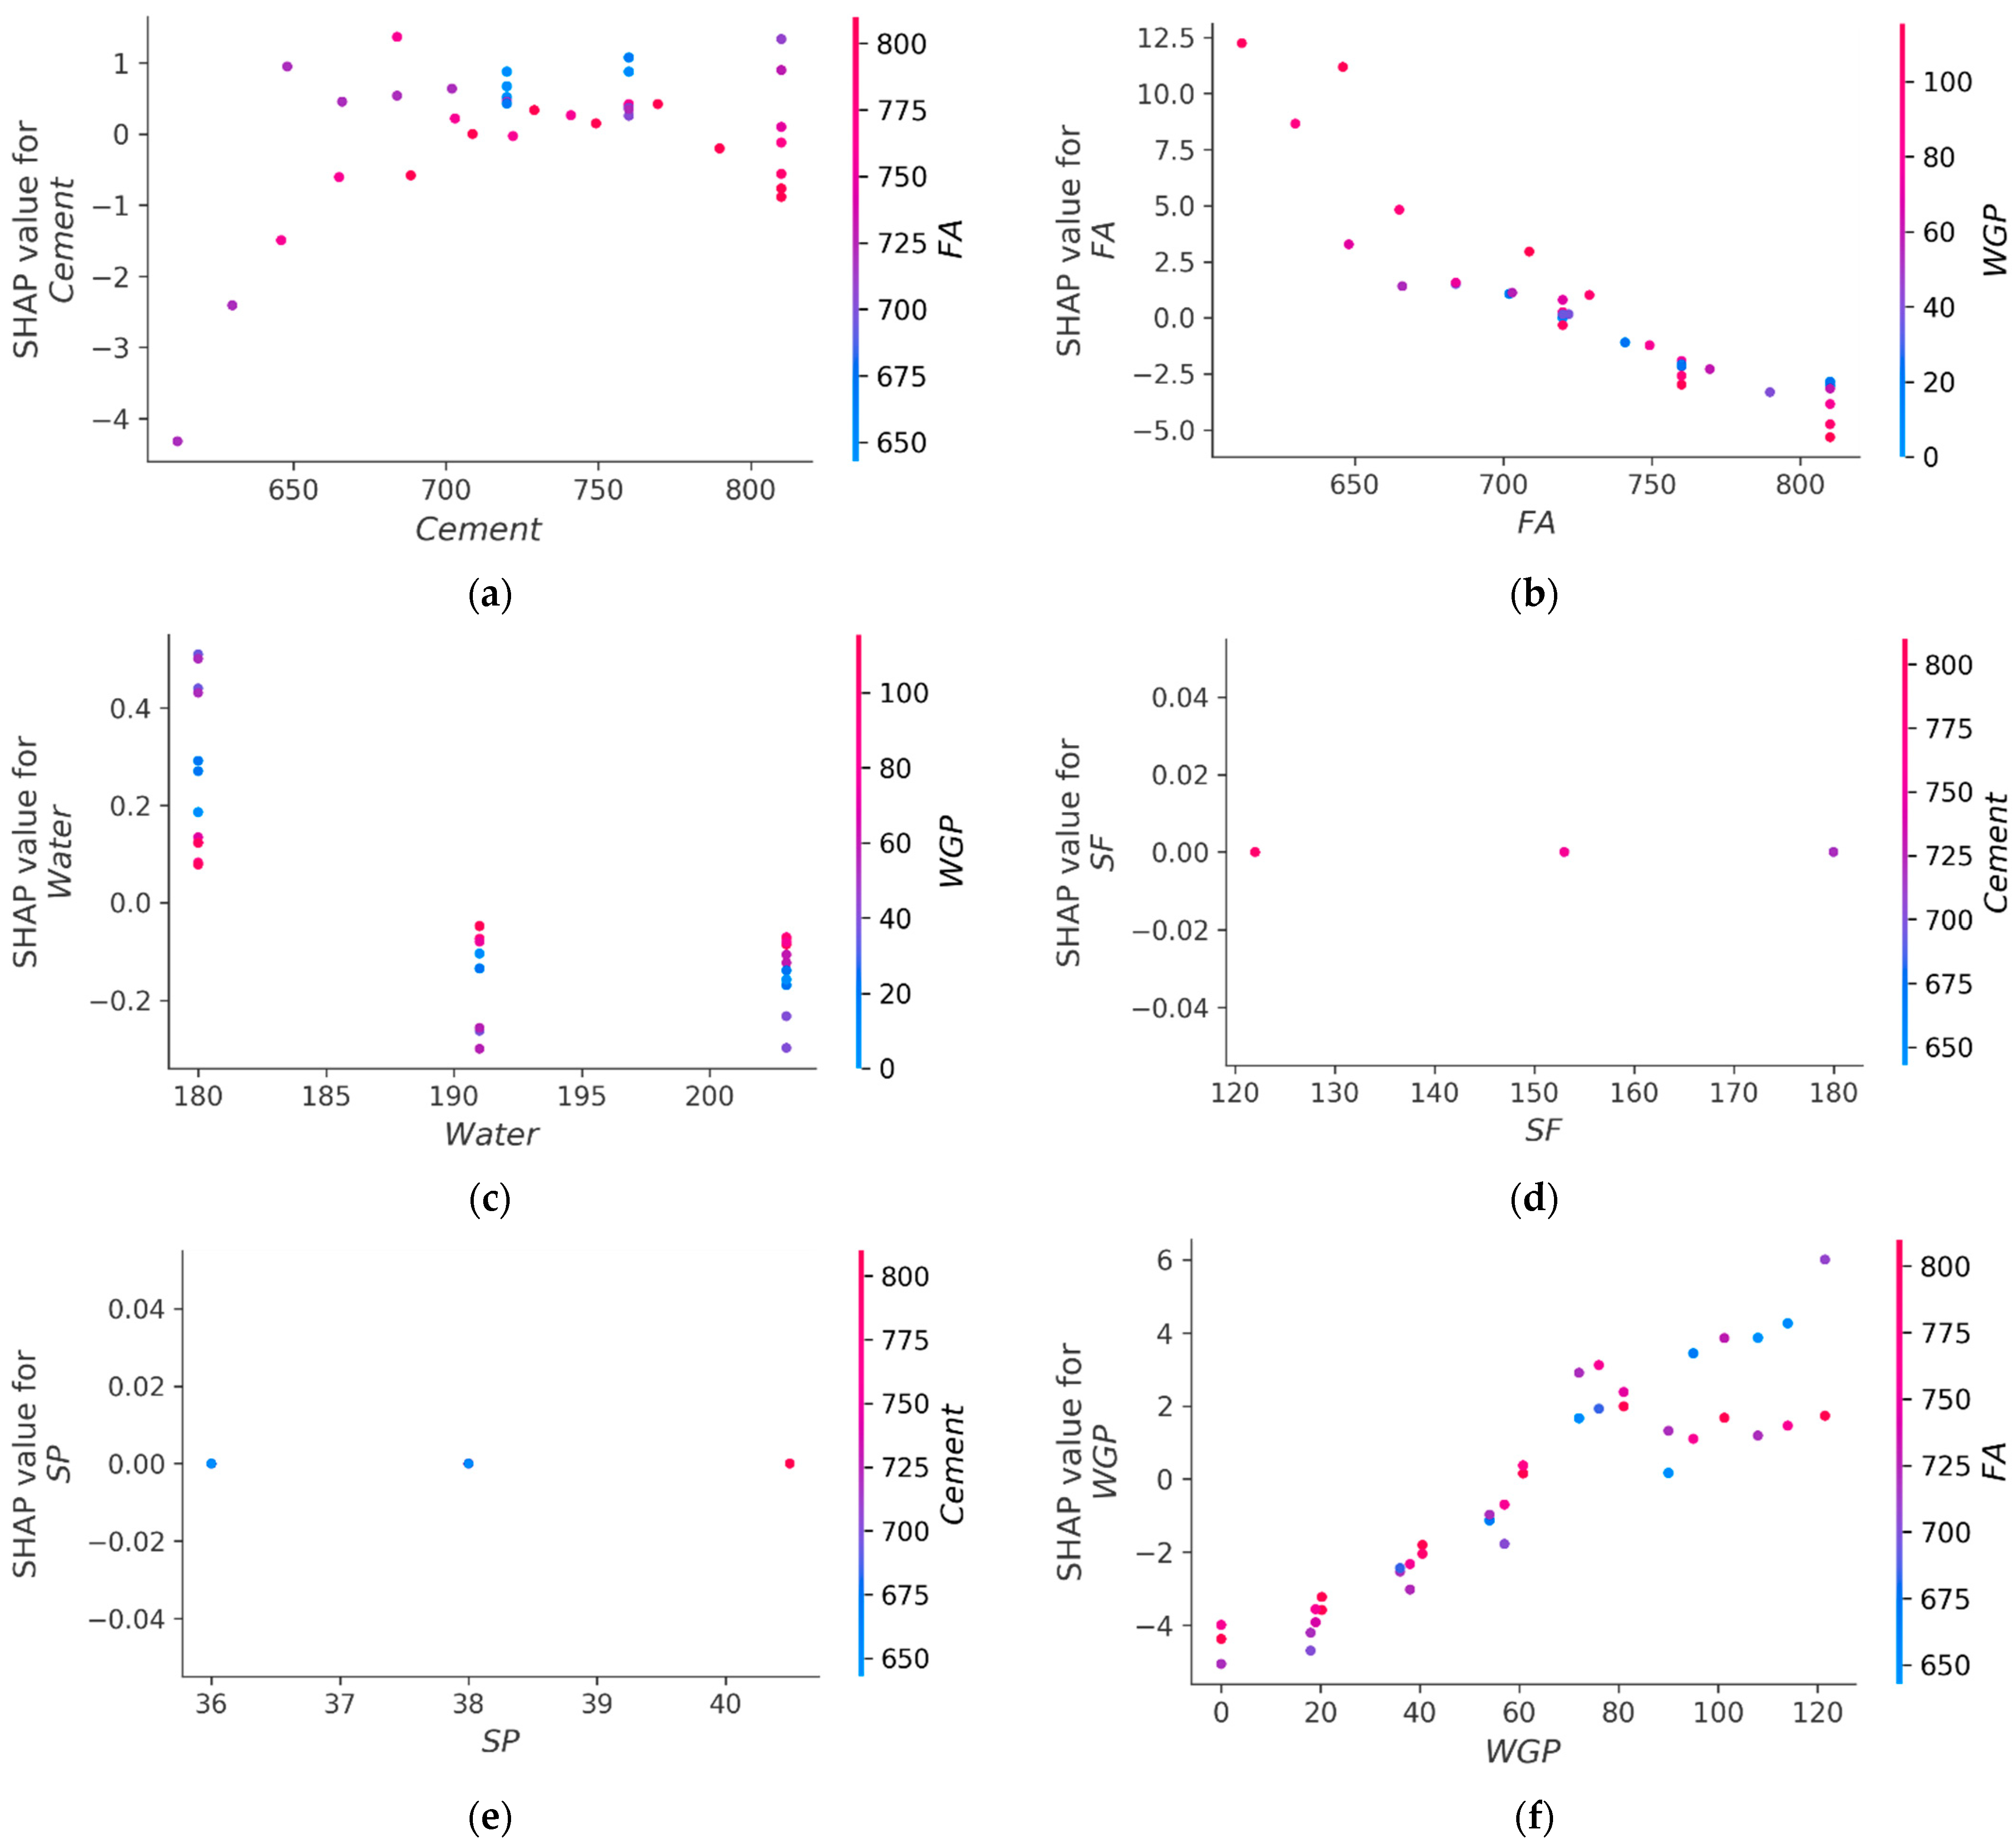
3.4. Impact of Raw Ingredients
4. Discussions
5. Conclusions
- It was determined from the modeling methods that the GBR models had a satisfactory degree of precision, with an R2 of 0.93 and 0.89 for CS and FS prediction, respectively, while the RFR models had a higher degree of precision, with an R2 of 0.94 and 0.91 for CS and FS prediction, respectively.
- The average variation between predicted and experimental CS (error) in GBR and RFR models was determined to be 1.25 MPa and 1.10 MPa, respectively. Similarly, the average error values in predicting the FS of CM in the GBR and RFR models were 0.12 MPa and 0.10 MPa, respectively. These errors also confirmed the acceptable precision of the RFR models and higher accuracy of the RFR models in forecasting the strength of WGP-based CM.
- The SHAP study revealed that fine aggregate (FA) was a crucial raw material, with a higher negative correlation to the material’s strength. WGP and cement had a stronger favorable impact on CM’s strength. Due to the deficiency of variance in silica fume (SF) and superplasticizer (SP) in the data set, the effect of SF and SP was unclear.
- New techniques, such as ML-based modeling and SHAP analysis, will aid the building industry by fostering the advancement of fast and economical ways of determining material properties and the impact of raw ingredients.
Author Contributions
Funding
Institutional Review Board Statement
Informed Consent Statement
Data Availability Statement
Acknowledgments
Conflicts of Interest
References
- Vigil de la Villa Mencía, R.; Frías, M.; Ramírez, S.M.; Carrasco, L.F.; Giménez, R.G. Concrete/Glass Construction and Demolition Waste (CDW) Synergies in Ternary Eco-Cement-Paste Mineralogy. Materials 2022, 15, 4661. [Google Scholar] [CrossRef] [PubMed]
- Kang, S.; Zhao, Y.; Wang, W.; Zhang, T.; Chen, T.; Yi, H.; Rao, F.; Song, S. Removal of methylene blue from water with montmorillonite nanosheets/chitosan hydrogels as adsorbent. Appl. Surf. Sci. 2018, 448, 203–211. [Google Scholar] [CrossRef]
- Wang, W.; Zhao, Y.; Bai, H.; Zhang, T.; Ibarra-Galvan, V.; Song, S. Methylene blue removal from water using the hydrogel beads of poly (vinyl alcohol)-sodium alginate-chitosan-montmorillonite. Carbohydr. Polym. 2018, 198, 518–528. [Google Scholar] [CrossRef] [PubMed]
- Ahmad, W.; Ahmad, A.; Ostrowski, K.A.; Aslam, F.; Joyklad, P. A scientometric review of waste material utilization in concrete for sustainable construction. Case Stud. Constr. Mater. 2021, 15, e00683. [Google Scholar] [CrossRef]
- Li, X.; Qin, D.; Hu, Y.; Ahmad, W.; Ahmad, A.; Aslam, F.; Joyklad, P. A systematic review of waste materials in cement-based composites for construction applications. J. Build. Eng. 2021, 45, 103447. [Google Scholar] [CrossRef]
- Alyousef, R.; Ahmad, W.; Ahmad, A.; Aslam, F.; Joyklad, P.; Alabduljabbar, H. Potential use of recycled plastic and rubber aggregate in cementitious materials for sustainable construction: A review. J. Clean. Prod. 2021, 329, 129736. [Google Scholar] [CrossRef]
- Khan, M.; Cao, M.; Xie, C.; Ali, M. Effectiveness of hybrid steel-basalt fiber reinforced concrete under compression. Case Stud. Constr. Mater. 2022, 16, e00941. [Google Scholar] [CrossRef]
- Khan, M.; Lao, J.; Dai, J.-G. Comparative study of advanced computational techniques for estimating the compressive strength of UHPC. J. Asian Concr. Fed. 2022, 8, 51–68. [Google Scholar] [CrossRef]
- Khan, M.; Cao, M.; Ai, H.; Hussain, A. Basalt Fibers in Modified Whisker Reinforced Cementitious Composites. Period. Polytech. Civ. Eng. 2022, 66, 344–354. [Google Scholar] [CrossRef]
- Khan, M.; Cao, M.; Hussain, A.; Chu, S.H. Effect of silica-fume content on performance of CaCO3 whisker and basalt fiber at matrix interface in cement-based composites. Constr. Build. Mater. 2021, 300, 124046. [Google Scholar] [CrossRef]
- Xie, C.; Cao, M.; Khan, M.; Yin, H.; Guan, J. Review on different testing methods and factors affecting fracture properties of fiber reinforced cementitious composites. Constr. Build. Mater. 2020, 273, 121766. [Google Scholar] [CrossRef]
- Asutkar, P.; Shinde, S.; Patel, R. Study on the behaviour of rubber aggregates concrete beams using analytical approach. Eng. Sci. Technol. Int. J. 2017, 20, 151–159. [Google Scholar] [CrossRef]
- Smarzewski, P.; Barnat-Hunek, D. Mechanical and durability related properties of high performance concrete made with coal cinder and waste foundry sand. Constr. Build. Mater. 2016, 121, 9–17. [Google Scholar] [CrossRef]
- Khan, M.; Ali, M. Effect of super plasticizer on the properties of medium strength concrete prepared with coconut fiber. Constr. Build. Mater. 2018, 182, 703–715. [Google Scholar] [CrossRef]
- Khan, M.; Rehman, A.; Ali, M. Efficiency of silica-fume content in plain and natural fiber reinforced concrete for concrete road. Constr. Build. Mater. 2020, 244, 118382. [Google Scholar] [CrossRef]
- Bueno, E.T.; Paris, J.M.; Clavier, K.A.; Spreadbury, C.; Ferraro, C.C.; Townsend, T.G. A review of ground waste glass as a supplementary cementitious material: A focus on alkali-silica reaction. J. Clean. Prod. 2020, 257, 120180. [Google Scholar] [CrossRef]
- Li, G.; Zhou, C.; Ahmad, W.; Usanova, K.I.; Karelina, M.; Mohamed, A.M.; Khallaf, R. Fly Ash Application as Supplementary Cementitious Material: A Review. Materials 2022, 15, 2664. [Google Scholar] [CrossRef] [PubMed]
- Zhang, B.; Ahmad, W.; Ahmad, A.; Aslam, F.; Joyklad, P. A scientometric analysis approach to analyze the present research on recycled aggregate concrete. J. Build. Eng. 2022, 46, 103679. [Google Scholar] [CrossRef]
- Amin, M.N.; Ahmad, W.; Khan, K.; Sayed, M.M. Mapping Research Knowledge on Rice Husk Ash Application in Concrete: A Scientometric Review. Materials 2022, 15, 3431. [Google Scholar] [CrossRef] [PubMed]
- He, Z.-H.; Han, X.-D.; Zhang, M.-Y.; Yuan, Q.; Shi, J.-Y.; Zhan, P.-M. A novel development of green UHPC containing waste concrete powder derived from construction and demolition waste. Powder Technol. 2022, 398, 117075. [Google Scholar] [CrossRef]
- Jain, K.L.; Sancheti, G.; Gupta, L.K. Durability performance of waste granite and glass powder added concrete. Constr. Build. Mater. 2020, 252, 119075. [Google Scholar] [CrossRef]
- Martínez-Barrera, G.; del Coz-Díaz, J.J.; Álvarez-Rabanal, F.P.; Gayarre, F.L.; Martínez-López, M.; Cruz-Olivares, J. Waste tire rubber particles modified by gamma radiation and their use as modifiers of concrete. Case Stud. Constr. Mater. 2020, 12, e00321. [Google Scholar] [CrossRef]
- Qin, D.; Hu, Y.; Li, X. Waste Glass Utilization in Cement-Based Materials for Sustainable Construction: A Review. Crystals 2021, 11, 710. [Google Scholar] [CrossRef]
- Ahmad, W.; Ahmad, A.; Ostrowski, K.A.; Aslam, F.; Joyklad, P.; Zajdel, P. Sustainable approach of using sugarcane bagasse ash in cement-based composites: A systematic review. Case Stud. Constr. Mater. 2021, 15, e00698. [Google Scholar] [CrossRef]
- Meena, A.; Singh, R. Comparative Study of Waste Glass Powder as Pozzolanic Material in Concrete; National Institute of Technology: Rourkela, India, 2012. [Google Scholar]
- Pant, D.; Singh, P. Pollution due to hazardous glass waste. Environ. Sci. Pollut. Res. 2014, 21, 2414–2436. [Google Scholar] [CrossRef] [PubMed]
- Singh, N.; Li, J.; Zeng, X. Solutions and challenges in recycling waste cathode-ray tubes. J. Clean. Prod. 2016, 133, 188–200. [Google Scholar] [CrossRef]
- Federico, L.; Chidiac, S. Waste glass as a supplementary cementitious material in concrete-critical review of treatment methods. Cem. Concr. Compos. 2009, 31, 606–610. [Google Scholar] [CrossRef]
- Mohajerani, A.; Vajna, J.; Cheung, T.H.H.; Kurmus, H.; Arulrajah, A.; Horpibulsuk, S. Practical recycling applications of crushed waste glass in construction materials: A review. Constr. Build. Mater. 2017, 156, 443–467. [Google Scholar] [CrossRef]
- Paul, S.C.; Šavija, B.; Babafemi, A.J. A comprehensive review on mechanical and durability properties of cement-based materials containing waste recycled glass. J. Clean. Prod. 2018, 198, 891–906. [Google Scholar] [CrossRef]
- Sudharsan, N.; Palanisamy, T.; Yaragal, S.C. Environmental sustainability of waste glass as a valuable construction material-A critical review. Ecol. Environ. Conserv. 2018, 24, S331–S338. [Google Scholar]
- Jiang, Y.; Ling, T.-C.; Mo, K.H.; Shi, C. A critical review of waste glass powder—Multiple roles of utilization in cement-based materials and construction products. J. Environ. Manag. 2019, 242, 440–449. [Google Scholar] [CrossRef] [PubMed]
- Singh, N.; Kumar, P.; Goyal, P. Reviewing the behaviour of high volume fly ash based self compacting concrete. J. Build. Eng. 2019, 26, 100882. [Google Scholar] [CrossRef]
- Meisuh, B.K.; Kankam, C.K.; Buabin, T.K. Effect of quarry rock dust on the flexural strength of concrete. Case Stud. Constr. Mater. 2018, 8, 16–22. [Google Scholar] [CrossRef]
- Awoyera, P.O. Nonlinear finite element analysis of steel fibre-reinforced concrete beam under static loading. J. Eng. Sci. Technol. 2016, 11, 1669–1677. [Google Scholar]
- Cao, M.; Mao, Y.; Khan, M.; Si, W.; Shen, S. Different testing methods for assessing the synthetic fiber distribution in cement-based composites. Constr. Build. Mater. 2018, 184, 128–142. [Google Scholar] [CrossRef]
- Sadrmomtazi, A.; Sobhani, J.; Mirgozar, M.A. Modeling compressive strength of EPS lightweight concrete using regression, neural network and ANFIS. Constr. Build. Mater. 2013, 42, 205–216. [Google Scholar] [CrossRef]
- Ilyas, I.; Zafar, A.; Afzal, M.T.; Javed, M.F.; Alrowais, R.; Althoey, F.; Mohamed, A.M.; Mohamed, A.; Vatin, N.I. Advanced Machine Learning Modeling Approach for Prediction of Compressive Strength of FRP Confined Concrete Using Multiphysics Genetic Expression Programming. Polymers 2022, 14, 1789. [Google Scholar] [CrossRef]
- Nafees, A.; Khan, S.; Javed, M.F.; Alrowais, R.; Mohamed, A.M.; Mohamed, A.; Vatin, N.I. Forecasting the Mechanical Properties of Plastic Concrete Employing Experimental Data Using Machine Learning Algorithms: DT, MLPNN, SVM, and RF. Polymers 2022, 14, 1583. [Google Scholar] [CrossRef]
- Nafees, A.; Amin, M.N.; Khan, K.; Nazir, K.; Ali, M.; Javed, M.F.; Aslam, F.; Musarat, M.A.; Vatin, N.I. Modeling of Mechanical Properties of Silica Fume-Based Green Concrete Using Machine Learning Techniques. Polymers 2022, 14, 30. [Google Scholar] [CrossRef]
- Khan, K.; Ahmad, A.; Amin, M.N.; Ahmad, W.; Nazar, S.; Arab, A.M.A. Comparative Study of Experimental and Modeling of Fly Ash-Based Concrete. Materials 2022, 15, 3762. [Google Scholar] [CrossRef]
- Nafees, A.; Javed, M.F.; Khan, S.; Nazir, K.; Farooq, F.; Aslam, F.; Musarat, M.A.; Vatin, N.I. Predictive Modeling of Mechanical Properties of Silica Fume-Based Green Concrete Using Artificial Intelligence Approaches: MLPNN, ANFIS, and GEP. Materials 2021, 14, 7531. [Google Scholar] [CrossRef] [PubMed]
- Shang, M.; Li, H.; Ahmad, A.; Ahmad, W.; Ostrowski, K.A.; Aslam, F.; Joyklad, P.; Majka, T.M. Predicting the Mechanical Properties of RCA-Based Concrete Using Supervised Machine Learning Algorithms. Materials 2022, 15, 647. [Google Scholar] [CrossRef] [PubMed]
- Shafabakhsh, G.H.; Ani, O.J.; Talebsafa, M. Artificial neural network modeling (ANN) for predicting rutting performance of nano-modified hot-mix asphalt mixtures containing steel slag aggregates. Constr. Build. Mater. 2015, 85, 136–143. [Google Scholar] [CrossRef]
- Khan, K.; Ahmad, W.; Amin, M.N.; Aslam, F.; Ahmad, A.; Al-Faiad, M.A. Comparison of Prediction Models Based on Machine Learning for the Compressive Strength Estimation of Recycled Aggregate Concrete. Materials 2022, 15, 3430. [Google Scholar] [CrossRef]
- Sharma, N.; Thakur, M.S.; Sihag, P.; Malik, M.A.; Kumar, R.; Abbas, M.; Saleel, C.A. Machine Learning Techniques for Evaluating Concrete Strength with Waste Marble Powder. Materials 2022, 15, 5811. [Google Scholar] [CrossRef]
- Shah, H.A.; Yuan, Q.; Akmal, U.; Shah, S.A.; Salmi, A.; Awad, Y.A.; Shah, L.A.; Iftikhar, Y.; Javed, M.H.; Khan, M.I. Application of Machine Learning Techniques for Predicting Compressive, Splitting Tensile, and Flexural Strengths of Concrete with Metakaolin. Materials 2022, 15, 5435. [Google Scholar] [CrossRef]
- Qi, C.; Huang, B.; Wu, M.; Wang, K.; Yang, S.; Li, G. Concrete Strength Prediction Using Different Machine Learning Processes: Effect of Slag, Fly Ash and Superplasticizer. Materials 2022, 15, 5369. [Google Scholar] [CrossRef]
- Khan, K.; Ahmad, W.; Amin, M.N.; Ahmad, A.; Nazar, S.; Alabdullah, A.A. Compressive Strength Estimation of Steel-Fiber-Reinforced Concrete and Raw Material Interactions Using Advanced Algorithms. Polymers 2022, 14, 3065. [Google Scholar] [CrossRef]
- Song, H.; Ahmad, A.; Farooq, F.; Ostrowski, K.A.; Maślak, M.; Czarnecki, S.; Aslam, F. Predicting the compressive strength of concrete with fly ash admixture using machine learning algorithms. Constr. Build. Mater. 2021, 308, 125021. [Google Scholar] [CrossRef]
- Sufian, M.; Ullah, S.; Ostrowski, K.A.; Ahmad, A.; Zia, A.; Śliwa-Wieczorek, K.; Siddiq, M.; Awan, A.A. An Experimental and Empirical Study on the Use of Waste Marble Powder in Construction Material. Materials 2021, 14, 3829. [Google Scholar] [CrossRef]
- Song, Y.-Y.; Ying, L.U. Decision tree methods: Applications for classification and prediction. Shanghai Arch. Psychiatry 2015, 27, 130. [Google Scholar] [PubMed]
- Hillebrand, E.; Medeiros, M.C. The benefits of bagging for forecast models of realized volatility. Econom. Rev. 2010, 29, 571–593. [Google Scholar] [CrossRef]
- Ahmad, A.; Ahmad, W.; Aslam, F.; Joyklad, P. Compressive strength prediction of fly ash-based geopolymer concrete via advanced machine learning techniques. Case Stud. Constr. Mater. 2022, 16, e00840. [Google Scholar] [CrossRef]
- Friedman, J.H. Greedy function approximation: A gradient boosting machine. Ann. Stat. 2001, 29, 1189–1232. [Google Scholar] [CrossRef]
- Yao, M.; Zhu, Y.; Li, J.; Wei, H.; He, P. Research on predicting line loss rate in low voltage distribution network based on gradient boosting decision tree. Energies 2019, 12, 2522. [Google Scholar] [CrossRef]
- Han, Q.; Gui, C.; Xu, J.; Lacidogna, G. A generalized method to predict the compressive strength of high-performance concrete by improved random forest algorithm. Constr. Build. Mater. 2019, 226, 734–742. [Google Scholar] [CrossRef]
- Grömping, U. Variable importance assessment in regression: Linear regression versus random forest. Am. Stat. 2009, 63, 308–319. [Google Scholar] [CrossRef]
- Guo, K.; Wan, X.; Liu, L.; Gao, Z.; Yang, M. Fault Diagnosis of Intelligent Production Line Based on Digital Twin and Improved Random Forest. Appl. Sci. 2021, 11, 7733. [Google Scholar] [CrossRef]
- Ahmad, A.; Chaiyasarn, K.; Farooq, F.; Ahmad, W.; Suparp, S.; Aslam, F. Compressive Strength Prediction via Gene Expression Programming (GEP) and Artificial Neural Network (ANN) for Concrete Containing RCA. Buildings 2021, 11, 324. [Google Scholar] [CrossRef]
- Farooq, F.; Ahmed, W.; Akbar, A.; Aslam, F.; Alyousef, R. Predictive modeling for sustainable high-performance concrete from industrial wastes: A comparison and optimization of models using ensemble learners. J. Clean. Prod. 2021, 292, 126032. [Google Scholar] [CrossRef]
- Aslam, F.; Farooq, F.; Amin, M.N.; Khan, K.; Waheed, A.; Akbar, A.; Javed, M.F.; Alyousef, R.; Alabdulijabbar, H. Applications of gene expression programming for estimating compressive strength of high-strength concrete. Adv. Civ. Eng. 2020, 2020, 8850535. [Google Scholar] [CrossRef]
- Wang, Q.; Ahmad, W.; Ahmad, A.; Aslam, F.; Mohamed, A.; Vatin, N.I. Application of Soft Computing Techniques to Predict the Strength of Geopolymer Composites. Polymers 2022, 14, 1074. [Google Scholar] [CrossRef] [PubMed]
- Lundberg, S. A Game Theoretic Approach to Explain the Output of Any Machine Learning Model. Github. 2021. Available online: https://github.com/slundberg/shap (accessed on 29 September 2022).
- Lundberg, S.M.; Erion, G.; Chen, H.; DeGrave, A.; Prutkin, J.M.; Nair, B.; Katz, R.; Himmelfarb, J.; Bansal, N.; Lee, S.-I. From local explanations to global understanding with explainable AI for trees. Nat. Mach. Intell. 2020, 2, 56–67. [Google Scholar] [CrossRef] [PubMed]
- Molnar, C. Interpretable Machine Learning. Lulu.com. 2020. Available online: https://christophm.github.io/interpretable-ml-book/ (accessed on 29 September 2022).
- Lundberg, S.M.; Lee, S.-I. A unified approach to interpreting model predictions. Adv. Neural Inf. Processing Syst. 2017, 30. [Google Scholar] [CrossRef]
- Shen, Z.; Deifalla, A.F.; Kamiński, P.; Dyczko, A. Compressive Strength Evaluation of Ultra-High-Strength Concrete by Machine Learning. Materials 2022, 15, 3523. [Google Scholar] [CrossRef]
- Islam, G.S.; Rahman, M.; Kazi, N. Waste glass powder as partial replacement of cement for sustainable concrete practice. Int. J. Sustain. Built Environ. 2017, 6, 37–44. [Google Scholar] [CrossRef]
- Matos, A.M.; Sousa-Coutinho, J. Durability of mortar using waste glass powder as cement replacement. Constr. Build. Mater. 2012, 36, 205–215. [Google Scholar] [CrossRef]
- Yuan, X.; Tian, Y.; Ahmad, W.; Ahmad, A.; Usanova, K.I.; Mohamed, A.M.; Khallaf, R. Machine Learning Prediction Models to Evaluate the Strength of Recycled Aggregate Concrete. Materials 2022, 15, 2823. [Google Scholar] [CrossRef]
- Xu, Y.; Ahmad, W.; Ahmad, A.; Ostrowski, K.A.; Dudek, M.; Aslam, F.; Joyklad, P. Computation of High-Performance Concrete Compressive Strength Using Standalone and Ensembled Machine Learning Techniques. Materials 2021, 14, 7034. [Google Scholar] [CrossRef]


| Parameter | Cement (kg/m3) | FA (kg/m3) | Water (kg/m3) | SF (kg/m3) | SP (kg/m3) | WGP (kg/m3) | CS (MPa) | FS (MPa) |
|---|---|---|---|---|---|---|---|---|
| Mean | 732.51 | 735.62 | 191.33 | 151.67 | 38.17 | 61.65 | 43.48 | 5.00 |
| Standard error | 4.96 | 5.04 | 0.87 | 2.20 | 0.17 | 3.36 | 0.56 | 0.05 |
| Median | 722.00 | 729.00 | 191.00 | 153.00 | 38.00 | 60.75 | 41.40 | 4.98 |
| Mode | 810.00 | 810.00 | 203.00 | 122.00 | 40.50 | 0.00 | 40.20 | 4.90 |
| Standard deviation | 53.62 | 54.51 | 9.43 | 23.80 | 1.85 | 36.34 | 6.09 | 0.56 |
| Minimum | 612 | 612 | 180 | 122 | 36 | 0 | 34.24 | 3.55 |
| Maximum | 810 | 810 | 203 | 180 | 40.5 | 121.5 | 62.46 | 6.21 |
| ML Method | CS Model | FS Model | ||||
|---|---|---|---|---|---|---|
| MAE (MPa) | MAPE (%) | RMSE (MPa) | MAE (MPa) | MAPE (%) | RMSE (MPa) | |
| GBR | 1.254 | 2.90 | 1.597 | 0.124 | 2.50 | 0.152 |
| RFR | 1.095 | 2.60 | 1.331 | 0.104 | 2.10 | 0.137 |
| K-fold | CS | FS | ||||||||||
|---|---|---|---|---|---|---|---|---|---|---|---|---|
| GBR | RFR | GBR | RFR | |||||||||
| MAE | RMSE | R2 | MAE | RMSE | R2 | MAE | RMSE | R2 | MAE | RMSE | R2 | |
| 1 | 1.60 | 2.48 | 0.53 | 2.04 | 2.61 | 0.40 | 0.23 | 0.35 | 0.89 | 0.13 | 0.29 | 0.88 |
| 2 | 1.62 | 4.06 | 0.86 | 1.49 | 1.46 | 0.94 | 0.32 | 0.30 | 0.73 | 0.26 | 0.26 | 0.91 |
| 3 | 1.52 | 1.60 | 0.65 | 1.90 | 1.87 | 0.70 | 0.27 | 0.32 | 0.83 | 0.29 | 0.31 | 0.61 |
| 4 | 2.99 | 4.01 | 0.82 | 3.51 | 4.63 | 0.77 | 0.12 | 0.38 | 0.85 | 0.10 | 0.27 | 0.63 |
| 5 | 4.41 | 5.48 | 0.93 | 3.04 | 1.33 | 0.53 | 0.42 | 0.64 | 0.66 | 0.39 | 0.43 | 0.75 |
| 6 | 1.61 | 1.77 | 0.85 | 1.23 | 2.08 | 0.89 | 0.26 | 0.34 | 0.45 | 0.21 | 0.26 | 0.68 |
| 7 | 5.09 | 2.70 | 0.57 | 4.22 | 2.31 | 0.89 | 0.43 | 0.48 | 0.57 | 0.35 | 0.24 | 0.81 |
| 8 | 1.25 | 2.17 | 0.33 | 1.13 | 1.82 | 0.78 | 0.23 | 0.39 | 0.31 | 0.25 | 0.31 | 0.59 |
| 9 | 2.50 | 3.97 | 0.81 | 2.64 | 3.03 | 0.91 | 0.48 | 0.54 | 0.64 | 0.40 | 0.44 | 0.62 |
| 10 | 1.63 | 1.82 | 0.83 | 1.10 | 3.44 | 0.71 | 0.24 | 0.15 | 0.86 | 0.24 | 0.29 | 0.54 |
Publisher’s Note: MDPI stays neutral with regard to jurisdictional claims in published maps and institutional affiliations. |
© 2022 by the authors. Licensee MDPI, Basel, Switzerland. This article is an open access article distributed under the terms and conditions of the Creative Commons Attribution (CC BY) license (https://creativecommons.org/licenses/by/4.0/).
Share and Cite
Alkadhim, H.A.; Amin, M.N.; Ahmad, W.; Khan, K.; Nazar, S.; Faraz, M.I.; Imran, M. Evaluating the Strength and Impact of Raw Ingredients of Cement Mortar Incorporating Waste Glass Powder Using Machine Learning and SHapley Additive ExPlanations (SHAP) Methods. Materials 2022, 15, 7344. https://doi.org/10.3390/ma15207344
Alkadhim HA, Amin MN, Ahmad W, Khan K, Nazar S, Faraz MI, Imran M. Evaluating the Strength and Impact of Raw Ingredients of Cement Mortar Incorporating Waste Glass Powder Using Machine Learning and SHapley Additive ExPlanations (SHAP) Methods. Materials. 2022; 15(20):7344. https://doi.org/10.3390/ma15207344
Chicago/Turabian StyleAlkadhim, Hassan Ali, Muhammad Nasir Amin, Waqas Ahmad, Kaffayatullah Khan, Sohaib Nazar, Muhammad Iftikhar Faraz, and Muhammad Imran. 2022. "Evaluating the Strength and Impact of Raw Ingredients of Cement Mortar Incorporating Waste Glass Powder Using Machine Learning and SHapley Additive ExPlanations (SHAP) Methods" Materials 15, no. 20: 7344. https://doi.org/10.3390/ma15207344
APA StyleAlkadhim, H. A., Amin, M. N., Ahmad, W., Khan, K., Nazar, S., Faraz, M. I., & Imran, M. (2022). Evaluating the Strength and Impact of Raw Ingredients of Cement Mortar Incorporating Waste Glass Powder Using Machine Learning and SHapley Additive ExPlanations (SHAP) Methods. Materials, 15(20), 7344. https://doi.org/10.3390/ma15207344