
Experimental Investigation of the Phase Relations in the Fe-Zr-Y Ternary System


Abstract
:1. Introduction
2. Experimental Procedures
3. Experimental Results
4. Discussion
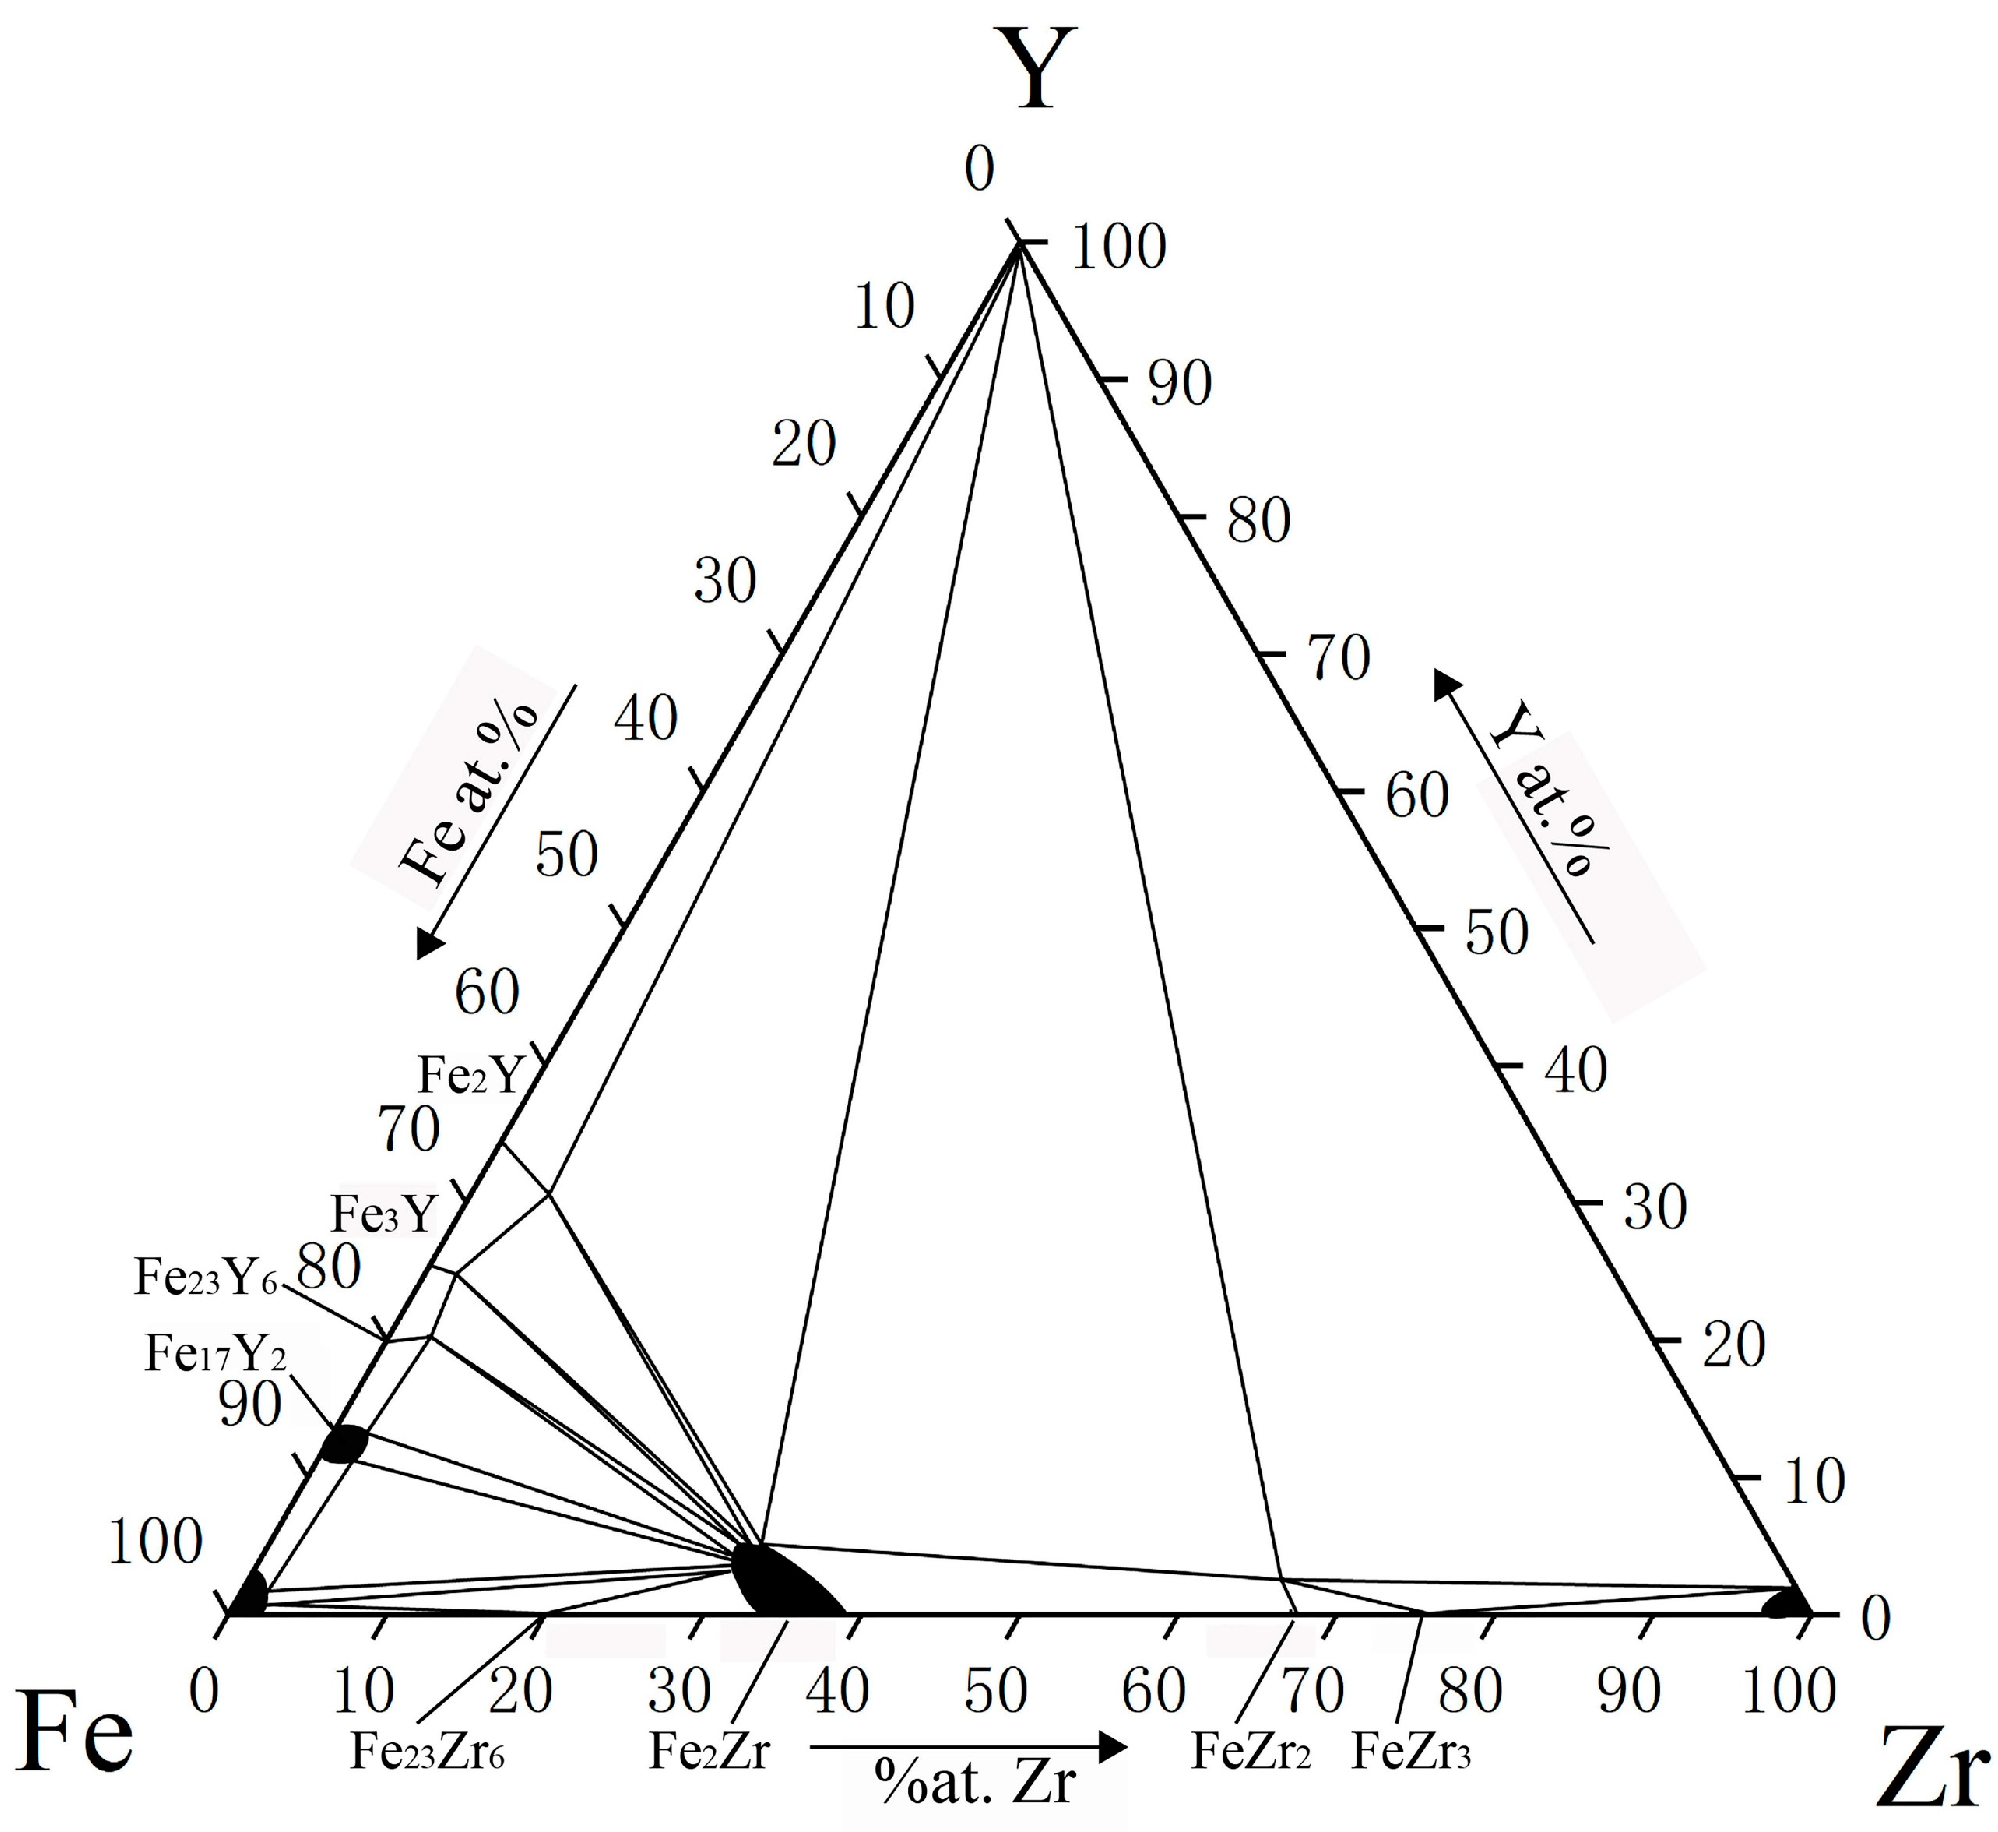
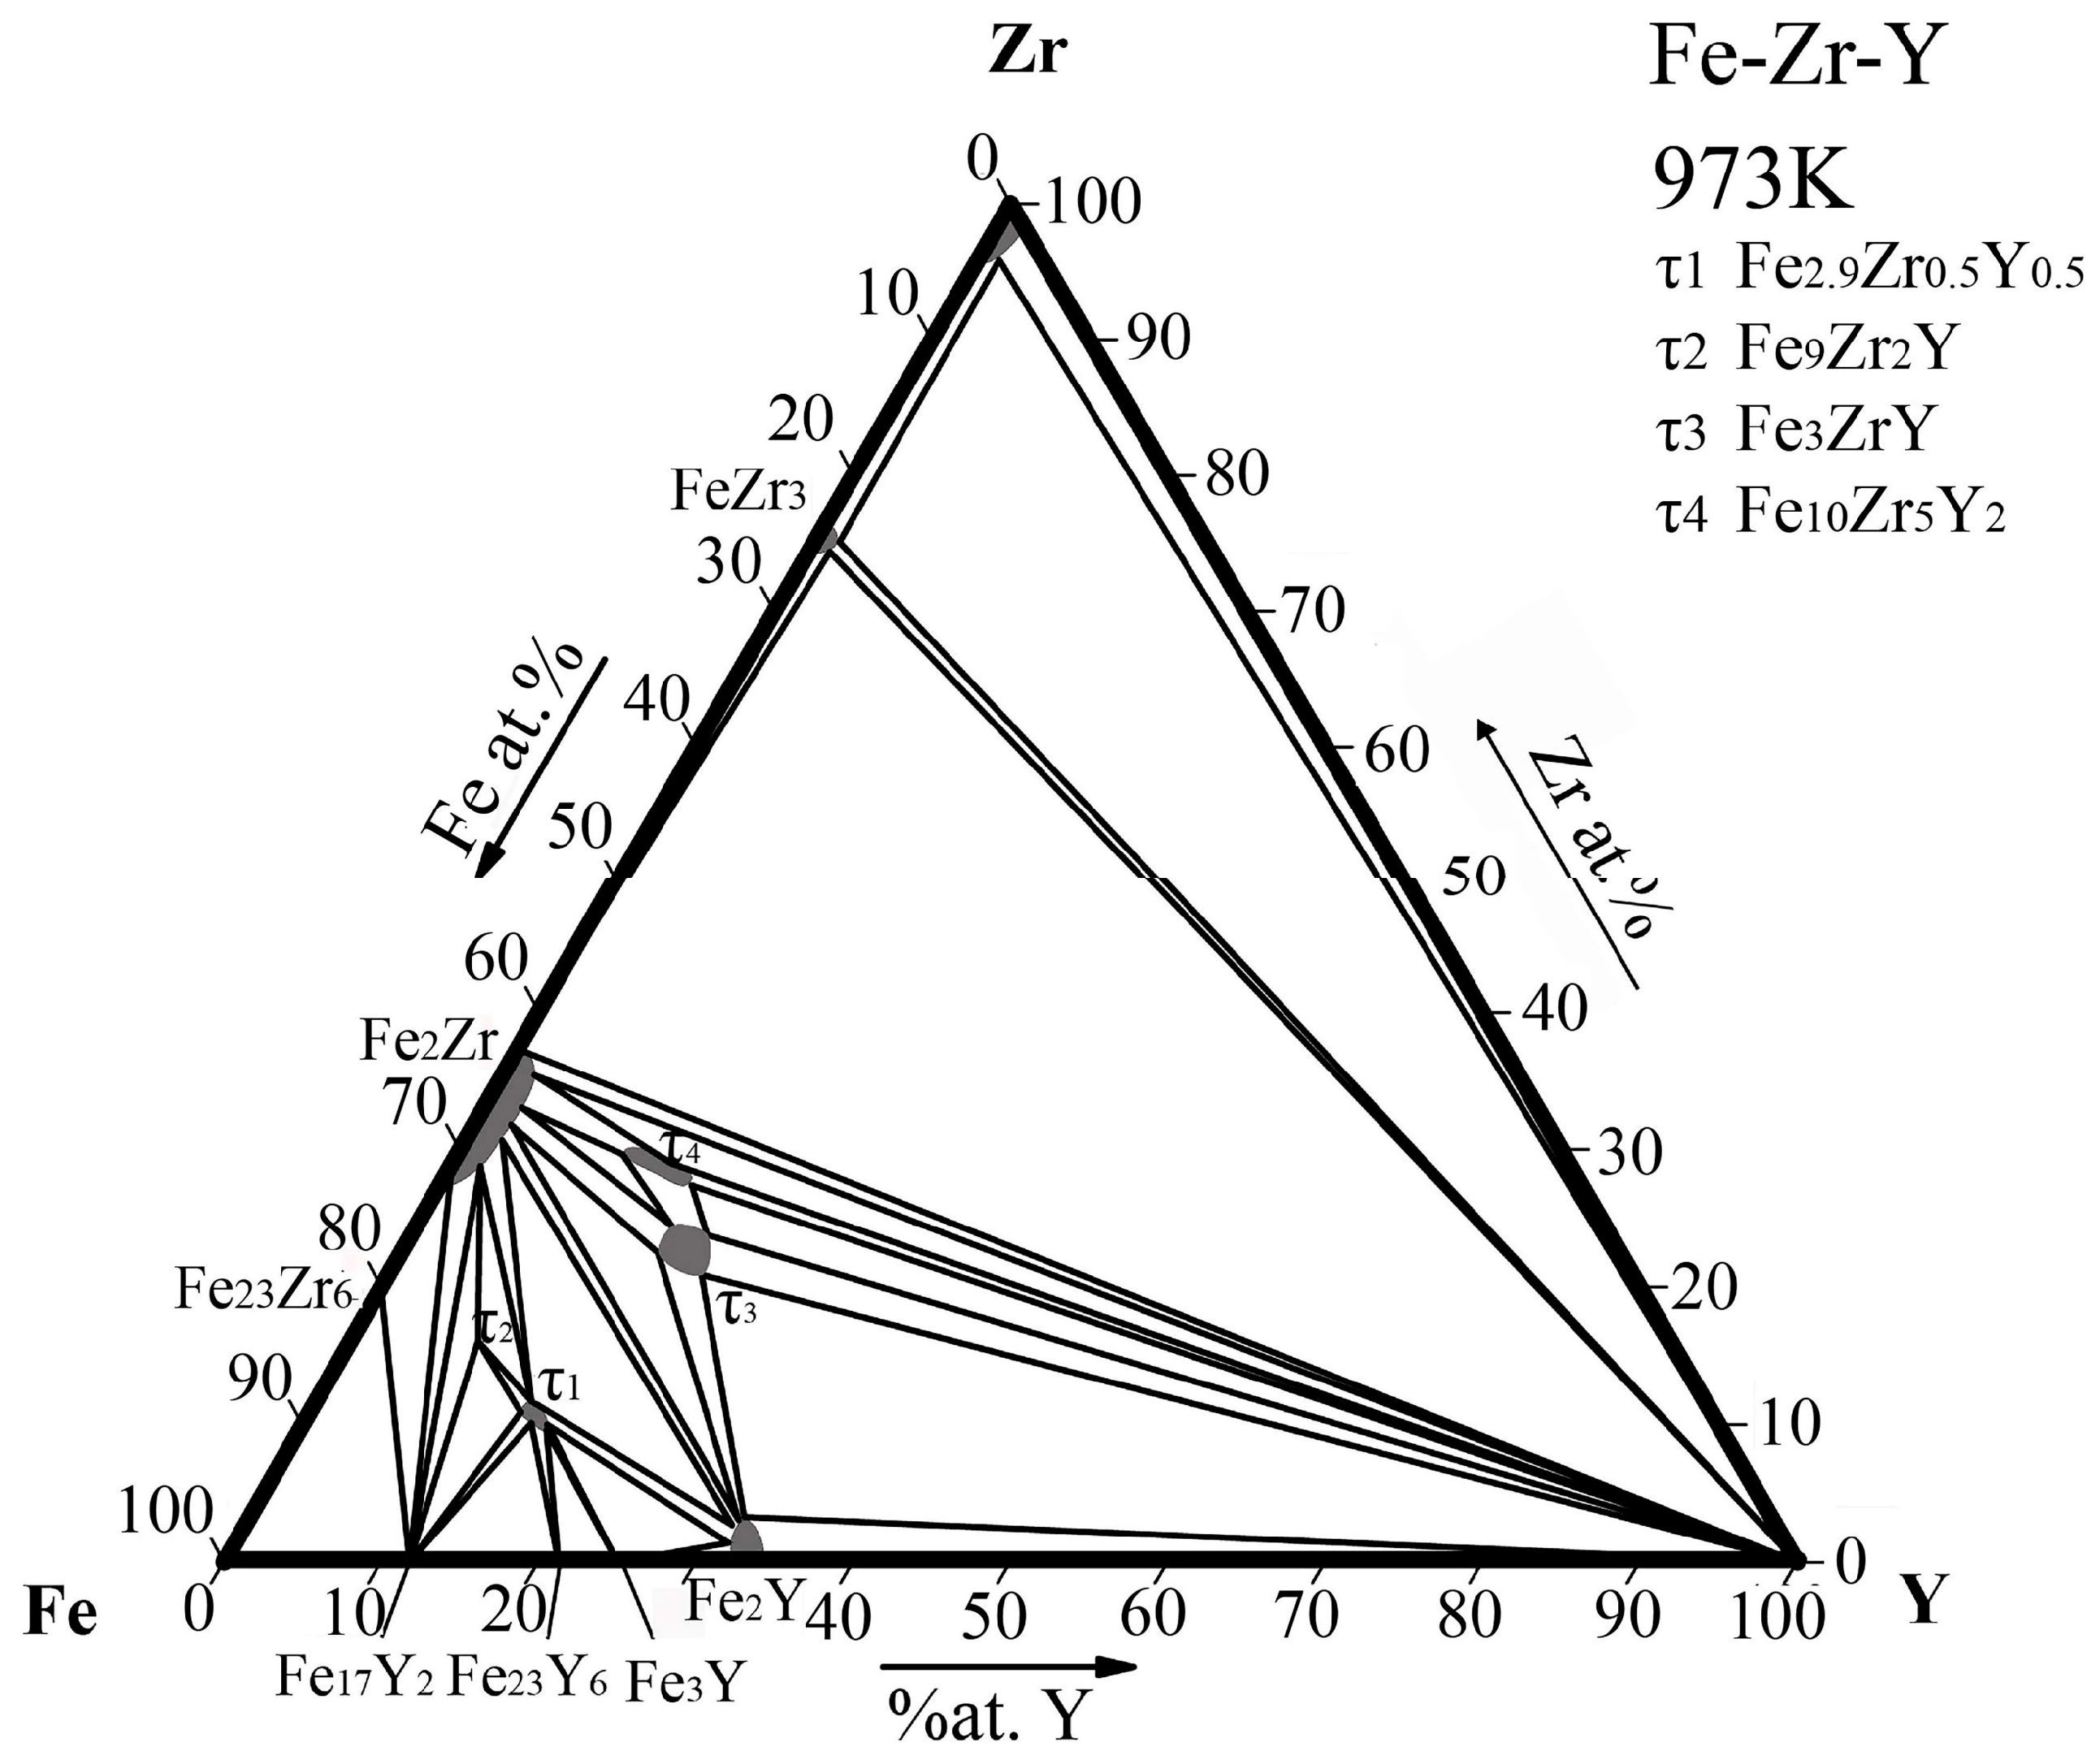
4.1. Phase Equilibria at 973 K
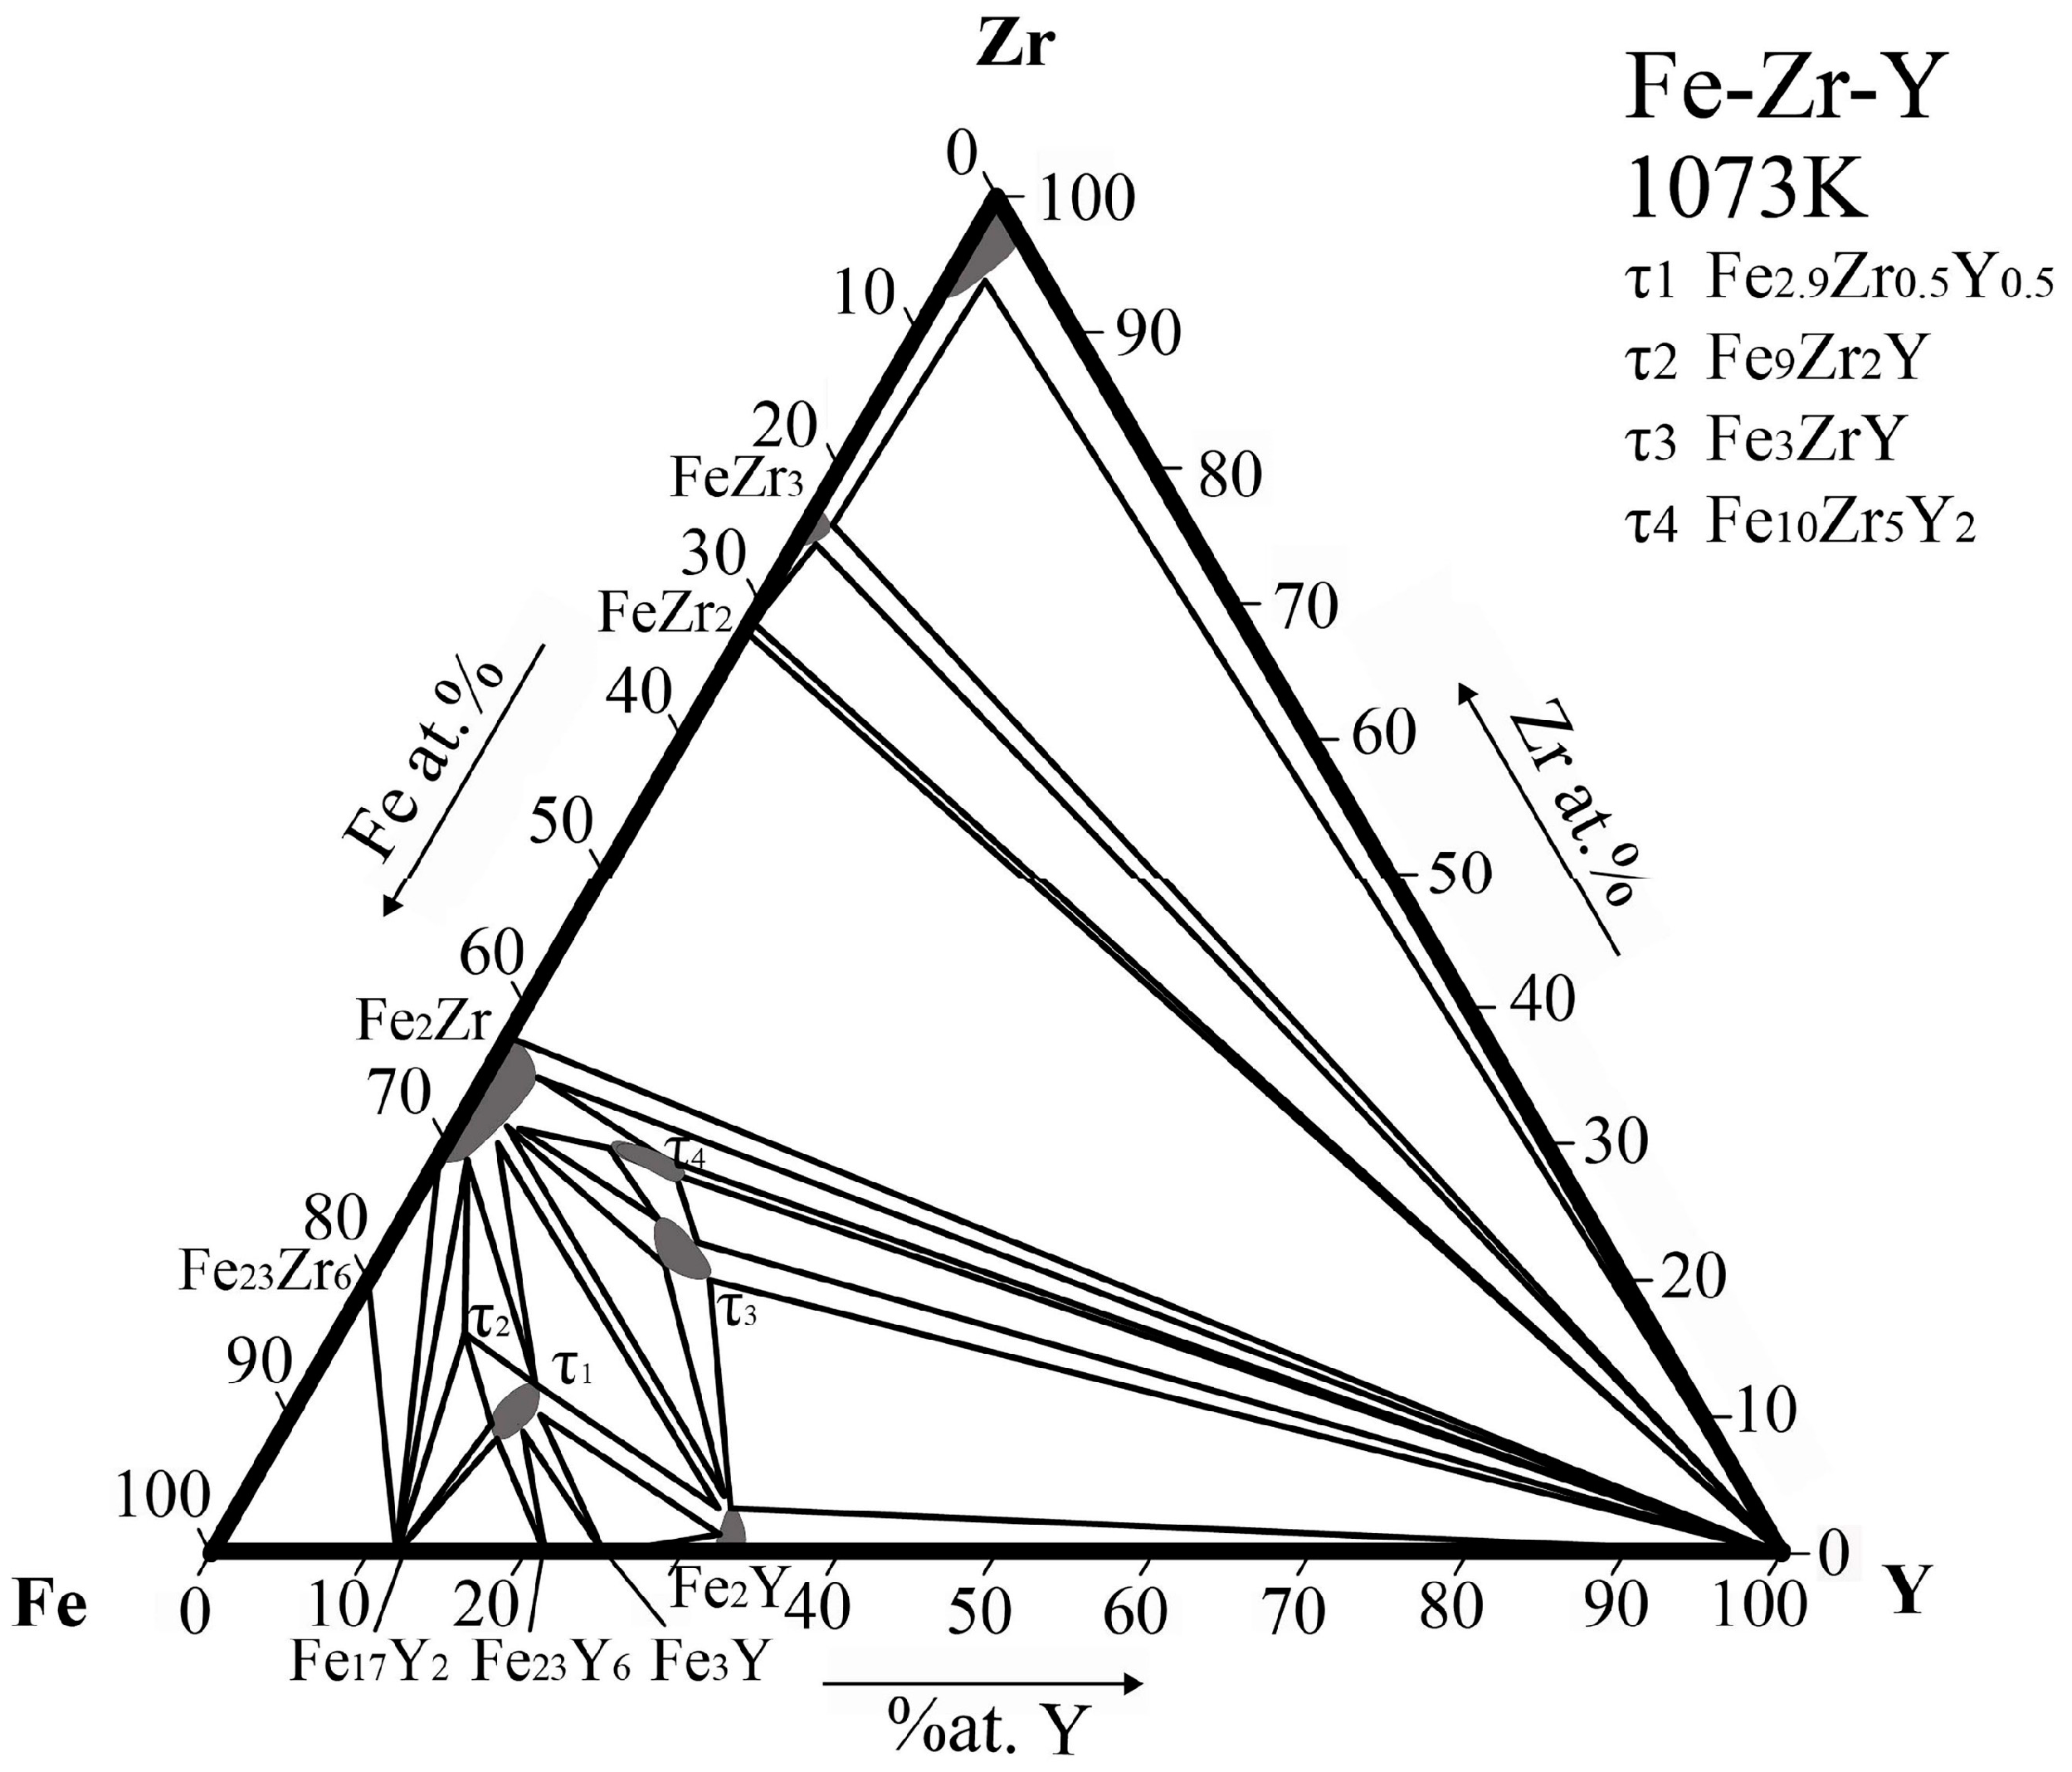
4.2. Phase Equilibria at 1073 K
5. Conclusions
Author Contributions
Funding
Institutional Review Board Statement
Informed Consent Statement
Data Availability Statement
Conflicts of Interest
References
- Celbová, L.; Ashcheulov, P.; Klimša, L.; Kopeček, J.; Dragounová, K.A.; Luštinec, J.; Macák, J.; Škoda, R.; Kratochvílová, I. Diamond Coating Reduces Nuclear Fuel Rod Corrosion at Accidental Temperatures: The Role of Surface Electrochemistry and Semiconductivity. Materials 2021, 14, 6315. [Google Scholar] [CrossRef]
- Diniasi, D.; Golgovici, F.; Marin, A.H.; Negrea, A.D.; Fulger, M.; Demetrescu, I. Long-Term Corrosion Testing of Zy-4 in a LiOH Solution under High Pressure and Temperature Conditions. Materials 2021, 14, 4586. [Google Scholar] [CrossRef]
- Zou, N.; Lu, H.-J.; Liu, L.-L.; He, Y.-L.; Lu, X.-G. Experimental investigation of phase equilibria in the Fe-Hf-Zr system at 1173 K and 1373 K. Calphad 2021, 72, 102240. [Google Scholar] [CrossRef]
- Zhang, H.; Du, Y.; Shen, Z.; Zhou, P.; Peng, Y.; Liu, S.; Kong, Y.; Rajkumar, V.B. Thermodynamic modeling and solidified microstructure in the Mo–Nb–Zr ternary system. Calphad 2019, 66, 101630. [Google Scholar] [CrossRef]
- Zeng, Y.; Zhou, P.; Du, Y.; Mo, W.; Bai, B.; Wang, X.; Zhao, J. A thermodynamic description of the U−Ti−Zr system. Calphad 2018, 60, 90–97. [Google Scholar] [CrossRef]
- Nieva, N.; Corvalán, C.; Jiménez, M.J.; Gómez, A.; Arreguez, C.; Joubert, J.M.; Arias, D. Phase diagram of the Fe-Sn-Zr system at 800 °C. J. Nucl. Mater. 2017, 487, 186–191. [Google Scholar] [CrossRef]
- Wang, Y.; Xu, S.; Jia, H.; Tong, Z.; Zhou, Z. Influence of Zr addition on the microstructure and mechanical properties of 9CrTi-ODS steels. Nucl. Mater. Energy 2021, 29, 101101. [Google Scholar] [CrossRef]
- Gómez-Acebo, T. Summary report of CALPHAD XLII—San Sebastian, Spain, 2013. Calphad 2014, 45, 62–117. [Google Scholar] [CrossRef]
- Li, Z.; Chen, L.; Zhang, H.; Liu, S. High-Temperature Oxidation Properties and Microstructural Evolution of Nanostructure Fe-Cr-Al ODS Alloys. Materials 2021, 14, 526. [Google Scholar] [CrossRef]
- Zhou, X.; Li, G.; Shen, X.; Liu, Y. Tensile strength improvement of martensitic ODS steels with Zr and Hf additions. Mater. Sci. Eng. A 2022, 829, 142071. [Google Scholar] [CrossRef]
- Peng, S.; Lu, Z.; Yu, L. Effects of Y2O3/Ti/Zr addition on microstructure and hardness of ODS-CoCrFeNi HEAs produced by mechanical alloying and spark plasma sintering. J. Alloys Compd. 2021, 861, 157940. [Google Scholar] [CrossRef]
- Chang, K.-C.; Zhao, J.-R.; Hung, F.-Y. Effects of hyper-high-temperature solid-solution treatment on microstructure evolution and nanoprecipitation of the Al-Ni-Cu-Fe-Zr-Sc alloy manufactured by selective laser melting. J. Alloys Compd. 2021, 883, 160781. [Google Scholar] [CrossRef]
- Sundman, B.; Dupin, N.; Hallstedt, B. Algorithms useful for calculating multi-component equilibria, phase diagrams and other kinds of diagrams. Calphad 2021, 75, 102330. [Google Scholar] [CrossRef]
- Malakhova, T.; Alekseyeva, Z. The Zr-Fe phase diagram in the range 20–40 at.% Fe and the crystalline structure of the intermetallic compound Zr3Fe. J. Less Common Met. 1981, 81, 293–300. [Google Scholar] [CrossRef]
- Raghavan, V. Al-Fe-Zr (Aluminum-Iron-Zirconium). J. Phase Equilibria Diffus. 2010, 31, 459–462. [Google Scholar] [CrossRef]
- Liu, Y.; Allen, S.M.; Livingson, J.D. An investigation of Fe3Zr phase. Scr. Metall. Mater. 1995, 32, 1129–1132. [Google Scholar] [CrossRef]
- Granovsky, M.S.; Canay, M.; Lena, E.; Arias, D. Experimental investigation of the Zr corner of theternary Zr–Nb–Fe phase diagram. J. Nucl. Mater. 2002, 302, 1–8. [Google Scholar] [CrossRef]
- Zeng, L.; Xu, G.; Liu, L.; Bai, W.; Zhang, L. Experimental investigation of phase equilibria in the Ti-Fe-Zr system. Calphad 2018, 61, 20–32. [Google Scholar] [CrossRef]
- Ye, J.; Guan, R.; Zhao, H.; He, C.; Xiong, K. Effect of Zr Microalloying on the Microstructures and Strengthening Mechanism of As-Cast Al-Fe-Zr Alloys. Materials 2020, 13, 4744. [Google Scholar] [CrossRef]
- Malakhova, T.O.; Kobylkin, A.N. Phase diagram for Zr-Fe(0-66,6 at.%Fe). Izvestiya Akademii Nauk SSSR Metally 1982, 14, 205–209. [Google Scholar]
- Servant, C.; Gueneau, C.; Ansara, I. Experimental and thermodynamic assessment of the Fe-Zr system. J. Alloys Compd. 1995, 220, 19–26. [Google Scholar] [CrossRef]
- Saenko, I.; Kuprava, A.; Udovsky, A.; Fabrichnaya, O. Heat capacity measurement of Zr2Fe and thermodynamic re-assessment of the Fe–Zr system. Calphad 2019, 66, 101625. [Google Scholar] [CrossRef]
- Jiang, M.; Oikawa, K.; Ikeshoji, T.; Wulff, L.; Ishida, K. Thermodynamic Calculations of Fe-Zr and Fe-Zr-C Systems. J. Phase Equilibria Diffus. 2000, 22, 406–417. [Google Scholar] [CrossRef]
- Zou, N.; Lu, H.-J.; Gu, P.-W.; Wang, J.-Y.; Feng, X.-K.; Shen, J.-Y.; He, Y.-L.; Li, L.; Lu, X.-G. Thermodynamic assessment and glass forming ability prediction of the Zr-Fe-Cu system. Calphad 2019, 64, 175–184. [Google Scholar] [CrossRef]
- Rigaud, V.; Sundman, B.; Daloz, D.; Lesoult, G. Thermodynamic assessment of the Fe–Al–Zr phase diagram. Calphad 2009, 33, 442–449. [Google Scholar] [CrossRef]
- Cui, J.; Shen, Y.; Liu, X. Experimental investigation and thermodynamic modeling of the Fe−Si−Zr system. Calphad 2019, 65, 385–401. [Google Scholar] [CrossRef]
- Kai, K.; Nakamichi, T.; Yamamoto, M. Crystal Structures and Magnetic Properties of the Intermetallic Compnd Fe2Zr. J. Phys. Soc. 1968, 25, 1192. [Google Scholar] [CrossRef]
- Stein, F.; Sauthoff, G.; Palm, M. Experimental Determination of Intermetallic Phases, Phase Equilibria, and Invariant Reaction Temperatures in the Fe-Zr System. J. Phase Equilibria Diffus. 2002, 23, 480–494. [Google Scholar] [CrossRef]
- Yang, Y.; Tan, L.; Bei, H.; Busby, J.T. Thermodynamic modeling and experimental study of the Fe–Cr–Zr system. J. Nucl. Mater. 2013, 441, 190–202. [Google Scholar] [CrossRef]
- Lu, H.-J.; Zou, N.; Zhao, X.-S.; Shen, J.-Y.; Lu, X.-G.; He, Y.-L. Thermodynamic investigation of the Zr-Fe-Nb system and its applications. Intermetallics 2017, 88, 91–100. [Google Scholar] [CrossRef]
- Domagala, R.F.; Rausch, J.J.; Levinson, D.W. The systems Y-Fe, Y-Ni, and Y-Cu. Trans. Am. Soc. Met. 1961, 53, 139–155. [Google Scholar]
- Gschneidner, K.A., Jr. Rare Earth Alloys; D. Van Nostrand Company Inc.: Princeton, NJ, USA, 1961; Volume 60, p. 247. [Google Scholar]
- Zhang, W.; Liu, G.; Han, K. The Fe-Y (iron-yttrium) system. J. Phase Equilibria 1992, 13, 304–308. [Google Scholar] [CrossRef]
- Saenko, I.; Fabrichnaya, O.; Udovsky, A. New Thermodynamic Assessment of the Fe-Y System. J. Phase Equilibria Diffus. 2017, 38, 684–699. [Google Scholar] [CrossRef]
- Wang, R. Formation of metastable low temperature allotropie solid solutions in rare earth-zirconium systems. Metall. Trans. 1972, 3, 1213–1221. [Google Scholar] [CrossRef]
- Palenzona, A.; Cirafici, S. The Y-Zr (yttrium-zirconium) system. J. Phase Equilibria 1991, 12, 485–489. [Google Scholar] [CrossRef]
- Flandorfer, H.; Gröbner, J.; Stamou, A.; Hassiotis, N.; Saccone, A.; Rogl, P.; Wouters, R.; Seifert, H.; Macciò, D.; Ferro, R. Experimental investigation and thermodynamic calculation of the ternary system Mn–Y–Zr. Int. J. Mater. Res. 1997, 88, 529–538. [Google Scholar]
- Bu, M.J.; Wang, P.S.; Xu, H.H.; Liu, S.H.; Sha, C.S.; Du, Y.; Pan, F.S.; Tang, A.T. Experimental investigation and thermodynamic modeling of the Zr-Y system. J. Min. Metall. Sect. B Metall. 2010, 46, 181–192. [Google Scholar] [CrossRef]
- Harchenko, O.I.; Berezyuk, D.A.; Kryshtal, M.I. Ternary (Y,Ce)-Zr-Fe systems. Visn. L'vivs'kogo (Derzhavnogo) Univ. Seriya Khimichna 1984, 25, 26–28. [Google Scholar]
- Jifan, H.; Mingxi, L.; Rufeng, X.; Shougong, Z.; Zhenxi, W. Formation of Magnetic Phases in Y-Zr-Fe Compounds. Phys. Stat. Sol. 1989, 113, 127–129. [Google Scholar]
- Itoh, K.; Okagaki, T.; Kanematsu, K. Crystal Structure and Magnetic Properties of Y1-xZrxFe2.9. J. Phys. Soc. 1989, 58, 1787–1792. [Google Scholar] [CrossRef]
- Villars, P. Pearson’s Handbook Desk Edition: C. Data for Intermetallic Phases, volume 2. ASM Int. 1997, 1, 1143. [Google Scholar]
- Nouri, K.; Jemmali, M.; Walha, S.; Salah, A.B.; Dhahri, E.; Bessais, L. Experimental investigation of the Y-Fe-Ga ternary phase diagram: Phase equilibria and new isothermal section at 800 °C. J. Alloys Compd. 2017, 719, 256–263. [Google Scholar] [CrossRef]


| Phase | Phase Prototype | Space Group | Lattice Parameters (nm) | Reference | ||
|---|---|---|---|---|---|---|
| a | b | c | ||||
| α (Fe) | W | m | 0.29315 | / | / | [42] |
| δ (Fe) | W | m | 0.29315 | / | / | [42] |
| β (Zr) | W | m | 0.3568 | / | / | [42] |
| γ (Fe) | Cu | m | 0.36599 | / | / | [42] |
| α (Zr) | Mg | P63/mmc | 0.323178 | / | 0.514831 | [28] |
| Fe2Zr_C15 | MgCu2 | m | 0.702 | / | / | [28] |
| Fe23Zr6 | Mn23Th6 | m | 1.172 | / | / | [28] |
| FeZr2 | Al2Cu | I4/mcm | 0.638 | / | 0.56 | [28] |
| FeZr3 | BRe3 | Cmcm | 0.332 | 1.1 | 0.882 | [28] |
| Fe17Y2 | Th2Zn17 | m | 0.846 | / | 1.241 | [43] |
| Fe23Y6 | Th6Mn23 | m | 1.2082 | / | / | [43] |
| Fe3Y | PuNi3 | m | 0.515 | / | 2.46 | [43] |
| Fe2Y | MgCu2 | m | 7.363 | / | / | [43] |
| Fe9Zr2Y | ThMn12 | I4/mmm | 0.8662 | 0.8662 | 0.50226 | [40] |
| Fe2.9Zr0.5Y0.5 | / | / | 0.5067 | 0.8634 | 2.451 | [41] |
| Alloy (No.) | Chemical Composition | Nominal Composition (at.%) | Experimental Results (at.%) | Phase Determination | ||||
|---|---|---|---|---|---|---|---|---|
| Fe | Zr | Y | Fe | Zr | Y | |||
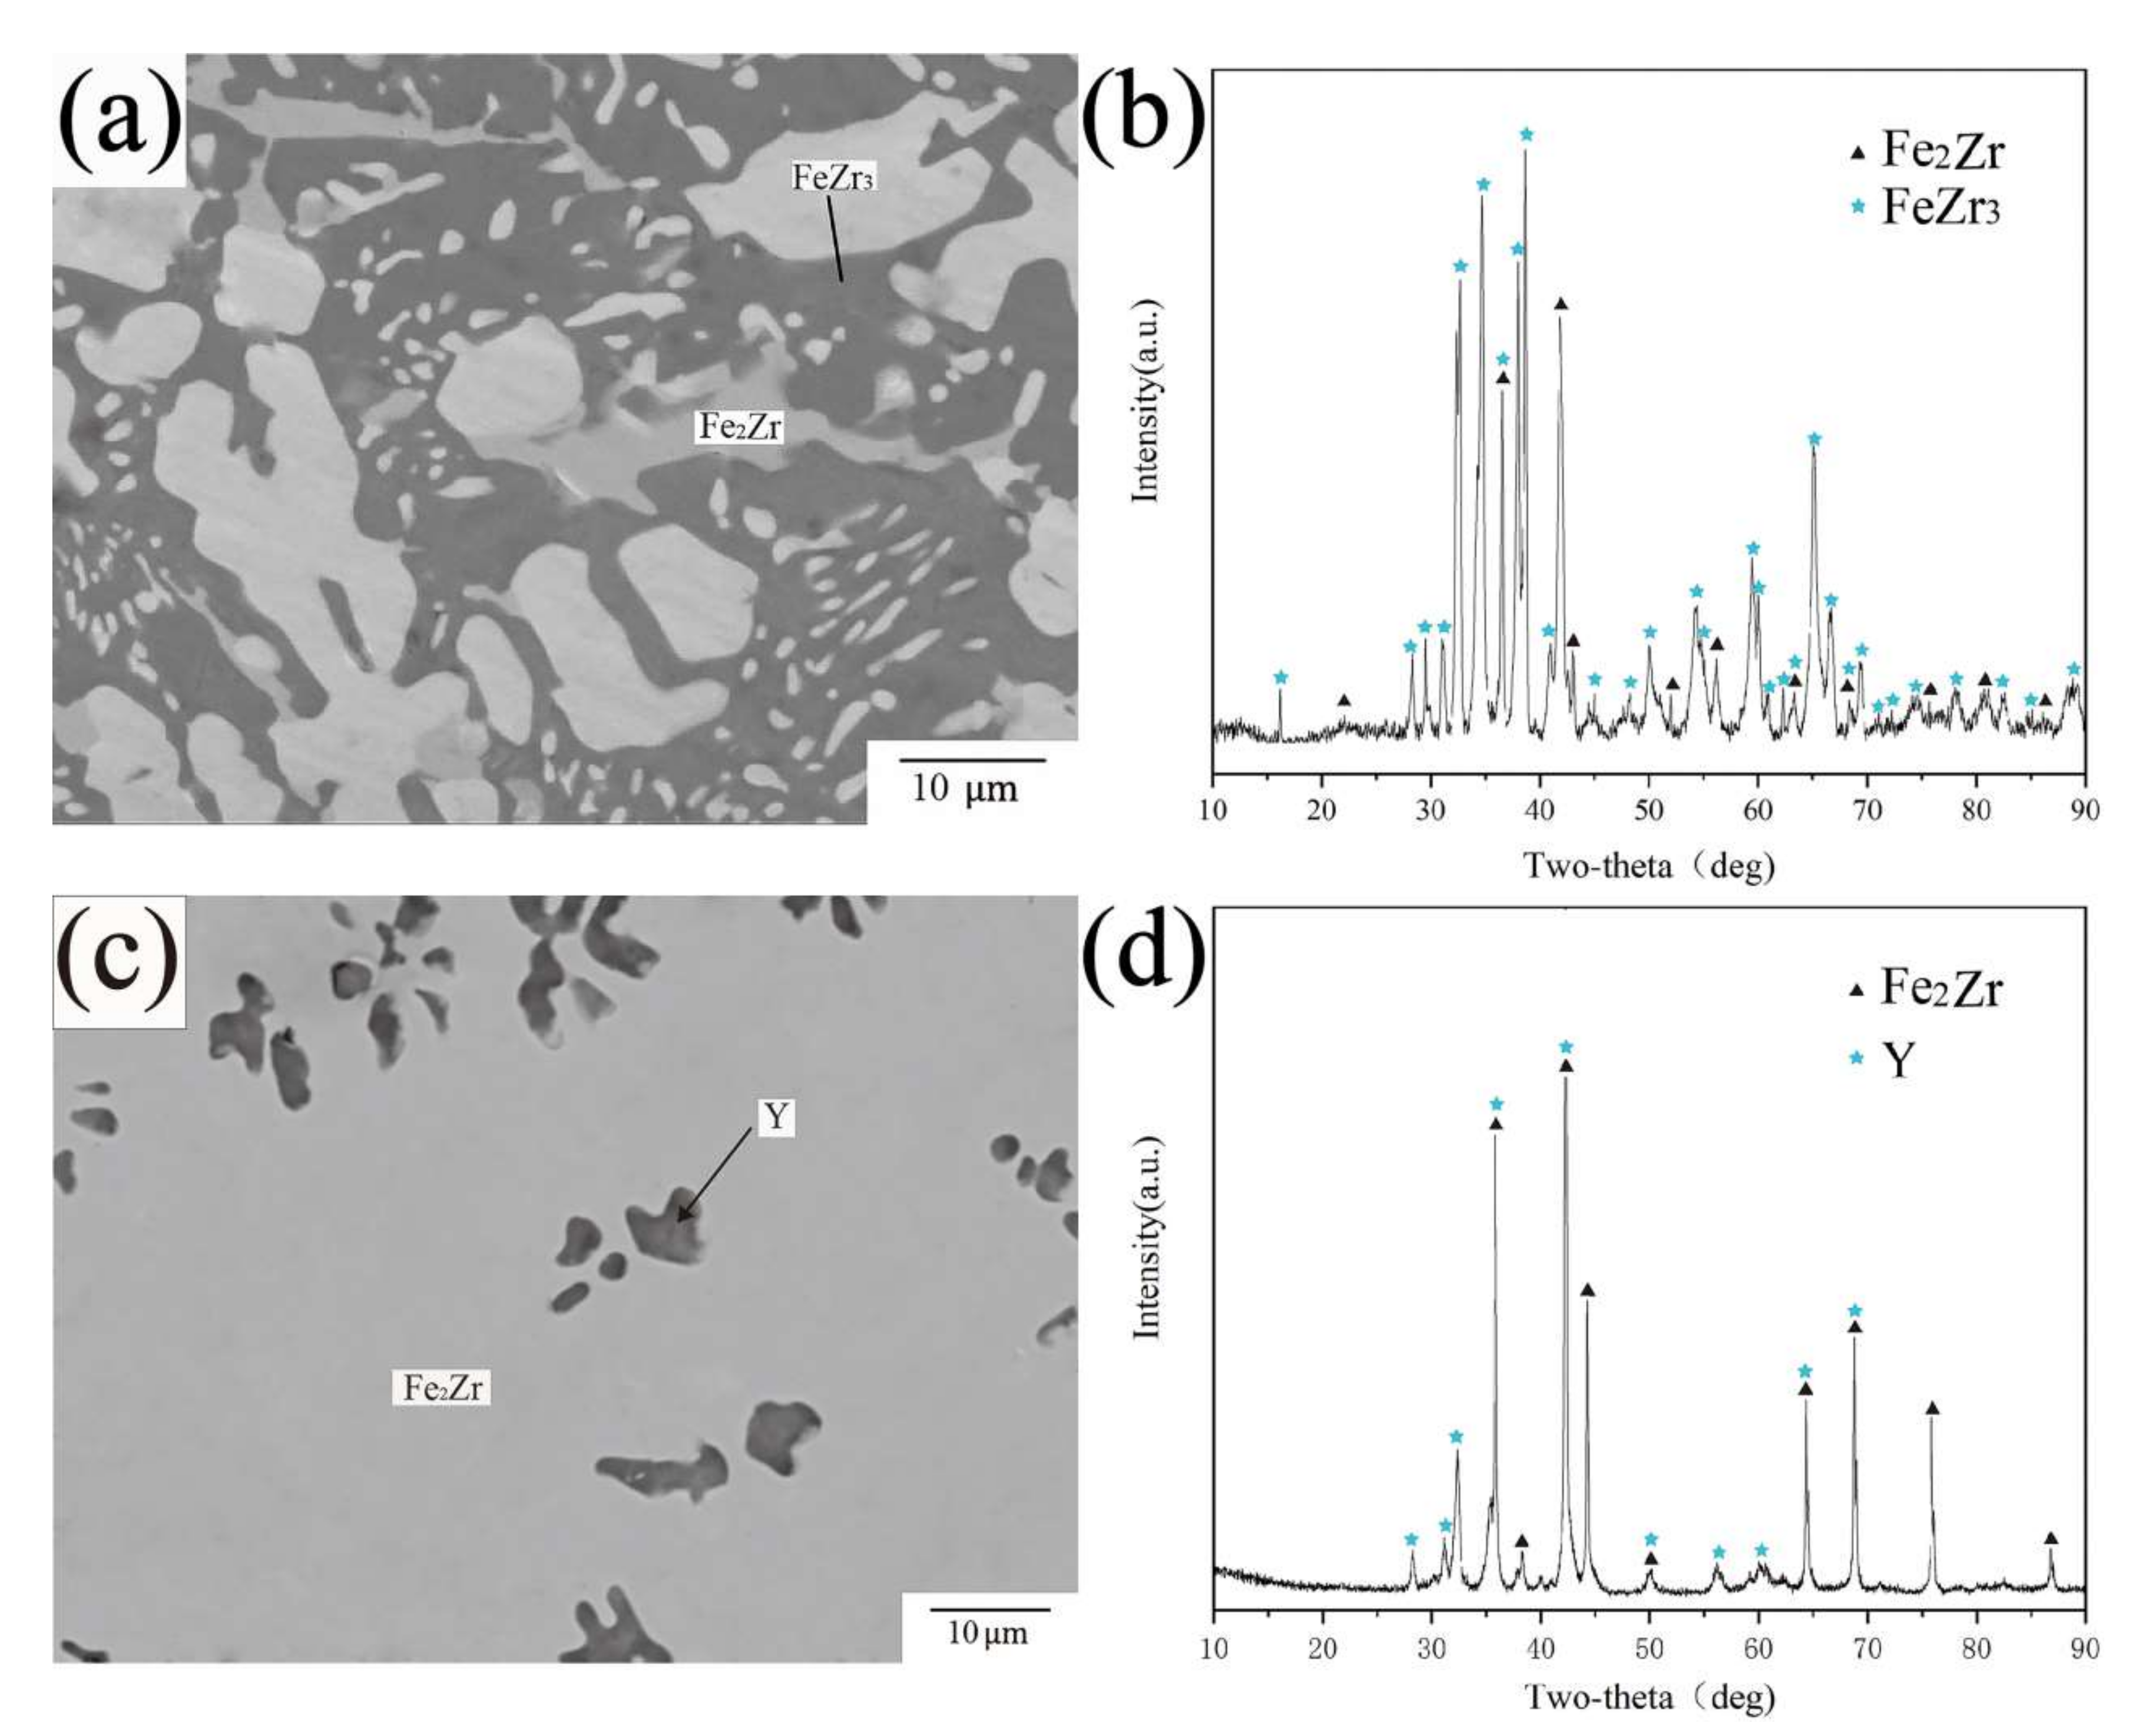
| A1 | Fe10Zr70Y20 | 10 | 70 | 20 | 62.61 | 37.23 | 0.16 | Fe2Zr |
| 24.35 | 74.42 | 1.23 | FeZr3 | |||||
| 0.29 | 0.13 | 99.58 | Y | |||||
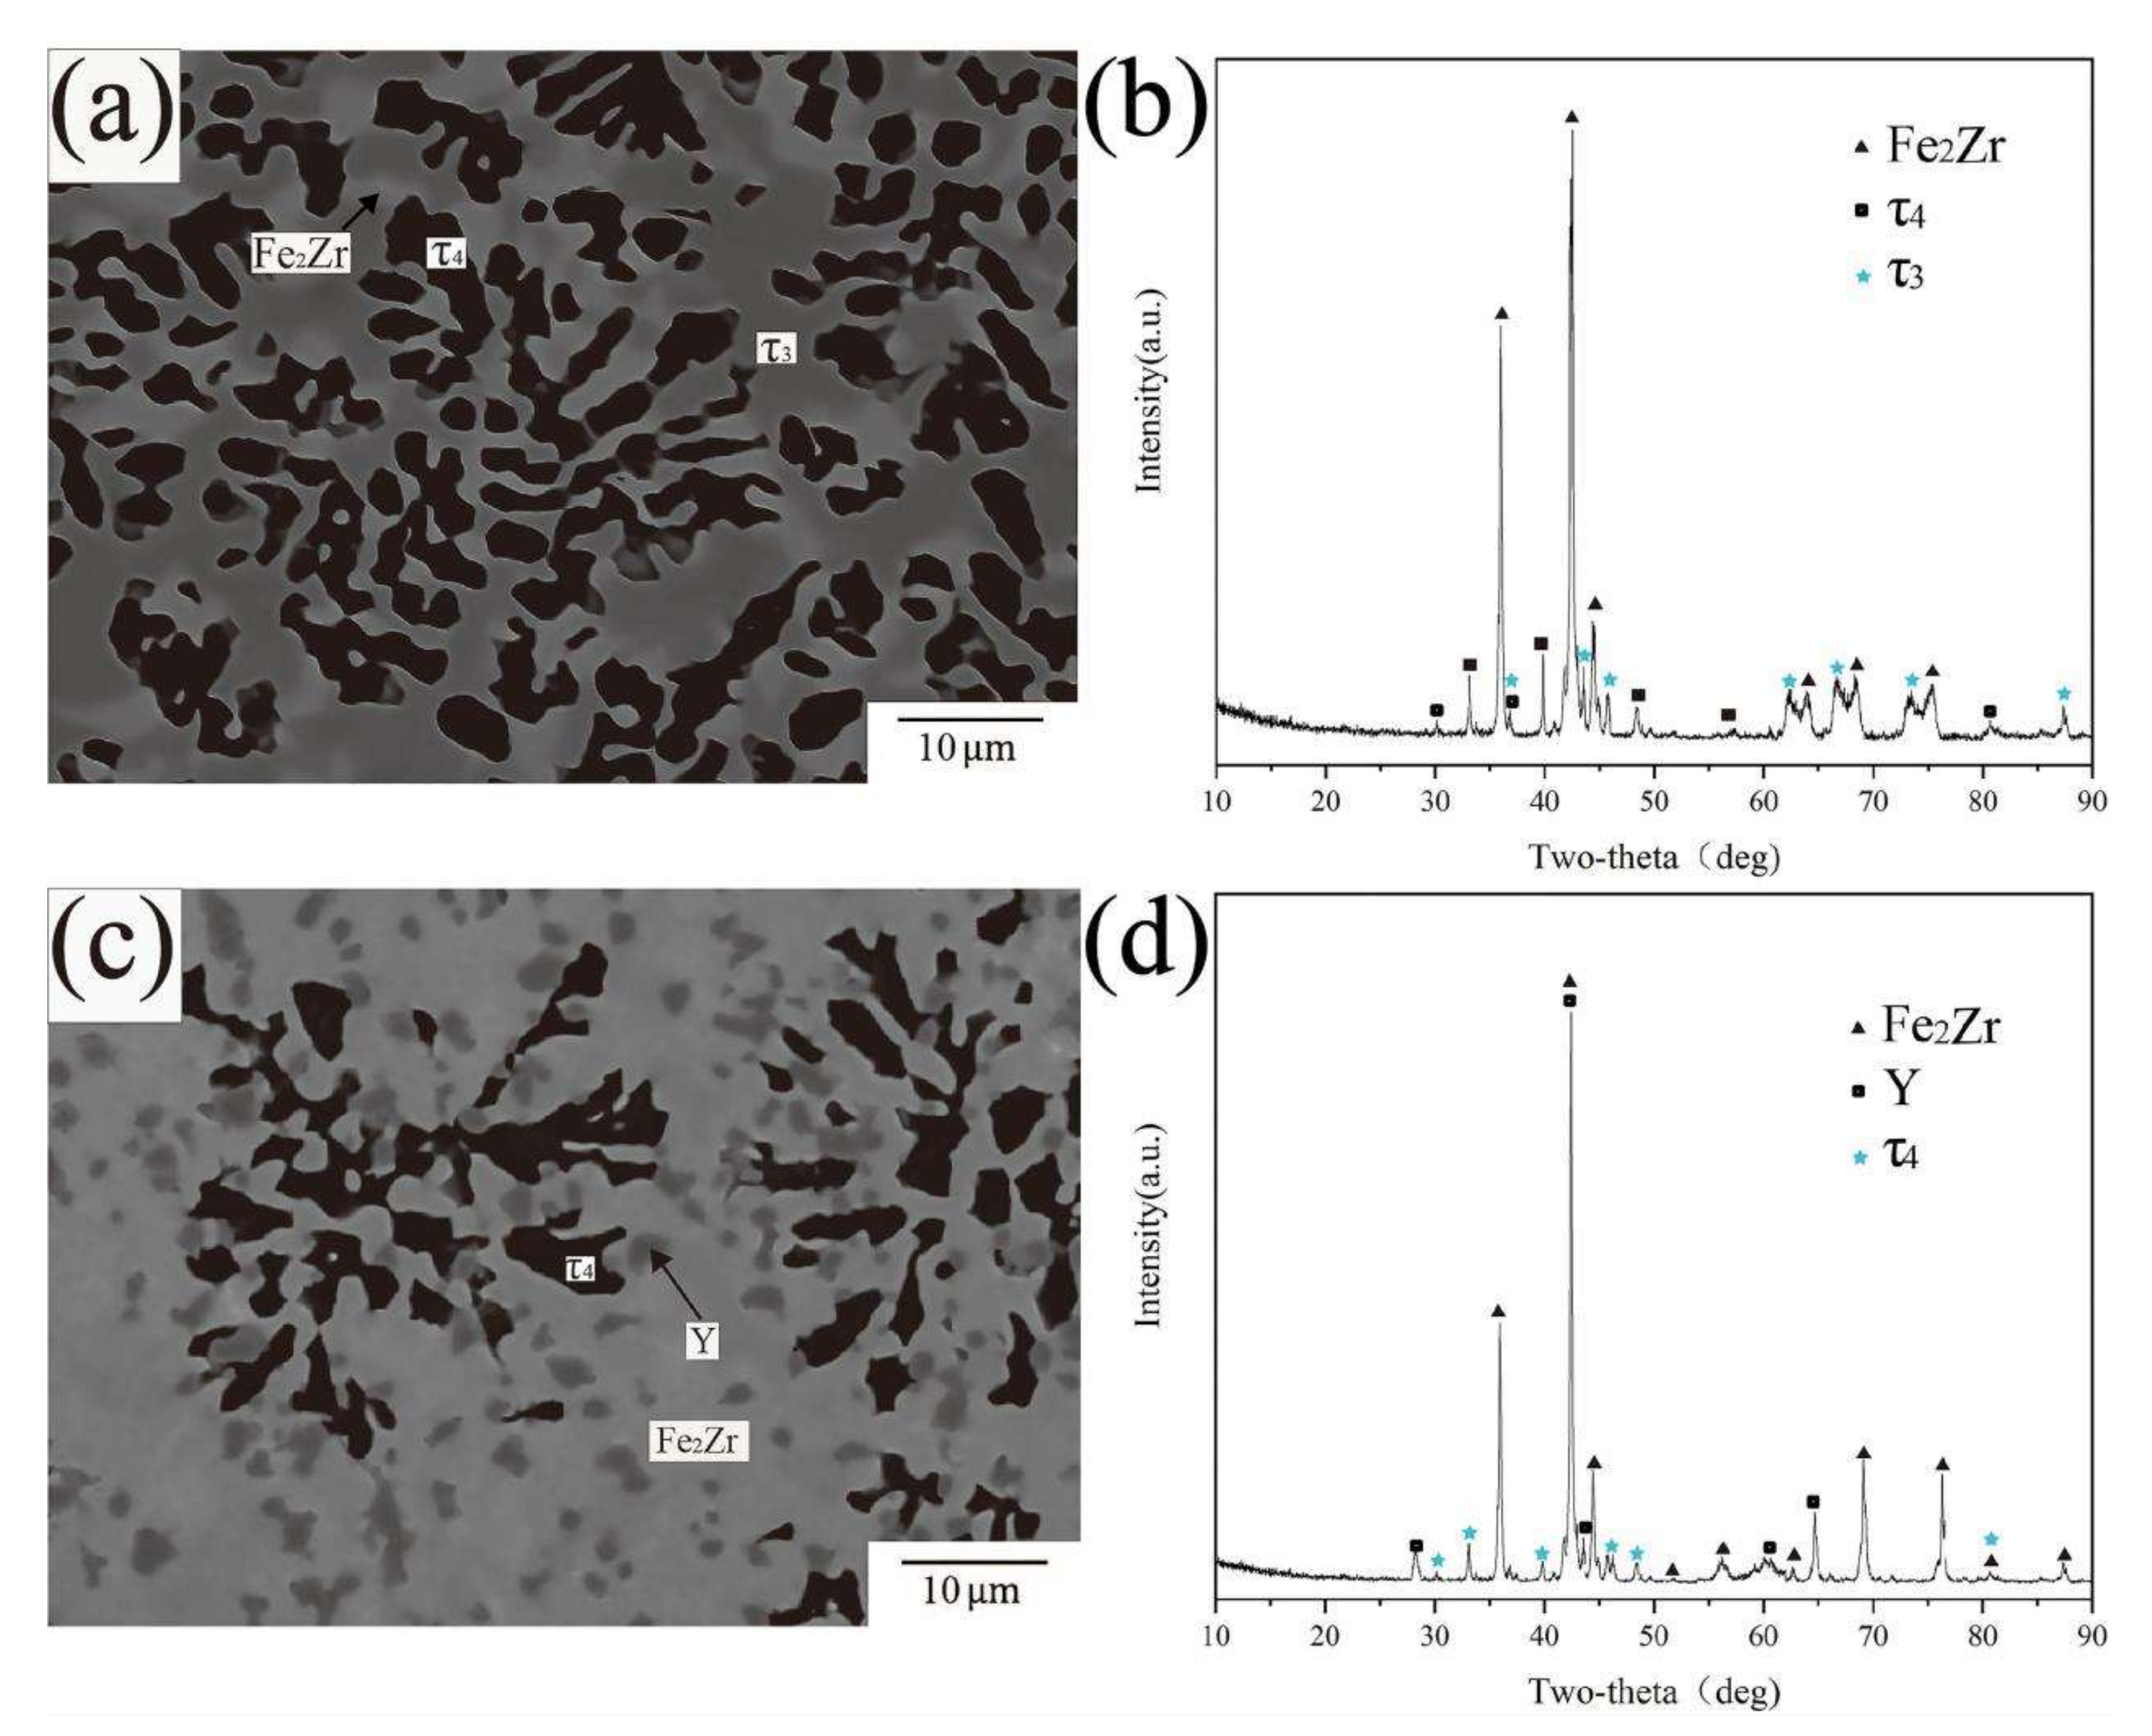
| A2 | Fe60Zr30Y10 | 60 | 30 | 10 | 59.22 | 24.46 | 16.32 | τ3 |
| 59.77 | 29.61 | 10.62 | τ4 | |||||
| 65.85 | 31.84 | 2.31 | Fe2Zr | |||||
| A3 | Fe10Zr60Y30 | 10 | 60 | 30 | 23.31 | 75.16 | 1.53 | FeZr3 |
| 2.81 | 95.82 | 1.37 | Zr | |||||
| 98.87 | 0.15 | 0.98 | Y | |||||
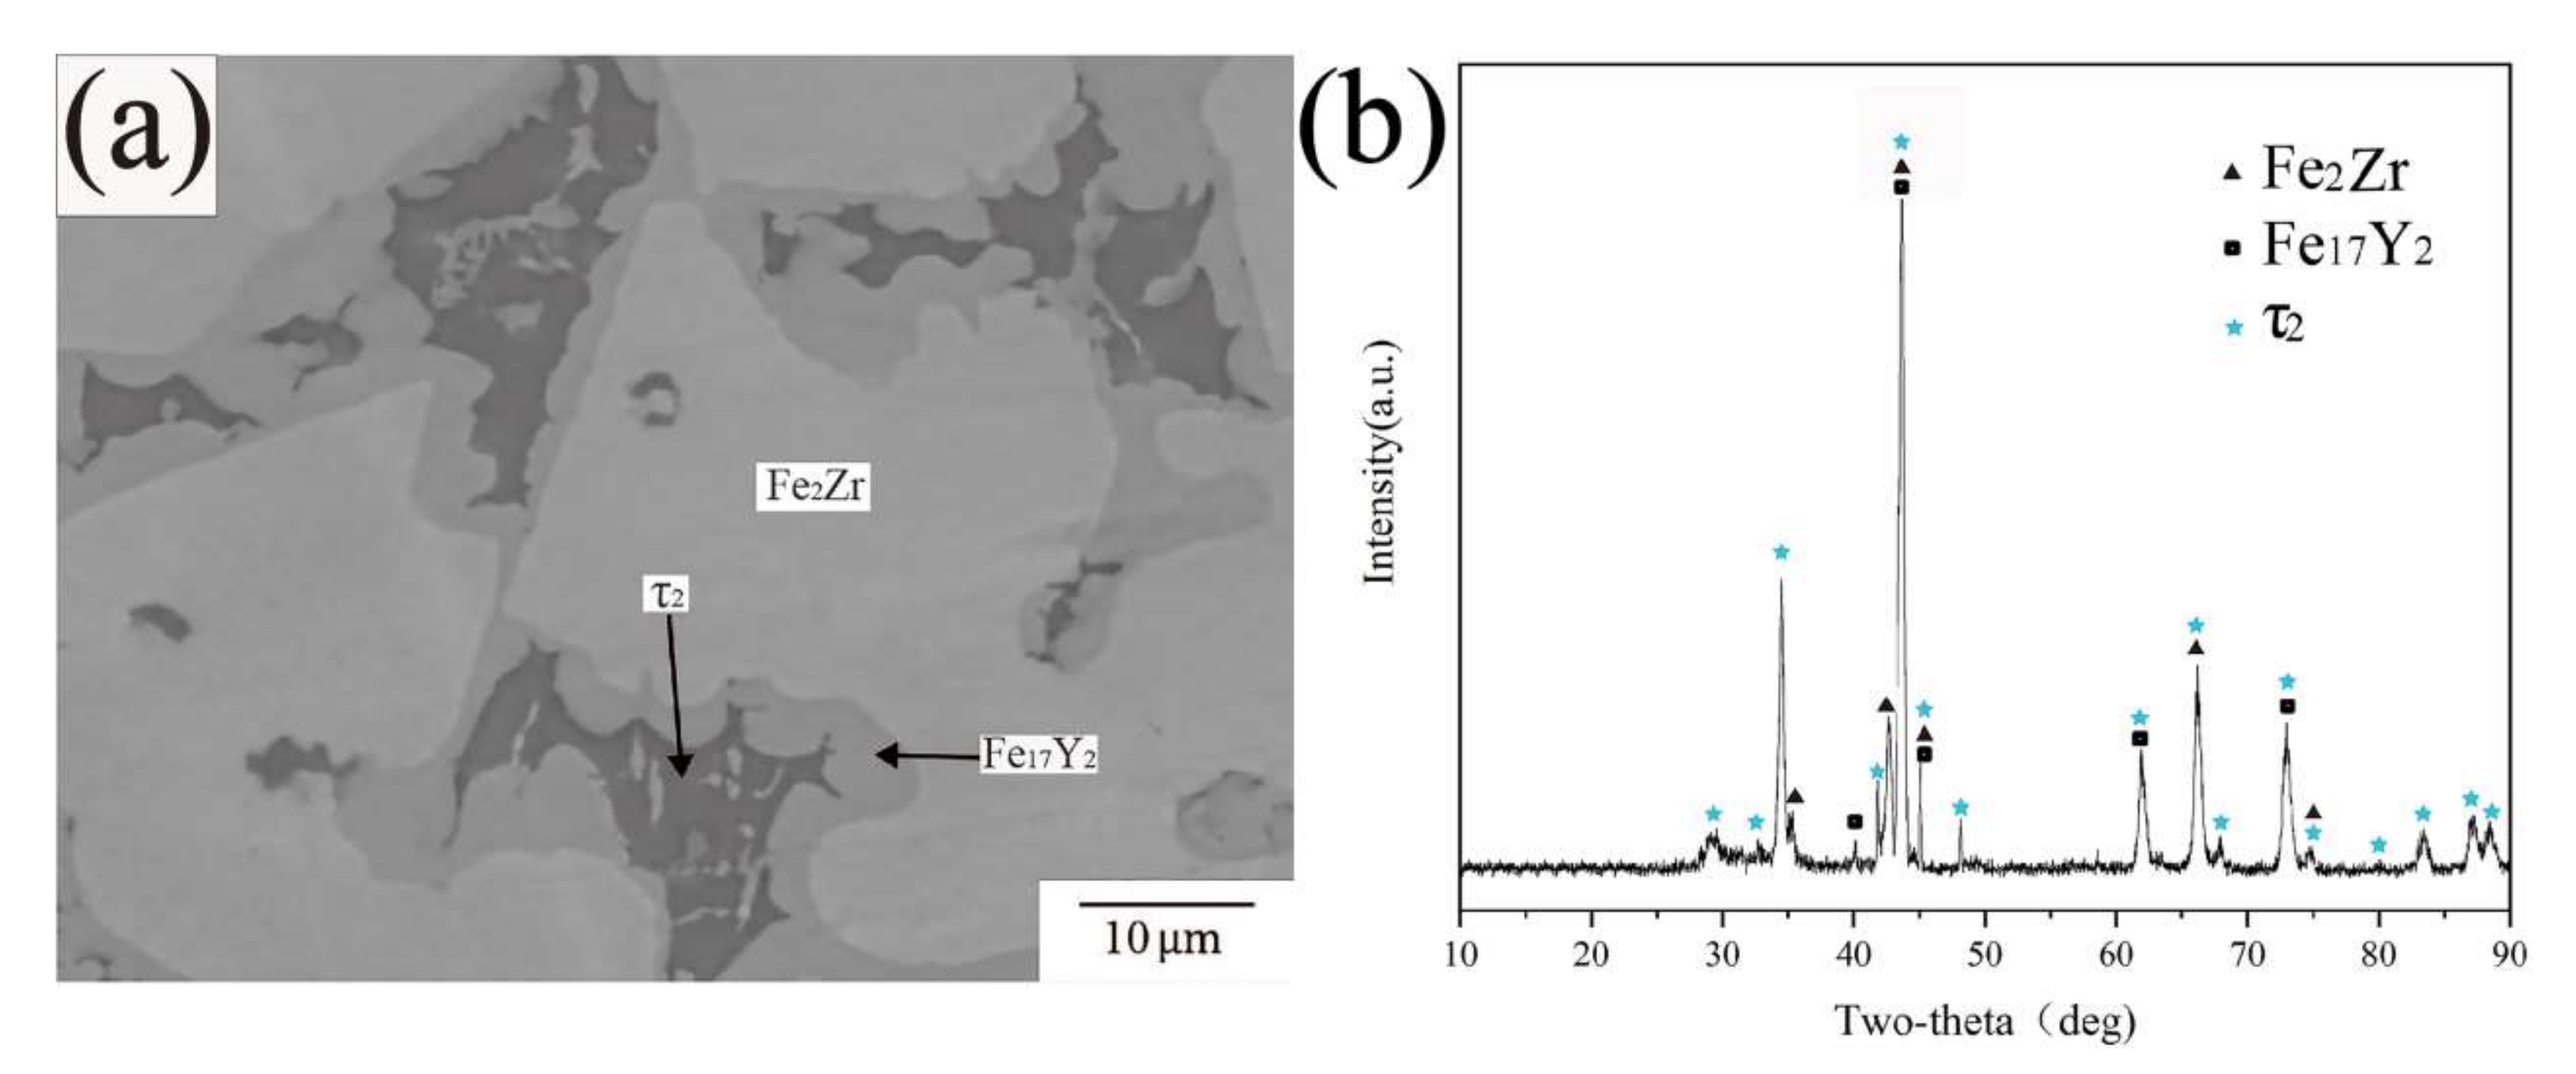
| A4 | Fe77Zr16Y7 | 77 | 16 | 7 | 68.14 | 29.31 | 2.55 | Fe2Zr |
| 75.81 | 16.12 | 8.07 | τ2 | |||||
| 88.24 | 0.21 | 11.55 | Fe17Y2 | |||||
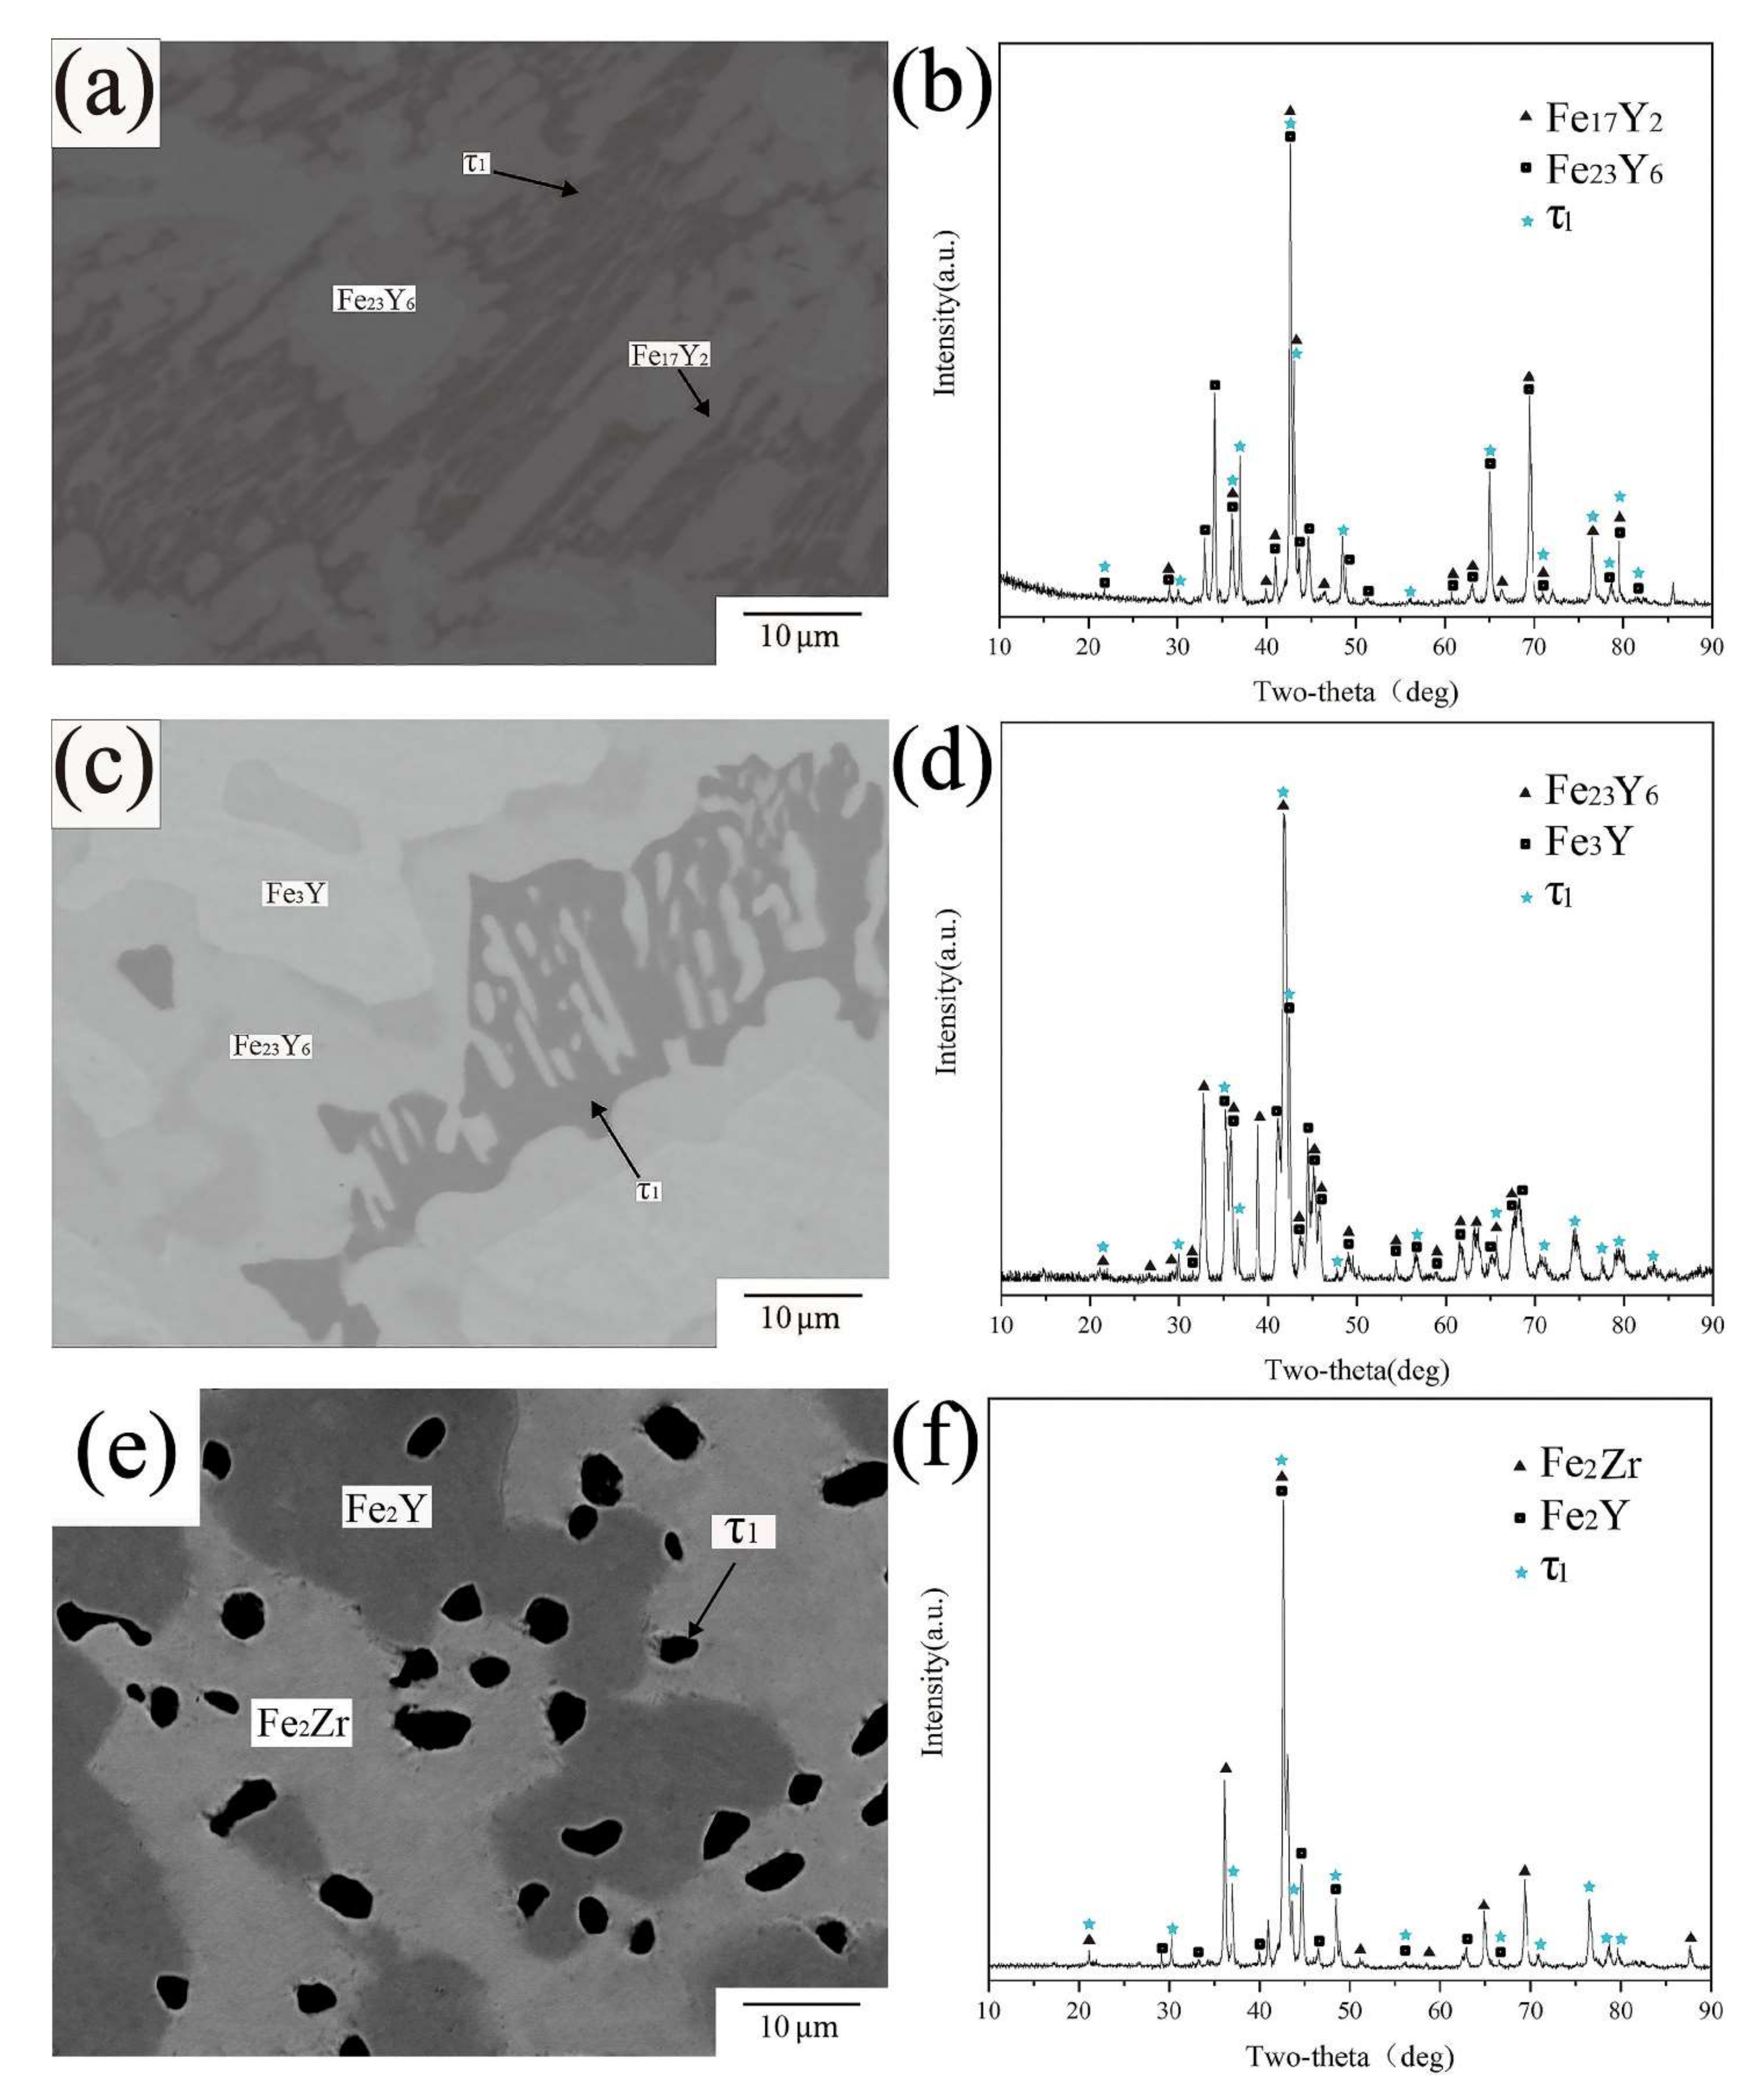
| A5 | Fe80Zr4Y16 | 80 | 4 | 16 | 75.49 | 10.12 | 14.39 | τ1 |
| 78.74 | 0.28 | 20.98 | Fe23Y6 | |||||
| 88.26 | 0.17 | 11.57 | Fe17Y2 | |||||
| A6 | Fe45Zr20Y35 | 45 | 20 | 35 | 57.34 | 23.89 | 18.77 | τ3 |
| 56.54 | 27.75 | 15.71 | τ4 | |||||
| 0.21 | 0.16 | 99.63 | Y | |||||
| A7 | Fe50Zr10Y40 | 50 | 10 | 40 | 59.14 | 21.3 | 19.56 | τ3 |
| 99.54 | 0.16 | 0.30 | Y | |||||
| 65.35 | 3.34 | 31.31 | Fe2Y | |||||
| A8 | Fe65Zr20Y15 | 65 | 20 | 15 | 65.86 | 31.84 | 2.30 | Fe2Zr |
| 61.11 | 22.54 | 16.35 | τ3 | |||||
| 65.38 | 3.36 | 31.26 | Fe2Y | |||||
| A9 | Fe55Zr30Y15 | 55 | 30 | 15 | 62.51 | 35.48 | 2.01 | Fe2Zr |
| 57.17 | 29.6 | 13.23 | τ4 | |||||
| 0.11 | 0.25 | 99.64 | Y | |||||
| A10 | Fe70Zr15Y15 | 70 | 15 | 15 | 74.62 | 11.77 | 13.61 | τ1 |
| 65.34 | 2.74 | 31.92 | Fe2Y | |||||
| 66.54 | 30.86 | 2.60 | Fe2Zr | |||||
| A11 | Fe62Zr32Y6 | 62 | 32 | 6 | 65.13 | 33.11 | 1.76 | Fe2Zr |
| 59.35 | 30.36 | 10.29 | τ4 | |||||
| A12 | Fe20Zr60Y20 | 20 | 60 | 20 | 0.15 | 0.24 | 99.61 | Y |
| 23.59 | 74.42 | 1.99 | FeZr3 | |||||
| A13 | Fe61Zr25Y14 | 61 | 25 | 14 | 59.44 | 24.42 | 16.14 | τ3 |
| 65.87 | 31.82 | 2.31 | Fe2Zr | |||||
| A14 | FeZr74Y25 | 1 | 74 | 25 | 1.52 | 96.93 | 1.55 | Zr |
| 0.14 | 0.18 | 99.68 | Y | |||||
| A15 | Fe15Zr84Y | 15 | 84 | 1 | 1.19 | 95.92 | 2.89 | Zr |
| 23.21 | 75.96 | 0.83 | FeZr3 | |||||
| A16 | Fe29Zr70Y | 29 | 70 | 1 | 24.33 | 74.41 | 1.26 | FeZr3 |
| 62.45 | 37.44 | 0.11 | Fe2Zr | |||||
| A17 | Fe75Zr6Y19 | 75 | 6 | 19 | 74.71 | 9.69 | 15.6 | τ1 |
| 75.33 | 0.25 | 24.42 | Fe3Y | |||||
| 78.75 | 0.33 | 20.92 | Fe23Y6 | |||||
| A18 | Fe55Zr30Y15 | 55 | 30 | 15 | 62.31 | 35.87 | 1.82 | Fe2Zr |
| 0.34 | 0.13 | 99.53 | Y | |||||
| A19 | Fe50Zr25Y25 | 50 | 25 | 25 | 56.25 | 27.91 | 15.84 | τ4 |
| 0.21 | 0.11 | 99.68 | Y | |||||
| A20 | Fe39ZrY60 | 39 | 1 | 60 | 65.45 | 1.86 | 32.69 | Fe2Y |
| 0.24 | 0.23 | 99.53 | Y | |||||
| A21 | Fe70ZrY29 | 70 | 1 | 29 | 66.87 | 0.16 | 32.97 | Fe2Y |
| 73.41 | 0.54 | 26.05 | Fe3Y | |||||
| A22 | Fe66Zr10Y24 | 66 | 10 | 24 | 65.66 | 2.74 | 31.6 | Fe2Y |
| 66.35 | 30.82 | 2.83 | Fe2Zr | |||||
| A23 | Fe4Zr8Y88 | 4 | 8 | 88 | 80.33 | 19.37 | 0.30 | Fe23Zr6 |
| 88.21 | 0.15 | 11.64 | Fe17Y2 | |||||
| 98.56 | 0.74 | 0.70 | Fe | |||||
| A24 | Fe60Zr18Y22 | 60 | 18 | 22 | 65.39 | 3.18 | 31.43 | Fe2Y |
| 60.25 | 21.24 | 18.51 | τ3 | |||||
| Alloy (No.) | Chemical Composition | Nominal Composition (at.%) | Experimental Results (at.%) | Phase Determination | ||||
|---|---|---|---|---|---|---|---|---|
| Fe | Zr | Y | Fe | Zr | Y | |||
| B1 | Fe10Zr70Y20 | 10 | 70 | 20 | 62.21 | 37.72 | 0.07 | Fe2Zr |
| 31.72 | 67.37 | 0.91 | FeZr2 | |||||
| 0.13 | 0.21 | 99.66 | Y | |||||
| B2 | Fe60Zr30Y10 | 60 | 30 | 10 | 59.25 | 24.41 | 16.34 | τ3 |
| 59.73 | 29.66 | 10.61 | τ4 | |||||
| 65.42 | 31.21 | 3.37 | Fe2Zr | |||||
| B3 | Fe10Zr60Y30 | 10 | 60 | 30 | 24.34 | 74.48 | 1.18 | FeZr3 |
| 93.86 | 3.84 | 2.3 | Zr | |||||
| 0.35 | 0.13 | 99.52 | Y | |||||
| B4 | Fe77Zr16Y7 | 77 | 16 | 7 | 68.15 | 29.33 | 2.52 | Fe2Zr |
| 75.84 | 16.17 | 7.99 | τ2 | |||||
| 88.25 | 0.16 | 11.59 | Fe17Y2 | |||||
| B5 | Fe80Zr4Y16 | 80 | 4 | 16 | 77.48 | 9.59 | 12.93 | τ1 |
| 78.77 | 0.27 | 20.96 | Fe23Y6 | |||||
| 88.22 | 0.15 | 11.63 | Fe17Y2 | |||||
| B6 | Fe45Zr20Y35 | 45 | 20 | 35 | 57.63 | 22.74 | 19.63 | τ3 |
| 56.54 | 27.70 | 15.76 | τ4 | |||||
| 0.12 | 0.25 | 99.63 | Y | |||||
| B7 | Fe50Zr10Y40 | 50 | 10 | 40 | 58.29 | 20.01 | 21.7 | τ3 |
| 0.35 | 0.16 | 99.49 | Y | |||||
| 65.31 | 3.36 | 31.33 | Fe2Y | |||||
| B8 | Fe65Zr20Y15 | 65 | 20 | 15 | 65.47 | 31.28 | 3.25 | Fe2Zr |
| 60.55 | 21.16 | 18.29 | τ3 | |||||
| 65.34 | 12.61 | 22.05 | Fe2Y | |||||
| B9 | Fe55Zr30Y15 | 55 | 30 | 15 | 61.89 | 34.82 | 3.29 | Fe2Zr |
| 56.68 | 28.8 | 14.52 | τ4 | |||||
| 0.51 | 0.20 | 99.29 | Y | |||||
| B10 | Fe70Zr15Y15 | 70 | 15 | 15 | 73.14 | 12.48 | 14.38 | τ1 |
| 65.33 | 2.71 | 31.96 | Fe2Y | |||||
| 66.59 | 30.65 | 2.76 | Fe2Zr | |||||
| B11 | Fe62Zr32Y6 | 62 | 32 | 6 | 63.23 | 32.45 | 4.32 | Fe2Zr |
| 10.28 | 30.79 | 58.93 | τ4 | |||||
| B12 | Fe20Zr60Y20 | 20 | 60 | 20 | 0.41 | 0.38 | 99.21 | Y |
| 1.73 | 75.2 | 23.07 | FeZr3 | |||||
| B13 | Fe61Zr25Y14 | 61 | 25 | 14 | 60.17 | 23.12 | 16.71 | τ3 |
| 65.54 | 31.35 | 3.11 | Fe2Zr | |||||
| B14 | FeZr74Y25 | 1 | 74 | 25 | 1.81 | 96.55 | 1.64 | Zr |
| 0.15 | 0.25 | 99.6 | Y | |||||
| B15 | Fe15Zr84Y | 15 | 84 | 1 | 0.87 | 94.83 | 4.3 | Zr |
| 22.61 | 76.52 | 0.87 | FeZr3 | |||||
| B16 | Fe29Zr70Y | 29 | 70 | 1 | 24.45 | 74.89 | 0.66 | FeZr3 |
| 31.31 | 68.61 | 0.08 | FeZr2 | |||||
| B17 | Fe75Zr6Y19 | 75 | 6 | 19 | 75.74 | 9.57 | 14.69 | τ1 |
| 75.31 | 0.36 | 24.33 | Fe3Y | |||||
| 77.51 | 0.85 | 21.64 | Fe23Y6 | |||||
| B18 | Fe55Zr30Y15 | 55 | 30 | 15 | 61.94 | 36.13 | 1.93 | Fe2Zr |
| 0.10 | 0.21 | 99.69 | Y | |||||
| B19 | Fe50Zr25Y25 | 50 | 25 | 25 | 56.24 | 28.29 | 15.47 | τ4 |
| 0.32 | 0.15 | 99.53 | Y | |||||
| B20 | Fe39ZrY60 | 39 | 1 | 60 | 65.41 | 1.81 | 32.78 | Fe2Y |
| 0.14 | 0.32 | 99.54 | Y | |||||
| B21 | Fe70ZrY29 | 70 | 1 | 29 | 66.96 | 32.52 | 0.52 | Fe2Y |
| 75.06 | 0.10 | 24.84 | Fe3Y | |||||
| B22 | Fe66Zr10Y24 | 66 | 10 | 24 | 65.54 | 3.36 | 31.1 | Fe2Y |
| 66.11 | 30.91 | 2.98 | Fe2Zr | |||||
| B23 | Fe20Zr60Y20 | 20 | 60 | 20 | 22.95 | 75.47 | 1.58 | FeZr3 |
| 0.13 | 0.13 | 99.74 | Y | |||||
| 31.20 | 68.64 | 0.16 | FeZr2 | |||||
| B24 | Fe84.5Zr12.5Y3 | 84.5 | 12.5 | 3 | 80.31 | 19.61 | 0.08 | Fe23Zr6 |
| 88.87 | 0.83 | 10.3 | Fe17Y2 | |||||
| 99.15 | 0.17 | 0.68 | Fe | |||||
| B25 | Fe60Zr18Y22 | 60 | 18 | 22 | 65.32 | 3.37 | 31.31 | Fe2Y |
| 59.21 | 20.29 | 20.5 | τ3 | |||||
Publisher’s Note: MDPI stays neutral with regard to jurisdictional claims in published maps and institutional affiliations. |
© 2022 by the authors. Licensee MDPI, Basel, Switzerland. This article is an open access article distributed under the terms and conditions of the Creative Commons Attribution (CC BY) license (https://creativecommons.org/licenses/by/4.0/).
Share and Cite
Li, C.; Song, Q.; Yang, X.; Wei, Y.; Hu, Q.; Liu, L.; Zhang, L. Experimental Investigation of the Phase Relations in the Fe-Zr-Y Ternary System. Materials 2022, 15, 593. https://doi.org/10.3390/ma15020593
Li C, Song Q, Yang X, Wei Y, Hu Q, Liu L, Zhang L. Experimental Investigation of the Phase Relations in the Fe-Zr-Y Ternary System. Materials. 2022; 15(2):593. https://doi.org/10.3390/ma15020593
Chicago/Turabian StyleLi, Chenbo, Qian Song, Xianwen Yang, Yuduo Wei, Qi Hu, Libin Liu, and Ligang Zhang. 2022. "Experimental Investigation of the Phase Relations in the Fe-Zr-Y Ternary System" Materials 15, no. 2: 593. https://doi.org/10.3390/ma15020593
APA StyleLi, C., Song, Q., Yang, X., Wei, Y., Hu, Q., Liu, L., & Zhang, L. (2022). Experimental Investigation of the Phase Relations in the Fe-Zr-Y Ternary System. Materials, 15(2), 593. https://doi.org/10.3390/ma15020593