
Research and TLS (LiDAR) Construction Diagnostics of Clay Brick Masonry Arched Stairs


Abstract
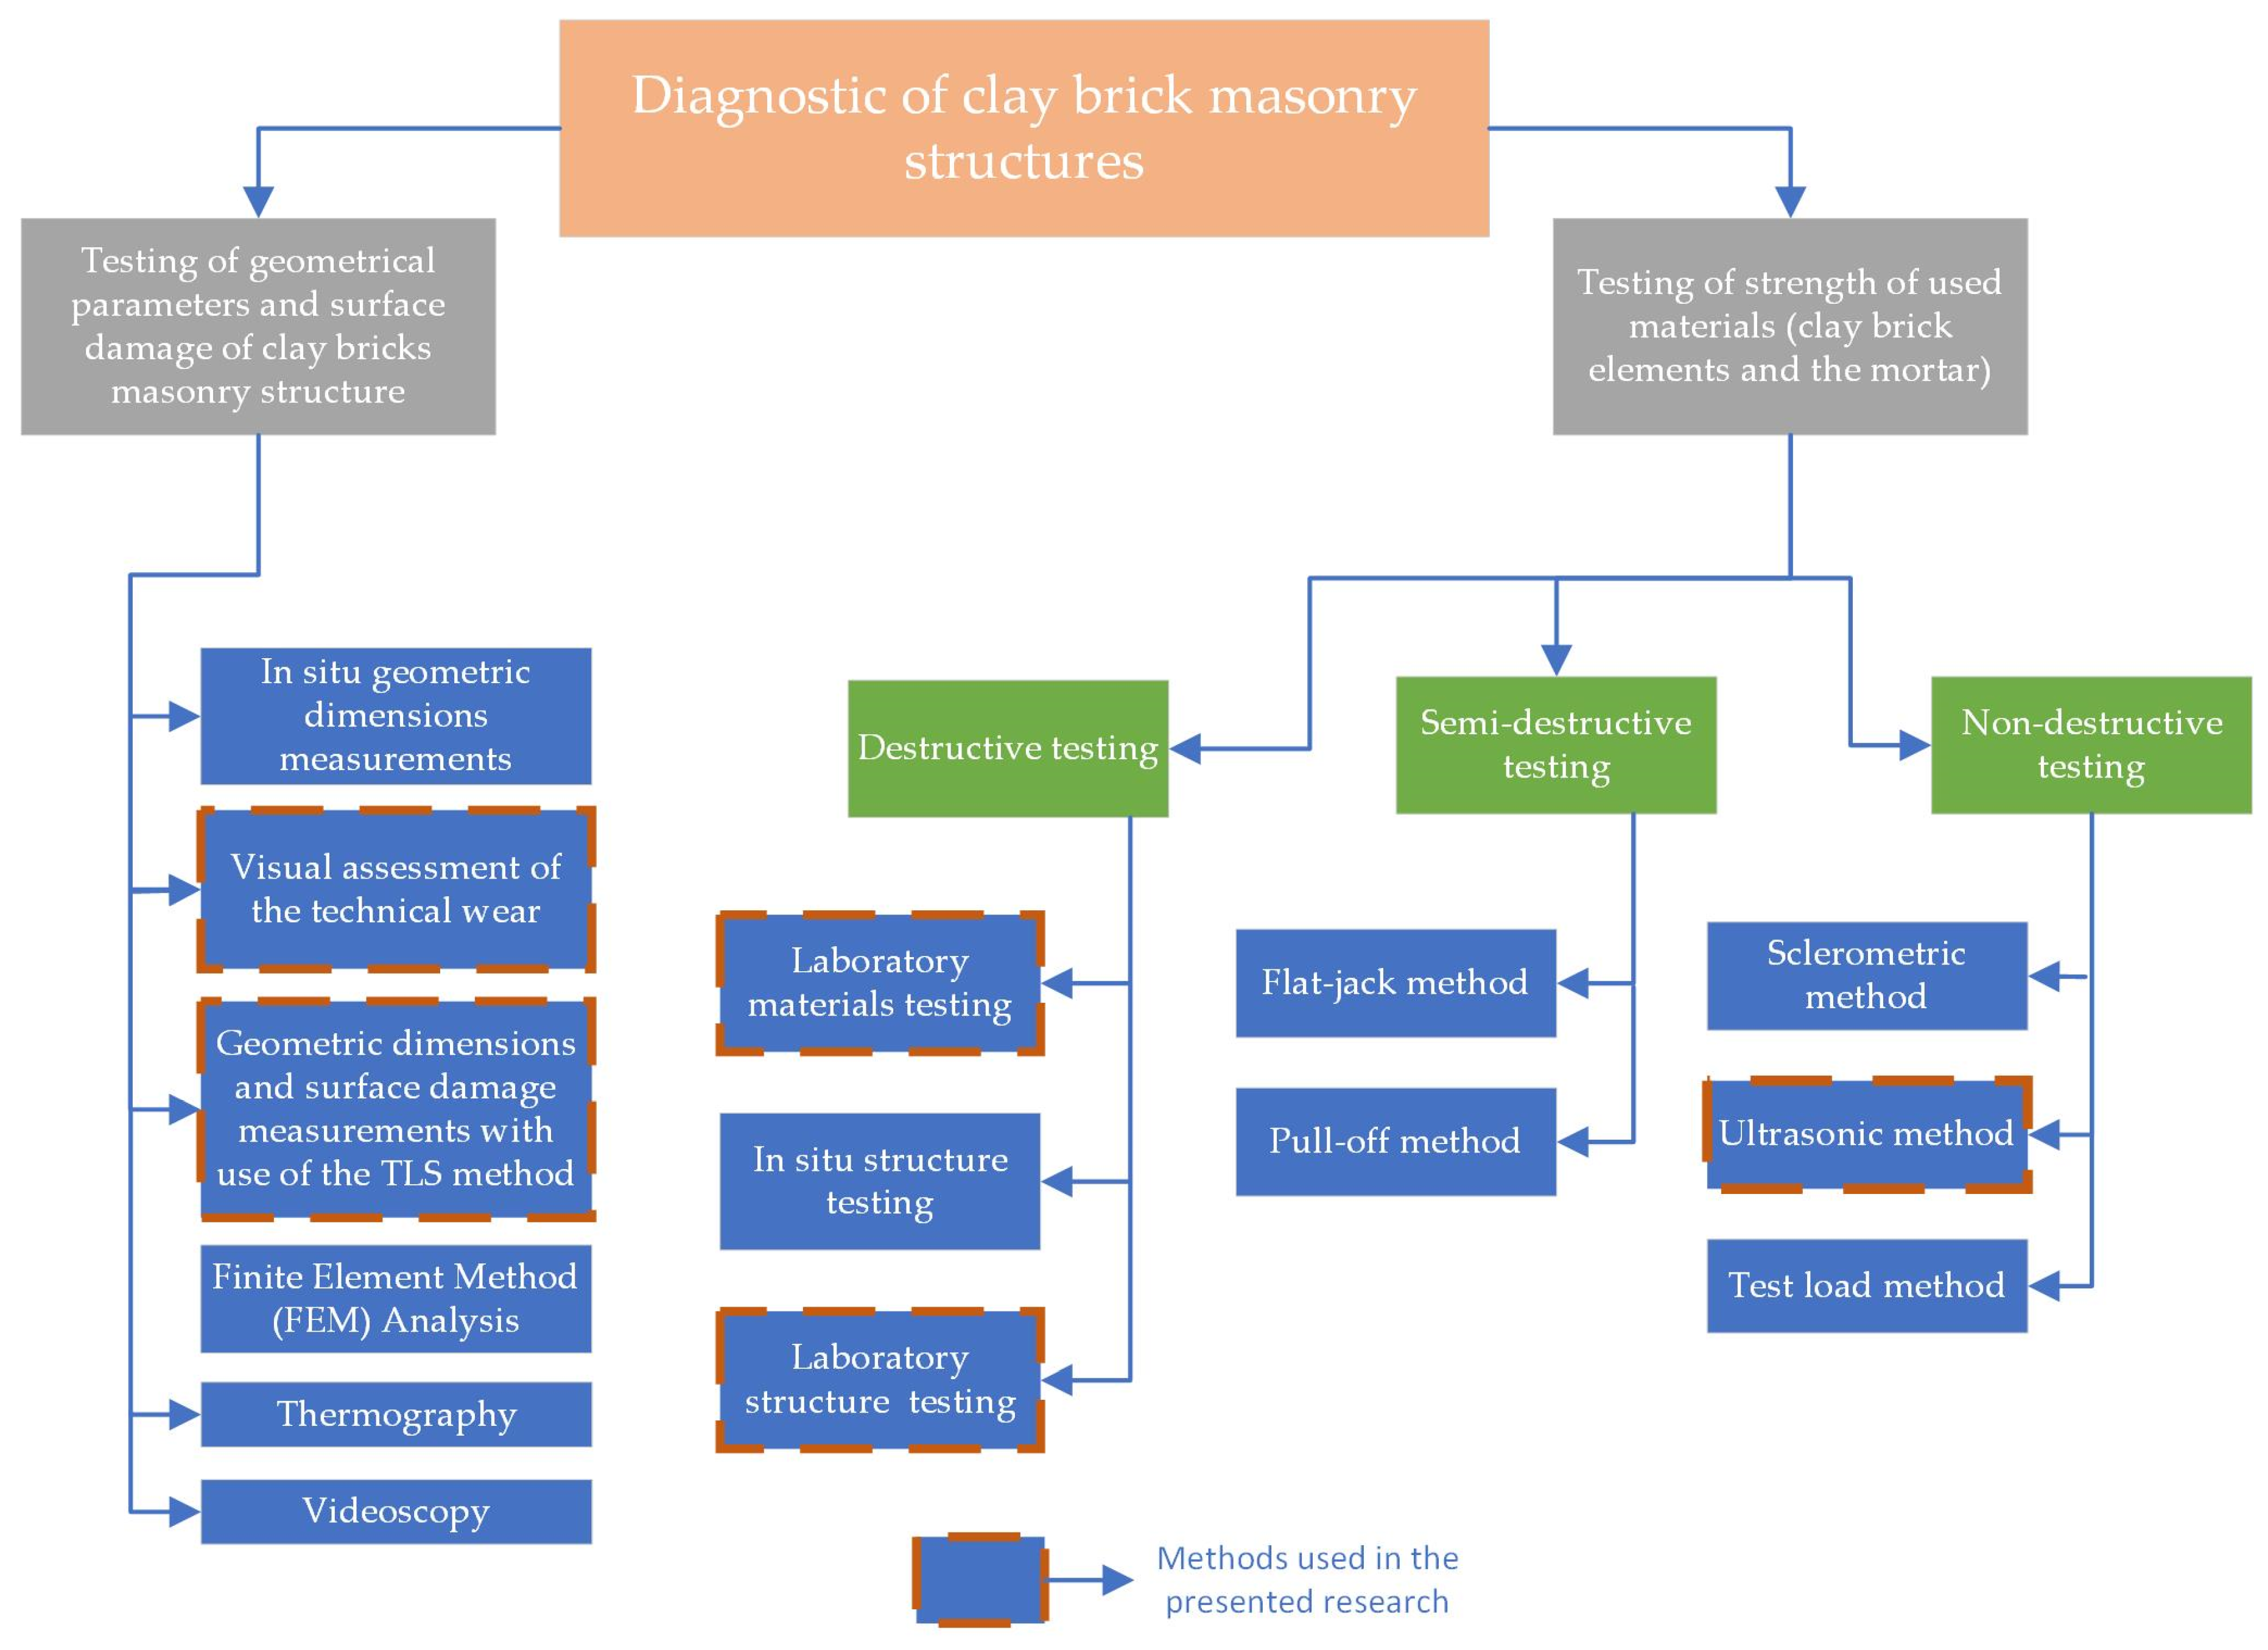
1. Introduction
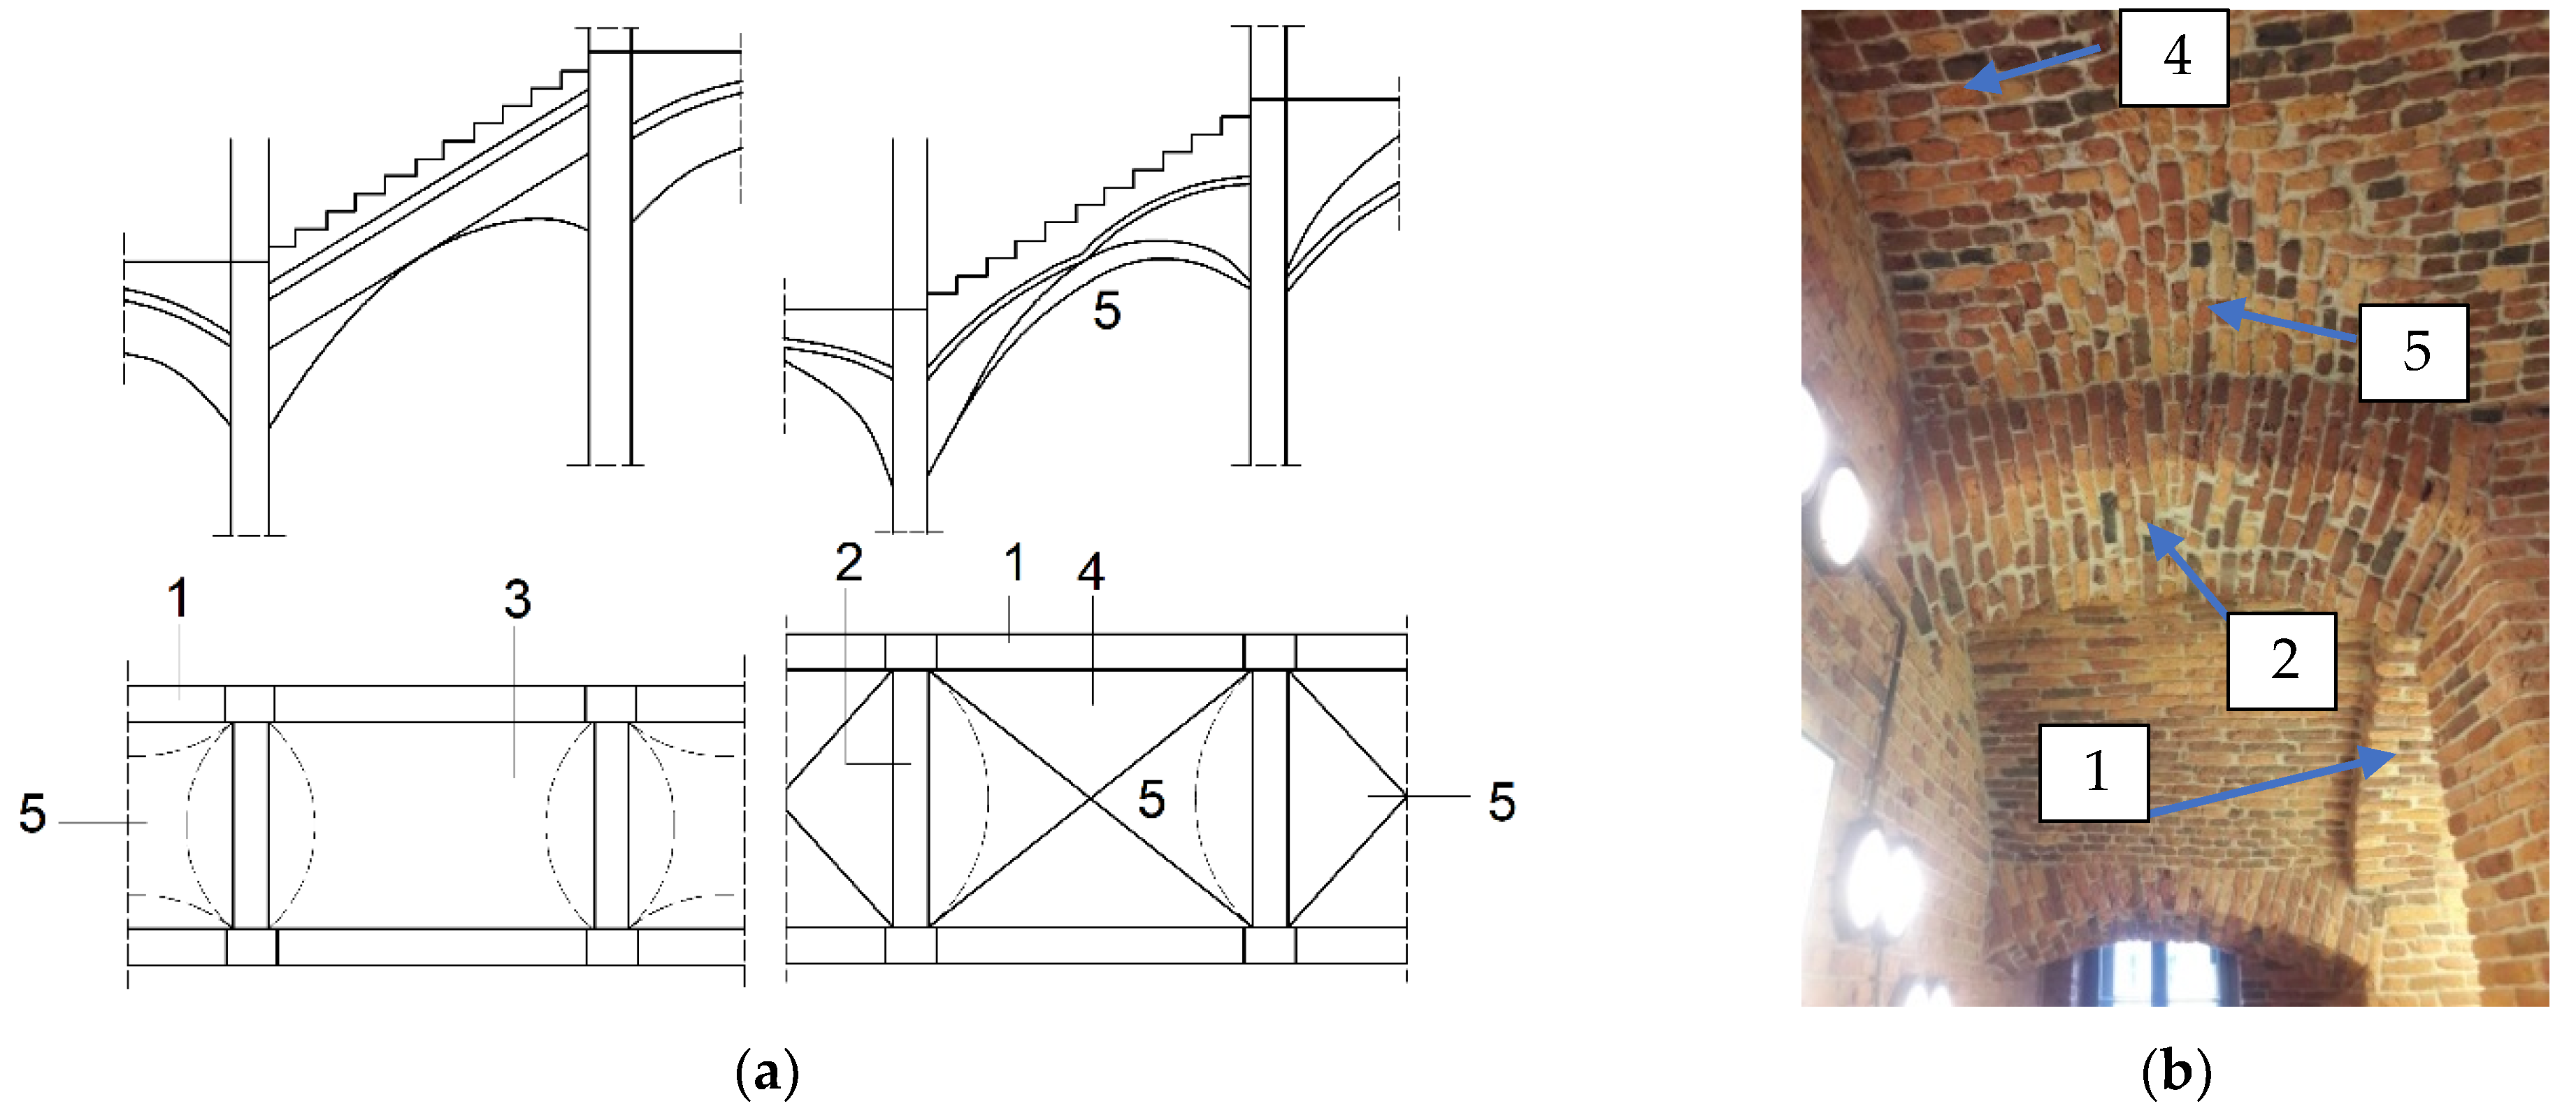
2. Real-Life Structure
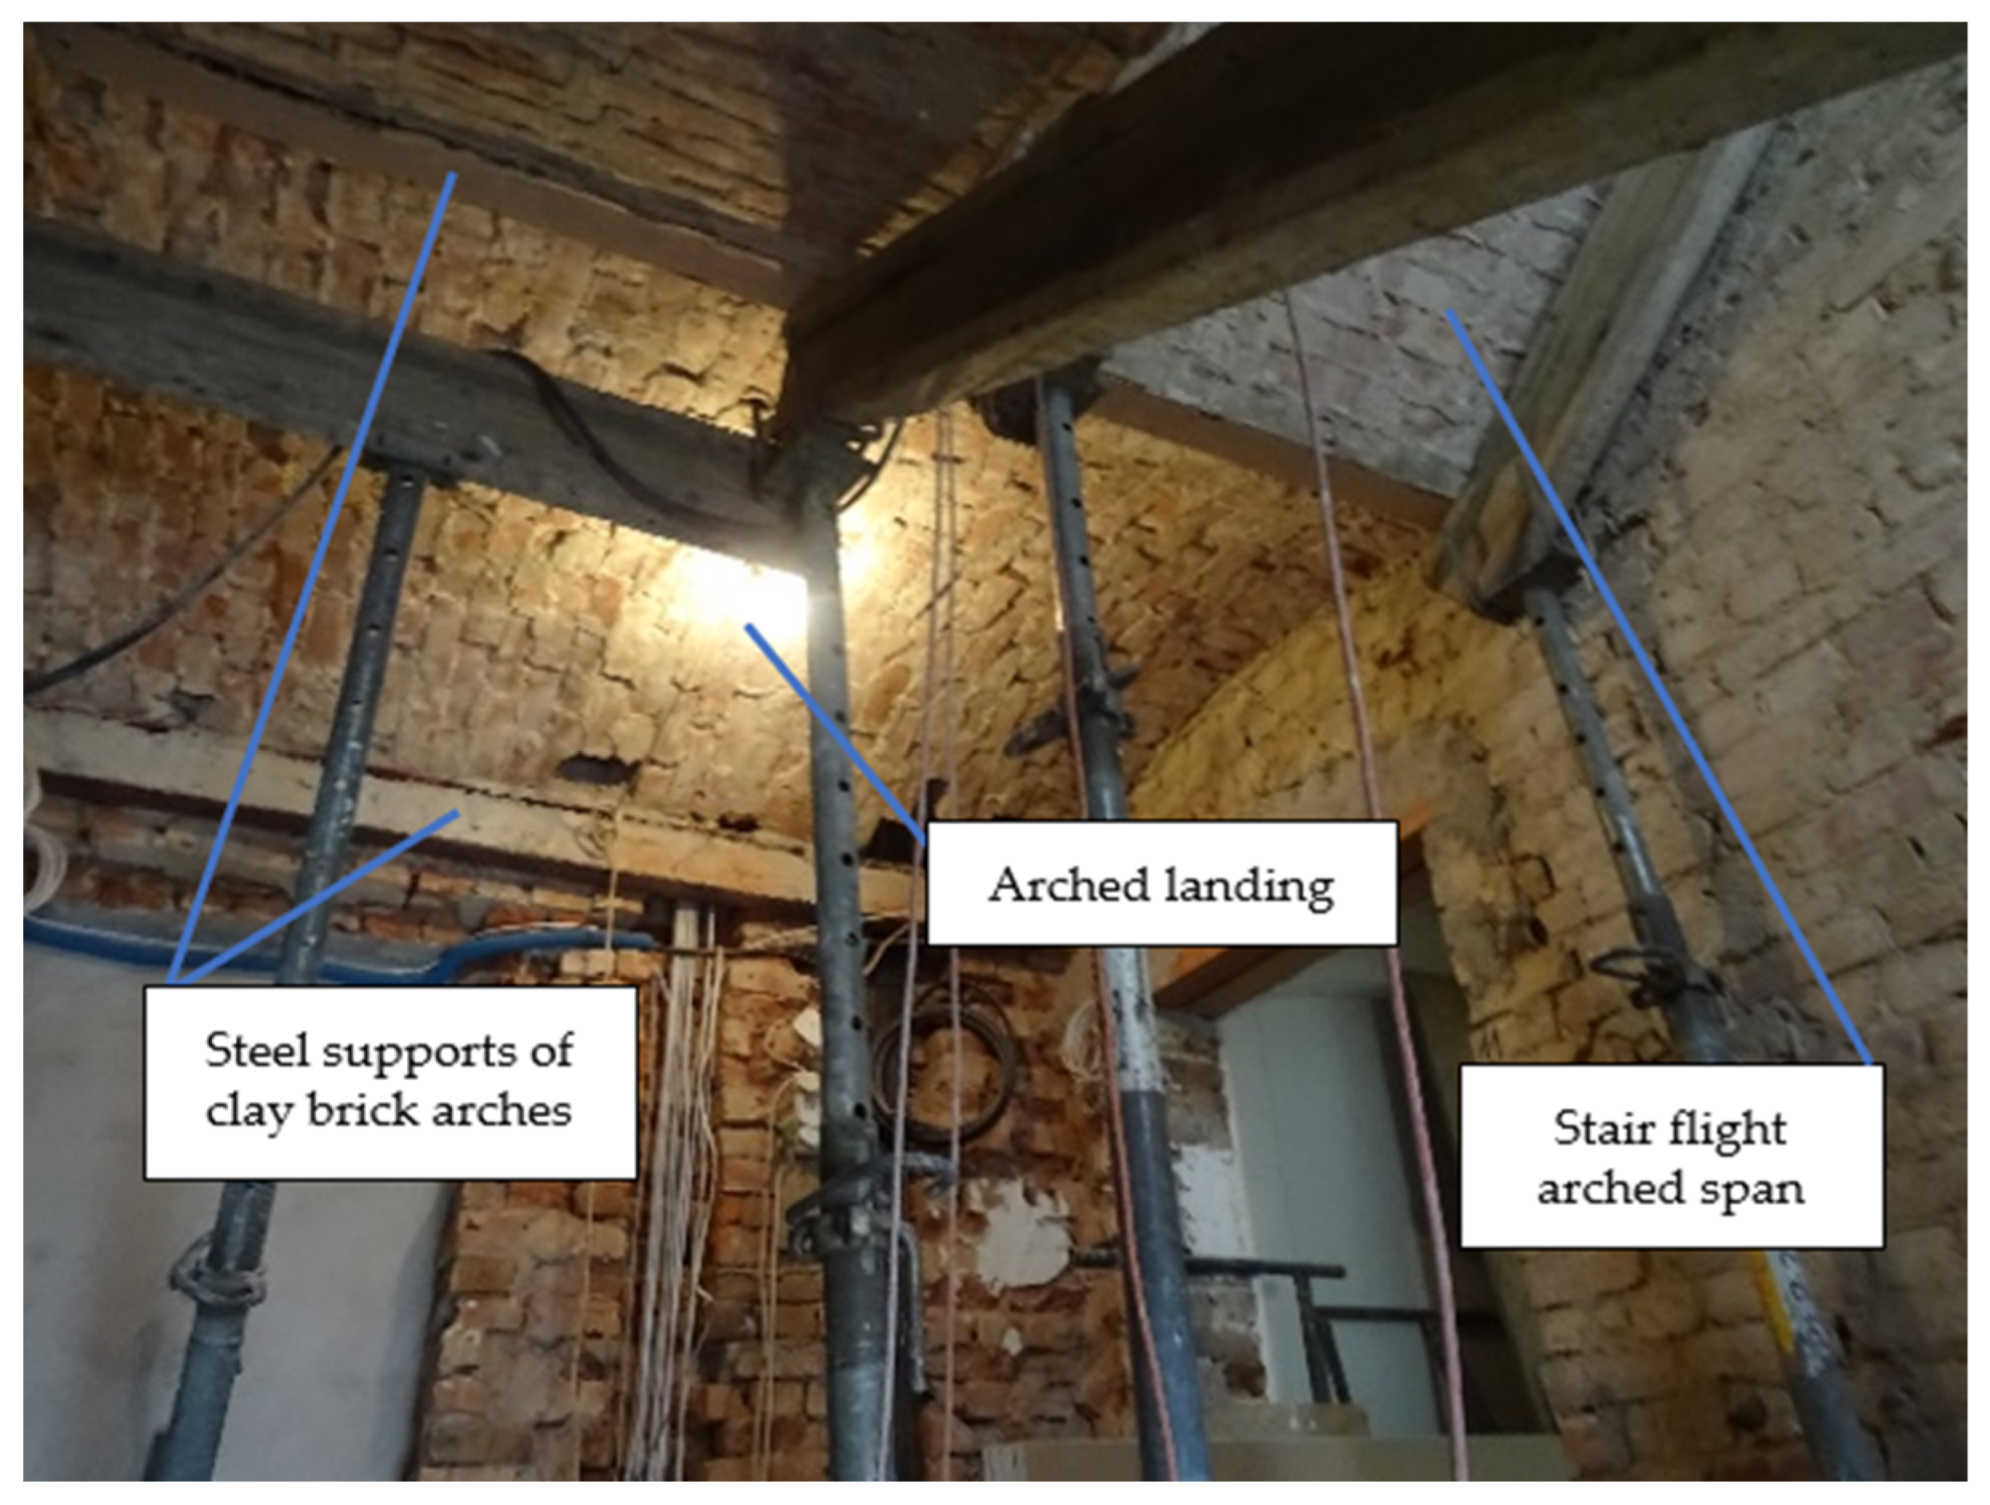
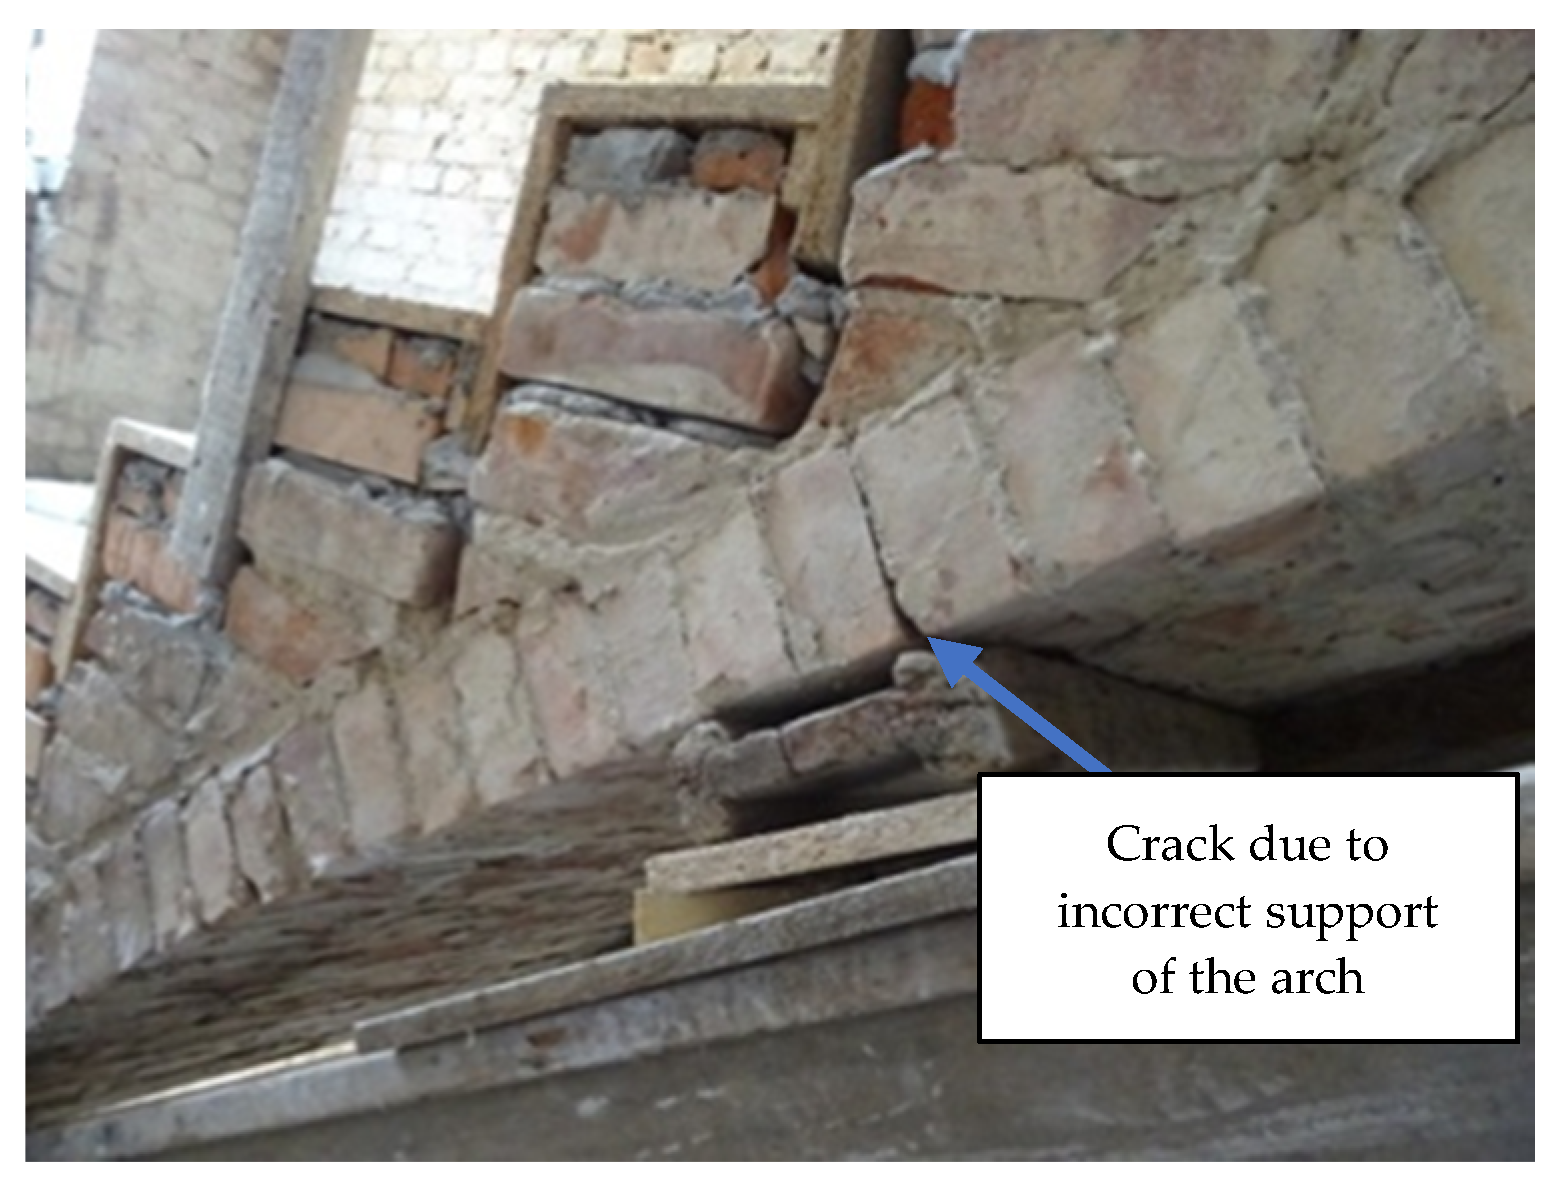
2.1. Case Study Description
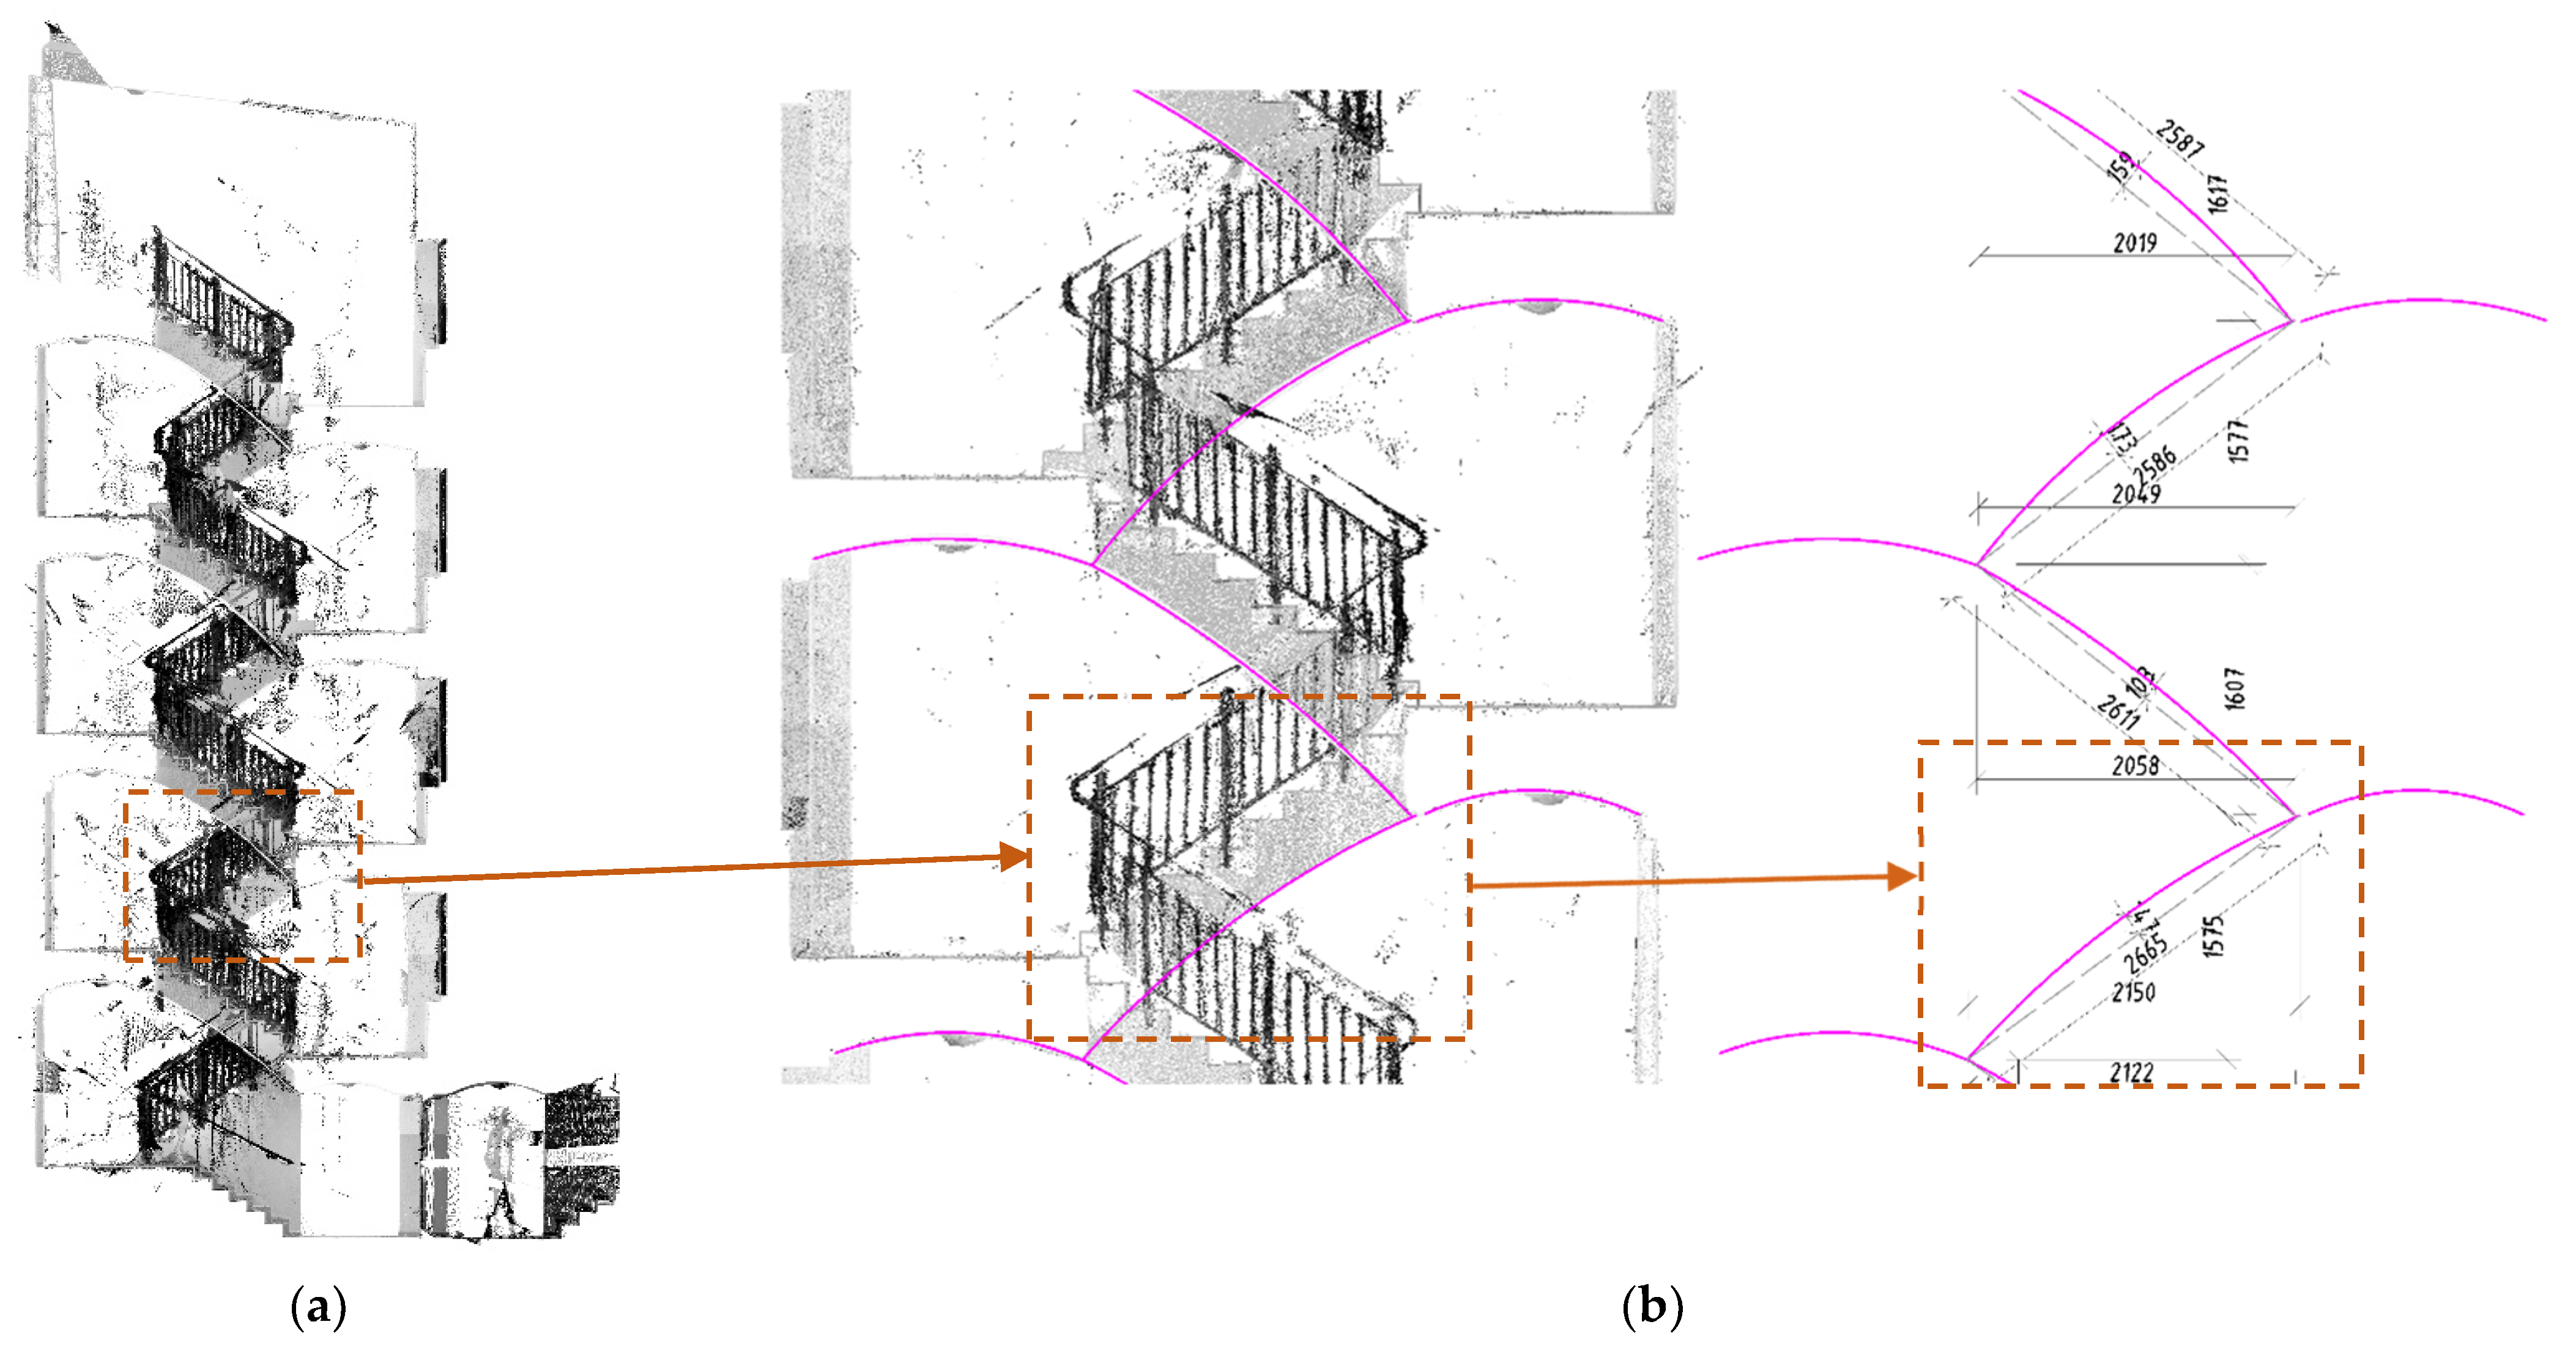
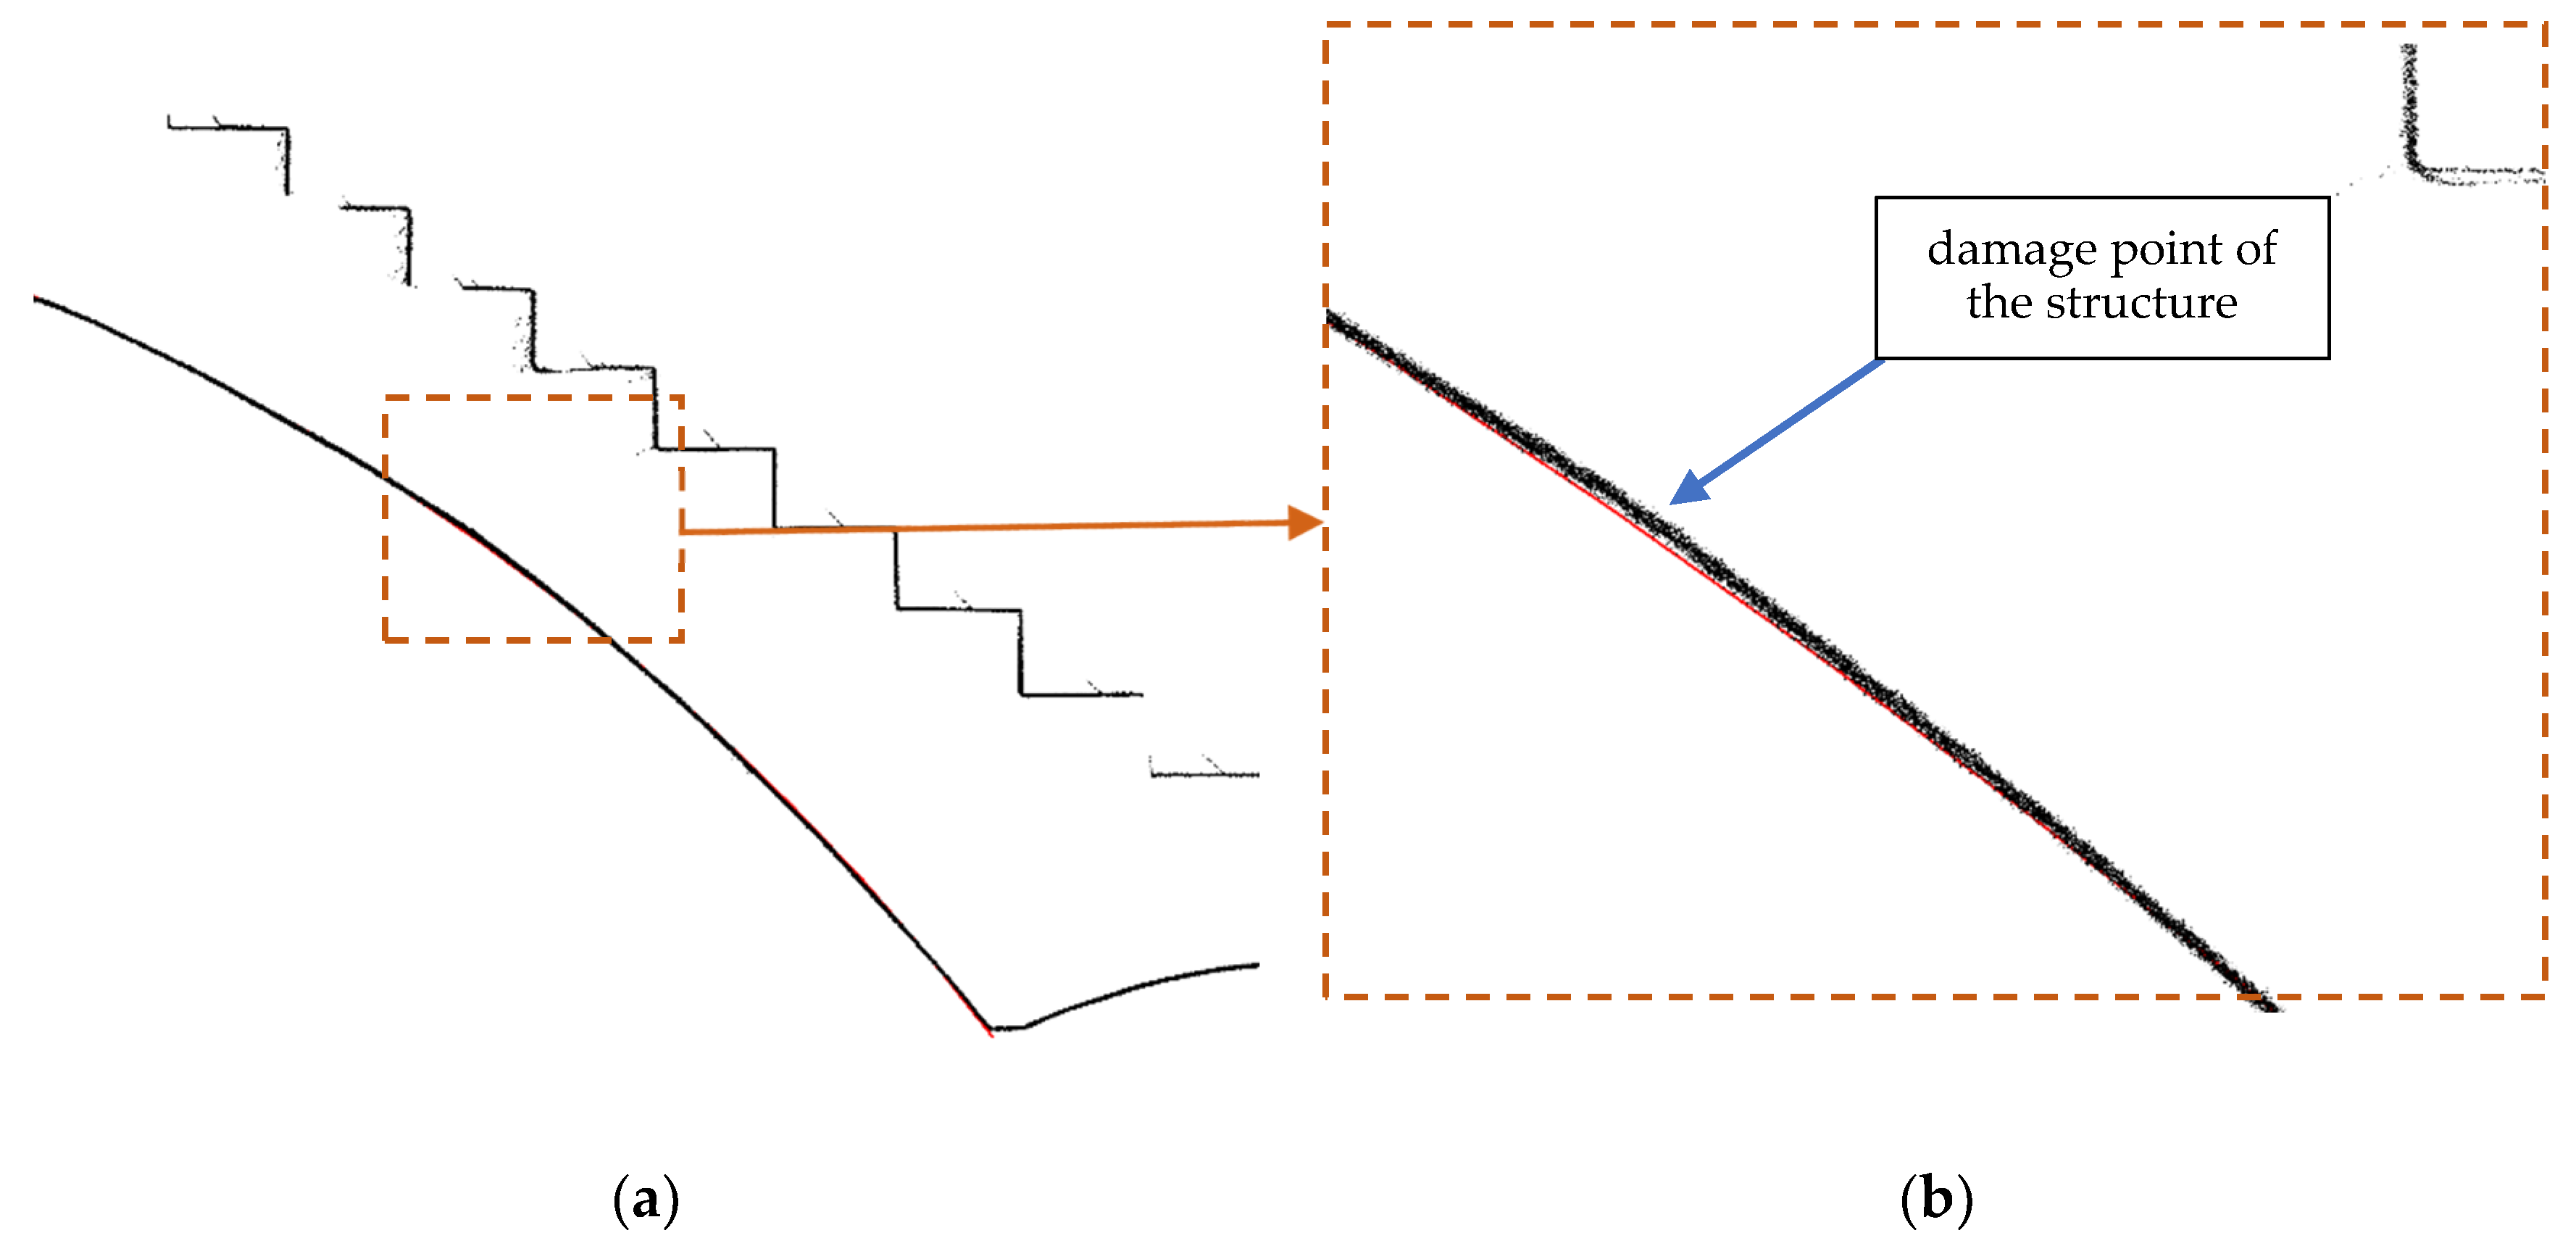
2.2. TLS Diagnostic on a Real-Life Structure
3. Laboratory Tests
3.1. Materials
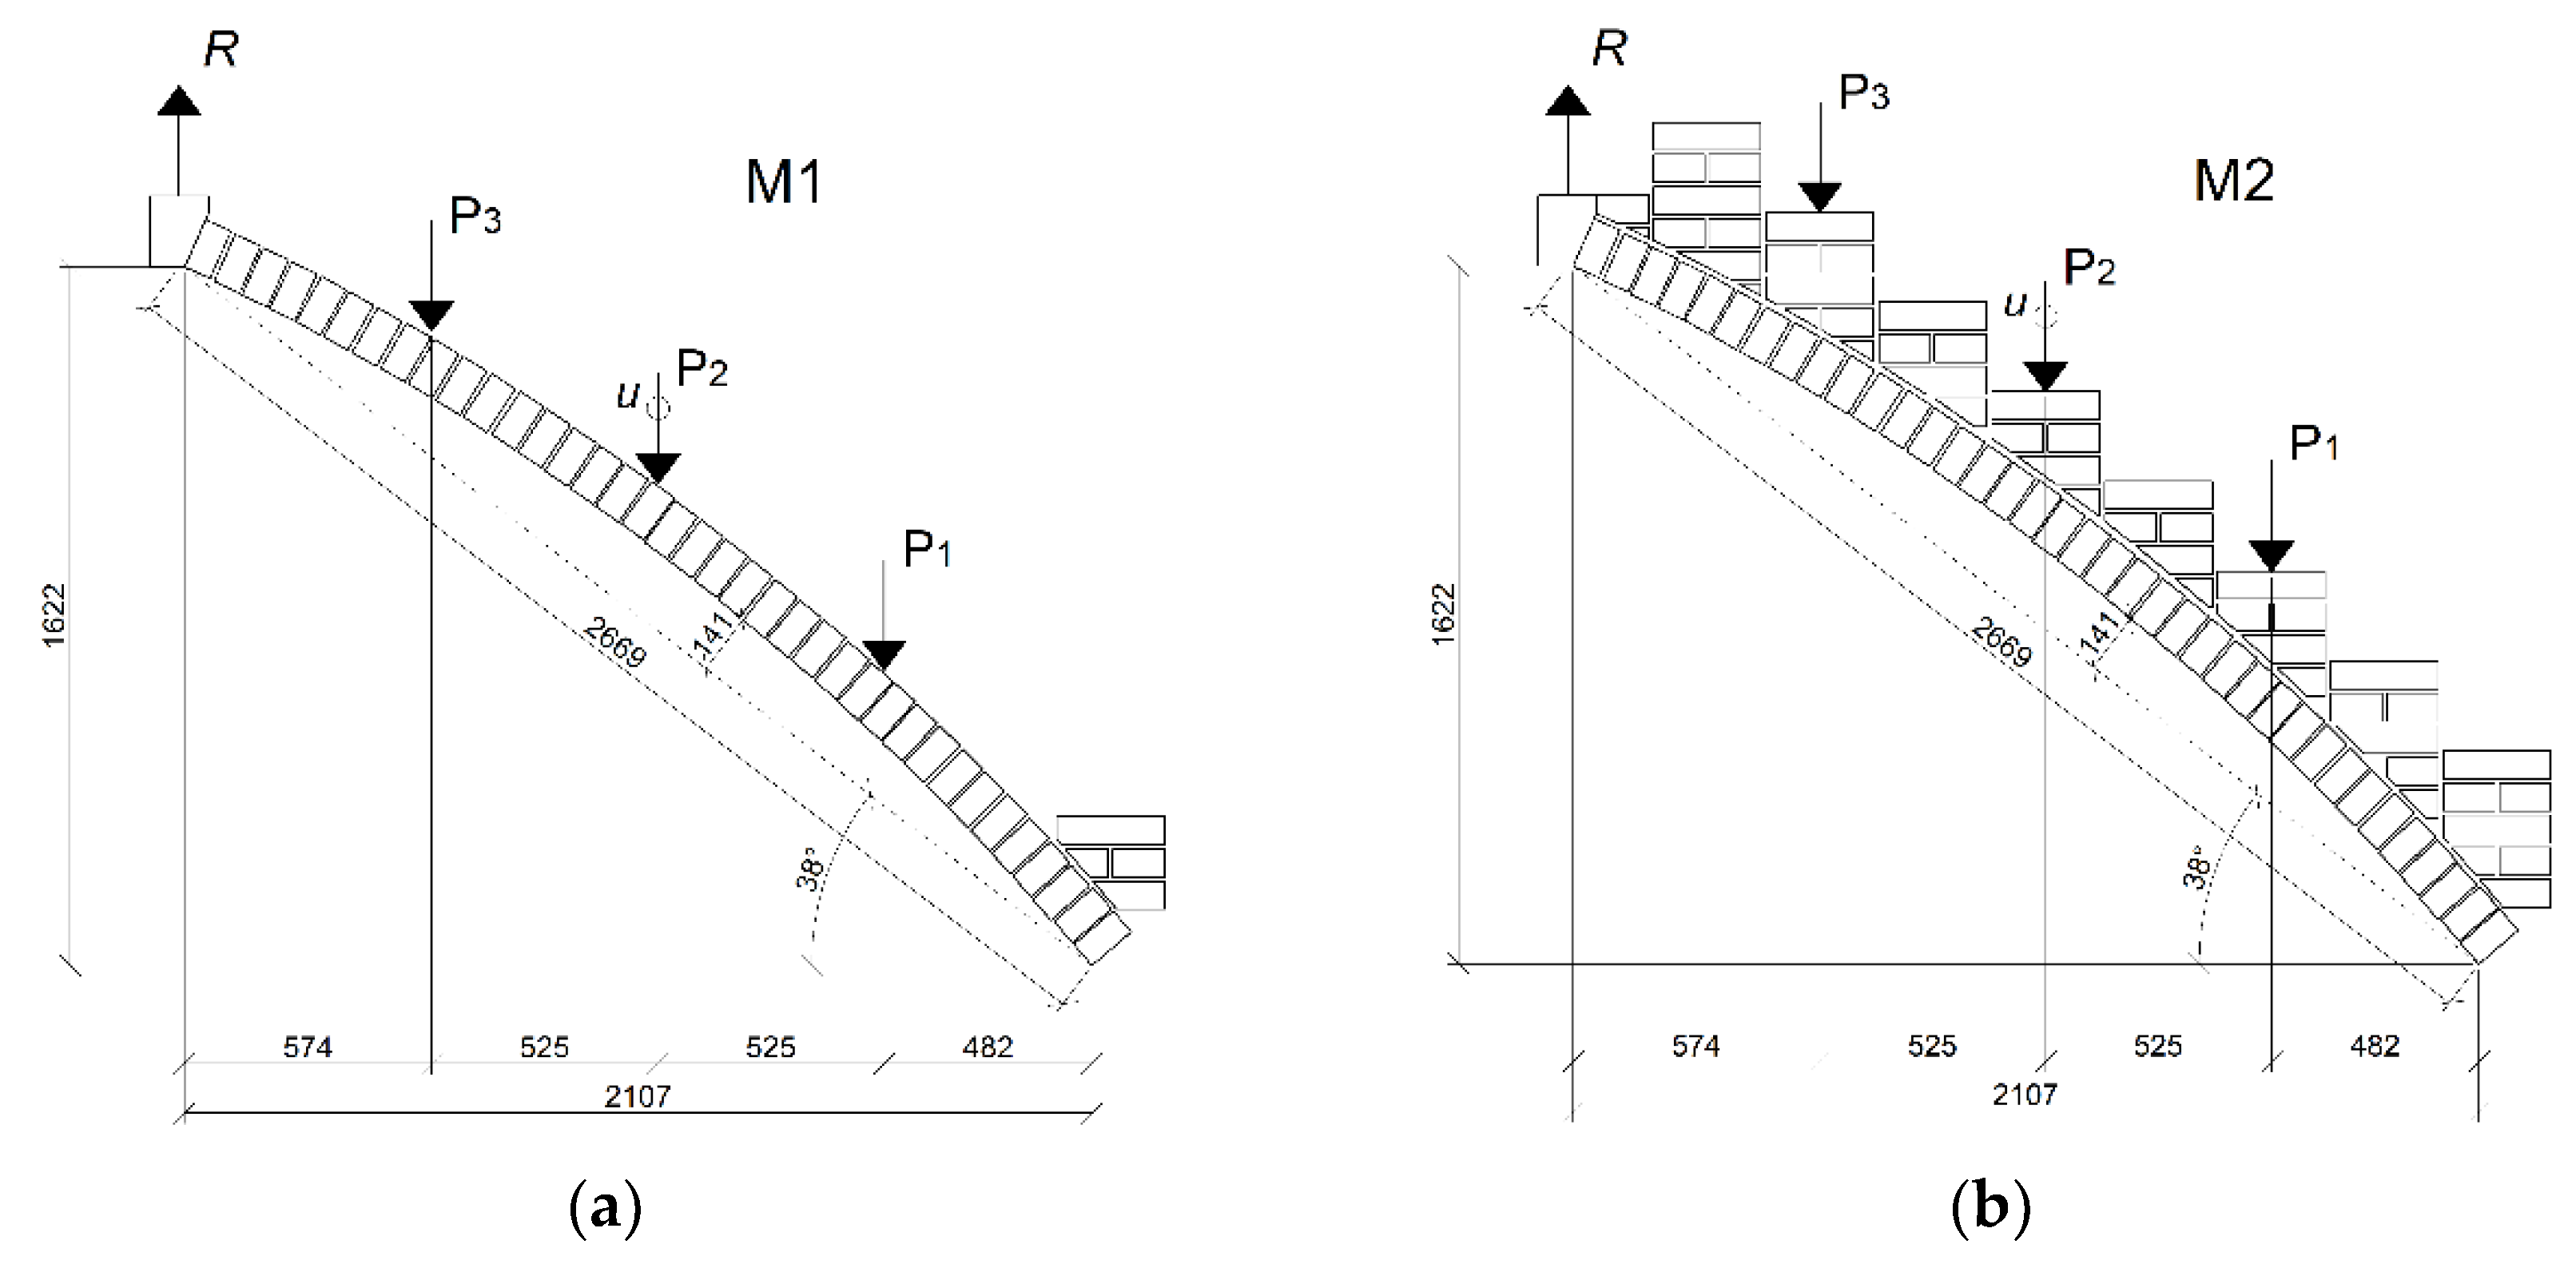
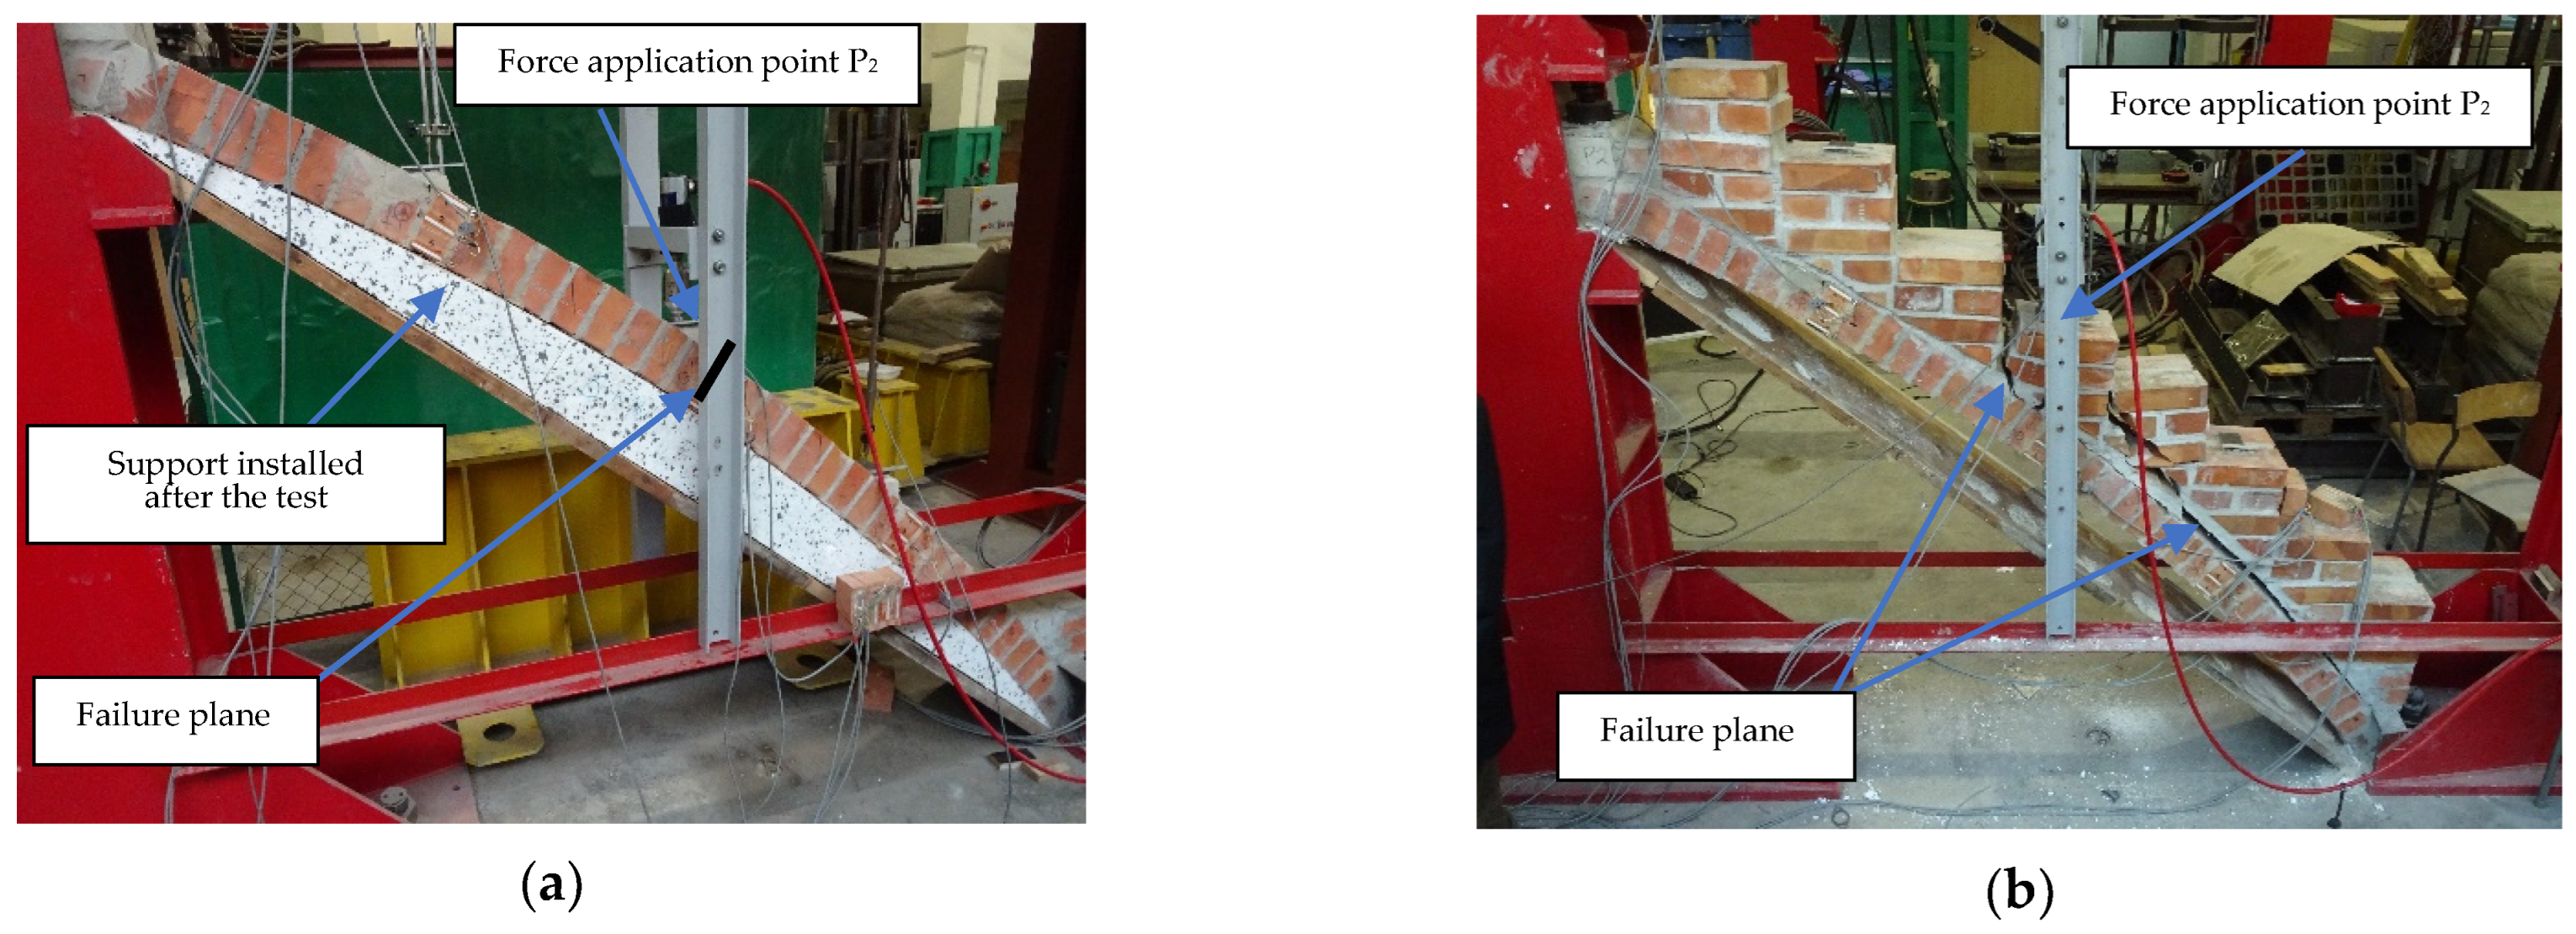
3.2. Laboratory Models of Stair Flights
- Height 162 cm;
- Length 210 cm;
- Slope 38°;
- Arch rise f = 14 cm.
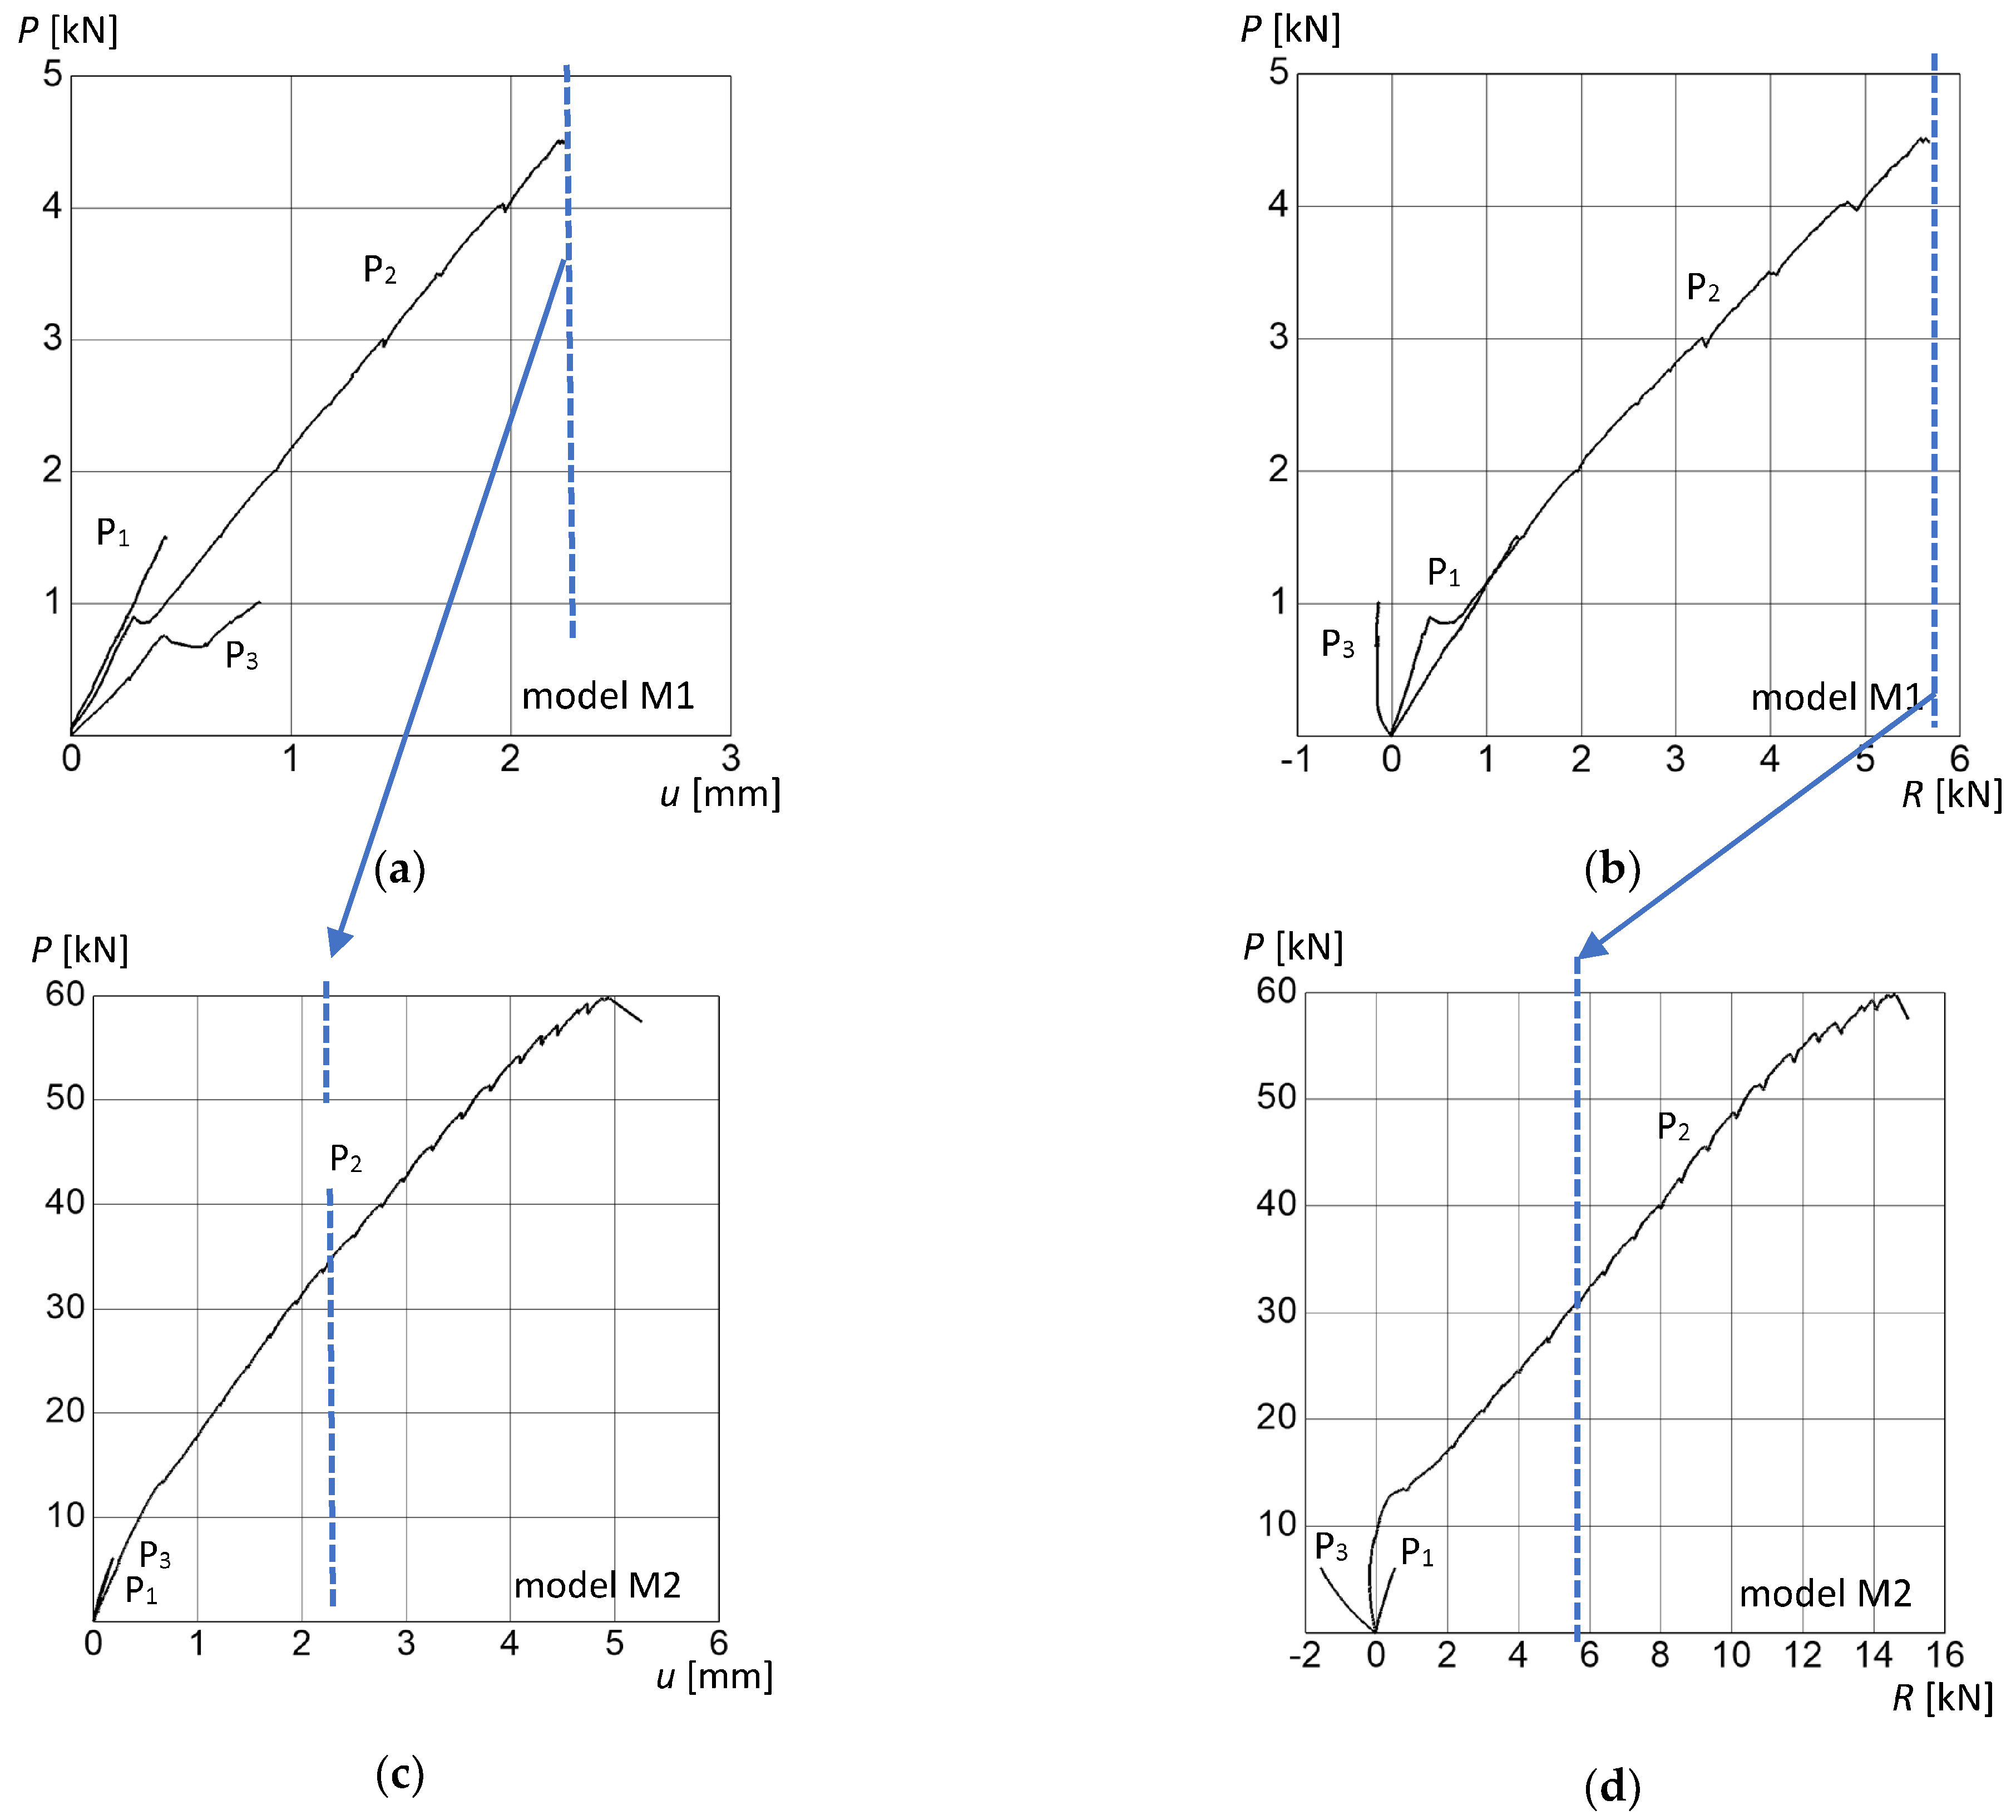
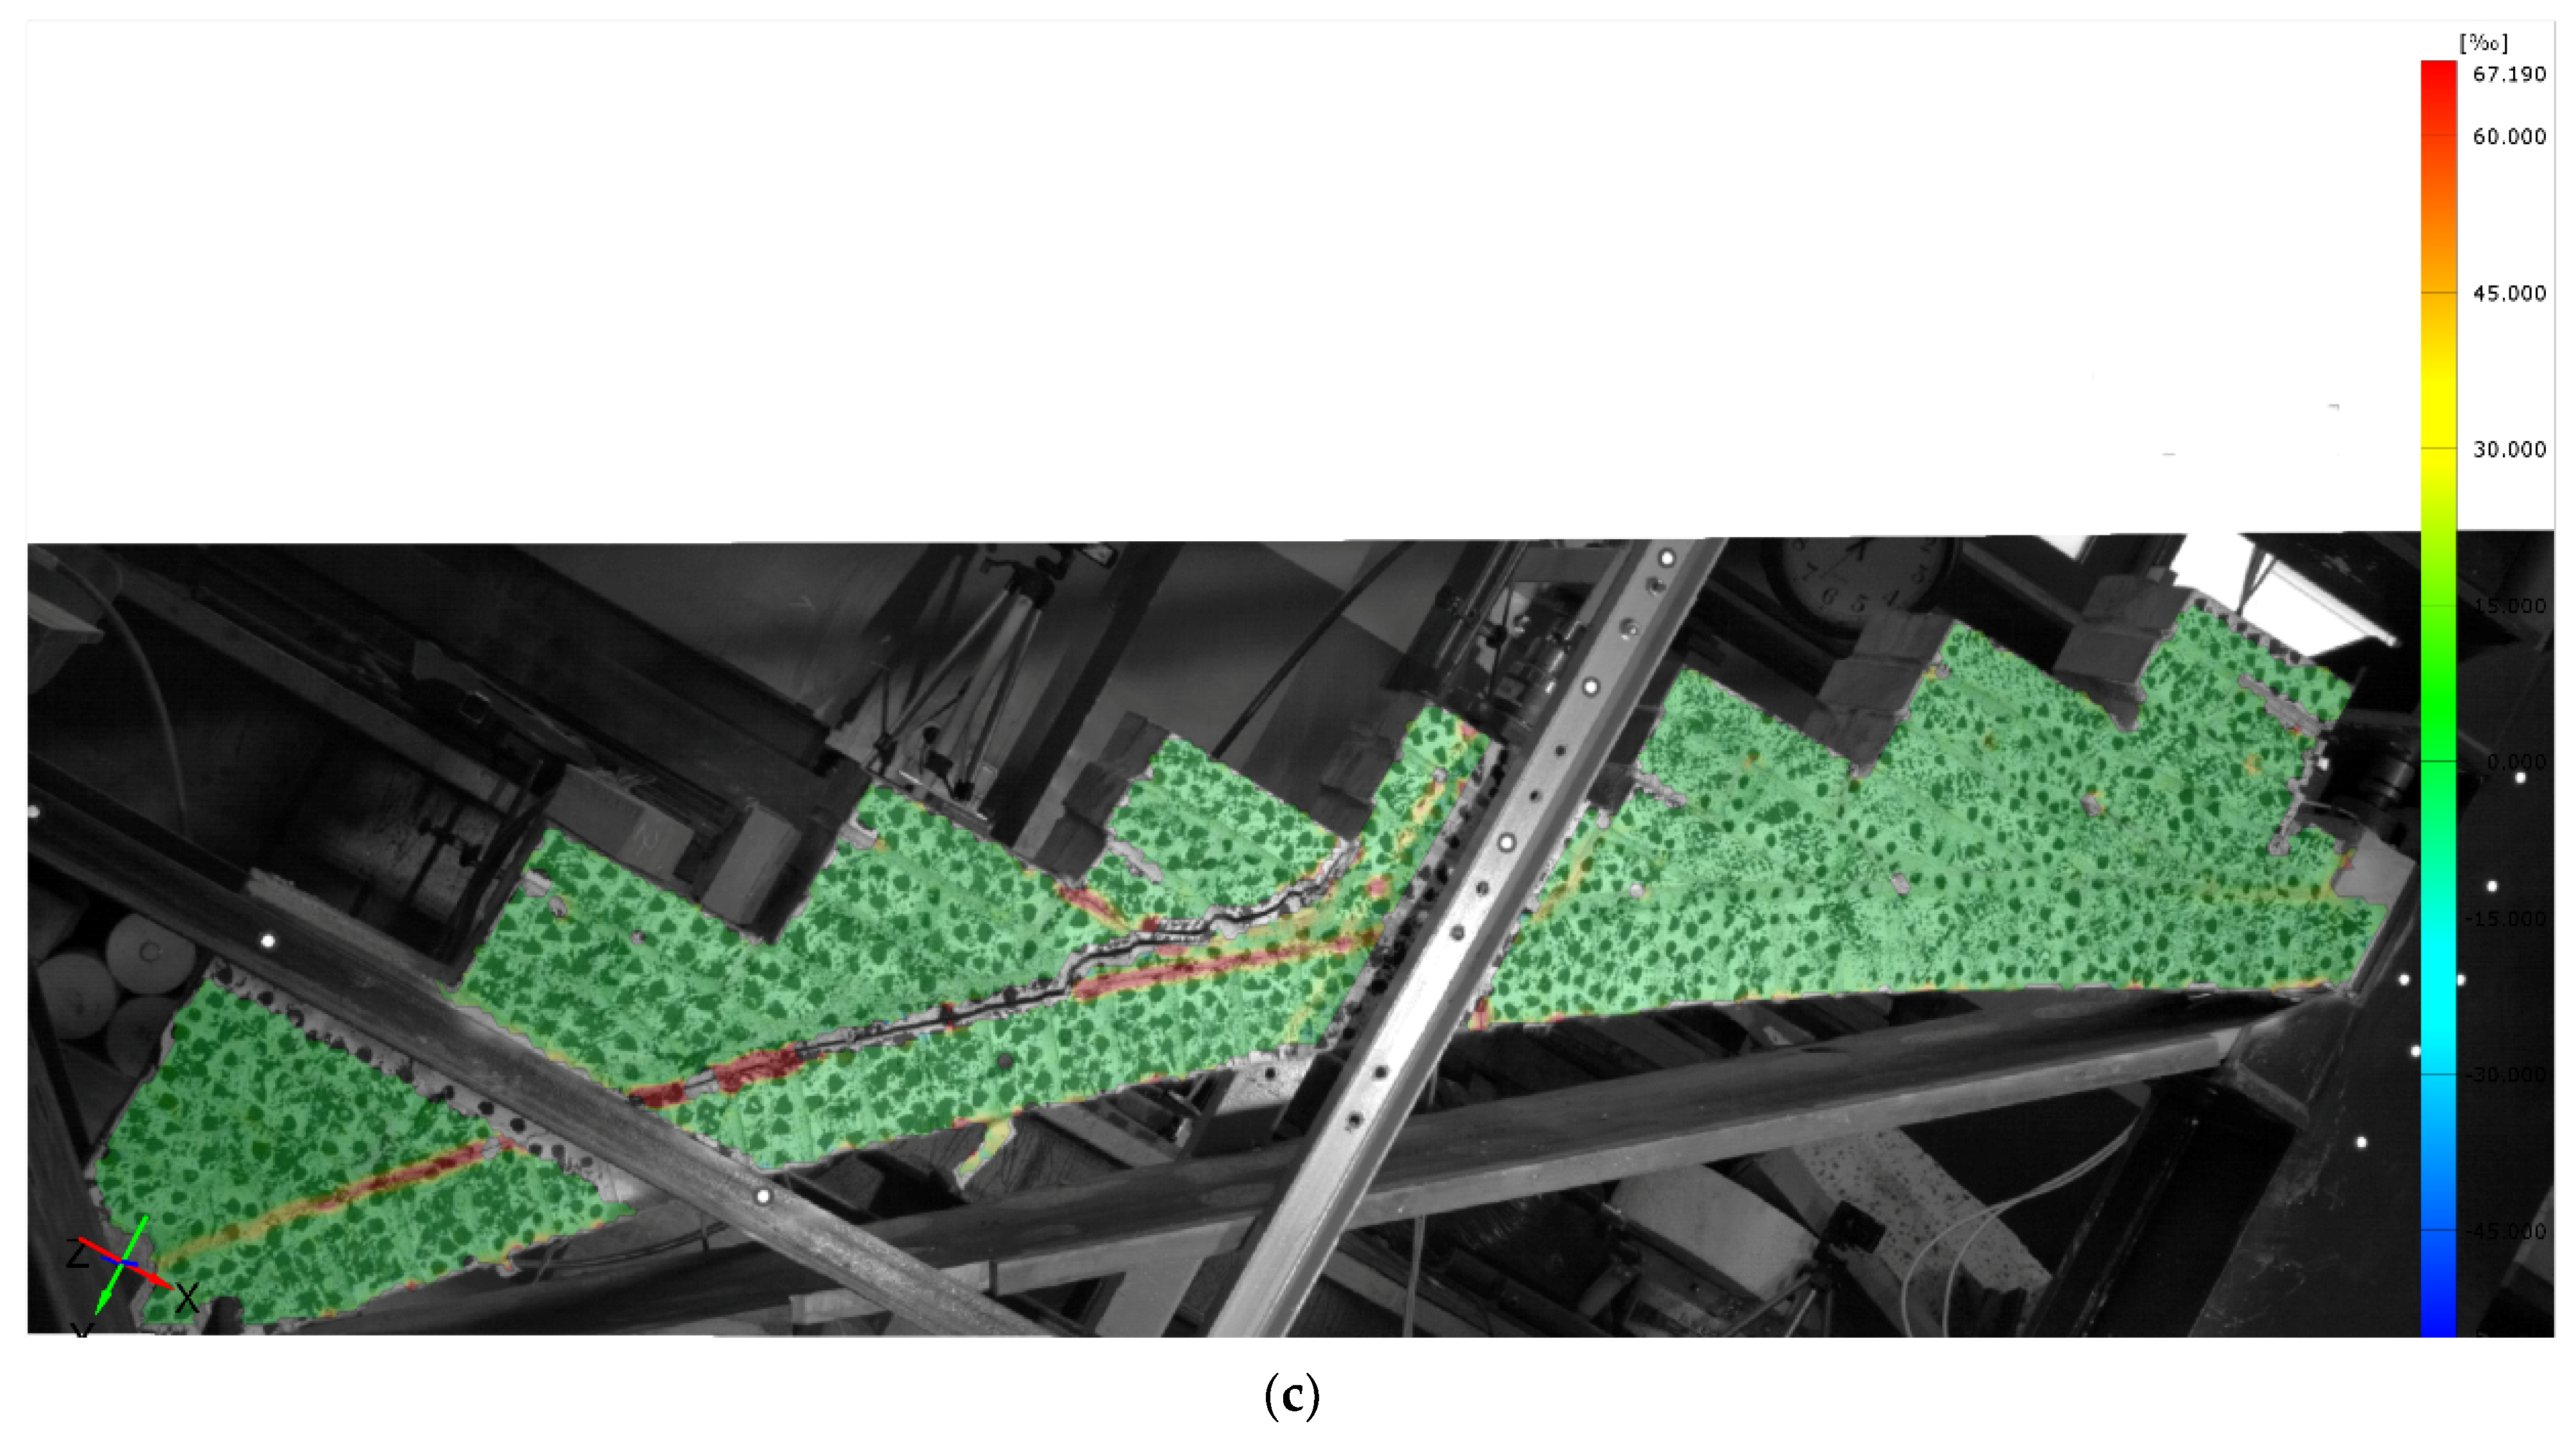
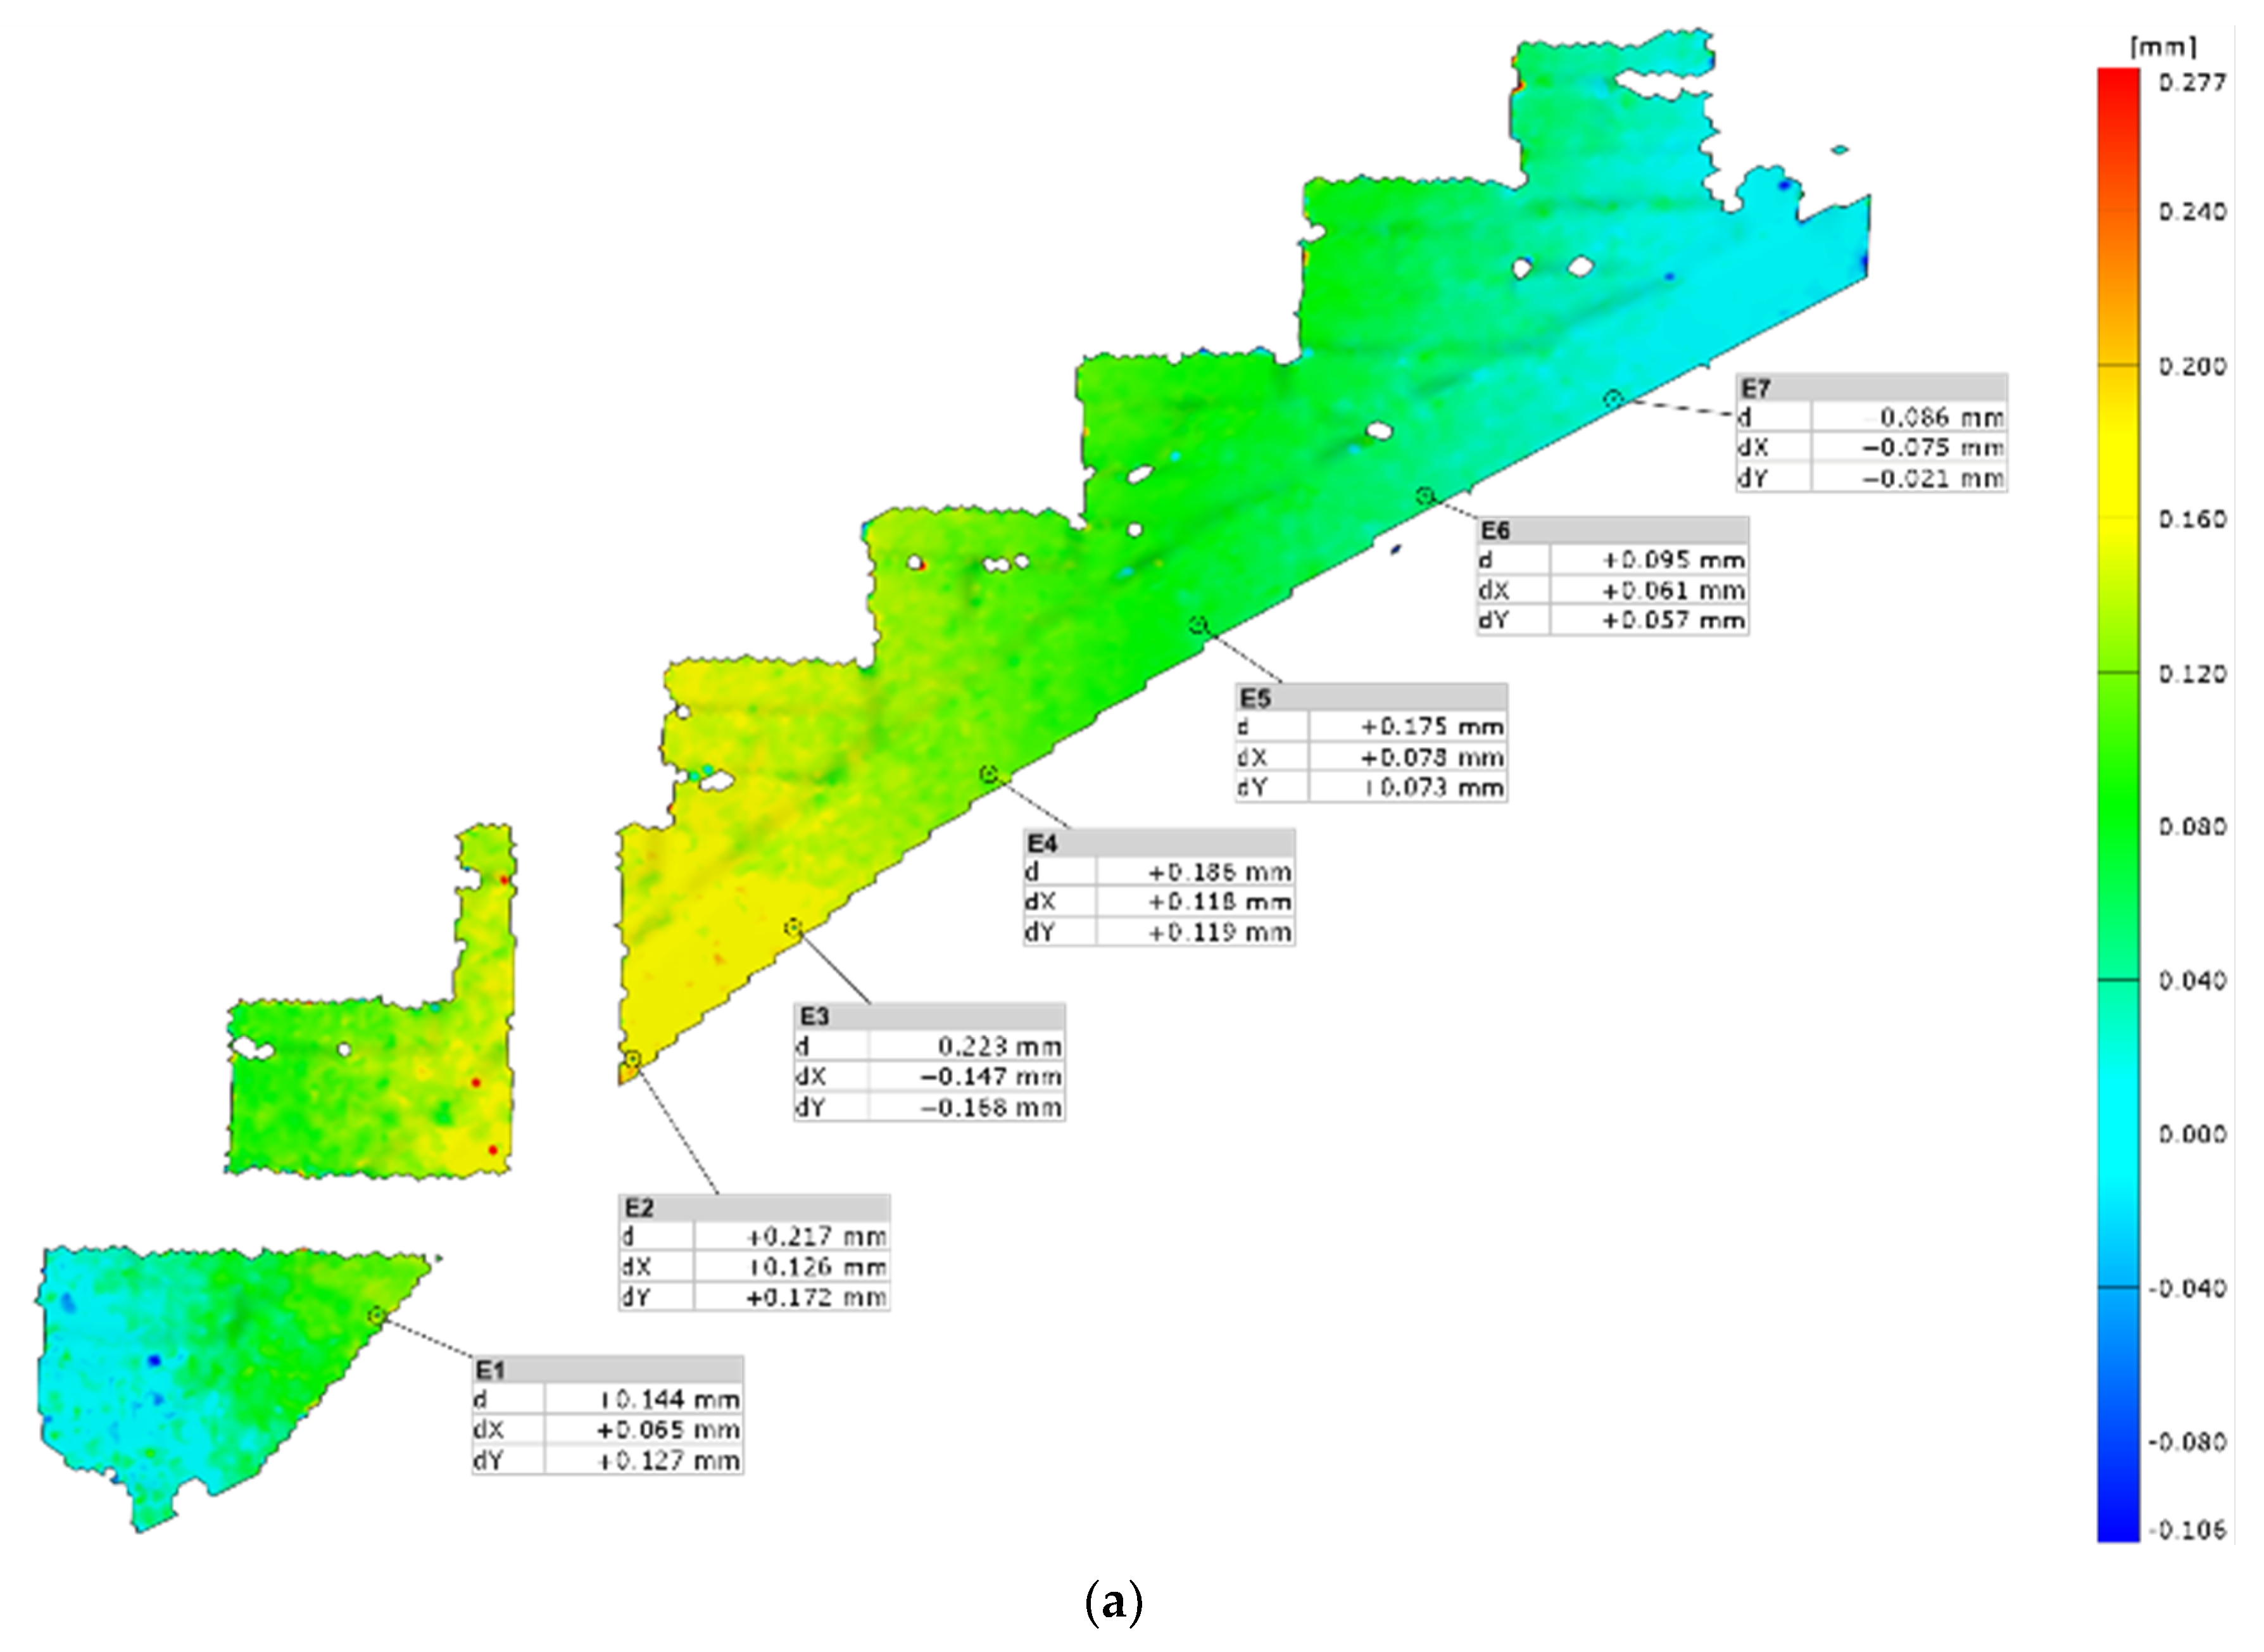
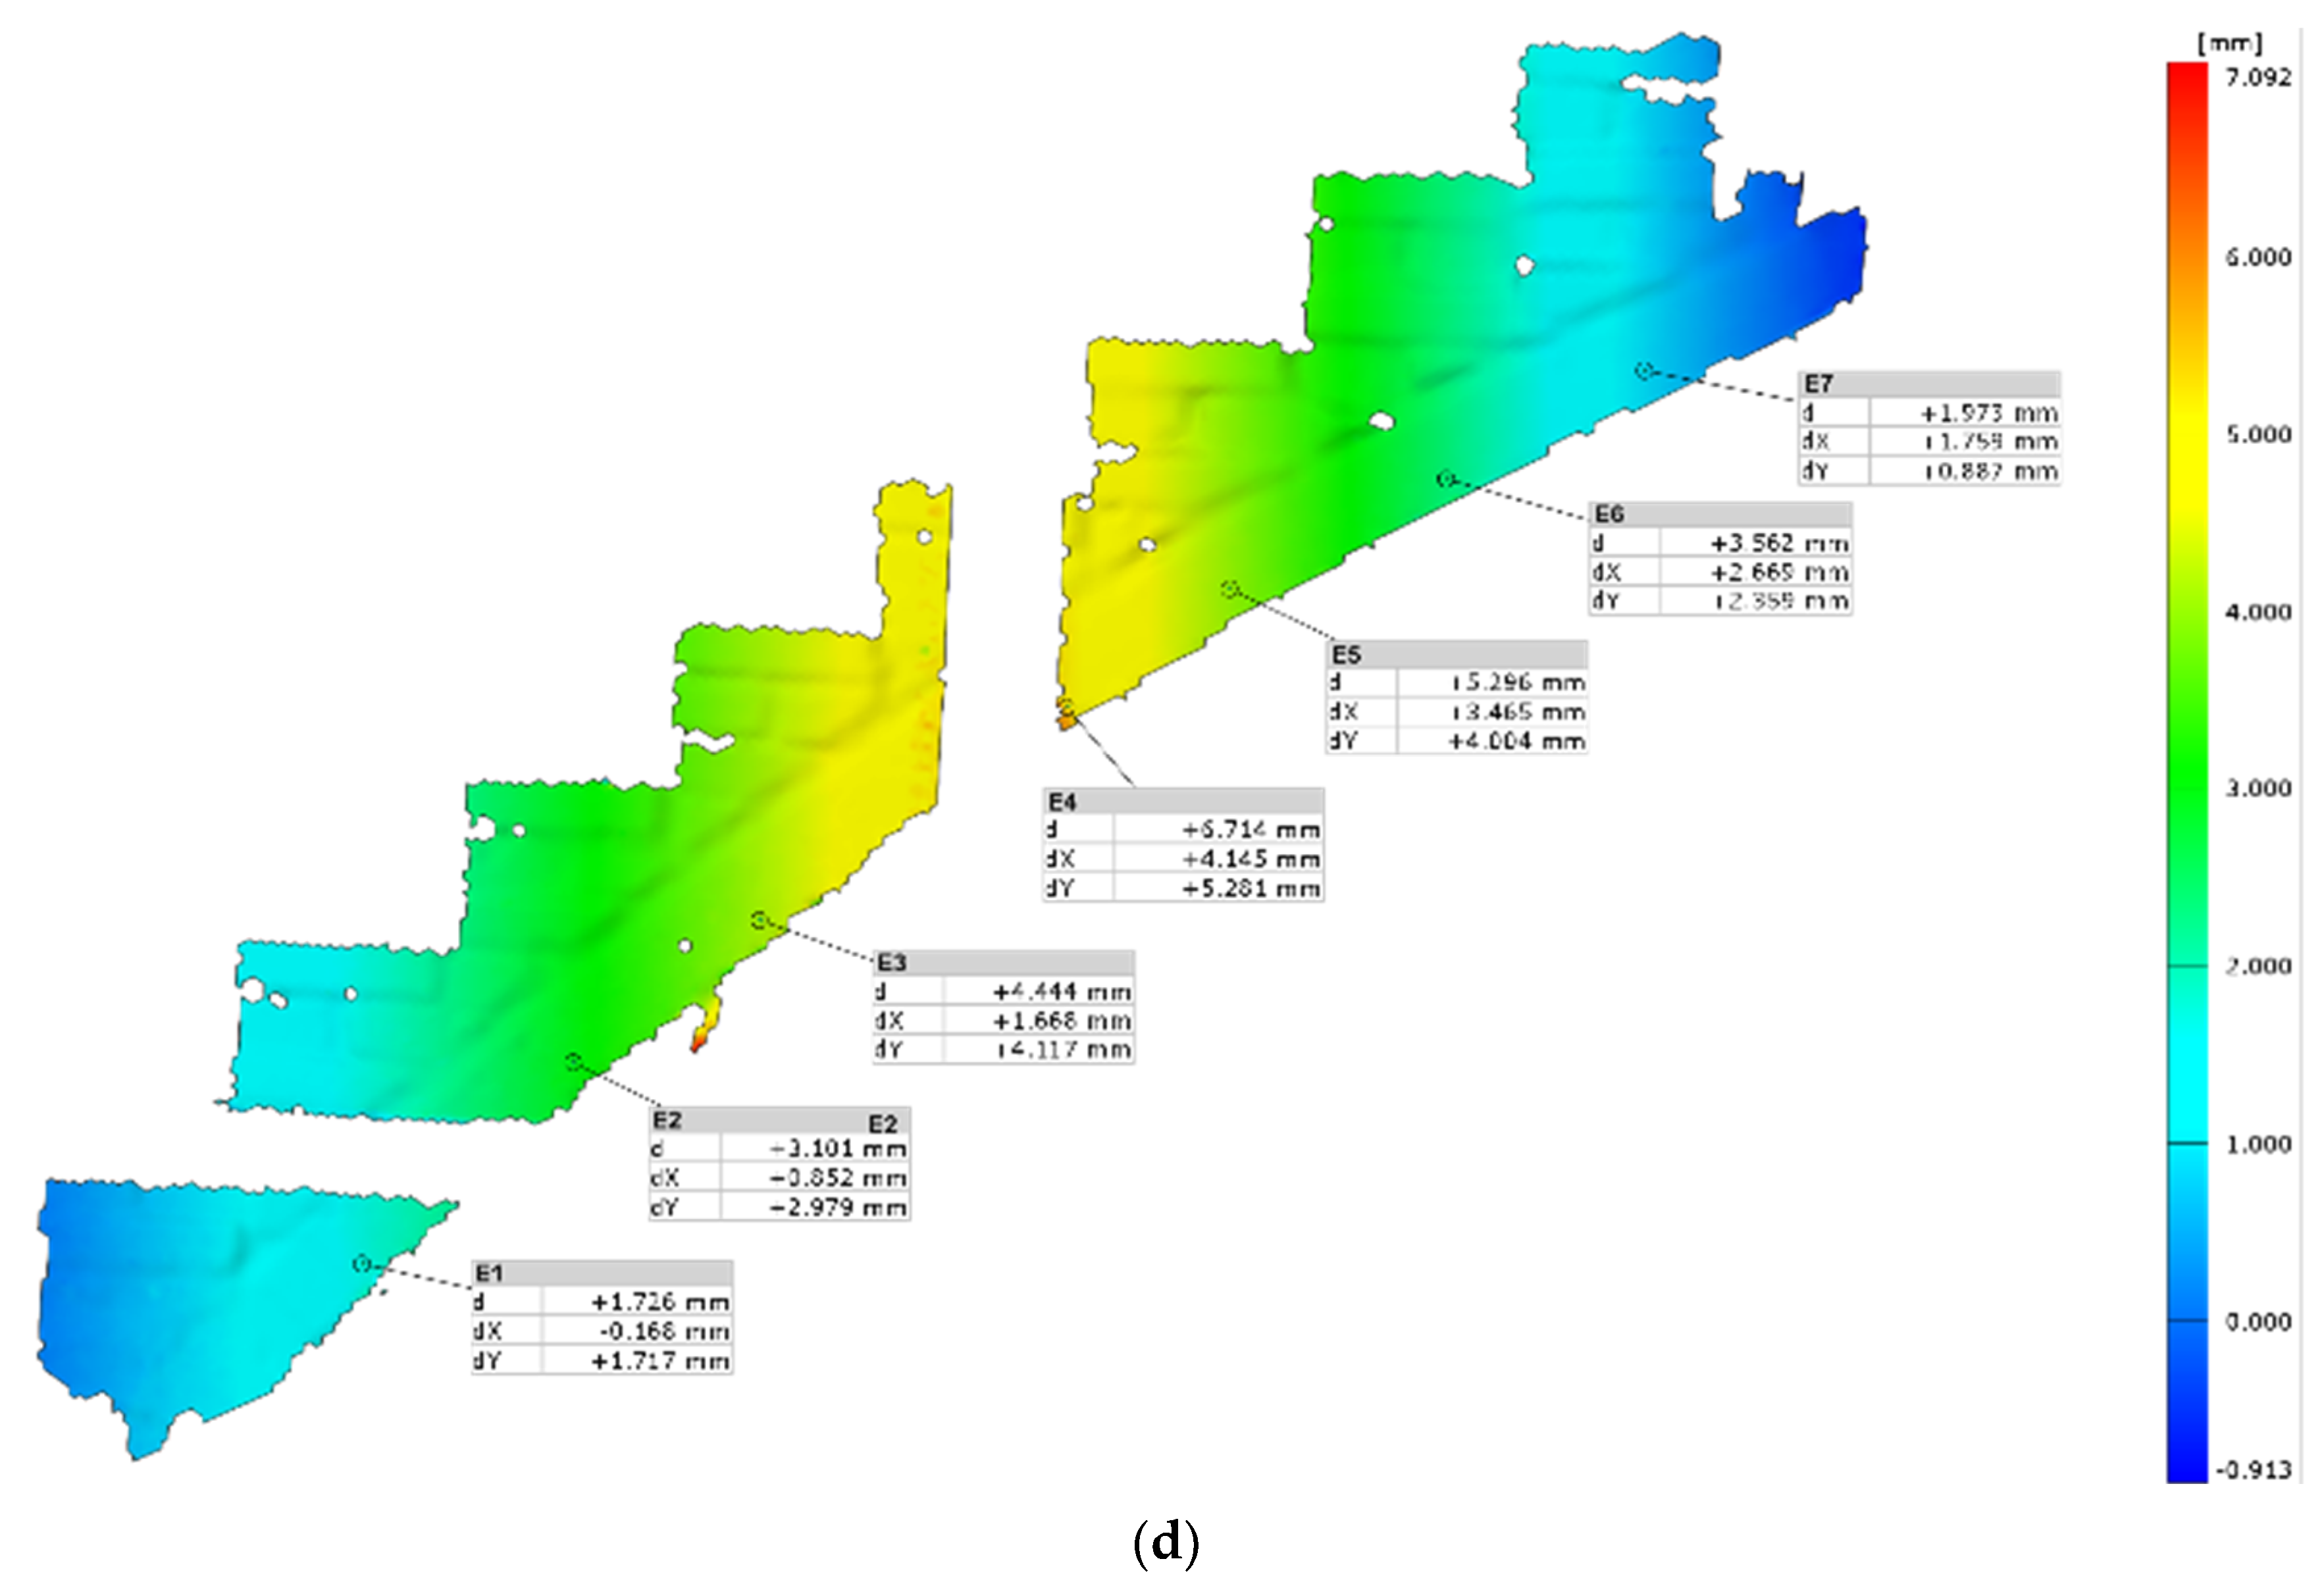
3.3. Results of Laboratory Tests
4. Conclusions
- The TLS method allowed us to perform the geometric analysis and dimensioning of the existing arched stair structure.
- The TLS measurements allowed us to detect geometric irregularities, which, complemented by visual diagnostic tests, allowed us to detect damage to their structure.
- The damage to the flight was caused by improperly performed repair works—improper temporary support of the flight.
- The conducted experimental investigations showed that the key element responsible for the actual load-bearing capacity and stiffness of the stair flight were the treads above the masonry arch.
- The load-bearing capacity of the model with treads was 13.3 times higher than that of the model without treads.
- The deflection value of model M2 was 9.5 times smaller than the deflection of model M1.
- A different working mechanism was found for the stair arch model with brick threads (M2) compared to the arch without threads (M1).
- The failure of model M1 was caused by the opening of the crack within the joint located under the concentrated force at point P2.
- In the case of model M2, failure occurred as a result of cracking along the arch, at the interface of the arch with the brick treads.
- In the case of arched stair renovation, it is crucial to properly connect the arches of the stair flights with the treads above. If there is no proper connection between the vaults and the treads, the increase in the load-bearing capacity shown in the research study should be excluded from the calculations.
Author Contributions
Funding
Institutional Review Board Statement
Informed Consent Statement
Conflicts of Interest
References
- Ahnert, R.; Krause, K.H. Typische Baukonstruktionen von 1860 bis 1960-Band 3; Beuth Verlag GmbH: Berlin, Germany, 2014. [Google Scholar]
- Małyszko, L.; Orłowicz, R. Konstrukcje Murowe. Zarysowania i Naprawy. (Structural Masonry. Cracks and Repairs); Wydawnictwo Uniwersytetu Warmińsko–Mazurskiego: Olsztyn, Poland, 2000. [Google Scholar]
- Nowak, R. Analiza Nośności i Mechanizmów Uszkodzeń Odcinkowych Ceglanych Nadproży Łukowych. Ph.D. Thesis, West Pomeranian University of Technology, Szczecin, Poland, 2014. (In Polish). [Google Scholar]
- Pawłowski, W.; Nowak, R. Architektura a statyka ceglanych nadproży łukowych. Przestrzeń Forma 2009, 12, 115–122. [Google Scholar]
- Stawiski, B.; Kania, T. Building diagnostics versus effectiveness of repairs. MATEC Web Conf. 2018, 174, 03005. [Google Scholar] [CrossRef]
- Drobiec, Ł.; Jasiński, R.; Mazur, W. Accuracy of Eddy-Current and Radar Methods Used in Reinforcement Detection. Materials 2019, 12, 1168. [Google Scholar] [CrossRef]
- Jasiński, R.; Drobiec, Ł.; Mazur, W. Validation of Selected Non-Destructive Methods for Determining the Compressive Strength of Masonry Units Made of Autoclaved Aerated Concrete. Materials 2019, 12, 389. [Google Scholar] [CrossRef]
- Hoła, A.; Matkowski, Z.; Hoła, J. Analysis of the Moisture Content of Masonry Walls in Historical Buildings Using the Basement of a Medieval Town Hall as an Example. Procedia Eng. 2017, 172, 363–368. [Google Scholar] [CrossRef]
- Lachowicz, J.; Rucka, M. Diagnostics of pillars in St. Mary’s Church (Gdańsk, Poland) using the GPR method. Int. J. Archit. Herit. 2018, 13, 1223–1233. [Google Scholar] [CrossRef]
- Schabowicz, K. Non-Destructive Testing of Materials in Civil Engineering. Materials 2019, 12, 3237. [Google Scholar] [CrossRef]
- Maione, A.; Argiento, L.U.; Cassapulla, C. Management of multi-source information to identify the typology of the horizontal structures in historical masonry buildings: The case study of the Museum of Capodimonte in Naples (Italy). Frattura Integrità Strutturale 2018, 46, 240–251. [Google Scholar] [CrossRef]
- Łątka, D.; Matysek, P. Badania konstrukcji murowych in-situ. Inżynieria Budownictwo 2017, 7, 360–363. [Google Scholar]
- Łątka, D.; Seręga, S.; Matysek, P. Estimation of Mortar Compressive Strength Based on Specimens Extracted from Masonry Bed Joints. In Proceedings of the Structural Analysis of Historical Constructions, Cusco, Peru, 11–13 September 2018; pp. 577–586. [Google Scholar]
- Tkacz, P. Ocena Wytrzymałości na Ściskanie Konstrukcji Murowych z Uwzględnieniem Badań In Situ. Ph.D. Thesis, West Pomeranian University of Technology, Szczecin, Poland, 2015. (In Polish). [Google Scholar]
- Matysek, P.; Witkowski, M. A Comparative Study on the Compressive Strength of Bricks from Different Historical Periods. Int. J. Archit. Herit. 2015, 10, 396–405. [Google Scholar] [CrossRef]
- Ramesh, M.; Azenha, M.; Lourenco, P. Mechanical properties of lime–cement masonry mortars in their early ages. Mater. Struct. 2019, 52, 13. [Google Scholar] [CrossRef]
- Ramesh, M.; Azenha, M.; Lourenco, P. Mechanical characterization of lime cement mortars: E-modulus and fracture energy. In Proceedings of the RILEM Spring Convention and Sustainable Materials, Systems and Structures Conference (SMSS 2019), Rovinj, Croatia, 18–22 March 2019. [Google Scholar]
- Matysek, P. Identyfikacja Wytrzymałości na Ściskanie i Odkształcalności Murów Ceglanych w Obiektach Istniejących; Cracow University o Technology: Cracow, Poland, 2014. (In Polish) [Google Scholar]
- Łątka, D.; Matysek, P. The Estimation of Compressive Stress Level in Brick Masonry Using the Flat-jack Method. Procedia Eng. 2017, 193, 266–272. [Google Scholar] [CrossRef]
- Runkiewicz, L.; Rodzik, W. Badania nieniszczące wytrzymałości murowanych obiektów zabytkowych. Inżynieria Budownictwo 1990, 2, 50–52. [Google Scholar]
- Runkiewicz, L.; Sieczkowski, J. Stosowanie obciążeń próbnych do oceny stanu technicznego budynków. Przegląd Budowlany 2015, 86, 7–8. [Google Scholar]
- Runkiewicz, L.; Biegus, A.; Brol, J.; Buczkowski, W.; Drobiec, Ł.; Gajownik, R.; Godlewski, T.; Hoła, J.; Hulimka, J.; Jakimowicz, M.; et al. Diagnostyka Obiektów Budowlanych. Zasady Wykonywania Ekspertyz; PWN: Warsaw, Poland, 2020. [Google Scholar]
- Kania, T.; Derkach, V.; Nowak, R. Testing Crack Resistance of Non-Load-Bearing Ceramic Walls with Door Openings. Materials 2021, 14, 1379. [Google Scholar] [CrossRef]
- Kregar, K.; Ambrožič, T.; Kogoj, D.; Vezočnik, R.; Marjetič, A. Determining the inclination of tall chimneys using the TPS and TLS approach. Measurement 2015, 75, 354–363. [Google Scholar] [CrossRef]
- Drygala, I.; Dulinska, J.; Bednarz, L.; Jasienko, J. Numerical evaluation of seismic-induced damages in masonry elements of historical arch viaduct. IOP Conf. Ser. Mater. Sci. Eng. 2018, 364, 012006. [Google Scholar] [CrossRef]
- Croce, P.; Beconcini, M.L.; Formichi, P.; Landi, F.; Puccini, B.; Zotti, V. Bayesian Methodology for Probabilistic Description of Mechanical Parameters of Masonry Walls. ASCE-ASME J. Risk Uncertain. Eng. Syst. Part A Civ. Eng. 2021, 7, 04021008. [Google Scholar] [CrossRef]
- Malomo, D.; DeJong, M.J. A Macro-Distinct Element Model (M-DEM) for out-of-plane analysis of unreinforced masonry structures. Eng. Struct. 2021, 244, 112754. [Google Scholar] [CrossRef]
- Lourenco, P.B. Computations on historic masonry structures. Prog. Struct. Eng. Mater. 2002, 4, 301–319. [Google Scholar] [CrossRef]
- Beconcini, M.L.; Croce, P.; Formichi, P.; Landi, F.; Puccini, B. Experimental Evaluation of Shear Behavior of Stone Masonry Wall. Materials 2021, 14, 2313. [Google Scholar] [CrossRef]
- Lourenço, P.B.; Rots, J.G.; Blaauwendraad, J. Continuum model for masonry: Parameter estimation and validation. J. Struct. Eng. 1998, 124, 642–652. [Google Scholar] [CrossRef]
- Baraldi., D.; Milani, G.; Sarhosis, V. A Rigid-Beam-Model for studying the dynamic behaviour of cantilever masonry walls. Structures 2021, 33, 2950–2963. [Google Scholar] [CrossRef]
- Celano, T.; Argiento, L.U.; Ceroni, F.; Casapulla, C. In-Plane Behaviour of Masonry Walls: Numerical Analysis and Design Formulations. Materials 2021, 14, 5780. [Google Scholar] [CrossRef]
- Suchocki, C.; Katzer, J.; Rapinski, J. Terrestrial Laser Scanner as a Tool for Assessment of Saturation and Moisture Movement in Building Materials. Period. Polytech. Civ. Eng. 2018, 62, 694–699. [Google Scholar] [CrossRef]
- Suchocki, C.; Jagoda, M.; Obuchovski, R.; Šlikas, D.; Sužiedelytė-Visockienė, J. The properties of terrestrial laser system intensity in measurements of technical conditions of architectural structures. Metrol. Meas. Syst. 2018, 25, 779–792. [Google Scholar] [CrossRef]
- Suchocki, C.; Katzer, J. TLS Technology in Brick Walls Inspection. In Proceedings of the Conference: 2018 Baltic Geodetic Congress (BGC Geomatics), Olsztyn, Poland, 21–23 June 2018; pp. 359–363. [Google Scholar]
- Suchocki, C.; Katzer, J.; Serrat, C.; Jagoda, M. Application of TLS Intensity Data for Detection of Brick Walls Defects. IOP Conf. Ser. Mater. Sci. Eng. 2019, 603, 022100. [Google Scholar] [CrossRef]
- Błaszczak-Bąk, W.; Suchocki, C.; Janicka, J.; Dumalski, A.; Duchnowski, R. Defect detection of historic structures in dark places based on the point cloud analysis by modified OptD Method. GeoInformation Disaster Manag. 2019, XLII-3/W8, 71–77. [Google Scholar] [CrossRef]
- Suchocki, C.; Błaszczak-Bąk, W.; Damięcka-Suchocka, M.; Jagoda, M.; Masiero, A. On the Use of the OptD Method for Building Diagnostics. Remote Sens. 2020, 12, 1806. [Google Scholar] [CrossRef]
- Suchocki, C.; Błaszczak-Bąk, W.; Janicka, J.; Dumalski, A. Detection of defects in building walls using modified OptD method for down-sampling of point clouds. Build. Res. Inf. 2020, 49, 197–215. [Google Scholar] [CrossRef]
- Błaszczak-Bąk, W.; Suchocki, C.; Janicka, J.; Dumalski, A.; Duchnowski, R.; Sobieraj-Żłobińska, A. Automatic Threat Detection for Historic Buildings in Dark Places Based on the Modified OptD Method. Int. J. Geo-Inf. 2020, 9, 123. [Google Scholar] [CrossRef]
- Suchocki, C. Comparison of Time-of-Flight and Phase-Shift TLS Intensity Data for the Diagnostics Measurements of Buildings. Materials 2020, 13, 353. [Google Scholar] [CrossRef]
- Nowak, R.; Orłowicz, R.; Rutkowski, R. Use of TLS (LiDAR) for Building Diagnostics with the Example of a Historic Building in Karlino. Buildings 2020, 10, 24. [Google Scholar] [CrossRef]
- Wierzbicki, K.; Szewczyk, P.; Paczkowski, W.; Wroblewski, T.; Skibicki, S. Torsional Stability Assessment of Columns Using Photometry and FEM. Buildings 2020, 10, 162. [Google Scholar] [CrossRef]
- Suchocki, C.; Błaszczak-Bąk, W.; Damięcka-Suchocka, M.; Jagoda, M.; Masiero, A. An example of using the OptD method to optimization of point clouds in the buildings diagnostics. In Proceedings of the 4th Joint International Symposium on Deformation Monitoring (JISDM), Athens, Greece, 15–17 May 2018. [Google Scholar]
- Suchocki, C.; Błaszczak-Bąk, W. Down-Sampling of Point Clouds for the Technical Diagnostics of Buildings and Structures. Geosciences 2019, 9, 70. [Google Scholar] [CrossRef]
- Dias, I.S.; Flores-Colen, I.; Silva, A. Critical Analysis about Emerging Technologies for Building’s Façade Inspection. Buildings 2021, 11, 53. [Google Scholar] [CrossRef]
- Mosalam, K.; Takhirov, S.; Park, S. Applications of laser scanning to structures in laboratory tests and field surveys. Struct. Control Health Monit. 2014, 21, 115–134. [Google Scholar] [CrossRef]
- Liu, J.; Zhang, Q.; Wu, J.; Zhao, Y. Dimensional accuracy and structural performance assessment of spatial structure components using 3D laser scanning. Autom. Constr. 2018, 96, 324–336. [Google Scholar] [CrossRef]
- Leonov, A.V.; Anikushkin, M.N.; Ivanov, A.V.; Ovcharov, S.V.; Bobkov, A.E.; Baturin, Y.M. Laser scanning and 3D modeling of the Shukhov hyperboloid tower in Moscow. J. Cult. Herit. 2015, 16, 551–559. [Google Scholar] [CrossRef]
- Feng, P.; Zou, Y.; Hu, L.; Liu, T. Use of 3D laser scanning on evaluating reduction of initial geometric imperfection of steel column with pre-stressed CFRP. Eng. Struct. 2019, 198, 109527. [Google Scholar] [CrossRef]
- Mora, R.; Martín-Jiménez, J.A.; Lagüela, S.; González-Aguilera, D. Automatic Point-Cloud Registration for Quality Control in Building Works. Appl. Sci. 2021, 11, 1465. [Google Scholar] [CrossRef]
- Erdélyi, J.; Kopáčik, A.; Kyrinovič, P. Spatial Data Analysis for Deformation Monitoring of Bridge Structures. Appl. Sci. 2020, 10, 8731. [Google Scholar] [CrossRef]
- Singhroy, V.; Fobert, M.-A.; Li, J.; Blais-Stevens, A.; Charbonneau, F.; Das, M. Advanced Radar Images for Monitoring Transportation, Energy, Mining and Coastal Infrastructure; Singhroy, V., Ed.; Springer: Cham, Switzerland, 2021; pp. 3–40. [Google Scholar] [CrossRef]
- Drobiec, Ł.; Piekarczyk, A.; Kubica, J. AAC bocks masonry compressed perpendicular and parallel to the bed joints. In Proceedings of the 12th International Brick/Block Masonry Conference, Madrid, Spain, 25–28 June 2000. [Google Scholar]
- Hulimka, J.; Kałuża, M.; Kubica, J. Failure and overhaul of a historic brick tower. Eng. Fail. Anal. 2019, 102, 46–59. [Google Scholar] [CrossRef]
- Hoła, J.; Schabowicz, K. Diagnostyka obiektów budownictwa ogólnego. In Proceedings of the XXX Jubileuszowe Ogólnopolskie Warsztaty Pracy Projektanta Konstrukcji, Szczyrk, Poland, 25–28 March 2015. [Google Scholar]
- Drobiec, Ł.; Grzyb, K.; Zając, J. Analysis of Reasons for the Structural Collapse of Historic Buildings. Sustainability 2021, 13, 10058. [Google Scholar] [CrossRef]
- Schabowicz, K. Testing of Materials and Elements in Civil Engineering. Materials 2021, 14, 3412. [Google Scholar] [CrossRef]
- Szabó, S.; Kövesdi, A.; Vasáros, Z.; Csicsely, Á.; Hegyi, D. The Cause of Damage and Failure of the Mud-brick Vault of the Khan in New-Gourna. Eng. Fail. Anal. 2021, 128, 105567. [Google Scholar] [CrossRef]
- Bednarz, Ł.; Drygała, I.; Dulińska, J.; Jasieńko, J. Study of Materials Behavior in a Monumental Vault Strengthened by a Carbon Net in a Mineral Matrix Subjected to Seismic Influence. Appl. Sci. 2021, 11, 1015. [Google Scholar] [CrossRef]
- Uranjek, M.; Lorenci, T.; Skrinar, M. Analysis of Cylindrical Masonry Shell in St. Jacob’s Church in Dolenja Trebuša, Slovenia—Case Study. Buildings 2019, 9, 127. [Google Scholar] [CrossRef]
- Bovo, M.; Mazzotti, C.; Savoia, M. Analysis of structural behaviuor of historical stone arches and vaults: Experimental tests and numerical analyses. In Proceedings of the International Conference on Structural Analysis of Historical Constructions (SAHC 2012), Wrocław, Poland, 15–17 October 2012; pp. 635–643. [Google Scholar]
- Jasieńko, J.; Bednarz, Ł.; Nowak, T. The effectiveness of strengthening historic brick vaults by contemporary methods. In Proceedings of the Protection of Historical Buildings, PROHITECH 09, Rome, Italy, 21–27 June 2009; Taylor & Francis Group: London, UK, 2009. [Google Scholar]
- Jasieńko, J.; Di Tommaso, A.; Bednarz, Ł. Experimental Investigations into Collapse of Masonry Arches Reinforced Using Different Compatible Technologies. In Proceedings of the Mechanics of Masonry Structures Strengthened with Composite Materials, MuRiCo., Venice, Italy, 22–24 April 2009. [Google Scholar]
- Boothby, T.E. Analysis of masonry arches and vaults. Prog. Struct. Eng. Mater. 2001, 3, 246–256. [Google Scholar] [CrossRef]
- Foraboschi, P. Strengthening of Masonry Arches with Fiber-Reinforced Polymer Strips. J. Compos. Constr. 2004, 8, 191–202. [Google Scholar] [CrossRef]
- Castori, G.; Borri, A.; Ebaugh, S.; Casadei, P. Strengthening masonry arches with composites. In Proceedings of the Third International Conference on FRP Composites in Civil Engineering (CICE 2006), Miami, FL, USA, 13–15 December 2006. [Google Scholar]
- Oliveira, D.; Basílio, I.; Lourenco, P. FRP strengthening of masonry arches towards an enhanced behaviour. In Proceedings of the Third International Conference on Bridge Maintenance, Safety and Management, Porto, Portugal, 16–19 July 2006. [Google Scholar]
- Borri, A.; Casadei, P.; Castori, G.; Ebaugh, S. Research on composite strengthening of masonry arches. In Proceedings of the 8th International Symposium on Fiber Reinforced Polymer Reinforcement for Concrete Structures (FRPRCS-8), Patras, Greece, 16 July 2007. [Google Scholar]
- Nowak, R.; Orłowicz, R. Mechanisms of brick arched lintels damage. Conserv. News 2009, 26, 253–259. [Google Scholar]
- Borri, A.; Casadei, P.; Castori, G.; Hammond, J. Strengthening of Brick Masonry Arches with Externally Bonded Steel Reinforced Composites. J. Compos. Constr. 2009, 13, 468–475. [Google Scholar] [CrossRef]
- Bati, S.B.; Rovero, S.; Tonietti, U. Experimental analysis on scale models of CFRP reinforced arches. In Proceedings of the Mechanics of Masonry Structures Strengthened with Composite Materials, MuRiCo., Venice, Italy, 22–24 April 2009. [Google Scholar]
- Bajno, D.; Bednarz, L.; Matkowski, Z.; Raszczuk, K. Monitoring of Thermal and Moisture Processes in Various Types of External Historical Walls. Materials 2020, 13, 505. [Google Scholar] [CrossRef]
- Bosnjak-Klecina, M.; Lozancic, S. Stability analysis for masonry-arch structures and vaulted structures. Gradevinar 2010, 62, 409–421. [Google Scholar]
- Gago, A.S.; Alfaiate, J.; Lamas, A. The effect of the infill in arched structures: Analytical and numerical modelling. Eng. Struct. 2011, 33, 1450–1458. [Google Scholar] [CrossRef]
- Cecchi, A. The curve of pressure in vertically loaded arches. Wiad. Konserw. 2013, 34, 18–22. [Google Scholar]
- Egidio, R.; Giada, C.; Annalisa, F.; Giuseppe, C. On the mixed collapse mechanism of semi-circular masonry arches. In Proceedings of the Structural Analysis of Historical Constructions–SAHC 2012, Wrocław, Poland, 15–17 October 2012; pp. 541–549. [Google Scholar]
- Albuerne, A.; Williams, M.; Lawson, V. Prediction of the Failure Mechanism of Arches under Base Motion Using DEM Based on the NSCD Method. In Proceedings of the Structural Analysis of Historical Constructions–SAHC 2012, Wrocław, Poland, 15–17 October 2012; pp. 41–47. [Google Scholar]
- Marfia, S.; Ricamato, M.; Sacco, E. Stress Analysis of Reinforced Masonry Arches. Int. J. Comput. Methods Eng. Sci. Mech. 2008, 9, 77–90. [Google Scholar] [CrossRef]
- Holzer, S.M. Numerical arch and vault analysis. J. Herit. Conserv. 2013, 34, 7–17. [Google Scholar]
- Hojdys, Ł.; Krajewski, P. Behavior of masonry arches strengthened with TRM. In Proceedings of the International Conference on Arch Bridges, Split, Croatia, 2–4 October 2013; pp. 739–746. [Google Scholar]
- Chen, J.F. Load-Bearing Capacity of Masonry Arch Bridges Strengthened with Fibre Reinforced Polymer Composites. Adv. Struct. Eng. 2016, 5, 37–44. [Google Scholar] [CrossRef]
- Reccia, E.; Cecchi, A.; Milani, G. FEM/DEM Approach for the Analysis of Masonry Arch Bridges. In Advances in Civil and Industrial Engineering; IGI Global: Hershey, PA, USA, 2016. [Google Scholar] [CrossRef]
- Ricci, E.; Sacco, E.; Piccioni, M. A method for the analysis of masonry arches. In Proceedings of the 10th International Conference on Structural Analysis of Historical Constructions, SAHC 2016, Leuven, Belgium, 13–15 September 2016; pp. 1067–1068. [Google Scholar]
- Pulatsu, B.; Erdogmus, E.; Lourenco, P. Discrete-continuum approach to assess 3D failure modes of masonry arch bridges. In Proceedings of the IABSE Symposium 2019 Guimarães: Towards a Resilient Built Environment-Risk and Asset Management, Guimarães, Portugal, 27–29 March 2019; pp. 570–577. [Google Scholar]
- Auciello, N.M. On the analysis of masonry arches. Int. J. Mason. Res. Innov. 2019, 4, 50. [Google Scholar] [CrossRef]
- Alecci, V.; De Stefano, M.; Focacci, F.; Luciano, R.; Rovero, L.; Stipo, G. Strengthening Masonry Arches with Lime-Based Mortar Composite. Buildings 2017, 7, 49. [Google Scholar] [CrossRef]
- Corradi, M.; Borri, A.; Castori, G.; Coventry, K. Experimental Analysis of Dynamic Effects of FRP Reinforced Masonry Vaults. Materials 2015, 8, 8059–8071. [Google Scholar] [CrossRef] [PubMed]
- Ferretti, E.; Pascale, G. Some of the Latest Active Strengthening Techniques for Masonry Buildings: A Critical Analysis. Materials 2019, 12, 1151. [Google Scholar] [CrossRef]
- Yang, F.; Wen, X.; Wang, X.; Li, X.; Li, Z. A Model Study of Building Seismic Damage Information Extraction and Analysis on Ground-Based LiDAR Data. Adv. Civ. Eng. 2021, 2021, 5542012. [Google Scholar] [CrossRef]
- Filgueira, A.; González-Jorge, H.; Lagüela, S.; Díaz-Vilariño, L.; Arias, P. Quantifying the influence of rain in LiDAR performance. Measurement 2017, 95, 143–148. [Google Scholar] [CrossRef]
- Abdou, O.A.; Burdette, J.Q. Masonry stairs–design and material performance. Mason. Soc. Boulder 1993, 1, 739–754. [Google Scholar]
- Heyman, J. The Mechanics of Masonry Stairs; Computational Mechanics Publications Ltd.: Southampton, UK, 1995; pp. 259–265. [Google Scholar]
- Baratta, A.; Corbi, I. Statics and equilibrium paths of masonry stairs. Open Constr. Build. Technol. J. 2012, 6, 368–372. [Google Scholar] [CrossRef][Green Version]
- Angelillo, M. Static analysis of a Guastavino helical stair as a layered masonry shell. Compos. Struct. 2015, 119, 298–304. [Google Scholar] [CrossRef]
- Gesualdo, A.; Cennamo, C.; Fortunato, A.; Frunzio, G.; Monaco, M.; Angelillo, M. Equilibrium formulation of masonry helical stairs. Meccanica 2017, 52, 1963–1974. [Google Scholar] [CrossRef]
- Rigo, B.; Bagi, K. Discrete element analysis of stone cantilever stairs. Meccanica 2018, 53, 1571–1589. [Google Scholar] [CrossRef]
- Briccola, D.; Bruggi, M.; Taliercio, A. Assessment of 3D Linear Elastic Masonry-Like Vaulted Structures. Key Eng. Mater. 2019, 817, 50–56. [Google Scholar] [CrossRef]
- Angelillo, M.; Olivieri, C.; DeJong, M. A new equilibrium solution for masonry spiral stairs. Eng. Struct. 2021, 238, 112176. [Google Scholar] [CrossRef]
- Nowak, R.; Kania, T.; Derkach, V.; Orłowicz, R.; Halaliuk, A.; Ekiert, E.; Jaworski, R. Strength Parameters of Clay Brick Walls with Various Directions of Force. Materials 2021, 14, 6461. [Google Scholar] [CrossRef] [PubMed]
- Nowak, R.; Orłowicz, R. Testing of Chosen Masonry Arched Lintels. Int. J. Archit. Herit. 2020, 15, 1895–1909. [Google Scholar] [CrossRef]
- Nowak, R.; Orłowicz, R. Selected problems of failures and repairs of historic masonry vaults. MATEC Web Conf. 2019, 284, 05008. [Google Scholar] [CrossRef]
- Nowak, R.; Orłowicz, R. Wpływ stanu technicznego muru na nośność zabytkowego łuku w Sankt Petersburgu. Mater. Bud. 2019, 5, 36–37. [Google Scholar] [CrossRef]
- De Santis, S.; Felice, G.; Roscini, F. Retrofitting of Masonry Vaults by Basalt Textile-Reinforced Mortar Overlays. Int. J. Archit. Herit. 2019, 13, 1061–1077. [Google Scholar] [CrossRef]
- Bespalov, V.; Orlovich, R.; Zimin, S. Stress-Strain State of Brick Masonry Vault with an Aperture. MATEC Web Conf. 2016, 53, 01009. [Google Scholar] [CrossRef]
- Pozo-Antonio, J.S.; Puente, I.; Pereira, M.F.C.; Rocha, C.S.A. Quantification and mapping of deterioration patterns on granite surfaces by means of mobile LiDAR data. Measurement 2019, 140, 227–236. [Google Scholar] [CrossRef]
- Stawiska, N.; Stawiski, B. Rewaloryzacja murów w obiektach zabytkowych. Wiadomości Konserwatorskie 2005, 18, 18–22. [Google Scholar]
- En 772-1+a1 Methods of Test for Masonry Units. In Determination of Compressive Strength; European Committee for Standardization: Brussels, Belgium, 2015.
- EN 1015-11 Methods of Test for Mortar for Masonry. In Determination of Flexural and Compressive Strength of Hardened Mortar; European Committee for Standardization: Brussels, Belgium, 2020.
- EN 1052-1 Methods of test for masonry. In Determination of Compressive Strength; European Committee for Standardization: Brussels, Belgium, 1998.
- ASTM E72 1989; Standard Tests for Conducting Strength Tests on Panels for Building Construction. American Society for Testing and Materials: West Conshohocken, PA, USA, 1989.


| Ordinal No | Bricks | Mortar | ||
|---|---|---|---|---|
| Ultrasonic Pulse Velocity (m/s) | Compressive Strength (MPa) | Ultrasonic Pulse Velocity (m/s) | Compressive Strength (MPa) | |
| 1 | 1130 | 14.3 | 1192 | 3.6 |
| 2 | 971 | 10.4 | 1227 | 3.9 |
| 3 | 1472 | 28.4 | 1317 | 4.6 |
| 4 | 1172 | 15.6 | 1414 | 5.3 |
| 5 | 1071 | 12.7 | 1276 | 4.3 |
| 6 | 1327 | 21.2 | 994 | 2.1 |
| 7 | 1191 | 16.2 | 1321 | 4.6 |
| 8 | 1432 | 26.2 | 1417 | 5.4 |
| 9 | 1101 | 13.5 | 1276 | 4.3 |
| Mean value | 1207.4 | 17.6 | 1270.4 | 4.2 |
| Load Diagram | Test | Material | No. of Samples | Result | Coefficient of Variation |
|---|---|---|---|---|---|
 | Compressive strength [108] | Brick | 6 | fb = 26.6 MPa | 9% |
 | Tensile strength | Brick | 6 | ftb = 2.3 MPa | 18% |
 | Flexural strength [109] | Mortar | 9 | f = 2.7 MPa | 17% |
 | Compressive strength [109] | Mortar | 12 | fm = 8.0 MPa | 23% |
 | Tensile strength | Mortar | 6 | ftm = 1.0 MPa | 13% |
 | Compressive strength [110] Young’s modulus [110] Poisson’s coefficient [110] | Masonry | 6 | fm = 10.8 MPa E = 6.6 GPa ν = 0.14 | 7% 7% 17% |
 | Tensile splitting strength [111] | Masonry | 6 | ft45 = 0.52 MPa | 11% |
 | Tensile strength | Masonry | 7 | ft90 = 0.11 MPa | 1% |
Publisher’s Note: MDPI stays neutral with regard to jurisdictional claims in published maps and institutional affiliations. |
© 2022 by the authors. Licensee MDPI, Basel, Switzerland. This article is an open access article distributed under the terms and conditions of the Creative Commons Attribution (CC BY) license (https://creativecommons.org/licenses/by/4.0/).
Share and Cite
Nowak, R.; Kania, T.; Rutkowski, R.; Ekiert, E. Research and TLS (LiDAR) Construction Diagnostics of Clay Brick Masonry Arched Stairs. Materials 2022, 15, 552. https://doi.org/10.3390/ma15020552
Nowak R, Kania T, Rutkowski R, Ekiert E. Research and TLS (LiDAR) Construction Diagnostics of Clay Brick Masonry Arched Stairs. Materials. 2022; 15(2):552. https://doi.org/10.3390/ma15020552
Chicago/Turabian StyleNowak, Rafał, Tomasz Kania, Radosław Rutkowski, and Ewa Ekiert. 2022. "Research and TLS (LiDAR) Construction Diagnostics of Clay Brick Masonry Arched Stairs" Materials 15, no. 2: 552. https://doi.org/10.3390/ma15020552
APA StyleNowak, R., Kania, T., Rutkowski, R., & Ekiert, E. (2022). Research and TLS (LiDAR) Construction Diagnostics of Clay Brick Masonry Arched Stairs. Materials, 15(2), 552. https://doi.org/10.3390/ma15020552